Embed Size (px)
Citation preview

Systematic Prevention of Diesel Exposures in UG mining
14th U.S./North American Mine Ventilation Symposium Diesel Workshop June 17-20, 2012
Sam Janisko Mechanical Engineer NIOSH/OMSHR

Introduction Purpose of diesel exposure prevention
• Ethical considerations • Legal requirements • Potential benefits
– Reduced ventilation costs – Comfortable work environment increased productivity – Mitigation of other risks
• Reduced risk of production shut down, fines • Reduced work time-lost to minor illness • Extended equipment life, improved reliability due to
better maintenance • Reduced health-care expenses

Background / Motivation True stories from the field:
• Enclosed cabs leaking, windows open, filters not installed • Equipment operators intentionally disabling SCR sensors • Defective DPFs remaining in-use for unknown lengths of
time • Leaks in stoppings/vent bags • Production haulage routed through intake air • No communication between functional departments • New monitoring technologies being implemented non-
systematically • Decisions unsupported by data

Background / Motivation
Tough questions from the field:
• What to measure? • How often to measure? • Where to measure? • How to reduce data into usable information? • How to integrate sources of data? • Which control option to implement (on limited $)? • How to measure progress?

Background / Motivation • Systems Method is an attempt to reduce confusion,
make diesel exposure prevention easier, more effective
• Emphasis on planning and standardization of work practices
• Focus on the big picture
• Develop systems/procedures for: – Controlling diesel exposures – Acquiring measurements – Processing data into meaningful information – Linking information to control systems – Improving control and measurement processes – Documenting work activities – Training employees

Diesel and Processes • Foundation is that diesel exposures are the outputs of
repetitive processes (generally)
• Repetitive processes are good candidates for engineering
• Many of the issues presented are either quality control
problems or measurement systems design problems
• Systems Method ~= Diesel Exposure Quality Control Program

Conceptual of Systems Method Incorporate existing industry knowledge with quality/process/systems engineering concepts
Systems/Process/Quality Engineering
Existing industry technology, methods,
knowledge
Systems Method for diesel exposure
prevention

Conceptualizing a Diesel Exposure Prevention
Program

Conceptual overview • Key components to any quality program
– Measurement Systems – Control Systems – Improvement Projects – Training Systems – Documentation Systems – Planning and auditing
• Systems here is holistic. Refers to planned methods by which work is accomplished – not individual technologies and not random actions
• I use “systems” and “processes” interchangeably

Diesel Control Systems Technologies, policies and routine practices that maintain exposure levels
• Administrative policies • Standard operating procedures • Control technologies themselves, strategies • Maintenance of control technologies, equipment • Plans for responding to routine monitoring data, actual
responses taken • Dashboards and monitoring tools • and more….

Diesel Improvement Projects Formal projects targeted at reducing exposure levels
• Selection and management of team • Meetings, assessment of problem areas, selection of
projects • Performance of improvement projects
– Development of solutions, selection of control technologies
– Pilot testing solutions, optimization – Development of long-term control plans
• Assessment of program performance • and more…

Diesel Measurement Systems
• Data for control systems and projects • Data collection and analysis procedures • Handling of data (transfer of data and information,
storage, backup) • Sensors/Instruments themselves • Instrument calibration procedures, maintenance of
instruments • and more….
All relevant data that is collected and the associated processes, technologies and analyses used
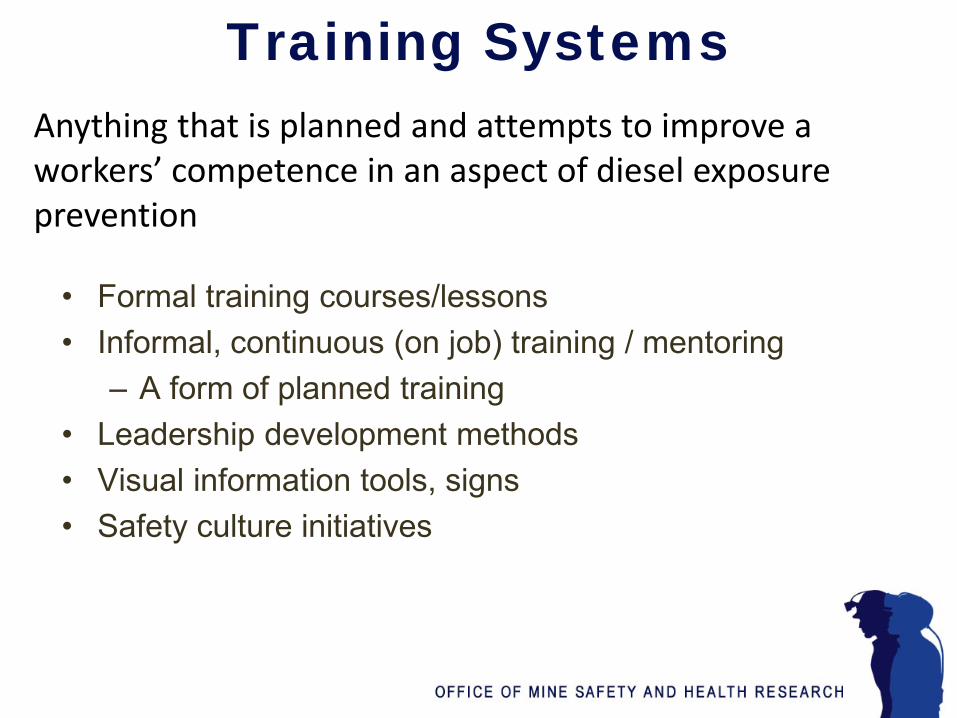
Training Systems
Anything that is planned and attempts to improve a workers’ competence in an aspect of diesel exposure prevention
• Formal training courses/lessons • Informal, continuous (on job) training / mentoring
– A form of planned training • Leadership development methods • Visual information tools, signs • Safety culture initiatives

A Quality Program ConOps Intermittent / Temporary
(Projects)
Data/Documentation
Improvement Projects Data Information
Identify project Test solution(s), optimize
Team
Solutions/ Decisions / Policies (control plan)
* Training and Documentation also ongoing, Auditing intermittent
Continuous / Ongoing (Operations)
Measurement Systems, Documentation
Data
Control Systems SOPs (control plans)
Actions on data

Continuous improvement (ideally)
Baseline
Control System
Control System
Control System Control System
Project Outcomes
months to years
• Improvement Projects provide gains (informed decisions and strategies) • Improvement team develops control plans
• Control system maintains those gains, prevents relapses • Measurement system provides data for both • Training system provides capable workers / culture for both • Documentation keeps everyone abreast of changes, reduces confusion • Auditing identifies deficiencies in program, keeps on track

Operationalizing a DPM Quality Control Program
“A problem well stated is a problem half solved.” – Charles Kettering

QC/QI Cheat Sheet 1) Define and understand processes
1) Personally observe and record them 2) Map them 3) Determine what aspects should be measured & controlled, how 4) Audit your ability to acquire sound measurements (gage R&R study, calibration) 5) Implement the measurements
2) Establish process requirements/specification limits 3) Monitor and control the process (ongoing)
1) Record data, transform into info 2) Review/monitor the info
1) Ensure that the process is operating within limits 2) Take actions to bring the process back to spec when necessary 3) Document actions taken
4) Improve the process incrementally (ongoing) 1) Review data, identify potential improvement options 2) Test and optimize solutions 3) Pilot the solution 4) Develop a control plan and implement the solution 5) Update process maps, document changes
5) Measure and assess long term progress (ongoing)
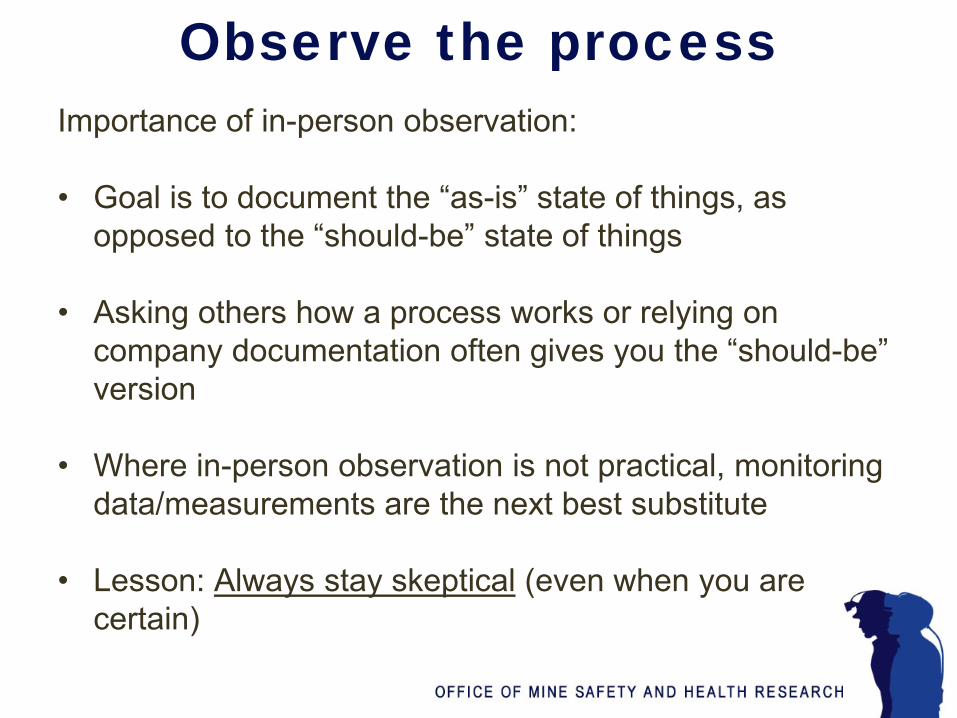
Observe the process Importance of in-person observation: • Goal is to document the “as-is” state of things, as
opposed to the “should-be” state of things
• Asking others how a process works or relying on company documentation often gives you the “should-be” version
• Where in-person observation is not practical, monitoring
data/measurements are the next best substitute
• Lesson: Always stay skeptical (even when you are certain)

Map the Processes • Each functional unit at a mine should define and understand
how their processes work • Members on improvement team should understand the entire
system • Goal is to produce a map that will help with process control &
improvement and to wrap your head around the process
– Trying to define too much where uncertainty exists is waste – Conceptual liberties may need to be taken to simplify maps – The act of developing the map is an excellent form of
training
• Maps are also good starting points for control dashboards

Map Processes • Example high-level lifecycle process map of diesel exposures at an
UG mine operation (pre-combustion portion)

Map Processes • High-level post-combustion processes (part I)
Continued from pre-combustion map

Map Processes • high-level post-combustion processes (part II)
Continued from part I

Decide what to measure & control
• Use the information in the map to develop a measurement and control system
• Risk analysis is commonly used to determine what should
be measured (or directly controlled) in the process • Process Failure Modes and Effects Analysis (FMEA) is a
popular approach – Note: there are variants of this depending on if you are designing a
new measurement/control system or auditing an existing one. In this example assume the purpose is to redesign existing measurement and control systems

Process FMEA
• For each step in process map ask, “How can this step go wrong?” (in terms of controlling worker exposure to diesel) – This results in a list of potential failure modes
• For each failure mode ask, “What is the impact on worker
exposures/safety?” – This is the SEVERITY rating (1-10, 10 = most severe)
• For each failure mode identify potential causes of the failure – Consider using the following categories:
» Man, Machine, Methods, Measurements, Materials, Environment

Process FMEA Example process step: Transferring fuel from bulk storage container to tank on equipment
Potential Failure Modes (example only): 1. Wrong fluid used (Severity = 8) - Potential causes
- Wrong transfer line used by operator - Wrong fluid in bulk storage container to
begin with - Etc…
2. Solid contaminates introduced (Severity = 3) - Potential causes
- Dirty transfer equipment used - Fuel cap not properly reinstalled - Etc..
This results in a list of potential causes

Process FMEA
• For each potential cause, ask “What is the likelihood of occurrence?” – This is the OCCURRENCE rating (1-10, 10 = most likely)
• For each potential cause, ask “What is the likelihood of
detection?” (in our current system) • This is the DETECTIBILITY rating (1-10, 10 = least likely) • Note: This rating is an inverse
• Calculate the risk priority number (RPN) for each cause • RPN = SEVERITY x OCCURANCE X DETECTIBILITY
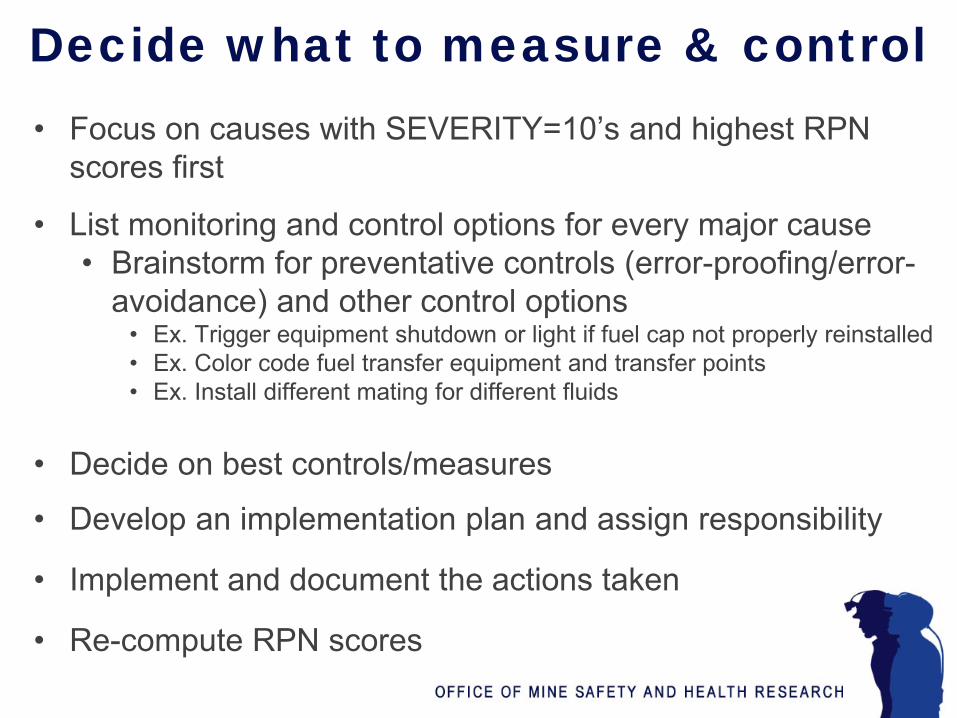
Decide what to measure & control • Focus on causes with SEVERITY=10’s and highest RPN
scores first
• List monitoring and control options for every major cause • Brainstorm for preventative controls (error-proofing/error-
avoidance) and other control options • Ex. Trigger equipment shutdown or light if fuel cap not properly reinstalled• Ex. Color code fuel transfer equipment and transfer points • Ex. Install different mating for different fluids
• Decide on best controls/measures
• Develop an implementation plan and assign responsibility
• Implement and document the actions taken
• Re-compute RPN scores

Example FMEA
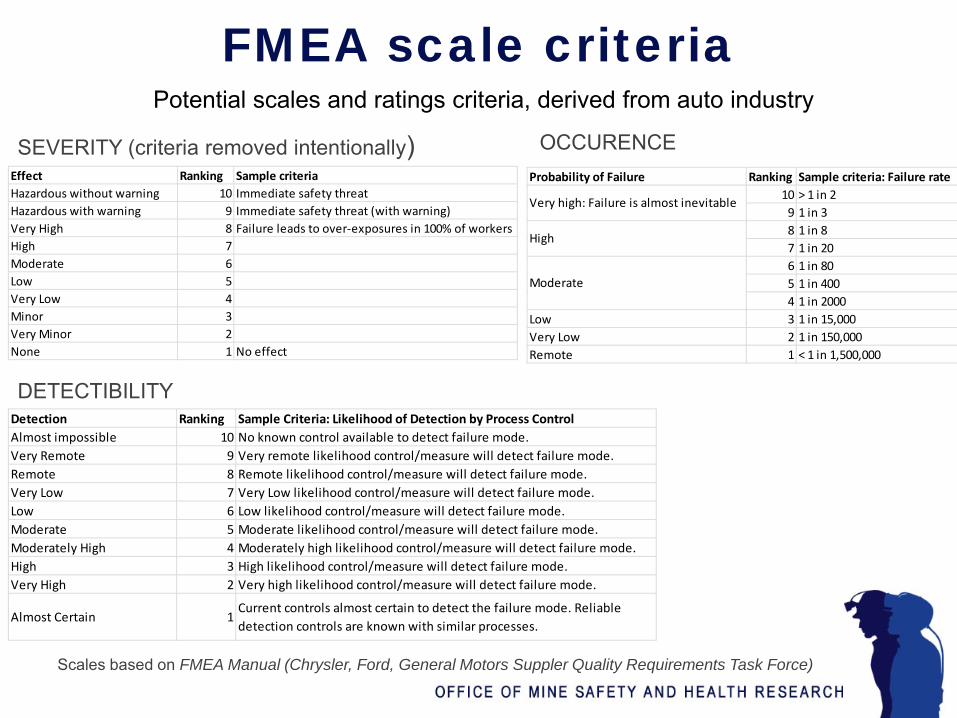
FMEA scale criteria Potential scales and ratings criteria, derived from auto industry
SEVERITY (criteria removed intentionally) Effect Ranking Sample criteriaHazardous without warning 10 Immediate safety threatHazardous with warning 9 Immediate safety threat (with warning)Very High 8 Failure leads to over-exposures in 100% of workersHigh 7Moderate 6Low 5Very Low 4Minor 3Very Minor 2None 1 No effect
OCCURENCE Probability of Failure Ranking Sample criteria: Failure rate
Very high: Failure is almost inevitable 109
> 1 in 21 in 3
High 87
1 in 81 in 20
6 1 in 80Moderate 5 1 in 400
4 1 in 2000Low 3 1 in 15,000Very Low 2 1 in 150,000Remote 1 < 1 in 1,500,000
DETECTIBILITY Detection Ranking Sample Criteria: Likelihood of Detection by Process ControlAlmost impossible 10 No known control available to detect failure mode.Very Remote 9 Very remote likelihood control/measure will detect failure mode.Remote 8 Remote likelihood control/measure will detect failure mode.Very Low 7 Very Low likelihood control/measure will detect failure mode.Low 6 Low likelihood control/measure will detect failure mode.Moderate 5 Moderate likelihood control/measure will detect failure mode.Moderately High 4 Moderately high likelihood control/measure will detect failure mode.High 3 High likelihood control/measure will detect failure mode.Very High 2 Very high likelihood control/measure will detect failure mode.
Almost CertainCurrent controls almost certain to detect the failure mode. Reliable
1detection controls are known with similar processes.
Scales based on FMEA Manual (Chrysler, Ford, General Motors Suppler Quality Requirements Task Force)

Notes on FMEA and measurements
• Specific criteria should be developed for each ranking – Reduces biases – A 1 to 5 ranking scale may be easier to reach a group
consensus

Notes on FMEA and measurements • Procedure outlined here focuses on designing measures
of the process – Primary purpose is to monitor operations and deploy
corrective actions when failures in the processes occur
• A complete measurement system would also include surveillance data to estimate worker exposures (e.g. area and personal exposure measurements) – These are measures of the outputs of the process – Useful in identifying improvement initiatives and
assessing quality program progress – Surveillance data can be less useful for taking immediate
corrective actions • Long control loops (historically) • Confounding information

Notes on measurements
(Hinckley, 1997 - Defining the best quality-control systems by design and inspection)
Downstream Measure the outputs of a process Measuring worker DPM exposure Measuring DPM concentration in an area Good for assessment purposes, but….. 1. Control loop is long! (*unless electronic/computerized) 2. Difficult to know what’s causing the problem 3. If data is limited, no good for monitoring processes that vary
significantly over time
Upstream Measure the inputs of a process Monitoring enclosed cab pressure Monitoring engine backpressure (DPF integrity) Good for control purposes 1. Control loop is short! 2. Directly measure the source(s) of problem 3. Can save time and energy However…. Can be difficult to implement Can be difficult to reduce data for assessment purposes

Notes on measurements
• Unfortunately, not many recommendations for designing exposure surveillance measurement systems at the moment – Part of ongoing work at NIOSH – Most industry information focuses on how to use
equipment, not sampling plan strategy – Can look to sampling plan theory, ASQ, MSHA, OSHA
and IH references for help – Difficulty stems from overhead of collecting data, limited #
of data – New tools can help in this area – Willingness to accept estimations can also help

Developing metrics • All measures must be operationalized
• Dimension Measure Metric • DPF reliability Frequency of failure Mean time between failures
• Individual DPF integrity Current engine backpressure psi
• Vent bypass maintenance How responsive are repairs Mean time between leaks identified and leaks repaired
• Diesel QC program impact Reduction in worker exposures % of non-compliant personal samples per quarter
• A living database of metrics used in the industry would be a good idea
Establishing operating limits • Determine metrics and begin collecting data as part of normal
operations
• Once enough data is acquired, chart this data (if possible) – Process data provides best info when charted over time
• From there, you can gauge and establish realistic requirements/specification limits – Other factors to consider
• maintenance requirements of equipment involved (manufacturer established)
• regulatory requirements

Monitor and control the process • Execute standard operating procedures • Perform routine data collection and analysis • Make use of Error-Proofing, Dashboards and Control Charts
whenever possible – Control charts ensure that you don’t act on random
variation (noise)
Image Source Credit: http://www.womp-int.com/story/2010vol01/story025.htm
Image Source Credit: http://minitabmaestro.com/
Monitor and control the process • Don’t let quality problems persist
– reduced DPM inventory reduced DPM exposures – Have mechanisms in place to process failures as fast as
possible!
– Conceptually, rate of DPM reduced by corrections must be greater than the rate of DPM generated by problems (Otherwise inventory builds, exposures increase)

Monitor and control the process • P
revent error/variation – It is far better to design quality into processes than to try and find
problems through inspection
– Standardization of work practices reduces error, reduces variation and increases efficiency
• Develop SOPs/policies, train workers, ensure practices are followed
– Make use of error-avoidance and error-proofing when possible • Ex. Vehicle can’t be operated with windows, doors open • Ex. Instructions/indicators located directly on equipment • Ex. Hygienist wraps personal sampling line so that it can’t kink • Ex. Electronic tag board, doors, limits X# of vehicles in an area at a time ** Careful not to create another problem or dangerous scenario!
– Organize work areas (5S method, this also improves efficiency) – Consider designing redundancy into key/unreliable components

Monitor and control the process • Other advice
– Upstream measurements when possible/sensible
– Limit # of measurements to what is necessary and manageable (excess measurements are typically considered waste)
– Use dashboards, visual management when possible
– Be open to new technology, but cautious • Adopt only when simpler/more effective than “stone
age” methods

Monitor and control the process • Other advice
– Randomize routine measurement schedules when possible
• This reduces chance of artifacts in data • Make use of random number tables
– Implement documentation systems • Changes that affect diesel prevention processes must
be recorded • Don’t over-document (waste) • Use your documentation!
– Documentation is supposed to be a tool, not a waste of time – Improvement team needs to know what changes were made to
the system. Likewise for HSMS audits.

Improve the process incrementally
• Team approach is most commonly used in quality improvement – Some mines already have these for improving
operational efficiencies – There may also be a good business case for diesel
exposure prevention
• Team should be composed of cross-functional members – Representatives from Management, Safety/IH,
Ventilation, Maintenance, Production.

Improve the process incrementally • Good traits for team members to have:
– Buy-in, belief in the program & concepts – Can-do attitude – Basic data processing and/or analysis abilities – Actual authority to implement change in his/her
department – Ideally, team members should have some training in
quality engineering, lean and six sigma • At least one person must have expertise in these
(lead role)
• Team must have real authority – Roadblocks must be removed – Must be allowed to test and implement changes – Oversight is good, best to involve leadership in the
process

Improve the process incrementally
• Team meets and reviews current performance information – Potentially….
• DPM surveillance by work function from IH • Environmental measurements collected from Ventilation • Maintenance performance and emissions measurements from
Maintenance • Long-term program performance
• Team reviews documentation from each department
– Keep informed of changes in processes, equipment, etc.
• Team reviews progress of current improvement projects

Improve the process incrementally
• Team identifies potential improvement initiatives (projects)
• For high-cost/complex projects – Testing and piloting plans would be made,
ownership assigned – Use DMAIC (six sigma) approach as a guide
• For low-cost/simple control solutions – Policies, control plans implemented immediately,
ownership assigned – Use PDCA approach as a guide

Improve the process incrementally • Members prepare info before meeting, come with ideas (hopefully)
– Reduce data to information (charts, diagrams) as part of routine work
– Consider correlation with measurements from other departments – Should have read-only access to raw data and documentation from
other departments
• This should not require the use of “space age” statistical tools • The improvement “way of thinking” is considered much more important
– “Space age” statistical tools rarely used in practice – Likewise, training should not focus primarily on statistical tools – 8 most used quality tools are:
• Flowchart (map), fishbone diagram, check list, control chart, histogram, Pareto chart, scatter diagram, stratification
• Design of Experiments is also something to consider when planning
new projects
Improve the process incrementally • After a project is performed and piloted, and results are
verified, it is ready to be scaled up
• A formal/written control plan must be developed – This is composed of operating procedures, maintenance
requirements, control measurements – A long-term process owner is identified
• Control is then handed over to process operators and owner • Process operators follow the control plan as part of routine
operations • Process owner monitors the control via performance data,
reports to team

Assess long-term performance
• Leadership and Team should track the progress of the Diesel Exposure Prevention Program over time
• Determining what metric to use is the most important/difficult aspect • Decide on this during program planning so that necessary
measurement systems can be established • Need a satellite level measure, should properly express the
“big picture” • Difficult to say what is best, needs researched further • May need multiple measures/metrics • Don’t just take the average concentration of personal
exposure measurements!

Assess long-term performance
• Use control chart(s) to track progress and assess over longer
time intervals
• Give the program and team time. It may take several months just to get a baseline satellite-level measurement

Assess long term performance • Other tools, things to consider • P
rocess Capability Maturity Rating
Level 1 - Initial (Chaotic) Processes are undocumented, in a state of dynamic change, tending to be driven in an ad hoc, uncontrolled and reactive manner by users or events. Individual heroics might be keeping the processes functioning.
Level 2 - Repeatable Some processes are repeatable, possibly with consistent results. Process discipline unlikely to be rigorous, but may exist in some aspects
Level 3 - Defined Sets of defined and documented standard processes are established and subject to some degree of improvement over time. These standard processes are in place.
Level 4 - Managed Using process metrics, management can effectively control the AS-IS process. Specification are in places and process are controlled and operated within specifications. Process Capability is established from this level.
Level 5 - Optimizing Processes are managed and are also continually improved through both incremental and innovative technological changes/improvements.

Assess long term performance • Other tools, things to consider • Audits / Standards / Training
– Health and Safety Management Systems (HSMS) • Usually variants of ANSI Z-10 or OHSAS 18001,
ISO-9001 • CORESafety.org looks promising
– Training, expectations of systems, metrics • If HSMS are not descriptive enough, ISO-9001 is
also a good set of standards to try to meet (rigorous though)

Selected reading
• ASQ.org (American Society for Quality) • Besterfield et al. Total quality management. Upper Saddle River,
N.J: Prentice Hall, 1999. • Besterfield. Quality control. Upper Saddle River, N.J:
Pearson/Prentice Hall, 2009. • Sower. Essentials of quality. Hoboken, NJ: John Wiley & Sons,
2011. • Breyfogle. Implementing six sigma. Hoboken, NJ: Wiley, 2003 • George (et al). The lean six sigma pocket toolbook. New York:
McGraw-Hill, 2005. • Arthur. Lean six sigma for hospitals. New York: McGraw-Hill, 2011.

More NIOSH diesel research Go to Diesel Team Home Page Directly: http://www.cdc.gov/niosh/mining/topics/topicpage2.htm -Or- Go to: http://www.cdc.gov/niosh/mining/
Then click here

Disclaimer
The findings and conclusions in this presentation are those of the authors and do not necessarily represent the views of NIOSH. Mention of company names or products does not constitute endorsement by the Centers for Disease Control and Prevention
Contact
Presented by: Sam Janisko Contact info: 412.386.4509 [email protected] The Office of Mine Safety and Health Research is a division of the National Institute for Occupational Safety and Health (NIOSH) www.cdc.gov/niosh/mining NIOSH is a division of the Centers for Disease Control and Prevention within the Department of Health and Human Services www.hhs.gov