Embed Size (px)
Citation preview
A Campbell Systematic Review2016:08
International Development Coordinating Group
Published: November 2016Search executed: November 2013
Ezequiel Molina, Laura Carella, Ana Pacheco, Guillermo Cruces, Leonardo Gasparini
Community monitoring interventions to curb corruption and increase access and quality of service delivery in low- and middle-income countries: a systematic review

The Campbell Library comprises:
• Systematic reviews (titles, protocols and reviews)
• Policies and Guidelines
• Methods Series
Go to the library to download these resources, at:
www.campbellcollaboration.org/library/
Better Evidence for a Better World

Colophon
Title Community monitoring interventions to curb corruption and increase access and quality of service delivery in low- and middle-income countries: a systematic review
Authors Ezequiel Molina Laura Carella Ana Pacheco Guillermo Cruces Leonardo Gasparini
DOI 10.4073/csr.2016.8
No. of pages 204
Citation Molina E, Carella L, Pacheco A, Cruces, G, Gasparini L. Community monitoring interventions to curb corruption and increase access and quality of service delivery in low- and middle-income countries. Campbell Systematic Reviews 2016:8 DOI: 10.4073/ csr.2016.8
ISSN 1891-1803
Copyright © Molina et al. This is an open-access article distributed under the terms of the Creative Commons Attribution License, which permits unrestricted use, distribution, and reproduction in any medium, provided the original author and source are credited.
Roles and responsibilities
See page 112
Editors for this review
Editor: Birte Snilstveit Managing editor: Stella Tsoli
Sources of support 3ie Systematic Review Grant supported the researchers’ salaries.
Declarations of interest
There are no known conflicts of interest. The team has not been part of any organisation that has implemented projects in this area. Nor has the team any interests in promoting particular findings due to personal relationships with individuals or organisations. Ezequiel Molina has conducted research on community monitoring in Colombia (Community Visible Audits) as part of his dissertation work. He studied the effects of the programme on corruption and political influence of the community over policy-making.
Corresponding author
Ezequiel Molina World Bank and CEDLAS 1818 H Street, NW Washington, DC 20433 USA E-mail: [email protected]
Full list of author information is available at the end of the article.

Campbell systematic reviews
Editor-in-Chief Julia Littell, Bryn Mawr College, USA
Editors
Crime and Justice David B. Wilson, George Mason University, USA Charlotte Gill, George Mason University, USA
Education Sandra Jo Wilson, Vanderbilt University, USA
International Development
Birte Snilstveit, 3ie, UK Hugh Waddington, 3ie, UK
Social Welfare Brandy Maynard, St Louis University, USA
Knowledge Translation and Implementation
Robyn Mildon, CEI, Australia Cindy Cai, AIR, USA
Methods Therese Pigott, Loyola University, USA Ryan Williams, AIR, USA
Managing Editor Chui Hsia Yong, The Campbell Collaboration
Co-Chairs
Crime and Justice David B. Wilson, George Mason University, USA Peter Neyroud, Cambridge University, UK
Education Sarah Miller, Queen's University, UK Gary W. Ritter, University of Arkansas, USA
Social Welfare Mairead Furlong, National University of Ireland Brandy Maynard, St Louis University, USA
Knowledge Translation and Implementation
Robyn Mildon, CEI, Australia Cindy Cai, AIR, USA
International Development
Peter Tugwell, University of Ottawa, Canada Hugh Waddington, 3ie, UK
Methods Ariel Aloe, University of Iowa, USA
The Campbell Collaboration was founded on the principle that systematic reviews on the effects of interventions will inform and help improve policy and services. Campbell offers editorial and methodological support to review authors throughout the process of producing a systematic review. A number of Campbell’s editors, librarians, methodologists and external peer reviewers contribute.
The Campbell Collaboration P.O. Box 4404 Nydalen 0403 Oslo, Norway www.campbellcollaboration.org

1 The Campbell Collaboration | www.campbellcollaboration.org
Table of contents
TABLE OF CONTENTS 1
PLAIN LANGUAGE SUMMARY 3
EXECUTIVE SUMMARY/ABSTRACT 5 1.1 Background 5 1.2 Objectives 5 1.3 Search Methods 5 1.4 Selection Criteria 5 1.5 Data Collection and Analysis 6 1.6 Results 6 1.7 Authors’ conclusions 7
BACKGROUND 9 1.1 Description of the problem 9 1.2 Description of the intervention 10 1.3 How the intervention might work 13 1.4 Why it is important to do this review 19
OBJECTIVES 22
METHODS 23 1.8 Criteria for including studies in the review [PICOs] 23 1.9 Search methods for identification of studies 27 1.10 Data Collection and Analysis 29 1.11 Data synthesis 36
RESULTS 39 1.12 search results 39 1.13 Characteristics of included studies 40 1.14 Sibling articles 48 1.15 Assessment of risk bias 51
RESULTS OF SYNTHESIS OF EFFECTS 53 1.16 Corruption outcomes 54 1.17 Service delivery outcomes 58 1.18 Studies not included in meta analyses 73 1.19 Moderator analysis 73 1.20 Publication bias 76
RESULTS OF MECHANISMS SYNTHESIS 79 1.21 Citizens’ participation in monitoring activities 81 1.22 Politicians’ and providers’ accountability 84

2 The Campbell Collaboration | www.campbellcollaboration.org
DISCUSSION 87 1.23 Synthesis 87 1.24 Implications for policy and practice 89 1.25 Implications for research 89 1.26 Limitations 90 1.27 Deviation from protocol 91
REFERENCES 92 1.28 Included Studies 92 1.29 Excluded Studies 93 1.30 Additional References 103
INFORMATION ABOUT THIS REVIEW 110 1.31 Review Authors 110 1.32 Roles and Responsibilities 111 1.33 Sources of Support 111 1.34 Declarations of Interest 112
APPENDICES 113 Appendix A: Search strategy – an example 113 Appendix B: Coding sheet 114 Appendix C: Critical appraisal of studies 123 Appendix D: Description of interventions 131 Appendix E: Results of critical appraisal of studies 144 Appendix F: Reasons for exclusion 166 Appendix G: The 15 included impact evaluations assessing the effects of CMIS 184 Appendix H: Citizens’ participation – potential relevant variables 199 Appendix I: Providers’ and politicians’ performance outcome variables 202

3 The Campbell Collaboration | www.campbellcollaboration.org
Plain language summary
COMMUNITY MONITORING INTERVENTIONS CAN REDUCE CORRUPTION AND MAY IMPROVE SERVICES
Community monitoring interventions (CMIs) can reduce corruption. In some cases, but not all, there are positive effects on health and education outcomes. Further research is needed to understand contexts and designs for effective interventions.
WHAT DID THE REVIEW STUDY?
Corruption and inefficient allocation of resources in service delivery are widespread in low- and middle-income countries. Community monitoring interventions (CMIs) are intended to address this problem. The community is given the opportunity to participate in monitoring service delivery: observing and assessing providers’ performance to provide feedback to providers and politicians.
This review assesses the evidence on the effects of community monitoring interventions on corruption and access and quality of service delivery outcomes. The review also considers the mechanism through which CMIs effect a change in corruption and service delivery outcomes, and possible moderating factors such as geographic region, income level or length of exposure to interventions.
WHAT STUDIES ARE INCLUDED?
To assess the effect on corruption included studies had to have either an experimental or a quasi-experimental design. Qualitative studies were included to assess mechanisms and moderators.
The review assesses 15 studies of 23 different programmes’ intervention effects. The studies were conducted in Africa (6), Asia (7) and Latin America (2). Most studies focused on programmes in the education sector (9), followed by health (3), infrastructure (2) and employment promotion (1).
What is the aim of this review?
This Campbell systematic review assesses the effectiveness of community monitoring interventions in reducing corruption. The review summarises findings from 15 studies, of which seven are from Asia, six from Africa and two from Latin America.

4 The Campbell Collaboration | www.campbellcollaboration.org
WHAT ARE THE MAIN RESULTS OF THIS REVIEW?
Community monitoring interventions can reduce corruption. They also improve use of health services, but no significant effect is found on school enrolments or dropouts. There is no improvement in health service waiting times, but there is an improvement in weight for age, though not child mortality. There are beneficial effects on education outcomes as measured by test scores.
Community monitoring interventions appear to be more effective in improving outcomes when they promote direct contact between citizens and providers or politicians, and when they include tools for citizens to monitor the performance of providers and politicians.
In all cases, findings are based on a small number of studies. There is heterogeneity in the findings with respect to health and education. Hence it is difficult to provide any strong, overall conclusions about intervention effectiveness..
WHAT DO THE FINDINGS OF THIS REVIEW MEAN?
The evidence identifies CMIs as promising. That is, there is evidence that they are effective. But the evidence base is thin, the interventions do no work in all contexts, and some approaches appear more promising than others.
Future studies should assess the effectiveness of different types of community monitoring interventions in different contexts, sectors and time frames to identify when and how such programmes may be most effective in improving outcomes. There is a need for adequate information and tools to assist citizens in the process of monitoring. Research about these mechanisms and their moderation of the effectiveness of CMIs should be a priority for further research in the area.
HOW UP-TO-DATE IS THIS REVIEW?
The review authors searched for studies published until November 2013. This Campbell systematic review was published in November 2016.

5 The Campbell Collaboration | www.campbellcollaboration.org
Executive summary/Abstract
1.1 BACKGROUND
In many low- and middle-income countries (L&MICs) corruption and mismanagement of resources are prevalent in the public sector. Community monitoring interventions (CMIs) aim to address such issues and have become common in recent years. Such programmes seek to involve communities in the monitoring of public service providers to increase their accountability to users. However, their effectiveness in reducing corruption and improving access and quality of services remain unclear.
1.2 OBJECTIVES
This review aims to assess and synthesise the evidence on the effects of CMI interventions on access to and quality of service delivery and corruption outcomes in L&MICs. More specifically, the review aims to answer three main questions:
1) What are the effects of CMIs on access to and quality of service delivery and corruption outcome measures in L&MICs relative to no formal community monitoring or CMIs with less community representation?
2) What are the mechanisms through which CMIs effect a change in service delivery and corruption outcomes?
3) Do factors such as geographic region, income level or length of exposure to interventions moderate final or intermediate outcomes?
1.3 SEARCH METHODS
We searched for relevant studies across a broad range of online databases, websites and knowledge repositories, which allowed the identification of both peer reviewed and grey literature. Keywords for searching were translated into Spanish, French, and Portuguese and relevant non-English language literature was included. We also conducted reference snowballing and contacted experts and practitioners to identify additional studies. We used Endnote software to manage citations, abstracts, and documents. First stage results were screened against the inclusion criteria by two independent reviewers, with additional supervision by a third.
1.4 SELECTION CRITERIA
We included studies of CMI in countries that were classified as L&MICs according to the World Bank definition at the time the intervention being studied was carried out. We

6 The Campbell Collaboration | www.campbellcollaboration.org
included quantitative studies with either experimental or quasi-experimental design to address question 1. In addition, both quantitative and qualitative studies were eligible for inclusion to address questions 2 and 3.
1.5 DATA COLLECTION AND ANALYSIS
Two reviewers independently coded and extracted data on study details, design and relevant results from the included studies. Studies were critically appraised for potential bias using a predefined set of criteria. To prepare the data for meta-analysis we calculated standardised mean differences and 95 per cent confidence intervals (CI) for continuous outcome variables and risk ratios and risk differences and 95% CI for dichotomous outcome variables. We then synthesised results using statistical meta-analysis. Where possible we also extracted data on intermediate outcomes such as citizen participation and public officials and service providers’ responsiveness.
1.6 RESULTS
Our search strategy returned 109,017 references. Of these 36,955 were eliminated as duplicates and a further 71,283 were excluded at the title screening stage. The remaining 787 papers were included for abstract screening and 181 studies were included for full text screening. Fifteen studies met the inclusion criteria for addressing question 1. Of these, ten used randomised assignment and five used quasi-experimental methodologies. An additional six sibling papers were also included to address questions 2 and 3. Included studies were conducted in Africa (6), Asia (7) and Latin America (2). The 15 studies included for quantitative analysis evaluated the effects of 23 different CMIs in the areas of Information Campaigns (10), Scorecards (3), Social Audits (5), and combined Information campaigns and Scorecards (2). Most studies focused on interventions in the education sector (9), followed by health (3), infrastructure (2) and employment promotion (1).
Corruption outcomes
Included studies on the effects of CMI on corruption outcomes were implemented in infrastructure, education and employment assistance programmes. The overall effect of CMI as measured by forensic economic estimates in two studies suggest a reduction in corruption (SMD=0.15, 95% CI [0.01, 0.29).
Three studies (comprising four interventions) measured perception of corruption as an outcome measure. A meta-analysis of two of these studies showed evidence for a reduction in the perception of corruption among the intervention group (risk difference (RD) 0.08, 95% CI [0.02, 0.13]). Another study, which was not included in the meta-analysis due to a lack of comparability in outcome, suggests an increase in perceptions of corruption in the intervention group (SMD -0.23, 95% CI [-0.38, -0.07]).
Access to services
A number of different outcome measures were included as proxies for access to service delivery. One study examined the effects of an information campaign and a combined information and scorecard campaign on health care utilisation. The information campaign showed no significant effect in the short term, but the information campaign and score card combined resulted in an increase in utilisation both in the short term (SMD 2.13, 95% CI [0.79, 3.47]) and the medium term (SMD 0.34, 95% CI [0.12, 0.55]).

7 The Campbell Collaboration | www.campbellcollaboration.org
The overall effects of two CMI interventions on immunisation outcomes suggest a positive effect in the short term (Risk Ratio (RR): 1.56, 95% CI [1.39, 1.73]). However, the medium term effect reported from one of these interventions is smaller and less precise (RR 1.04, 95% CI [-0.52, 2.61]). Another study reporting on a range of measures of access to health services suggests an overall positive effect (RR 1.43, 95% CI [1.29, 1.58]).
Meta-analysis of four studies which evaluated the effects of CMI on school enrolment showed an overall positive effect, but the estimate cross the line of no effect (SMD 0.09, 95% CI [-0.03, 0.21]). The overall effect across on drop-out across four studies is no different from zero (SMD 0.0, 95% CI [-0.10, 0.10]).
Quality of services
For health related interventions child death and anthropometric outcomes were considered proxies for quality of service. A meta-analysis of two studies which examined the short term effects of a score card and a combined score card and information campaign using child deaths as an outcome is not clear (RR 0.76 [0.42, 1.11]). For the score card and information campaign intervention data was available on the medium term effects and the estimate is similarly imprecise (RR 0.79, 95% CI [0.57, 1.08]). The average effect on weight for age, based on the same two studies, suggests an overall beneficial effect (RR 1.20, 95% CI [1.02, 1.38]). For the combined score card and information campaign intervention with data on medium term effects the results suggest the benefits were sustained (RR 1.29, 95% CI [1.01, 1.64]). The same two studies also looked at waiting times for services and the results suggest no difference in this outcome (RR 0.99, 95% CI [.80, 1.17]).
In education interventions test scores were used as a proxy outcome measure for quality of service. The overall effect across six studies was 0.16 (SMD, 95%CI [0.04, 0.29]).
The limited number of studies included in our review, and the limited number of included studies with information on intermediate outcomes in particular limited our ability to answer our second and third research questions regarding the mechanisms through which CMIs effect change and whether contextual factors such as geographic region, income level or length of exposure to interventions moderate final or intermediate outcomes.
Nonetheless, some exploratory evidence is provided in response to these questions, which may inform further research in the area. Some likely important moderators of the effect of CMI are having an accountability mechanism for ensuring citizen participation, availability of information and tools for citizens engaged in the monitoring process and pre-existing beliefs regarding the responsiveness of providers to citizen’s needs
1.7 AUTHORS’ CONCLUSIONS
This review identified and analysed available evidence regarding the effects of CMIs on both access to and quality of service delivery and on corruption outcome measures in L&MICs. Overall, our findings were heterogeneous making it difficult to provide any strong, overall conclusions as to the effectiveness of CMIs.
However, the results suggest CMIs may have a positive effect on corruption measures and some service delivery measures.
We found the overall effect of CMIs on both forensic and perception based measures of corruption to be positive. In improving access to public sector services results were more variable. Effects on utilization of health services are not clear, but we observe an

8 The Campbell Collaboration | www.campbellcollaboration.org
improvement in immunization rates. In the education sector, we did not find evidence of an effect on proxy access measures such as school enrollment and dropout.
We used child anthropometric measurements and deaths and waiting times for services as proxy measures for service quality in the health sector and test scores in the education sector. The evidence from two studies suggests improvements in weight for height, but no difference in child deaths or in waiting times for services. The results suggest an improvement of quality of services, as measured by improvements in test scores.
Despite limitations in our ability to synthesise evidence on the mechanisms which moderate the effects of CMIs, some important preliminary evidence was uncovered. Firstly, we identified a lack of accountability in ensuring the involvement of citizens in CMIs as an important potential bottleneck to effectiveness. Secondly, we identified the need for adequate information and tools to assist citizens in the process of monitoring. Further research on these mechanisms and their moderating effect on the effectiveness of CMIs should be a priority for further research in the area.

9 The Campbell Collaboration | www.campbellcollaboration.org
Background
1.1 DESCRIPTION OF THE PROBLEM
Corruption and inefficient allocation of resources in service delivery are widespread in low- and middle-income countries (Pande and Olken, 2011). There is increasing evidence that corruption holds back countries’ economic development and erodes their citizens’ quality of life (Mauro, 1995; Svensson, 2005; Singer, 2013). Millions of people around the world encounter administrative corruption in their daily interactions with public services. Using a 0-100 scale on perceived levels of public sector corruption, only a third of the 176 countries covered in the Transparency International Corruption Index 2012 scored above 50. The World Bank Institute estimates that total bribes in a year amount to about one trillion USD (Rose-Ackerman, 2004), making corruption account for around three per cent of world GDP (Svensson, 2005). Bribes are used to influence the actions of public officials, either to performed their duties, distort the duties or to prevent them from performing their duties. For instance, under the presidency of Fujimori in Peru, there is direct evidence in the form of signed receipts that politicians and judges received bribes ranging from 3,000 to 50,000 USD and the media received as much as 1.5 million USD per month for turning a blind eye to government malfeasance (McMillan and Zoido, 2004).
In many countries, corruption is widespread throughout the public sector, not only among high level public officials. Gorodnichenko and Sabirianova (2007) estimate the aggregate amount of bribes collected by low and medium level public officials in Ukraine to be between 460 and 580 million USD, about one per cent of its GDP. Administrative corruption imposes a heavy burden on citizens’ and firms’ time and resources. Olken and Barron (2009) estimate that 13 per cent of the cost of a truck driver’s trip in Indonesia is allocated to pay bribes to police officials that they encounter on their journey. In cases where the accountability relationship between bureaucrats, frontline providers and politicians is broken, unofficial payments can be the only way to incentive those frontline providers to perform their duties. Svensson (2003) finds that bribes represent eight per cent of firms’ production costs in Uganda. Corruption creates discontent with public services, undermines trust in public institutions (Sacks and Larizza, 2012; Singer, 2013), and stifles business growth and investment. Khwaja and Mian (2005) find that politically connected firms receive substantially larger loans from government banks in spite of having a 50 per cent higher default rate.
Resources needed to improve equality of opportunities and provide services for citizens are lost every day as a result of corruption and inefficiency (World Bank, 2003), which in turn results in inadequate provision of key services. Often, it is the poor and the vulnerable who suffer the most from public sector corruption (Olken, 2006; Sukhtankar, 2011). A landmark study in Uganda found that only 13 per cent of the public funds that the central government had assigned to the school system reached the intended destination (Reinikka and Svensson, 2004, 2005, 2011). Similarly, leakages are also a problem in Tanzania, where elected officials

10 The Campbell Collaboration | www.campbellcollaboration.org
are the recipients of more than half of the total amount of subsidised fertilizer’s price vouchers (Pan and Christiaensen, 2012). In Indonesia, village officials hide their corruption by deflating quantities, that is, they claim to procure enough rock, sand, and gravel to build a road that is 20cm thick, but instead build a road that is only 10cm or 15cm thick. Since the roads they build are thinner than official engineering guidelines, they will not last nearly as long and will need to be replaced sooner (Olken, 2007; 2009). In India, the lack of monitoring and accountability has resulted in high levels of public sector absenteeism, with one quarter of all the teachers in public schools and more than a third of nurses and doctors being absent from their duties (Chaudhury et al., 2006).1 Corruption has also impacted on service delivery in Brazil. Municipalities where corruption in education has been detected have test scores that are 0.35 standard deviations lower than those without corruption, as well as higher rates of dropout and failure. Moreover, teachers in corrupt municipalities are 10.7 per cent less likely to receive pedagogical training and less likely to have a computer or science lab (Ferraz et al., 2012).
1.2 DESCRIPTION OF THE INTERVENTION
The idea that community members have incentives to monitor providers and demand better services (Stiglitz, 2002) led practitioners to believe that allowing communities to have monitoring power over providers could be beneficial for improving service delivery and reducing corruption in both the short and long term. In the short term, it could improve outcomes by identifying pockets of corruption and inefficiency in service delivery. In the long term it may contribute to changes in political norms and to establishing a transparent and accessible channel of communication for the community to provide feedback to providers and politicians on a regular basis.
This set the stage for a move to encourage governments in developing countries to become accountable to their own citizens, in an attempt to reform institutions from the bottom up. As a consequence, over the last two decades programmes aimed at encouraging community monitoring have been introduced in countries spanning continents and cultures including Albania, Argentina, Brazil, Cambodia, Cameroon, Colombia, Kenya, India, Indonesia, Malawi, Philippines, South Africa, and Uganda, among others (Reinikka and Svensson, 2004, 2005, 2011; Pan and Christiaensen, 2012; Tosi, 2010; Ferraz, Finan and Moreira, 2012; Capuno and Garcia, 2010; Ringold et al., 2012).
This idea was operationalised by the introduction of community monitoring interventions (CMIs), often referred to as social accountability mechanisms. These programmes can be broadly defined as interventions where the community is given the opportunity to participate in the process of monitoring service delivery, where monitoring means being able to observe and assess providers’ performance and provide feedback to providers and politicians.
The Association for the Empowerment of Workers and Farmers in India was the first organization to introduce a social accountability initiative, through social audits in the early 1990s (Maru, 2010).2 Association workers read out government accounts and expenditure
1 This is also the case of Sub Saharan Africa, where absence levels are above 20 per cent and in same countries even 50 per cent (Service Delivery Indicators, 2015).
2 The word 'audit' is derived from Latin, which means 'to hear'. In ancient times, emperors used to recruit persons designated as auditors to get feedback about the activities undertaken by the kings in their kingdoms. These auditors used to go to public places to listen to citizens' opinions on various matters, like behaviour of employees, incidence of tax and image of local officials (Centre for Good Governance, 2005).

11 The Campbell Collaboration | www.campbellcollaboration.org
records at community meetings, and then invited villagers to testify to any discrepancies between official records and the villagers’ personal experience. Since then, a range of different community monitoring initiatives has been implemented. The four major categories of such interventions are information campaigns, scorecards/citizen report cards, social audits, and grievance redress mechanisms. These four sub-categories of community monitoring share two common elements:
• a clear objective of reducing corruption and improving service delivery, and • using encouragement of the community to monitor service delivery as a key
intervention instrument.
Table 1 below summarises the key components of these interventions.
Table 1: Interventions Aimed to Increase Civic Participation in Monitoring Public Officials and Providers.
Intervention Description
Information Campaign
These are efforts to inform citizens about their rights to services, quality standards,
and performance campaigns. In particular, it can include information on the importance of the service, on providers’ performance, and on how to monitor providers.
Scorecard/ Citizen Report Cards
These involve quantitative surveys that assess users' satisfaction and experiences
with various dimensions of service delivery. It often involves a meeting between the recipients of services and providers to discuss the findings of the survey and to develop a follow-up plan (Ringold et al., 2012).
Social Audit
Social audits allow citizens receiving a specific service to examine and cross-check
the information the provider makes available against information collected from users of the service (Ringold et al., 2012).
Grievance Redress Mechanisms
These are mechanisms that provide citizens with opportunities to use information
redress to influence service delivery and give feedback on government programmes and services, mechanisms including complaint hotlines, informal dispute resolution mechanisms, and courts (Ringold et al., 2012).
Information campaigns are one of the most common interventions to encourage participation and interest in service delivery monitoring. They usually involve provision of information on the benefits of the service to be delivered (health, education, police, and so on) and the current state of the service in the community. The information could be provided door to door, in public gatherings aided by local leaders, through radio, newspapers or other means. Kefeer and Khemani (2011), for example, study the impact of having access to community radio programmes on the benefits of educational attainment in Benin. Information campaigns can also include information on how to monitor providers. For example, Banerjee et al. (2010) conduct a randomised evaluation of three interventions to encourage beneficiaries' participation in India's educational system. Prior to conducting the interventions, information was provided on the state of educational performance. They then a) provided information on existing institutions, Village Education Committees (VECs), to

12 The Campbell Collaboration | www.campbellcollaboration.org
monitor schools, b) trained community members in a testing tool for children, and c) trained volunteers to hold remedial reading camps for disadvantage children.
Scorecards, 3 often referred to as citizen report cards, are another way in which to encourage citizen to participate in monitoring service delivery. The rationale is that by giving citizens a voice, they will be encouraged to demand better services. For example, Björkman and Svensson (2009) analyse the impact of a scorecard community monitoring intervention on primary health care in Uganda. For the intervention, a non-governmental organisation (NGO) facilitated village and service provider staff meetings in which members of the communities discussed baseline information on the status of health service delivery relative to other providers and the government standard. Community members were also encouraged to develop a plan identifying key problems and steps that providers should take to improve health service delivery. An important difference between information campaigns and scorecards is that the latter can include an interaction between citizens and providers, while the former does not include a forum for such interaction.
Social audits involve interactions not only between citizens and providers, but also with politicians, as for instance in Colombia’s Citizens Visible Audit (CVA) (Molina, 2013b). As part of this program, infrastructure projects providing local public goods, such as water and sanitation infrastructure, schools and hospitals, included an additional CVA component. A social audit involves:
a) dissemination of information through radio, newspapers and local TV about the CVA programme in the neighbourhoods where the project takes place;
b) introduction of the infrastructure project to the community in a public forum. Citizens are told about their rights and entitlements, including the activities they can do to monitor the project and the responsibilities of the executing firm. A group of interested beneficiaries is established and trained to carry out community monitoring activities;
c) periodical public forums, bringing together local authorities, neighbours, and representatives from the firm carrying out the specific project. The state of the project is explained in detail to the community, who can voice concerns and recommendations. Commitments are made by the firm, the local government, and project supervisor to solve the problems that may arise during the project. These commitments are monitored by the community, the facilitators from the central government and the project supervisor. If the problem persists, administrative complaints are submitted to the Supreme Audit Body in the central administration;
d) regular monitoring of the project by the beneficiary group and collection of information on whether commitments are being honoured and any other new problem that may arise;
e) presentation of the finalised project to the community before making the final payment to the executing firm, and sharing of the audit results with all interested and concerned stakeholders.
3 Scorecards for health services were pioneered in Malawi in the early 2000s by Care International. This intervention followed the spirit of individual “citizen report cards,” which were first introduced in Bangalore, India in 1993. The citizen report card revealed low levels of public satisfaction with the performance of service providers. The findings were widely publicised through the media, which created pressure among public officials to organize workshops and meeting with local civic groups and NGOs. Increased public awareness on government inefficiencies and other related concerns triggered the formation of more than 100 civic groups in different parts of India, as well as the launch of many campaigns for transparent public management (Bhatnagar, Dewan, Torres and Kanungo, 2003).

13 The Campbell Collaboration | www.campbellcollaboration.org
Social audits can also involve citizens as decision makers. In this case, citizens have the power to make actual decisions over the project. The extent of the decisions over which the community has control, however, varies. An example of a CMI where citizens had decision power is the Kecamatan Development Programme (KDP) in Indonesia (Olken, 2007). This programme funded projects in about 15,000 villages each year. Each village received an average of 8,800 USD, which was often used to surface existing dirt roads. To control the use of funds, checks were built into KDP. First, funds were paid to village “implementation teams” in three instalments. To receive the second and third payments, the teams had to make accountability reports at an open village meeting. Second, each project had a four per cent chance of being audited by an independent government agency. The study introduced two anti-corruption strategies: enhancing community participation and increasing government audits. To enhance community monitoring, invitations to the community meetings were randomly distributed throughout the village. It is important to note the community decides how to allocate the funds before monitoring the project, which differentiates it from studies on CMIs describe above.4
Grievance redress mechanisms (GRMs) provide people with opportunities to use information to influence service delivery. GRMs capture different mechanisms that provide citizens with opportunities to use information redress to influence service delivery and give feedback on government programmes and services. Such mechanisms include complaint hotlines, informal dispute resolution mechanisms, and courts (Ringold et al., 2012). An example described in Ringold (2012) is the design of Kenya’s Hunger Safety Net Programme (HSNP), which includes GRMs at the community level. At the district level, the HSNP is designed to have a grievance front office to receive complaints. Complaints that cannot be addressed by the district office are forwarded to the national grievances coordinator.
1.3 HOW THE INTERVENTION MIGHT WORK
For this systematic review, we define corruption as dishonest or fraudulent conduct by those in power. A big issue in the literature is the difficulty in measuring corruption accurately (Pande and Olken, 2011). As a consequence, each study measures it in a different way, reflecting the multi-faceted nature of corruption (Campos and Pradhan, 2007). We will review corruption estimates from both the forensic economic literature (Zitzewitz, 2012) as well as measures based on perceptions of corruption. An example from the forensic economic literature is Olken’s study, (2007), where he measures corruption by comparing an estimate of what the project actually cost to what was reported on an item-by-item basis.
We refer to service delivery as the process through which basic services, such as education, health, and security are delivered to communities.5 We will define service delivery outcomes as access to and quality of the service. For example, if the goal of the intervention is to facilitate household access to clean water, the percentage of access to clean water and water quality is the outcome of interest. If the goal is to monitor school performance, children’s tests scores are the desired outcome.
Figure 1 presents a stylised theory of change we developed. Here we present a typical community monitoring program, clarifying the mechanisms through which the programme is
4 Furthermore, because these initiatives are put in place as a result of weak government presence, monitoring involves monitoring peers, which is different to traditional CMIs.
5 For the purpose of this review, service delivery involves not only services, but also construction of necessary infrastructure to carry out those services. As a result, we will talk indistinctly between service delivery and project performance.

14 The Campbell Collaboration | www.campbellcollaboration.org
expected to have an impact on corruption and service delivery. A typical CMI begins by attempting to make the project or service that it aims to monitor salient in the community. This is usually done though a communication campaign (building block 1) using as many mediums as possible, such as radio, newspapers, door to door campaigns, and local TV. The campaign’s primary objective is to increase citizen knowledge of (a) the performance of the service to be monitored and/or (b) the importance of the service or project for the community.
Equipped with this information, citizens can engage in different activities. For instance, they might change their private actions, or contact fellow community members to collectively pressure providers and politicians to improve the quality of the service through monitoring activities (building block 2). To encourage citizens to monitor service providers, CMIs usually include activities to build the capacity of beneficiaries to monitor providers. For instance the CVA in Colombia provides information about the contractual obligations of the provider, ways for citizens to detect problems and to whom inquiries about the project should be directed to.
Empowered with information from building block 1 and/or 2, citizens are expected to solve the collective action problem and invest their time and effort to participate in monitoring service delivery (building block 3). Participation in monitoring activities could take many forms, depending on the specific CMI. For instance, social audits have public forums and scorecards and can include meetings between providers and citizens.
As an organised group, citizens can take turns to visit the place where the service or project takes place, such as a school, construction site or hospital, and collect information on its problems, for example absenteeism, use of low quality inputs in the construction process, unresponsive front-line providers. Citizens can then contact providers (building block 6) and/or elected officials (building block 4) to file complains about the service and provide information on the specific problems the service is facing. In addition, citizens are expected to share the information collected by monitoring providers with their fellow neighbours that did not take part in monitoring activities (building block 5), to increase visibility of the community monitoring intervention and put pressure on providers and politicians. Finally, the independence and strength of the local media is assumed to impact upon the visibility of the project (Reinikka and Svensson, 2005; Ringold et al., 2012).
Citizens’ participation in the programme may reduce the cost of monitoring front-line providers for politicians and managers. Citizens’ monitoring activities also increase both visibility and citizens’ ability to recognize whether elected officials are making an effort to reduce corruption and improve service delivery. As a result, there may be a greater incentive for politicians and policymakers to achieve better results and to put more pressure on providers to improve service delivery (building block 7). The threat of formal sanctions by politicians and/or informal sanctions by citizens is assumed to motivate service providers into exerting greater effort.
Many of these mechanisms are mediated by local norms and context. Participation in the CMI will be influenced by the strength of the community to act collectively. For example, communities with a history of grassroots participation are expected to organise more rapidly and more efficiently (Björkman and Svensson, 2010). History can play an important role in this crucial phase of the theory of change. In Africa, the history of slave trade left an imprint in cultural norms and beliefs which arguably diminished the trust among fellow citizens and reduced the strength of the community to act collectively (Nunn and Wantchekon, 2011). In Uganda, media attention was argued to be decisive to reduce corruption (Reinikka and Svensson, 2005) but that may not be the case in South Sudan or Zimbabwe today. Finally, this is a dynamic process, which makes understanding the specific history of service delivery,

15 The Campbell Collaboration | www.campbellcollaboration.org
citizen engagement and political accountability in the community where the intervention took place, crucial.6
While the description above fits different type of CMI interventions, there are some features that are specific to each intervention. Below we describe two additional components of social audits and scorecards respectively. Scorecards have an added accountability mechanism through which citizens meet with service providers to discuss how to improve the service. This face-to-face interaction introduces intrinsic motivation arguments for the service providers, which may contribute to improving their performance. This will be moderated by whether it is credible for a given community to establish an informal system of rewards and sanctions. Additionally, the meeting could result in new ideas for providers and citizens on how to use and manage the service in a more efficient way.
Social Audits are CMIs with an additional component in the form of public forums, where representatives from the local government, the executing firm, the central government, and the community are present. It allows citizens to make their voice heard by local officials and providers, and reduces the time and effort citizens would need to invest to get an appointment with these officials. The public forums also reduce the cost for central government representatives to be heard by local officials. Finally, it reduces the cost of local officials to take actions to solve problems that arise during the implementation of the projects, such as lack of planning, lack of resources to finish the project, and acts of corruption. The symbolic act of the public forum may also signal to politicians and providers the importance of performing well on this project, as citizens are paying extra attention.
There are several empirical implications from this overall theory of change, which warrant testing:
• CMIs will increase the quantity and the degree to which citizens are involved in monitoring service providers.
• As a result of the CMIs, politicians and providers will exert more effort and improve their performance in relation to service delivery.
• CMIs will reduce the probability of corruption. • CMIs will improve access and quality of the service provided.
6 For a review of the importance of context to understand the effectiveness of community monitoring interventions see Grandvoinnet, Ghazia and Raha (2015).

16 The Campbell Collaboration | www.campbellcollaboration.org
Figure 1: Theory of Change for Community Monitoring
There are several assumptions underlying this theory of change, which must hold in order for it to accurately describe the process through which a CMI impacts on service delivery.
Communication Campaign
(1)
Citizens Decide to Act Collectively
(2)
-Participate in Public Forums
-Participate in Field Visits to assess the service
Participation in Monitoring Activities
(3)
Voice
Politicians
(4)
Other Citizens
(5)
Informal Sanctions
Formal Sanctions
Providers
(6)
Better Outcomes
(8)
Providers and Politicians exert more effort and
reduce corruption
(7)

17 The Campbell Collaboration | www.campbellcollaboration.org
Citizens need to participate in monitoring activities and politicians and providers need to be accountable. For citizens to participate, they need to have adequate information on how to monitor the project, be able to pay the opportunity cost of participation and coordinate their actions to monitor the project. Finally, citizens should believe the programme has the potential to be successful, be able to understand the information provided, pay attention and face a non-prohibitive opportunity cost to participate. Providers and politicians need to gain popularity, increased salary and/or social recognition, obtain re-election or avoid social disapproval or an indictment. If these assumptions are not met, the underlying programme theory of the CMI breaks down and this may prevent CMIs from having an impact on service delivery outcomes. In particular, whether or not they hold true can affect citizens’ decision on whether to monitor government activity and the governments’ willingness to facilitate citizen engagement and become more accountable. Below we present the bottlenecks as well as the empirical implications.
Civic participation failure
One potential concern with CMIs is that citizens will fail to participate in monitoring activities (building block 3). We have identified six potential bottlenecks7 that could prevent citizens from participating in monitoring activities, which in turn reduces the potential impact of the programme (see Table 2). In particular, if community monitoring activities are not carried out, or carried out by only a few citizens, their ability to uncover problems and put pressure on the government to provide accountability can be significantly reduced.
Table 2: Bottlenecks preventing citizens from participating in monitoring activities
Bottleneck Description Empirical Implications
Information Gaps
Scholars and policymakers have long argued that programmes often fell short of their expectations because of information problems (Ringold et al., 2012). In the case of the CMIs there are two important potential deficiencies: (a) the information may not have been properly disseminated (building block 1), and/or (b) information on how to monitor the project was either not provided or not understood by the citizens (building block 2).
• If the information is not properly disseminated, citizens will not participate in monitoring activities
• Citizens’ probability of participation in monitoring activities will be a function of how well they understand how to monitor providers.
Lack of Attention Span or Rational Inattention
Even if information is provided, it may fail to have the anticipated outcome. A factor that conditions its success is what information is to be disclosed (content), and how it is to be presented (vehicle). In the case of CMIs, citizens’ lack of attention span might prevent them from absorbing the information provided by the intervention and properly monitor providers. Citizen may also choose not to pay attention (Sims, 1998, 2003, 2006), often describe as rational inattention. As a consequence,
If citizens’ opportunity cost of paying attention to the information is high or they lack of attention span, their probability of participation will decrease8.
7 The term bottlenecks has been used in the literature (Lieberman et al., 2013) to refer to constraints that limit the effectiveness of community monitoring programmes.
8 In order to give salience to information practitioners use an array of instruments to attract the citizens’ attention. We are not aware of any CMIs where these incentives were embedded in the theory of change and properly assessed. This appears to be a knowledge gap for CMIs.

18 The Campbell Collaboration | www.campbellcollaboration.org
introducing new information does not always lead to new beliefs or changes in behaviour.
High Opportunity Cost of Participation
Citizens, and particularly the poor, simply may not have the time to get informed or give feedback on service delivery because of more pressing priorities such as securing food and meeting other basic needs (Banerjee and Mullainathan, 2008).
If opportunity cost of participation is high, probability of participation will be lower.
Collective Action Failure
Scholars have emphasised the collective action problems that can arise in the presence of a non-excludable local public good (Olson, 1971), such as community monitoring. If community members believe fellow citizens will contribute to monitor the project, they may decide not to participate.
If citizens expect other citizens would free-ride on their efforts to monitor the project, the probability and intensity of participation will be lower.
Citizens’ Beliefs can prevent participation
Citizens may refuse to take advantage of the opportunity to influence politicians and providers if they believe the chances of success are low. These beliefs can become a self-fulfilling prophecy where citizens refuse to participate and as a consequence providers have fewer incentives to improve performance (Molina, 2013a).
Citizens who perceived politicians and/or providers are responsive to them have higher probability of participation in community monitoring activities.
Elite Capture Community monitoring may also be prone to be captured by local elites (Bardhan, 2002; Bardhan and Mookherjee, 2006; Olken, 2007). The rationale is that when decision making is part of the CMI, the elite would want to take advantage by capturing the monitoring process and appropriate the resources associated with the program.
If the CMI is captured by local elites, the participation will be limited to its supporters, which may affect the effectiveness of the program. It is an empirical question whether the elite capture could improve or worsen outcomes. See Atlas et al. (2013) for an example of different types of elites
Politicians and providers’ accountability
Under this heading we present potential reasons for a lack of responsiveness on the part of the politicians and providers. The literature cites many reasons why politicians and providers may not be accountable to their citizens (building block 4 and 6). Below we identify three potential bottlenecks.
19 The Campbell Collaboration | www.campbellcollaboration.org
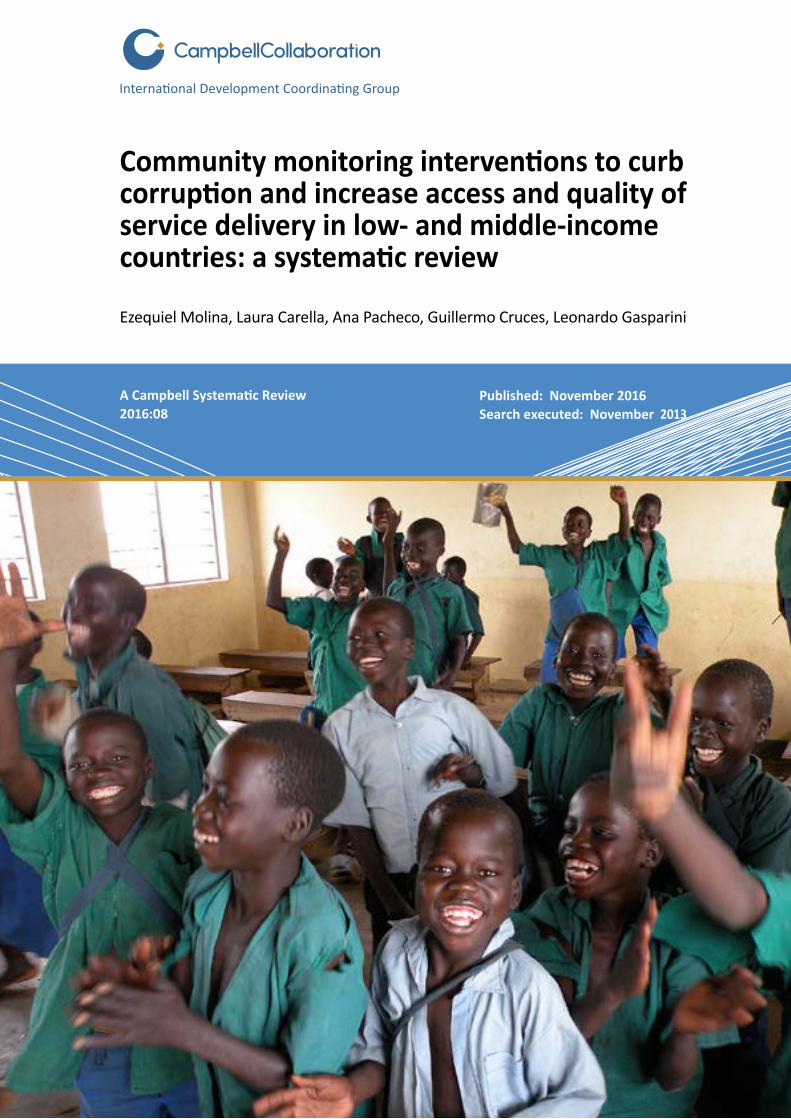
Table 3: Bottlenecks causing a lack of responsiveness from politicians and service providers
Bottleneck Description Empirical Implications
Unresponsive Politicians
Even in well-functioning democracies, citizens in a given community may not be pivotal for politician’s electoral strategy (Downs, 1957; Hotelling, 1929; Persson and Tabellini, 2002). This means that citizens’ support is not needed for politicians to win elections and/or stay in power. Additionally, especially in developing countries, often the political system does not work properly and institutions do not help translate the preference of the people into policy (Boix et al., 2003; Acemoglu and Robinson, 2008). Keefer and Khemani (2004, 2005) argue that public service providers have weak incentives to improve performance quality because their jobs are protected by political agents – politicians have stronger incentives to provide secure public-sector jobs as teachers, health workers, and local bureaucrats, than to pressure these job-holders to improve service delivery.
If the community is not needed for the politicians to stay in power, we should find that politicians’ performance does not increase as a result of the CMI, irrespective of what happens with citizen engagement in monitoring activities.
Unresponsive Providers
The literature on providers’ motivations to deliver services no longer assumed them to be either public spirited altruists (knights) or passive recipients of state largesse (pawns). Instead, they are often considered to be in one way or another self-interested (knaves) (Le Grand, 2003). Communities in developing countries often have low state capacity, which limits the ability of governments to monitor self-interested providers (Besley and Persson, 2011). If this is the case, putting pressure on the government will be ineffective and only competition or informal sanctions from the community may have an effect on providers’ performance.
In communities where providers are not responsive to politicians, CMIs will only be effective if it changes providers’ behaviour. If communities can impose a credible threat of informal social sanctions to unresponsive providers, the probability of a change in behaviour from providers will be higher, regardless of whether they are responsive to politicians. If communities can choose providers, competition among them will foster better performance9.
1.4 WHY IT IS IMPORTANT TO DO THIS REVIEW
Community monitoring interventions have gained widespread acceptance as a tool to improve transparency and accountability by all the major players in the practitioners’ world, that is, governments, NGOs, and the donor community. Increasing citizen participation in government decision making and policy formulation is the main objective behind the Open Government Partnership (OGP), a global consortium of governments. Through OGP, more than 50 countries around the world have already agreed upon different goals related to transparency and citizen participation. Moreover, international aid agencies increasingly require development projects to include ‘beneficiary participation’ components. Over the last
9 In some parts of the world the state fails completely to provide services and to monitor illegal private service provision. Even under these environments, when citizens can choose providers overall providers’ performance may increase.

20 The Campbell Collaboration | www.campbellcollaboration.org
decade the World Bank alone has channelled 85 billion USD to local participatory development (Mansuri and Rao, 2012).
The United Nations have set increasing citizen participation as their main strategy to achieve good governance and human rights (UN, 2008), and NGOs with a focus on increasing government accountability through citizen participation continue to expand around the globe, managing increasing amounts of resources. For instance, Transparency International has an annual budget of 36 million USD, which they use to advocate for increasing citizen engagement as a necessary step for development (Transparency International, 2013). Other examples of NGOs are Twaweza and the Affiliated Network for Social Accountability (ANSA). Twaweza engages in building citizen capacity to monitor governments and foster their accountability across East Africa and has an annual budget of 17 million USD. ANSA is currently operating in East Asia and the Pacific, South Asia, Africa, Middle East and at the global level to support civil society organisations in their efforts to monitor governments in service delivery and to build demand for public accountability.
Finally, through the newly created Global Partnership for Social Accountability (GPSA) a coalition of donors, governments and civil society organisations aim to improve development results by supporting capacity building for enhanced citizen feedback and participation to monitor service delivery. GPSA aims to reach overall funding of 75 to 125 million USD over the next seven years. To date, 15 countries have joined the GPSA: Bangladesh, Belarus, Colombia, Dominican Republic, Honduras, Indonesia, Kyrgyzstan, Malawi, Moldova, Mongolia, Mozambique, Philippines, Senegal, Tajikistan and Tunisia.
From a theoretical perspective, as we highlighted above, there are no clear predictions as to what the impact of these programmes should be. Some authors have found reasons to expect CMIs to have a positive effect on improving service delivery and reducing corruption (Stiglitz, 2002), but others have argued that successful implementation of CMIs might prove more difficult than expected (Bardhan, 2002; Bardhan and Mookherjee, 2006; Olken, 2007; Molina, 2013a).
While a number of empirical studies have been conducted in recent years, we still lack a clear picture of the impact of community monitoring programmes. High quality primary studies find what at first appears to be contradicting evidence regarding the effect of CMIs on service delivery outcomes. Björkman and Svensson (2009) find that community scorecards in Uganda significantly increased the quality and quantity of primary health care provision. Banerjee et al. (2010), however, find the opposite result when testing the effect of an information campaign in India. They report that neither giving citizens information on how to use existing institutions to monitor schools nor training them in a testing tool to monitor children's learning had any statistical impact on children's learning performance.
There are several existing reviews of this literature. For instance, King, Samii and Snilstveit (2010) provide a systematic review of impact evaluations examining the effectiveness of community-driven development and curriculum interventions in improving social cohesion in sub-Saharan Africa. However, this is an outcomes driven review focusing on social cohesion outcomes, rather than focusing on corruption and service delivery outcomes of a broad range of CMIs. There are also several non-systematic reviews on related issues. Mansuri and Rao (2012) review the evidence on the effectiveness of local participatory programmes on an array of outcomes, including service delivery. The study focuses mostly on large-scale interventions such as Community Driven Development (CDD), and Community Driven Reconstruction (CDR). They find that, on average, results are below the expectations of these programmes, and suggest that the reason for this may be a failure to build cohesive and resilient organisations to pressure the government. In particular, they argue that both local and national contexts may be key factors in determining effectiveness, in part because not all communities have a stock of social capital that can be readily harnessed though a

21 The Campbell Collaboration | www.campbellcollaboration.org
participatory intervention. Finally, they argue that induced participatory interventions work best when they are supported by a responsive state and when local accountability institutions are robust.
Moreover, Hanna et al. (2011) and Pande and Olken (2011) review studies of interventions aimed at reducing corruption. However, they do not provide comprehensive reviews of the literature on effects of community monitoring and use narrative methods of synthesis rather than meta-analysis. Ringold et al. (2012) review the effects of CMIs on human development, and while it is relatively comprehensive, it is a narrative review rather than a systematic review. It identifies some key impediments to the successful implementation of CMIs: a) information asymmetries between citizens and providers, b) individuals may not use the opportunity to influence service providers, c) providers that are not amenable to change, and d) fragmented civil society and weak media.
Similarly, Devarajan et al. (2011) review interventions aimed at strengthening the role of civil society in service delivery and government accountability, focusing on Sub-Saharan Africa. The review, which is not systematic, finds preliminary evidence of the positive effects of building organic participation and building on existing political and civil society structures, on service delivery and government accountability. The findings are mediated by the local context, as in communities where clientelism and rent-seeking were widespread, civic participation failed to have an impact on service delivery and government accountability.
Gaventa and Barret (2012) perform a meta-case study of 100 interventions aimed at increasing citizen engagement in service delivery. However, the search for literature was limited to the studies undertaken by the Institute of Development Studies between 2000 and 2011 and the review adopts a vote counting approach with a broad range of study designs.
To date no systematic reviews have been conducted on the effects of CMIs on corruption and service delivery outcomes. The existing reviews provide some suggestive evidence of the effects of CMI, but come to different conclusions, in an area that is hotly debated and of key policy importance. Reports from USAID for instance acknowledge that the lack of systematic evidence limits our ability to make precise claims regarding the relationship between CMIs, corruption and service delivery outcomes (Brinkerhoff and Azfar, 2008).
Whether CMIs affect the behaviour of beneficiaries, providers and politicians, and in turn reduce corruption and improve service delivery outcomes is still an open empirical question. We also know little about the mechanisms through which these interventions have an effect (or lack thereof). The inconclusiveness reflected in the theoretical and empirical work described above highlights the need for systematic evidence on the subject. Our systematic review aims to shed light on this debate by providing a systematic and exhaustive literature search, together with a comprehensive and unbiased synthesis of the existing evidence.

22 The Campbell Collaboration | www.campbellcollaboration.org
Objectives
Our systematic review aims to assess and synthesise the evidence on the effects of CMI interventions on corruption and access to and quality of service delivery outcomes. We introduce a theoretical framework to understand the pathways of change of the CMIs interventions. Using this framework, we aim to uncover the facilitators and barriers for CMIs to successfully reduce corruption and improve access to and quality of service delivery. The review systematically collects and synthesises evidence from high quality impact evaluations of CMIs. Outcomes are synthesised along the causal chain, from intermediate outcomes such as participation in the monitoring activities through to public officials and providers’ responsiveness, to final outcomes such as corruption and access to and quality of the services provided.
The review aims to answer the following questions:
1) What are the effects of CMIs on corruption and access to and quality of service delivery in L&MICs, relative to no formal community monitoring or CMIs with less community representation?
2) What are the mechanisms through which CMIs have an effect (or lack thereof) on reducing corruption and improving service delivery outcomes?
3) Do factors such as region, income level or length of exposure moderate the effects of CMI on intermediate and final outcomes?

23 The Campbell Collaboration | www.campbellcollaboration.org
Methods
Our review strives to answer these questions by synthesising evidence from both quantitative and qualitative studies. The review follows Campbell and Cochrane Collaboration approaches to systematic reviewing (Campbell Collaboration, 2015; Hammerstrøm et al., 2010; Higgins and Green, 2011; Shadish and Myers, 2004; Shemilt et al., 2008). The review is also informed by theory-based impact evaluation (White, 2009), using the theory of change (Figure 1) as the framework for the review, to guide the types of studies included, data collection and analysis. To ensure the review is adequately oriented towards both reporting effects and explaining the reasons for them, we synthesise effects along the causal chain, including qualitative evidence where appropriate, using the effectiveness plus approach (Snilstveit, 2012; Snilstveit et al., 2012). For the quantitative synthesis we use meta-analysis to pool study effects where studies are judged to be sufficiently similar to do so.
1.8 CRITERIA FOR INCLUDING STUDIES IN THE REVIEW [PICOS]
3.1.1 Participants
The review includes CMIs in either low- or middle-income countries at the time that the intervention was carried out. To assess whether a country is low, middle or high income we follow the World Bank classification method. For example, for interventions carried out in 2011, to qualify as a low income group gross national income (GNI) per capita should be 1,025 USD or less; middle income, 1,026 USD – 12,475 USD; and high income, 12,476 USD or more. We include all CMIs in low- and middle-income countries. The review excludes CMIs in high-income countries. For studies to be included, they need to collect and report on data at the individual or at the community level. Interventions targeting particular disadvantaged groups, or studies that conduct analysis across disadvantaged groups, are included in the review. This inclusion criterion was used for both quantitative and qualitative studies.
3.1.2 Interventions
We include community monitoring interventions where the community is given the opportunity to participate in the process of monitoring service delivery, where monitoring means being able to observe and assess providers’ performance and provide feedback to providers and politicians. To be included interventions need to:
• have a clear objective of reducing corruption and/or improving service delivery; • use encouragement of the community to monitor service delivery as a key intervention
instrument; • fall into one of the following four intervention categories: information campaigns,
scorecards/citizen report cards, social audits and grievance redress mechanism.
These interventions have a common theory of change that exactly addresses our objective of interest: whether programmes that encourage community monitoring reduce corruption and

24 The Campbell Collaboration | www.campbellcollaboration.org
improve access to and quality of service delivery. Detailed descriptions of these interventions are provided below:
Information campaigns usually involves information on the benefits of the service to be delivered (health, education, police, etc.) and the current state of the service in the community. The information could be provided door to door, in public gatherings aided by local leaders, through radio, newspapers and other means. Kefeer and Khemani (2011), for example, study the impact of having access to community radio programmes on the benefits of educational attainment in Benin. Information campaigns may also include information on how to monitor providers.
Scorecards, or citizen report cards, also encourage citizen to participate in monitoring service delivery. The intervention takes the form of a quantitative survey that assesses users' satisfaction and experiences with various dimensions of service delivery. It often involves a meeting between the recipients of services and providers to discuss the findings of the survey and to develop a follow-up plan (Ringold et al., 2012). For instance, Björkman and Svensson (2009), analyse the impact of a scorecard community monitoring intervention on primary health care in Uganda. A non-governmental organization (NGO) distributed a quantitative survey) and facilitated village and service provider’s staff meetings in which members of the communities discussed the results. Community members were also encouraged to develop a plan identifying key problems and steps that providers should take to improve health service delivery. Scorecards may also include an interaction between citizens and providers, while information campaigns do not include a forum for such interaction.
Social audits involves group of citizens collecting information on the implementation of particular public services in relation to expected standards. This allow citizens receiving a specific service to examine and cross-check the information the provider makes available during a mandatory public hearing against information collected from users of the service (Ringold et al., 2012). During the public hearing all relevant stakeholders are present, including citizens, providers, and politicians.
Grievance redress mechanisms (GRMs) provide people with opportunities to use information to influence service delivery. GRMs capture different mechanisms that provide citizens with opportunities to use information redress to influence service delivery and give feedback on government programmes and services. Such mechanisms include complaint hotlines, informal dispute resolution mechanisms, and courts (Ringold et al., 2012).
Other interventions may include community monitoring as part of a different intervention. For instance, Community Driven Development Interventions (CDDs), Community Driven Reconstruction Interventions (CDRs), participatory budgeting, and school based management will only be included if they have a clear community monitoring component. In that case, depending on the monitoring component, we will classify them as information campaigns, scorecards, social audits or grievance redress mechanism. The study from Olken (2007) in Indonesia is a case in point. The monitoring program, a social audit, is embedded in a larger intervention, a CDD. We include this type of interventions in our review.
However, there are other CDDs and CDRs where there is no monitoring component. For instance, Casey et al. (2012), who study the impact of a CDR programme in Sierra Leona, are excluded from our review. The reason is that the theory of change for these types of interventions is completely different than for CMIs. Even further, the objectives of these interventions are also different. A similar argument could be made about participative budgeting and school based management. As a result, we also exclude those interventions from our review when there is no community monitoring component.

25 The Campbell Collaboration | www.campbellcollaboration.org
Access to information laws provides a legal framework for the public provision of information (Ringold et al., 2012). There are many laws that can potentially improve citizens’ abilities to monitor service delivery, for instance, voting rights, laws that allow schools or hospitals to have user groups, the creation of the ombudsman figure, among many others. The theory of change for these interventions is different from the one we develop for CMIs and studies assessing such interventions on their own are excluded. Such interventions are not defined as community monitoring unless they include an additional component aimed at encouraging community monitoring. For instance, studies assessing the impact of information campaigns which aim to induce citizens to monitor the implementation of such laws fall under our definition of community monitoring, and thus are included in the review. These criteria are used for both quantitative and qualitative studies.
3.1.3 Comparisons: Treatment and Comparison Groups
Even for identical interventions we could have different estimands and/or different counterfactuals. We include interventions that estimate the impact among the following groups:
1. Community Monitoring Interventions (CMI) as the treatment condition and no formal process of monitoring as the counterfactual. For example, see Björkman and Svensson (2009).
2. CMIs where there is an encouragement for community to participate in monitoring as the treatment condition and CMI with no encouragement as the counterfactual. For example, see Olken (2007).
3.1.4 Outcomes
Primary outcomes
We include studies assessing the effects of CMI on the following primary outcomes to address review question (1), the effects of CMIs on access and quality of service delivery, and corruption outcomes in L&MICs.
Corruption outcomes
As we argued above, a big issue in the literature is the difficulty in measuring corruption accurately (Pande and Olken, 2011). In this review we synthesise two types of corruption measures, forensic estimates and perception measures. Below we provide specific examples:
• Forensic economic estimates: This refers to the application of economics to the detection and quantification of behaviour (Zitzewitz, 2012), in this case, corruption. In Olken (2007) corruption is measured by comparing the researcher’s estimate of what the project actually costs10 to what the village reported it spent on the project on an item by item basis.
10 The cost is determined by the quantity of materials used and estimate of material prices and wages paid on the project.

26 The Campbell Collaboration | www.campbellcollaboration.org
• Perception measures: An imperfect way to deal with the fact that it is very difficult to detect and measure the extent of corruption, is to rely on citizen’s perception measures of corruption.
Service delivery outcomes
For impacts on service delivery we look at two types of outcome: access and quality of the service. Below we provide specific examples:
Access to service: We use the percentage of the population that has access to the service to measure this outcome. For example, if the CMI involves an infrastructure programme to facilitate household access to clean water, the percentage of the population that has access to clean water is the primary variable of interest.
Quality of services
We will use measures of:
• Improvement in prevalence condition. For example, Björkman and Svensson (2009) capture the effect of the CMI on infant weight. Additional measures in the health care sector could be mortality rates as well as disease prevalence in general. In Banerjee et al. (2010), there is information on student’s reading ability. Additionally, information on test scores would be in this category. For CMIs in the police sector, the outcome indicator could be victimisation rates for each type of crime. In infrastructure projects, we look at different outcomes depending on whether it is a school, a hospital, or a water and sanitation program. In the last case we could measure the quality of the water that reaches households, as well as whether the service is working all the time or has interruptions. Finally, in Molina (2013b) the author looks at satisfaction with project performance as a measure of the impact of the social audit.
• Average waiting time to get the service. This is important for health care interventions as well as those in the security sector. See Björkman and Svensson (2009).
Studies that include at least one of these outcomes are included in the systematic review. Among those included studies, we collect and analyse data on a range of intermediate outcomes to address question (2), the mechanisms through which CMIs have an effect (or lack thereof) on improving service delivery outcomes and reducing corruption. This means that any study that has an intermediate outcome should also include at least one of the primary outcomes. Below we specify the intermediate outcomes of interest for this review.
Intermediate outcomes
These outcomes include changes in behaviour induced by the intervention, such as whether participants contribute to monitoring of the service or project and the behaviour and performance of providers and politicians. Below we provide specific examples that follow the logic of the theory of change presented above.
• Citizen’s participation in monitoring activities: This could be measured by the percentage of citizens that contribute to the monitoring process. If measures of intensity of participation are available, we also collect them. In the context of the social audit in Colombia this would be the percentage of citizens that spend any time monitoring the project. The more time they spend, the higher the intensity of participation.

27 The Campbell Collaboration | www.campbellcollaboration.org
• Providers’ and politicians’ performance: This outcome could be measured in several ways. Traditionally, absenteeism rates are computed if a direct measure of effort and quality of their performance is not available.
3.1.5 Study types
To address review questions 1, 2 and 3, studies eligible for inclusion in the effectiveness synthesis include impact evaluations based on experimental design (where randomised assignment to the intervention is made at the individual or cluster level), quasi-experimental designs (including controlled before and after (CBA) studies with contemporaneous data collection and with two or more control and intervention sites, regression discontinuity designs and interrupted time series studies (ITSs)) and ex-post observational studies with non-treated comparison groups and adequate control for confounding.
For quasi-experimental studies and observational designs with comparison groups, eligible studies must use adequate methods of analysis to match participants with non-participants, or statistical methods to account for confounding and sample selection bias. Appropriate methods of analysis to match participants and non-participants include propensity score matching (PSM) and covariate matching. Appropriate methods of analysis to control for confounding and selection bias include multivariate regression analysis using difference-in-differences (DID) estimation, instrumental variables (IV) or Heckman sample-selection correction models.
Studies that do not control for confounding using these methods, such as those based on reflexive comparison groups (pre-test post-test with no non-intervention comparison group), are excluded.
To address question (2) we extracted relevant data from studies meeting the criteria outlined above, and related documents for the interventions evaluated in the effectiveness studies.
1.9 SEARCH METHODS FOR IDENTIFICATION OF STUDIES
3.2.1 Electronic searches
We performed searches in the following databases and resources: International Bibliography of Social Science (IBSS), EconLit, Citas Latinoamericanas en Ciencias Sociales y Humanidades (CLASE), Plataforma Open Access de Revistas Científicas Electrónicas Españolas y Latinoamericanas (e-Revist@as), Red de Revistas Científicas de América Latina y el Caribe, España y Portugal (REDALyC), African Journals Online (AJOL), Scopus, the British Library for Development Studies (BLDS), PAIS (Public Affairs Information Service), Worldwide Political Science Abstracts (WPSA ), International Political Science Abstracts (IPSA), JSTOR, CIAO (Columbia International Affairs Online), ABI/Inform (Ebsco), ELDIS, CAIRN and Google Scholar.
These databases cover a wide range of journals, including those from low- to middle-income countries that may be overlooked in global indexes. Initial searches were based on keywords derived from our research questions. All searches were stored to ensure replicability.
We searched using a combination of the group of keywords presented in the Table 4. The combination within each group is given by the Boolean operator OR, and between groups by AND (or equivalent operator for the database).

28 The Campbell Collaboration | www.campbellcollaboration.org
Table 4: Search keywords
Group 1: People Group 2: Monitoring Group 3: Results Group 4: Government
communit* monitor* performance representative*
civil* particip* effort* local authorit*
civic* empower* attend* bureaucra*
citizen* control* achievement* councillor*
people develop* test score* provider*
elector* governanc* absent* politician*
grassroot* superv* disease prevalence official*
social report* card* cost effectiv* leader*
societ* audit* access* govern*
local informat* AND campaign* deliver* service* administration
resident* scorecard* performance service*
neighbo* score card* provi* service*
accountab* corrupt*
watchdog* fraud*
democrati* dishonest*
people power brib*
mismanag*
leak*
missing fund*
client*
wait*
victim*
efficien*
inefficien*
quality
rent* seek*
Keywords were translated to Spanish, French, and Portuguese.

29 The Campbell Collaboration | www.campbellcollaboration.org
The search strategy was adapted to the particularities of each database. Several of the databases had restrictions regarding the maximum number a keyword and/or wildcards used, or the number or reported results, and required dividing the searches into several combinations.
Whenever possible we searched for synonyms or used the option of searching for similar terms before every keyword. Depending on the maximum number of keywords allowed in the database we limited the searches with a L&MIC filter, to low- or middle-income countries.
We used ENDNOTE, and ZOTERO as an auxiliary tool, to record searches, and collect and organise references.
One example of the search strategy is available in Appendix A.
3.2.2 Other searches
We tried to avoid the bias against unpublished and non-English literature by searching in Google Scholar, REPEC-IDEAS, NBER, Global Development Network, Networked Digital Library of Theses and Dissertations Index to Theses, 3ie database and the ProQuest dissertation database using the set of keywords described above.
We also used the following methods to identify additional studies:
• Screening the references of included studies and existing reviews for eligible studies. • Citation searches of all included studies using Social Sciences Citation Index, Scopus
and Google Scholar. • Searching in conference programmes and websites of key institutions; such as the
World Bank, UNDP Governance Projects, Asian Development Bank, African Development Bank, Inter-American Development Bank, Open Government Partnership, Research centres and networks, as JPAL, MIT, IEN, Institute of Development Studies; International, Economic Commission for Latin America (ECLAC), Centro Interamericano para el Desarrollo del Conocimiento en la Formación Profesional (CINTERFOR), regional, national and local non-governmental organizations.
• Contact with subject-matter experts, and practitioners
3.2.3 Additional searches to address question 2
In order to analyse the mechanisms through which CMIs have (or not) an effect, we searched for sibling articles following Booth (2011), doing a citation tracking of all included studies to identify any sibling papers, and conducting targeted searches at implementing agencies websites, Google and databases using the intervention name.
1.10 DATA COLLECTION AND ANALYSIS
1.10.4 Selection of studies
Two independent review authors performed the searches and screened the first stage results against the inclusion/exclusion criteria. A third author supervised the process and solved any discrepancies. A record was kept of all decisions.

30 The Campbell Collaboration | www.campbellcollaboration.org
1.10.5 Data extraction and management
We extracted information on the study type, authors, date, publication status, type of publication and language. We also collected information about the intervention, country and area, dates of the intervention, available information, type of intervention, research design, outcomes reported, information transmission, interaction between community and service providers, and the community’s power to make decisions. 11
Two reviewers independently coded and extracted the data from the selected studies. Again, this process was supervised by a third author. A coding sheet with a description of the data collected is included in Appendix B.
1.10.6 Assessment of risk of bias in included studies12
Assessment of risk of bias in included studies of effects
Studies were critically appraised according to the likely risk of bias based on:
• quality of attribution methods (addressing confounding and sample selection bias); • the extent of spillovers to services and projects in comparison groups; • outcome and analysis reporting bias; and • other sources of bias.
‘Low risk of bias’ studies are those in which clear measurement of and control for confounding was made, including selection bias, where intervention and comparison groups were described adequately (in respect of the nature of the interventions being received) and risks of spillovers or contamination were small, and where reporting biases and other sources of bias were unlikely.
Studies were identified as at ‘medium risk of bias’ where there were suspected threats to validity of the attribution methodology, or there were possible risks of spillovers or contamination, arising from inadequate description of intervention or comparison groups or reporting biases suspected.
‘High risk of bias studies’ are all others, including those where comparison groups were not matched or differences in covariates were not accounted for in multivariate analysis, or where there was evidence for spillovers or contamination to comparison groups from the same communities, and reporting biases were evident. Our evaluation criteria are presented in Appendix C.
At the same time, we also critically appraised the confidence in our classifications, the consistency among ratings by our coders by doing inter-rater assessment, we use an absolute agreement intra-class correlation, McGraw and Wong (1996).
11 We used a reduced version of the Coding sheet proposed in the Protocol, in which we have discarded the ‘Capacity Building’ block because we found several missing values for most of these fields.
12 Our instrument was an abridged version of the one developed by Waddington, Snilstveit, Hombrados, Vojtkova, Phillips, Davies and White (2014).

31 The Campbell Collaboration | www.campbellcollaboration.org
Following de Vibe et al. (2012) and Waddington et al. (2014) we present a summary of the quality assessment of the included studies using a traffic light scheme graph to differentiate study quality across the four different components of our risk of bias assessment tool.
Quality appraisal of studies included to address review question 2
To address review question (2), we include a subset of the quantitative studies included in the review of question (1), specifically, those that measure not only primary outcomes but also intermediate outcomes, plus a set of sibling studies. Most of those sibling articles were previous versions of the final included paper, policy papers, or other authors’ descriptions of the same intervention. The subset of studies already included to answer question (1) are already appraised, and we simply use again the same ratings, adjusting them if necessary when we take into account the new variables, and for the sibling articles we follow the same methodology, for those cases where the article is merely descriptive of the intervention, or a retelling of the main paper, we assigned the same appraisal to the design of the intervention than in the effects paper, namely whether they address the existence of spillovers, selection bias and confounding, and we assigned them their own values for the potential existence of outcome and analysis reporting bias, or any other sources of bias.
1.10.7 Measures of treatment effect13
We extracted comparable effect size estimates from included studies, together with 95 per cent confidence intervals. Whenever possible, we calculated standardised mean differences (SMDs) for continuous outcome variables, risk ratios (RRs) and risk differences (RD) for dichotomous outcome variables. Some studies, Björkman and Svensson (2009) and Bjiörkman, de Walque and Svensson (2013), already reported average standard effects; which are interpreted in the same way as SMDs; in those cases we used them directly. Treatment effects were calculated as the ratio of, or difference between, treated and control observations in a consistent way, such that outcome measures are comparable across studies. Thus, a SMD or RD greater than zero (RR greater than 1) indicates an increase in the outcome of interest due to the intervention, as compared to the control group. A SMD or RD less than zero (RR between 0 and 1) indicates a reduction under the intervention as compared to the comparison. A SMD or RD equal to (or insignificantly different from) zero (RR equal to 1) indicates no change in outcome over the comparison. Whether these relative changes represent positive or negative impacts depend on meaning of the outcome in the context of the programme being evaluated. For example, while positive impacts on service delivery are measured as values greater than 1, positive impacts of CMIs on – in this case, reductions in – corruption are measured as values less than 1. We followed the statistical transformations for calculating risk ratios and standardised mean differences from matching-based and regression studies provided in Waddington et al. (2012).
13 This section draws heavily on Waddington, Snilstveit, Vojtkova and Hombrados (2012), IDCG (Campbell International Development Coordinating Group), Protocol and Review Guidelines (2012) as well as Waddington, Snilstveit, Hombrados, Vojtkova, Phillips, Davies, and White, (2014).

32 The Campbell Collaboration | www.campbellcollaboration.org
Effect sizes for continuous outcomes
For studies using parallel group or matching strategies14 the SMD and its standard error are computed as follows (Borenstein et al., 2009):
𝑆𝑆𝑆𝑆𝑆𝑆 = 𝑌𝑌�𝑟𝑟−𝑌𝑌�𝑐𝑐𝑆𝑆𝑝𝑝
𝑆𝑆𝑆𝑆 = �𝑛𝑛𝑡𝑡+𝑛𝑛𝑐𝑐𝑛𝑛𝑐𝑐∗𝑛𝑛𝑡𝑡
+ 𝑆𝑆𝑆𝑆𝑆𝑆2
2∗(𝑛𝑛𝑐𝑐+𝑛𝑛𝑡𝑡)
where 𝑌𝑌�𝑟𝑟 is the outcome in the treatment group, 𝑌𝑌�𝑐𝑐 is the outcome in the control group, nc is the sample size of the control group, nt is the sample size in the treatment group and 𝑆𝑆𝑝𝑝 is the pooled standard deviation.15
For studies using a regression analysis to address attribution of impact (cross sectional OLS regressions, instrumental variables, difference-in-difference multivariate regressions), SMD and its standard error are estimated as follows (Keef and Roberts, 2004):16
𝑆𝑆𝑆𝑆𝑆𝑆 = 𝛽𝛽�
𝜎𝜎� 𝑆𝑆𝑆𝑆 = �𝑆𝑆𝑆𝑆𝑆𝑆2
𝑣𝑣−2∗ ( 𝑣𝑣
𝑡𝑡2+ 𝑣𝑣 ∗ [𝑐𝑐(𝑣𝑣)]2 − 𝑣𝑣 + 2)
Where 𝛽𝛽 refers to the coefficient of the treatment variable in the regression, 𝜎𝜎� is the pooled standard deviation17, v is n-k degrees of freedom.
14 Note that for studies using a matching strategy the outcome level for the treatment group and control group used to estimate the effect size is the outcome level for each group after matching. If Kernel approach is used it is recommended to substitute 𝑌𝑌�𝑐𝑐 in the formula with 𝑌𝑌�𝑟𝑟-ATET (Average Treatment effect on the treated).
15 There are two main categories of SMD, Cohen’s d and Hedges g. The difference between them lies in the strategy to estimate the pooled standard deviation, 𝑆𝑆𝑝𝑝. For Cohen’s d, 𝑆𝑆𝑝𝑝 refers to the standard deviation of the dependent variable for the entire distribution of observations in the control and treatment group. For Hedges g, 𝑆𝑆𝑝𝑝 is estimated as follows:
𝑆𝑆𝑝𝑝 = �(𝑛𝑛𝑐𝑐 − 1) ∗ 𝑆𝑆𝑐𝑐2 + (𝑛𝑛𝑡𝑡 − 1) ∗ 𝑆𝑆𝑡𝑡2
𝑛𝑛𝑡𝑡 + 𝑛𝑛𝑐𝑐 − 2
Hedges g is preferable, though the use of g or d will depend on the availability of data.
16 For studies with large n, c(v) is considered equal to 1. Otherwise, please see below footnotes for c(v) computation.
17 The calculation of the pool standard deviation from regression approaches vary for the two main types of SMD. While in the Cohen’s d SMD 𝜎𝜎� is the standard deviation of the dependent variable both for all the individuals in the treatment and control group, in the Hedges g SMD 𝜎𝜎� is the standard deviation of the error term in the regression.

33 The Campbell Collaboration | www.campbellcollaboration.org
SMD effect sizes need to be corrected for sample bias by applying the following correction factor to the SMD calculations:
a) for studies using a parallel group or a statistical matching-based design (Ohlin, 1981):
𝑆𝑆𝑆𝑆𝑆𝑆𝑐𝑐𝑐𝑐𝑟𝑟𝑟𝑟𝑐𝑐𝑐𝑐𝑡𝑡𝑐𝑐𝑐𝑐 = 𝑆𝑆𝑆𝑆𝑆𝑆𝑢𝑢𝑛𝑛𝑐𝑐𝑐𝑐𝑟𝑟𝑟𝑟𝑐𝑐𝑐𝑐𝑡𝑡𝑐𝑐𝑐𝑐 ∗ �1 − 34∗(𝑛𝑛𝑡𝑡+𝑛𝑛𝑐𝑐−2)−1
�
b) for studies using a regression based approach (Keef and Roberts, 2004):18
𝑆𝑆𝑆𝑆𝑆𝑆𝑐𝑐𝑐𝑐𝑟𝑟𝑟𝑟𝑐𝑐𝑐𝑐𝑡𝑡𝑐𝑐𝑐𝑐 = 𝑆𝑆𝑆𝑆𝑆𝑆𝑢𝑢𝑛𝑛𝑐𝑐𝑐𝑐𝑟𝑟𝑟𝑟𝑐𝑐𝑐𝑐𝑡𝑡𝑐𝑐𝑐𝑐 ∗ 𝑐𝑐(𝑣𝑣)
For continuous outcomes, whenever the data reported or obtainable from the authors was not sufficient to estimate SMD, it was necessary to estimate response ratios, which offer greater possibilities for estimation. Response ratios measure the proportionate change in the outcome between the intervention and the control group that is caused by the intervention (Hedges et al. 1999). The formula is the same as the formula for calculating risk ratios, as reported below (following Borenstein et al., 2009 and Keef and Roberts, 2004). 19
Effect sizes for dichotomous outcomes
Treatment effects of dichotomous outcome variables are converted into Risk Ratios (RR) and 95% confidence intervals. RRs measure the ratio between two proportions – the dichotomous outcome level in the treatment group and the dichotomous outcome level in the control group. For studies using a parallel group or statistical matching-based strategy, the RR and its standard error are estimated as follows (Borenstein et al., 2009):
𝑅𝑅𝑅𝑅 = 𝑌𝑌�𝑡𝑡𝑌𝑌�𝑐𝑐
𝑆𝑆𝑆𝑆 = 𝑆𝑆𝑝𝑝2 ∗ ( 1𝑛𝑛𝑡𝑡∗(𝑌𝑌𝑡𝑡� )2 + 1
𝑛𝑛𝑐𝑐∗(𝑌𝑌𝑐𝑐� )2)
Where 𝑌𝑌�𝑡𝑡 is the mean outcome in the treatment group, 𝑌𝑌�𝑐𝑐 is the mean outcome in the control group, nc is the sample size of the control group, nt is the sample size in the treatment group and Sp is the pooled standard deviation.20
18 Where 1𝑐𝑐(𝑣𝑣)
= �𝑣𝑣2∗𝛤𝛤 (𝑣𝑣2−
12)
𝛤𝛤(𝑣𝑣2) where Γ() is the gamma function and v is the n-k degrees of freedom.
19 When it is not possible to compute Sp, it is also possible to estimate the standard error for response ratios based on reported t statistics for differences in means between groups (e.g. PSM, regression), as 𝑆𝑆𝑆𝑆(𝑅𝑅) = exp( 𝐿𝐿𝑛𝑛 (𝑅𝑅)
𝑡𝑡), where ln(R) is the natural logarithm of the response ratio and t is the t-statistic of
the significance of the effect, e.g. the t-statistic of the regression coefficient. For some maximum likelihood regression models such as Logit or Probit, the impact effect from this regression coefficient needs to be used. For difference-in-difference multivariate regression model the response ratio can be calculated as 𝑅𝑅𝑅𝑅 = 𝑒𝑒𝛽𝛽 ∗ 100.
20 There are different approaches to the estimation of the pooled standard deviation. The most
commonly used is Hedges method: 𝑆𝑆𝑝𝑝 = �(𝑛𝑛𝑐𝑐−1)∗𝑆𝑆𝑐𝑐2+ (𝑛𝑛𝑡𝑡−1)∗𝑆𝑆𝑡𝑡2
𝑛𝑛𝑡𝑡+𝑛𝑛𝑐𝑐−2 Cohen’s method uses the standard
deviation of the dependent variable as the pooled standard deviation.

34 The Campbell Collaboration | www.campbellcollaboration.org
For regression-based studies, RR and its standard errors are estimated as follows:21
𝑅𝑅𝑅𝑅 = 𝑌𝑌�𝑐𝑐+𝛽𝛽𝑌𝑌�𝑐𝑐
𝑆𝑆𝑆𝑆 = 𝜎𝜎� ∗ ( 1𝑛𝑛𝑡𝑡∗(𝑌𝑌𝑐𝑐�+𝛽𝛽)2 + 1
𝑛𝑛𝑐𝑐∗(𝑌𝑌𝑐𝑐� )2)
where 𝛽𝛽 is the coefficient of the treatment effect, 𝑌𝑌�𝑐𝑐 is the mean outcome in the control group, nc is the sample size of the control group, nt is the sample size in the treatment group and 𝜎𝜎� is the pooled standard deviation.22
The RD is an absolute measure and sensitive to the baseline risk. RD and its standard errors are estimated as follows
𝑅𝑅𝑆𝑆 = 𝐴𝐴𝐴𝐴+𝐵𝐵
− 𝐶𝐶𝐶𝐶+𝑆𝑆
𝑆𝑆𝑆𝑆 = � 𝐴𝐴𝐵𝐵(𝐴𝐴+𝐵𝐵)3 + 𝐶𝐶𝑆𝑆
(𝐶𝐶+𝑆𝑆)3
where A is the number of cases with the event on the threated group, B the number of cases with no event on the threated, C the number of cases with the event on the controlled, and D the number of cases with no event on the controlled group.
This systematic review includes different study designs that assess the effects on different measures of the same outcome. For example, studies using a difference-in-differences approach would provide the impact of the programme on the growth rate of the outcome. Other studies that use a propensity score matching approach would provide the impact of the programme on the level of the outcome. Since the response ratio measures the proportional change in an outcome of an intervention, it does not seem unreasonable to combine the response ratios of studies measuring impacts of an intervention on levels with studies assessing impacts on growth rates of outcomes.23
Average standardised treatment effect
Some of the studies report average standardised treatment effects following Kling et al. (2004)’s methodology. They combine several measures for the same outcome into a unique average standardised treatment effect (ASE), by estimating a seemingly unrelated regression system for K related outcomes:
𝑌𝑌 = [𝐼𝐼𝐾𝐾 ⊗ (𝑇𝑇 𝑋𝑋 )] 𝜃𝜃 + 𝜐𝜐,
where 𝐼𝐼𝐾𝐾 is a K by K identity matrix.
21 For some maximum likelihood regression models such as Logit or Probit (for dichotomous outcomes) and Tobit (for continuous outcomes), it is not possible to use the regression coefficient to estimate the RR. In such a case, β refers to the “impact effect” calculated from the regression coefficient for Logit, Probit or Tobit models.
22 There are two main approaches to the calculation of the pooled standard deviation from regression-based studies. While in the Cohens approach 𝜎𝜎� is the standard deviation of the dependent variable both for all the individuals in the treatment and control group, in the Hedges approach 𝜎𝜎� is the standard deviation of the error term in the regression, Waddington et al. (2014)
23 On the other hand it would not be meaningful to combine standardised mean differences or mean differences of studies measuring impact in corruption levels with studies measuring impact on growth rate of corruption. Indeed, the mean differences approaches might require included studies to use not only the same outcome but also the same measure of outcome, preventing the aggregation of results of studies that use study designs based on panel data (cross-sectional before versus after) and those based on cross-sectional data only.

35 The Campbell Collaboration | www.campbellcollaboration.org
The average standardised treatment effect is estimated as
𝛽𝛽 � = 1𝐾𝐾∑ 𝛽𝛽𝑘𝑘��
𝜎𝜎𝑘𝑘�𝐾𝐾𝑘𝑘=1 ,
where 𝛽𝛽𝑘𝑘 � is the point estimate on the treatment indicator in the kth outcome regression and and 𝜎𝜎𝑘𝑘 � is the standard deviation of the control group for outcome k (Björkman de Walque and Svensson, 2013).
As the authors do not report a single effect for each of these K outcomes, we were not able to compute RR nor RD for them, so we simply report the ASE, as it is a standardised effect in itself, which is interpreted in the same way as SMDs.
Unit of analysis
For clustered designs, the assessment of the unit of analysis error is based on whether the unit of analysis is different from the unit of treatment assignment. If this is the case, the review assesses whether the authors take clustering into account in the analysis (for example using multilevel model, variance components analysis, cluster level fixed effects, and so on).
No adjustments were required as all studies included in the meta-analysis reported clustered standard errors.
Missing data
Many quasi-experimental studies used in impact evaluation in economics and political science do not report the information required to calculate standardised mean differences. In those cases, we contacted the authors to obtain it, and when needed, we compute response ratios, which measure the proportional change in an outcome in the situation in the intervention group relative to that in the comparison group, giving a similar interpretation to a risk ratio. Borenstein et al. (2009) define this as R= Xt / Xc, where R is the response ratio effect size, Xt is the mean outcome in the treatment group and Xc is the mean outcome in the comparison group. The response ratio provides a measure of the relative change in an outcome caused by an intervention. In other words, the response ratio quantifies the proportionate change that results from an intervention.
1.10.8 Dependent effect sizes
For dependent effect sizes, where multiple outcome measures are reported by a sub-group, data is collected at multiple time points, or when the impacts of the programme on multiple outcomes measuring the same outcome category are reported, we combined groups from the same study prior to meta-analysis, in order to avoid problems of results-related choices, including one effect estimate per study and intervention in a single meta-analysis. Following Waddington et al. (2014), in which multiple outcomes were reported from alternate specifications, we selected the specification according to likely lowest risk of bias in attributing impact, or according to the authors’ criteria24. In some cases, where studies have reported multiple effect sizes from different specifications, and we were not able to choose a preferred specification, we have calculated a synthetic effect size using appropriate formulae
24 For instance, in the case of Björkman and Svensson (2009), the effect of the intervention on some outcomes was computed in two ways: using a difference-in-difference estimator, and using an OLS estimator. In these cases, we chose the difference-in-difference estimator because, as the authors say, the OLS estimates are less precisely estimated.

36 The Campbell Collaboration | www.campbellcollaboration.org
to recalculate variances according to Borenstein et al. (2009, chapter 24) and Higgins and Green, 2011, Chapter 1625.
𝑆𝑆𝑆𝑆���� = ∑ 𝐸𝐸𝑆𝑆𝑖𝑖𝑚𝑚𝑖𝑖=1𝑚𝑚
𝑆𝑆𝑆𝑆(𝑆𝑆𝑆𝑆����) = � 1𝑚𝑚2 �∑ 𝑉𝑉(𝑆𝑆𝑆𝑆𝑖𝑖)𝑚𝑚
𝑖𝑖=1 + ∑ 𝑟𝑟𝑖𝑖𝑖𝑖𝑆𝑆𝑆𝑆(𝑆𝑆𝑆𝑆𝑖𝑖)𝑖𝑖≠𝑖𝑖 𝑆𝑆𝑆𝑆(𝑆𝑆𝑆𝑆𝑖𝑖)�
The correlation between the effect sizes was calculated whenever possible using the databases for the papers, only Piper and Korda (2010) report the correlation matrix in the text, for the rest of the studies we assume correlations of 0.5. For those studies, we did a sensibility test, using extreme values for the correlations, and the conclusions on the effect sizes significance remained unchanged.
When studies used a single control group and several treatment groups the effects of each treatment are not independent of each other as the control group is the same for each intervention. To solve this problem, we follow the same procedure than to face the dependence produced by multiple outcomes, we computed a summary effect for the combination of interventions versus control, creating a composite variable which is simply the mean of the effect of each treatment versus control. The variance of this composite would be computed based on the variance of each effect size as well as the correlation between the two effects. This correlation can be estimated accurately based on the number of cases in each group as explained in Borenstein et al. (2009, chapter 25).
1.11 DATA SYNTHESIS
The review synthesises quantitative data on effects to assess whether the intervention of interest works to improve service delivery outcomes and reduce corruption (objectives question 1), and mix of quantitative studies on intermediate outcomes with their companion sibling papers, which are useful to provide context and to explain the mechanisms behind the effects (objectives question 2). Finally, we conducted moderator analyses to assess which factors moderate effects on intermediate and final outcomes (objective question 3).
1.11.4 Review question (1): Effectiveness synthesis
We synthesised the evidence on effects using meta-analysis. Following Wilson et al. (2011), our a-priori rule for conducting meta-analysis required two or more studies, each with a computable effect size of a common outcomes construct (potentially measured in different ways), and similar comparison condition.
To account for the possibility of different effect sizes across studies, we used a random effects meta-analysis model, since the CMIs were carried out in different countries, with different contexts, for participants with different demographic characteristics, and with differences in intervention design and implementation. By accounting for the possibility of different effect sizes across studies in this way, random effects meta-analysis produces a pooled effect size with greater uncertainty attached to it, in terms of wider confidence intervals than a fixed effect model.
25 The same procedure was applied for computing an overall effect size from effect sizes arising from different regions, different age groups, different surveys, etc.

37 The Campbell Collaboration | www.campbellcollaboration.org
We used Stata software to estimate the meta-analyses, and effect sizes are reported using forest plots (Stata Corporation, College Station, TX, USA).
We estimated an aggregated meta-analysis for all types of interventions for each primary outcome (5). Initially, we anticipated running one meta-analysis for each outcome, and then decomposing into stratified meta-analyses for each CMI. However, given the low number of studies found, we decided that the breakdowns by intervention would be meaningless, except for a few outcomes26. We also decomposed the analysis by sector in which service was provided (e.g. education, health, infrastructure, etc.) and perform some sensitivity analyses, namely by study design and region. However, the results of these exercised should not be generalised given the low number of studies involved in them.
Assessment of heterogeneity
We assessed heterogeneity of effects across studies, using the I2 statistic to provide an overall estimate of the amount of variability in the distribution of the true effect sizes (Borenstein et al., 2009).
1.11.5 Review question (2): CMIs mechanisms synthesis
For the synthesis of evidence relating to question 2, we used both qualitative and quantitative approaches.
For studies measuring intermediate and final outcomes, we used a narrative synthesis approach, where themes were identified based on the links and assumptions in the theory of change model described above. The low number of comparable effect sizes prevented us from running meta-regression analyses of the associations between intermediate and final outcomes.
1.11.6 Review question (3): Moderator analyses
For the synthesis of evidence relating to question 3, we attempted to use a quantitative approach. The a priori decision rule for performing meta-analysis following Wilson et al. (2011) required to consider two or more studies, in the end, given the restriction on the number of studies, we only were able to perform a modest analysis on the effect of the design of the CMI on the improvement in a prevalence condition. The coding sheet in Appendix B collects information about the differences within each intervention whenever possible. In particular, for information campaigns, it included a capacity building component where information on how to monitor providers is disseminated, and for scorecards and social audits, whether they involved facilitated meetings with providers and politicians. Finally, we studied whether length of exposure (measured as length of CMI programme implementation, and length of post-implementation follow-up period) had any impact on the effectiveness of the CMIs. Given the final low number and variation of the studies selected, we were only able to investigate in some extent geographical variation only for some primary outcomes.
26 We only decompose the analysis by CMIs for some measures of Access to service and Improvement in prevalence condition, where we found more papers to assess the effect size. For details, please see chapter 5.

38 The Campbell Collaboration | www.campbellcollaboration.org
1.11.7 Integrated synthesis (review questions 1, 2 and 3)
We used the programme theory (Figure 1) as a framework for integrating the findings from synthesis of review questions (1), (2) and (3) with the aim of providing an integrated narrative synthesis along the causal chain addressing the objectives of the review.
1.11.8 Sensitivity analysis
Whenever the number of studies was high enough we perform sensitivity analysis in order to account per differences by study design, region and the existence of outliers.
1.11.9 Analysis of publication bias27
Additionally, whenever possible, we studied whether published and unpublished results tend to differ significantly, as a test for publication bias. Because statistical significance is often regarded as a requirement for publication, one symptom of publication bias is an unusually large number of published p-values just below the 0.05 threshold (Gerber and Malhotra, 2008a, 2008b). Another symptom is larger reported effects among studies with smaller samples; because smaller studies tend to have larger standard errors, their estimated effects need to be larger in order to achieve significance at the p < 0.05 level. We tested for possible publication bias using funnel plots and Egger et al.’s (1997) test. However, the low power of these tests due to the low number of studies prevented us from having conclusive findings.
27 A broader concept of publication bias would include not only published results, but also working papers as being affected by the same syndrome. Since we do not have access to those results which authors decided not to put on paper or circulate in the academic community (so-called file drawer problems), we will not be able to test for that type of publication bias.

39 The Campbell Collaboration | www.campbellcollaboration.org
Results
1.12 SEARCH RESULTS
The following figure shows a summary of the search and selection process.
Figure 2: Search and selection process
* Reasons for exclusion:
- Not CMI: the study does not assess a community monitoring intervention. - Outcome type: the study does not have outcomes on corruption, service delivery or quality of services - Data: the study does not collect data at the individual or the community level - Study Types: the study does not follow any of the methodologies accepted, or it does not provide
information on methodology.
109,025 references
72,070 titles screened
36,955 duplicated references eliminated
787 abstracts screened
1,318 not L&MIC 69,965 not related
181 full text screened
15 selected studies 6 sibling articles
615 not relevant
- 11 not available - 149 excluded*: 136 Not CMI 48 Outcome Type 78 Data 48 Study Type

40 The Campbell Collaboration | www.campbellcollaboration.org
The search strategy presented in section 3.2 yielded 109,017 references, 36,955 of which were eliminated as duplicates, leaving 72,070 to be screened. Of the 72,070 potentially relevant papers identified, 65,044 were identified from databases, 7,009 from Google or Google scholar, citation tracking and bibliographic searches of reviews and 17 from contact with organisations and researchers. 71,283 were excluded at the title screening stage as they were irrelevant or not based in a low- or middle income country, leaving 788 studies to be screened at abstract. Of these, 181 studies were assessed for inclusion at full text, 136 did not assess a community monitoring intervention, 48 did not have outcomes on corruption, service delivery or quality of services, 78 did not collect data at the individual or the community level, and the study does not follow any of the methodologies accepted, and 48 did not provide information on methodology.28 Fifteen studies met the inclusion criteria, and six sibling studies were identified.
1.13 CHARACTERISTICS OF INCLUDED STUDIES
We included studies from three regions: six in Africa, seven in Asia and two in Latin America. Uganda and India had the largest presence of CMI impact evaluations, with four studies conducted in each country. We also identified two studies from Indonesia and one each from Benin, Liberia, Colombia, Pakistan and Mexico. Descriptive information on the 15 included studies assessing the effects of Community Monitoring Interventions (CMIs) is presented in Annex G.
The included studies evaluated the effects of 23 different CMI interventions. Information Campaigns were the most commonly studied intervention. Specifically, there were 10 examples of Information Campaigns (IC), three examples of Scorecards, five examples of Social Audits (SA), and two that combined Information campaigns and Scorecards29. We did not identify any studies on Grievance Redress Mechanisms. These programmes targeted different sectors, with most studies focusing on the education sector (9), followed by health (3), infrastructure (2) and promoting employment (1). Table 5 includes additional information that describes each study.
The review includes studies assessing the effects of CMIs on all primary outcomes of interest. Improvement in prevalence condition was the outcome most commonly reported in the studies, followed by access to services. Eleven studies reported on improvement in prevalence condition, seven on access to service, three on perception of corruption, two on average waiting time to get the service and two on forensic economic estimates for corruption.
There are differences between the specific measures used to assess any one outcome. For example, in health, access could be measured as utilization, coverage or immunizations. Even in education, where different interventions measure pupil learning through test scores, the differences in the population of interest, age, type of test, etc. imply differences in the actual instrument.
For all outcomes, we have attempted to calculate effect sizes and 95 per cent confidence intervals. However, as reported in Table 14, in two studies insufficient information was
28 Appendix F presents a list of the excluded studies along with the reasons for their exclusion.
29 Appendix D describes these interventions in more detail.

41 The Campbell Collaboration | www.campbellcollaboration.org
provided in order to estimate standard errors and therefore statistical precision of the effect sizes.
The included studies used a range of study designs including randomised assignment (10), and quasi-experimental studies (5). In eight of the eight RCT the control group received no form of intervention, in the other two, the comparison group received or a simplified version of the intervention (Olken, 2007), or a combination of no treatment and a different treatment (Pradhan et al., 2014). The quasi-experimental studies have more variation, from relying on the distance to a media outlet, to compare with a previous round of a social audit.
We can notice that we have a wide range of studies, from studies that were designed only to inform whether a given programme improved outcomes for the treatment group as compared to the control group, to more complex studies, with many treatment arms, that attempt to measure not only whether the intervention brought any positive effect but also to understand the pathway of change. As we anticipated in the protocol, we face different ways to measure the outcomes of interest.
Table 5 summarises some other important features of the included studies. Follow-up periods varied from less than one year to over 12 years, and most studies report clustered standard errors.

42 The Campbell Collaboration | www.campbellcollaboration.org
Table 5: Detailed descriptive information on included studies
Study Intervention Study design /
Attribution method
Target and Control group Follow-up
time period1
Unit of analysis error assessment Internal
validity
assessment
Afridi, F. and
Iversen, V.
(2013)
Social audit
(Second
audit)
Difference-in-
differences (DID)
This is a panel data set that comprises of
official data from three rounds of social audits,
with an initial sample of 300 GPs in eight
districts of Andhra Pradesh. It compares the
results of the second (264 audits) and third
audit (166) with those of the first one (284).
548 number of audits, from which 284 are
first audit, and 264 are a second audit.
(Clusters at GPs level: 300)
Five years Low probability of relevant unit of analysis
error: standard errors are clustered at GP level.
Low risk of
bias
Social audit
(Third
audit)
Andrabi, Das
and Khwaja
(2013)
Scorecard Difference-in-
differences (DID)
Treatment group: Scorecards. Control Group
without scorecard
112 Villages were chosen randomly from
among those with at least one private school
according to a 2000 census of private schools.
First, Grade 3 children in all primary schools
were tested and then, in a randomly selected
50 per cent of the villages, were disseminated
report cards with the results of school and
child test scores for all schools (804) and
tested children (12110)
One year and
two years
Low probability of relevant unit of analysis
error.
Low risk of
bias

43 The Campbell Collaboration | www.campbellcollaboration.org
Study Intervention Study design /
Attribution method
Target and Control group Follow-up
time period1
Unit of analysis error assessment Internal
validity
assessment
Banerjee et
al. (2010)
Information
campaign
(IC)
Treatment
1
RCT 85 villages as control group and 195 as target
group.
The final sample for the baseline survey
consisted of 2,800 households, 316 schools,
17,533 children (ages 7–14) tested in reading
and math, and 1,029 VEC member interviews
from the 280 villages.
In the endline survey, 17,419 children were
tested, a sample that includes all but 716 of
the children in the baseline and, thus, very
little attrition from the baseline survey (the
attrition is evenly spread across the various
treatment and control groups).
One year Low probability of relevant unit of analysis
error: standard errors are clustered at village
level.
Low risk of
bias
Information
campaign
(IC)
Treatment
2
Information
campaign
(IC)
Treatment
3
Barr et al.
(2012)
Scorecard
Intervention
1: standard
scorecard
RCT, Difference-in-
differences (DID)
100 rural primary schools: 30 schools were
assigned to each of the standard and
participatory treatment arms, with the
remaining 40 serving as a control group. 3512
students, we assume it follows the same
division as the schools
Two years
and
four
mont
hs
Low probability of relevant unit of analysis
error: for some outcomes, authors use DID
which accounts for clustering at school level
and include strata-years controls, but for they
report strata control.
Low risk of
bias
Scorecard
Intervention
2:

44 The Campbell Collaboration | www.campbellcollaboration.org
Study Intervention Study design /
Attribution method
Target and Control group Follow-up
time period1
Unit of analysis error assessment Internal
validity
assessment
participator
y scorecard
Björkman
and
Svensson
(2009)
Scorecard +
information
campaign
RCT 25 facilities/ communities randomly assigned
as control group and 25 facilities/
communities randomly assigned as target
group
One year Low probability of relevant unit of analysis
error: authors include district and facilities
fixed effects and, when possible, they estimate
DID. Standard errors are clustered by
catchment areas.
Low risk of
bias
Björkman,
de Walque
and
Svensson
(2013)
Scorecard +
information
campaign
Cross-section
(regression),Differe
nce-in-differences
(DID), Seemingly
unrelated
regression (Kling et
al., 2004)
25 facilities/ communities randomly assigned
as control group and 25 facilities/
communities randomly assigned as target
group
Two years Low probability of relevant unit of analysis
error: authors include district and facilities
fixed effects and, when possible, they estimate
DID. Standard errors are clustered by
catchment areas.
Low risk of
bias
Information
Campaign
Intervention
(IC)
12 facilities/ communities randomly assigned
as control group and 13 facilities/
communities randomly assigned as target
group
One year
Gertler et al.
(2008)
Scorecard Difference-in-
differences (DID)
Treatment schools are those schools that first
received the AGE programme at the beginning
of any school year between 1998-99 and
2001-02, and had AGE continuously ever since
(N=2544). Those that had not received AGE
before school year 2002-03 constitute the
comparison group (N=3483).
Twelve years Low probability of relevant unit of analysis
error: standard errors are clustered at school
level.
Low risk of
bias

45 The Campbell Collaboration | www.campbellcollaboration.org
Study Intervention Study design /
Attribution method
Target and Control group Follow-up
time period1
Unit of analysis error assessment Internal
validity
assessment
Keefer and
Khemani
(2011)
Information
Campaign
Intervention
(IC)
Cross-section,
Quasi-experimental
In the target group are the households and
children in the villages which access to the
radio. In the control are those in villages
without access to the radio. 210 villages
(4200 households) from 21 communes
Not
applicable
Low probability of relevant unit of analysis
error: standard errors are clustered at
commune level.
Low risk of
bias
Molina
(2013b)
Social audit Cross section-
Matching
The random sample contains 390 households
for the 13 projects in the treatment group and
410 for the 11 projects in the control group.
Not
applicable
Low probability of relevant unit of analysis
error: standard errors are clustered at
commune level.
Low risk of
bias
Olken
(2007)
Social Audit
-
Invitations
RCT, Cross-section
(regression)
Social Audit with Invitations vs. Social Audit.
199 villages (audit 94 , control 105)
OnOne year Low probability of relevant unit of analysis
error: standard errors are adjusted to allow for
correlation within subdistricts. The estimations
include engineering team fixed effects and
fixed effects for each subdistrict (i.e., the
stratifying variable for the participation
experiments).
Low risk of
bias
Social Audit
-
Invitations
+
comments
Social Audit with Invitations plus comments vs.
Social Audit 202 villages (audit 96, control
106)
Pandey et al.
(2007)
Information
campaign
(IC)
Difference-in-
differences (DID)
and Cross-section
105 villages (1045 households at the
baseline), from which 55 (548 households)
intervention and 50 (497 households) control
One year Unclear: for some outcomes, authors use DID
which accounts for clustering in the treatment
allocation, but for other outcomes they report
the results of a multivariate random-effect
regression for which the specification is not
reported, although they state that random
Low risk of
bias

46 The Campbell Collaboration | www.campbellcollaboration.org
Study Intervention Study design /
Attribution method
Target and Control group Follow-up
time period1
Unit of analysis error assessment Internal
validity
assessment
effects are at the village cluster level and
standard errors are clustered at the village
cluster level. They also argue that the
regression adjusts for total population of the
village cluster, district size, household caste,
and highest education attained in the
household.
Pandey,
Goyal and
Sundararam
an (2009)
Information
campaign
(IC)
RCT 610 villages from which 340 intervention and
270 control
Two to four
mont
hs
Low probability of relevant unit of analysis
error: standard errors are clustered at village
level.
Medium risk
Second IC
in one
region
Piper and
Korda
(2010)
Information
campaign
(IC)
RCT Groups were randomly selected and clustered
within districts, such
that several nearby schools were organised
together. 117 schools, from which 59 are
control. The intervention was targeted at
grades 2 and 3.
One year Low probability of relevant unit of analysis
error: standard errors are clustered at school
level.
Medium risk
Pradhan et
al. (2014)
Training (T):
IC
Difference-in-
differences (DID)
2 provinces, nine districts, 44 subdistricts and
520 schools. Training: treatment group: 230
One year and
10
Low probability of relevant unit of analysis
error: all estimations include stratum fixed
Low risk of
bias

47 The Campbell Collaboration | www.campbellcollaboration.org
Study Intervention Study design /
Attribution method
Target and Control group Follow-up
time period1
Unit of analysis error assessment Internal
validity
assessment
Linkage (L):
IC
schools, 1060 students; control group 190
schools and 2120 students. Linkage:
treatment group: 240 schools and 893
students; control group: 180 schools and
2120 students. The authors also include a
third treatment that we do not consider as it is
not of the type of CMI considered in this
review, the intervention introduced changes in
the election of the committee. They also
explore combinations of treatments given that
some individuals in the control groups for each
treatment had received the other treatments.
mont
hs
effects because assignment of treatment was
within each stratum and the robust standard
errors for regressions with test scores are
clustered at the school level.
Reinikka
and
Svensson
(2011)
Information
campaign
(IC)
Difference-in-
differences (DID),
Instrumental
Variable (IV)
Using distance to newspapers outlets the
authors construct the treatment and control
group. 218 schools for which survey data are
available for the years 1991-95 and 2001,
and a sample of 388 (218 + 170) schools for
which survey data are available in 2001.
Not
applicable
Low probability of relevant unit of analysis
error: standard errors are clustered at school
level.
Low risk of
bias
Notes: IC Information campaign, SA Social Audit; SC Scorecard; DID: Differences-in-differences, IV: Instrumental Variable; OLS: Ordinary Least Squares estimation
1/ Average years from intervention to endline survey.

48 The Campbell Collaboration | www.campbellcollaboration.org
1.14 SIBLING ARTICLES
We identified six additional documents related to the programmes analysed, and we describe them in Table 6.
Table 6: Related studies
Included Study
Additional Study
Study objectives Country Programme Methods of data collection Methods of analysis
Afridi, F. and Iversen, V. (2013)
Singh and Vutukuru (2009)
To evaluate the effectiveness of social audit as a tool to enhance accountability by measuring the impact of social audit on the implementation an employment guarantee programme.
India National Rural Employment Guarantee Scheme, the flagship employment guarantee programme of the Government of India, in the state of Andhra Pradesh.
Case study. Quantitative data collected from the programme. A reporting format designed for the qualitative findings of each social audit carried out in each village. Interviews were conducted with Directors, Social Audits, Department of Rural Development, government of Andhra Pradesh
Mix of quantitative (DID) and qualitative methods.
Banerjee et al. (2010)
Banerjee et al. (2007)
To assess community participation in monitoring education services. To evaluate the impact of advocacy and public action information campaigns on local participation to improve school functioning and to strengthen learning outcomes of the children.
India Universalisation of elementary education (Sarva Shiksha Abhiyan (SSA)) and Pratham India Education Initiative (Pratham).
Data from a survey of parents, teachers, VECs, and children which was undertaken in the rural district of Jaunpur in the eastern part of the state, during March-April 2005.
Descriptive statistics using data from the survey.
Björkman and Svensson (2009)
Björkman and Svensson (2010)
To test whether social heterogeneity can explain why some communities managed to push for better health service delivery while others did not.
Uganda Citizen report cards aimed at enhancing community involvement and monitoring in the delivery of primary health care, initiated in rural
The authors use a smaller subset of the data in Björkman and Svensson (2009). Specifically, they exploit detailed utilization data –on out-patients, delivery, antenatal care, and family planning – obtained directly from records kept by facilities for their own need (i.e. daily patient
Seemingly unrelated regression system.

49 The Campbell Collaboration | www.campbellcollaboration.org
Included Study
Additional Study
Study objectives Country Programme Methods of data collection Methods of analysis
areas in Uganda in 2004.
registers). The data set covers 50 primary health care providers in nine districts in Uganda of which half took part in the experiment (the remaining constitute the control group).
Olken (2007)
Olken (2004) To assess the effect of social audits and external audits on corruption in provision of public services (roads building).
Indonesia The Kecamatan (Subdistrict) Development Project
The data come from four types of surveys, each designed by the author and conducted specifically as part of the project: a key-informant survey, covering baseline characteristics about the village and the village implementation team; a meeting survey, containing data on the attendees and a first-hand report of discussions at the accountability meetings; a household survey, containing data on household participation in and perceptions of the project; and a final field survey, used to measure corruption in the project.
Descriptive statistics and Ordinary- least-squares (OLS)
Olken (2007)
Olken (2005) To examine the relationship between perceptions of corruption and a more objective measure of graft, in the context of a road building programme in rural Indonesia.
Indonesia Kecamatan (Subdistrict) Development Project
Household survey, containing data on household perceptions of the project; a field survey, used to measure missing expenditures in the road project; a key-informant survey with the village head and the head of each hamlet, used to measure village characteristics; and a meeting survey, containing data on the village accountability meetings.
Probit model and Ordinary- least-squares (OLS).
Olken (2007)
Woodhouse (2005)
The paper aims to get a sense of the anatomy of corruption in KDP villages: of how the actors
Indonesia Kecamatan Development Programme (KDP)
interviews with people involved in corruption case, from ordinary villagers to local government
The report is based on an analysis of identified corruption cases in KDP, field visits to ten

50 The Campbell Collaboration | www.campbellcollaboration.org
Included Study
Additional Study
Study objectives Country Programme Methods of data collection Methods of analysis
perceive their interests, what motivates them, what kinds of constraints they face, and what kinds of steps they take to resolve their problems. The underlying aim is to assess the kinds of anti-corruption measures that are likely to succeed in local projects that operate in a systemically corrupt environment and in an overall project whose size and breadth (20,000 villages nationwide) makes centralised control and monitoring of funds impossible. The paper also uses corruption as a lens through which to view snapshots of social and political change in Indonesian villages.
officials (including those accused of corruption)
villages and three provinces, and on-site interviews with central KDP project staff, KDP field consultants, government officials, and villagers. It also makes use of information gathered during KDP supervision missions to provinces other than those visited for this report. The report especially makes use of the views of KDP’s project historian and of staff from KDP’s Complaints Handling Unit, who track and follow up corruption cases that get reported.

51 The Campbell Collaboration | www.campbellcollaboration.org
1.15 ASSESSMENT OF RISK BIAS
1.15.1 Assessment of risk of bias in included studies of effects
Taking into account the characteristics of each paper, it was possible to evaluate the internal validity and the risk of bias of the assessment of each programme. Seven studies were categorised as low risk of bias in attributing outcomes to the intervention, based on our five criteria of selection bias and confounding, spillovers, outcome reporting bias, analysis reporting bias, and other sources of bias (Andrabi et al., 2013; Banerjee et al., 2010; Barr et al., 2012; Björkman and Svensson, 2009; Olken, 2007; Pandey et al., 2007, and Pradhan et al., 2014). The remaining eight studies were classified as medium risk (Afridi and Iversen , 2013; Björkman et al., 2013; Gertler et al., 2008; Keefer and Khemani, 2011; Molina, 2013b; Pandey et al., 2009; Pandey, Goyal and Sundararaman, 2009, Piper and Korda, 2010, and Reinikka and Svensson, 2011). None were considered to have a high risk of bias. The summary report across risk of bias categories is provided in Figure 3.
Figure 3: Summary of quality appraisal across effectiveness studies
Thus, the overall risk of bias assessment is predominantly low, with 13 out of 15 papers having this level of risk, followed by two papers with medium risk of bias.30 The inter-rater assessment, the absolute agreement intra-class correlation is 0.70 with a 95% CI [0.21, 0.95]
The full quality assessment for each study is reported in Appendix E. The table shows that included studies used a range of attribution methods. Most of them used randomised assignment in the study design. A minority of studies used quasi-experimental approaches such as instrumental variables and matching (Keefer and Khemani, 2011; Molina, 2013b).
The majority of studies (11 out of 15) were adequately protected against performance bias as the units of treatment were located far from the control units. While in some cases the comparison group was selected from villages were the intervention was not carried out but
30 This result was corroborated by having a third researcher analyse the ratings.
0% 20% 40% 60% 80% 100%
5) Other sources of bias adressed?
4) Analysis reporting bias addressed?
3) Outcome reporting bias addressed?
2) Spillovers adressed?
1) Selection bias and confounding adressed?
Overall risk of bias assessment
Low Risk Medium Risk High Risk

52 The Campbell Collaboration | www.campbellcollaboration.org
were located near villages that had received the intervention31, and in other cases, the comparison group received a different treatment or the same intervention with a different degree of intensity (for example, Afridi and Iversen, 2013; Olken, 2007), the authors took that into consideration while designing the intervention and selecting cluster for their standard errors.
We found just one case of potential outcome reporting bias, where the outcome reported was a new type of literacy test and the authors had not clearly justified the reason for using the measure over standard ones. There was no evidence in the remaining studies that outcomes were selectively reported and authors use “common” methods of estimation. Therefore, almost all studies are considered as having low risk of outcome reporting bias.
With regards to analysis reporting bias, in most of the included studies different measures for the same outcome are reported or different specification and estimation methods are applied, and in general there are no red alerts regarding other bias.
1.15.2 Assessment of risk of bias in included studies of effects to address review question (2)
For this section, we appraise 11 papers, five of them were already included in the previous subsection, and the other six are sibling studies. Four Olken (2004, 2005, 2007) and Woodhouse (2005) analyse the social audit evaluated in Olken (2007). We also included Banerjee et al. (2007, 2010), Björkman and Svensson (2010), Molina (2013b), Pandey et al. (2007), Pradhan et al. (2014), and Singh and Vutukuru (2009).
Thus, the overall risk of bias assessment is low, with ten out of 11 papers having this level of risk, and Woodhouse (2005) with a medium risk of bias. The full quality assessment for each study is reported in Appendix E. The inter-rater assessment, the absolute agreement intra-class correlation is good at 0.55, although is not statistically significant with a 95% CI [-0.19, 0.93].
Figure 4: Summary of quality appraisal across studies for question (2)
31 All randomised field experiments report no statistical difference between treatment and control groups.
0% 20% 40% 60% 80% 100%
5) Other sources of bias adressed?
4) Analysis reporting bias addressed?
3) Outcome reporting bias addressed?
2) Spillovers adressed?
1) Selection bias and confounding adressed?
Overall risk of bias assessment
Low Risk Medium Risk High Risk

53 The Campbell Collaboration | www.campbellcollaboration.org
Results of synthesis of effects
In this section, we synthesize the quantitative data from our 15 studies on effectiveness using statistical meta-analysis to assess whether the included interventions worked to improve service delivery outcomes and reduce corruption (review question 1).
We report the results of meta-analyses for the effects of CMIs on the five primary outcomes, explained in detail in section 3.1.4. Initially, we expected to run one meta-analysis for each outcome, and then to decompose into separate analyses for each CMI. However we did not identify enough studies for each intervention sub-group to do so, except for a few outcomes.
The included studies use a range of different measures to assess primary outcomes and it would not be sensible to pool conceptually different outcomes in our analysis. To avoid this problem we grouped studies only when the outcome variables represent a similar broad outcome construct and the intervention is implemented in the same sector.
In some cases, studies report the effect of more than one intervention. In those cases, we chose the interventions that could be classified as one of our four categories. In cases where more than one intervention was relevant, we pooled their effects before integrate them into meta-analysis, taking into account the correlation of the treatment and control groups between study arms to address possible dependency32. This is the case of Afridi and Iversen (2013), Banerjee et al. (2010), Barr et al. (2012), Olken (2007) and Pradhan et al. (2014); see Table 5 for details.
In the case of Afridi and Iversen (2013) we took the two interventions carried out in India reported by authors and pooled their effects on the same outcome –a measure of corruption- assuming a correlation between treatments of 0.5. We computed the pooled effect size of both treatments and its corresponding standard error following Borenstein et al. (2009).
Banerjee et al. (2010) report three different interventions that were all classified as a CMI. We pooled their effects taking into account the correlations between them33.
Barr et al. (2012) also explore the effect of two different scorecard interventions that are both relevant for our analysis. In this case, we computed correlations based on sample size, following Borenstein et al. (2009).
32 In some cases, these correlations were available in the studies’ databases, or where easily obtainable from tables reported in the papers. When not available, we assumed a value of 0.5, and checked whether the results changed substantially for extreme correlation values.
33 We computed them using the author’s dataset.

54 The Campbell Collaboration | www.campbellcollaboration.org
We also identified two CMIs in Olken (2007). Again, we computed correlations based on sample size. Although the author reports many possible measures of corruption, we chose the most representative for our analysis.
Finally, Pradhan et al. (2014) report three interventions in Indonesia and different combinations of them, but we only identified two of them as falling into one of our four categories of CMIs, namely, the ‘Linkage’ and ‘Training’ interventions. In this case, we were able to compute correlations using the dataset.
In case where we identified different measures for the same outcome, we followed a similar procedure. We computed a synthetic effect size, defined as the mean effect size in that study, with a variance that takes account of the correlation among the different outcomes (Borenstein et al., 2009). The details of the variables considered for each outcome are presented in the corresponding tables regarding effect sizes (see below).
Finally, when we found different follow up periods for comparable interventions, we compared them considering similar horizon time. This is the case for Björkman and Svensson (2009) and Björkman, de Walque and Svensson (2013), who report both the short and the medium term impact of an intervention in Uganda, and the short term impact of another intervention in the same place. In these cases, we only run meta-analysis for short term effects.
All effect sizes were computed as continuous outcomes, excepting those from Pandey et al. (2007), which were computed as binary outcomes.
1.16 CORRUPTION OUTCOMES
We identified few studies assessing the effect of CMIs on corruption outcomes, both using forensic estimates (two studies, two interventions) and perception measures (three studies, four interventions). This limits our ability to extrapolate these results. In the case of service delivery, we differentiated access from quality.
1.16.1 Forensic economic estimates
We looked for different measures of corruption in the papers considered, with the aim of extracting measures based on the application of economics to the detection and quantification of behavior (Zitzewitz, 2012), in this case, corruption. With this purpose, we extracted all measures that we could identify for each intervention. Table 7 lists the measures reported in each case.34 We identified two studies reporting forensic measures of corruption (Olken, 2007 and Reinikka and Svensson, 2011). Olken (2007) evaluates the impact of increasing citizen participation in social audits in Indonesia on corruption, with two different treatment arms testing different variations of social audits. Villagers were invited to participate in social audits (”accountability meetings”) in both treatment arms, but in one group the invitation was accompanied by an anonymous comment form, which could be submitted in a sealed box. The results of this exercise were summarised in the accountability
34 In both cases, we changed the sign of the effect size so it can be interpreted properly (that is, a positive effect size means that corruption has been reduced).

55 The Campbell Collaboration | www.campbellcollaboration.org
meetings.35 The study reports a forensic measure of corruption, which is the percentage of missing funds in roads and ancillary projects. The effect of social audits only was SMD 0.082, 95% CI [-0.10, 0.26] and the effect of social audits with anonymous comment form was SMD 0.08, 95% CI [-0.10, 0.25]. The combined effect for both treatment arms was SMD 0.08, 95% [-0.08 - 0.24].36
Reinikka and Svensson (2011) evaluate the effect of systematic publication of monthly financial transfers to schools in Uganda. They found that a school close to a newspaper outlet suffers less from the capture of funds as compared to a school away from a newspaper outlet (Reinikka and Svensson, 2011).37 The SMD shows that schools where the intervention took place had 22 per cent less corruption than the others.
Table 7: Forensic economic estimates of corruption outcomes
Study Variable definition CMI Type Effect Size 95% Confidence
Interval
ES Type
Olken (2007) -
Invitations
Percentage of missing
funds as log reported
value - log actual value
(major items in roads
and ancillary projects)
Social Audit 0.08 -0.10 0.26 SMD
Olken (2007) -
Invitations +
comments
Percentage of missing
funds as log reported
value - log actual value
(major items in roads
and ancillary projects)
Social Audit 0.08 -0.10 0.25 SMD
Olken (2007) - All interventions 0.08 -0.08 0.24 SMD
Reinikka and
Svensson (2011)
Share of funding
reaching school
IC 0.22 0.05 0.40 SMD
Meta-analysis 0.15 0.01 0.29 SMD
35 The study also evaluates the effect of external audits, which did reduced corruption, but we did not include it in the meta-analysis because it does not fall into any of our four intervention categories.
36 This finding is consistent with those reported by the author, who argues that ‘increasing grassroots participation in monitoring had little average impact (Olken, 2007).
37 Finally, we did not include Banerjee et al. (2010) as it is not a measure of corruption they use, but rather they look at whether the treatments to increase community monitoring generated additional nonteaching resources for the schools. They found that none of the interventions have any effect.

56 The Campbell Collaboration | www.campbellcollaboration.org
Figure 5: Forest plot for forensic economic estimates of corruption outcomes
The meta-analysis suggests that the overall effect of these interventions is positive, improving corruption outcomes in 15 per cent of cases, as is shown in Figure 5. Since Olken (2007) finds no statistically significant effects, this result is probably driven by Reinikka and Svensson (2011), who did find a positive and statistically significant effect.
1.16.2 Perception measures
Perception measures of corruption are more commonly available than forensic measures of corruption. While a less objective measure, it is difficult to detect and measure corruption objectively and because of that we included these more subjective measures.
Table 8 lists the outcome measures reported in the three studies (four interventions) that we have included in this category. We were able to compute RD for the first two studies and SMD for the third one, so we analysed them separately.
Table 8: Perception measures of corruption outcomes
Study Variable definition CMI Type Effect Size 95% Confidence
Interval
ES Type
Molina (2013b) Adequacy in the
Administration of Resources
Social
Audit
0.03 -0.08 0.15 RD
Pandey et al. (2007) Percentage of household
reporting that development
work has been performed in
the village
IC 0.09 0.03 0.15 RD
Meta-analysis 0.08 0.02 0.13 RD
NOTE: Weights are from random effects analysis
Overall (I-squared = 28.5%, p = 0.237)
ID
Olken (2007) - All interventions
Reinikka and Svensson (2011)
Study
0.15 (0.01, 0.29)
SMD (95% CI)
0.08 (-0.08, 0.24)
0.22 (0.05, 0.40)
0.15 (0.01, 0.29)
SMD (95% CI)
0.08 (-0.08, 0.24)
0.22 (0.05, 0.40)
0-.1 0 .25 .5

57 The Campbell Collaboration | www.campbellcollaboration.org
Afridi and Iversen
(2013) - Second audit
Total number of irregularities
(reversed sign)
Social
Audit
-0.22 -0.39 -0.05 SMD
Afridi and Iversen
(2013) - Third audit
Total number of irregularities
(reversed sign)
Social
Audit
-0.23 -0.43 -0.04 SMD
Afridi and Iversen (2013) - All interventions -0.23 -0.38 -0.07 SMD
We identified two studies assessing the effect of CMI on corruption perception measures for which comparable effect size were available. Molina (2013b) found evidence that a social audit improved the perception of the administration of resources in Colombia, while Pandey et al. (2007) suggest that an information campaign carried out in India increased the probability of households reporting that development work took place in the villages, which can be interpreted as a reduction in corruption. The overall effect is RD 0.08, 95% CI [0.02, 0.13], as can be seen from the forest plot presented in Figure 6. The confidence intervals are overlapping and the test of homogeneity does not suggest between study variability. Both studies report a reduction in the perception of corruption among beneficiary households.
Figure 6: Forest plot for corruption outcomes – Perception measures. Risk Differences
Afridi and Iversen (2013) assess the effect of social audits in India. They estimate the effect on reported irregularities in Gram Panchayats with one audit as compared to those with two and three audits respectively. The effect after two audits was SMD -0.22, 95% CI [-0.39, -0.05] and after three audits SMD -0.23, 95% CI [-0.43, -0.04]. The overall average effect across both groups was SMD -0.23 [-0.38 - 0.07], suggesting a worsening in corruption outcomes of 23 per cent in Gram Panchayats after these interventions, and a stronger effect with two or more social audits, as compared to those with one audit only. The authors explain that “maladministration and corruption could be underreported in initial audit rounds when beneficiaries may be more sceptical of and have less confidence in the integrity of the audit process. Alternatively, beneficiaries may, initially, be less aware of their MGNREGA
NOTE: Weights are from random effects analysis
Overall (I-squared = 0.0%, p = 0.364)
Molina (2013b)
ID
Pandey et al. (2007)
Study
0.08 (0.02, 0.13)
0.03 (-0.08, 0.15)
RD (95% CI)
0.09 (0.03, 0.15)
0.08 (0.02, 0.13)
0.03 (-0.08, 0.15)
RD (95% CI)
0.09 (0.03, 0.15)
0-1 -.5 0 .5 1

58 The Campbell Collaboration | www.campbellcollaboration.org
entitlements. In both instances we would expect the number of complaints to surge even if the quality of programme delivery remained the same. Similarly, if the quality of social audits improves through audit team learning, which is plausible, but not a given (…), the growing sophistication of audit teams should increase the number of reported harder to detect irregularities and the number of such complaints filed by the audit team” (Afridi and Iversen, 2013).
1.17 SERVICE DELIVERY OUTCOMES
In the case of service delivery, we differentiated access from quality. We also perform separate analysis by sector and by outcome.
1.17.1 Access to services
In this section we begin with health services and present the results for utilization, immunization and other measures of access, followed by results for enrolment and dropout rates in the education sector.
Health
We identified two studies that assessed at the impact of CMIs on utilization. Björkman and Svensson (2009) evaluate the same intervention, a combination of a scorecard with an information campaign both in the short and in the medium term,38 using the same group of 50 facilities/communities that were randomly assigned to treatment and control group.
In addition, Björkman, de Walque and Svensson (2013) assess a new intervention, an information campaign with new treatment and control groups in which 25 new facilities were randomly assigned to a treatment group (13 units) and control group (12 units). This intervention differs from the previous one since it does not include a scorecard with relevant information about the health service provision.
In these studies, authors report an ‘average standardised treatment effect’ following Kling et al. (2004)’s methodology, that can be combined into one meta-analysis given their homogeneity and given that they are comparable as they all imply better access to health services. Table 9 presents the effect size for each intervention regarding utilization of health services.39
38 Actually, the medium term impact of the first intervention is assed in Björkman, de Walque and Svensson (2013). However, to avoid confusion, we designate the latter as the main reference for the second intervention and Björkman and Svensson (2009) for the first intervention.
39 We were not able to compute neither SMD nor RR for these outcomes due to lack of information.

59 The Campbell Collaboration | www.campbellcollaboration.org
Table 9: Utilisation Outcomes
Study Variable definition CMI Type Effect Size 95% Confidence
Interval
ES Type
Björkman and
Svensson
(2009) - Short
Term
Utilization/coverage (pooled from
average number of patients visiting
the facility per month for out-patient
care, average number of deliveries
at the facility per month, share of
visits to the project facility of all
health visits, averaged over
catchment area and share of visits
to traditional healers, averaged over
catchment area).
Scorecard
+ IC
2.13 0.79 3.47 ASE
Björkman, de
Walque and
Svensson
(2013) - Short
Term
Utilization/coverage (idem before) IC 0.04 -0.41 0.49 ASE
Meta-analysis 0.99 -1.05 3.02 ASE
Björkman and
Svensson
(2009) -
Medium Term
Utilization/coverage (idem before) Scorecard
+ IC
0.34 0.12 0.55 ASE
Looking at the short run, both interventions show an increase in the access to health services, although for the second one the result is statistically no significant. This suggests that effects are stronger when the information campaign is coupled with a scorecard, which is consistent with the authors’ findings, who hint that without information, the process of stimulating participation and engagement had little impact on health workers’ performance or the quality of health care (Björkman, de Walque and Svensson, 2013). The overall effect is positive but no statistically significant, and the I-squared suggests a large amount of between study variability (I² = 88.0%, p=0.004).
Looking at the medium term, the information campaign combined with the scorecard has a positive and statistically significant effect, improving the access to services.
Regarding immunization outcomes, Table 10 reports the short run effects found by Björkman, de Walque and Svensson (2013) and Pandey et al. (2007). It also reports the medium term effects for the intervention assessed in Björkman and Svensson (2009) but it is not incorporated into meta-analysis given the different time horizons.

60 The Campbell Collaboration | www.campbellcollaboration.org
Table 10: Immunisation outcomes
Study Variable definition CMI Type Effect Size 95% Confidence
Interval
ES Type
Björkman, de
Walque and
Svensson
(2013)
immunization (pooled from
newborn, children less than 1-year,
1-year old, 2-year old 3-year old and
4-year old, whether the child has
received at least one dose of
measles, DPT, BCG, and Polio)
IC 1.00 -0.63 2.63 RR
Pandey et al.
(2007)
Vaccinations received by infants IC 1.57 1.40 1.75 RR
Meta-analysis 1.56 1.39 1.73 RR
Björkman and
Svensson
(2009) -
Medium Term
immunization (idem Björkman, de
Walque and Svensson, 2013)
IC 1.04 -0.52 2.61 RR
Björkman, de Walque and Svensson (2013) assess the impact of the CMI on immunization for different age groups, while Pandey et al. (2007) compute the percentage of households where infants have received vaccinations. Overall effect is RR 1.56, 95% CI [1.39, 1.73], implying that the effect of the CMI was positive and improved access to services by 56 per cent as can be seen in Figure 7.

61 The Campbell Collaboration | www.campbellcollaboration.org
Figure 7: Forest plots for immunisation
The medium term impact of the intervention reported by Björkman and Svensson (2009) is positive but statistically not significant40.
Pandey et al. (2007) also report on different measures of access to health services, specifically the percentage of households getting health services such as visits by nurse midwives, prenatal examinations, tetanus vaccinations, and prenatal supplements received by pregnant women. We computed risk ratios for these outcomes, and the results are reported in Table 11. All risk ratios are above unity, with an overall effect RR 1.43, 95% CI [1.29, 1.58] implying that the intervention improved access to services in 43 per cent.
Table 11: Other access to service outcomes
Study Variable definition CMI Type Effect Size 95% Confidence
Interval
ES Type
Pandey et
al. (2007)
Visits by nurse midwife IC 1.03 0.94 1.14 RR
Prenatal examinations 1.63 1.45 1.83 RR
Tetanus vaccinations 1.57 1.39 1.77 RR
40 The short term impact of this intervention is also not statistically significant, but it is not reported in the table since we were not able to compute RR.
NOTE: Weights are from random effects analysis
Overall (I-squared = 0.0%, p = 0.497)
and Svensson (2013)
Study
Pandey et al. (2007)
Björkman, de Walque
ID
1.56 (1.39, 1.73)
1.57 (1.40, 1.75)
1.00 (-0.63, 2.63)
RR (95% CI)
1.56 (1.39, 1.73)
1.57 (1.40, 1.75)
1.00 (-0.63, 2.63)
RR (95% CI)
1-1 -.5 0 .5 1 2 3

62 The Campbell Collaboration | www.campbellcollaboration.org
Prenatal supplements received by pregnant
women
1.45 1.29 1.64 RR
Vaccinations received by infants 1.57 1.40 1.75 RR
Meta-analysis 1.43 1.29 1.58 RR
Education
We identified four studies evaluating effects on enrolment in six different treatment arms. Table 12 presents the effect sizes from all treatment arms. Before combining the studies into a meta-analysis, we created synthetic effect sizes for the study with multiple treatment arms (Banerjee et al., 2010) to avoid combining effects based on dependent samples. Figure 8 presents the forest plot for the meta-analysis of enrolment rates. The overall average effect of CMI on enrolment is SMD 0.09, 95% CI [-0.03, 0.21]. However, it can be noted that this result is driven by the inclusion of one study for which the SMD is substantially higher than the others (Andrabi, Das and Khwaja, 2013). Also, the I-squared suggests a large amount of between study variability (I² = 73.6%, p=0.010). To address this issue, we performed another meta-analysis excluding this study. Figure 9 presents the results. When excluding this study, the overall effect is 0.05, 95% CI [-0.03, 0.13].
Table 12: Enrolments outcomes
Study Variable definition CMI Type Effect Size 95% Confidence Interval
ES Type
Andrabi, Das and Khwaja
(2013)
Enrolment Scorecard 0.58 0.17 0.99 SMD
Banerjee et al. (2010) -
Mobilization
Enrolment IC 0.059 -0.138 0.257 SMD
Banerjee et al. (2010) -
Mobilization + information
Enrolment IC 0.05 -0.14 0.25 SMD
Banerjee et al. (2010) -
Mobilization + information
+ "Read India"
Enrolment IC -0.008 -0.199 0.183 SMD
Banerjee et al. (2010) - All interventions 0.04 -0.13 0.20 SMD
Gertler et al. (2008) Enrolment Scorecard 0.003 -0.048 0.054 SMD
Reinikka and Svensson
(2011)
Enrolment IC 0.12 0.02 0.22 SMD
Meta-analysis 0.09 -0.03 0.21 SMD

63 The Campbell Collaboration | www.campbellcollaboration.org
Figure 8: Forest plot for Enrolment outcomes
Figure 9: Forest plot for Enrolment outcomes – Outliers excluded
NOTE: Weights are from random effects analysis
Overall (I-squared = 73.6%, p = 0.010)
ID
and Khwaja (2013)Andrabi, Das
Svensson (2011)
Banerjee et al. (2010)
Reinikka and
- All interventions
Gertler et al. (2008)
Study
0.09 (-0.03, 0.21)
SMD (95% CI)
0.58 (0.17, 0.99)
0.04 (-0.13, 0.20)
0.12 (0.02, 0.22)
0.00 (-0.05, 0.05)
0.09 (-0.03, 0.21)
SMD (95% CI)
0.58 (0.17, 0.99)
0.04 (-0.13, 0.20)
0.12 (0.02, 0.22)
0.00 (-0.05, 0.05)
0-.2 0 .25 .5 1
NOTE: Weights are from random effects analysis
Overall (I-squared = 54.2%, p = 0.113)
- All interventions
ID
Svensson (2011)
Study
Banerjee et al. (2010)
Reinikka and
Gertler et al. (2008)
0.05 (-0.03, 0.13)
SMD (95% CI)
0.04 (-0.13, 0.20)
0.12 (0.02, 0.22)
0.00 (-0.05, 0.05)
0.05 (-0.03, 0.13)
SMD (95% CI)
0.04 (-0.13, 0.20)
0.12 (0.02, 0.22)
0.00 (-0.05, 0.05)
0-.3 -.2 0 .1 .2 .3

64 The Campbell Collaboration | www.campbellcollaboration.org
We also performed sensitivity analysis. The results are shown in Figure 10. When considering only Scorecards (Gertler et al., 2008), the overall effect is SMD 0.003, 95% CI [-0.05, 0.05], positive but not statistically significant. On the other hand, information campaigns show an overall effect SMD 0.10, 95% CI [0.01, 0.18], suggesting that these interventions have increased enrolment rates in 10 per cent.
Figure 10: Forest plot for Enrolment outcomes – Sensitivity analysis – Outliers excluded
We also identified four studies that measure dropout at schools in seven treatment arms. Table 13 presents the results.
Table 13: Dropout outcomes
Study Variable definition CMI Type Effect Size 95% Confidence Interval
ES Type
Andrabi, Das and
Khwaja (2013)
Dropout rate IC 0.220 -0.159 0.600 SMD
Banerjee et al.
(2010) - Mobilization
Dropout rate IC 0.028 -0.006 0.063 SMD
Banerjee et al.
(2010) - Mobilization
+ information
Dropout rate IC 0.02 -0.01 0.06 SMD
NOTE: Weights are from random effects analysis
.
.
Overall (I-squared = 54.2%, p = 0.113)
Scorecard
Gertler et al. (2008)
Banerjee et al. (2010) - All interventions
Study
Reinikka and Svensson (2011)
ID
Subtotal (I-squared = .%, p = .)
Subtotal (I-squared = 0.0%, p = 0.373)
Information campaign
0.05 (-0.03, 0.13)
0.00 (-0.05, 0.05)
0.04 (-0.13, 0.20)
0.12 (0.02, 0.22)
SMD (95% CI)
0.00 (-0.05, 0.05)
0.10 (0.01, 0.18)
0.05 (-0.03, 0.13)
0.00 (-0.05, 0.05)
0.04 (-0.13, 0.20)
0.12 (0.02, 0.22)
SMD (95% CI)
0.00 (-0.05, 0.05)
0.10 (0.01, 0.18)
0-.3 -.2 0 .1 .2 .3

65 The Campbell Collaboration | www.campbellcollaboration.org
Banerjee et al.
(2010) - Mobilization
+ information +
"Read India"
Dropout rate IC 0.046 0.011 0.081 SMD
Banerjee et al. (2010) - All interventions 0.032 0.003 0.061 SMD
Gertler et al. (2008) Dropout rate IC -0.09 -0.14 -0.04 SMD
Pradhan et al. (2014)
- Training
Dropout rate IC 0.12 -0.08 0.31 SMD
Pradhan et al. (2014)
- Linkage
Dropout rate IC -0.03 -0.23 0.16 SMD
Pradhan et al. (2014) - All interventions 0.041 -0.124 0.207 SMD
Meta-analysis 0.00 -0.10 0.10 SMD
For some interventions, the results suggest an increase in children out of school in the villages receiving CMI compared to those that did not receive the programme. Considering the study of Banerjee et al. (2010), the effect range from SMD 0.02, 95% CI [-0.01, 0.06] for the treatment arm with mobilization and information, to SMD 0.046, 95% [0.011, 0.081] for the treatment arm with mobilization and information in addition to “Read India” – reading camps held by trained volunteers, with a combined effect of SMD 0.032, 95% CI [0.003, 0.06]. The authors argue that this result is due to “children dropping out of private or NGO schools (results omitted to save space). It may be that parents consider the reading classes to be an adequate alternative to a private school”. The CMI also resulted in an increase in dropout rates in the cases of Andrabi, Das and Khwaja (2013) and for the Training intervention in Pradhan et al. (2014). On the other hand, the Linkage intervention in Pradhan et al. (2014) and the study of Gertler et al. (2008) find a reduction in dropout rates after interventions.
Before performing the meta-analysis, we calculated a synthetic effect size for the two treatment arms included in Pradhan et al.’s (2014) study from Indonesia to avoid issues with dependent effect sizes in the meta-analysis. We did the same with the three interventions reported by Banerjee et al. (2010).
Taking into account all the interventions, the overall effect of these CMIs is SMD 0.00, 95% CI [-0.10, 0.10], suggesting that the effect is not significant. However, the I-squared in Figure 11 suggests a large amount of between study variability (I² = 83.1%, p=0.000).

66 The Campbell Collaboration | www.campbellcollaboration.org
Figure 11: Forest plot for Dropout outcomes
When we exclude the study of Andrabi, Das and Khwaja (2013), which reports an effect considerably larger than the others, the overall effect of CMIs is SMD -0.01, 95% CI [-0.11, 0.09], suggesting a 1 per cent reduction in dropout rates in those communities where CMI have taken place, although the effect is still not significant and the homogeneity test still reveals a large amount of between study variability (I² = 87.9%, p=0.000).
NOTE: Weights are from random effects analysis
Overall (I-squared = 83.1%, p = 0.000)- All interventions
- All interventionsGertler et al. (2008)
Pradhan et al. (2014)
Andrabi, Dasand Khwaja (2013)Banerjee et al. (2010)
StudyID
-0.00 (-0.10, 0.10)
-0.09 (-0.14, -0.04)
0.04 (-0.12, 0.21)
0.22 (-0.16, 0.60)
0.03 (0.00, 0.06)
SMD (95% CI)
-0.00 (-0.10, 0.10)
-0.09 (-0.14, -0.04)
0.04 (-0.12, 0.21)
0.22 (-0.16, 0.60)
0.03 (0.00, 0.06)
SMD (95% CI)
0-.2 0 .25 .5 1

67 The Campbell Collaboration | www.campbellcollaboration.org
Figure 12: Forest plot for Dropout outcomes – Outliers excluded
1.17.2 Quality of services
In this section, we present the analysis of effects on quality of services by sector and outcome, starting with health, and followed by education.
Health
For health related outcomes, we consider measures of child death and anthropometric outcomes.
We identified two studies with measurements of child mortality, Björkmann and Svensson (2009) and Björkman, de Walque and Svensson (2013). Table 14 shows that the short term evaluation for the two interventions had an overall effect of RR 0.76, 95% CI [0.42, 1.11], suggesting that child death had been reduced by 24 per cent after CMIs, however the effect is not statistically significant. Similar conclusions apply for the medium term effect of the information campaign combined with a scorecard, were the effect is a reduction in 21 per cent in mortality.
NOTE: Weights are from random effects analysis
Overall (I-squared = 87.9%, p = 0.000)
Gertler et al. (2008)
- All interventions
Pradhan et al. (2014)
ID
Banerjee et al. (2010)
- All interventions
Study
-0.01 (-0.11, 0.09)
-0.09 (-0.14, -0.04)
0.04 (-0.12, 0.21)
SMD (95% CI)
0.03 (0.00, 0.06)
-0.01 (-0.11, 0.09)
-0.09 (-0.14, -0.04)
0.04 (-0.12, 0.21)
SMD (95% CI)
0.03 (0.00, 0.06)
0-.2 -.1 0 .1 .2

68 The Campbell Collaboration | www.campbellcollaboration.org
Table 14: Child death
Study Variable definition CMI Type Effect Size 95% Confidence Interval
ES Type
Björkman and Svensson
(2009) - Short Term
child death (under five
mortality rate)
Scorecard
+ IC
0.65 0.42 1.02 RR
Björkman, de Walque and
Svensson (2013) - Short
Term
child death (infant
mortality rate)
IC 1.05 0.61 1.81 RR
Meta-analysis 0.76 0.42 1.11 RR
Björkman and Svensson
(2009) - Medium Term
child death (under five
mortality rate)
Scorecard
+ IC
0.79 0.57 1.08 RR
We can also interpret an improvement in anthropometric measures as an improvement in the quality of health services provided. Table 15 reports the impact of the same two CMIs on weight-for-age scores.
Table 15: Weight for age
Study Variable definition CMI Type Effect Size 95% Confidence Interval
ES Type
Björkman and Svensson
(2009) - Short Term
Weight for age (children
0-18 months)
Scorecard
+ IC
1.20 1.00 1.43 RR
Björkman, de Walque and
Svensson (2013) - Short
Term
Weight for age (children
0-11 months)
IC 1.22 0.92 1.60 RR
Meta-analysis 1.20 1.02 1.38 RR
Björkman and Svensson
(2009) - Medium Term
Weight for age (children
0-18 months)
Scorecard
+ IC
1.29 1.01 1.64 RR
In the short term, CMIs have increased weight for age scores by 20 per cent, suggesting that quality of health services has improved. The positive impact seems to be stronger in the medium term, resulting in a 29 per cent improvement. Homogeneity test suggests no variability between studies (I² = 0.01%, p=0.928).
In addition to these measures of health services’ quality, these studies also report on another measure, namely average waiting time in medical facilities. The effects range from RR 0.91

69 The Campbell Collaboration | www.campbellcollaboration.org
95% CI [0.81, 1.01], to RR 1.10 95% CI [0.81, 1.15], and are displayed in Table 16.41 Meta-analysis for the short term interventions suggests a negligible effect –reducing waiting time in 1 per cent, and this is not significant. However, there is a large between study heterogeneity that might be driven the results (I² = 70.8%, p=0.064).
Table 16: Average waiting time to get the service outcome variables
Study Variable definition CMI Type Effect Size 95% Confidence Interval
ES Type
Björkman and
Svensson (2009) -
Short Term
Waiting time in medical
services*
Scorecard +
IC
0.91 0.81 1.01 RR
Björkman, de Walque
and Svensson (2013)
- Short Term
Waiting time in medical
services*
IC 1.10 0.81 1.15 RR
Meta-analysis 0.99 0.80 1.17 RR
Björkman and
Svensson (2009) -
Medium Term
Waiting time in medical
services*
Scorecard +
IC
1.06 0.95 1.19 RR
* Difference between the time the user left the facility and the time the user arrived at the facility,
subtracting the examination time.
Education
We included six studies assessing the effect of CMI on the quality of education as measured by test scores.42 As can be seen from Table 17, three of these studies include multiple treatment arms. We calculated synthetic effect sizes combining the different treatment arms before including these studies in the meta-analysis. The overall average effect of CMI on student outcomes across these six studies is SMD 0.16, 95% CI [0.04, 0.29],43 suggesting that CMIs improved test scores by 16 per cent.
41 It is important to note why we think this is a quality measure and not an access measure. Access is related to getting the service. However, you can get the service and the fact that you had to wait makes it less valuable and of lesser quality.
42 When different test scores where reported (e.g. language and math test scores), we previously pooled them following the procedure explained before.
43 It should be noted that we are excluding some studies for which we were not able to compute standardised effects (Table 11) but which found significant effects of CMIs on our outcomes of interest. For example, Keefer and Khemani (2011) found that the information campaign resulting from communities’ access to radios enhanced literacy tests.

70 The Campbell Collaboration | www.campbellcollaboration.org
Table 17: Test scores
Study Variable definition
CMI Type Effect Size
95% Confidence Interval
ES Type
Andrabi, Das and Khwaja (2013) test score Scorecard 0.510 0.163 0.857 SMD
Banerjee et al. (2010) -
Mobilization
test score IC 0.01 -0.02 0.04 SMD
Banerjee et al. (2010) -
Mobilization + information
test score IC 0.010 -0.018 0.037 SMD
Banerjee et al. (2010) -
Mobilization + information +
"Read India"
test score IC 0.03 0.00 0.05 SMD
Banerjee et al. (2010) - All
interventions
0.02 -0.01 0.04 SMD
Barr et al. (2012) - Standard
scorecard
test score Scorecard 0.03 -0.05 0.11 SMD
Barr et al. (2012) - Participatory
scorecard
test score Scorecard
(Participatory)
0.078 -0.002 0.158 SMD
Barr et al. (2012) - All
interventions
0.056 -0.015 0.127 SMD
Piper and Korda (2010) test score IC 0.63 0.54 0.71 SMD
Pradhan et al. (2014) - Training test score IC -0.02 -0.09 0.04 SMD
Pradhan et al. (2014) - Linkage test score IC 0.07 0.02 0.13 SMD
Pradhan et al. (2014) - All
interventions
0.03 -0.03 0.08 SMD
Reinikka and Svensson (2011) test score IC -0.01 -0.03 0.01
Meta-analysis 0.16 0.04 0.29 SMD
The assessment of homogeneity suggests a large amount of variability between studies. This is further supported by the forest plot in Figure 13. The effect sizes range from SMD -0.01, 95% CI [-0.03, 0.01] in Uganda (Reinikka and Svensson, 2011) to SMD 0.63, 95% CI [0.54, 0.71] in Liberia (Piper and Korda, 2010). The confidence intervals of these two studies do not overlap.

71 The Campbell Collaboration | www.campbellcollaboration.org
Figure 13: Forest plot for Test scores
We tried excluding the possibly outlier papers (Andrabi, Das and Khwaja, 2013 and Piper and Korda, 2010). The results are presented in Figure 14. Overall effect is SMD 0.01, 95% CI [-0.01, 0.03].
Figure 14: Forest plot for Test scores – Outliers excluded
NOTE: Weights are from random effects analysis
Overall (I-squared = 97.8%, p = 0.000)
ID
Piper and Korda (2010)
Svensson (2011)
Study
Reinikka and
and Khwaja (2013)
Barr et al. (2012)
Pradhan et al. (2014)
- All interventions
- All interventions
- All interventions
Andrabi, Das
Banerjee et al. (2010)
0.16 (0.04, 0.29)
SMD (95% CI)
0.63 (0.54, 0.71)
-0.01 (-0.03, 0.01)
0.06 (-0.02, 0.13)
0.03 (-0.03, 0.08)
0.51 (0.16, 0.86)
0.02 (-0.01, 0.04)
0.16 (0.04, 0.29)
SMD (95% CI)
0.63 (0.54, 0.71)
-0.01 (-0.03, 0.01)
0.06 (-0.02, 0.13)
0.03 (-0.03, 0.08)
0.51 (0.16, 0.86)
0.02 (-0.01, 0.04)
0-.2 0 .25 .5 1
NOTE: Weights are from random effects analysis
Overall (I-squared = 44.8%, p = 0.142)
- All interventions
- All interventions
- All interventionsBarr et al. (2012)
Banerjee et al. (2010)
Reinikka and
StudyID
Svensson (2011)
Pradhan et al. (2014)
0.01 (-0.01, 0.03)
0.06 (-0.02, 0.13)
0.02 (-0.01, 0.04)
-0.01 (-0.03, 0.01)
SMD (95% CI)
0.03 (-0.03, 0.08)
0.01 (-0.01, 0.03)
0.06 (-0.02, 0.13)
0.02 (-0.01, 0.04)
-0.01 (-0.03, 0.01)
SMD (95% CI)
0.03 (-0.03, 0.08)
0-.1 0 .1 .2

72 The Campbell Collaboration | www.campbellcollaboration.org
Figure 15 presents sensitivity analysis by CMI type, excluding the possible outliers. Overall effect for information campaigns is SMD 0.004, 95% CI [-0.017, 0.024].
Figure 15: Forest plot for Test scores – Sensitivity analysis - Outliers excluded
NOTE: Weights are from random effects analysis
.
.
Overall (I-squared = 44.8%, p = 0.142)
Subtotal (I-squared = .%, p = .)
Scorecard
Subtotal (I-squared = 36.5%, p = 0.207)
- All interventions
Reinikka and- All interventions
Barr et al. (2012)
ID
Pradhan et al. (2014)
Banerjee et al. (2010)
Information campaign
Svensson (2011)
- All interventions
Study
0.01 (-0.01, 0.03)
0.06 (-0.02, 0.13)
0.00 (-0.02, 0.02)
-0.01 (-0.03, 0.01)
0.06 (-0.02, 0.13)
SMD (95% CI)
0.03 (-0.03, 0.08)
0.02 (-0.01, 0.04)
0.01 (-0.01, 0.03)
0.06 (-0.02, 0.13)
0.00 (-0.02, 0.02)
-0.01 (-0.03, 0.01)
0.06 (-0.02, 0.13)
SMD (95% CI)
0.03 (-0.03, 0.08)
0.02 (-0.01, 0.04)
0-.1 0 .1 .2

73 The Campbell Collaboration | www.campbellcollaboration.org
1.18 STUDIES NOT INCLUDED IN META ANALYSES
We also identified other measures of the quality of services, but we were unable to compute effect sizes for them. In all cases, the reason was that the information required to compute effect sizes was lacking. Table 18 lists the variables for which we were not able to compute effect sizes.
Table 18: Excluded studies
Study Variable definition Available information Missing information
Keefer and Khemani
(2011)
Proportion of children
tested in the village
public school who could
read sentence and
paragraphs (ASER
literacy test)
coefficients and its p-
values, total n
The standard deviation of
the dependent variable
or the standard deviation
of the error term in the
regression
Pandey, Goyal and
Sundararaman (2009)
Percentage of children
who could pass different
learning tests, including
reading and writing
competences and
mathematics abilities
Change in treatment -
change in control, p-
values
Does not provide total
size nor the size of the
control or the
comparison group
1.19 MODERATOR ANALYSIS
In this subsection we had hoped to explore whether our findings differ by intervention characteristics such as design and implementation or the length of exposure to the treatment (review question 3). Unfortunately, the lack of outcome data available from different studies prevented us from undertaking many moderator analyses for the primary outcomes.44 We were only able to perform some sensitivity analysis by type of intervention for some outcomes, namely enrolment rates and test scores, as reported in the previous sections.
We also performed sensitivity analysis by study design (namely, RCT versus Non RCT). Most of them coincide with the previous analysis due to the way we have aggregated outcomes (namely, corruption measures, utilization, immunization, child death, weight for age and
44 To address review question 3, we also tried to identify whether information campaigns with a capacity building component where information on how to monitor providers is disseminated differ from those without it, or whether scorecards or social audits that involve facilitated meetings with providers and politicians have better impacts than those that does not or -for all CMIs- whether citizens act not only as monitors but also as decision makers in the project. For details, please see the “Results of Barriers and Facilitators’.

74 The Campbell Collaboration | www.campbellcollaboration.org
average waiting time to get the service). The other outcomes for which we obtained different results are presented in Table 19.
Table 19: Moderator analysis by study design – Outliers excluded
Sub-group Effect size 95% confidence interval Num. Estimates I-squared Type
Access to service
Enrolment
Study design
RCT 0.055 -0.061 0.171 2 77.1% SMD
(p= 0.037)
Others 0.035 -0.128 0.199 1 n/a SMD
Dropout
Study design
RCT 0.032 0.003 0.061 2 0.0% SMD
(p= 0.913)
Others -0.09 -0.14 -0.04 1 n/a SMD
Quality of service
Test scores
Study design
RCT 0.022 -0.001 0.046 3 0.0% SMD
(p=0.591)
Others -0.01 -0.03 0.01 1 n/a SMD
Note: n/a not applicable
While analysing enrolment rates, neither those studies designed as RCT nor the other studies seem to have found statistically significant effects after CMIs. In the case of dropout, the overall effect of studies designed as a RCT shows an increase in dropout rates, while the other study finds a reduction in it. Finally, when we evaluate the impact of the interventions on test scores, again the overall effects are statistically non-significant, although RCT studies show a positive aggregated effect and the remaining study shows a reduction in this measure. However, the caveat regarding the low amount of studies considered remains relevant and these findings cannot be generalised.

75 The Campbell Collaboration | www.campbellcollaboration.org
We also undertook some moderator analysis by region.45 Again, in many cases, results coincide with the analysis in the previous section (namely, for corruption measures, utilization, child death, weight for age and average waiting time to get the service). Other cases are presented in Table 20.
Table 20: Moderator analysis by study region – Outliers excluded
Sub-group Effect size 95% confidence interval Num. Estimates I-squared Type
Access to service
Immunisation
Region
Africa 0.998 -0.631 2.627 1 n/a RR
Asia 1.565 1.403 1.746 1 n/a RR
Enrolment
Region
Africa 0.122 0.023 0.222 1 n/a SMD
Asia 0.035 -0.128 0.199 1 n/a SMD
Latin America 0.003 -0.048 0.054 1 n/a SMD
Dropout
Region
Asia 0.032 0.003 0.061 2 0.0% SMD
(p= 0.913)
Latin America -0.09 -0.14 -0.04 1 n/a SMD
Quality of service
Test scores
Region
Africa 0.014 -0.046 0.074 2 66.5% SMD
45 The idea behind this exercise is to explore whether results vary according to key contextual factors, such as geographical region or income level.

76 The Campbell Collaboration | www.campbellcollaboration.org
(p=0.084)
Asia 0.02 -0.01 0.04 2 0.0% SMD
(p=0.756)
Note: n/a not applicable
Regarding immunization, the study of Asia finds a positive effect of this outcome, while for Africa the effect is statistically not significant. Looking at enrolment rates, we can distinguish a study carried out in Africa, another one in Asia and the third one in Latin America. While the three of them show a positive impact of CMI, only the first one is statistically significant. In the case of dropout, overall effect of studies from Asian countries shows an increase in dropout rates, while the intervention in Latin America has reduced this outcome. Finally, there is no evidence of a differential impact in test scores of CMIs from Africa or Asia.
1.20 PUBLICATION BIAS
We assess publication bias by reporting funnel graphs and the results of the Egger’s Test, which evaluates the null hypothesis that there is publication bias present. A funnel plot is a scatter plot of treatment effect against a measure of study size. It assumes that the largest studies will be near the average, and small studies will be spread on both sides of the average. Variation from this assumption can indicate publication bias. Egger et al. (1997) proposed a test for asymmetry of the funnel plot. This is a test with the null hypothesis that the intercept from a linear regression of normalised effect estimate (estimate divided by its standard error) against precision (reciprocal of the standard error of the estimate) is equal to zero.
On a first stage, we analyse this issue by outcome and type of effect size, considering those reported in the previous section. In many cases, we had only two observations for each case, so we were not able to perform Egger’s Test. Here we present the results of those outcomes for which we could perform this test, namely enrolment, dropout rates test scores. However, it should be taken into account that the power of this method to detect publication bias will be low with such a small numbers of studies.
For enrolment rates, the p-value of Egger’s Test is 0.160 and the number of studies is 4. The results of the Egger’s Test suggest that there is not publication bias. However, the caveat regarding the low power of the test holds, given the low number of observations. Funnel plot is reported in Figure 16.
Figure 17 reports the funnel plot for dropout rates. In this case, the p-value of Egger’s Test is 0.975 and the number of studies is 4. Again, there is no evidence of publication bias, but the power of the test is low.
Finally, Figure 18 presents the funnel plot for test scores. The p-value of Egger’s Test is 0.156, considering six studies.

77 The Campbell Collaboration | www.campbellcollaboration.org
Figure 16: Funnel plot showing pseudo-95% confidence limits for Enrolment rates
Figure 17: Funnel plot showing pseudo-95% confidence limits for Dropout rates
Figure 18: Funnel plot showing pseudo-95% confidence limits for Test scores
0.0
5.1
.15
.2SE
(ES)
-.4 -.2 0 .2 .4 .6ES
0.0
5.1
.15
.2SE
(ES)
-.4 -.2 0 .2 .4ES
0.0
5.1
.15
.2SE
(ES)
-.4 -.2 0 .2 .4 .6ES

78 The Campbell Collaboration | www.campbellcollaboration.org
In a second stage, we pooled all effect size (reversing the sign when needed, so they all measure positive effects in the same direction) and preformed the same analysis by type of effect size. Figure 19 and Figure 20 present the cases for RR and SMD, respectively.
Figure 19: Funnel plot showing pseudo-95% confidence limits for RR
Figure 20: Funnel plot showing pseudo-95% confidence limits for SMD
In the case of effect sizes calculated as RR (immunization, child death, average waiting time to get the service and weight for age), the p-value of Egger’s Test is 0.007, suggesting some evidence of probable publication bias. For SMD (enrolment, dropout, test scores and forensic economic estimates of corruption), the p-value of Egger’s Test is 0.058, suggesting again some evidence of probable publication bias. However, the low power of these tests prevents us for extracting conclusions with any degree of reliability.
0.5
11.
5SE
(ES)
-1 0 1 2 3 4ES
0.0
5.1
.15
.2SE
(ES)
-.4 -.2 0 .2 .4 .6ES

79 The Campbell Collaboration | www.campbellcollaboration.org
Results of mechanisms synthesis
In this section, we synthesise evidence on the mechanisms through which CMIs may have an effect (or lack thereof) on corruption and service delivery outcomes. Asking why programmes succeed or fail involves identifying causal pathways. Sometimes pathways are explicit and other times finding pathways means looking for implicit assumptions and arguments. There are a range of possible pathways from the CMIs process to improvement in service delivery, and assessing these pathways can assists us in answering how and why interventions work or not.
The theory of change presented in Figure 21 highlights the implicit necessary assumption for the different pathways. It allows us to articulate the expected mechanisms through which the CMIs may have effect, and the underlying set of assumptions involved for each stage of the process. As described above, the synthesis is based on data available in the studies included to address our primary research question, as well as any sibling papers identified for these studies. Because the limited number of studies, which are also not a random sample of CMI programmes, the findings presented here should be considered preliminary and should be further assessed in future studies.

80 The Campbell Collaboration | www.campbellcollaboration.org
Figure 21: Theory of change
Better Outcomes
(8)
Formal Sanctions
Communication Campaign
(1)
Assumptions: -- High social cohesion or low expectation of free-riding on the part of the community. - Participation in social accountability has low opportunity cost. - Expectation that participating in the monitoring process will improve the chances the service/project is conducted more efficiently. - In case these expectations regarding political accountability are low, the campaign changed individual attitudes by convincing citizens of the importance of participation. - There are institutions in place to avoid elite capture of the monitoring process. - Internal monitor and evaluation technology is put in place to organize communities’ activities.
Citizens Decide to Act
Collectively (2)
-Participate in Public Forums
-Participate in Field Visits to assess the service
Assumptions: - Techniques to monitor the service are easy to understand and put in practice. - Techniques to communicate problems with public officials and providers are understood and easy to use. - Political authorities and bureaucrats are accountable and give the importance to this initiative.
Participation in Monitoring
Activities
Assumptions:
- The campaign solves any potential information gap and attention span problems.
Voice
Politicians
(4)
Other Citizens
(5) Assumptions: - High Degree of Social Cohesion between participant and non-participant. - Geographical proximity to non-participants.
Informal Sanctions
Assumptions:
- Providers are accountable to the community and political authorities.
Providers
(6)
Providers and Politicians exert more effort and
reduce corruption
(7)

81 The Campbell Collaboration | www.campbellcollaboration.org
1.21 CITIZENS’ PARTICIPATION IN MONITORING ACTIVITIES
Citizens’ participation is a key component of most CMI interventions, and a potential concern with CMIs is that citizens may fail to participate in monitoring activities (building block 3). In section 1.3 we identified six potential bottlenecks that could prevent citizens from participating in monitoring activities, which in turn reduces the potential impact of the programme. In particular, if community monitoring activities are not carried out, or carried out by only a few citizens, the likelihood they uncover problems and put pressure on the government to provide accountability can be significantly reduced. Several of the included studies (or their sibling papers) provide data on citizens’ participation in monitoring activities. A summary of the potential relevant variables is presented in Appendix H.
Our theory of change provides some potential reasons why participation may fail to materialize. In particular, citizens could have (i) inadequate information on how to monitor the project, (ii) high opportunity cost of participation, (iii) pessimistic beliefs about politicians/providers responsiveness, or (iv) believe that other citizens will decide not to participate. Below we discuss the findings from the included interventions that failed to increase participation on each of these potential explanations.
(i) Inadequate information on how to monitor the project
The question here is whether inadequate information on how to monitor the programme is what is behind the citizen participation failure. This can be expressed as two questions: (a) whether citizens are inadequately informed and (b) whether having the necessary information would increase participation.
Banerjee et al. (2010) study was designed to answer these questions. They begin to answer that question with a previous study on the same intervention. Banerjee et al. (2007) found that parents, teachers and the VEC (equivalent to parent-teacher association) members did not seem to be fully aware of how low the actual level of students’ performance was. At the same time, they did not appear to have given much thought to the role of local committees, and/or to the possibility of local participation in improving outcomes. Many parents did not know that a VEC existed, sometimes even when they were supposed to be members of it. Moreover, the VEC members were unaware of the key roles they had been assigned in the educational system. Public participation in improving education was negligible, and people’s ranking of education on a list of village priorities was low.
We know that citizens were inadequately informed about the VEC programme as well as about the quality of education their children received. The question now is whether proving that information would increase participation. To answer this question Banerjee et al. (2010) test three different interventions. In the first one, Pratham field staff was sent to villages to inform and mobilize parent on how to monitor schools using the VEC. In the second one, they explained how to monitor schools as well as why it was important. To make this salient, Pratham staff taught the community how to conduct a simple test to evaluate student performance and compile a report card. The results of the report card (which revealed that the quality of education was very low) were used highlight the importance of monitoring schools and student progress. The third intervention requested randomly chosen communities to come up with volunteers to be trained by Pratham staff on techniques to teach children how to read to then run after-class remedial reading classes for them.
The results show that the first two interventions had no impact on increasing citizen participation monitoring schools but the third one did managed to get volunteers and improve children reading levels in these villages. The question then is how to interpret these results. One interpretation is that the information was not narrow enough in intervention 1

82 The Campbell Collaboration | www.campbellcollaboration.org
and 2 and as a result, participation did not increase (Banerjee and Duflo, 2011). Another interpretation is that citizens preferred to circumvent the state and the existing institutions for school monitoring (Banerjee et al. 2010). That interpretation would suggest citizens having pessimistic beliefs as to whether their participation in the VEC system would improve outcomes as the reason why the programme failed to increase participation.
Banerjee et al. (2010) was not the only one to attempt to answer this question, though it had the best identification strategy. In Molina (2013b), the author found that in some communities, citizens were not aware of the existence of the project they were supposed to monitor. In other communities citizens knew about the project, but they did not have access to information on how to monitor it. This prevented citizens from those communities from taking an active role in social audit community forums and community monitoring activities in general. While the author found a lack of information to be an obstacle, this was neither the only nor most important issue identified in this study, as discussed below.
(ii) High opportunity cost of participation
It is difficult to test this hypothesis as it is not easy to measure individual opportunity costs and the included papers only report indirect evidence on this. Molina (2013b) assesses under what conditions citizens decided to monitor the project in the context of “Auditorias Visibles”, a social audit in Colombia. The author finds that participants are not statistically different from non-participants in employment status, income level or whether they work at home or not. From this he infers that opportunity cost cannot explain the variation in citizens’ participation in monitoring the project.
Andrabi, Das and Khwaja (2013) find that better educated parents participate more actively in monitoring activities, which could indicate that the opportunity cost of participation is lower for them.
(iii) Pessimistic beliefs about politicians/providers responsiveness
Citizens may refuse to take advantage of the opportunity to monitor the government and service providers if they believe that the chances of politicians and providers being responsive are low. Molina (2013b) found that perceiving oneself as being able to influence local government is crucial for deciding whether to spend time in community monitoring activities.
Results coming from and evaluation in India (Banerjee et al., 2010) provide suggestive evidence on the importance of citizens’ perceptions of providers’ responsiveness on social accountability interventions.46 Only the intervention that did not involve government action, but rather trained volunteers to help children learn to read, had a significant impact on citizens’ participation and a positive effect on children's reading skills (3-8%).
46 There is additional qualitative and quantitative evidence that could be understood using these insights. Gaventa and Barrett (2012) perform a meta-case study of 100 interventions aim to increase citizen engagement in service delivery. For the 828 outcomes from the 100 reviewed case studies, only 153 came from interventions where the final goal was to strengthen the responsiveness and accountability of the state to provide services. Results indicate that 55 per cent of those 153 outcomes were positive and 45 per cent were negative. Negative results were associated with failure of citizens to participate, due in part to fear of backlash against those who speak out and a sense of tokenism in the participation mechanism.
There are also other quantitative papers that could be interpreted using this lens. For example, Keefer and Khemani (2011), as discussed above.

83 The Campbell Collaboration | www.campbellcollaboration.org
In the case of the social audit programme in India Afridi and Iversen (2013) suggest cases of maladministration and corruption may have been underreported in the initial audit rounds because of citizens pessimistic beliefs about the integrity of the audit process. They suggest this may be one possible explanation for the lack of a decrease in the aggregate number of complaints. This is supported by findings from Singh and Vutukuru (2009), analysing the initial stages of the same intervention. They describe a situation with little political enthusiasm during the pilot phase of the social audits, but with subsequent high level political support generating huge increases in the turnouts at the local social audit meetings.
Interactions between citizens and providers of the services could change citizens’ perceptions of low accountability. Evidence in Barr et al. (2012) assess whether facilitated contacts with providers had an effect on citizen participation in CMIs. The authors argue that the impacts of the participatory treatment exceed those of the standard treatment primarily because of increased willingness to contribute to public goods, rather than differences in the information content of the scorecards. They find that the willingness to contribute to public goods is statistically higher for participants of the participatory treatment. However, the identification strategy prevents the authors from discriminating between two potential theories. The participatory treatment could influence outcomes in the school (test scores) and in the lab (voluntary contribution games) either by affecting preferences or by affecting beliefs about the willingness of providers to contribute to public goods.
Woodhouse (2005) analyses the beginning of the KDP programme studied later in Olken (2007). The author finds that when villagers possessed information about their rights and, crucially, when the potential perpetrators of corruption knew that villagers had this information, it raised the perceived cost of corrupt behaviour and reduced the cost of fighting it.
These pessimistic beliefs could also be the cause of elite capture, as the indirect evidence from Olken (2007) suggest. The intervention showed that issuing anonymous comment forms to villagers reduced missing expenditures only if the comment forms were distributed via schools in the village, completely bypassing village officials who may have been involved in the project. Olken (2006) find that those closer to the project, either by distance or participation, are less likely to report corruption in the project, probably reflecting the fact that those who benefit from the project do not want to be on record stating the existence of corruption as they might be concerned that this would create problems for the project that might result in it not being completed.
(iv) Beliefs that other citizens would not participate
Björkman and Svensson (2010), a follow up to Björkman and Svensson (2009), suggest that citizen participation may be threatened by differences within the community. They find that ‘income inequality, and particularly ethnic fractionalization, adversely impact collective action for improved service provision’. This means that in communities where there was higher income inequality, and ethnic fractionalization the programme failed to increase participation. However, the available data prevent the authors from being able to answer whether this failure in collective action is due to lack of trust among community members, lack of trust of the community in the service providers and representatives, or both. This is important as if the lack of trust is with representatives we would place this as evidence of alternative (iii).
Molina (2013b) found no relation between measures of fractionalization indexes, a measure of trust in fellow neighbours and the variation in average time spent in monitoring activities. However, the low number of communities in the study limits the information we can extract from this finding.

84 The Campbell Collaboration | www.campbellcollaboration.org
1.22 POLITICIANS’ AND PROVIDERS’ ACCOUNTABILITY
In the case of providers and politicians, they need to gain popularity, increase/maintaine salary and/or social recognition for their responsiveness. If these assumptions are not met, the underlying programme theory of the social accountability information breaks down and this may prevent them from having an impact on service delivery. In particular, whether or not they hold true can affect citizens’ decision on whether to monitor government activity and the governments’ willingness to facilitate citizen engagement and become more accountable. The literature cites many reasons why politicians and providers may not be accountable to their citizens (as we described in the building blocks 4 and 6 of our theory of change). In section 1.3 we identified three potential bottlenecks, the existence of unresponsive politicians, clientelism and unresponsive providers.
We looked for measures of providers’ or politicians’ performance in the studies included in the meta-analyses. The results are presented in Appendix I. Although we refer to ‘Providers’, depending on the service under analysis, it may also involve politicians. We do not discuss findings separately for these two groups because of the low number of studies measuring politicians’ performance.
According to our theory of change, the programme may fail to generate positive treatment effects if there is not enough demand for change (i.e. participation is low), or even in the presence of this demand politicians can for some reason disregarded it (i.e. the politicians does not need their support, clientelism, among others). Even when there is demand and politicians are committed to improve service delivery, the providers might not be responsive.
From the included studies we find that in the cases where citizens decided not to monitor service provision, providers responded by not changing their behaviour. This is consistent with our theory of change. We would not expect providers to change behaviour when the citizens do not participate in monitoring activities. However, in this subsection we are interested in understanding why demand was lacking. Is it because (a) politicians would be unresponsive to demand, (b) providers would be unresponsive to increased pressure from politicians, or (c) citizens believe politicians/providers would be unresponsive. It is important to note the difference between (a) and (b) with (c). While in (a) and (b) politicians and providers respectively are not responsive, in alternative (c) they are responsive but citizens believe they are not. As a result they do not participate in monitoring and politicians and providers act as if there is no demand.
Molina (2013) provides suggestive evidence that when the community increases its demands by increasing citizen participation in the social audit, the politicians respond by performing better, as evaluated by the citizens. This would suggest politicians are actually responsive in this case.
We discussed the results from Banerjee et al. (2010) above. The data does not allow us to infer why citizens decided not to participate in the program, neither what would have happened if citizens actually participated. On the other hand, Keefer and Khemani (2011) found that better learning outcomes were not due to better performance by providers, but rather changes in households’ behaviour:
‘…government inputs into village schools, and household knowledge of government policies related to education, are all unrelated to village access to community radio. Instead, greater access to community radio leads to significantly greater private investment by households in the education of their children. This shows a case where monitoring did not increase, neither provider effort but quality of service provision improved. This is because among households with children, those that listen to more community radio because of their

85 The Campbell Collaboration | www.campbellcollaboration.org
access to a larger number of community radio stations, are more likely to buy books and to make informal or private tuition payments to schools’.47
This suggests that understanding why citizens decide to circumvent the existing institutions to monitor service providers and instead use the private sector to invest in their children’s human capital is an underexploited area of research.
So far we have used evidence coming from interventions that failed. However, we can also extract information from studies that had positive outcomes. Björkman and Svensson (2009) found the scorecard intervention improved the type of equipment used to treat patients, reduced the average waiting time and the absence rate of staff at the nurseries, and also improved the management of the nurseries, that is, cleaner floors and rooms, staff politeness, among others. Furthermore, using data collected through visual checks by the enumerators during the post-intervention facility survey, the authors find evidence that the programme increased the opportunity the health facility gave the community to monitor them through various methods. In particular, the CMI increase the probability that the health facility had: (i) A suggestion box for complaints and recommendations; (ii) Numbered waiting cards for its patients; (iii) A poster informing about free health services; and (iv) A poster on patients' rights and obligations.
The authors suggest these improvements in the management of the health facilities and the behaviour of health facility staff resulted in better health outcomes for the targeted population. Changes in increased intrinsic motivation due to the interaction between the community and providers appears to be the key behind the improvement in the behaviour of service providers.
Evidence from studies with both a programme with facilitated contact with providers, and one without it support this finding. These studies have a better identification strategy to answer the question of whether facilitated contact improved provider responsiveness. Barr et al. (2012) is one of such studies. They found that only the participatory treatment had a positive and statistically significant effect in reducing teachers’ absence rate in schools, compared to the standard treatment that did have no effect. Pradhan et al. (2014), also found suggestive evidence of impact on teachers’ effort, though the statistical significance of the results is not present for all teacher effort outcomes. Again, facilitated contact between users and providers may enhance motivation for citizens to concern on service outcomes and for providers to perform better. As authors argue, ‘these effects are driven by reported increases in the village council’s collaboration with the school and the school principal’s satisfaction of the extent of the village council’s attention to education in the village […] Instead of being a passive fundraising vehicle only, the joint planning meetings between the school committee and the village council translated into co-sponsored education initiatives’.
Björkman, de Walque and Svensson (2013) designed a follow up study to Björkman, de Walque and Svensson (2009) to attempt to assess whether information on how to monitor providers and facilitated contact with providers alone is enough to increase participation and improve outcomes, or if there is a need to add objective information on how the facility is performing to influence the dialogue. They find that without the information on the facility performance the process of stimulating participation and engagement had little impact on health workers’ performance or the quality of health care. They interpret this finding as the
47 It can be thought that households were persuaded by the public interest programming on the radio to increase their private investments (i.e. buying inputs such as books, hiring tutors, etc.) in the education of their children. However, it should be emphasize that this is one of many potential interpretations of the paper, as they do not have data to test the reason behind parents’ decision to circumvent public sector institutions and use private solutions to increase their children’s learning.

86 The Campbell Collaboration | www.campbellcollaboration.org
need for objective information to influence the discussion and the content of the action plan the community develops in conjunction with the health facility to improve outcomes. When that objective information on health workers effort and performance is not available, the action plans get “captured” by health workers and the real issues are not addressed.
These findings suggest the details of intervention design are important in driving changes in citizen participation, the performance of service providers and politicians, and ultimately service delivery outcomes. The theory of change has many bottlenecks and the included studies show that different interventions suffer from more than one bottleneck. But more importantly, the binding constraint is not always the same and does not have the same degree of importance. The evidence in this section, though important, should be interpreted as preliminary, as there is almost no paper with a rigorous identification strategy to answer mechanism questions. In order to investigate whether this is the actually the case more research is needed in the area.

87 The Campbell Collaboration | www.campbellcollaboration.org
Discussion
1.23 SYNTHESIS
In this review we aimed to summarize empirical evidence on the effects of CMIs on corruption or service delivery outcomes (review question 1), assess the channels through which these effects occur (review question 2) and whether contextual factors and intervention design features moderate effects on intermediate and final outcomes (review question 3). In this section we integrate the findings from the synthesis structured around the intervention components and the intermediate and final outcome categories. Many of these links have been drawn in the previous section, but here we summarize all findings.
Table 21 summarises the findings for review question 1. The results for both forensic estimates and perception outcomes suggest a positive effect of CMIs on reducing corruption on average. In the case of service delivery, we differentiated access from quality outcomes. For access we divided the analysis by sector and outcome. Effects on utilization of health services are not clear, but we observe an improvement in immunization rates. In the education sector, we did not find evidence of an effect on proxy access measures such as school enrolment and dropout. On service quality measures, studies looked at child death and weight for age for the health sector, and test scores for education. Evidence from two studies suggests improvements in weight for height, but no difference in child deaths or in waiting times for services. On average waiting time to get a service results from two interventions show a reduction in waiting time in the short term, but this is not sustained in the medium term. Finally, CMI may improve test scores in some contexts. Overall, our findings are heterogeneous and all results are based on few studies. The results should therefore be interpreted with caution.
Table 21: Summary of effectiveness of CMIs
Primary Outcome Variable definition Number of Interventions Effect size 95% Confidence
Interval Forensic economic estimates of corruption 3 0.15 (SMD) 0.01 0.29
Perception measures of corruption 2 0.08(RD) 0.02 0.13
2 -0.23 (SMD) -0.38 -0.07
Access to service
Utilization (short term) 2 0.99 (SMD) -1.05 3.02 Utilization (medium term) 1 0.34 (SMD) 0.12 0.55
Immunization (short term) 2 1.56 (RR) 1.39 1.73
Immunization (medium term) 1 1.04 (RR) -0.52 2.61
Enrolment 6 0.09 (SMD) -0.03 0.21 Dropout rate 7 -0.00 (SMD) -0.10 0.10
Improvement in prevalence condition
Child death (short term) 2 0.76 (RR) 0.42 1.11 Child death (medium term) 1 0.79 (RR) 0.57 1.08

88 The Campbell Collaboration | www.campbellcollaboration.org
Primary Outcome Variable definition Number of Interventions Effect size 95% Confidence
Interval Weight for age (short term) 2 1.20 (RR) 1.02 1.38
Weight for age (medium term) 1 1.29 (RR) 1.01 1.64
Test score 10 0.16 (SMD) 0.04 0.29
Quality of service
Average waiting time to get the service (short term)
2 0.99 (RR) 0.80 1.17
Average waiting time to get the service (medium term)
1 1.06 (RR) 0.95 1.19
* Statistically significant at 95% confidence level
Understanding the effect of the programme on intermediate outcomes, such as citizens’ participation in monitoring activities and providers and politicians’ performance, seems crucial. If an intervention fails to increase citizens’ participation in those activities, and does not improve service providers’ or politicians’ performance, it will be almost impossible for the intervention to have an impact on final outcomes. The limited evidence available on mechanisms suggests that interventions that have modified these intermediate outcomes have been those that include a set of tools for citizens to monitor providers or politicians, and facilitate contacts between citizens, providers and politicians. These interventions appear to be the ones that have the bigger impacts on providers’ responsiveness (lower absence rates, more teachers’ effort, better school inputs) and more participation of communities in monitoring activities (more time spent in monitoring, more in-kind and monetary donations).
There are many reasons why interventions may fail in increasing citizens’ participation in monitoring activities. In some cases, it is related to insufficient or even no information provision to citizens for controlling service delivery (Banerjee et al., 2007; Björkman, de Walque and Svensson, 2013). It could also be a result of citizen's low expectations of leaders, officials, or service providers' accountability or about the chances of success (Molina, 2013b; Banerjee et al., 2010, Khemani, 2007). In addition, the nature of the service provided may be related with the incentives of citizens to actively participate in monitoring activities (Olken 2004, 2007). This relates to the collective action failure, where some citizens may free-ride on their efforts to monitor the project.
Within community differences may result in heterogeneous participation (Björkman and Svensson, 2010). As Banerjee and Mullainathan (2008) argue, certain groups, especially the poor, are less likely to participate in monitoring activities because they have more pressing priorities. All these factors may also influence the degree of providers and politicians’ responsiveness, since it is influenced by citizens’ participation. We would not expect providers to change behaviour when the citizens do not solve the collective action problem and participate in monitoring activities. For the latter to improve their performance, they need to gain popularity, increased/maintained salary and/or social recognition for their responsiveness.
Other reasons why providers and politicians may not be accountable are related to institutional settings. If citizens’ support is not needed for politicians to stay in power, it is likely that CMIs will not improve their performance. In addition, if citizens can impose sanctions to unresponsive providers, CMIs are more likely to improve providers’ performance.

89 The Campbell Collaboration | www.campbellcollaboration.org
With this in mind, Björkman and Svensson (2010) argue that their results ‘have implications for both the design and evaluation of interventions aimed at strengthening beneficiary control in public service delivery programmes. On programme design, interventions should be adjusted to the local socio-political situation. As little is known about how this is to be done, our results open up an important agenda for research: How to enhance collective action in socially heterogeneous communities. On evaluation, ideally the researchers should design the evaluation protocol so as to be able to assess the impact conditional on the socio-political environments’.
Other studies have emphasised the need of adapting interventions to local contexts. Masouri and Rao (2012) argue that both local and national context may be a key factor in determining effectiveness. In turn, Devarajan, Khemani and Walton (2011, 2013) find that interventions’ effectiveness is mediated by the local context, as in communities where clientelism and rent-seeking is widespread, civic participation fails to have an impact on service delivery and government accountability.
1.24 IMPLICATIONS FOR POLICY AND PRACTICE
Overall, our findings are heterogeneous and based on few studies, and should therefore be interpreted with caution. However, the results suggest CMIs can have a positive effect on corruption measures and some service delivery measures.
Considering the potential bottlenecks that may arise given the local context is important to design complementary policies to enhance the effect of CMIs. For example, in India citizens did not know how to get involved in community monitoring in the education sector, but even after receiving information they decided not to participate. In such cases, policy design should focus on either improving the accountability of those institutions to motivate citizens to participate or focus the interventions on policy options that do not require involvement of state institutions, such as remedial education programmes run by local citizens. The review also highlights the need to provide accessible information for citizens on how to monitor providers. Finally, there is some preliminary evidence that combining objective information on service delivery outcomes together with facilitated interactions between citizens and service providers in particular has improved outcomes.
1.25 IMPLICATIONS FOR RESEARCH
We identified a relatively small number of impact evaluations that assess the effects of CMIs on service delivery and corruption outcomes in L&MICs. We also found few studies that address the channels through which effects materialise. This might be due to the difficulty of performing such experimental evaluations with appropriate identification strategies, especially in the case of causal mediation.
To improve future systematic reviews there is a need for not only more impact evaluations on this topic but more coordination among researchers on the design of the interventions and outcome measurement tools. In particular studies assessing replications of several almost identical interventions in different contexts, using similar study designs and measurement tools would improve our ability to reach more generalizable findings about intervention

90 The Campbell Collaboration | www.campbellcollaboration.org
effects.48 Even if this degree of coordination is not possible,49 there is a need to encourage better reporting of the necessary data to compute effect sizes to avoid having to exclude studies from formal meta-analysis due to lack of data.
New studies should embed the theoretical underpinning of the programme when designing new interventions. For instance, what is their theory of change? Who are the ‘providers’ and ‘politicians’ that the ‘community’ needs to hold accountable? What are the sources of change in incentives that these interventions aim to address? How can these be nudged and supported through more data and new information?
Understanding the micro determinants of intermediate outcomes is crucial for translating academic research to policy. For example, how to influence beliefs about providers’ responsiveness, citizen participation in monitoring activities, providers and politicians’ responsiveness is an area for future research.
Another issue that arose from this review is how to enhance collective action in socially heterogeneous communities. As Björkman and Svensson (2010) argue, ‘ideally the researchers should design the evaluation protocol so as to be able to assess the impact conditional on the socio-political environments’.
Additionally, we still know very little on how the information-for-accountability diffuses among citizens’ social networks. Using social network mapping to understand the diffusion of these interventions would be important.
Complementary to this, there are very few studies that compare social accountability interventions with other supervision strategies. Comparing as well as combining bottom-up accountability mechanisms with top down accountability mechanisms, such as improving monitoring capacity by the regulator (e.g. new technology that allows the regulator to monitor providers), impose higher penalties or increase audit probability (as in Olken, 2007) should also be part of the research agenda.
1.26 LIMITATIONS
Due to the low number of included studies, results from meta-analysis should be interpreted carefully. Interventions considered to address review question (1) may be not representative since they took place mainly in Africa and Asia, in rural communities within specific contexts, so the same interventions may have different effects elsewhere. Moreover, in some cases, studies assess the same intervention with a different time scope.
Finally, it seems reasonable that this type of interventions, more than others like vaccinations and the like, are more sensible to the political economy of the society. As such, external validity of the findings is even more difficult to achieve.
48 Berk Ozler made this suggestion in a World Bank seminar on why we found very different conclusions from other systematic reviews of interventions to improve learning outcomes.
49 Researchers may not have incentives to put effort into working on the same intervention as other researchers.

91 The Campbell Collaboration | www.campbellcollaboration.org
1.27 DEVIATION FROM PROTOCOL
We ran an aggregated meta-analysis for all types of interventions for each primary outcome (5). Initially, we anticipated running one meta-analysis for each outcome, and then decomposing into stratified meta-analyses for each CMI. However, given the low number of studies found, we decided that the breakdowns by intervention would be meaningless, except for a few outcomes. We also decomposed the analysis by sector in which service was provided (e.g. education, health, infrastructure, etc.) and perform some sensitivity analyses, namely by study design and region. However, the results of these exercised should not be generalised given the low number of studies involved in them.
Also, we did not run parametric meta-analysis for different degrees of quality among studies as well as uncertainty about the bias associated to each study, in the spirit of Gerber and Green (2012) Bayesian framework due to low number of studies.

92 The Campbell Collaboration | www.campbellcollaboration.org
References
1.28 INCLUDED STUDIES
Afridi, F. and Iversen, V. (2013). Social audits and MGNREGA delivery: Lessons from Andhra Pradesh, Brookings-NCAER India Policy Forum (eds. Barry Bosworth, Arvind Panagariya and Shekhar Shah).
Andrabi, T., Das, J. And Khwaja, A. I. (2013). Report Cards: The impact of Providing School and Child Test Scores on Educational Markets, Working paper JPAL.
Banerjee, A., Banerji, R., Duflo, E., Glennerster, R., Kenniston, D., Khemani, S., Shotland, M. (2007). Can Information Campaigns Raise Awareness and Local Participation in Primary Education? Economic and Political Weekly, 42(15): 1365-1372.
Banerjee, A. V., Banerji, R., Duflo, E., Glennerster, R., and Khemani, S. (2010). Pitfalls of participatory programmes: Evidence from a randomized evaluation in education in India. American Economic Journal: Economic Policy, 2(1), 1-30.
Barr, A., Mugisha, F., Serneels, P. and Zeitlin, A. (2012). Information and collective action in community-based monitoring of schools: Field and lab experimental evidence from Uganda. Working paper mimeo.
Björkman, M. and Svensson, J. (2009). Power to the people: evidence from a randomized field experiment on community-based monitoring in Uganda. The Quarterly Journal of Economics, 124(2), 735-769.
Björkman, M. and Svensson, J. (2010). When is community-based monitoring effective? Evidence from a randomized experiment in primary health in Uganda. Journal of the European Economic Association, vol. 8, issue 2-3, pages 571-581.
Björkman, M., de Walque, D. and Svensson, J. (2013) Information is Power: Experimental Evidence of the Long Run Impact of Community Based Monitoring, unpublished.
Gertler, P., Patrinos, H. A., and Rubio-Codina, M. (2008). Empowering parents to improve education: evidence from rural Mexico. Policy Research Working Paper 3935-IE, Revised May 2008.
Keefer, P., and Khemani, S. (2011). Mass media and public services: The effects of radio access on public education in Benin. Policy Research Working Paper Number 5559, Development Research Group, The World Bank.

93 The Campbell Collaboration | www.campbellcollaboration.org
Molina, E. (2013b). Bottom up institutional reform: Evaluating the impact of the citizen visible audit program in Colombia. Unpublished document.
Olken, B. A. (2004). Monitoring corruption: Evidence from a field experiment in Indonesia (No. w11753). National Bureau of Economic Research.
Olken, B. A. (2005). Corruption perceptions vs. corruption reality. (No. W12428). National Bureau of Economic Research
Olken, B. A. (2007). Monitoring corruption: evidence from a field experiment in Indonesia. Journal of Political Economy, 115(2).
Pandey, P., Goyal, S., and Sundararaman, V. (2009). Community participation in public schools: impact of information campaigns in three Indian states. Education Economics, 17(3), 355-375.
Pandey, P., Sehgal, A. R., Riboud, M., Levine, D., and Goyal, M. (2007). Informing Resource-Poor Populations and the Delivery of Entitled Health and Social Services in Rural India. JAMA: The Journal of the American Medical Association, 298(16), 1867-1875.
Piper, B., and Korda, M. (2010). Early Grade Reading Assessment (EGRA) Plus: Liberia. Program evaluation report: Prepared for USAID/Liberia. Research Triangle Park, NC: RTI International.
Pradhan, M., Suryadarma, D., Beatty, A., Wong, M., Gaduh, A., Alisjahbana, A., and Artha, R. P. (2014). Improving educational quality through enhancing community participation: Results from a randomized field experiment in Indonesia. American Economic Journal: Applied Economics, 6(2), 105-126.
Reinikka, R., and Svensson, J. (2011). The power of information in public services: Evidence from education in Uganda. Journal of Public Economics, Elsevier, vol. 95(7), pages 956-966.
Singh, R., and Vutukuru, V. (2010). Enhancing Accountability in Public Service Delivery through Social Audits: A Case Study of Andhra Pradesh, India. Accountability Initiative, Centre for Policy Research, New Delhi.
Woodhouse, A. (2005) Village Corruption in Indonesia. Fighting Corruption in Indonesia’s Kecamatan Development Program, World Bank Working Papers Series: Indonesian Social Development Paper No. 6.
1.29 EXCLUDED STUDIES
Abdullah, R. (2006). The role of private vending in developing country water service delivery: The case of Karachi, Pakistan. Rochester.
Adamolekun, L. (2002). Africa's evolving career civil service systems: Three challenges--state continuity, efficient service delivery and accountability. International Review of Administrative Sciences, 68(3), 373-387.
Adserà, A., Boix, C., and Payne, M. (2003). Are You Being Served? Political Accountability and Quality of Government. Journal of Law, Economics and Organization 19(2):445-490.

94 The Campbell Collaboration | www.campbellcollaboration.org
Anazodo, R. O., Okoye, J. C., and Chukwuemeka, E. E. O. (2012). Civil service reforms in Nigeria: The journey so far in service delivery. Journal of Political Studies, 19(2), 1-19.
Asaduzzaman, M. (2011) Innovation in local governance: Decentralization and citizen participation in Bangladesh. Vol. 16 (pp. 220-233).
Basheka, B. C. (2009). Public procurement corruption and its implications on effective service delivery in Uganda: An empirical study. International Journal of Procurement Management, 2(4), 415-440.
Bassey, A. O., Abia, R. P., Frank, A., and Bassey, U. A. (2013). Corruption as a social problem and its implication on Nigerian society: a review of anticorrupt policies. Mediterranean journal of social sciences, 4(1), 423-430.
Beasley, E. and Huillery, E. (2013). Empowering Parents in School: What They Can (not) Do, No 2013-03, Sciences Po Economics Discussion Papers, Sciences Po Department of Economics, http://EconPapers.repec.org/RePEc:spo:wpecon:info:hdl:2441/dambferfb7dfprc9lj6b650r8.
Bhatnagar, S. C. (2002). E-government: Lessons from implementation in developing countries. Regional Development Dialogue, 23(2), 164-173.
Bisht, B. S., and Sharma, S. (2011). Social accountability: governance scenario in the health and education sector. Journal of Social Sciences, 29(3), 249-255.
Blunt, P. (2009). The political economy of accountability in Timor-Leste: implications for public policy. Public Administration and Development, 29(2), 89-100.
Boyd, T. M. (2005). Popular participation in Cochabamba, Bolivia as an ameliorative policy treatment affecting public education. (3163307 Ph.D.), The University of Oklahoma, Ann Arbor.
Brixi, H. (2009). China: urban services and governance: The World Bank.
Bussell, J. L. (2010). Why Get Technical? Corruption and the Politics of Public Service Reform in the Indian States. Comparative Political Studies, 43(10), 1230-1257.
Calavan, M., Barr, A., and Blair, H., (2009). Local Administration and Reform Project: Mid-term Evaluation, Report for USAID/Cambodia, Washington, DC: Checchi and Company Consulting.
Cano Blandón, L. F. (2008). Citizen participation in anti-corruption public policies: responding to governance logic. Estudios políticos [Medellin], 33, 147-180.
Capuno, J. J., and Garcia, M. M. (2010). Can information about local government performance induce civic participation? Evidence from the Philippines. Journal of Development Studies, 46(4), 624-643.
Carasciuc, L. (2001). Corruption and quality of governance: The case of Moldova. Rochester.
Caseley, J. (2003). Bringing citizens back in: public sector reform, service delivery performance, and accountability in an Indian state. (BL: DXN069824). (U173981 D.Phil.), University of Sussex (United Kingdom), Ann Arbor.

95 The Campbell Collaboration | www.campbellcollaboration.org
Caseley, J. (2006). Multiple accountability relationships and improved service delivery performance in Hyderabad City, Southern India. International Review of Administrative Sciences, 72(4), 531-546.
Claudio, O. L. (1996). Responsabilidad y control en gobiernos locales: las experiencias de Bolivia, Chile e Inglaterra. Estudios Sociales(3), 107-165.
Devas, N., and Grant, U. (2003). Local government decision-making - Citizen participation and local accountability: Some evidence from Kenya and Uganda. Public Administration And Development, 23(4), 307-316.
Dibie, R. (2003). Local Government Public Servants Performance and Citizens Participation in Governance in Nigeria. International Journal of Public Administration, 26(8-9), 1061-1084.
Digman, E. R. (2006). Decentralization, horizontal institutional exchange, and accountability at the municipal level: Institutional behavior in the Bolivian Orient. (3235663 Ph.D.), Northern Illinois University, Ann Arbor.
Dorado, D. (2009). The evolution of monitoring and evaluation in Colombia: a look at the most representative evaluations of the country. Planeación y desarrollo 40(2): 52-97.
Eckardt, S. (2008). Political accountability, fiscal conditions and local government performance - cross-sectional evidence from Indonesia. Public Administration and Development, 28(1), 1-17.
Ferraz, C., and Finan, F. (2011). Electoral accountability and corruption: Evidence from the audits of local governments. American Economic Review, 101(4), 1274-1311.
Ferraz, C., Finan, F., and Moreira, D. B. (2012). Corrupting learning: Evidence from missing federal education funds in Brazil (Vol. w18150): National Bureau of Economic Research, Inc, NBER Working Papers: 18150.
Francken, N., Minten, B., and Swinnen, J. F. M. (2006). Listen to the radio! Media and corruption: evidence from Madagascar. Rochester.
Goldfrank, B. (2002). Urban experiments in citizen participation: Deepening democracy in Latin America. (3082201 Ph.D.), University of California, Berkeley, Ann Arbor.
Goodspeed, T. J. (2011). Corruption, accountability, and decentralization: theory and evidence from Mexico: Institut d'Economia de Barcelona (IEB).
Gray-Molina, G., Perez de Rada, E. and Yáñez, E. (1999). "Transparency and Accountability in Bolivia: Does Voice Matter?," Research Department Publications 3081, Inter-American Development Bank, Research Department.
Hentic, I., and Bernier, G. (1999). Rationalization, decentralization and participation in the public sector management of developing countries. Rationalisation, d‚centralisation et participation dans la gestion du secteur public des pays en d‚veloppement, 65(2), 197-209.
Huss, R. (2011). Good governance and corruption in the health sector: lessons from the Karnataka experience. Health Policy and Planning, 26(6), 471-484.

96 The Campbell Collaboration | www.campbellcollaboration.org
Iati, I. (2007). Civil society and political accountability in Samoa: A critical response to the good governance agenda for civil society from a Pacific island perspective. (3302137 Ph.D.), University of Hawai'i at Manoa, Ann Arbor.
Israr, S. M., and Islam, A. (2006). Good governance and sustainability: A case study from Pakistan. International Journal of Health Planning and Management, 21(4), 313-325.
Jarquin, E., and Carrillo-Flores, F. (2000). The Complexity of Anticorruption Policies in Latin America Combating corruption in Latin America (pp. 193-201): Woodrow Wilson Center.
Kakumba, U. (2010). Local government citizen participation and rural development: reflections on Uganda's decentralization system. International Review of Administrative Sciences, 76(1), 171-186.
Kaufmann, D., Mehrez, G., Gurgur, T. (2002). Voice or Public Sector Management? An Empirical Investigation of Determinants of Public Sector Performance based on a Survey of Public Officials. World Bank Policy Research Working Paper.
Khagram, S. (2013). Open Budgets: The Political Economy of Transparency, Participation, and Accountability, Brookings Institution Press
Khalid, S. N. A. (2010). Improving the service delivery. Global Business Review, 11(1), 65-77.
Kohl, B. (2003). Democratizing decentralization in Bolivia: The law of popular participation. Journal of Planning Education and Research, 23(2), 153-164.
Kolybashkina, N. (2009). The effects of community development interventions on citizen participation, empowerment, regeneration of civil society and transformation of local governance: case-study of UNDP Crimea Integration and Development Programme. (U557004 D.Phil.), University of Oxford (United Kingdom), Ann Arbor.
Kubal, M. R. (2001). Decentralization and citizen participation in urban Chile: The transfer of health and education administration to local governments. (3031862 Ph.D.), The University of North Carolina at Chapel Hill, Ann Arbor.
Kumnerdpet, W. (2010). Community learning and empowerment through participatory irrigation management: case studies from Thailand. (NR70316 Ph.D.), University of Manitoba (Canada), Ann Arbor.
Kurosaki, T. (2006). Community and economic development in Pakistan: The case of citizen community boards in Hafizabad and a Japanese perspective. Pakistan Development Review, 45(4), 575-585.
Lamprea, E. (2010). When Accountability Meets Judicial Independence: A Case Study of the Colombian Constitutional Court's Nominations. Global Jurist, 10(1).
Lassibille, G., Tan, J. P., Jesse, C., and Van Nguyen, T. (2010). Managing for results in primary education in Madagascar: Evaluating the impact of selected workflow interventions. The World Bank Economic Review, 24(2), 303-329.
Li, L. (2001). Support for Anti-Corruption Campaigns in Rural China. Journal of Contemporary China, 10(29), 573-586.

97 The Campbell Collaboration | www.campbellcollaboration.org
Lieberman, E., Posner, D. N. and Tsai, L. (2013). Does Information Lead to More Active Citizenship? Evidence from an Education Intervention in Rural Kenya. Technical report MIT Political Science Department.
Loewenson, R. (2000). Participation and accountability in health systems: the missing factor in equity. Equinet Policy Series, 9.
Lopez, J. A. F. (2002). The politics of participatory democratic initiatives in Mexico: a comparative study of three localities. (BL: DXN064985). (U166514 D.Phil.), The University of York (United Kingdom), Ann Arbor.
Lulle, T. (2004). Participar en la gestión local: los actores urbanos y el control fiscal cívico en Bogotá. Economía, Sociedad y Territorio, IV(15), 501-528.
Mackay, K., and Gariba, S. (2000). The role of civil society in assessing public sector performance in Ghana: World Bank.
MacLean, M. J. (2005). Decentralization, mobilization and democracy in mature neoliberalism: The Bolivian case. (NR07822 Ph.D.), University of Toronto (Canada), Ann Arbor.
MacPherson, E. (2008). Invisible agents: Women in service delivery reforms. IDS Bulletin, 38(6), 38-44.
Mahmood, Q., Muntaner, C., del Valle Mata Leon, R., and Perdomo, R. E. (2012). Popular Participation in Venezuela's Barrio Adentro Health Reform. Globalizations, 9(6), 815-833.
Mahmud, S. G., Shamsuddin, S. A. J., Feroze Ahmed, M., Davison, A., Deere, D., and Howard, G. (2007). Development and implementation of water safety plans for small water supplies in Bangladesh: benefits and lessons learned. Journal of Water and Health, 5(4), 585-597.
Malinowitz, S. (2006). Decentralization, participation, and consumer services: A case study of municipal enterprises in Cuba. (3212739 Ph.D.), University of Massachusetts Amherst, Ann Arbor.
Manor, J. (2004). Democratisation with Inclusion: Political Reforms and People's Empowerment at the Grassroots. Journal of Human Development, 5(1), 5-29.
Marulanda, L. (2004). Local Participatory Planning and Management in Villa El Salvador, Lima, Peru. Regional Development Dialogue, 25(2), 27-43.
Matančević, J. (2011). Strengthening the Practice of Good Governance in Croatia - Are Civil Society Organizations Co-governors in Policy Making? : Academic Public Administration Studies Archive - APAS.
Mbanaso, M. U. (1989). Urban service delivery system and federal government bureaucracy: A structural analysis of spatial distribution of water supply in a suburban community of Metropolitan Lagos. (9016131 Ph.D.), Portland State University, Ann Arbor.
McAntony, T. S. (2009). Public sector management reforms in Africa: Analysis of anticorruption strategies in Kenya. (3384577 Ph.D.), Syracuse University, Ann Arbor.

98 The Campbell Collaboration | www.campbellcollaboration.org
McDonald, J. (2006). Provincial Strengthening and Environmental Governance in the Solomon Islands. Asia Pacific Journal of Environmental Law, 9(4), 293-330.
McNulty, S. (2013). Participatory democracy? Exploring Peru's efforts to engage civil society in local governance. Latin American Politics and Society, 55(3), 69-92.
Mela, U. A. (2009). Free press: An instrumental weapon in the fight against corruption? (1462552 M.P.P.), Georgetown University, Ann Arbor.
Miarsono, H. (2000). The provision of public services in the developing world: A case study of Semarang, Indonesia. (9999169 Ph.D.), University of Cincinnati, Ann Arbor.
Mitchinson, R. (2003). Devolution in Uganda: An Experiment in Local Service Delivery. Public Administration and Development, 23(3), 241-248.
Mohammadi, S. H., Norazizan, S., and Shahvandi, A. R. (2011). Civic engagement, citizen participation and quality of governance in Iran. Journal of Human Ecology, 36(3), 211-216.
Mohmand, S. K., and Cheema, A. (2007). Accountability Failures and the Decentralisation of Service Delivery in Pakistan. IDS Bulletin, 38(1), 45-59.
Molyneux, S., Atela, M., Angwenyi, V., and Goodman, C. (2012). Community accountability at peripheral health facilities: a review of the empirical literature and development of a conceptual framework. Health Policy and Planning, 27(7), 541.
Montambeault, F. C. (2011). Overcoming Clientelism Through Local Participatory Institutions in Mexico: What Type of Participation? Latin American Politics and Society, 53(1), 91-124.
Morrison, K. M., and Singer, M. M. (2006). The Challenges of “Deliberative Development”: Bolivia’s Experience with a National Dialogue: Instituto de Investigaciones Socio-Económicas (IISEC), Universidad Católica Boliviana.
Mosquera, J., Gutiérrez, A., and Serra, M. (2009). La experiencia de participación ciudadana en el control social a la gestión en salud en Cali, Colombia. Colombia Médica, 40(1), 95-102.
Mubangizi, B. C. (2009). Community development and service delivery in South Africa: work, workers and challenges. Journal of public administration, 44(3), 435-450.
Muriisa, R. K. (2008). Decentralisation in Uganda: Prospects for Improved Service Delivery. Africa Development, 33(4).
Muwanga, N. K. M. S. (2000). The politics of primary education in Uganda: Parent participation and national reforms. (NQ53852 Ph.D.), University of Toronto (Canada), Ann Arbor.
Narayanan, S. (2010). Accountability and the new media: Use of ICTs in governance in India.
Nengwekhulu, R. H. (2009). Public service delivery challenges facing the South African public service. Journal of public administration, 44(2), 341-363.

99 The Campbell Collaboration | www.campbellcollaboration.org
Nguemegne, J. P. (2009). Fighting corruption in Africa: an institutional appraisal of the scope and the effectiveness of anti-corruption system and policies in Cameroon. Cahiers africains d'administration publique, 73, 143-177.
Nguyen, P. (2010). The Effect of a Poverty Reduction Policy and Service Quality Standards on Commune-Level Primary Health Care Utilization in Thai Nguyen Province, Vietnam. Health Policy and Planning, 25(4), 262-271.
Nguyen, T. V. (2008). Education and health care in developing countries. (0821482 Ph.D.), Massachusetts Institute of Technology, Ann Arbor.
Nsingo, S. A. M., and Kuye, J. O. (2005). Democratic participation for service delivery in local government in Zimbabwe: humanising structural configurations and legal provisions. Journal of public administration, 40(4), 744-760.
Nurick, R. (1998). Towards community based indicators for monitoring quality of life and the impact of industry in south Durban.
O’Leary, D. (2010). Corruption and transparency in the water sector. Water Ethics.
OECD. (2008). Service delivery in fragile situations: Key concepts, findings and lessons. OECD Journal on Development, 9(3), 7-60.
Ohemeng, F. L. K. (2010). The new charter system in Ghana: the 'holy grail' of public service delivery? International Review of Administrative Sciences, 76(1), 115-136.
Olken, B. A., and Pande, R. (2012). Corruption in developing countries. Annual Review of Economics, 4, 479-509.
Olmedo, M. S. G. (2005). Control and vigilance citizen committees in the State of Mexico. Convergencia, 12(39), 51-73.
Olowu, D. (1985). Bureaucratic corruption and public accountability in Nigeria: an assessment of recent developments. Revue internationale des Sciences administratives, 51(1), 7-12.
Omar, M. (2009). Urban governance and service delivery in Nigeria. Development in Practice, 19(1), 72-78.
Pandey, P. (2010). Service delivery and corruption in public services: How does history matter? American Economic Journal: Applied Economics, 2(3), 190-204.
Pape-Yalibat, E. A. (2003), Citizen Initiative for Freedom of Information in Guatemala Citizen Action, in The World Bank (2003): Voice, Eyes and Ears Social Accountability in Latin America. Case Studies on Mechanisms of Participatory Monitoring and Evaluation, The World Bank.
Paredes-Solís, S., Andersson, N., Ledogar, R. J., and Cockcroft, A. (2011). Use of social audits to examine unofficial payments in government health services: Experience in South Asia, Africa, and Europe. BMC Health Services Research, 11(SUPPL. 2).
Parker, A. N. (1998). Decentralisation, rural development and local government performance: A case study of rural municipalities in north-east Brazil. (0800278 Ph.D.), University of Pretoria (South Africa), Ann Arbor.

100 The Campbell Collaboration | www.campbellcollaboration.org
Pascaru, M., and Ana Butiu, C. (2010). Psycho-sociological barriers to citizen participation in local governance. The case of some rural communities in Romania. Local Government Studies, 36(4), 493-509.
Pathak, R. D., Naz, R., Rahman, M. H., Smith, R. F. I., and Agarwal, K. N. (2009). E-Governance to Cut Corruption in Public Service Delivery: A Case Study of Fiji. International Journal of Public Administration, 32(5), 415.
Paul, S. (2002). Holding the state to account: Citizen monitoring in action: Public Affairs Centre.
Payani, H. (2000). Public service accountability and control mechanisms in Papua New Guinea. Philippine Journal of Public Administration, 44(1-2), 64-87.
Paz Cuevas, C. (1999). La participación ciudadana municipal en México: factor para el desarrollo y la eficiencia gubernamental. Estudios Políticos (20), 129-158.
Peirce, M. H. (1998). Bolivia's popular participation law: A case of decentralized decision making. (9934261 Ph.D.), University of Miami, Ann Arbor.
Peters, D. H., Noor, A. A., Singh, L. P., Kakar, F. K., Hansen, P. M., and Burnham, G. (2007). Policy and practice: A balanced scorecard for health services in Afghanistan. Bulletin of the World Health Organization, 85(2), 146-151.
Petrova, T. (2011). Citizen participation in local governance in Eastern Europe: rediscoveringa strength of civil society in the post-socialist world? Europe-Asia studies, 63(5), 757-787.
Plummer, J., and Cross, P. (2006). Tackling corruption in the water and sanitation sector in Africa. The Many Faces of Corruption.
Priyadarshee, A., and Hossain, F. (2010). Decentralisation, service delivery, and people's perspectives: Empirical observations on selected social protection programmes in India. International Journal of Public Administration, 33(12), 752-766.
Quiroga, G. D. (1999). Gobernabilidad y participación ciudadana. Revista CIDOB d'Afers Internacionals(47), 169-174.
Rajshree, N., and Srivastava, B. (2012). Open government data for tackling corruption - A perspective.
Reaud, B. (2011). The Political Economy of Local Democracy: Revenue Effects on Service Delivery in Four Mozambican Municipalities. Rochester.
Recanatini, F., Montoriol-Garriga, J., and Kaufmann, D. (2008). How does bribery affect public service delivery? micro-evidence from service users and public officials in Peru.
Remme, J. H. F. (2010). Community-directed interventions for priority health problems in Africa: results of a multicountry study. Bulletin of the World Health Organization, 88(7), 509-518.
Rincón González, S., and Mujica Chirinos, N. (2010). The evaluation of citizen participation from the perspective of beneficiaries in the Mission Barrio Adentro program. Espacio abierto, 19(4), 697-709.

101 The Campbell Collaboration | www.campbellcollaboration.org
Ringold, D., Holla, A., Koziol, M., and Srinivasan, S. (2012). Citizens and service delivery. Assessing the use of social accountability approaches in the human development sectors. Washington, DC: World Bank.
River-Ottenberger, A. X. (2004). The pobladores and local democracy in Chile: The cases of El Bosque and Penalolen. (0807483 Ph.D.), Massachusetts Institute of Technology, Ann Arbor.
Rose, J. (2010). Participation is not enough: Associations and local government in the social fund of Nicaragua. (0822860 Ph.D.), Massachusetts Institute of Technology, Ann Arbor.
Ross Arnold, J. (2012). Political awareness, corruption perceptions and democratic accountability in Latin America. Acta Politica, 47(1), 67-90.
Ruzaaza, G., Malowa, D., and Mugisha, M. (2013). Is performance management measurement a panacea for effective accountability and transparency in public service delivery in a developing country? Insights from Uganda. African Journal of Governance and Development, 2(1), 71-88.
Sangita, S. (2007). Decentralisation for good governance and service delivery in India: theory and practice. Indian Journal of Political Science, 68(3).
Sawada, Y. (1999). Community participation, teacher effort, and educational outcome: the case of El Salvador's EDUCO program.
Schatz, F. (2013). Fighting corruption with social accountability: a comparative analysis of social accountability mechanisms' potential to reduce corruption in public administration. Public Administration and Development, 33(3), 161-174.
Shah, A. (1999). Balance, accountability, and responsiveness: Lessons about decentralization.
Shah, A. (2008). Demanding to be served: holding governments to account for improved access: The World Bank.
Siddiquee, N. A. (2008). E-Government and innovations in service delivery: The Malaysian experience. International Journal of Public Administration, 31(7), 797-815.
Singh, R., and Vutukuru, V. (2010). Enhancing Accountability in Public Service Delivery through Social Audits: A Case Study of Andhra Pradesh, India. Accountability Initiative, Centre for Policy Research, New Delhi.
Smith, J. A., and Green, J. M. (2006). Water service delivery in Pietermaritzburg: A community perspective. Water SA, 31(4), 435-448.
Smulovitz, C., and Peruzzotti, E. (2000). Societal accountability in Latin America. Journal of Democracy, 11(4), 147-158.
Souza, C. (2001). Participatory budgeting in Brazilian cities: Limits and possibilities in building democratic institutions. Environment and Urbanization, 13(1), 159-184.
Speer, J. (2012). Participatory governance reform: A good strategy for increasing government responsiveness and improving public services? World Development, 40(12), 2379-

102 The Campbell Collaboration | www.campbellcollaboration.org
2398. Stromberg, J. (1975). Community involvement in solving local health problems in Ghana. Inquiry, 12(2, sup), 148-155.
Stromberg, J. (1975). Community involvement in solving local health problems in Ghana. Inquiry, 12(2 ,su), 148-155.
Subirats, J. (2000). Democracia, participación y eficiencia. Foro internacional, 40(3 (161)), 430-450.
Swindell, D., and Kelly, J. M. (2000). Linking citizen satisfaction data to performance measures: A preliminary evaluation. Public Performance and Management Review, 24(1), 30-52.
Tarpen, D. N. (1984). Local participation and institution building: the case of the Lofa county agricultural development project in Liberia.
Teixeira, M. A. C. (2011). Ciudadanía, participación y desarrollo local. Cadernos EBAPE.BR, 9(3), 946-949.
Thomas, C. J. (1996). Does community participation make a difference? Girls' schooling outcomes and community participation in Balochistan. (9620548 Ph.D.), Stanford University, Ann Arbor.
Thompson, I. N. M. (2005). The new participation in development economics citizen engagement in public policy at the national level: A case study of Ghana's Structural Adjustment Participatory Review Initiative (SAPRI). (3193016 Ph.D.), University of Pittsburgh, Ann Arbor.
Tolosa, H. A. M., Bustos, W. O. P., and Nieto, C. A. B. (2012). Encuesta de opinión para la evaluación de la gestión pública en Colombia: una propuesta de medición. Semestre económico, 15(32), 77-102.
Tosi, F. G. (2012). Direct popular participation and crises in public services in Argentina: The Gordian Knot. Rochester.
Tsai, L. L. (2005). The informal state: Governance, accountability, and public goods provision in rural China. (3174054 Ph.D.), Harvard University, Ann Arbor.
Tshandu, Z. (2005). Citizen satisfaction survey: A national review of the delivery of social services in the New South Africa. International Review of Administrative Sciences, 71(3), 493-519.
Tshishonga, N. (2011). Mind the service delivery gap: the application of area based management and development (ABMD) model at Cato Manor in E-thekwini. Journal of public administration, 46(1), 720-735.
Unger, J. P., Marchal, B., and Green, A. (2003). Quality standards for health care delivery and management in publicy oriented health services. International Journal of Health Planning and Management, 18(SUPPL. 1), S79-S88.
Vannier, C. N. (2010). Audit culture and grassroots participation in rural Haitian development. PoLAR: Political and Legal Anthropology Review, 33(2), 282-305.

103 The Campbell Collaboration | www.campbellcollaboration.org
Varatharajan, D., Thankappan, R., and Jayapalan, S. (2004). Assessing the performance of primary health centres under decentralized government in Kerala, India. Health Policy and Planning, 19(1), 41-51.
Vyas-Doorgapersad, S. (2009). The application of e-government for increased service delivery in South Africa. International Journal of Interdisciplinary Social Sciences, 4(1), 455-466.
Wampler, B. (2008). When does participatory democracy deepen the quality of democracy? Lessons from Brazil. Comparative politics, 41(1), 61-82.
Yang, K. (2005). Public administrators' trust in citizens: A missing link in citizen involvement efforts. Public Administration Review, 65(3), 273-285.
Yen, N. T. K., and Luong, P. V. (2008). Participatory village and commune development planning (VDP/CDP) and its contribution to local community development in Vietnam. Community Development Journal, 43(3), 329-340.
Zafarullah, H. (1997). Local government reform and accountability in Bangladesh: the continuing search for legitimacy and performance. Regional Development Dialogue, 18, 37-56.
Zhang, X., Fan, S., Zhang, L., and Huang, J. (2002). Local governance and public goods provision in rural China: International Food Policy Research Institute (IFPRI).
1.30 ADDITIONAL REFERENCES
Acemoglu, D. and J. A. Robinson. (2008). Persistence of Power, Elites, and Institutions. American Economic Review 98(1):267-293.
Banerjee, A. V. and Duflo, E. (2011). Poor Economics, a radical rethinking of the way to fight global poverty, Public Affairs.
Banerjee, A. V., and Mullainathan, S. (2008). Limited Attention and Income Distribution. American Economic Review, 98(2): 489-93.
Bardhan, P. (2002). Decentralization of governance and development. Journal of Economic Perspectives, 185-205.
Bardhan, P., and Mookherjee, D. (2006). Decentralisation and accountability in infrastructure delivery in developing countries. The Economic Journal, 116(508), 101-127.
Besley, T. and Persson, T. (2011). Pillars of prosperity: The political economics of development clusters. Princeton University Press.
Bhatnagar, D., Dewan, A., Moreno Torres, M., and Kanungo, P. (2003). Citizens’ report cards on public services: Bangalore, India. Empowerment Case Studies. Available at http://web.worldbank.org/WBSITE/EXTERNAL/TOPICS/EXTPOVERTY/EXTEMPOWERMENT/0,,contentMDK:20269087~pagePK:210058~piPK:210062~theSitePK:486411~isCURL:Y,00.html

104 The Campbell Collaboration | www.campbellcollaboration.org
Borenstein, M., Hedges, L. V., Higgins, J. P., and Rothstein, H. R. (2009). Introduction to meta-analysis. Wiley.
Booth, A. (2011). Searching for Studies. In: J. Noyes, A. Booth, K. Hannes, A. Harden, J. Harris, S. Lewin, and C. Lockwood (Eds). Supplementary Guidance for Inclusion of Qualitative Research in Cochrane Systematic Reviews of Interventions. Version 1 (updated August 2011). Cochrane Collaboration Qualitative Methods Group. Available from URL http://cqrmg.cochrane.org/supplemental-handbook-guidance
Brinkerhoff, D.W., and Azfar, O. (2006). Decentralization and community empowerment: Does community empowerment deepen democracy and improve service delivery?. Washington, DC: Office of Democracy and Governance, USAID.
Campos, J. E., and Pradhan, S. (2007). The Many Faces of Corruption : Tracking Vulnerabilities at the Sector Level. ©World Bank, Washington DC. https://openknowledge.worldbank.org/handle/10986/6848
Capuno, J. J., and Garcia, M. M. (2010). Can information about local government performance induce civic participation? Evidence from the Philippines. Journal of Development Studies, 46(4), 624-643.
Casey, K., Glennerster, R., and Miguel, E. (2012). Reshaping institutions: Evidence on aid impacts using a pre-analysis plan. Quarterly Journal of Economics, 127(4):1755-1812.
Centre for Good Governance (2005). Social audit: A toolkit. A guide for performance improvement and outcome measurement. Centre for Good Governance, Hyderabad.
Chaudhury, N., Hammer, J., Kremer, M., Muralidharan, K., and Halsey Rogers, F. (2006). Missing in action: Teacher and health worker absence in developing countries. Journal of Economic Perspectives, Winter 2006, pp 91-116.
Chernozhukov, V. and Hansen, C. (2008). The Reduced Form: A Simple Approach to Inference with Weak Instruments .Economics Letters, 100(1), 68-71.
Devarajan, S., Khemani, S., and Walton, M. (2011). Civil society, public action and accountability in Africa. HKS Faculty Research Working Paper Series RWP11-036, John F. Kennedy School of Government, Harvard University
de Vibe M, Bjørndal A, Tipton E, Hammerstrøm KT, Kowalski K. (2012) Mindfulness based stress reduction (MBSR) for improving health, quality of life and social functioning in adults. Campbell Systematic Reviews.
Downs, A. (1957). An economic theory of democracy. Harper.
Dreze, J. and Gazdar, H. (1996). "Uttar Pradesh: The Burden of Inertia." In Jean Dreze and Amartya Sen, eds., Indian Development: Selected Regional Perspectives. New York: Oxford University Press.
Duval, S., and Tweedie, R. (2000). A nonparametric "trim and fill" method of accounting for publication bias in meta-analysis. Journal of the American Statistical Association,95(449), 89-98.

105 The Campbell Collaboration | www.campbellcollaboration.org
Effective Practice and Organisation of Care Group (EPOC). (n.d.). Suggested risk of bias criteria for EPOC reviews. Available from http://epocoslo.cochrane.org/epoc-specific-resources-review-authors
Egger, M., Davey Smith, G., Schneider, M. and Minder, C. (1997). Bias in meta-analysis detected by a simple, graphical test. British Medical Journal, 315, 629-634.
Ferraz, C., Finan, F., and Moreira, D. B. (2012). Corrupting learning: Evidence from missing federal education funds in Brazil (Vol. w18150): National Bureau of Economic Research, Inc, NBER Working Papers: 18150.
Gaventa, J., and Barrett, G. (2012). Mapping the Outcomes of Citizen Engagement. World Development 40(12): 2399–2410.
Gerber, A. S., and Green, D. P. (2012). Field experiments: Design, analysis, and interpretation. WW Norton.
Gerber, A. S., and Malhotra, N. (2008a). Do statistical reporting standards affect what is published? Publication bias in two leading political science journals. Quarterly Journal of Political Science, 3(3), 313-26.
Gerber, A. S., and Malhotra, N. (2008b). Publication bias in empirical sociological research: Do arbitrary significance levels distort published results? Sociological Methods and Research, 37(1), 3-30.
Gorodnichenko, Y. and Sabirianova, P. K. (2007). Public Sector Pay and Corruption: Measuring Bribery from Micro Data. Journal of Public Economics, 91(5-6): 963-991.
Grandvoinnet, H., Aslam, G., and Raha, S. (2015). Opening the Black Box: The Contextual Drivers of Social Accountability. World Bank Publications.
Hanna, R., Bishop, S., Nadel, S., Scheffler, G., and Durlacher, K. (2011). The effectiveness of anti-corruption policy: What has worked, what hasn’t, and what we don’t know. DIFD Systematic Review.
Higgins, J., and Green, S. (Eds.). (2011). Cochrane handbook for systematic reviews of interventions. (Version 5.0.2, updated September 2009). The Cochrane Collaboration. Available at www.cochrane-handbook.org
Hotelling, H. (1929). Stability in Competition. Economic Journal 39:41 -57.
International Development Coordinating Group (IDCG). (2012). Protocol and review guidelines. Campbell Collaboration. Available at www.campbellcollaboration.org
Keefer, P. and S. Khemani, S. (2004), “Why do the Poor Receive Poor Services?” Economic and Political Weekly, vol. 39, no. 9, pp. 935-943.
Keefer, P. and Khemani, S. (2005), “Democracy, Public Expenditures, and the Poor,” World Bank Research Observer, vol. 20, no. 1, pp. 1-27.
Khemani, S. (2007). Can information campaigns overcome political obstacles to serving the poor? In S. Devarajan and I. Widlund (Eds.), The politics of service delivery in democracies: Better access for the poor. Expert Group on Development Issues, Ministry for Foreign Affairs, Sweden.

106 The Campbell Collaboration | www.campbellcollaboration.org
Khwaja, A. I. and Mian, A. (2005). Do Lenders Favor Politically Connected Firms? Rent Provision in an Emerging Financial Market, The Quarterly Journal of Economics, vol. 120(4), pages 1371-1411, November.
King, E., Samii, C. and Snilstveit, B. (2010): Interventions to promote social cohesion in sub-Saharan Africa, Journal of Development Effectiveness, 2(3), 336-370.
Kling, J. R., Liebman, J. B., Katz, L. F. and Sanbonmatsu, L. (2004) Moving To Opportunity and Tranquility: Neighborhood Effects on Adult Economic Self-Sufficiency and Health from a Randomized Housing Voucher Experiment, Princeton University Working Paper No. 5.
Krishnaratne, S., White, H. and Carpenter, E., 2013. Quality education for all children? What works in education in developing countries,Working Paper 20. New Delhi: International Initiative for Impact Evaluation (3ie)
Le Grand, J. (2003). Motivation, agency, and public policy: of knights and knaves, pawns and queens. Oxford University Press, Oxford, UK.
Lieberman, E., Posner, D. N. and Tsai, L. (2013). Does Information Lead to More Active Citizenship? Evidence from an Education Intervention in Rural Kenya. Technical report MIT Political Science Department.
Mansuri, G., and Rao, V. (2012). Localizing development: Does participation work? Washington DC, World Bank.
Maru, V. (2010). Social accountability and legal empowerment. Health and Human Rights: An International Journal, North America, 1225 05.
Mauro, P. (1995). Corruption and Growth. The Quarterly Journal of Economics, 110(3): 681-712.
McGraw, K. O., and Wong, S. P. (1996). Forming inferences about some intraclass correlation coefficients. Psychological methods, 1(1), 30.
McMillan, J. and Zoido, P. (2004). How to Subvert Democracy: Montesinos in Peru. Journal of Economic Perspectives, 18(4): 69-92.
Molina, E. (2013a). Community monitoring and self-fulfilling prophecies in service delivery. Unpublished Manuscript.
Noyes, J., Booth, A., Hannes, K., Harden, A., Harris, J., Lewin, S., and Lockwood, C. (Eds.). (2011). Supplementary guidance for inclusion of qualitative research in Cochrane systematic reviews of interventions (Version 1, updated August 2011). Cochrane Collaboration Qualitative Methods Group. Available from http://cqrmg.cochrane.org/supplemental-handbook-guidance.
Nunn, N., and Wantchekon, L. (2009). The slave trade and the origins of mistrust in Africa (No. w14783). National Bureau of Economic Research.
OECD. (2008). Service delivery in fragile situations: Key concepts, findings and lessons. OECD Journal on Development, 9(3), 7-60.

107 The Campbell Collaboration | www.campbellcollaboration.org
Olken, B. A. (2006). Corruption and the Costs of Redistribution: Micro Evidence from Indonesia. Journal of Public Economics, 90(4-5):853-870.
Olken, B. A. (2009). Corruption Perceptions vs. Corruption Reality. Journal of Public Economics, 93(7-8): 950-964.
Olken, B. A. and Barron, P. (2009). The Simple Economics of Extortion: Evidence from Trucking in Aceh. Journal of Political Economy, 117(3): 417-452.
Olken, B. A., and Pande, R. (2012). Corruption in developing countries. Annual Review of Economics, 4, 479-509.
Olson, M. (1971). The Logic of Collective Action: Public Goods and the Theory of Groups. Harvard economic studies, v. 124 revised ed. Harvard University Press.
Pan, L., and Christiaensen, L. (2012). Who is vouching for the input voucher? Decentralized targeting and elite capture in Tanzania. World Development, Elsevier, vol. 40(8), pages 1619-1633.
Pande, R. and Olken, B. A. (2011). Governance review paper. JPAL governance initiative. Abdul Latif Jameel Poverty Action Lab.
Pandey, P. (2010). Service delivery and corruption in public services: How does history matter? American Economic Journal: Applied Economics, 2(3), 190-204.
Persson, T., and Tabellini, G. (2002). Political Economics: Explaining Economic Policy. Vol. 1 of MIT Press Books The MIT Press.
Reinikka, R., and Svensson, J. (2004). Local capture: evidence from a central government transfer program in Uganda. The Quarterly Journal of Economics, 119(2), 679-705.
Reinikka, R., and Svensson, J. (2005). Fighting corruption to improve schooling: Evidence from a newspaper campaign in Uganda. Journal of the European Economic Association, MIT Press, vol. 3(2-3), pages 259-267, 04/05.
Reinikka, R., and Svensson, J. (2011). The power of information in public services: Evidence from education in Uganda. Journal of Public Economics, Elsevier, vol. 95(7), pages 956-966.
Remme, J. H. F. (2010). Community-directed interventions for priority health problems in Africa: results of a multicountry study. Bulletin of the World Health Organization, 88(7), 509-518.
Ringold, D., Holla, A., Koziol, M., and Srinivasan, S. (2012). Citizens and service delivery. Assessing the use of social accountability approaches in the human development sectors. Washington, DC: World Bank.
Rose-Ackerman, S. (2004). Governance and Corruption, in Global Crises, Global Solutions. B. Lomborg, ed. Cambridge: Cambridge University.
Sacks, A. and Larizza, M. (2012). Why Quality Matters: Rebuilding Trustworthy Local Government in Post-Conflict Sierra Leone. World Bank Policy Research Working Paper No.

108 The Campbell Collaboration | www.campbellcollaboration.org
Shadish, W. and Myers, D. (2004). Research design policy brief. Campbell Collaboration: Oslo. Available at: http://www.campbellcollaboration.org/artman2/uploads/1/C2_Research_Design_Policy_Brief-2.pdf
Shemilt, I., Mugford, M., Byford, S., Drummond, M., Eisenstein, E., Knap, M., … Walker, D. (2008). The Campbell collaboration economics methods policy brief. Campbell Collaboration: Oslo. Available at http://www.campbellcollaboration.org/artman2/uploads/1/Economic_Methods_Policy_Brief.pdf
Sims, C. A. (1998). Stickiness. In Carnegie-Rochester Conference Series on Public Policy, 49(1), 317-356.
Sims, C. A. (2003). Implications of rational inattention. Journal of Monetary Economics, 50(3), 665-690.
Sims, C. A. (2006). Rational inattention: Beyond the linear-quadratic case. The American Economic Review, 96(2), 158-163.
Singer, M. M. (2013). Bribery Diminishes Life Satisfaction in the Americas, Working paper from University of Connecticut. Unpublished manuscript.
Snilstveit, B. (2012). Systematic reviews: from ‘bare bones’ reviews to policy relevance. Journal of Development Effectiveness, 4(3), 388-408.
Snilstveit, B., Oliver, S., and Vojtkova, M. (2012). Narrative approaches to systematic review and synthesis of evidence for international development policy and practice. Journal of Development Effectiveness, 4(3), 409-429.
Staiger, D. and Stock, J. H. (1997). Instrumental Variables Regression with Weak Instruments. Econometrica 65, no. 3, 557-586.
Stiglitz, J. E. (2002). Participation and development: Perspectives from the comprehensive development paradigm. Review of Development Economics, 6(2), 163-182.
Stock, J. H. and Yogo, M. (2005). Testing for Weak Instruments in Linear IV Regression. Ch. 5 in J.H. Stock and D.W.K. Andrews (eds), Identification and Inference for Econometric Models: Essays in Honor of Thomas J. Rothenberg. Cambridge University Press.
Sukhtankar, S. (2011). Sweetening the Deal? Political Connections and Sugar Mills in India American Economic Journal: Applied Economics, vol 4, no 3, pp 43-63, July 2012.
Svensson, J. (2003). Who Must Pay Bribes and How Much? Evidence from A Cross Section Of Firms. The Quarterly Journal of Economics, 118(1): 207-230.
Svensson, J. (2005). Eight questions about Corruption. Journal of Economic Perspectives, 19 (5): 19-42.
Tosi, F. G. (2012). Direct popular participation and crises in public services in Argentina: The Gordian Knot. Rochester.

109 The Campbell Collaboration | www.campbellcollaboration.org
Transparency International. (2013). Policy Brief. Looking Beyond 2015: A role for governance. Transparency International, Berlin, Germany.
UN (2008). People matter: Civic engagement in public governance. New York, NY: United Nations Department of Economic and Social Affairs.
Vevea, J. L., and Hedges, L.V. (1995). A general linear model for estimating effect size in the presence of publication bias. Psychometrika, 60, 419-435.
Waddington, H., Snilstveit, B., Vojtkova, M., and Hombrados, J. (2012). Protocol and review guidelines. 3ie, New Delhi.
Waddington, H., White, H., Snilstveit, B., Hombrados, J. G., Vojtkova, M., Davies, P., and Tugwell, P. (2012). How to do a good systematic review of effects in international development: a tool kit. Journal of development effectiveness, 4(3), 359-387.
Waddington, H, Snilstveit, B, Hombrados, J, Vojtkova, M, Phillips, D, Davies, P and White, H. (2014) Farmer Field Schools for Improving Farming Practices and Farmer Outcomes: A Systematic Review Campbell Systematic Reviews 2014:6 DOI: 10.4073/csr.2014.
White, H. (2009). Theory-based impact evaluation: Principles and practice. Working Paper. International Initiative for Impact Evaluation: New Delhi. Available at http://www.3ieimpact.org/admin/pdfs_papers/51.pdf
Wilson, D.B., Weisburd, D. and McClure, D. (2011). Use of DNA testing in police investigative work for increasing offender identification, arrest, conviction and case clearance. Campbell Systematic Reviews.
World Bank. (2003). Making services work for poor people. World Development Report 2004. Washington, DC:World Bank; New York: Oxford University Press.
Zitzewitz, E. (2012). Forensic Economics. Journal of Economic Literature, 50(3): 731-69.

110 The Campbell Collaboration | www.campbellcollaboration.org
Information about this review
1.31 REVIEW AUTHORS
Lead review author
Name: Ezequiel Molina
Title: Economist
Affiliation: World Bank and CEDLAS
Address: 1818H NW Washington, DC
City, State, Province or County:
Postal Code: 20433
Country: United States
Phone: (+54221) – 422 9383 int. 14
Email: [email protected]
Co-author(s)
Name: Laura Carella
Affiliation: CEDLAS - Universidad Nacional de La Plata
Country: Argentina
Email: [email protected]
Co-author(s)
Name: Ana Pacheco
Affiliation: CEDLAS - Universidad Nacional de La Plata
Country: Argentina
Email: [email protected]

111 The Campbell Collaboration | www.campbellcollaboration.org
Co-author(s)
Name: Leonardo Gasparini
Affiliation: CEDLAS - Universidad Nacional de La Plata
Country: Argentina
Email: [email protected]
Co-author(s)
Name: Guillermo Cruces
Affiliation: CEDLAS - Universidad Nacional of La Plata
Country: Argentina
Email: [email protected]
1.32 ROLES AND RESPONSIBILITIES
• Content: Ezequiel Molina. He holds a PhD in Political Economy from Princeton University, where he has devoted several years to study these topics in detail. Currently he is an Economist at The World Bank.
• Systematic review methods: Ezequiel Molina and Ana Pacheco have attended a Systematic Review Training in Dhaka, Bangladesh (December 10-14, 2012). Ezequiel has taken PhD level courses on methodology and meta-analysis research. Andres Rius, an expert in systematic review, was an advisor on these topics for the team.
• Statistical analysis: Laura Carella, Ana Pacheco, Guillermo Cruces, Leonardo Gasparini, and Ezequiel Molina have extensive training in statistical methods. In addition, several research assistants provided statistical and analytical support to the team.
• Information retrieval: Ana Pacheco leaded this section. Ana has worked as an editorial assistant for Económica, the journal of Economics at the UNLP, and as such she had to maintain the series at different indexes. Andres Rius has experience in information retrieval in the context of a systematic review and supported the team in this area. Additionally, several research assistants have provided support to Ana and the team. The research assistants are Malena Arcidiácono, María Noelia Garbero, Joaquín Serrano, Nicolás Badaracco, Juan Francisco Chiste, Marco Cobanera, Jessica Bracco, Luis Morano Germani, Agustín Casarini, Valentina Bonifacio, Santiago Cerutti, and Facundo Sirimarco.
• Policy Influence: Ana Pacheco and Ezequiel Molina are in charge of this area. Ana worked on dissemination activities and coordinated the non-technical report prepared by CIPPEC. Ezequiel met with stakeholders in Washington DC and had skype calls with stakeholders elsewhere to disseminate the findings and receive feedback.
1.33 SOURCES OF SUPPORT
External sources: 3ie Systematic Review Grant will support researchers’ salaries.

112 The Campbell Collaboration | www.campbellcollaboration.org
1.34 DECLARATIONS OF INTEREST
There are no known conflicts of interest that the team is currently aware of. The team has not been part of any organization that has implemented projects in this area, nor has any interests in promoting particular findings due to personal relationships with individuals or organizations who will benefit from these.
Ezequiel Molina has conducted research on community monitoring in Colombia (Community Visible Audits) as part of his dissertation work. He studied the effects of the programme on corruption as well as political influence of the community over policy making.

113 The Campbell Collaboration | www.campbellcollaboration.org
Appendices
APPENDIX A: SEARCH STRATEGY – AN EXAMPLE
Econlit (Ovid) Search – 20 October 2013
1. (communit* or civil* or civic* or citizen* or people or elector* or grassroot* or social or societ* or local or resident* or neighbo*).ti,ab.
2. (monitor* or particip* or empower* or control* or develop* or governanc* or superv* or "report* card*" or audit* or (informat* adj3 campaign*) or scorecard* or "score card*" or accountab* or watchdog* or democrati* or "people power").ti,ab.
3. (performance or effort* or attend* or achievement* or "test score*" or absent* or (disease adj3 prevalence) or "cost effectiv*" or access* or ((deliver* or performance or provi*) adj3 service*) or corrupt* or fraud* or dishonest* or brib* or mismanag* or leak* or (missing adj3 fund*) or client* or wait* or victim* or efficien* or inefficien* or quality or (rent* adj3 seek*)).ti,ab.
4. (representative* or "local authorit*" or bureaucra* or councillor* or provider* or politician* or official* or leader* or govern* or administration).ti,ab.
5. (D720 or D730 or H110).cc. 6. 4 or 5 7. (Africa or Asia or Caribbean or West Indies or South America or Latin America or
Central America).ti,ab,hw. 8. (Afghanistan or Albania or Algeria or Angola or Antigua or Barbuda or Argentina or
Armenia or Armenian or Azerbaijan or Bangladesh or Barbados or Benin or Byelarus or Byelorussian or Belarus or Belorussian or Belorussia or Belize or Bhutan or Bolivia or Bosnia or Herzegovina or Hercegovina or Botswana or Brazil or Bulgaria or Burkina Faso or Burkina Fasso or Upper Volta or Burundi or Urundi or Cambodia or Khmer Republic or Kampuchea or Cameroon or Cameroons or Cameron or Camerons or Cape Verde or Central African Republic or Chad or Chile or China or Colombia or Comoros or Comoro Islands or Comores or Mayotte or Congo or Zaire or Costa Rica or Cote d'Ivoire or Ivory Coast or Croatia or Cuba or Djibouti or French Somaliland or Dominica or Dominican Republic or East Timor or East Timur or Timor Leste or Ecuador or Egypt or United Arab Republic or El Salvador or Eritrea or Ethiopia or Fiji or Gabon or Gabonese Republic or Gambia or Gaza or Georgia Republic or Georgian Republic or Ghana or Gold Coast or Grenada or Guatemala or Guinea or Guam or Guiana or Guyana or Haiti or Honduras or India or Maldives or Indonesia or Iran or Iraq or Jamaica or Jordan or Kazakhstan or Kazakh or Kenya or Kiribati or Korea or Kosovo or Kyrgyzstan or Kirghizia or Kyrgyz Republic or Kirghiz or Kirgizstan or Lao PDR or Laos or Latvia or Lebanon or Lesotho or Basutoland or Liberia or Libya or Lithuania or Macedonia or Madagascar or Malagasy Republic or Malaysia or Malaya or Malay or Sabah or Sarawak or Malawi or Nyasaland or Mali or Marshall Islands or Mauritania or Mauritius or Agalega Islands or Mexico or Micronesia or Middle East or Moldova or Moldovia or Moldovian or Mongolia or Montenegro or Morocco or Ifni or Mozambique or Myanmar or Myanma or Burma or Namibia or Nepal or Netherlands Antilles or New Caledonia or Nicaragua or Niger or Nigeria or Northern Mariana Islands or Oman or Muscat or Pakistan or Palau or Palestine or Panama or

114 The Campbell Collaboration | www.campbellcollaboration.org
Paraguay or Peru or Philippines or Philipines or Phillipines or Phillippines or Papua New Guinea or Portugal or Romania or Rumania or Roumania or Russia or Russian or Rwanda or Ruanda or Saint Lucia or St Lucia or Saint Vincent or St Vincent or Grenadines or Samoa or Samoan Islands or Navigator Island or Navigator Islands or Sao Tome or Senegal or Serbia or Montenegro or Seychelles or Sierra Leone or Sri Lanka or Ceylon or Solomon Islands or Somalia or Sudan or Suriname or Surinam or Swaziland or South Africa or Syria or Tajikistan or Tadzhikistan or Tadjikistan or Tadzhik or Tanzania or Thailand or Togo or Togolese Republic or Tonga or Trinidad or Tobago or Tunisia or Turkey or Turkmenistan or Turkmen or Uganda or Ukraine or Uruguay or USSR or Soviet Union or Union of Soviet Socialist Republics or Uzbekistan or Uzbek or Vanuatu or New Hebrides or Venezuela or Vietnam or Viet Nam or West Bank or Yemen or Yugoslavia or Zambia or Zimbabwe or russia).tw.
9. ((developing or less* developed or under developed or underdeveloped or middle income or low* income or underserved or under served or deprived or poor*) adj (countr* or nation? or population? or world or state*)).ti,ab.
10. ((developing or less* developed or under developed or underdeveloped or middle income or low* income) adj (economy or economies)).ti,ab.
11. (low* adj (gdp or gnp or gross domestic or gross national)).tw. 12. (low adj3 middle adj3 countr*).tw. 13. (lmic or lmics or third world or lami countr*).tw. 14. transitional countr*.tw. 15. developing countries.hw. 16. or/7-15 17. 1 and 2 and 3 and 6 and 16 (Result 3435 hits)
APPENDIX B: CODING SHEET
Variable Description Values
Study information:
Id Unique identifier code Numeric
Author Name of Authors String
Year Year of the document Yyyy
Publication Type of publication 1 Article
2 Chapter in a book
3 Conference presentation
4 Government or institutional report
5 Mimeo
6 Working paper

115 The Campbell Collaboration | www.campbellcollaboration.org
Variable Description Values
Status Publication status 1 Published or forthcoming in
refereed journal or book
2 Published or forthcoming in non
refereed journal or book
3 Unpublished
4 Unknown
Source Document found using… 1 Citation
2 Electronic database
3 Handsearch
4 Unknown
5 Website
Language 1 English
2 French
3 Portuguese
4 Spanish
5 Other
Intervention:
Country Country String
Region region (EAP, LAC, MENA, SA, SSA) String

116 The Campbell Collaboration | www.campbellcollaboration.org
Variable Description Values
Sector Sector in which the intervention
was carried out, e.g. health, police,
education, infrastructure, etc.
String
Urban Urban/Rural 0 Rural
1 Urban
Fragility Fragility of the community
according underlying political
systems, social norms, etc.
String
Start Year when the intervention started Yyyy
duration Intervention period (from MM/YY to
MM/YY)
String
quantitative Is it a quantitative or qualitative
study?
0 Qualitative
1 Quantitative
data Is the intervention data available? 0 No
1 Yes
contrafactual Treatment and comparison groups 1 CMI vs no formal process of
monitoring
2 CMI with encouragement to
participate vs. CMI without
encouragement to participate in
monitoring

117 The Campbell Collaboration | www.campbellcollaboration.org
Variable Description Values
design Research design 1 impact evaluations based on
experimental design
2 quasi-experimental designs
3 contemporaneous data collection
4 two or more control and
intervention sites
5 regression discontinuity designs
6 interrupted time series studies
7 ex post observational studies with
non-treated comparison groups
and adequate control for
confounding
8 reflexive comparison groups
9 project completion reports and
process evaluations
# Other
units Units of observations String
Variables for
Sample size
Number of clusters, number of
individuals for each sample size
(treatment, exposed, and
comparison group)
Numeric
Variables for
Sample attrition
Attrition for each sample size
(treatment, exposed, and
comparison group)
Numeric
spillover Geographical separation of
treatment and comparison
String

118 The Campbell Collaboration | www.campbellcollaboration.org
Variable Description Values
assignment Information reported on method of
allocating individuals to groups
additional_int Description of whether there is an
additional intervention provided:
e.g. CDD, CDR, school
management.
control_group Description of comparison group
target_group Description of targeted group.
Type of intervention
campaign information campaigns 0 No
1 Yes
scorecard Scorecards/Report Cards 0 No
1 Yes
audits social audits 0 No
1 Yes
Grm Grievance Redress Mechanism 0 No
1 Yes
desc_int
Description of the Intervention String
Outcomes and Effect Size
outcome# Outcome as stated in the study String
o_type# Is the outcome a … 1 Measure of corruption
119 The Campbell Collaboration | www.campbellcollaboration.org
Variable Description Values
2 Measure of access or quality of
service delivered
3
4
5
6
7
8
9
10
Forensic measure
Time measure
Measure of access
Perception measure
Measure of citizen participation in
monitoring activities?
Measure of elite capture
Measure of providers’ performance
Other measure
0_main# Is it a primary outcome? 0
1
No
Yes
o_estimate#
Estimate extracted from the study. String
0_smd#
Effect size for standardised mean
differences
Numeric
0_rr#
Effect size for risk ratios Numeric
o_estimand#
Description of treatment effect
estimated: ITT, ATET, ATE, LATE
and whether the estimates is
adjusted for cluster if possible or
unadjusted analysis
String
o_other# Other relevant information for the
outcome
String
Information Transmission:

120 The Campbell Collaboration | www.campbellcollaboration.org
Variable Description Values
it_description How was devised the information
transmission mechanism?
String
it_presentation How was the message presented? String
Interaction between Community and Service Providers:
int_nmeetings Number of meetings (0 to N) numeric
int_participation Attendance rate to meetings (%) numeric
Int_distance Distance to the meeting numeric
Community Power to Make Decisions:
pow_decision Which type of decisions can the
community make?
string
Critical Appraisal
ci_aims Are the aims of the study
clearly stated?
0 No
1 Yes
ci_framework Is there a clear link to relevant
literature/theoretical framework?
0 No
1 Yes
ci_context Is there an appropriate description
of the context?
0 No
1 Yes

121 The Campbell Collaboration | www.campbellcollaboration.org
Variable Description Values
ci_theory Is there a clear link to the
theoretical framework and
previous literature?
0 No
1 Yes
ci_data Is there an appropriate description
of the methods of data collection?
0 No
1 Yes
ci_methods Is there an appropriate description
of the methods of analysis?
0 No
1 Yes
ci_design Was the research design
appropriate?
0 No
1 Yes
ci_controls Does it control for potential
confounding variables?
0 No
1 Yes
ci_findings Are the findings supported by the
data?
0 No
1 Yes
ci_ethics Are there ethical
concerns related to the research?
0 No
1
9
Yes
Unclear
ci_perform Was the study adequately
protected against performance
bias?
0 No
1
9
Yes
Unclear
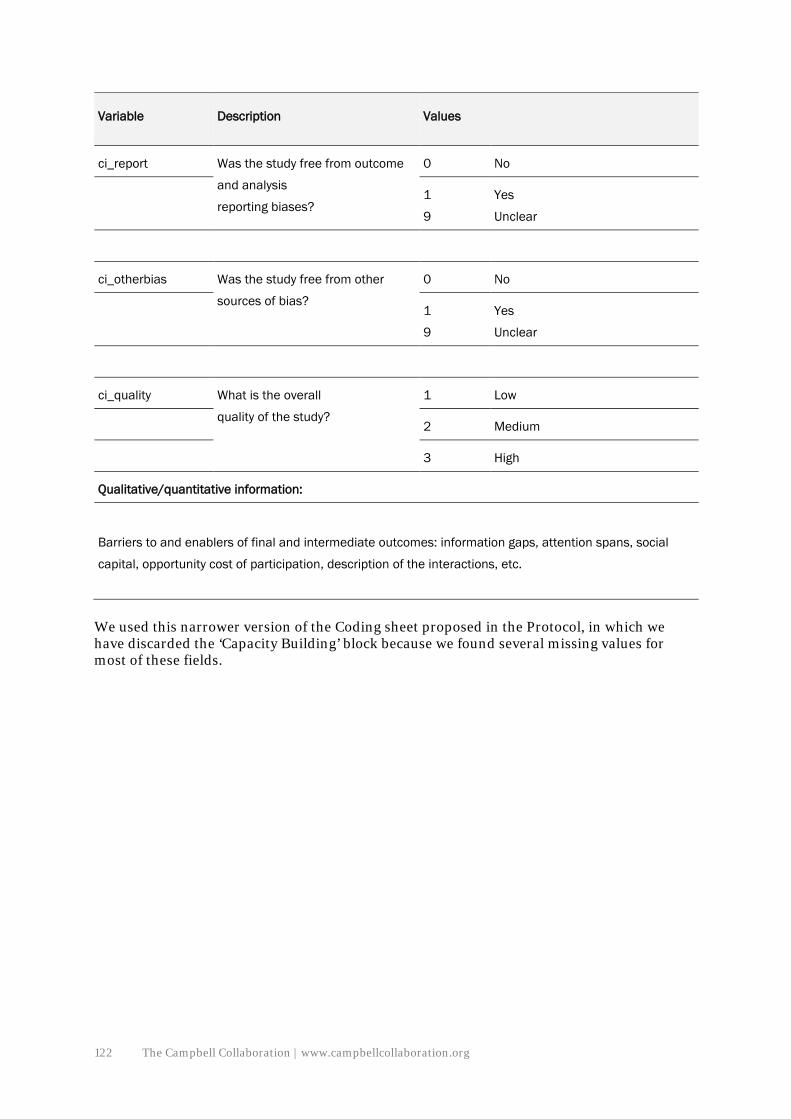
122 The Campbell Collaboration | www.campbellcollaboration.org
Variable Description Values
ci_report Was the study free from outcome
and analysis
reporting biases?
0 No
1
9
Yes
Unclear
ci_otherbias Was the study free from other
sources of bias?
0 No
1
9
Yes
Unclear
ci_quality What is the overall
quality of the study?
1 Low
2 Medium
3 High
Qualitative/quantitative information:
Barriers to and enablers of final and intermediate outcomes: information gaps, attention spans, social
capital, opportunity cost of participation, description of the interactions, etc.
We used this narrower version of the Coding sheet proposed in the Protocol, in which we have discarded the ‘Capacity Building’ block because we found several missing values for most of these fields.

123 The Campbell Collaboration | www.campbellcollaboration.org
APPENDIX C: CRITICAL APPRAISAL OF STUDIES50
1) Selection bias and confounding
a) For Randomised assignment (RCTs), Score “YES” if:
• a random component in the sequence generation process is described (e.g. referring to a random number table)51;
• and if the unit of allocation was at group level (geographical/ social/ institutional unit) and allocation was performed on all units at the start of the study,
• or if the unit of allocation was by beneficiary or group and there was some form of centralised allocation mechanism such as an on-site computer system;
• and apart from receiving different treatments, subjects in different experimental conditions should be handled in an identical fashion.
• and the same standards where used to measure outcomes in the two groups, possible those tasked with measuring outcomes are blind to experimental condition.
• and if the unit of allocation is based on a sufficiently large sample size to equate groups on average.
• baseline characteristics of the study and control/comparisons are reported and overall
• similar based on t-test or ANOVA for equality of means across groups52, • or covariate differences are controlled using multivariate analysis; • and the attrition rates (losses to follow up) are sufficiently low and similar in
treatment and control, or the study assesses that loss to follow up units are random draws from the sample (e.g. by examining correlation with determinants of outcomes, in both treatment and comparison groups);
• and problems with cross-overs and drop outs are dealt with using intention-to-treat analysis or in the case of drop outs, by assessing whether the drop outs are random draws from the population;
• and, for cluster-assignment, randomization should be done at the cluster level. If this is not the case, authors should control for external cluster-level factors that might confound the impact of the programme (e.g. institutional strength,
50 We drew almost entirely on Waddington et al. (2012) in developing this tool.
51 If a quasi-randomised assignment approach is used (e.g. alphabetical order), you must be sure that the process truly generates groupings equivalent to random assignment, to score “Yes” on this criteria. In order to assess the validity of the quasi-randomization process, the most important aspect is whether the assignment process might generate a correlation between participation status and other factors (e.g. gender, socio-economic status) determining outcomes; you may consider covariate balance in determining this (see question 2).
52 Even in the context of RCTs, when randomisation is successful and carried out over sufficiently large assignment units, it is possible that small differences between groups remain for some covariates. In these cases, study authors should use appropriate multivariate methods to correcting for these differences.

124 The Campbell Collaboration | www.campbellcollaboration.org
provider’s competition, media independence, and community fixed effects) through either matching or multivariate analysis.
Score “UNCLEAR” if:
• the paper does not provide details on the randomization process, or uses a quasi- randomization process for which it is not clear has generated allocations equivalent to true randomization.
• insufficient details are provided on covariate differences or methods of adjustment;
• or insufficient details are provided on cluster controls.
Score “NO” if:
• the sample size is not sufficient or any failure in the allocation mechanism or execution of the method could affect the randomization process53.
b) For discontinuity assignment (regression discontinuity design)
Score “YES” if:
• allocation is made based on a pre-determined discontinuity on a continuous variable (regression discontinuity design) and blinded to participants or,
• if not blinded, individuals reasonably cannot affect the assignment variable in response to knowledge of the participation decision rule;
• and the sample size immediately at both sides of the cut-off point is sufficiently large to equate groups on average.
• the interval for selection of treatment and control group is reasonably small, • or authors have weighted the matches on their distance to the cut-off point, and
the mean of the covariates of the individuals immediately at both sides of the cut-off point (selected sample of participants and non-participants) are overall not statistically different based on t-test or ANOVA for equality of means,
• or significant differences have been controlled in multivariate analysis; • and, for cluster-assignment, authors control for external cluster-level factors that
might confound the impact of the program (e.g. weather, infrastructure, community fixed effects, etc.) through multivariate analysis.
Score “UNCLEAR” if:
53 If the research has serious concerns with the validity of the randomisation process or the group equivalence completely fails, it is recommended to assess the risk of bias of the study using the relevant questions for the appropriate methods of analysis (cross-sectional regressions, difference-in-difference, etc.) rather than the RCTs questions.

125 The Campbell Collaboration | www.campbellcollaboration.org
• the assignment variable is either non-blinded or it is unclear whether participants can affect it in response to knowledge of the allocation mechanism.
• there are covariate differences across individuals at both sides of the discontinuity which have not been controlled for using multivariate analysis, or if insufficient details are provided on controls,
• or if insufficient details are provided on cluster controls.
Score “NO” if:
• the sample size is not sufficient or • there is evidence that participants altered the assignment variable prior to
assignment.
c) For identification based on an instrumental variable (IV estimation)
Score “YES” if:
• An appropriate instrumental variable is used which is exogenously generated: e.g. due to a ‘natural’ experiment or random allocation. This means there is evidence that both assumptions holds: any effect of the instrument on the outcome must occur via the effect of the instrument on the treatment (exclusion restriction) and the instrument is correlated with the variable is instrumenting.
• Following Staiger and Stock (1997) and Stock and Yogo (2005) the F-statistic in the first stage regression should exceed 1054 (or if an F test is not reported, the authors report and assess whether the R-squared (goodness of fit) of the participation equation is sufficient for appropriate identification);
• the identifying instruments are individually significant (p≤0.01); for Heckman models, the identifiers are reported and significant (p ≤0.05);
• where at least two instruments are used, the authors report on an over-identifying test (p≤0.05 is required to reject the null hypothesis of all instruments are uncorrelated with the structural error term.); and none of the covariate controls can be affected by participation and the study convincingly assesses qualitatively why the instrument only affects the outcome via participation55.
• and, for cluster-assignment, authors particularly control for external cluster-level factors that might confound the impact of the programme through multivariate analysis.
54 We will include studies where the first stage the F-statistics is below 10, but confidence intervals for the IV regression are computed following Chernozhukov and Hansen (2008) method and are statistically significant at the 95 per cent significance.
55 If the instrument is the random assignment of the treatment, the reviewer should also assess the quality and success of the randomisation procedure in part a).

126 The Campbell Collaboration | www.campbellcollaboration.org
Score “UNCLEAR” if:
• the exogeneity of the instrument is unclear (both externally as well as why the variable should not enter by itself in the outcome equation).
• relevant confounders are controlled but appropriate statistical tests are not reported or exogeneity56 of the instrument is not convincing,
• or if insufficient details are provided on cluster controls (see category f) below).
Score “NO” otherwise.
d) For assignment based non-randomised programme placement and self-selection (studies using a matching strategy or regression analysis (excluding IV), studies which apply other methods)
Score “YES” if:
• Participants and non-participants are either matched based on all relevant characteristics explaining participation and outcomes, or
• all relevant characteristics are accounted for.57 58
Score “UNCLEAR” if:
• it is not clear whether all relevant characteristics (only relevant time varying characteristics in the case of panel data regressions) are controlled.
Score “NO” if:
• relevant characteristics are omitted from the analysis.
56 An instrument is exogenous when it only affects the outcome of interest through affecting participation in the programme. Although when more than one instrument is available, statistical tests provide guidance on exogeneity (see background document), the assessment of exogeneity should be in any case done qualitatively. Indeed, complete exogeneity of the instrument is only feasible using randomised assignment in the context of an RCT with imperfect compliance, or an instrument identified in the context of a natural experiment.
57 Accounting for and matching on all relevant characteristics is usually only feasible when the programme allocation rule is known and there are no errors of targeting. It is unlikely that studies not based on randomisation or regression discontinuity can score “YES” on this criterion.
58 There are different ways in which covariates can be taken into account. Differences across groups in observable characteristics can be taken into account as covariates in the framework of a regression analysis or can be assessed by testing equality of means between groups. Differences in unobservable characteristics can be taken into account through the use of instrumental variables (see also question 1.d) or proxy variables in the framework of a regression analysis, or using a fixed effects or difference-in-differences model if the only characteristics which are unobserved are time-invariant.

127 The Campbell Collaboration | www.campbellcollaboration.org
In addition:
d1) For non-randomised trials using panel data (including DID) models,
Score “YES” if:
• the authors use a difference-in-differences (or fixed effects) multivariate estimation method;
• the authors control for a comprehensive set of time-varying characteristics; 59 • and the attrition rate is sufficiently low and similar in treatment and control, or
the study assesses that drop-outs are random draws from the sample (e.g. by examining correlation with determinants of outcomes, in both treatment and comparison groups);
• and, for cluster-assignment, authors control for external cluster-level factors that might confound the impact of the programme through multivariate analysis.
Score “UNCLEAR” if:
• insufficient details are provided, • or if insufficient details are provided on cluster controls.
Score “NO” otherwise, including if the treatment effect is estimated using raw comparison of means in statistically un-matched groups.
d2) For statistical matching studies including propensity scores (PSM) and covariate matching,60
Score “YES” if:
• matching is either on baseline characteristics or time-invariant characteristics which cannot be affected by participation in the program; and the variables used to match are relevant (e.g. demographic and socio-economic factors) to explain both participation and the outcome (so that there can be no evident differences across groups in variables that might explain outcomes) (see fn. 6).
• In addition, for PSM Rosenbaum’s test suggests the results are not sensitive to the existence of hidden bias.
59 Knowing allocation rules for the programme – or even whether the non-participants were individuals that refused to participate in the programme, as opposed to individuals that were not given the opportunity to participate in the programme – can help in the assessment of whether the covariates accounted for in the regression capture all the relevant characteristics that explain differences between treatment and comparison.
60 Matching strategies are sometimes complemented with difference-in-difference regression estimation methods. This combination approach is superior since it only uses in the estimation the common support region of the sample size, reducing the likelihood of existence of time-variant unobservable differences across groups affecting outcome of interest and removing biases arising from time-invariant unobservable characteristics.

128 The Campbell Collaboration | www.campbellcollaboration.org
• and, with the exception of Kernel matching, the means of the individual covariates are equated for treatment and comparison groups after matching;
• and, for cluster-assignment, authors control for external cluster-level factors that might confound the impact of the programme through multivariate or any appropriate analysis.
Score “UNCLEAR” if:
• relevant variables are not included in the matching equation, or if matching is based on characteristics collected at endline,
• or if insufficient details are provided on cluster controls.
Score “NO” otherwise.
d3) For regression-based studies using cross sectional data (excluding IV)
Score “YES” if:
• the study controls for relevant confounders that may be correlated with both participation and explain outcomes (e.g. demographic and socio-economic factors at individual and community level) using multivariate methods with appropriate proxies for unobservable covariates (see fn. 6),
• and a Hausman test61 with an appropriate instrument suggests there is no evidence of endogeneity,
• and none of the covariate controls can be affected by participation; • and either, only those observations in the region of common support for
participants and non-participants in terms of covariates are used, or the distributions of covariates are balanced for the entire sample population across groups;
• and, for cluster-assignment, authors control particularly for external cluster-level factors that might confound the impact of the programme through multivariate analysis.
Score “UNCLEAR” if:
• relevant confounders are controlled but appropriate proxy variables or statistical tests are not reported,
• or if insufficient details are provided on cluster controls.
61 The Hausman test explores endogeneity in the framework of regression by comparing whether the OLS and the IV approaches yield significantly different estimations. However, it plays a different role in the different methods of analysis. While in the OLS regression framework the Hausman test mainly explores endogeneity and therefore is related with the validity of the method, in IV approaches it explores whether the author has chosen the best available strategy for addressing causal attribution (since in the absence of endogeneity OLS yields more precise estimators) and therefore is more related with analysis reporting bias.

129 The Campbell Collaboration | www.campbellcollaboration.org
Score “NO” otherwise.
d4) For study designs which do not account for differences between groups using statistical methods, score “NO”.
2) Spill-overs: was the study adequately protected against performance bias?
Score “YES” if:
• the intervention is unlikely to spill-over to comparisons (e.g. participants and non- participants are geographically and/or socially separated from one another and general equilibrium effects are unlikely) 62.
Score “UNCLEAR” if:
• spill-overs are not addressed clearly.
Score “NO” if:
• allocation was at individual or household level and there are likely spill-overs within households and communities which are not controlled for in the analysis;
• or if allocation at cluster level and there are likely spill-overs to comparison clusters.
3) Selective reporting: was the study free from outcome and analysis reporting biases?
Score “YES” if:
• there is no evidence that outcomes were selectively reported (e.g. all relevant outcomes in the methods section are reported in the results section).
• authors use ‘common’ methods63 of estimation and the study does not suggest the existence of biased exploratory research methods64.
62 Contamination, that is differential receipt of other interventions affecting outcome of interest in the control or comparison group, is potentially an important threat to the correct interpretation of study results and should be addressed via PICO and study coding.
63 ‘Common methods’ refers to the use of the most credible method of analysis to address attribution given the data available.
64 A comprehensive assessment of the existence of ‘data mining’ is not feasible particularly in quasi-experimental designs where most studies do not have protocols and replication seems the only possible mechanism to examine rigorously the existence of data mining.

130 The Campbell Collaboration | www.campbellcollaboration.org
Score “NO” if:
• some important outcomes are subsequently omitted from the results or the significance and magnitude of important outcomes was not assessed.
• authors use uncommon or less rigorous estimation methods such as failure to conduct multivariate analysis for outcomes equations where it is has not been established that covariates are balanced.65
Score “UNCLEAR” otherwise.
4) Other: was the study free from other sources of bias?
Important additional sources of bias may include: concerns about blinding of outcome assessors or data analysts; concerns about blinding of beneficiaries so that expectations, rather than the intervention mechanisms, are driving results (detection bias or placebo effects) 66; concerns about courtesy bias from outcomes collected through self-reporting; concerns about coherence of results; data on the baseline collected retrospectively; information is collected using an inappropriate instrument (or a different instrument/at different time/after different follow up period in the comparison and treatment groups).
Score “YES” if:
• the reported results do not suggest any other sources of bias.
Score “UNCLEAR” if:
• other important threats to validity may be present
Score “NO” if:
• it is clear that these threats to validity are present and not controlled for.
65 For PSM and covariate matching, score “YES” if: where over 10 per cent of participants fail to be matched, sensitivity analysis is used to re-estimate results using different matching methods (Kernel Matching techniques). For matching with replacement, no single observation in the control group is matched with a large number of observations in the treatment group. Where not reported, score “UNCLEAR”. Otherwise, score “NO”.
For IV (including Heckman) models, score “YES” if: the authors test and report the results of a Hausman test for exogeneity ≤ 0 (p < 0.05 is required to reject the null hypothesis of exogeneity), the coefficient of the selectivity correction term (Rho) is significantly different from zero (p<0.05) (Heckman approach). Where not reported, score “UNCLEAR”. Otherwise, score “NO”.
For studies using multivariate regression analysis, score “YES” if: authors conduct appropriate specification tests (e.g. reporting results of multicollinearity test, testing robustness of results to the inclusion of additional variables, etc). Where not reported or not convincing, score “UNCLEAR”. Otherwise, Score “NO”.
66 All interventions may create expectations (placebo effects), which might confound causal mechanisms. In social interventions, which usually require behaviour change from participants, expectations may form an important component of the intervention, so that isolating expectation effects from other mechanisms may be less relevant.

131 The Campbell Collaboration | www.campbellcollaboration.org
APPENDIX D: DESCRIPTION OF INTERVENTIONS
Study Description of the intervention Outcomes measurement
Afridi and
Iversen (2013)
The first step in conducting the social audit is a notification with reference to
RTI (Right to Information) obligations, requesting unrestricted access to
muster rolls and other relevant MGNREGA project documents would be sent
to the relevant sub-district or mandal office (ibid.). A team, comprising state
and district auditors will, upon their arrival in the mandal headquarter, first
recruit and then, in a two-day workshop, intensively train Village Social
Auditors about MGNREGA rights and regulations, about how to conduct the
social audits and about how to obtain information under RTI legislation (ibid.).
The social audit teams will then, over a period of about a week, implement
social audits in all GPs of the mandal. In each GP, official labour expenses will
be verified by visiting labourers listed in the worksite logs (‘muster-rolls’).
Complaints by individuals, groups and the audit team are recorded and
attested using a standardised audit report template. For verification of
material expenditure, the audit team is mandated to undertake worksite
inspections. Once the audits of all GPs have been completed, a mandal level
“public hearing” to discuss the audit findings is organised with mandatory
attendance for all implementing officials. Complaints will be read out,
testimonies verified while accused officials will be given an opportunity to
defend themselves. After the “public hearing” a decision taken report (DTR) is
created by the officer presiding over the public hearing. In this report the
responsibility for each confirmed malfeasance is pinned on a programme
functionary.
The GP audit reports have two components: a standard audit report card
which records the date of the audit along with the demographic
characteristics of the GP, and more importantly, the impressions of the
audit team about process performance since the last audit including an
estimate of financial misappropriations. These impressions and
estimates are based largely on the second component of the audit report
– the list of complaints filed during the verification process by individuals,
groups of individuals or by the members of the audit team itself. These
complaints are recorded during the door-to-door verification of labour
expenditures and the visits by the technical members of the audit team
to project sites to verify expenditures on the materials component of the
MGNREGA projects. During the public hearing the responsibility for each
complaint is pinned on one or multiple MGNREGA functionaries.

132 The Campbell Collaboration | www.campbellcollaboration.org
Study Description of the intervention Outcomes measurement
Andrabi, Das
and Khwaja
(2013)
Villages were sampled from three districts: one each in the north, center and
south. Within these districts, villages were chosen randomly from among
those with at least one private school according to a 2000 census of private
schools; this frame captures the educational environment for 60 per cent of
the province’s population. In each of the three districts in the study, the
authors experimentally allocated half the villages (within district stratification)
to the group that would receive report cards. Since the report card
intervention affects the entire educational marketplace and the authors were
interested in exploring how the overall market would respond, the intervention
was carried out at the village rather than the school level. For a well-defined
market-level experiment, the authors required “closed” markets where
schools and children (including those who switch schools across years) could
be tracked over time.
In 2003, the first year of the survey, the authors completed a census of
80,000 households in the sample villages, and since 2004 the project
has conducted additional survey rounds consisting of school, teacher,
child, and parent surveys, in addition to annual testing of the same
children that were in Grade 3 in 2003. School surveys were administered
to all schools in the sample. Through these surveys the authors collected
information on infrastructure, prices and costs, as well as the availability
of other facilities in the neighborhood of the school. In addition, in every
school, they administered teacher surveys to Grade 3 teachers and the
head teacher (the head teacher questionnaire included questions on
management practices, along with other modules.). Finally, for a sample
of 10 randomly selected children in every tested grade (6,000 children),
a short questionnaire was administered to collect information on
parental literacy, family structure, and household assets. In classes with
less than 10 children, all children were chosen. The household
questionnaire, with an extended focus on education investments, was
fielded for 1,800 households in the sample villages and stratified to over-
sample students eligible by age for (the tested) Grade 3. The dataset is
matched across schools, children, and households, allowing the authors
to follow children and teachers even when they switch schools or drop
out. The 12,110 children the authors tested in the 804 public and
private schools in Grade 3 in 2004 were retested in 2005 in whatever
grade they were enrolled in at the time.
Banerjee et al.
(2010)
The evaluation took place in 280 villages in the Jaunpur district in the state of
UP, India. All three interventions adopted the same basic structure to share
The outcomes were measure through two surveys. The baseline survey
consists of 2,800 households, 316 schools, 17,533 children (ages 7–
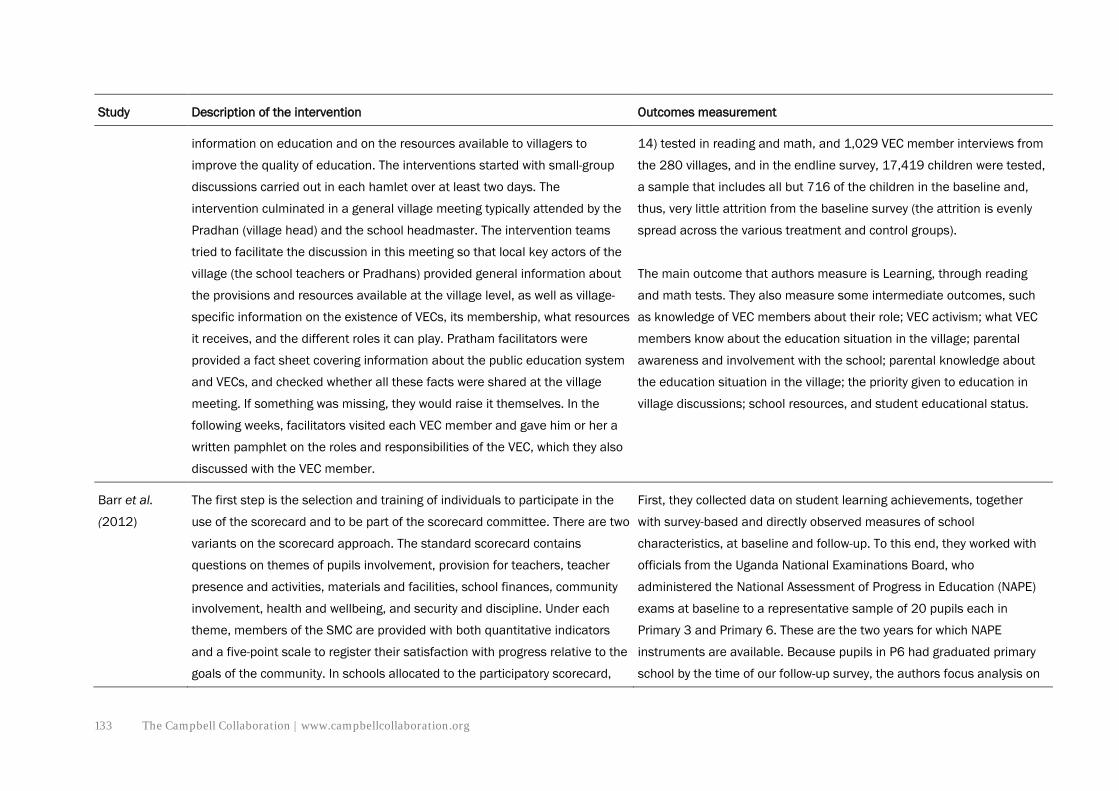
133 The Campbell Collaboration | www.campbellcollaboration.org
Study Description of the intervention Outcomes measurement
information on education and on the resources available to villagers to
improve the quality of education. The interventions started with small-group
discussions carried out in each hamlet over at least two days. The
intervention culminated in a general village meeting typically attended by the
Pradhan (village head) and the school headmaster. The intervention teams
tried to facilitate the discussion in this meeting so that local key actors of the
village (the school teachers or Pradhans) provided general information about
the provisions and resources available at the village level, as well as village-
specific information on the existence of VECs, its membership, what resources
it receives, and the different roles it can play. Pratham facilitators were
provided a fact sheet covering information about the public education system
and VECs, and checked whether all these facts were shared at the village
meeting. If something was missing, they would raise it themselves. In the
following weeks, facilitators visited each VEC member and gave him or her a
written pamphlet on the roles and responsibilities of the VEC, which they also
discussed with the VEC member.
14) tested in reading and math, and 1,029 VEC member interviews from
the 280 villages, and in the endline survey, 17,419 children were tested,
a sample that includes all but 716 of the children in the baseline and,
thus, very little attrition from the baseline survey (the attrition is evenly
spread across the various treatment and control groups).
The main outcome that authors measure is Learning, through reading
and math tests. They also measure some intermediate outcomes, such
as knowledge of VEC members about their role; VEC activism; what VEC
members know about the education situation in the village; parental
awareness and involvement with the school; parental knowledge about
the education situation in the village; the priority given to education in
village discussions; school resources, and student educational status.
Barr et al.
(2012)
The first step is the selection and training of individuals to participate in the
use of the scorecard and to be part of the scorecard committee. There are two
variants on the scorecard approach. The standard scorecard contains
questions on themes of pupils involvement, provision for teachers, teacher
presence and activities, materials and facilities, school finances, community
involvement, health and wellbeing, and security and discipline. Under each
theme, members of the SMC are provided with both quantitative indicators
and a five-point scale to register their satisfaction with progress relative to the
goals of the community. In schools allocated to the participatory scorecard,
First, they collected data on student learning achievements, together
with survey-based and directly observed measures of school
characteristics, at baseline and follow-up. To this end, they worked with
officials from the Uganda National Examinations Board, who
administered the National Assessment of Progress in Education (NAPE)
exams at baseline to a representative sample of 20 pupils each in
Primary 3 and Primary 6. These are the two years for which NAPE
instruments are available. Because pupils in P6 had graduated primary
school by the time of our follow-up survey, the authors focus analysis on

134 The Campbell Collaboration | www.campbellcollaboration.org
Study Description of the intervention Outcomes measurement
SMC members received the same training in the principles of monitoring and
the development of objectives and indicators of progress. They then were led
in the definition of their own goals and measures, starting from only a simple
framework for a scorecard. Once training was completed, the scorecard
process was carried out in the same way in both treatment arms. In each term
for the duration of the study, this process consisted of three steps. First,
members of the scorecard committee would visit the school individually at
least once during the term and complete their own copy of the scorecard.
Second, at the end of the term, there would be a reconciliation process, in
which scorecard committee members would meet, initially in small groups
according to their roles, and subsequently as a whole, in order to agree upon
a single set of scorecard results for the term and to discuss specific goals and
means for improvement in relation to this information. Third, the results of
this `consensus scorecard' would be disseminated, by sending it to the
District Education Office and by discussing it at the next parent teacher
association meeting.
the sample of Primary 3 pupils, who they tracked at follow-up. The exams
administered to each sampled student consisted of both a literacy and
numeracy component. In addition, at follow-up they conducted
unannounced visits in both treatment and control schools to measure
absenteeism; these were conducted separately from survey and testing
activities.
Björkman and
Svensson
(2009)
A set of information obtained from pre-intervention surveys, including
utilization, quality of services, and comparisons vis-à-vis other health facilities,
was assembled in report cards. Each treatment facility and its community
received a unique report card, translated into the main language spoken in
the community, summarizing the key findings from the surveys conducted in
their area. The process of disseminating the report card information, and
encouraging participation, was initiated through a series of meetings: a
community meeting; a staff meeting; and an interface meeting. Staff from
various local NGOs (CBOs) acted as facilitators in these meetings. The
Outcomes were measured through surveys addressed to health care
providers and users. Utilization/coverage was measured by the average
number of patients visiting the facility per month for out-patient care,
average number of deliveries at the facility per month, average number
of antenatal visits at the facility per month, average number of family
planning visits at the facility per month, share of visits to the project
facility of all health visits, averaged over catchment area and share of
visits to traditional healers and self-treatment of all health visits,
averaged over catchment area. Immunization was measured as the

135 The Campbell Collaboration | www.campbellcollaboration.org
Study Description of the intervention Outcomes measurement
community meeting was a two-afternoons event with approximately 100
invited participants from the community.
number of children receiving at least one dose of measles, DPT, BCG,
and Polio. Waiting time was measured as the difference between the
time the citizen left the facility and the time the citizen arrived at the
facility, subtracting the examination time.
Baseline surveys were collected in 2004, and Follow-up in 2006.
Björkman, de
Walque and
Svensson
(2013)
The first intervention was the same as described in Björkman and Svensson
(2009). The second one was similar but it did not include the information
component, it only included the meetings.
Outcomes were measured in a similar way as described in Björkman and
Svensson (2009). For the first intervention (Participation and
information) baseine surveys were collected in 2006, and endline
surveys in 2009. For the second intervention, baseline surveys were
collected in 2006, and Follow-up in early 2009.
Gertler et al.
(2008)
AGE is part of a broader school reform designed to improve the supply and
quality of education in schools in highly disadvantaged communities. The
Compensatory Programme consists of: (i) infrastructure improvement, (ii)
provision of school equipment, (iii) provision of materials for students (e.g.
notebooks, pens, etc), (iv) pedagogical training for teachers, (v) performance
based monetary incentives for teachers, and (vi) AGE. AGE finances and
support the schools’ parent associations. The monetary support varies from
$500 to $700 per year depending on school size. The use of funds is
restricted and subject to annual financial audits for a random sample of
schools. Amongst other things, the parents are not allowed to spend money
on wages and salaries for teachers. Most of the money goes to infrastructure
improvements and small civil works. In return, parents must commit to
greater involvement in school activities, participate in the infrastructure work,
Data on school level grade repetition, failure and drop out as well as
other characteristics comes from the Mexican School Census (Censo
Escolar).

136 The Campbell Collaboration | www.campbellcollaboration.org
Study Description of the intervention Outcomes measurement
and attend training sessions delivered by state educational authorities. In
these sessions, parents receive training in the management of the funds and
in participatory skills to increase their involvement in the school. Parents also
receive information on the role of the school as an educator, on the role of the
schools’ parent association, on their children educational achievements and
on how to help their children learn.
Keefer and
Khemani
(2011)
It is a sort of IC, exploting a scenario where some communes have access to
radio stations and some others have not. Variation in radio access is
exogenous, driven by the nature of media markets in northern
Benin. Community broadcasters have limited signal strength, so small
geographical differences
between villages are sufficient to yield large differences in access.
The main outcome is the proportion of children (from second grade)
tested in the village public school who could read sentences and
paragraphs. They also measure education inputs and households'
education investments. The data are from a March 2009 survey of more
than 4,000 households and 210 villages, and a literacy test given to
2,100 children in second grade (on average, eight to nine years old) in
village schools in Benin. The survey was undertaken in 32 of the 77
communes in Benin, all located in the northern part of the country
Molina
(2013b)
The SA implies to give information about the projects through the media and a
public forum, in which citizens are told about their rights and entitlements,
including the activities they can do to monitor the project and the
responsibilities of the executing firm. A group of beneficiaries composed of
interested citizens is constituted and trained to carry out community
monitoring activities. Additionally periodical public forums are held, bringing
together local authorities, neighbors, and representatives from the firm that
carries out the specific project. In these public forums, the state of the project
is explained in detail to the community, which in turn might voice its
suggestions and recommendations. Commitments are made by the firm, the
The author carries out a retrospective evaluation and uses indicators
derived from a household survey instrument about the projects. For each
project with the CVA programme he looks for similar projects without the
program, within the same sector (education, health, water and
sanitation), with similar spatial concentration of its population, similar
initial estimated timeline of the project and similar resources.
Additionally he selected projects that were carried out in a non-
contiguous community from the same municipality to guarantee same
administrative procedures and same responsible local government.
Using this methodology, he find matches for 10 CVA projects out of the

137 The Campbell Collaboration | www.campbellcollaboration.org
Study Description of the intervention Outcomes measurement
local government, and project supervisor to solve the problems that may arise
during the construction of the project. These commitments are monitored by
the community, the facilitators from the central government (DNP) and the
project supervisor. If a commitment is not honored, facilitators and
supervisors intervene to let the local government know about this. If the
problem persists, administrative complaints are submitted to the Supreme
Audit Body in the central administration. Before making the final payment to
the executing firm, the finalised project is presented to the community. The
audit results are shared with all interested and concerned stake-holders.
universe of 400 CVA projects. He expand the search for similar projects
in similar municipalities to add three additional pairs to the final sample.
Two different random samples were collected: (a) a sample of individuals
from treated and control projects that may or may not have participated
in community monitoring activities and (b) a sample of participants in the
public forums. For (a) he use a household survey of 28 infrastructure
projects, 13 of which were treated with the CVA programme and 15 were
control projects. Each project was located it in the cartographical map
and sampled randomly from the surrounding areas. The random sample
contains 30 households for all 13 projects in the treatment group and 11
in the control group. For the two CVA projects that have two controls
each, each sample contains 20 households. The total sample is 390
treated and 410 control households. For (b), the contact information
collected for each community forum for each CVA project is used. He
uses a random sample of 10 participants in each of the 13 treated
projects.
Olken (2007) In the invitations treatment, either 300 or 500 invitations were distributed
throughout the village several days prior to each of the three accountability
meetings. The village head, who normally issues written invitations for the
meetings, therefore has the potential to stack the attendance of the
accountability meeting in his favor by issuing invitations only to his
supporters. By distributing a large number of invitations, the village head’s
ability to control who attends the meeting was substantially reduced. Given
the size of a typical village, approximately one in every two households in
Corruption is measured by comparing the researcher’s estimate of what
the project actually costs to what the village reported it spent on the
project on an item by item basis. A team of engineers and surveyors was
assambled who, after the projects were completed, dug core samples in
each road to estimate the quantity of materials used, surveyed local
suppliers to estimate prices, and interviewed villagers to determine the
wages paid on the project. From these data, was constructed an
independent estimate of the amount each project actually cost to build

138 The Campbell Collaboration | www.campbellcollaboration.org
Study Description of the intervention Outcomes measurement
treatment villages received an invitation. The invitations were distributed
either by sending them home with school children or by asking the heads of
hamlets and neighborhood associations to distribute them throughout their
areas of the village. The number of invitations (300 or 500) and the method
of distributing them (schools or neighborhood heads) were randomised by
village. The purpose of these extra randomizations—the number of invitations
and how they were distributed—was to generate additional variation in the
number and composition of meeting attendees, to distinguish size effects
from composition effects.
and then compare this estimate with what the village reported it spent on
the project on a line-item by line-item basis. The difference between what
the village claimed the road cost to build and what the engineers
estimated it actually cost to build is the key measure of missing
expenditures used as outcome in the article. Since the village must
account for every rupiah it received from the central government, stolen
funds must show up somewhere in the difference between reported
expenditures and estimated actual expenditures.
In the invitations plus comment forms treatment were distributed exactly as in
the invitations treatment, but attached to the invitation was a comment form
asking villagers’ opinions of the project. The idea behind the comment form
was that villagers might be afraid of retaliation from village elites, and thus
providing an anonymous comment form would increase detection of
corruption. The form asked the recipient to answer several questions about
the road project and then to return the form—either filled out or blank—to a
sealed drop box, placed either at a village school or at a store in the
subvillage. The form had three closed-response questions (i.e., requesting
answers of the form good,satisfactory, or poor) about various aspects of the
project and two freeresponse questions, one asking about the job
performance of the implementation team and one asking about any other
project-related issues. The comment forms were collected from the drop
boxes two days before each meeting and summarised by a project

139 The Campbell Collaboration | www.campbellcollaboration.org
Study Description of the intervention Outcomes measurement
enumerator. The enumerator then read the summary, including a
representative sample of the open-response questions, at the village meeting.
Pandey et al.
(2007)
The information campaign was conducted in two rounds in each village
cluster, separated by a period of two weeks. Each round consisted of two to
three meetings, as well as distribution of posters and leaflets. Residents were
informed in advance about the dates and locations of meetings, and separate
meetings were held in low- and mid- to high-caste neighborhoods. Each
meeting lasted about an hour and consisted of a 15-minute audiotaped
presentation that was played twice, opportunities to ask questions, and
distribution of leaflets. People were notified that the information was collected
from the government and distributed in the public interest by the research
team and a nongovernmental organization based in Uttar Pradesh, Sahbhagi
Shikshan Kendra.
The outcomes were measured through two surveys. In baseline survey,
both parents from each household were asked several questions about
access to health and social services. Health services questions included
whether a nurse midwife had come to the village in the past four weeks;
whether there was a pregnant woman in the household within the past
12 months and, if so, whether she had received a prenatal examination,
tetanus shots, and prenatal supplements (iron/folic acid tablets); and
whether there was an infant younger than one year in the household and,
if so, whether he or she had received any vaccinations. Social services
questions included how many children went to primary school in the
village for the previous academic year and how much in school fees they
were charged, whether a village council meeting had occurred in the past
six months, and whether development work was performed in the village.
Baseline survey participants were interviewed again 12 months later.
Pandey, Goyal
and
Sundararaman
(2009)
The authors collaborated with the Nike Foundation [...] in the development of
campaign tools. The tools consisted of a short film of six minutes, a poster, a
wall painting, a take-home calendar and a learning assessment booklet. The
tools were the same in all states except that the information communicated
was state specific. The film, poster and calendar focused on the following
information: details of roles and responsibilities of school oversight
committees; rules for selection of members of these committees; rules for
committee meetings; number of mandatory meetings, minimum attendance
- Teacher attendance and activity. Four unannounced visits were made,
one every two or three weeks, to record attendance and activity. Activity
is a measure of whether a teacher is actively engaged in teaching when
the team arrives. It is scored one if the teacher is teaching, writing on the
board, supervising written
work, teaching by rote or another method; and scored zero if the teacher
is absent, chatting, sitting idle/standing outside classroom, keeping
order but not
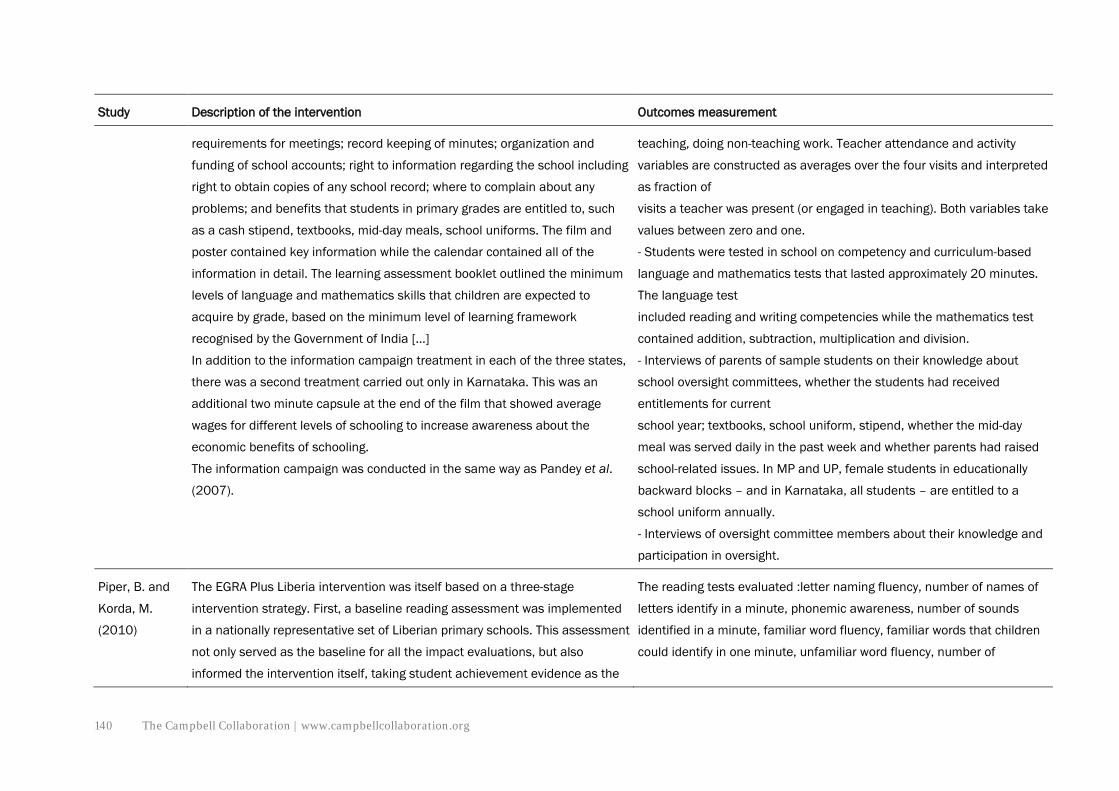
140 The Campbell Collaboration | www.campbellcollaboration.org
Study Description of the intervention Outcomes measurement
requirements for meetings; record keeping of minutes; organization and
funding of school accounts; right to information regarding the school including
right to obtain copies of any school record; where to complain about any
problems; and benefits that students in primary grades are entitled to, such
as a cash stipend, textbooks, mid-day meals, school uniforms. The film and
poster contained key information while the calendar contained all of the
information in detail. The learning assessment booklet outlined the minimum
levels of language and mathematics skills that children are expected to
acquire by grade, based on the minimum level of learning framework
recognised by the Government of India [...]
In addition to the information campaign treatment in each of the three states,
there was a second treatment carried out only in Karnataka. This was an
additional two minute capsule at the end of the film that showed average
wages for different levels of schooling to increase awareness about the
economic benefits of schooling.
The information campaign was conducted in the same way as Pandey et al.
(2007).
teaching, doing non-teaching work. Teacher attendance and activity
variables are constructed as averages over the four visits and interpreted
as fraction of
visits a teacher was present (or engaged in teaching). Both variables take
values between zero and one.
- Students were tested in school on competency and curriculum-based
language and mathematics tests that lasted approximately 20 minutes.
The language test
included reading and writing competencies while the mathematics test
contained addition, subtraction, multiplication and division.
- Interviews of parents of sample students on their knowledge about
school oversight committees, whether the students had received
entitlements for current
school year; textbooks, school uniform, stipend, whether the mid-day
meal was served daily in the past week and whether parents had raised
school-related issues. In MP and UP, female students in educationally
backward blocks – and in Karnataka, all students – are entitled to a
school uniform annually.
- Interviews of oversight committee members about their knowledge and
participation in oversight.
Piper, B. and
Korda, M.
(2010)
The EGRA Plus Liberia intervention was itself based on a three-stage
intervention strategy. First, a baseline reading assessment was implemented
in a nationally representative set of Liberian primary schools. This assessment
not only served as the baseline for all the impact evaluations, but also
informed the intervention itself, taking student achievement evidence as the
The reading tests evaluated :letter naming fluency, number of names of
letters identify in a minute, phonemic awareness, number of sounds
identified in a minute, familiar word fluency, familiar words that children
could identify in one minute, unfamiliar word fluency, number of

141 The Campbell Collaboration | www.campbellcollaboration.org
Study Description of the intervention Outcomes measurement
first step in assessing teacher training needs, and developing teacher
professional development courses to respond to the critical learning areas for
improving student achievement.
Second, RTI, in collaboration the Ministry of Education and supported by
Liberian Education Trust, implemented a teacher professional development
programme that included intensive, week-long capacity-building workshops.
These workshops gave teachers an opportunity to learn techniques for high-
quality instruction in early grade reading. Teachers also received ongoing
professional development support and regular feedback regarding their
teaching. The intervention was buttressed with activities designed to foster
community action and stakeholder participation, particularly around the
production and dissemination of EGRA findings reports at various stages in
the EGRA Plus intervention. The project also encouraged meetings between
school managers and community members.
The third major intervention activity was an additional two rounds of EGRA,
which allowed for a longitudinal research design. This design allowed
researchers and the Ministry of Education to identify whether and how the
interventions had a significant impact on student achievement, as well as
which causal mechanisms were responsible for the project’s success.
unfamiliar words indentify in one minute, reading comprehension,
listening comprehension. All of them were measured by test scores.
Pradhan et al.
(2014)
Training (T): Information campaign (IC) about different topics, such as their
lack of knowledge about the decree; and capacity, such as how to engage the
community, how to play a role in school management, and how to promote
student learning services, and village governance requirements. A two day,
district-level training attended by four school committee members (principal,
teacher, parent, and one village representative) covered planning, budgeting
The paper evaluates the effects of four treatments (grant, election,
linkage ad training) independently and combined with each other on
public primary rural schools indicators. The baseline survey took place in
January 2007, midline in April 2008, and the endline survey in October
2008. Tests in mathematics and Indonesian, designed by the Ministry,
were administered to all students in grade four at baseline and grade six

142 The Campbell Collaboration | www.campbellcollaboration.org
Study Description of the intervention Outcomes measurement
and steps the school committee could take to support education quality. The
budget session focused on a plan for spending the block grant. The training
also included a visit to a ‘model’ school committee that had been successful
in applying school-based management practices.
at endline. They matched students on the basis of student names written
on the test sheets and school ID. They were able to match 10,941
students, which is equal to 87 per cent of the tests administered at
baseline in grade four, and 88 per cent of the tests administered at
endline in grade six in the 517 schools that participated in both rounds.
Broadly, these intermediate outcomes relate to awareness of school
committees, school-based management, parent, community and teacher
inputs to education and perceptions of student learning. They
interviewed parents, teachers, students, school committee members,
and principals. Administrative data and interviewer observations on
infrastructure and teacher activities at the start of visit were also
recorded. To track the teachers of the students tested, the teacher
sample was restricted to teachers teaching grade four at baseline and
grade six at endline. They then randomly selected three students from
their classes, and these students’ parents, for interview.
Linkage (L): meetings between the school committee and the village council,
discussing potential measures to address education issues in the village. The
first facilitated meeting was between the school principal and the school
committee members to identify measures for improving education quality that
they would then propose to the village council. These measures were
discussed in a subsequent meeting with village council representatives and
other village officials, and the results of the meeting were documented in a
memorandum of understanding, signed by the head of the school committee,
the head of the village council and the school principal.
The authors also include a third treatment that we do not consider as it is not
of the type of CMI considered in this review, the intervention introduced
changes in the election of the committee. They also explore combinations of
treatments given that some individuals in the control groups for each
treatment had received the other treatments
Reinikka and
Svensson
(2011)
Towards the end of 1997, the Ugandan government began to publish
systematic public information on monthly transfers of capitation grants to
districts in the national newspapers. The newspaper campaign came in
response to evidence of extensive capture and corruption in the education
sector –in 1995 schools received on average only 24 per cent of the total
yearly capitation grant from the central government (Reinikka and Svensson,
As a measure of the entitled number of students, the paper take the
average of the number of enrolled students (in grades P1–P3 and P4–
P7) from the public expenditure tracking surveys and the number of
enrolled students according to district records.
Also derive a measure of cognitive skills from the Primary Leaving Exam
records. Standardised test scores in Math, English, Science, and Social

143 The Campbell Collaboration | www.campbellcollaboration.org
Study Description of the intervention Outcomes measurement
2004). The campaign was intended to enhance head teachers’and
parents’ability to monitor the local administration and to voice complaints if
funds did not reach the schools.
Studies aggregated into a score averaged across grade 7 students in the
school.

144 The Campbell Collaboration | www.campbellcollaboration.org
APPENDIX E: RESULTS OF CRITICAL APPRAISAL OF STUDIES
Studies to address review question 1
Study Study design
(analysis
method)
Selection bias and confounding
addressed?
Spillovers addressed? Outcome
reporting bias
addressed?
Analysis
reporting bias
addressed?
Other sources
of bias
addressed?
Overall risk
of bias
assessment
Afridi and
Iversen (2013)
Longitudinal
(DID)
Yes: to assess whether programme
implementation improves with repeated
social audits within the same mandal,
over time, while controlling for other
trends that could potentially impact the
quality of programme delivery and
corruption in the programme.
Unclear: the authors do not
mention spillovers concerns
in this article, but the
persons attending the
meetings seem to be local.
Yes: The
authors use
fixed effects to
solve part of
the problem.
Yes: different
specification
models are
reported.
Yes: No
evidence of
other bias.
Low risk
Andrabi, Das
and Khwaja
(2013)
RCT Yes: Villages were sampled from three
districts: one each in the north, center
and south. Within these districts,
villages were chosen randomly from
among those with at least one private
school according to a 2000 census of
private schools; this frame captures the
educational environment for 60 per
cent of the province’s population. In
each of the three districts in our study,
we experimentally allocated half the
villages (within district stratification) to
Yes: Using the facts that
children do not travel long
distances to school, and
villages are geographically
separated by farmland (or
forests and wasteland), the
authors were able to define
closed markets for the
purpose of the intervention
as follows.
They constructed
Yes: No
evidence of
outcome
reporting bias.
Yes: when
available,
different
measures for
the same
outcome are
reported and
different
specification
and estimation
methods are
applyed. The
Yes: No
evidence of
other bias.
Low risk

145 The Campbell Collaboration | www.campbellcollaboration.org
Study Study design
(analysis
method)
Selection bias and confounding
addressed?
Spillovers addressed? Outcome
reporting bias
addressed?
Analysis
reporting bias
addressed?
Other sources
of bias
addressed?
Overall risk
of bias
assessment
the group that would receive report
cards. Since the report card
intervention affects the entire
educational marketplace and we were
interested in exploring how the overall
market would respond, the intervention
was carried out at the village rather
than the school level. For a well-defined
market-level experiment, we required
“closed” markets where schools and
children (including those who switch
schools across years) could be tracked
over time.
boundaries around the
sampled villages that were
within a fifteen minute
walking distance from any
house in the village. All
institutions offering formal
primary education within
this boundary were covered
by our study and are
considered to be the
“village” schools.
standard
errors are
reported in all
cases.
Banerjee et al.
(2010)
RCT Yes: The evaluation took place in 280
villages in the Jaunpur district in the
state of UP, India. Districts in India are
divided into administrative blocks. In
each block, on average, there are about
100 villages. Four of these blocks were
randomly selected to participate in the
study, and the study villages were then
randomly selected within each block.
The survey and the study are thus
Unclear: Authors do not
mention the distance
between control and
treatment villages, but they
use clustering by village in
their analysis
Yes: No
evidence of
outcome
reporting bias.
Yes: The only
empirical
difficulty is that
there are a
large number
of outcomes
that could
have been
affected by the
interventions.
Yes: No
evidence of
other bias.
Low risk

146 The Campbell Collaboration | www.campbellcollaboration.org
Study Study design
(analysis
method)
Selection bias and confounding
addressed?
Spillovers addressed? Outcome
reporting bias
addressed?
Analysis
reporting bias
addressed?
Other sources
of bias
addressed?
Overall risk
of bias
assessment
representative of Jaunpur district (and
its 3.9 million population) as a whole.
Each of these interventions was
implemented in 65 villages, randomly
selected out of the 280 villages in the
baseline between September 2005 and
December 2005. A fourth group of 85
villages formed the control group.
Monitoring data suggests that the
interventions were well implemented.
All treated villages held at least one
meeting, with some holding more than
one, for a total of 215 village-level
meetings in the 195 villages.
To avoid
"cherry picking"
-emphasizing
the results that
show large
effects, the
authors
present results
on all of the
outcomes on
which they
collected data,
and calculate
the average
standardised
effect over the
family of
outcomes.
Barr et al.
(2012)
RCT Yes: The allocation was done using a
stratified random assignment, with sub-
counties used as strata to balance the
competing aims of comparability within
strata and concerns over potential for
Yes: they stratified the
sample by sub-counties
Yes: No
evidence of
outcome
reporting bias.
Yes: different
specification
and estimation
methods are
applied. The p-
Yes: No
evidence of
other bias.
Low risk

147 The Campbell Collaboration | www.campbellcollaboration.org
Study Study design
(analysis
method)
Selection bias and confounding
addressed?
Spillovers addressed? Outcome
reporting bias
addressed?
Analysis
reporting bias
addressed?
Other sources
of bias
addressed?
Overall risk
of bias
assessment
contamination across study arms. Of
five study schools per subcounty, two
were assigned to control, and the
remaining three were divided between
the two treatments. Consequently, each
district contains either seven or eight
schools of each treatment type.
values are
reported in all
cases.
Björkman and
Svensson
(2009)
RCT Yes: The experiment involved 50 public
dispensaries, and health care users in
the corresponding catchment areas, in
nine districts covering all four regions in
Uganda. For the experimental design,
the facilities were first stratified by
location (districts) and then by
population size. From each group, half
of the units were randomly assigned to
the treatment group and the remaining
25 units were assigned to the control
group.
Yes: There are reasons to
believe spillovers will not be
a serious concern. The
average (and median)
distance between the
treatment and control
facility is 30 kilometers and
in a rural setting it is
unclear to what extent
information about
improvements in treatment
facilities has spread to
control communities. The
authors do not find
evidence in favor of the
spillover hypothesis (the
Yes: No
evidence of
outcome
reporting bias.
Yes: when
available,
different
measures for
the same
outcome are
reported and
different
specification
and estimation
methods are
applyed. The
standard
errors are
reported in all
cases.
Yes: No
evidence of
other bias.
Low risk

148 The Campbell Collaboration | www.campbellcollaboration.org
Study Study design
(analysis
method)
Selection bias and confounding
addressed?
Spillovers addressed? Outcome
reporting bias
addressed?
Analysis
reporting bias
addressed?
Other sources
of bias
addressed?
Overall risk
of bias
assessment
results of the tests are
available in a supplemental
appendix).
Björkman, de
Walque and
Svensson
(2013)
RCT Yes: Of the 75 rural communities and
facilities, 50 facilities/communities
were included in the first-phase of the
project (the participation and
information intervention) and 25
facilities/communities were added in
2007 (the participation intervention).
For each intervention, the units
(facility/community) were first stratified
by location (districts) and then by
population size. From each block, half
of the units were randomly assigned to
the treatment group and the remaining
health facilities were assigned to the
control group.
Yes: although the authors
do not mention spillovers
concerns in this article, it is
a continuation of Björkman
and Svensson (2009),
where the issue is
addressed.
Yes: No
evidence of
outcome
reporting bias.
Yes: when
available,
different
measures for
the same
outcome are
reported and
different
specification
and estimation
methods are
applyed. The
standard
errors are
reported in all
cases.
Yes: No
evidence of
other bias.
Low risk
Gertler et. al.
(2008)
Longitudinal
(DID)
Yes: The paper use the phased rollout
of the AGE to identify treatment and
comparison groups, with the treatment
Unclear: there is a
probability, although we
think is low, of
Yes: The
authors use
fixed effects to
Yes: different
specification
models are
Yes: No
evidence of
other bias.
Low risk

149 The Campbell Collaboration | www.campbellcollaboration.org
Study Study design
(analysis
method)
Selection bias and confounding
addressed?
Spillovers addressed? Outcome
reporting bias
addressed?
Analysis
reporting bias
addressed?
Other sources
of bias
addressed?
Overall risk
of bias
assessment
group being schools getting AGE early
and the comparison group being those
who got AGE later.
contamination between
municipalities.
solve part of
the problem.
reported
together with
their
corresponding
p-values of
significance
tests
Keefer and
Khemani
(2011)
Quasi-
experimental
Cross-section
(regression)
Yes: The fragmentation of the Benin
radio offers a quasi natural experiment,
the authors report no statistically
significant association between village
characteristics and access to radios.
Yes: Signals from multiple
communes spill over to
villages in adjoining
communes, leading to
substantial variation in
access to neighboring
commune-based radio
across villages within the
same commune. The
authors perform several
tests to show that these
variations are uncorrelated
with village-specific
characteristics.
Unclear: the
outcome
selected is a
new type of
literacy test,
but it is not
justified the
reason for
using this
measure.
Yes: different
specification
models are
reported
together with
their
corresponding
p-values of
significance
tests
Yes: No
evidence of
other bias.
Low risk

150 The Campbell Collaboration | www.campbellcollaboration.org
Study Study design
(analysis
method)
Selection bias and confounding
addressed?
Spillovers addressed? Outcome
reporting bias
addressed?
Analysis
reporting bias
addressed?
Other sources
of bias
addressed?
Overall risk
of bias
assessment
Molina (2013) Cross
sectional
(regression)-
Matching
Yes: use a household survey of 28
infrastructure projects, 13 of which
were treated with the CVA programme
and 15 were control projects. Each
project was located it in the
cartographical map
and sampled randomly from the
surrounding areas. The random sample
contains 30 households for all 13
projects in the treatment group and 11
in the control group. For the two CVA
projects that have two controls each,
each sample contains 20 households.
The total sample is 390 treated and
410 control households. They use a
random sample of 10 participants in
each of the 13 treated projects.
Yes: for the matching, the
author selected projects
that were carried out in
non- contiguous
communities with the same
characteristics.
Yes: No
evidence of
outcome
reporting bias.
Yes: different
specification
and estimation
methods are
applied. The p-
values are
reported in all
cases. The
paper also
reports the risk
difference.
Yes: No
evidence of
other bias.
Low risk
Olken (2007) RCT Yes: randomization into the invitations
and comment form treatments was
independent of randomization into the
audit treatment. In both cases, the
treatments were announced to villages
after the project design and allocations
Yes: The author was a
concern that the audit
treatment might be likely to
spill over from one village
to another, since officials in
other villages might worry
Yes: No
evidence of
outcome
reporting bias.
Yes: are
reported three
different
specifications:
no fixed
effects, fixed
Yes: No
evidence of
other bias.
Low risk

151 The Campbell Collaboration | www.campbellcollaboration.org
Study Study design
(analysis
method)
Selection bias and confounding
addressed?
Spillovers addressed? Outcome
reporting bias
addressed?
Analysis
reporting bias
addressed?
Other sources
of bias
addressed?
Overall risk
of bias
assessment
to each village had been finalised, but
before construction or procurement of
materials began.10 Thus the choice of
what type of project to build, as well as
the project’s design and planned
budget, should all be viewed as
exogenous with respect to the
experiments.
that when the auditors
came to the subdistrict,
their villages might be
audited as well. On the
other hand, the
participation treatments
were much less likely to
have similar spillover
effects, since the treatment
was directly observable in
the different villages early
on. Therefore, the
randomization for audits
was clustered by subdistrict
(i.e., either all study villages
in a subdistrict received
audits or none did),
whereas the randomization
for invitations and
comment forms was done
village by village. The
calculations of the standard
errors are adjusted to take
effects for
each
engineering
team that
conducted
survey, and
stratum fixed
effects. The
adjusted
standard
errors are
reported in all
cases.

152 The Campbell Collaboration | www.campbellcollaboration.org
Study Study design
(analysis
method)
Selection bias and confounding
addressed?
Spillovers addressed? Outcome
reporting bias
addressed?
Analysis
reporting bias
addressed?
Other sources
of bias
addressed?
Overall risk
of bias
assessment
into account the potential
correlation of outcomes in
villages within a subdistrict.
Pandey et al.
(2007)
RCT Yes: Of the 70 districts in this state,
authors focused on 21 central, central
eastern, and southern districts in which
they have previously conducted
surveys. Districts consist of
approximately 14 blocks and each
block consists of about 65 village
clusters. From a comprehensive list of
blocks and village clusters, a random
number generator was used to
randomly select one block within each
district and then randomly select five
village clusters within each block. They
then randomly assigned districts to
intervention and control arms.
Yes: By randomly selecting
only five village clusters of
about 1000 in each district,
authors spread the
selection of 105 village
clusters over 21 districts to
minimize any potential for
contamination between
intervention and control
villages. Although the
districts were adjacent to
one another, no two blocks
were adjacent to each other
and the village clusters
were far apart. Travel
between them would be
difficult.
Yes: No
evidence of
outcome
reporting bias.
Unclear: the
study reports
the results of a
multivariate
random-effect
regression but
there is no
discussion on
the
specification
model.
No: according
to the authors,
there is a
possible recall
bias.
Low risk
Pandey, Goyal
and
RCT Yes: GPs from three states were
randomly allocated to receive or not
Yes: Treatment and control
GPs were evenly spread
Yes: No
evidence of
Unclear: the
analytical
No: some
estimates are
Medium risk

153 The Campbell Collaboration | www.campbellcollaboration.org
Study Study design
(analysis
method)
Selection bias and confounding
addressed?
Spillovers addressed? Outcome
reporting bias
addressed?
Analysis
reporting bias
addressed?
Other sources
of bias
addressed?
Overall risk
of bias
assessment
Sundararaman
(2009)
receive the information campaign. A GP
is a cluster of approximately one to
three adjacent villages and is the
smallest unit of local government. In
each state, four districts were chosen
purposefully, matched across states by
literacy rates. Within a district, 50 GPs
were selected from two randomly
chosen blocks. A random number
generator was used to randomly select
the blocks and then GPs within the
blocks. One-half of the GPs within each
block were then randomly assigned to
the intervention arm and the remaining
half to the control arm. Treatment and
control GPs were evenly spread across
the two blocks to reduce any potential
contamination between intervention
and control villages. In one state
(Karnataka) the design was identical
except an additional set of treatment
villages was added that received a
across the two blocks to
reduce any potential
contamination between
intervention and control
villages.
outcome
reporting bias.
model is not
specified
performed at
teacher's or
student's level
but the
number of
observations
is not reported

154 The Campbell Collaboration | www.campbellcollaboration.org
Study Study design
(analysis
method)
Selection bias and confounding
addressed?
Spillovers addressed? Outcome
reporting bias
addressed?
Analysis
reporting bias
addressed?
Other sources
of bias
addressed?
Overall risk
of bias
assessment
slightly different treatment called
information and advocacy campaign.
Piper and
Korda (2010)
RCT EGRA Plus: Liberia was designed as a
randomised controlled trial. Groups of
60 schools were randomly selected into
treatment, and control groups. These
groups were clustered within districts,
such that several nearby schools were
organised together.
Yes: Although the authors
do not mention spillovers
concerns in this article,
they use cluster within
districts
Yes: No
evidence of
outcome
reporting bias.
Yes, the model
is well
specified, and
they study the
correlations
between
variables
Unclear:
according to
the authors,
there is a
possible recall
bias.
Medium risk
Pradhan et al.
(2014)
RCT Yes: From the 44 sub-districts of six
districts, they selected 520 villages and
randomly selected one school from
each of these villages. The resulting
sample of 520 schools was then
stratified into three groups using their
average test scores. Within each
stratum, schools were randomly
assigned into the nine treatments and
comparison groups. They dropped
schools with extremely good or bad
average sixth grade examination scores
in mathematics or Indonesian. To
Yes: To avoid spillovers
between treatment and
comparison schools within
a village, they sampled one
school per village.
Yes: No
evidence of
outcome
reporting bias.
Unclear: the
study reports
the results but
there is no
discussion on
the
specification
model.
Yes: attrition
occurred both
in terms of
schools and
students. They
do find that
students with
lower baseline
scores have a
statistically
significantly
higher
probability of
Low risk

155 The Campbell Collaboration | www.campbellcollaboration.org
Study Study design
(analysis
method)
Selection bias and confounding
addressed?
Spillovers addressed? Outcome
reporting bias
addressed?
Analysis
reporting bias
addressed?
Other sources
of bias
addressed?
Overall risk
of bias
assessment
gauge the extent of the external validity
problem due to this selection criterion,
they checked the average scores for the
selected schools and the full sample.
The median is also not that different.
not being
matched, but
the size of the
effect is small.
They believe
that most of
the matching
problems
arise from
problems in
writing names.
Reinikka and
Svensson
(2011)
Longitudinal
(DID),
Instrumental
Variable (IV)
The identification strategy builds on two
assumptions. First, prior to 1998 –
before the government began to
systematically publish data on
disbursement –schools, ’knowledge
about the grant programme was largely
a function of own effort and ability.
Second, schools/communities closer to
a newspaper outlet will be more
exposed to information disseminated
through newspapers. Controlling for
time and school …fixed effects, our
Yes: they use a distance
variable as an instrument
for exposure, and assess its
validity.
Yes: The
authors use
fixed effects to
solve part of
the problem.
Yes: different
methodologies
are used to
check the
issue.
Yes: No
evidence of
other bias.
Low risk

156 The Campbell Collaboration | www.campbellcollaboration.org
Study Study design
(analysis
method)
Selection bias and confounding
addressed?
Spillovers addressed? Outcome
reporting bias
addressed?
Analysis
reporting bias
addressed?
Other sources
of bias
addressed?
Overall risk
of bias
assessment
strategy is thus to use distance timing
as an instrument for exposure (access
to information). We assess the validity
of this instrument procedure next.
Studies to address review question 2
Study Study design
(analysis
method)
Selection bias and confounding addressed? Spillovers addressed? Outcome
reporting bias
addressed?
Analysis
reporting bias
addressed?
Other
sources of
bias
addressed?
Overall risk of
bias
assessment
Banerjee et
al. (2007)
Descriptive
statistics using
data from the
baseline survey
of Banerjee et
al. (2010)
Yes: The evaluation took place in 280 villages in
the Jaunpur district in the state of UP, India.
Districts in India are divided into administrative
blocks. In each block, on average, there are
about 100 villages. Four of these blocks were
randomly selected to participate in the study, and
the study villages were then randomly selected
within each block. The survey and the study are
thus representative of Jaunpur district (and its
3.9 million population) as a whole.
Unclear: Authors do not
mention the distance
between control and
treatment villages, but
they use clustering by
village in their analysis
Yes: No
evidence of
outcome
reporting bias.
Yes: No
evidence of
bias
Yes: No
evidence of
other bias.
Low risk

157 The Campbell Collaboration | www.campbellcollaboration.org
Each of these interventions was implemented in
65 villages, randomly selected out of the 280
villages in the baseline between September
2005 and December 2005. A fourth group of 85
villages formed the control group.
Banerjee et.
al (2010)
RCT Yes: The evaluation took place in 280 villages in
the Jaunpur district in the state of UP, India.
Districts in India are divided into administrative
blocks. In each block, on average, there are
about 100 villages. Four of these blocks were
randomly selected to participate in the study, and
the study villages were then randomly selected
within each block. The survey and the study are
thus representative of Jaunpur district (and its
3.9 million population) as a whole.
Each of these interventions was implemented in
65 villages, randomly selected out of the 280
villages in the baseline between September
2005 and December 2005. A fourth group of 85
villages formed the control group. Monitoring
data suggests that the interventions were well
implemented. All treated villages held at least
one meeting, with some holding more than one,
for a total of 215 village-level meetings in the
195 villages.
Unclear: Authors do not
mention the distance
between control and
treatment villages, but
they use clustering by
village in their analysis
Yes: No
evidence of
outcome
reporting bias.
Yes: The only
empirical
difficulty is
that there are
a large
number of
outcomes
that could
have been
affected by
the
interventions.
To avoid
"cherry
picking" -
emphasizing
the results
that show
large effects,
the authors
present
Yes: No
evidence of
other bias.
Low risk

158 The Campbell Collaboration | www.campbellcollaboration.org
results on all
of the
outcomes on
which they
collected
data, and
calculate the
average
standardised
effect over
the family of
outcomes.
Björkman
and
Svensson
(2010)
Seemingly
unrelated
regression
system.
Yes: They use a smaller subset of the data in
Björkman and Svensson (2009).
Yes: as in Björkman and
Svensson (2009) there
are reasons to believe
spillovers will not be a
serious concern.
Yes: No
evidence of
outcome
reporting bias.
Yes: when
available,
different
measures for
the same
outcome are
reported and
different
specification
and
estimation
methods are
applyed. The
standard
Yes: No
evidence of
other bias.
Low risk

159 The Campbell Collaboration | www.campbellcollaboration.org
errors are
reported in all
cases.
Molina
(2013)
Cross sectional
(regression)-
Matching
Yes: use a household survey of 28 infrastructure
projects, 13 of which were treated with the CVA
programme and 15 were control projects. Each
project was located it in the cartographical map
and sampled randomly from the surrounding
areas. The random sample contains 30
households for all 13 projects in the treatment
group and 11 in the control group. For the two
CVA projects that have two controls each, each
sample contains 20 households. The total
sample is 390 treated and 410 control
households. They use a random sample of 10
participants in each of the 13 treated projects.
Yes: for the matching,
the author selected
projects that were
carried out in non-
contiguous
communities whith the
same characteristics.
Yes: No
evidence of
outcome
reporting bias.
Yes: different
specification
and
estimation
methods are
applied. The
p-values are
reported in all
cases. The
paper also
report the
risk
difference.
Yes: No
evidence of
other bias.
Low risk
Olken
(2004)
Descriptive
statistics and
Ordinary- least-
squares (OLS)
Yes: uses the same strategy as Olken 2007 Yes: uses the same
strategy as Olken 2007
Yes: No
evidence of
outcome
reporting bias.
Yes: No
evidence of
analysis
reporting
bias.
Yes: No
evidence of
other bias.
Low risk
Olken
(2005)
Probit model
and Ordinary-
least-squares
(OLS).
Yes: uses the same strategy as Olken 2007 Yes: uses the same
strategy as Olken 2007
Yes: analyses
how the results
of Olken
(2007) would
Yes, it reports
alternatives
Yes: No
evidence of
other bias.
Low risk

160 The Campbell Collaboration | www.campbellcollaboration.org
change by
using a
perception
measure
Olken
(2007)
RCT Yes: randomization into the invitations and
comment form treatments was independent of
randomization into the audit treatment. In both
cases, the treatments were announced to villages
after the project design and allocations to each
village had been finalised, but before
construction or procurement of materials
began.10 Thus the choice of what type of project
to build, as well as the project’s design and
planned budget, should all be viewed as
exogenous with respect to the experiments.
Yes: The autor was a
concern that the audit
treatment might be
likely to spill over from
one village to another,
since officials in other
villages might worry
that when the auditors
came to the subdistrict,
their villages might be
audited as well. On the
other hand, the
participation treatments
were much less likely to
have similar spillover
effects, since the
treatment was directly
observable in the
different villages early
on. Therefore, the
randomization for
audits was clustered by
Yes: No
evidence of
outcome
reporting bias.
Yes: are
reported
three
diferents
specifications
: no fixed
effects, fixed
effects for
each
engineering
team that
conducted
survey, and
stratum fixed
effects. The
adjusted
standard
errors are
reported in all
cases.
Yes: No
evidence of
other bias.
Low risk

161 The Campbell Collaboration | www.campbellcollaboration.org
subdistrict (i.e., either
all study villages in a
subdistrict received
audits or none did),
whereas the
randomization for
invitations and
comment forms was
done village by village.
The calculations of the
standard errors are
adjusted to take into
account the potential
correlation of outcomes
in villages within a
subdistrict.
Pandey et. al
(2007)
RCT Yes: Of the 70 districts in this state, authors
focused on 21 central, centraleastern, and
southern districts in which they have previously
conducted surveys. Districts consist of
approximately 14 blocks and each block consists
of about 65 village clusters. From a
comprehensive list of blocks and village clusters,
a random number generator was used to
randomly select one block within each district
and then randomly select five village clusters
Yes: By randomly
selecting only five
village clusters of about
1000 in each district,
authors spread the
selection of 105 village
clusters over 21
districts to minimize any
potential for
contamination between
Yes: No
evidence of
outcome
reporting bias.
Unclear: the
study reports
the results of
a multivariate
random-
effect
regression
but there is
no discussion
on the
No: according
to the
authors,
there is a
possible
recall bias.
Low risk

162 The Campbell Collaboration | www.campbellcollaboration.org
within each block. They then randomly assigned
districts to intervention and control arms.
intervention and control
villages. Although the
districts were adjacent
to one another, no two
blocks were adjacent to
each other and the
village clusters were far
apart. Travel between
them would be difficult.
specification
model.
Pradhan et.
al (2013)
RCT Yes: From the 44 sub-districts of six districts, they
selected 520 villages and randomly selected one
school from each of these villages. The resulting
sample of 520 schools was then stratified into
three groups using their average test scores.
Within each stratum, schools were randomly
assigned into the nine treatments and
comparison groups. They dropped schools with
extremely good or bad average sixth grade
examination scores in mathematics or
Indonesian. To gauge the extent of the external
validity problem due to this selection criterion,
they checked the average scores for the selected
schools and the full sample. The median is also
not that different.
Yes: To avoid spillovers
between treatment and
comparison schools
within a village, they
sampled one school per
village.
Yes: No
evidence of
outcome
reporting bias.
Unclear: the
study reports
the results
but there is
no discussion
on the
specification
model.
Yes: attrition
occurred
both in terms
of schools
and students.
They do find
that students
with lower
baseline
scores have
a statistically
significantly
higher
probability of
not being
matched, but
the size of
Low risk

163 The Campbell Collaboration | www.campbellcollaboration.org
the effect is
small. They
believe that
most of the
matching
problems
arise from
problems in
writing
names.
Singh and
Vutukuru
(2009)
Mix of
quantitative
(DID) and
qualitative
methods.
Yes: compare the performance of Karnataka, a
neighbouring state, which has not taken up social
audit, to Andhra Pradesh, in the overall
implementation of the program; and the reasons
behind the successful scale up of social audits in
Andhra Pradesh. A difference of difference
estimator was used to estimate the effect of
social audit using the person-days of work
generated and the proportion of timely payments
in mandals (sub-district level) where social audit
had been conducted and mandals where it had
not been conducted in the years 2006-07 and
2007-08.
Yes: They selected one
control mandal for each
treatment mandal,
where social audit was
not conducted in 2006-
07. The control mandal
was chosen to be in the
same district and was a
geographically adjacent
mandal. The control
mandal was chosen by
listing all the adjacent
mandals, and then
looking at the date in
which the social audit
has been conducted in
Yes: No
evidence of
outcome
reporting bias.
Yes: The
difference of
difference
estimator
was used
because it
gave us the
best chance
of
isolating the
impact of
social audits.
By comparing
the difference
in
performance
Yes: An
interstate
comparison
is actually of
little added
significance
in view of the
major
challenges
the
programme
faces in
Karnataka,
compared
with the
relative
Low risk

164 The Campbell Collaboration | www.campbellcollaboration.org
that mandal. The
control mandal was
designated as the
mandal where the
social audit had been
conducted after
September 2007. This
would imply that the
mandal had no social
audit in 2006-07 (no
treatment) and social
audit, if conducted in
the year 2007-08, had
been conducted in the
second half of the
financial year, so that
the size of the
programme in 2007/08
can be assumed to be
substantially without
the treatment.
before
and after the
social audits
between the
treated and
control
mandals and
by ensuring
that
the control
mandals are
similar in all
other aspects
to the
treatment
mandals, we
could
isolate the
impact of
social audit
on the
program.
stability and
robust growth
of the
programme
in Andhra
Pradesh.
Woodhouse
(2005)
Analysis of
identified
corruption
cases, field
Unclear, although the author exploits several
alternative sources of information
Unclear Yes: No
evidence of
outcome
reporting bias.
Unclear Yes: No
evidence of
other bias.
Medium risk

165 The Campbell Collaboration | www.campbellcollaboration.org
visits, and on-
site interviews.
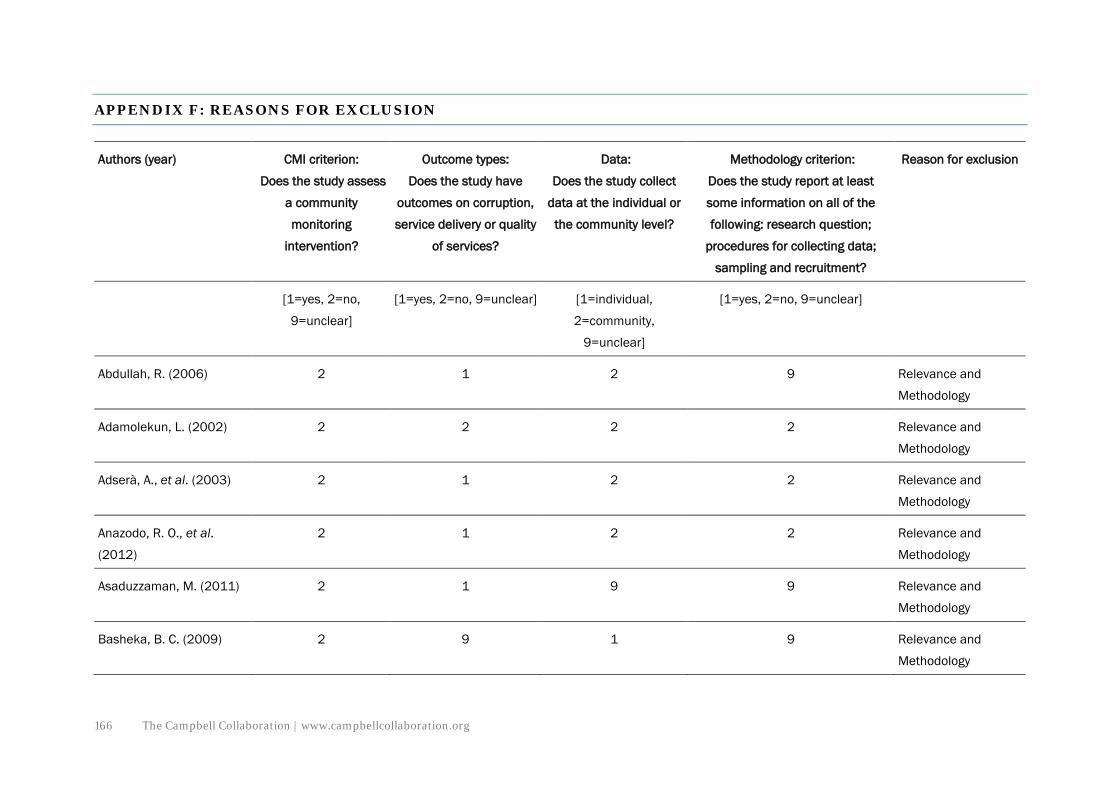
166 The Campbell Collaboration | www.campbellcollaboration.org
APPENDIX F: REASONS FOR EXCLUSION
Authors (year) CMI criterion:
Does the study assess
a community
monitoring
intervention?
Outcome types:
Does the study have
outcomes on corruption,
service delivery or quality
of services?
Data:
Does the study collect
data at the individual or
the community level?
Methodology criterion:
Does the study report at least
some information on all of the
following: research question;
procedures for collecting data;
sampling and recruitment?
Reason for exclusion
[1=yes, 2=no,
9=unclear]
[1=yes, 2=no, 9=unclear] [1=individual,
2=community,
9=unclear]
[1=yes, 2=no, 9=unclear]
Abdullah, R. (2006) 2 1 2 9 Relevance and
Methodology
Adamolekun, L. (2002) 2 2 2 2 Relevance and
Methodology
Adserà, A., et al. (2003) 2 1 2 2 Relevance and
Methodology
Anazodo, R. O., et al.
(2012)
2 1 2 2 Relevance and
Methodology
Asaduzzaman, M. (2011) 2 1 9 9 Relevance and
Methodology
Basheka, B. C. (2009) 2 9 1 9 Relevance and
Methodology

167 The Campbell Collaboration | www.campbellcollaboration.org
Authors (year) CMI criterion:
Does the study assess
a community
monitoring
intervention?
Outcome types:
Does the study have
outcomes on corruption,
service delivery or quality
of services?
Data:
Does the study collect
data at the individual or
the community level?
Methodology criterion:
Does the study report at least
some information on all of the
following: research question;
procedures for collecting data;
sampling and recruitment?
Reason for exclusion
Bassey, A. O., et al. (2013) 2 1 9 2 Relevance and
Methodology
Beasley and Huillery
(2012)
1 2 1 1 Methodology
Bhatnagar, S. C. (2002) 2 2 9 2 Relevance
Bisht, B. S. and S. Sharma
(2011)
1 2 1 1 Relevance and
Methodology
Blunt, P. (2009) 2 1 9 1 Relevance and
Methodology
Boyd, T. M. (2005) 2 1 2 9 Relevance and
Methodology
Brixi, H. (2009) 1 1 1 2 Methodology
Bussell, J. L. (2010) 2 1 9 1 Relevance
Calavan, Barr and Blair
(2009)
2 2 2 9 Relevance and
Methodology

168 The Campbell Collaboration | www.campbellcollaboration.org
Authors (year) CMI criterion:
Does the study assess
a community
monitoring
intervention?
Outcome types:
Does the study have
outcomes on corruption,
service delivery or quality
of services?
Data:
Does the study collect
data at the individual or
the community level?
Methodology criterion:
Does the study report at least
some information on all of the
following: research question;
procedures for collecting data;
sampling and recruitment?
Reason for exclusion
Cano Blandón, L. F.
(2008)
2 2 9 2 Relevance
Capuno, J. J. and M. M.
Garcia (2010)
2 2 1 1 Relevance and
Methodology
Carasciuc, L. (2001) 2 1 1 1 Relevance and
Methodology
Caseley, J. (2003) 2 9 9 9 Relevance and
Methodology
Caseley, J. (2006) 2 9 9 9 Relevance and
Methodology
Claudio, O. L. (1996) 2 9 9 9 Relevance and
Methodology
Devas, N. and U. Grant
(2003)
2 2 9 2 Relevance and
Methodology
Dibie, R. (2003) 2 9 9 9 Relevance and
Methodology

169 The Campbell Collaboration | www.campbellcollaboration.org
Authors (year) CMI criterion:
Does the study assess
a community
monitoring
intervention?
Outcome types:
Does the study have
outcomes on corruption,
service delivery or quality
of services?
Data:
Does the study collect
data at the individual or
the community level?
Methodology criterion:
Does the study report at least
some information on all of the
following: research question;
procedures for collecting data;
sampling and recruitment?
Reason for exclusion
Digman, E. R. (2006) 2 9 9 9 Relevance and
Methodology
Dorado, D. (2009). 2 2 9 9 Relevance and
Methodology
Eckardt, S. (2008) 2 9 9 1 Relevance and
Methodology
Ferraz, C. and F. Finan
(2011)
2 1 2 1 Relevance and
Methodology
Ferraz, C., et al. (2012) 2 1 2 1 Relevance and
Methodology
Francken, N., et al. (2006) 2 1 2 1 Relevance and
Methodology
Goldfrank, B. (2002) 2 9 1 9 Relevance and
Methodology
Goodspeed, T. J. (2011) 2 1 2 1 Relevance and
Methodology

170 The Campbell Collaboration | www.campbellcollaboration.org
Authors (year) CMI criterion:
Does the study assess
a community
monitoring
intervention?
Outcome types:
Does the study have
outcomes on corruption,
service delivery or quality
of services?
Data:
Does the study collect
data at the individual or
the community level?
Methodology criterion:
Does the study report at least
some information on all of the
following: research question;
procedures for collecting data;
sampling and recruitment?
Reason for exclusion
Gray-Molina, Pérez de
Rada and Yañez (1999)
2 1 1 1 Relevance and
Methodology
Hentic, I. and G. Bernier
(1999)
2 9 9 9 Relevance and
Methodology
Huss, R. (2011) 2 1 2 9 Relevance and
Methodology
Iati, I. (2007) 2 2 2 2 Relevance and
Methodology
Israr, S. M. and A. Islam
(2006)
2 9 9 9 Relevance and
Methodology
Jarquin, E. and F. Carrillo-
Flores (2000)
2 9 9 9 Relevance and
Methodology
Kakumba, U. (2010) 2 9 9 9 Relevance
Kaufmann, D., et al.
(2002)
2 1 2 1 Relevance and
Methodology
Khagram, S. (2013) 2 1 9 9 Relevance and
Methodology

171 The Campbell Collaboration | www.campbellcollaboration.org
Authors (year) CMI criterion:
Does the study assess
a community
monitoring
intervention?
Outcome types:
Does the study have
outcomes on corruption,
service delivery or quality
of services?
Data:
Does the study collect
data at the individual or
the community level?
Methodology criterion:
Does the study report at least
some information on all of the
following: research question;
procedures for collecting data;
sampling and recruitment?
Reason for exclusion
Khalid, S.-N. A. (2010) 2 9 2 1 Relevance
Kohl, B. (2003) 1 1 2 2 Methodology
Kolybashkina, N. (2009) 2 1 2 1 Relevance and
Methodology
Kubal, M. R. (2001) 2 1 2 2 Relevance and
Methodology
Kumnerdpet, W. (2010) 2 2 1 1 Relevance
Kurosaki, T. (2006) 2 2 1 1 Relevance
Lamprea, E. (2010) 2 1 2 1 Relevance and
Methodology
Lassibille et al. (2010) 1 2 1 1 Methodology
Li, L. (2001) 2 1 1 9 Relevance and
Methodology
Lieberman, Posner and
Tsai (2013)
1 2 1 1 Methodology

172 The Campbell Collaboration | www.campbellcollaboration.org
Authors (year) CMI criterion:
Does the study assess
a community
monitoring
intervention?
Outcome types:
Does the study have
outcomes on corruption,
service delivery or quality
of services?
Data:
Does the study collect
data at the individual or
the community level?
Methodology criterion:
Does the study report at least
some information on all of the
following: research question;
procedures for collecting data;
sampling and recruitment?
Reason for exclusion
Loewenson, R. (2000) 2 2 2 1 Relevance and
Methodology
Lopez, J. A. F. (2002) 2 2 2 1 Relevance and
Methodology
Lulle, T. (2004) 2 2 2 1 Relevance and
Methodology
Mackay, K. and S. Gariba
(2000)
2 1 2 1 Relevance and
Methodology
MacLean, M. J. (2005) 2 2 9 1 Relevance
MacPherson, E. (2008) 2 1 2 1 Relevance and
Methodology
Mahmood, Q., et al.
(2012)
1 2 1 1 Relevance
Mahmud, S. G., et al.
(2007)
1 2 2 1 Relevance and
Methodology
Malinowitz, S. (2006) 2 1 2 9 Relevance and
Methodology

173 The Campbell Collaboration | www.campbellcollaboration.org
Authors (year) CMI criterion:
Does the study assess
a community
monitoring
intervention?
Outcome types:
Does the study have
outcomes on corruption,
service delivery or quality
of services?
Data:
Does the study collect
data at the individual or
the community level?
Methodology criterion:
Does the study report at least
some information on all of the
following: research question;
procedures for collecting data;
sampling and recruitment?
Reason for exclusion
Manor, J. (2004) 2 2 2 2 Relevance and
Methodology
Marulanda, L. (2004) 2 2 2 1 Relevance and
Methodology
Matančević, J. (2011) 2 1 1 1 Relevance and
Methodology
Mbanaso, M. U. (1989) 2 1 2 1 Relevance and
Methodology
McAntony, T. S. (2009) 2 1 2 1 Relevance and
Methodology
McDonald, J. (2006) 2 1 2 2 Relevance and
Methodology
McNulty, S. (2013) 1 2 2 1 Relevance and
Methodology
Mela, U. A. (2009) 2 1 1 1 Relevance and
Methodology

174 The Campbell Collaboration | www.campbellcollaboration.org
Authors (year) CMI criterion:
Does the study assess
a community
monitoring
intervention?
Outcome types:
Does the study have
outcomes on corruption,
service delivery or quality
of services?
Data:
Does the study collect
data at the individual or
the community level?
Methodology criterion:
Does the study report at least
some information on all of the
following: research question;
procedures for collecting data;
sampling and recruitment?
Reason for exclusion
Miarsono, H. (2000) 2 1 1 1 Relevance and
Methodology
Mitchinson, R. (2003) 2 1 2 2 Relevance and
Methodology
Mohammadi, S. H., et al.
(2011)
2 2 1 1 Relevance and
Methodology
Mohmand, S. K. and A.
Cheema (2007)
2 1 1 9 Relevance and
Methodology
Molyneux, S., et al. (2012) 2 1 1 1 Relevance and
Methodology
Montambeault, F. c.
(2011)
2 2 1 1 Relevance
Morrison, K. M and M. M.
Singer (2006)
2 2 1 1 Relevance
Mosquera, J., et al. (2009) 2 1 1 1 Relevance
Mubangizi, B. C. (2009) 2 1 2 9 Relevance and
Methodology

175 The Campbell Collaboration | www.campbellcollaboration.org
Authors (year) CMI criterion:
Does the study assess
a community
monitoring
intervention?
Outcome types:
Does the study have
outcomes on corruption,
service delivery or quality
of services?
Data:
Does the study collect
data at the individual or
the community level?
Methodology criterion:
Does the study report at least
some information on all of the
following: research question;
procedures for collecting data;
sampling and recruitment?
Reason for exclusion
Muriisa, R. K. (2008) 2 1 2 1 Relevance and
Methodology
Muwanga, N. K. M. S.
(2000)
2 1 2 2 Relevance and
Methodology
Narayanan, S. (2010) 2 1 2 1 Relevance and
Methodology
Nengwekhulu, R. H.
(2009)
2 1 2 9 Relevance and
Methodology
Nguemegne, J. P. (2009) 2 1 9 1 Relevance and
Methodology
Nguyen, P. (2010) 2 1 1 1 Relevance and
Methodology
Nguyen, T. V. (2008)
Chapter 2
2 2 1 1 Relevance
Nsingo, S. A. M. and J. O.
Kuye (2005)
2 1 2 9 Relevance and
Methodology

176 The Campbell Collaboration | www.campbellcollaboration.org
Authors (year) CMI criterion:
Does the study assess
a community
monitoring
intervention?
Outcome types:
Does the study have
outcomes on corruption,
service delivery or quality
of services?
Data:
Does the study collect
data at the individual or
the community level?
Methodology criterion:
Does the study report at least
some information on all of the
following: research question;
procedures for collecting data;
sampling and recruitment?
Reason for exclusion
Nurick, R. (1998) 2 2 2 2 Relevance and
Methodology
O’Leary, D. (2010) 2 1 1 2 Relevance and
Methodology
OECD(2007) 2 1 2 2 Relevance and
Methodology
Ohemeng, F. L. K. (2010) 2 1 2 2 Relevance and
Methodology
Olken, B. A. and R. Pande
(2012)
2 1 2 1 Relevance and
Methodology
Olmedo, M. S. G. (2005) 2 2 2 2 Relevance and
Methodology
Olowu, D. (1985) 2 1 2 9 Relevance and
Methodology
Omar, M. (2009) 2 1 2 2 Relevance and
Methodology

177 The Campbell Collaboration | www.campbellcollaboration.org
Authors (year) CMI criterion:
Does the study assess
a community
monitoring
intervention?
Outcome types:
Does the study have
outcomes on corruption,
service delivery or quality
of services?
Data:
Does the study collect
data at the individual or
the community level?
Methodology criterion:
Does the study report at least
some information on all of the
following: research question;
procedures for collecting data;
sampling and recruitment?
Reason for exclusion
Pandey, P. (2010) 2 1 9 1 Relevance and
Methodology
Pape-Yalibat (2003) 1 2 9 2 Methodology
Paredes-Solís, S., et al.
(2011)
2 1 2 1 Relevance and
Methodology
Parker, A. N. (1998) 2 1 1 1 Relevance and
Methodology
Pascaru, M. and C. Ana
Butiu (2010)
2 2 2 1 Relevance and
Methodology
Pathak, R. D., et al. (2009) 2 1 1 2 Relevance and
Methodology
Paul, S. (2002) 2 1 1 2 Relevance and
Methodology
Payani, H. (2000) 2 1 2 2 Relevance and
Methodology
Paz Cuevas, C. (1999) 2 2 2 2 Relevance and
Methodology
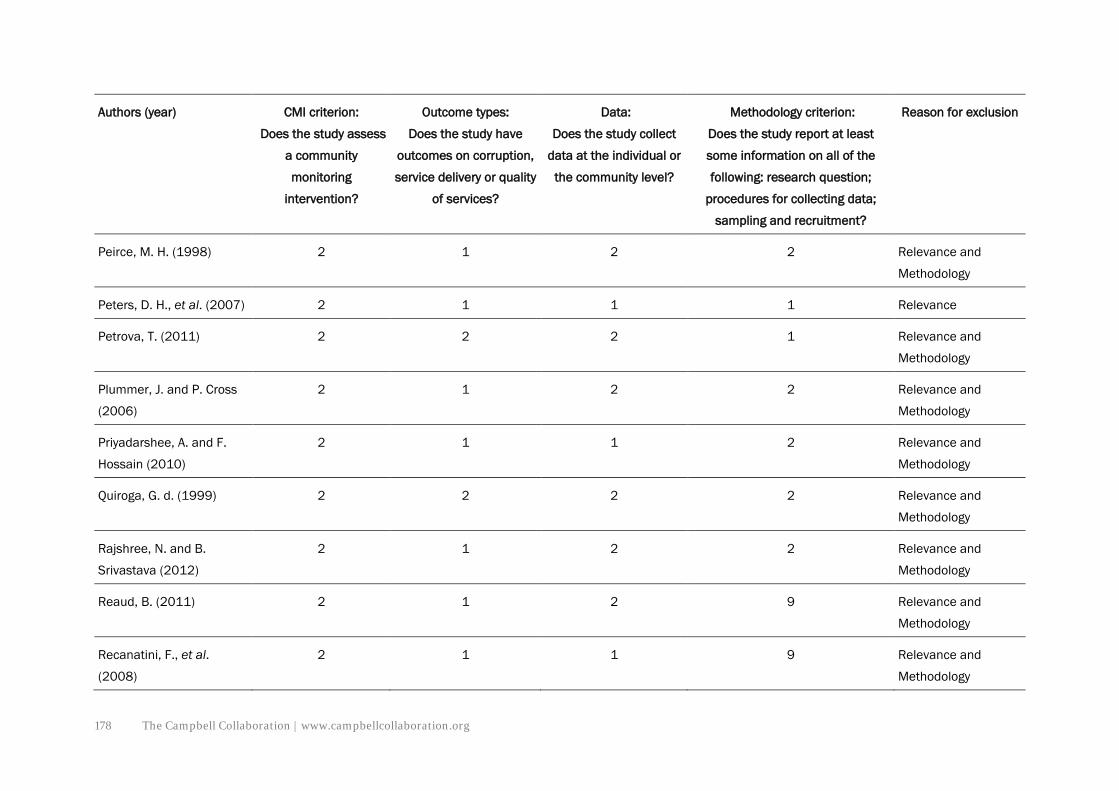
178 The Campbell Collaboration | www.campbellcollaboration.org
Authors (year) CMI criterion:
Does the study assess
a community
monitoring
intervention?
Outcome types:
Does the study have
outcomes on corruption,
service delivery or quality
of services?
Data:
Does the study collect
data at the individual or
the community level?
Methodology criterion:
Does the study report at least
some information on all of the
following: research question;
procedures for collecting data;
sampling and recruitment?
Reason for exclusion
Peirce, M. H. (1998) 2 1 2 2 Relevance and
Methodology
Peters, D. H., et al. (2007) 2 1 1 1 Relevance
Petrova, T. (2011) 2 2 2 1 Relevance and
Methodology
Plummer, J. and P. Cross
(2006)
2 1 2 2 Relevance and
Methodology
Priyadarshee, A. and F.
Hossain (2010)
2 1 1 2 Relevance and
Methodology
Quiroga, G. d. (1999) 2 2 2 2 Relevance and
Methodology
Rajshree, N. and B.
Srivastava (2012)
2 1 2 2 Relevance and
Methodology
Reaud, B. (2011) 2 1 2 9 Relevance and
Methodology
Recanatini, F., et al.
(2008)
2 1 1 9 Relevance and
Methodology
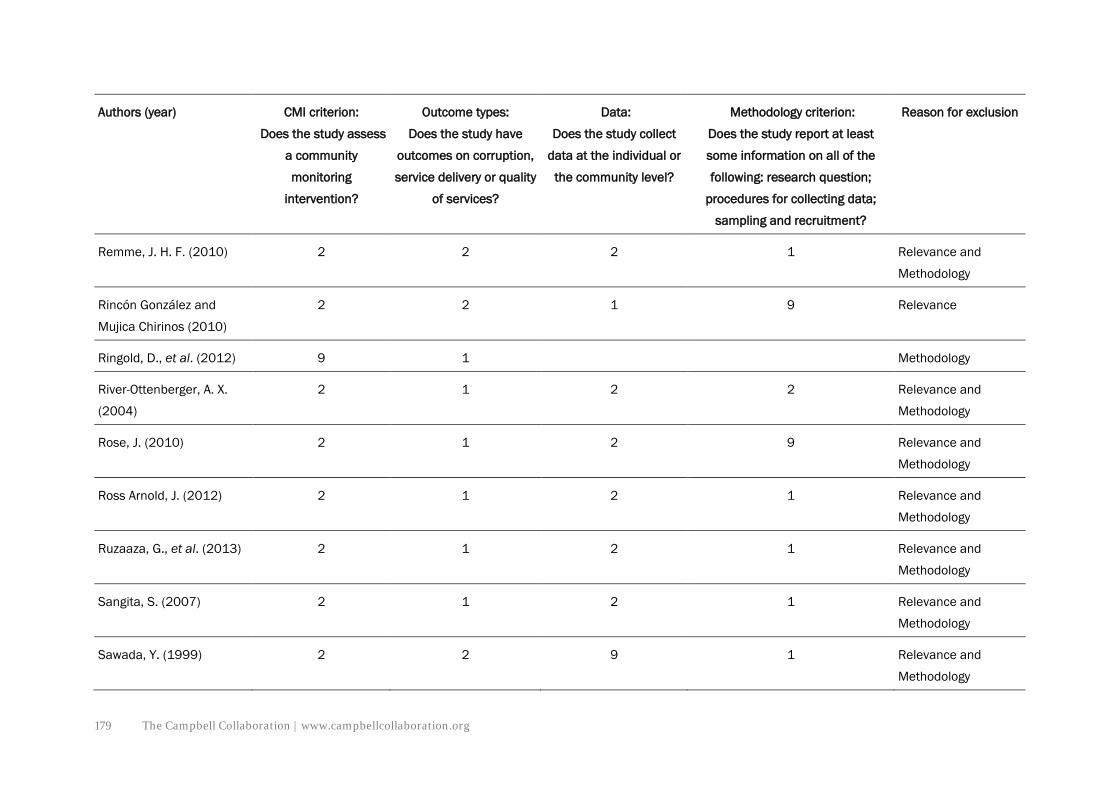
179 The Campbell Collaboration | www.campbellcollaboration.org
Authors (year) CMI criterion:
Does the study assess
a community
monitoring
intervention?
Outcome types:
Does the study have
outcomes on corruption,
service delivery or quality
of services?
Data:
Does the study collect
data at the individual or
the community level?
Methodology criterion:
Does the study report at least
some information on all of the
following: research question;
procedures for collecting data;
sampling and recruitment?
Reason for exclusion
Remme, J. H. F. (2010) 2 2 2 1 Relevance and
Methodology
Rincón González and
Mujica Chirinos (2010)
2 2 1 9 Relevance
Ringold, D., et al. (2012) 9 1 Methodology
River-Ottenberger, A. X.
(2004)
2 1 2 2 Relevance and
Methodology
Rose, J. (2010) 2 1 2 9 Relevance and
Methodology
Ross Arnold, J. (2012) 2 1 2 1 Relevance and
Methodology
Ruzaaza, G., et al. (2013) 2 1 2 1 Relevance and
Methodology
Sangita, S. (2007) 2 1 2 1 Relevance and
Methodology
Sawada, Y. (1999) 2 2 9 1 Relevance and
Methodology

180 The Campbell Collaboration | www.campbellcollaboration.org
Authors (year) CMI criterion:
Does the study assess
a community
monitoring
intervention?
Outcome types:
Does the study have
outcomes on corruption,
service delivery or quality
of services?
Data:
Does the study collect
data at the individual or
the community level?
Methodology criterion:
Does the study report at least
some information on all of the
following: research question;
procedures for collecting data;
sampling and recruitment?
Reason for exclusion
Schatz, F. (2013) 2 1 2 1 Relevance and
Methodology
Shah, A. (1999) 2 1 2 2 Relevance and
Methodology
Shah, A. (2008) 2 1 2 2 Relevance and
Methodology
Siddiquee, N. A. (2008) 2 1 2 2 Relevance and
Methodology
Singh, G., et al. (2010) 2 1 1 9 Relevance and
Methodology
Smith, J. A. and J. M.
Green (2006)
2 1 2 2 Relevance
Smulovitz, C. and E.
Peruzzotti (2000)
2 1 2 2 Relevance and
Methodology
Souza, C. (2001) 2 2 2 2 Relevance and
Methodology

181 The Campbell Collaboration | www.campbellcollaboration.org
Authors (year) CMI criterion:
Does the study assess
a community
monitoring
intervention?
Outcome types:
Does the study have
outcomes on corruption,
service delivery or quality
of services?
Data:
Does the study collect
data at the individual or
the community level?
Methodology criterion:
Does the study report at least
some information on all of the
following: research question;
procedures for collecting data;
sampling and recruitment?
Reason for exclusion
Speer, J. (2012) 2 1 1 2 Relevance and
Methodology
Stromberg, J. (1975) 2 1 2 2 Relevance and
Methodology
Subirats, J. (2000) 2 2 2 2 Relevance and
Methodology
Swindell, D. and J. M. Kelly
(2000)
2 1 9 1 Relevance and
Methodology
Tarpen, D. N. (1984) 2 1 2 2 Relevance and
Methodology
Teixeira, M. A. C. (2011) 2
2 1 1 Relevance and
Methodology
Thomas, C. J. (1996) 2 2 1 1 Relevance
Thompson, I. N. M. (2005) 1 2 1 1 Relevance
Tolosa, H. A. M. et al.
(2012)
2 2 1 1 Relevance

182 The Campbell Collaboration | www.campbellcollaboration.org
Authors (year) CMI criterion:
Does the study assess
a community
monitoring
intervention?
Outcome types:
Does the study have
outcomes on corruption,
service delivery or quality
of services?
Data:
Does the study collect
data at the individual or
the community level?
Methodology criterion:
Does the study report at least
some information on all of the
following: research question;
procedures for collecting data;
sampling and recruitment?
Reason for exclusion
Tosi, F. G. (2012) 2 1 2 2 Relevance and
Methodology
Tsai, L. L. (2005) 2 1 1 1 Relevance and
Methodology
Tshandu, Z. (2005) 2 1 2 2 Relevance and
Methodology
Tshishonga, N. (2011) 2 1 1 9 Relevance and
Methodology
Unger, J. P., et al. (2003) 2 2 1 1 Relevance
Vannier, C. N. (2010) 2 1 2 2 Relevance and
Methodology
Varatharajan, D., et al.
(2004)
2 1 1 9 Relevance and
Methodology
Vyas-Doorgapersad, S.
(2009)
2 1 2 9 Relevance and
Methodology
Wampler, B. (2008) 2 2 2 1 Relevance and
Methodology

183 The Campbell Collaboration | www.campbellcollaboration.org
Authors (year) CMI criterion:
Does the study assess
a community
monitoring
intervention?
Outcome types:
Does the study have
outcomes on corruption,
service delivery or quality
of services?
Data:
Does the study collect
data at the individual or
the community level?
Methodology criterion:
Does the study report at least
some information on all of the
following: research question;
procedures for collecting data;
sampling and recruitment?
Reason for exclusion
Yang, K. (2005) 2 2 1 1 Relevance and
Methodology
Yen, N. T. K. and P. V.
Luong (2008)
1 2 2 2 Methodology
Zafarullah, H. (1997) 2 2 2 2 Relevance and
Methodology
Zhag, X., et al. (2002) 2 1 1 2 Relevance and
Methodology

184 The Campbell Collaboration | www.campbellcollaboration.org
APPENDIX G: THE 15 INCLUDED IMPACT EVALUATIONS ASSESSING THE EFFECTS OF CMIS
Study Country Intervention
Type (and
number) of
intervention
s
Outcome data
Population/
Units
Sector Forensic
economic
estimates
corruption
Perception of
corruption
Access
to
service
Changes in
prevalence
condition
Average
waiting
time
Afridi, F.
and
Iversen, V.
(2013)
India It assesses the impact of audits on
irregularities in the implementation of
the he Mahatma Gandhi National Rural
Employment Guarantee Act (MGNREGA
2005) in Andhra Pradesh. In the
implementation of the public work
projects, ‘social’ audits have been made
mandatory. The ones responsible for
implementation of such audits are the
Gram Sabhas, meetings of the residents
of village councils. The Act thus
empowers intended beneficiaries to
scrutinize programme expenditures and
to monitor and keep track of
programme delivery.
Social audit
(Two later
rounds
compared
with the first
one)
number of
irregularities
Gram
Panchayats
(GPs)
Promotion
of
Employme
nt
Andrabi,
Das and
Pakistan It studies the impact of providing report
cards with school and child test scores
on changes in test scores, prices, and
Scorecard enrolme
nt
test score Schools and
children
Education

185 The Campbell Collaboration | www.campbellcollaboration.org
Study Country Intervention
Type (and
number) of
intervention
s
Outcome data
Population/
Units
Sector Forensic
economic
estimates
corruption
Perception of
corruption
Access
to
service
Changes in
prevalence
condition
Average
waiting
time
Khwaja
(2013)
enrolment in markets with multiple
public and private providers.
Scorecards were delivered in person in
discussion groups, during which parents
were given a sealed envelope with their
child’s report card, which they could
open and discuss with others, or with
members of the LEAPS team. Every
group started with a 30-minute open
discussion on what influences test
score results, followed by the card
distribution. The team was careful to not
offer any advice to parents or schools.
The goal of the meetings was to provide
the report cards and explain what the
information meant but not to advocate
or discuss any particular plan of action.
Banerjee et
al. (2010)
India The authors conducted a randomised
evaluation of three interventions to
Information
campaign
enrolme
nt
test score Villages Education

186 The Campbell Collaboration | www.campbellcollaboration.org
Study Country Intervention
Type (and
number) of
intervention
s
Outcome data
Population/
Units
Sector Forensic
economic
estimates
corruption
Perception of
corruption
Access
to
service
Changes in
prevalence
condition
Average
waiting
time
encourage beneficiaries’ participation to
India. Treatment 1: providing
information on existing institutions.
Teams facilitated the meeting, got
discussions going, and encouraged
village administrators to share
information about the structure and
organization of local service delivery.
After the meetings, distributed
pamphlets describing the various roles
and responsibilities of VEC members
and training of individual VEC members.
Treatment 2: training community
members in a testing tool for children. It
also provided this information and, in
addition, the teams trained community
members to administer a simple
reading test for children, and invited
them to create “report cards” on the
status of enrolment and learning in their
village. Treatment 3: training volunteers
(IC)
Treatment 1
Information
campaign
(IC)
Treatment 2
Information
campaign
(IC)
Treatment 3

187 The Campbell Collaboration | www.campbellcollaboration.org
Study Country Intervention
Type (and
number) of
intervention
s
Outcome data
Population/
Units
Sector Forensic
economic
estimates
corruption
Perception of
corruption
Access
to
service
Changes in
prevalence
condition
Average
waiting
time
to hold remedial reading camps. It
started with the team conducting
treatment 2 in the village, then
recruiting volunteers per village, and
giving them a week’s training in a
pedagogical technique for teaching
basic reading skills developed and used
by Pratham throughout India. These
trained volunteers then held reading
camps in the villages.
Barr et al.
(2012)
Uganda This paper combines field and
laboratory experimental evidence to
study the impacts and mechanisms of
community-based monitoring
interventions in rural, government
primary schools in Uganda.
Treatment 1: The first step is the
selection and training of individuals to
participate in the use of the scorecard
and to be part of the scorecard
Treatment 1:
standard
scorecard
test score Children Education
Treatment 2:
participatory
scorecard

188 The Campbell Collaboration | www.campbellcollaboration.org
Study Country Intervention
Type (and
number) of
intervention
s
Outcome data
Population/
Units
Sector Forensic
economic
estimates
corruption
Perception of
corruption
Access
to
service
Changes in
prevalence
condition
Average
waiting
time
committee. Then they visit the school
and complete the scorecard. Finally,
during a reconciliation process,
scorecard committee members would
meet, in small groups and later as a
whole, in order to agree upon a single
set of scorecard results for the term and
to discuss specific goals and means for
improvement in relation to this
information. These meetings were
facilitated by the CCTs. After, the results
of this 'consensus scorecard' would be
disseminated, by sending it to the
District Education Office and by
discussing it at the next parent teacher
association meeting.
Treatment 2: The process is the same
as the standard scorecard with the
exception that they were allow creating
their own goals and measures.

189 The Campbell Collaboration | www.campbellcollaboration.org
Study Country Intervention
Type (and
number) of
intervention
s
Outcome data
Population/
Units
Sector Forensic
economic
estimates
corruption
Perception of
corruption
Access
to
service
Changes in
prevalence
condition
Average
waiting
time
Björkman
and
Svensson
(2009)
Uganda This paper presents a randomised
…field experiment on community-based
monitoring of public primary health care
providers. Each treatment facility and its
community received a unique report
card summarizing the key findings from
pre-intervention surveys conducted in
their area, including utilization, quality
of services, and comparisons vis-à-vis
other health facilities. The process of
disseminating the report card
information and encouraging
participation was initiated through a
series of meetings: a community
meeting; a staff meeting; and an
interface meeting.
Scorecard utilizatio
n/
coverag
e,
immuniz
ation
mortality
rate, weight
for age
average
waiting
time to
get the
service
Health
facilities
and health
care users
Health
Björkman,
de Walque
and
Uganda This paper presents the results of two
field experiments on local accountability
in primary health care.
The first experiment is a longer run
Scorecard +
information
campaign
utilizatio
n
/covera
ge
mortality
rate, weight
for age
average
waiting
time to
Communitie
s/health
facilities
Health

190 The Campbell Collaboration | www.campbellcollaboration.org
Study Country Intervention
Type (and
number) of
intervention
s
Outcome data
Population/
Units
Sector Forensic
economic
estimates
corruption
Perception of
corruption
Access
to
service
Changes in
prevalence
condition
Average
waiting
time
Svensson
(2013)
version of Björkman and Svensson
(2009).
get the
service
and
households.
The second one, the participation
intervention included three types of
meetings: a community meeting; a
health facility meeting; and an interface
meeting, with representatives from the
community and the staff attending. The
objective was to encourage community
members and health facility staff to
develop a shared view on how to
improve service delivery and monitor
health provision in the community; i.e.,
to agree on a joint action plan or a
community contract. In total, the
process of reaching an agreement took
five days. After the meetings, the
communities themselves had the
responsibility to monitor the
Information
Campaign
Intervention
(IC)

191 The Campbell Collaboration | www.campbellcollaboration.org
Study Country Intervention
Type (and
number) of
intervention
s
Outcome data
Population/
Units
Sector Forensic
economic
estimates
corruption
Perception of
corruption
Access
to
service
Changes in
prevalence
condition
Average
waiting
time
implementation of the issues outlined in
the joint action plan.
Gertler et
al. (2008)
Mexico The authors examine a programme that
involves parents directly in the
management of schools located in
highly disadvantaged rural
communities. The program, known as
AGE, finances parent associations and
motivates parental participation by
involving them in the management of
the school grants.
Scorecard enrolme
nt
repetition
rate
nonindigeno
us primary
schools in
rural areas
Education
Keefer and
Khemani
(2011)
Benin This paper study the effect on literacy
rates in children in villages exposed to
signals from a larger number of
community radio stations. They
exploited the large number of very local
radio stations in north Benin to argue
that variation in radio access across
villages within the same commune is
Information
Campaign
Intervention
(IC)
test score1 Households
and children
in second
grade
Education

192 The Campbell Collaboration | www.campbellcollaboration.org
Study Country Intervention
Type (and
number) of
intervention
s
Outcome data
Population/
Units
Sector Forensic
economic
estimates
corruption
Perception of
corruption
Access
to
service
Changes in
prevalence
condition
Average
waiting
time
accidental, and exogenous to village
characteristics.
Molina
(2013b)
Colombi
a
The paper provides evidence on the
effect of social audits on citizens'
satisfaction with infrastructure projects
as well as subjective measures of the
efficiency of the execution process. The
SA implies giving information about the
projects through the media and public
forums. A group of beneficiaries
composed of interested citizens is
constituted and trained to carry out
community monitoring activities.
Commitments are made by the firm, the
local government, and project
supervisor to solve the problems that
may arise during the construction of the
project. These commitments are
monitored by the community, the
facilitators from the central government
Social audit perception of
adequacy in
the
administratio
n of
resources
Projects and
households
Infrastruct
ure

193 The Campbell Collaboration | www.campbellcollaboration.org
Study Country Intervention
Type (and
number) of
intervention
s
Outcome data
Population/
Units
Sector Forensic
economic
estimates
corruption
Perception of
corruption
Access
to
service
Changes in
prevalence
condition
Average
waiting
time
(DNP) and the project supervisor. In
between public forums, the beneficiary
group monitors the project and collects
information on whether commitments
are being honoured and any other new
problem that may arise. Before making
the final payment to the executing firm,
the finalised project is presented to the
community. The audit results are shared
with all interested and concerned stake-
holders.
Olken
(2007)
Indonesi
a
This paper presents a randomised field
experiment on reducing corruption in
village road projects. Invitations are
send to participate in Social Audits
(“accountability meetings”), to
encourage direct participation in the
monitoring process of a road project
and to reduce elite dominance of the
process. The invitations were distributed
Treatment 1:
Social Audit
-
Invitations
Per cent
missing
funds
major
items in
roads and
ancillary
projects
Villages Infrastruct
ure
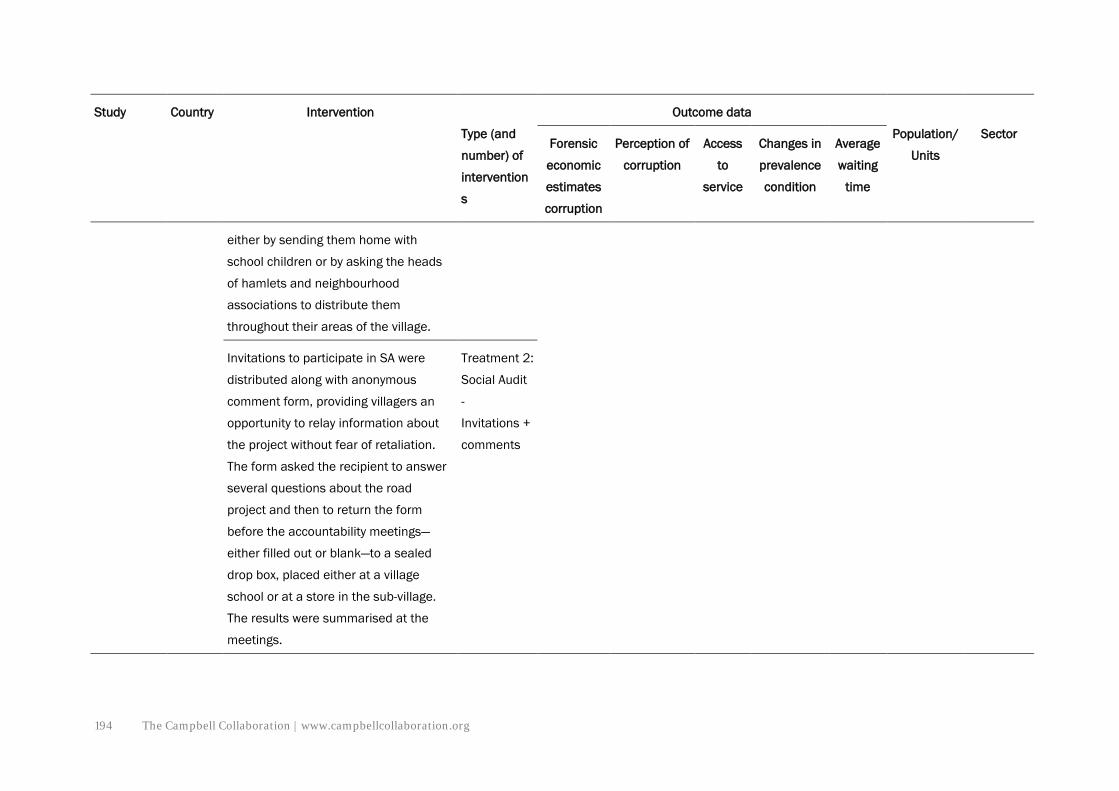
194 The Campbell Collaboration | www.campbellcollaboration.org
Study Country Intervention
Type (and
number) of
intervention
s
Outcome data
Population/
Units
Sector Forensic
economic
estimates
corruption
Perception of
corruption
Access
to
service
Changes in
prevalence
condition
Average
waiting
time
either by sending them home with
school children or by asking the heads
of hamlets and neighbourhood
associations to distribute them
throughout their areas of the village.
Invitations to participate in SA were
distributed along with anonymous
comment form, providing villagers an
opportunity to relay information about
the project without fear of retaliation.
The form asked the recipient to answer
several questions about the road
project and then to return the form
before the accountability meetings—
either filled out or blank—to a sealed
drop box, placed either at a village
school or at a store in the sub-village.
The results were summarised at the
meetings.
Treatment 2:
Social Audit
-
Invitations +
comments

195 The Campbell Collaboration | www.campbellcollaboration.org
Study Country Intervention
Type (and
number) of
intervention
s
Outcome data
Population/
Units
Sector Forensic
economic
estimates
corruption
Perception of
corruption
Access
to
service
Changes in
prevalence
condition
Average
waiting
time
Pandey et
al. (2007)
India The objective of the paper is to
determine the impact of informing
resource-poor rural populations about
entitled services. An information
campaign was conducted
consisting in two rounds of two or three
public meetings in each intervention
village, plus the distribution of posters
and leaflets to disseminate information
on entitled health services, entitled
education services, and village
governance requirements.
Information
campaign
(IC)
development
work in
villages
Visits by
nurse
midwife;
prenatal
examina
tions,
tetanus
vaccinat
ions,
and
prenatal
supplem
ents
received
by
pregnan
t
women;
vaccinat
ions
received
Households Health

196 The Campbell Collaboration | www.campbellcollaboration.org
Study Country Intervention
Type (and
number) of
intervention
s
Outcome data
Population/
Units
Sector Forensic
economic
estimates
corruption
Perception of
corruption
Access
to
service
Changes in
prevalence
condition
Average
waiting
time
by
infants.
Pandey,
Goyal and
Sundarara
man (2009)
India This study evaluates the impact of a
community-based information campaign
on school performance. The
IC consisted in the development of
tools such as a short film of six minutes,
a poster, a wall painting, a take-home
calendar and a learning assessment
booklet focused on information about
school oversight committees;
organization and funding of school
accounts; right to information regarding
the school including right to obtain
copies of any school record; where to
complain about any problems; benefits
that students in primary grades are
entitled to and minimum levels of
language and mathematics skills that
children are expected to acquire by
Treatment 1:
Information
campaign
(IC)
test score1 Teacher and
students in
villages.
Education
Treatment 2:
Additional IC
in one of the
regions

197 The Campbell Collaboration | www.campbellcollaboration.org
Study Country Intervention
Type (and
number) of
intervention
s
Outcome data
Population/
Units
Sector Forensic
economic
estimates
corruption
Perception of
corruption
Access
to
service
Changes in
prevalence
condition
Average
waiting
time
grade. In addition, there was a second
treatment carried out only in one of the
three regions involved on the first one to
increase awareness about the
economic benefits of schooling. It also
advocated the audience to become
involved in monitoring outcomes in the
school.
Piper and
Korda
(2010)
Liberia The authors study a targeted reading
intervention
focused on improving the quality of
reading instruction in primary schools
and its impact on student achievement.
The control group did not receive any
interventions. In the treatment group,
reading levels were assessed; teachers
were
trained on how to continually assess
student performance; teachers were
provided frequent school-based
Information
campaign
test score Schools Education

198 The Campbell Collaboration | www.campbellcollaboration.org
Study Country Intervention
Type (and
number) of
intervention
s
Outcome data
Population/
Units
Sector Forensic
economic
estimates
corruption
Perception of
corruption
Access
to
service
Changes in
prevalence
condition
Average
waiting
time
pedagogic support, resource materials,
and books; and, in addition, parents
and communities were informed of
student performance.
Pradhan et
al. (2014)
Indonesi
a
This paper investigates the role of
school committees in improving
education quality in public schools in
Indonesia. Two of the interventions, are
CMI:
Training: IC about different topics, such
as their lack of knowledge about the
decree; and capacity, such as how to
engage the community, how to play a
role in school management, and how to
promote student learning, services, and
village governance requirements.
Treatment 1:
Training.
Information
Campaign
(IC)
test score
Schools Education
Linkage: IC with facilitated contact with
providers: meetings between the school
committee and the village council,
Treatment 2:
Linkage:
Information
Campaign

199 The Campbell Collaboration | www.campbellcollaboration.org
Study Country Intervention
Type (and
number) of
intervention
s
Outcome data
Population/
Units
Sector Forensic
economic
estimates
corruption
Perception of
corruption
Access
to
service
Changes in
prevalence
condition
Average
waiting
time
discussing potential measures to
address education issues in the village.
Reinikka
and
Svensson
(2011)
Uganda This paper exploits an information
campaign done by the government. The
government published systematic public
information on monthly transfers of
capitation grants to districts in the
national newspapers.
Information
campaign
(IC)
Share of
grants
received
enrolme
nt
test score Schools Education
Notes:
1 We had to exclude these papers from the meta-analysis for lack of information. See Table 18
APPENDIX H: CITIZENS’ PARTICIPATION – POTENTIAL RELEVANT VARIABLES
Study Variable definition Effect of the Intervention on Participation
Effect of the Intervention on Service Provision
Suggested Reason for these Results
Banerjee et al.(2010) - Mobilization
Number of school inspections reported, Visited school to monitor or complain, Parents visit the school
0 0 Expectations about providers

200 The Campbell Collaboration | www.campbellcollaboration.org
Study Variable definition Effect of the Intervention on Participation
Effect of the Intervention on Service Provision
Suggested Reason for these Results
Banerjee et al. (2010) - Mobilization + information
Number of school inspections reported, Visited school to monitor or complain, Parents visit the school
0 0 Expectations about providers
Banerjee et al. (2010) - Mobilization + information + "Read India"
Number of school inspections reported, Visited school to monitor or complain, Parents visit the school
0/+ 0/+ Expectations about providers
Molina (2013b) Citizen Participation in the public forums and time spent monitoring service provision
Mixed. In projects where participation was higher, treatment effect was also
higher
+/- Information asymmetry and expectations about providers
Olken (2007) - Invitations Measures of participation (Attendance, Attendance of Non-elite, Number who talk, Number non-elite who talk)
+ 0/+ Elite Capture
Olken (2007) - Invitations + comments
Measures of participation (Attendance, Attendance of Non-elite, Number who talk, Number non-elite who talk)
+ 0/+ Elite Capture
Pandey et al. (2007) Percentage of household reporting that have had village council meetings in the previous six months
0/+ 0/+ Idiosyncratic Reasons related to context
Pradhan et al. (2014) - Linkage
Number of times parents come to school to meet a teacher, meetings between principal and teachers, meeting with school committee.
0/+ 0/+ Expectations about providers
Pradhan et al. (2014) - Training
Number of times parents come to school to meet a teacher, meetings between principal and teachers, meeting with school committee.
0 0 Expectations about providers

201 The Campbell Collaboration | www.campbellcollaboration.org
Study Variable definition Effect of the Intervention on Participation
Effect of the Intervention on Service Provision
Suggested Reason for these Results
Notes: 0 = No significant effect; + Positive effect; +/- Mixed effects.

202 The Campbell Collaboration | www.campbellcollaboration.org
APPENDIX I: PROVIDERS’ AND POLITICIANS’ PERFORMANCE OUTCOME VARIABLES
Provider's and Politician's (PP) performance
Study Variable definition Effect of the Intervention on Suggested Reason for
these Results Monitoring PP
performance
Service
Provision
Andrabi, Das and Khwaja (2013) Whether the school spent money on teaching aids (textbooks),
whether the class teacher for the tested school went from
below matric to above matric qualification and changes in
school schedule (break/recess time)
+ + + Parents' pressure for
improving schools'
investments
Banerjee et al. (2010) -
Mobilization
Textbooks, indoor classes, seats, maps, charts, boundary wall,
electricity, water, toilet
0 0 0 Low Participation
Banerjee et al. (2010) -
Mobilization + information
Textbooks, indoor classes, seats, maps, charts, boundary wall,
electricity, water, toilet
0 0 0 Low Participation
Banerjee et al. (2010) -
Mobilization + information + "Read
India"
Textbooks, indoor classes, seats, maps, charts, boundary wall,
electricity, water, toilet
0/+ 0 0/+ Low Participation
Way of influencing
learning outcomes
without engaging with
the school system
Barr et al. (2012) - Standard
scorecard
Teacher presence rates 0 0 0 Low Participation

203 The Campbell Collaboration | www.campbellcollaboration.org
Barr et al. (2012) - Participatory
scorecard
Teacher presence rates + + + Intrinsic Motivation
Björkman and Svensson (2009) -
Short term
Absence rate, equipment used, management of clinic (first
component from a principal components analysis of the
variables Condition of the floors of the health clinic, Condition
of the walls, Condition of furniture, and Smell of the facility),
health information (whether the household has received
information about the importance of visiting the health facility
and the danger of self-treatment; importance of family
planning (whether the household has received information
about family planning, and share of months in 2005 in which
stock-cards indicated no availability of drugs.
No info + + Intrinsic Motivation
Björkman and Svensson (2009) -
Medium term
Absence rate, equipment used, condition of clinic (first
component from a principal components analysis of the
variables Condition of the floors of the health clinic, Condition
of the walls, Condition of furniture, and Smell of the facility)
and share of months in 2009 in which stock-cards indicated
no availability of drugs.
No info 0 0/+ Intrinsic motivation
Hard to institute
permanent changes in
behaviour
Björkman, de Walque and
Svensson (2013) - Short term
Absence rate, equipment used, condition of clinic (first
component from a principal components analysis of the
variables Condition of the floors of the health clinic, Condition
of the walls, Condition of furniture, and Smell of the facility)
and share of months in 2009 in which stock-cards indicated
no availability of drugs.
No info 0 0 Lack of information
difficults providers'
accountability

204 The Campbell Collaboration | www.campbellcollaboration.org
Keefer and Khemani (2011) Share of teachers that are absent, average pupil-teacher ratio
across classrooms, number of available textbooks per enrolled
pupil, proportion of active classrooms with teachers and level
of PTA activity.
No info 0 0/+ Increase in private
tutors
Molina (2013b) Providers and politicians performance 0/+ 0/+ 0/+ Citizens participation in
monitoring providers
Pradhan et al. (2014) - Linkage Number of teachers and their work effort (hours worked per
day in past week on teaching activities)
0/+ 0/+ 0/+ Intrinsic Motivation
Pradhan et al. (2014) - Training Number of teachers and their work effort (hours worked per
day in past week on teaching activities)
0 0 0 Low participation
Notes: 0 = No significant effect; + Positive effect; +/- Mixed effects.

The Campbell [email protected]: (+47) 23 25 50 00
Mailing address: P.O. Box 4004, NydalenN-0403 Oslo, Norway
Visiting address: Pilestredet Park 7(Entrance from Stensberggata)
Website:www.campbellcollaboration.org

The Campbell [email protected]: (+47) 23 25 50 00
Mailing address: P.O. Box 4004, NydalenN-0403 Oslo, Norway
Visiting address: Pilestredet Park 7(Entrance from Stensberggata)
Website:www.campbellcollaboration.org
About this review
Corruption and inefficient allocation of resources in service delivery are widespread in low- and middle-income countries. Community monitoring interventions (CMIs) are intended to address this problem. The community is given the opportunity to participate in monitoring ser-vice delivery: observing and assessing providers’ performance to provide feedback to providers and politicians.
This review assesses the evidence on the effects of community monitoring interventions on corruption and access and quality of service delivery outcomes. The review also considers the mechanism through which CMIs effect a change in corruption and service delivery outcomes, and possible moderating factors such as geographic region, income level or length of exposure to interventions.


![[David Campbell, David Campbell] Promoting Participation](https://img.pdfslide.net/doc/110x75/577c83a61a28abe054b5a6fa/david-campbell-david-campbell-promoting-participation.jpg)