Embed Size (px)
Citation preview

Systemic Safety Analysis
Chad Polk and Joseph Santos
Goals
• Illustrate the value in a “comprehensive” safety program
• Raise awareness of the systemic process and how it can be one component in a comprehensive safety program
• Make you think

Show of Hands…
• Who here has heard of systemic safety?
• Who has used the systemic safety process or implemented recommendations from a systemic process?
What is Systemic Safety?
• “the process of evaluating an entire system using a defined set of criteria to identify candidate locations for safetyinvestments to reduce the occurrence of and the potential for severe crashes”
FHWA Systemic Safety Project Selection Tool
• Project Selected Based on Risk

Risk Discussion• 2-lane undivided
• Rural typical section
• DS=50
Curve #1
Radius = 500’
Superelevation (e) = 8.0%
Curve #2
Radius = 550’
Superelevation (e) = 8.5%
Which is safer?
Design Criteria -> Rmin = 716’,
emax = 10%
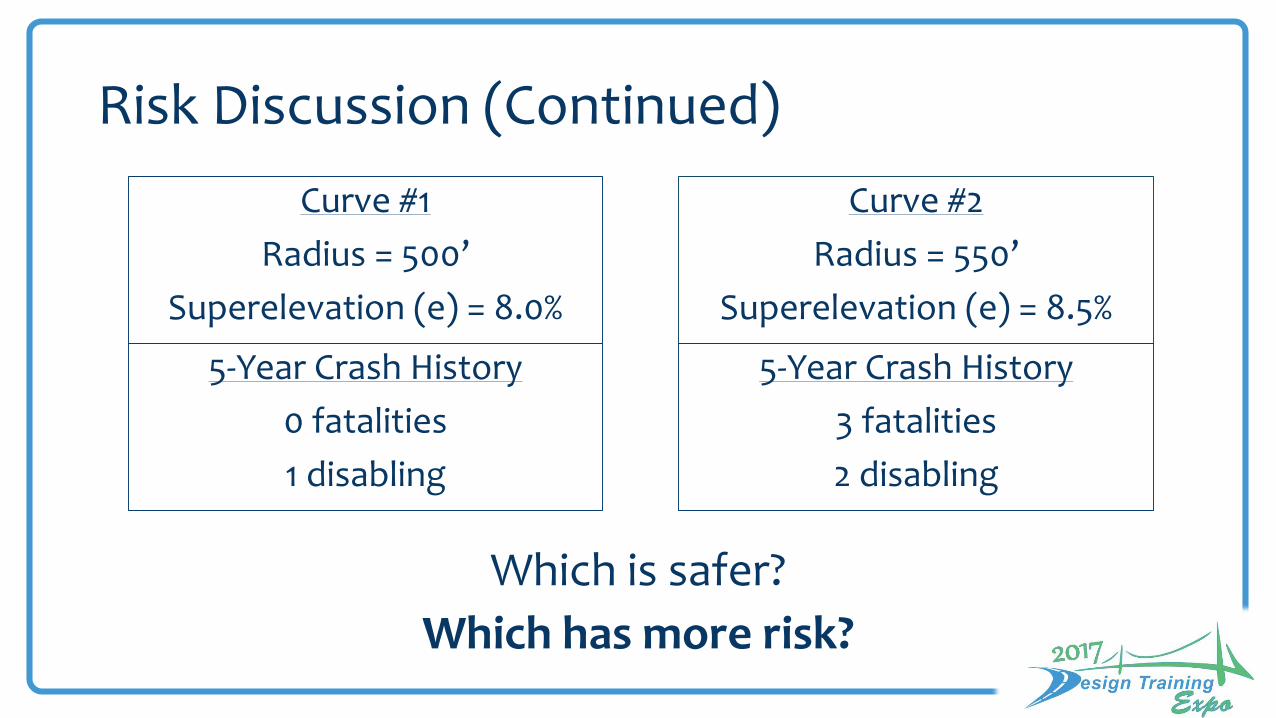
Risk Discussion (Continued)
Curve #1
Radius = 500’
Superelevation (e) = 8.0%
Curve #2
Radius = 550’
Superelevation (e) = 8.5%
5-Year Crash History
0 fatalities
1 disabling
5-Year Crash History
3 fatalities
2 disabling
Which is safer?
Which has more risk?
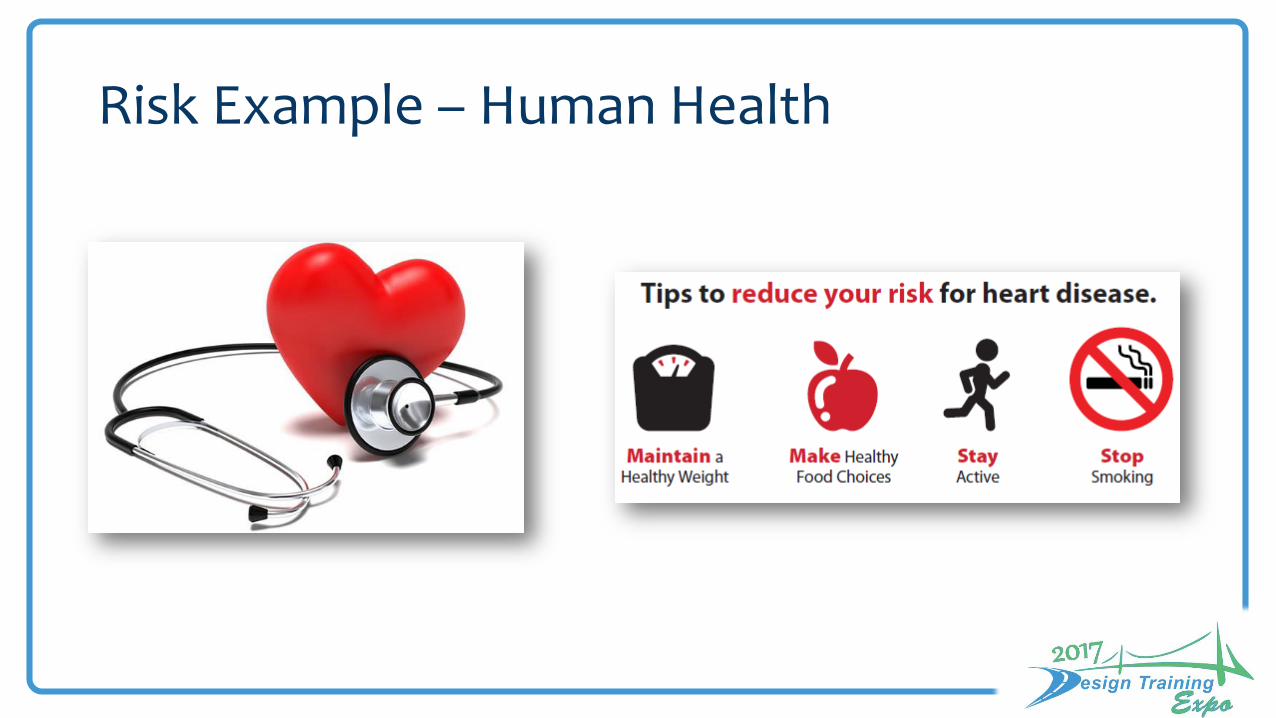
Risk Example – Human Health
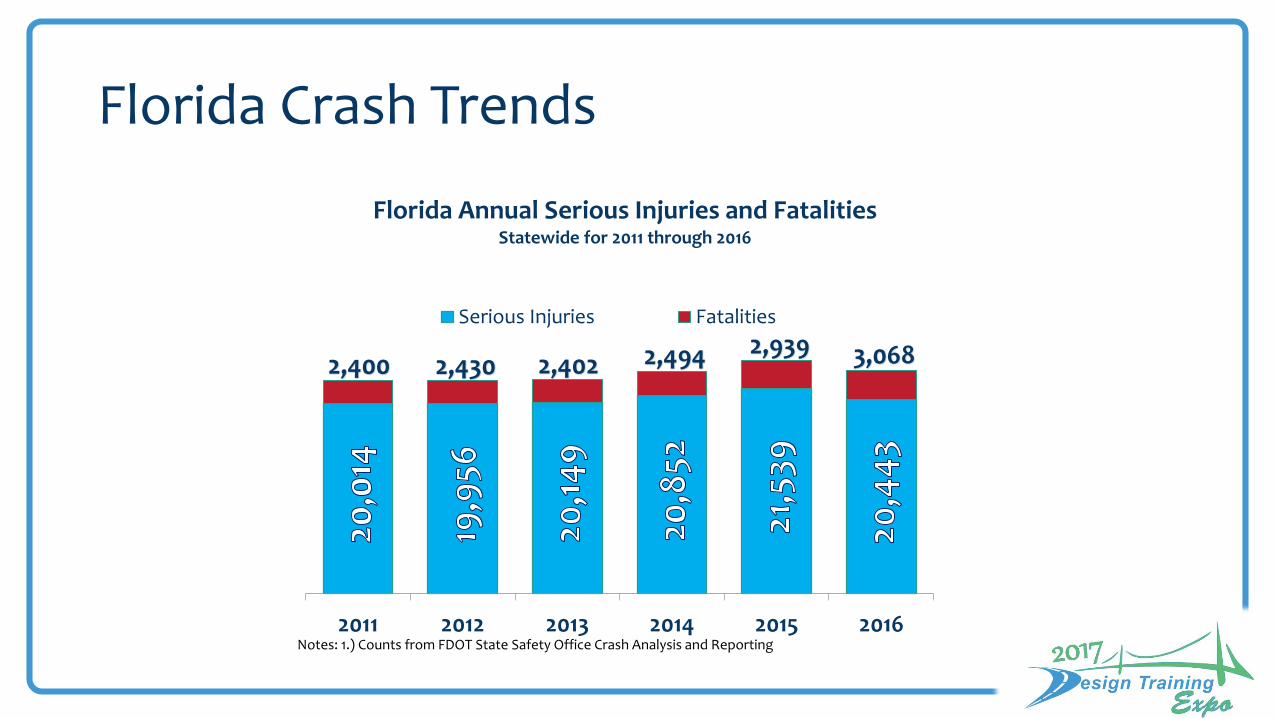
Florida Crash Trends
2,400 2,430 2,402 2,494 2,939 3,068
2011 2012 2013 2014 2015 2016
Florida Annual Serious Injuries and FatalitiesStatewide for 2011 through 2016
Serious Injuries Fatalities
Notes: 1.) Counts from FDOT State Safety Office Crash Analysis and Reporting
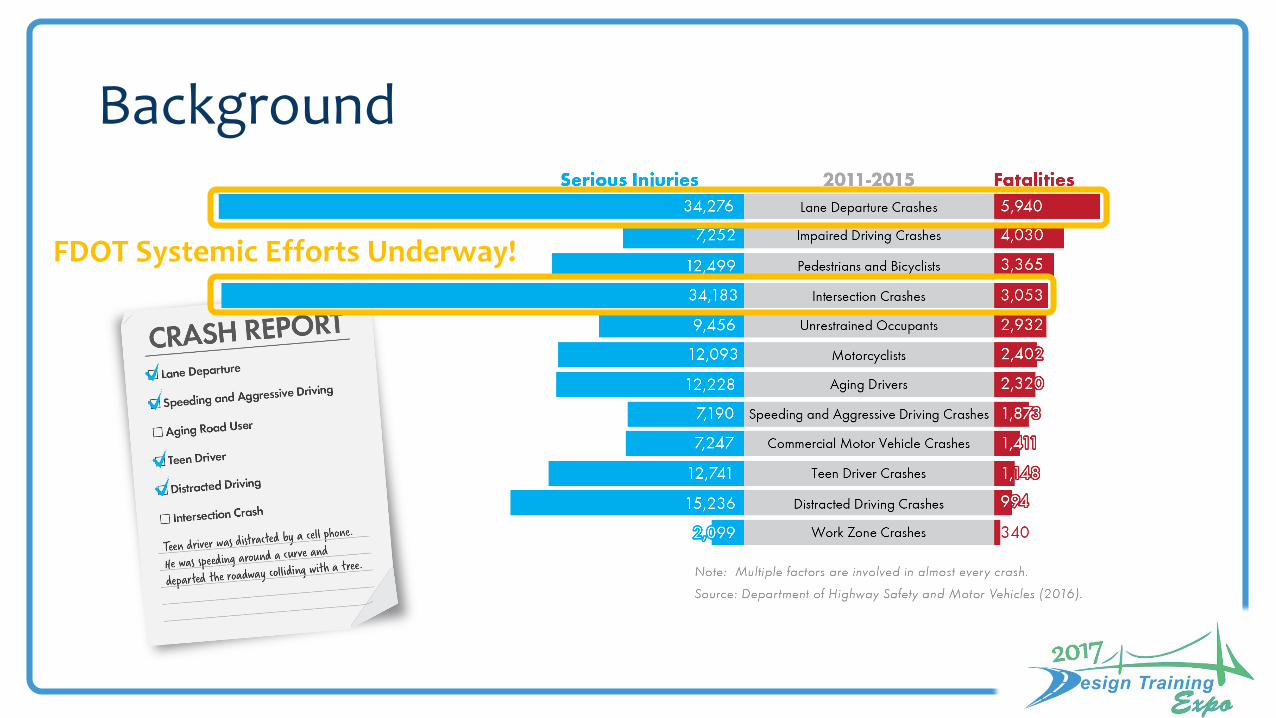
Background
FDOT Systemic Efforts Underway!
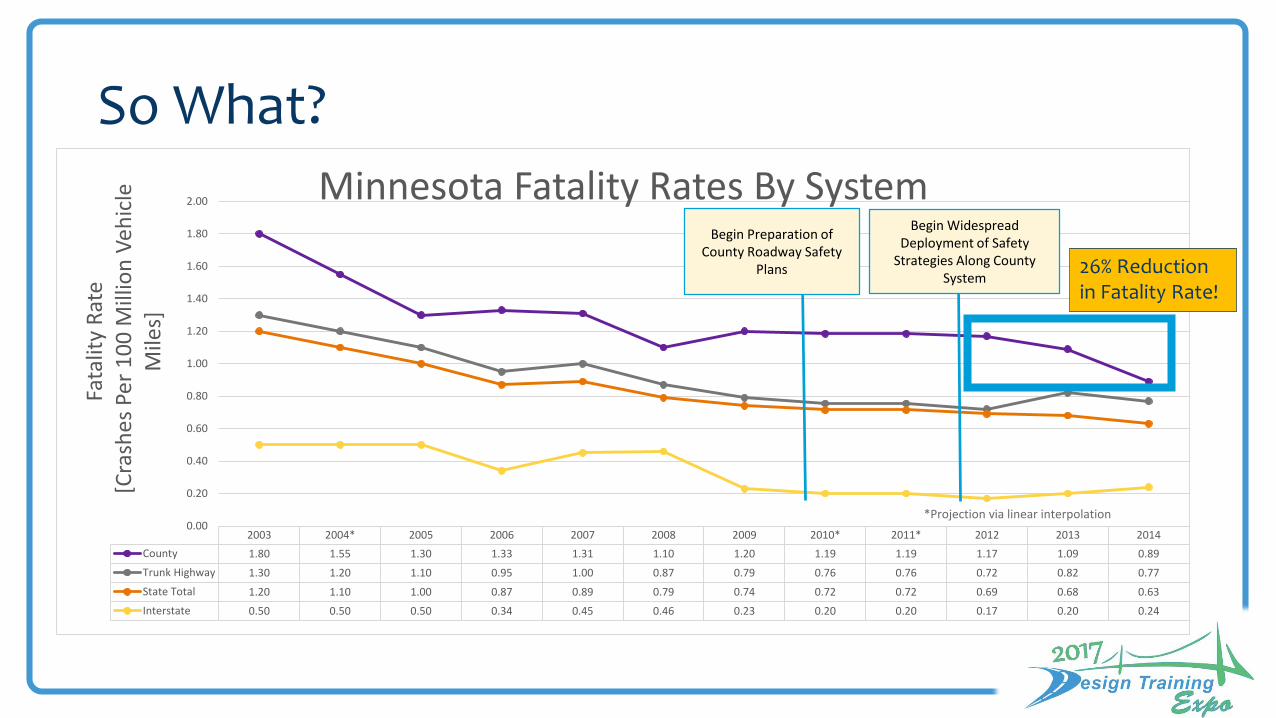
So What?
2003 2004* 2005 2006 2007 2008 2009 2010* 2011* 2012 2013 2014
County 1.80 1.55 1.30 1.33 1.31 1.10 1.20 1.19 1.19 1.17 1.09 0.89
Trunk Highway 1.30 1.20 1.10 0.95 1.00 0.87 0.79 0.76 0.76 0.72 0.82 0.77
State Total 1.20 1.10 1.00 0.87 0.89 0.79 0.74 0.72 0.72 0.69 0.68 0.63
Interstate 0.50 0.50 0.50 0.34 0.45 0.46 0.23 0.20 0.20 0.17 0.20 0.24
0.00
0.20
0.40
0.60
0.80
1.00
1.20
1.40
1.60
1.80
2.00
Fata
lity
Rat
e[C
rash
es
Per
10
0 M
illio
n V
ehic
le
Mile
s]
Minnesota Fatality Rates By SystemBegin Preparation of
County Roadway Safety Plans
Begin WidespreadDeployment of Safety
Strategies Along County System
*Projection via linear interpolation
26% Reduction in Fatality Rate!
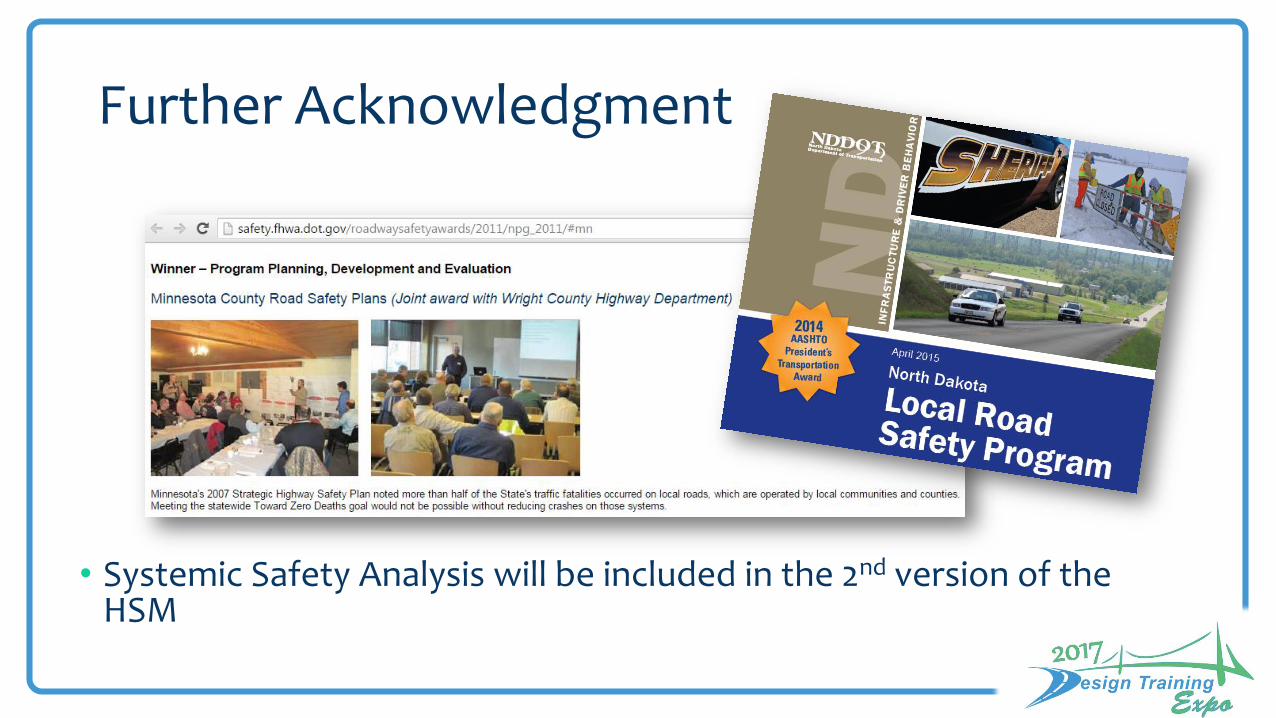
Further Acknowledgment
• Systemic Safety Analysis will be included in the 2nd version of the HSM

Where Can Systemic be Applied
• Vehicles – rural, urban, etc.
• Pedestrians
• Railroad Crossings
• FDOT – Lane Departure and Intersections
• Other?
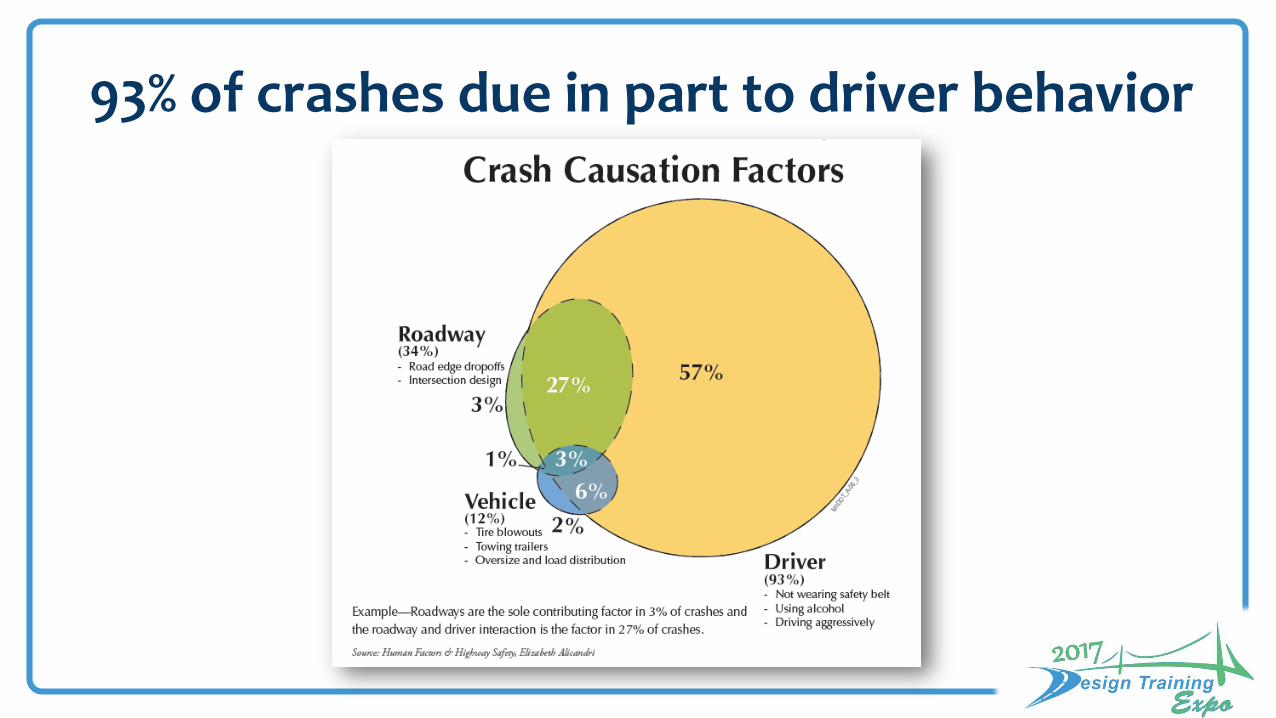
93% of crashes due in part to driver behavior
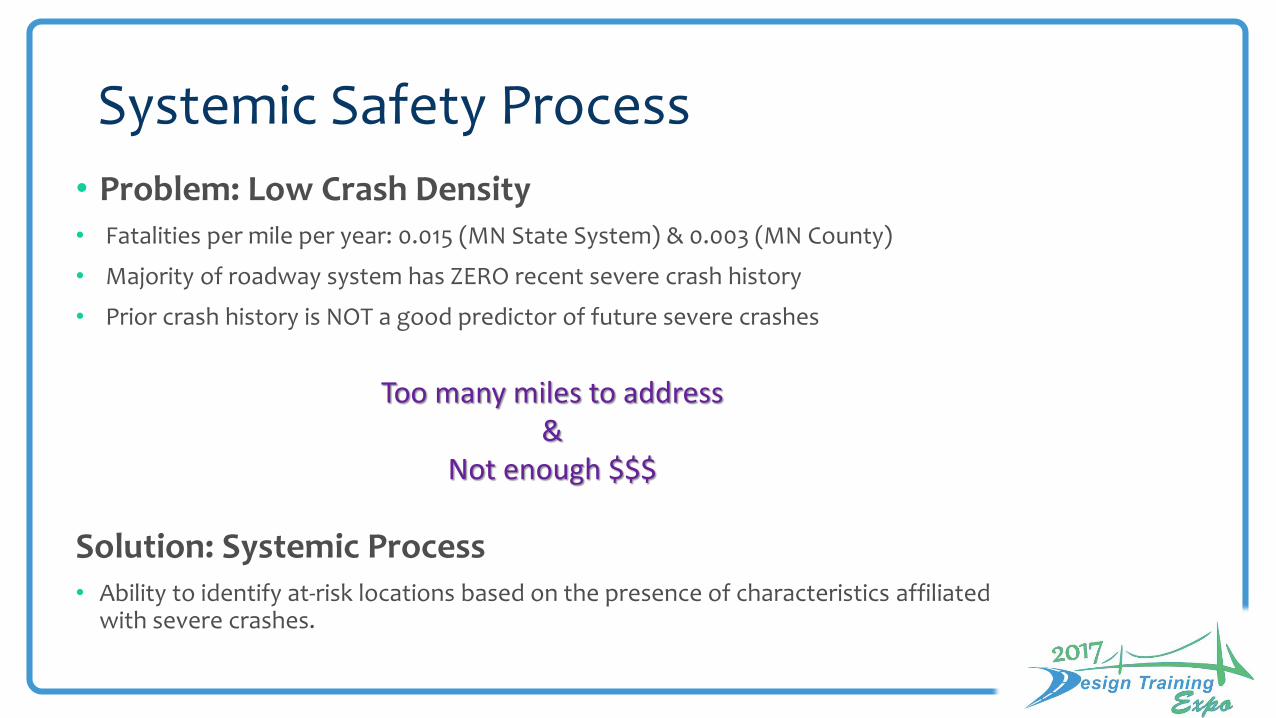
Systemic Safety Process
• Problem: Low Crash Density• Fatalities per mile per year: 0.015 (MN State System) & 0.003 (MN County)
• Majority of roadway system has ZERO recent severe crash history
• Prior crash history is NOT a good predictor of future severe crashes
Too many miles to address&
Not enough $$$
Solution: Systemic Process• Ability to identify at-risk locations based on the presence of characteristics affiliated
with severe crashes.
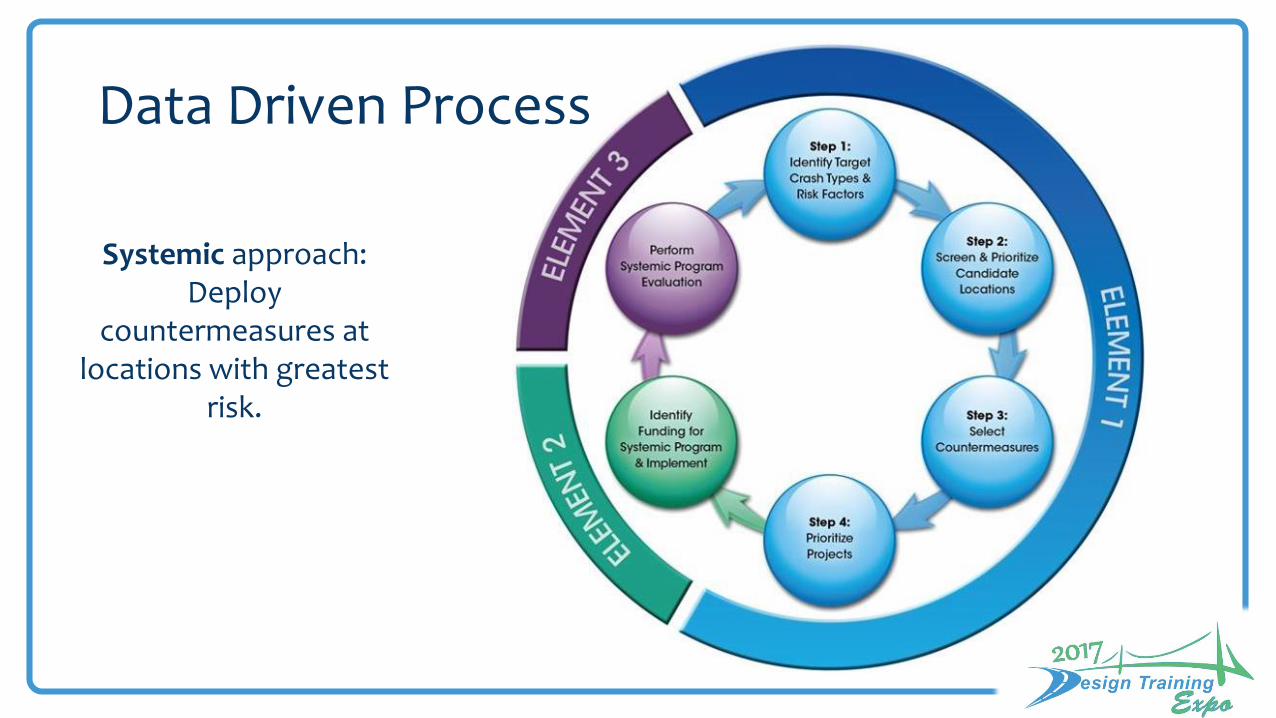
Data Driven Process
Systemic approach:Deploy
countermeasures at locations with greatest
risk.

Disaggregate the Data- Disaggregate to homogeneous sites- “Apples to apples”

Disaggregate the Data
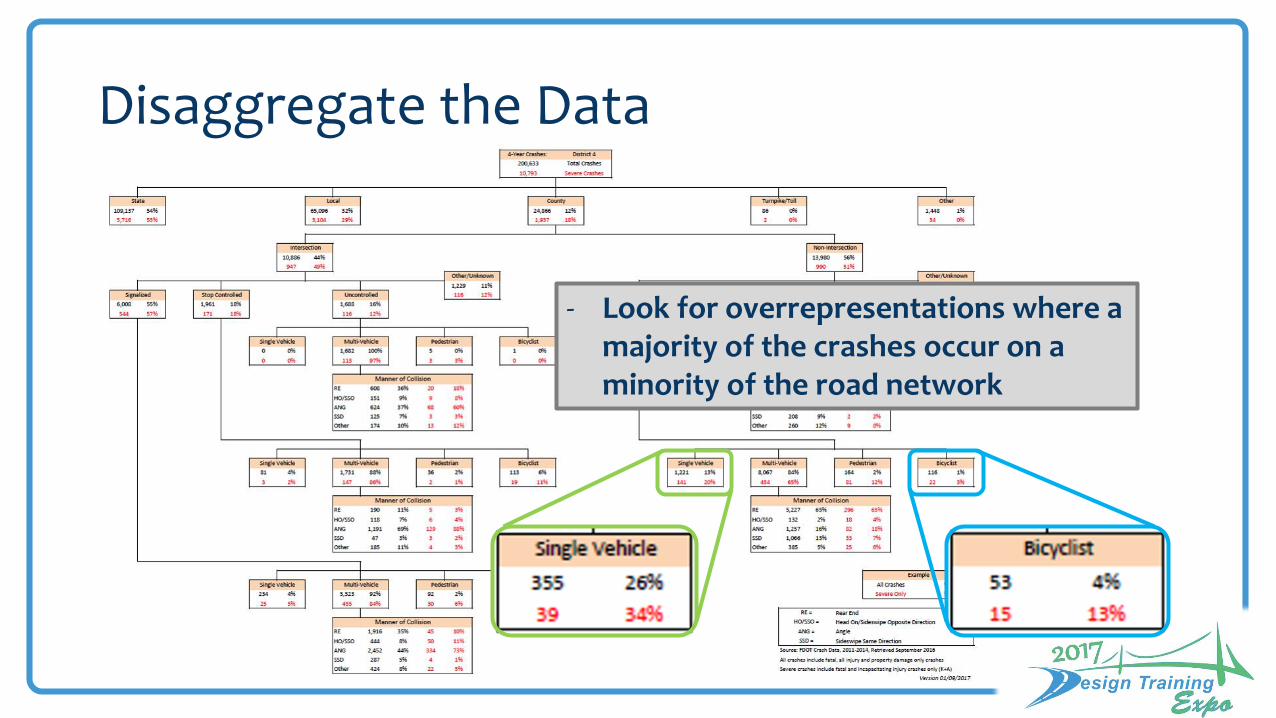
Disaggregate the Data
- Look for overrepresentations where a majority of the crashes occur on a minority of the road network

Florida Crash Trends
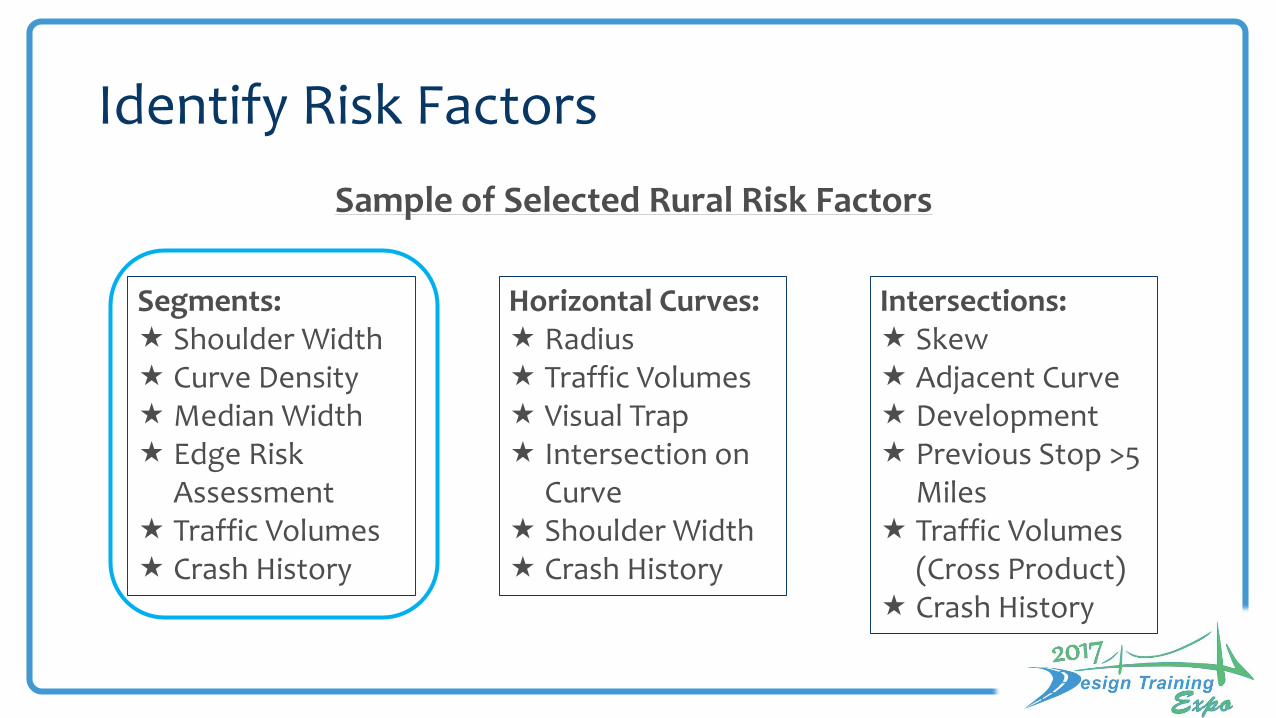
Identify Risk Factors
Segments: Shoulder Width Curve Density Median Width Edge Risk
Assessment Traffic Volumes Crash History
Horizontal Curves: Radius Traffic Volumes Visual Trap Intersection on
Curve Shoulder Width Crash History
Intersections: Skew Adjacent Curve Development Previous Stop >5
Miles Traffic Volumes
(Cross Product) Crash History
Sample of Selected Rural Risk Factors
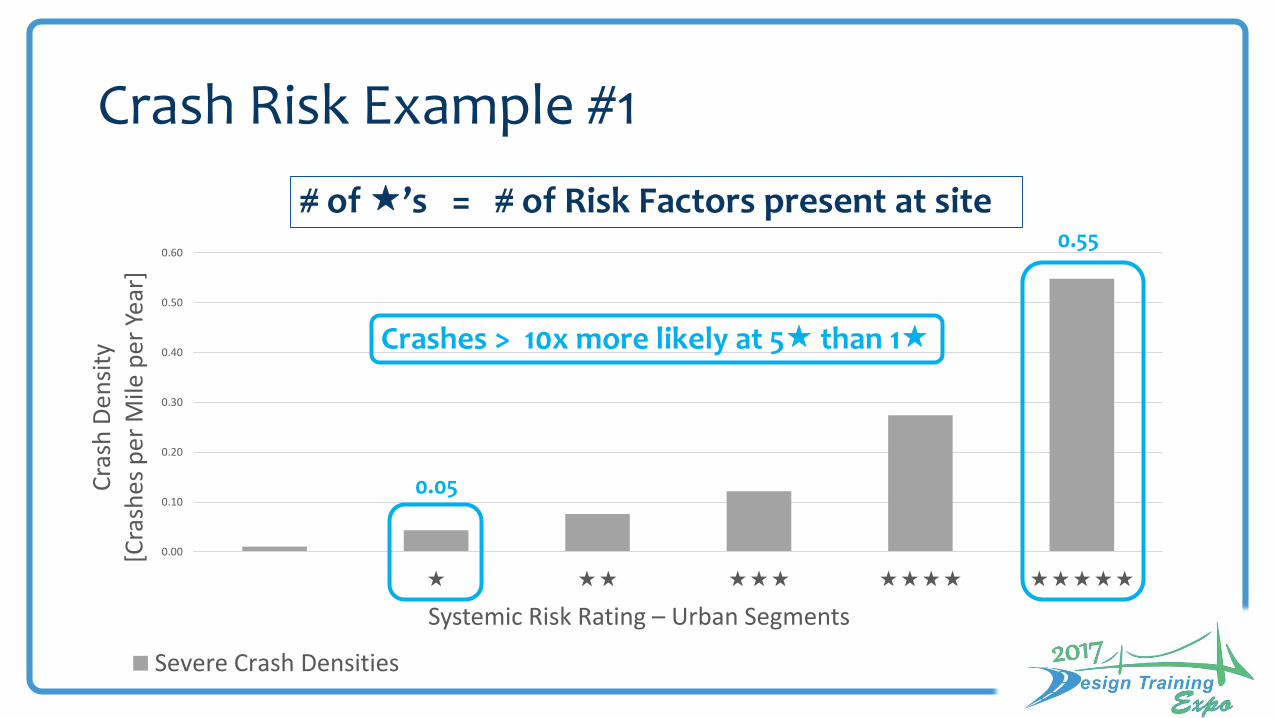
Crash Risk Example #1
0.00
0.10
0.20
0.30
0.40
0.50
0.60
Cra
sh D
ensi
ty
[Cra
shes
per
Mile
per
Yea
r]
Systemic Risk Rating – Urban Segments
Severe Crash Densities
# of ’s = # of Risk Factors present at site
0.05
0.55
Crashes > 10x more likely at 5 than 1
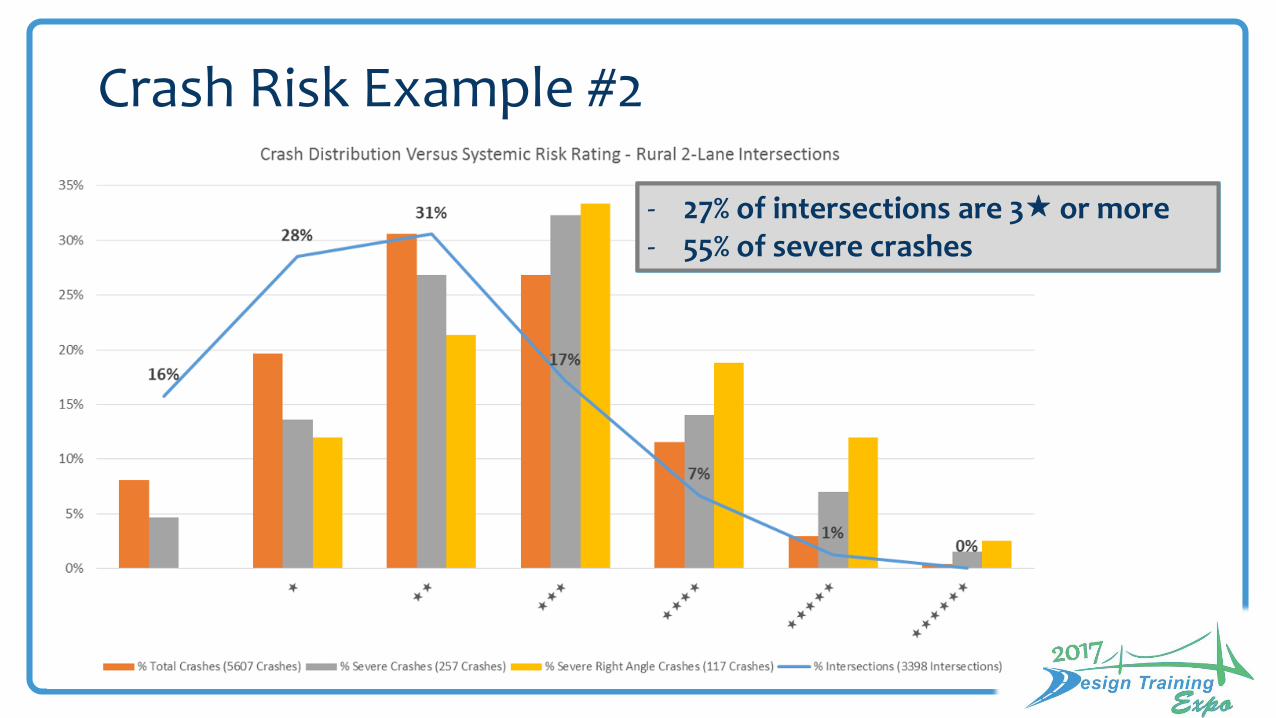
Crash Risk Example #2
- 27% of intersections are 3 or more- 55% of severe crashes

Candidate Location Identification
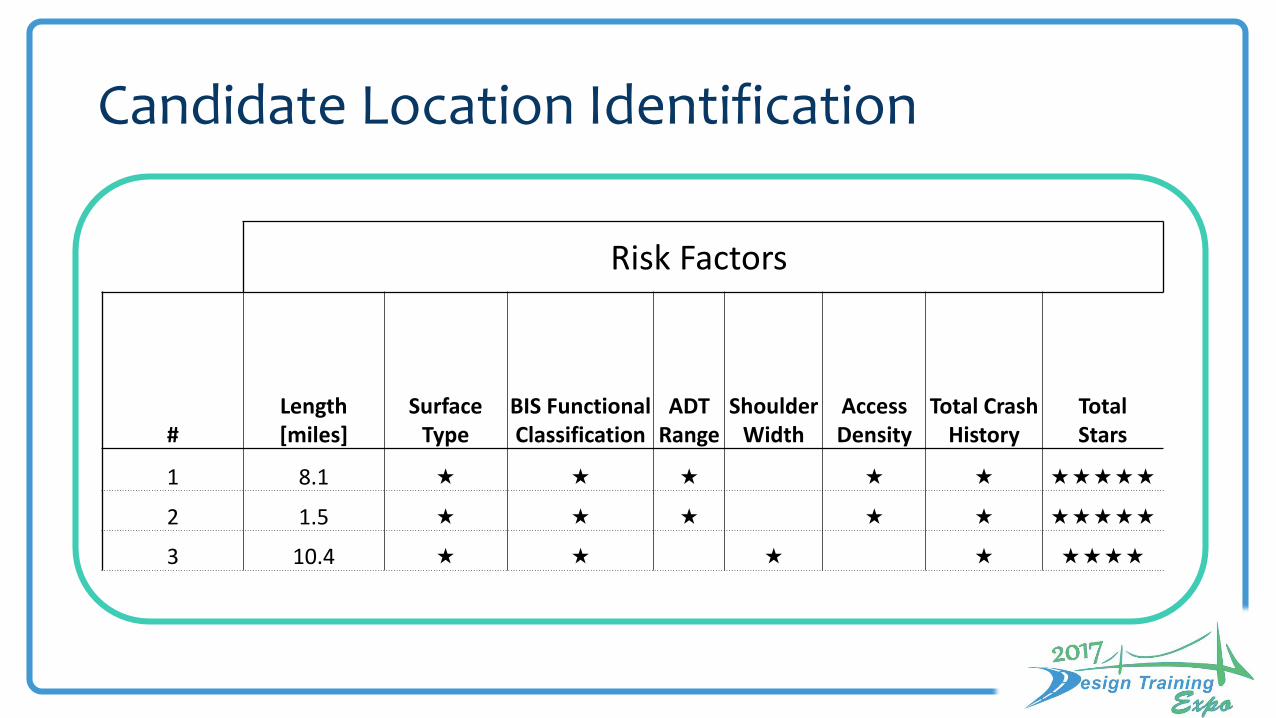
Candidate Location Identification
Risk Factors
#Length[miles]
SurfaceType
BIS Functional Classification
ADTRange
ShoulderWidth
AccessDensity
Total CrashHistory
TotalStars
1 8.1
2 1.5
3 10.4
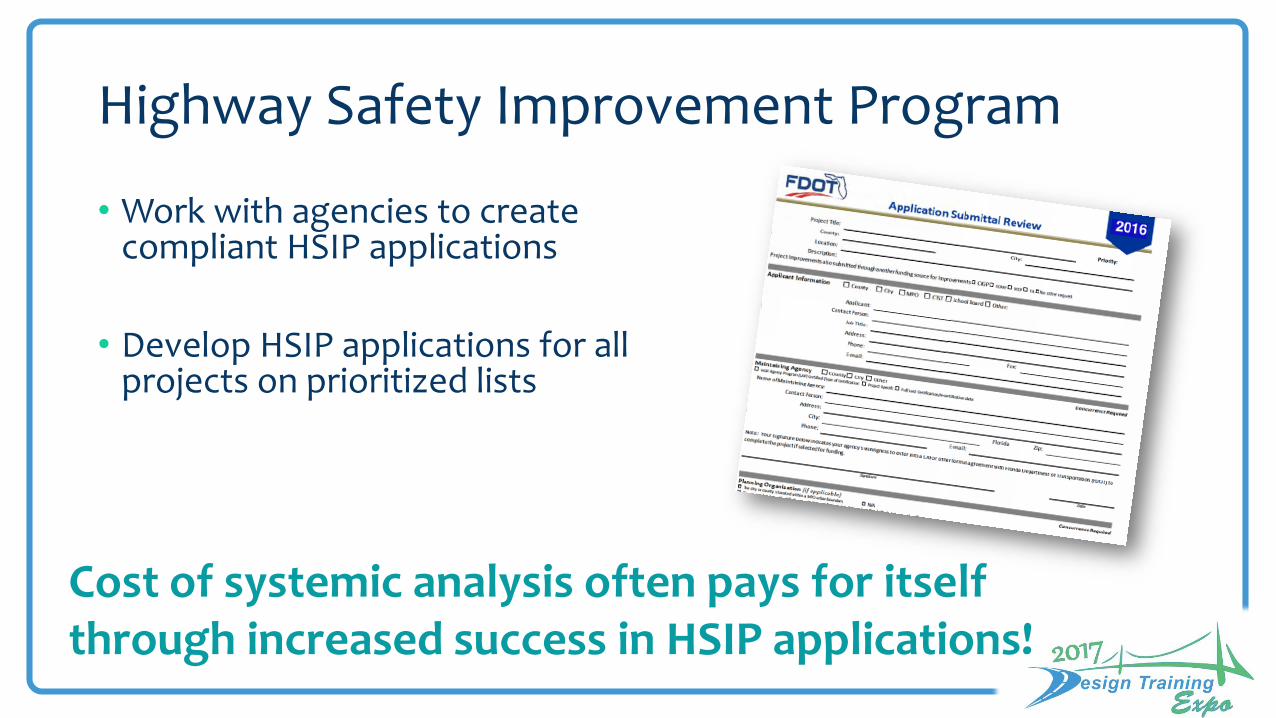
Highway Safety Improvement Program
• Work with agencies to create compliant HSIP applications
• Develop HSIP applications for all projects on prioritized lists
Cost of systemic analysis often pays for itself through increased success in HSIP applications!
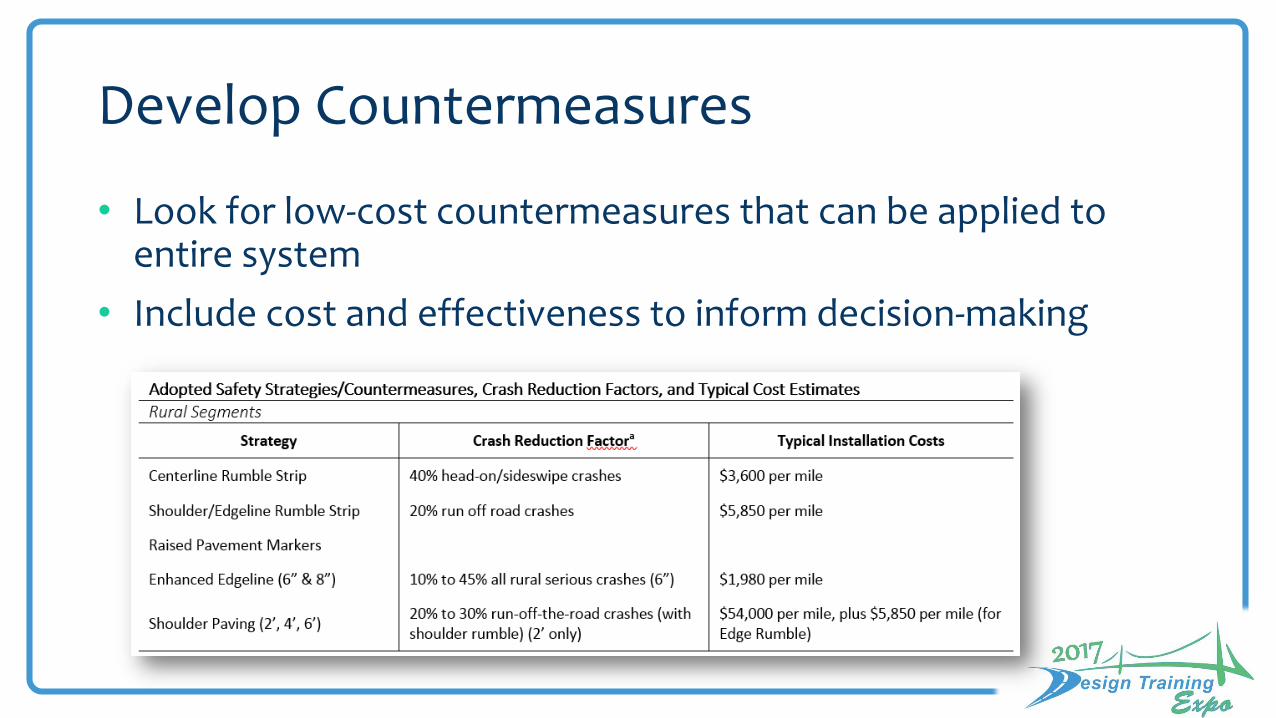
Develop Countermeasures
• Look for low-cost countermeasures that can be applied to entire system
• Include cost and effectiveness to inform decision-making
Deliverables/Benefits from Systemic Safety Analysis
• Report –process, stakeholder engagement, emphasis areas, findings, Prioritized List of all Safety Projects and identified risk factors
• HSIP applications ~80% complete (obtaining funding for 1 HSIPoften pays for systemic analysis costs)
• Justifies why some projects aren’t the best use of money
Florida Systemic Efforts to Date
• FDOT – Lane Departure
• FDOT – Intersections
• FHWA/FDOT/Palm Beach County – Local Road Safety Plan
• Seminole Tribe of Florida – Safety Plan

Draft Recommendations
• Deploy a large number of low cost, effective, countermeasures at numerous State and Non-State intersections with crash histories. Here is a partial list:
– Intersection Sign and Marking Improvements (1156 Intersections)
– Signal Improvements (645 Intersections)
– Pedestrian Improvement (645 Intersections)
– Turning restrictions at multi-lane stop controlled intersections (300 Intersections)

Draft Recommendations
• Deploy a large number of low cost, effective, countermeasures at numerous State and Non-State roadway segments with crash histories. Here is a partial list:
– Enhanced Curve Sign and Marking Countermeasures (364 miles)
– Improved Pavement Marking (206 miles)
– Edge Line Rumble Stripes or Shoulder Rumble Strips (175 miles)
– High Friction Surface Treatment (150 miles)
– Wider Shoulders (52 miles)
– Centerline Rumble Stripes (46 miles)
Draft Recommendations
• Request Total $265.02M over 3 to 5 Years ($103.46M Intersection and $161.56M Lane Departure)
• Primarily for proven low cost systemic safety improvements for both State and Non-State Roads
• Locations determined using combined data driven and Highway Safety Manual (predicted) methodology
Draft Outcomes
• Intersection Improvements B/C is 123.70 and NPV is $1,564.3M
• 112 Lives Saved Annually
• Lane Departure Improvements B/C is 87.7 and NPV is $1,727.4M
• 140 Lives Saved Annually
Next Steps
• Implement recommendations from Systemic Analysis – lane departure and intersections
• Look for opportunities to refine planning process, design criteria/standards based on results of Systemic Analysis

Questions
Joe Santos, PE
FDOT State Safety Engineer
850.414.4097
Chad Polk, PE
Project Manager
813.281.7912