Embed Size (px)
Citation preview
ARTICLE
Received 1 Sep 2014 | Accepted 4 Dec 2014 | Published 23 Jan 2015
Systems genetics identifies Sestrin 3 as aregulator of a proconvulsant gene network inhuman epileptic hippocampusMichael R. Johnson1,y, Jacques Behmoaras2,*, Leonardo Bottolo3,*, Michelle L. Krishnan4,*, Katharina Pernhorst5,*,
Paola L. Meza Santoscoy6,*, Tiziana Rossetti7, Doug Speed8, Prashant K. Srivastava1,7, Marc Chadeau-Hyam9, Nabil Hajji10,
Aleksandra Dabrowska10, Maxime Rotival7, Banafsheh Razzaghi7, Stjepana Kovac11, Klaus Wanisch11, Federico W. Grillo7,
Anna Slaviero7, Sarah R. Langley1,7, Kirill Shkura1,7, Paolo Roncon12,13, Tisham De7, Manuel Mattheisen14,15,16,
Pitt Niehusmann5, Terence J. O’Brien17, Slave Petrovski18, Marec von Lehe19, Per Hoffmann20,21, Johan Eriksson22,23,24,
Alison J. Coffey25, Sven Cichon20,21, Matthew Walker11, Michele Simonato12,13,26, Benedicte Danis27, Manuela Mazzuferi27,
Patrik Foerch27, Susanne Schoch5,28, Vincenzo De Paola7, Rafal M. Kaminski27, Vincent T. Cunliffe6, Albert J. Becker5,y &
Enrico Petretto7,29,y
Gene-regulatory network analysis is a powerful approach to elucidate the molecular processes and
pathways underlying complex disease. Here we employ systems genetics approaches to characterize the
genetic regulation of pathophysiological pathways in human temporal lobe epilepsy (TLE). Using
surgically acquired hippocampi from 129 TLE patients, we identify a gene-regulatory network genetically
associated with epilepsy that contains a specialized, highly expressed transcriptional module encoding
proconvulsive cytokines and Toll-like receptor signalling genes. RNA sequencing analysis in a mouse
model of TLE using 100 epileptic and 100 control hippocampi shows the proconvulsive module is
preserved across-species, specific to the epileptic hippocampus and upregulated in chronic epilepsy. In
the TLE patients, we map the trans-acting genetic control of this proconvulsive module to Sestrin 3
(SESN3), and demonstrate that SESN3 positively regulates the module in macrophages, microglia and
neurons. Morpholino-mediated Sesn3 knockdown in zebrafish confirms the regulation of the
transcriptional module, and attenuates chemically induced behavioural seizures in vivo.
DOI: 10.1038/ncomms7031
1 Division of Brain Sciences, Imperial College London, Hammersmith Hospital Campus, Burlington Danes Building, London W12 0NN, UK. 2 Centre for Complement andInflammation Research, Imperial College London, Hammersmith Hospital, Du Cane Road, London W12 0NN, UK. 3 Department of Mathematics, Imperial College London, 180Queen’s Gate, London SW7 2AZ, UK. 4 Centre for the Developing Brain, Department of Perinatal Imaging and Health, St Thomas’ Hospital, King’s College London, London SE1 7EH,UK. 5 Section of Translational Epileptology, Department of Neuropathology, University of Bonn, Sigmund Freud Street 25, Bonn D-53127, Germany. 6 Department of BiomedicalScience, Bateson Centre, University of Sheffield, Firth Court, Western Bank, Sheffield S10 2TN, UK. 7 Medical Research Council (MRC) Clinical Sciences Centre, Imperial CollegeLondon, Hammersmith Hospital, Du Cane Road, London W12 0NN, UK. 8 UCL Genetics Institute, University College London, Gower Street, London WC1E 6BT, UK. 9 Department ofEpidemiology and Biostatistics, School of Public Health, MRC/PHE Centre for Environment and Health, Imperial College London, St Mary’s Hospital, Norfolk Place, W21PG London,UK. 10 Department of Medicine, Centre for Pharmacology and Therapeutics, Imperial College London, Du Cane Road, London W12 0NN, UK. 11 Institute of Neurology, UniversityCollege London, London WC1N 3BG, UK. 12 Department of Medical Sciences, Section of Pharmacology and Neuroscience Center, University of Ferrara, 44121 Ferrara, Italy.13 National Institute of Neuroscience, 44121 Ferrara, Italy. 14 Department of Genomics, Life and Brain Center, University of Bonn, D-53127 Bonn, Germany. 15 Institute of HumanGenetics, University of Bonn, D-53127 Bonn, Germany. 16 Institute for Genomic Mathematics, University of Bonn, D-53127 Bonn, Germany. 17 Department of Medicine, RMH,University of Melbourne, Royal Melbourne Hospital, Royal Parade, Parkville, Victoria 3050, Australia. 18 Department of Neurology, Royal Melbourne Hospital, Melbourne, Parkville,Victoria 3050, Australia. 19 Department of Neurosurgery, University of Bonn Medical Center, Sigmund-Freud-Strasse 25, 53105 Bonn, Germany. 20 Institute of Human Genetics,University of Bonn, Sigmund-Freud-Strasse 25, 53127 Bonn, Germany. 21 Department of Biomedicine, University of Basel, Hebelstrasse 20, 4056 Basel, Switzerland. 22 FolkhalsanResearch Centre, Topeliusgatan 20, 00250 Helsinki, Finland. 23 Helsinki University Central Hospital, Unit of General Practice, Haartmaninkatu 4, Helsinki 00290, Finland.24 Department of General Practice and Primary Health Care, University of Helsinki, 407, PO Box 20, Tukholmankatu 8 B, Helsinki 00014, Finland. 25 Wellcome Trust SangerInstitute, Wellcome Trust Genome Campus, Hinxton CB10 1SA, UK. 26 Laboratory for Technologies of Advanced Therapies (LTTA), University of Ferrara, 44121 Ferrara, Italy.27 Neuroscience TA, UCB Biopharma SPRL, Avenue de l’industrie, R9, B-1420 Braine l’Alleud, Belgium. 28 Department of Epileptology, University of Bonn Medical Center, Sigmund-Freud-Strasse 25, Bonn D-53127, Germany. 29 Duke-NUS Graduate Medical School, 8 College Road, Singapore 169857, Singapore. * These authors contributed equally to this work.yThese authors jointly supervised this work. Correspondence and requests for materials should be addressed to M.R.J. (email: [email protected]) or to A.J.B.(email: [email protected]) or to E.P. (email: [email protected]).
NATURE COMMUNICATIONS | 6:6031 | DOI: 10.1038/ncomms7031 | www.nature.com/naturecommunications 1
& 2015 Macmillan Publishers Limited. All rights reserved.
Epilepsy is a serious neurological disorder affecting about 1%of the world’s population. Recently, a growing body ofexperimental and clinical data has implicated Toll-like
receptor (TLR) signalling1 and release of proconvulsantinflammatory molecules (that is, interleukin (IL)-1b) in bothseizure generation and epileptogenesis2,3. However, thepathogenetic mechanisms linking these inflammatory processeswith the development (and recurrence) of epileptic seizures inhumans are unclear. Despite high heritability of epilepsy4–6, bothgenome-wide association studies (GWAS) and exome sequencingapproaches have so far provided limited insights into the geneticregulatory mechanisms underlying inflammatory pathways inepilepsy aetiology7–11, and traditional single-variant associationapproaches are likely to be underpowered to detect complex genenetwork interactions that underlie disease susceptibility12. As themolecular processes driving complex disease usually affect sets ofgenes acting in concert, one alternative strategy is to use systems-level approaches to investigate transcriptional networks andpathways within pathologically relevant cells and tissues13,14.Integrated analysis of transcriptional networks with geneticsusceptibility data and phenotypic information allows specifictranscriptional programmes to be connected to disease states, andthereby can identify disease pathways and their genetic regulatorsas new targets for therapeutic intervention15.
Almost uniquely among disorders of the human brain, epilepsysurgery offers opportunities for gene expression profiling inante-mortem brain tissue from pathophysiologically relevantbrain structures such as the hippocampus16. This allows directinvestigation of transcriptional programmes in brain tissue fromliving epilepsy patients. In this study, we integrate unsupervisednetwork analysis of global gene expression in the hippocampiof patients with temporal lobe epilepsy (TLE) with GWASdata in a systems genetics approach17. We uncover pathwaysand transcriptional programmes associated with epilepsy thatare conserved in mouse epileptic hippocampus, includinga proconvulsant gene network encoding IL-1b3 andTLR-signalling genes1 previously implicated in epilepsy. Usinggenome-wide Bayesian expression QTL mapping18, we probe thegenome for key genetic regulators of the network in human brain.We pinpoint an unexpected gene, Sestrin 3 (SESN3) whoseprotein product controls the intracellular response to reactiveoxygen species19–22, as a trans-acting genetic regulator ofthe proconvulsant gene network in the human epileptichippocampus. We carry out validation experiments inindependent in vitro and in vivo systems, which confirm thegenetic regulation of the proconvulsant transcriptionalprogramme in epilepsy by Sestrin 3, therefore providing a firstevidence of a function for SESN3 in disorders of the human brain.
ResultsIdentification of a gene network associated with epilepsy. Wefirst assessed the degree of variation in gene expression betweenhippocampal subfields in TLE patients with hippocampalsclerosis, and compared this with the total variation in geneexpression measured both across subjects and between subfields(Supplementary Fig. 1). We found higher variability in geneexpression across TLE subjects than between the hippocampalsubfields alone, suggesting that variation in whole hippocampusexpression can be used to infer co-expression networks in thehippocampus of TLE patients (Supplementary Fig. 1). Afterexcluding subjects with incomplete clinical data or non-hippocampal sclerosis pathology, whole-genome expressionprofiles in surgically resected hippocampi from 129 TLE patients(median age at surgery 35 years, range 1–64 years, male/femaleratio of 1.2:1; Supplementary Table 1) were available for geneco-expression network analysis.
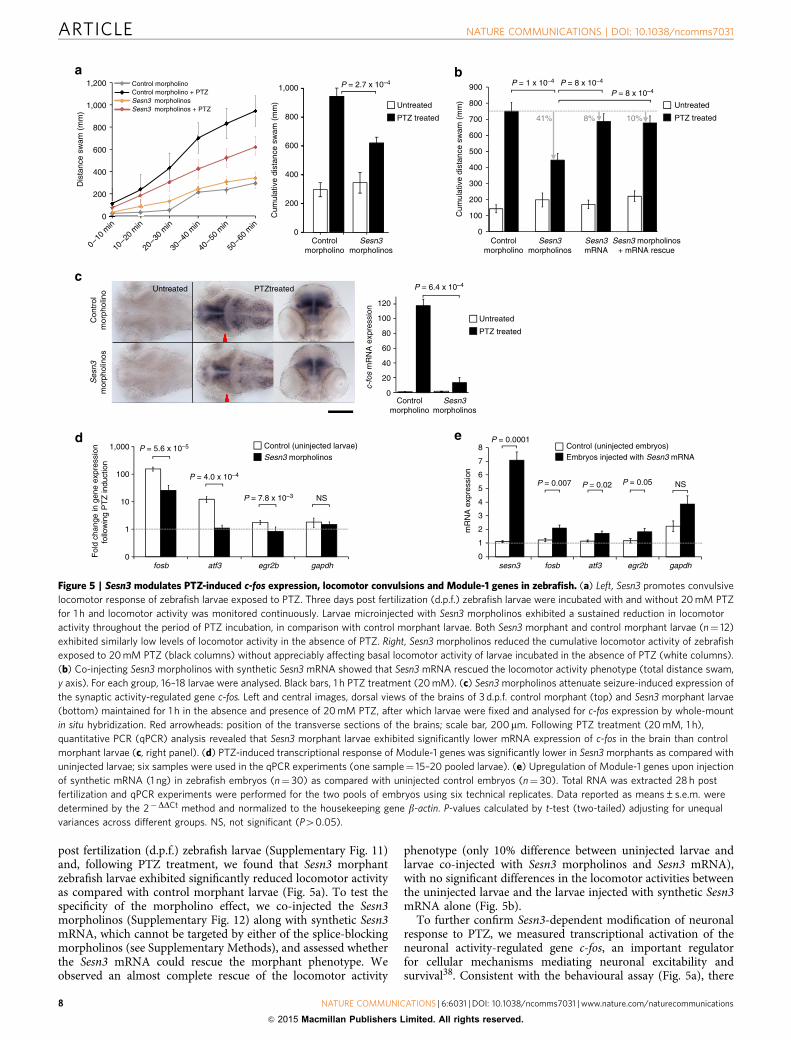
We then investigated whether the transcriptome in thehippocampus of these 129 TLE patients is organized into discretegene co-expression networks, and if these have functionalimplications for susceptibility to epilepsy. Gene co-expressionnetworks were reconstructed genome wide using GraphicalGaussian Models (GGMs)23, which identified a large co-expression network comprising 442 annotated genes (falsediscovery rate (FDR)o5%, Fig. 1a and Supplementary Data 1).To investigate whether the protein products of the TLE-hippocampus derived transcriptional network (TLE-network)genes have a shared function at the protein level, we used theDAPPLE algorithm24. This method interrogates high-confidenceprotein–protein interactions to assess the physical connectionsamong proteins encoded by the genes in the network.Genes comprising the TLE-network were found to haveincreased protein–protein interconnectivity as compared withrandom protein–protein interaction networks (P¼ 9.9� 10� 5,Supplementary Fig. 2). This provides evidence that proteinsencoded by the co-expressed genes in the TLE-network interactphysically, supporting the validity of the gene networktopography.
As gene expression may vary both as a cause and aconsequence of disease, we investigated the causal relationshipbetween the TLE-network and epilepsy by integration withgenetic susceptibility data. Here, DNA variation was used to infercausal relationships between the network and epilepsy byassessing whether the network as a whole was geneticallyassociated with epilepsy. To this aim, we used focal epilepsyGWAS data6,25 from a separate cohort of 1,429 cases (consistingmainly of patients with TLE) and 7,358 healthy controls.Although no single-nucleotide polymorphism (SNP) achievedgenome-wide significance in the epilepsy GWAS (SupplementaryFig. 3), we found that the TLE-network as a whole was highlyenriched for genetic associations to focal epilepsy compared withgenes not in the network (P¼ 2� 10� 7; Fig. 1a andSupplementary Table 2). These integrated analyses of co-expression network and genetic susceptibility data from a focalepilepsy GWAS provide independent evidence to support thecausal involvement of the TLE-network in epilepsy aetiology.
Conservation and functional specialization of the network. TheTLE-network was significantly enriched for genes belonging toseveral biological pathways involving cell-to-extracellular matrixadhesion including ‘extracellular matrix–receptor interaction’(P¼ 3.9� 10� 5), ‘focal adhesion’ (P¼ 1.4� 10� 4) and inflam-mation, such as the ‘cytokine–cytokine receptor interaction’(P¼ 2.4� 10� 5) and ‘TLR signalling’ (P¼ 3.9� 10� 5; Fig. 1b).The observation that the TLE-network was enriched for multiplepathways led us to investigate whether the network containedfunctionally homogenous transcriptional modules (that is,sub-networks of highly correlated genes) with implications forepilepsy aetiology. Using unsupervised agglomerate clusteringapproaches (see Supplementary Methods), we identifiedtwo transcriptional modules comprising 69 (Module-1) and54 (Module-2) unique genes, respectively (Fig. 1c andSupplementary Data 1). Module-1 was specifically enriched forgene ontology categories related to inflammatory mechanisms,whereas Module-2 was enriched for cell-to-extracellular matrixadhesion processes (Fig. 1d and Supplementary Table 3), indi-cating functional sub-specialization within the larger TLE-network. We observed that Module-1 genes were significantlyupregulated as compared with genes in the larger TLE-network,Module-2, or with respect to all other genes profiled in the hip-pocampus of TLE patients (Fig. 1e). This increased hippocampalexpression of Module-1 genes in TLE patients was not observed
ARTICLE NATURE COMMUNICATIONS | DOI: 10.1038/ncomms7031
2 NATURE COMMUNICATIONS | 6:6031 | DOI: 10.1038/ncomms7031 | www.nature.com/naturecommunications
& 2015 Macmillan Publishers Limited. All rights reserved.
in separate gene expression data sets from the hippocampusof healthy subjects (that is, individuals clinically classified asneurologically normal; Supplementary Fig. 4). Notably,Module-1 was markedly enriched for highly expressed inflam-matory cytokines (16-fold enrichment, P¼ 6.6� 10� 13) many ofwhich belong to the IL-1 signalling cascade (IL-1b, IL-1RN, IL-1a,TNFa) and the TLR-signalling pathway (11-fold enrichment,P¼ 1.4� 10� 6), previously implicated in epileptogenesis1
and brain inflammation2,3 (Supplementary Fig. 5). Takentogether, these data indicate the presence of a coordinatedtranscriptional programme (Module-1), encompassing TLRactivation and release of proinflammatory cytokines (includingIL-1b), in chronic human epileptic hippocampus as previouslyhypothesized3,26.
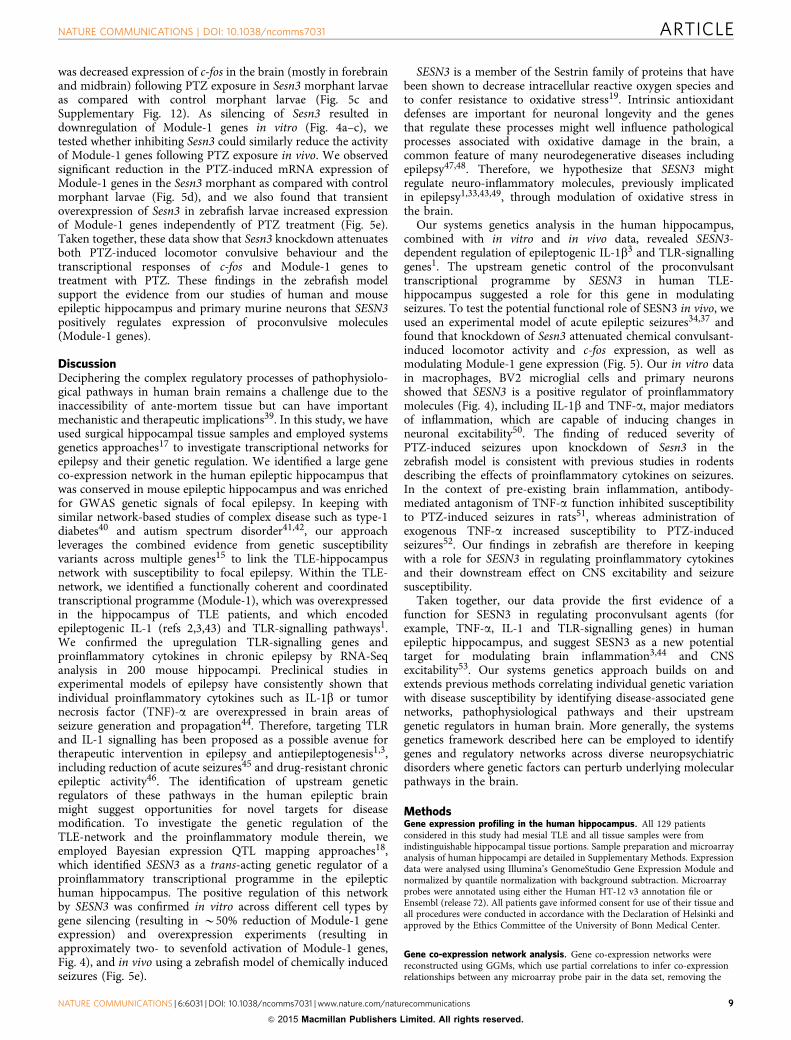
We then investigated whether the TLE-network and Module-1genes, in particular, were conserved across-species and to this aimwe carried out high-throughput sequencing of mRNA (RNA-Seq)in whole hippocampus from 100 epileptic (pilocarpine model)27
and 100 control naıve mice (full details of this model are reportedin the Supplementary Methods). We employed GGMs toassess the co-expression relationships between the 371 mouseorthologues of the human TLE-network genes, and found that312 genes (84%) had significant co-expression (FDRo5%) withat least another network gene in mouse epileptic hippocampus
(Fig. 2a). The conserved TLE-network genes formed 1,119significant partial correlations in mouse epileptic hippocampus,which is significantly higher than expected by chance (P¼ 0.001by 10,000 bootstrap permutations; Fig. 2b). In contrast, only 615significant partial correlations between the same 312 genes weredetected in healthy hippocampus (P¼ 0.659 by 10,000 bootstrappermutations), suggesting that the TLE-network is specificallyconserved in the epileptic mouse hippocampus (Fig. 2b). Inkeeping with the high expression of proinflammatory genesobserved in the hippocampus of TLE patients (SupplementaryFig. 5), the mouse orthologues of Module-1 genes that weresignificantly upregulated in epileptic hippocampus were enrichedfor TLR-signalling and cytokines (gene set enrichment analysis28,P¼ 9.03� 10� 4, Fig. 2c). These comparative genomics analysesrevealed that, to a large extent, the hippocampal TLE-networkis conserved across-species, and confirm that genes forTLR signalling and proinflammatory cytokines within theTLE-network are upregulated in chronic epileptic hippocampus.
SESN3 is a genetic regulator of the proinflammatory network.We set out to identify genetic variants that regulate the gene co-expression modules (that is, regulatory ‘hotspots’) by employinggenome-wide Bayesian expression QTL mapping approaches18,29.
p53 signaling pathwayChemokine signaling pathway
Focal adhesionNOD-like receptor signaling pathway
MAPK signaling pathwayType I diabetes mellitus
Hematopoietic cell lineageGraft-versus-host disease
Toll-like receptor signaling pathwayCytokine–cytokine receptor interaction
ECM-receptor interaction
–Log10 (P-value)
GWAS P-value
0.05
3x10⁻⁴
NS
p53 signaling pathway
MAPK signaling pathway
Chemokine signaling pathway
Toll-like receptor signalingpathway
NOD-like receptor signalingpathway
Cytokine-cytokine receptorinteraction
–Log10 (P-value)
ECM-receptor interaction
Focal adhesion
–Log10 (P-value)
Module-1 MCL1
PDGFB
SERPINE1
SIK1
C7orf68
KLF4GEM(1)RPPH1
PHLDA1
LDLR
MAFF
EMP1
PIM1
GEM(2)
ADM NFKBIZ
JUNB
FOS
EGR3
CCL2
HBEGFNR4A2(2)
C2CD4B
NR4A2(1)GPR183(1)
GPR183(2)
IL1A
IL1RN CXCL2ITPRIP
CDKN1ACD83(2)
CD83(1)
OSM
TNF
IL1B
IER3CCL3
CCL3L1(1)
IL8(1)
IL8(2)
BTG2
FOSBZFP36
TNFRSF12A
SERPINH1
GADD45BGADD45G
EGR2
ATF3
CCL4CCL3L1(3)
CCL3L1(4)CCL3L1(2)
PTGS2(2)
CYR61
CD14
PTGS2(1)
IER2
NLRP3(1)APOLD1
FKBP5 KIF19KLF15
CCL4L2 CCL3L1CCL8
CD69
CH25H
NLRP3(2)
SDPRRGS1 TSC22D3
ZBTB16 IP6K3ECHDC3
PDK4 ARRDC2 OR7A5CHST3
Module-1
Module-2
Enrichment for KEGG pathways (TLE-network)
Enrichment for KEGG pathways (Module-1)
6.62.73.05.1
3.04.7
Enrichment for KEGG pathways (Module-2)Module-2
500
400
300
200
100
0Module-1
genes
Mic
roar
ray
expr
essi
on le
vels
(ar
bitr
ary
units
)
Module-2genes
Networkgenes
All other geneson the microarray
**
******
5.22.9
4.37.14.5
65432
1086420
543210
ILMN_1872564
SOD2CHI3L2
ALDH4A1(1)
ILMN_1717565
CLEC18CLIPG(1)
LIPG(2)
PCSK1(2)
SORCS3
SMAD6
CD248
C5orf40
NNAT
CITED1
GPX3
TLL1
SLC27A2ILMN_1895335
COL15A1
ILMN_1707070
HSPB3COL1A2(1)
ILMN_2415583
ADAD2 GPR68
LGI2
BDNFSUSD2
PRPH
COL4A1
ISLR
SCARA3
COL5A1
DKK1
ILMN_2041101 DIRAS3
DCBLD2(2)
LUMIGFBP6
TAGLN
DCBLD2(1)
PRKCDBPRDH10
ZNF436
LAMC3
SLCO2A1COL6A2
FLNC
METTL7B
ILMN_1755173
CAV1MGP(2)
MXRA5
PRSS23
MGP(1)ALDH4A1(2)
ILMN_1759092
S100A3 SYNGR4
Figure 1 | Identification of the TLE-network and functionally specialized transcriptional modules in human epileptic hippocampus. (a) Gene
co-expression network identified in the hippocampus of TLE patients (TLE-network). Nodes represent genes and edges represent significant partial
correlations between their expression profiles (FDRo5%). Node colour indicates the best GWAS P-value of association with focal epilepsy for SNPs
within 100 kb of each gene (Supplementary Data 1). Boxes mark two transcriptional modules within the network. (b) Kyoto Encyclopedia of Genes and
Genome (KEGG) pathways significantly enriched in the TLE-network (FDRo5%). The fold enrichment for each KEGG pathway is reported on the side of
each bar. (c) Module-1 and Module-2 details. The size of each node is proportional to its degree of interconnectivity within each module. Light blue
indicates genes showing nominal association with susceptibility to focal epilepsy by GWAS. Numbers in parenthesis indicate multiple microarray probes
representing the same gene. (d) KEGG pathways significantly enriched in Module-1 (top) and Module-2 (bottom; FDRo5%). (e) Module-1 is significantly
highly expressed in the hippocampus of TLE patients. mRNA expression of Module-1 (n¼80 probes, representing 69 unique annotated genes) as
compared with Module-2 (n¼ 60 probes, representing 54 unique annotated genes), other network genes (n¼ 371 probes, representing 319 unique
annotated genes) and all other probes represented on the microarray (n¼48,256). **P¼ 3.8� 10�4; ***Po10� 10, Mann–Whitney test, two-tailed.
NATURE COMMUNICATIONS | DOI: 10.1038/ncomms7031 ARTICLE
NATURE COMMUNICATIONS | 6:6031 | DOI: 10.1038/ncomms7031 | www.nature.com/naturecommunications 3
& 2015 Macmillan Publishers Limited. All rights reserved.

0
1
2
3
4
5
6
IL1R
N
CC
L4L1
SE
RP
INE
1 R
GS
1 C
CL8
IP
6K3
CC
L2
TN
F
CD
69
CC
L8
OS
M
CD
14
EM
P1
EC
HD
C3
GP
R18
3 IL
1B
AT
F3
PIM
1 IL
1A
ZF
P36
C
2CD
4B
GE
M
KIF
19
CH
ST
3 N
LRP
3 C
H25
H
TN
FR
SF
12A
LD
LR
CY
R61
A
DM
M
AF
F
SE
RP
INH
1 C
2CD
4B
GA
DD
45G
S
DP
R
PD
GF
B
ITP
RIP
P
TG
S2
AR
RD
C2
HB
EG
F
CD
83
MC
L1
CD
KN
1A
GA
DD
45B
P
DK
4 F
KB
P5
EG
R3
FLO
T1
PH
LDA
1 K
LF15
B
TG
2 Z
BT
B16
IE
R2
NF
KB
IZ
SIK
1 K
LF4
AP
OLD
1 T
SC
22D
3 N
R4A
2 F
OS
B
JUN
B
FO
S
EG
R2
Module-2
Module-1
Conserved TLE-network
300
250
200
150
100
50
0
Epilepticmouse
hippocampus
Controlmouse
hippocampus
Fol
d ch
ange
(epi
leps
y/co
ntro
l)
Module-1 genes
TLR-signaling and cytokines genes(enrichment P = 9.03 x 10⁻⁴)
300
250
200
150
100
50
0
Fre
quen
cyF
requ
ency
Number of significant partial correlations between the network genes
* *
* * * * *
* * * * * * * * * * * * * * * * * * * * * * * * * * * * * * * * * * * * * * *
FOSB JUNB FOS EGR2CCL4L1
IL1RN
RGS1
IP6K3
CCL21
TNF
CD69
CCL8
OSM
ECHDC3
GPR183
IL1B
ATF3
IL1A
C2CD4B
KIF19
CHST3NLRP3
CH25HBTG2ADMPDK4
LUMS100A3COL1A2
PLEKHA4
COL6A2
PCOLCE
IGFBP6
TAGLN
CD248
SLC27A2
HSPB3
NNAT
LAMC3
COL4A1
SUSD2SCARA3
SMAD6MGPGPX3
LIPGDKK1
ZNF436
RDH10
SORCS3
ALDH4A1
CXorf40B
PRPH
CITED1
SOD2
SLCO2A1
LGI2
SYNGR4HS6ST2
PCSK1
SDPRPDGFB
ITPRIP
PTGS2
ARRDC2
NR4A2
SERPINH1
FKBP5
FLOT1
PHLDA1
KLF15
LDLR
ZBTB16
IER2
NFKBIZ
SIK1
KLF4
APOLD1TSC22D3
CD83
200 400 600 800 1,000 1,200 1,400
200 400 600 800 1,000 1,200 1,400
Figure 2 | TLE-network conservation in mouse epileptic hippocampus. (a) Human TLE-network genes that are conserved and co-expressed (84%) in the
mouse hippocampus. Each node in the network represents a transcript that had significant partial correlation with at least another transcript in the network
(FDRo5%). Conserved Module-1 and Module-2 genes are indicated in blue and green, respectively. (b) Distribution of significant partial correlations
(FDRo5%) between pairs of transcripts from 10,000 bootstrap permutation samples in epileptic (top) and control (bottom) mouse hippocampus.
In each case, the red line indicates the actual number of significant partial correlations (FDRo5%) between all genes in the network. The number of
significant partial correlations observed in control hippocampus was no different from chance expectation (P¼0.659). In contrast, the number of
significant partial correlations detected in epileptic hippocampus was significantly higher than expected by chance (P¼0.001). (c) Differential expression
of Module-1 genes between control and epileptic mouse hippocampus shows specific enrichment for TLR-signalling and cytokine genes among the
upregulated genes (gene set enrichment analysis28). Stars denote significant fold changes between epileptic and control mouse hippocampus (FDRo5%);
blue bars indicate TLR-signalling and cytokine genes.
ARTICLE NATURE COMMUNICATIONS | DOI: 10.1038/ncomms7031
4 NATURE COMMUNICATIONS | 6:6031 | DOI: 10.1038/ncomms7031 | www.nature.com/naturecommunications
& 2015 Macmillan Publishers Limited. All rights reserved.

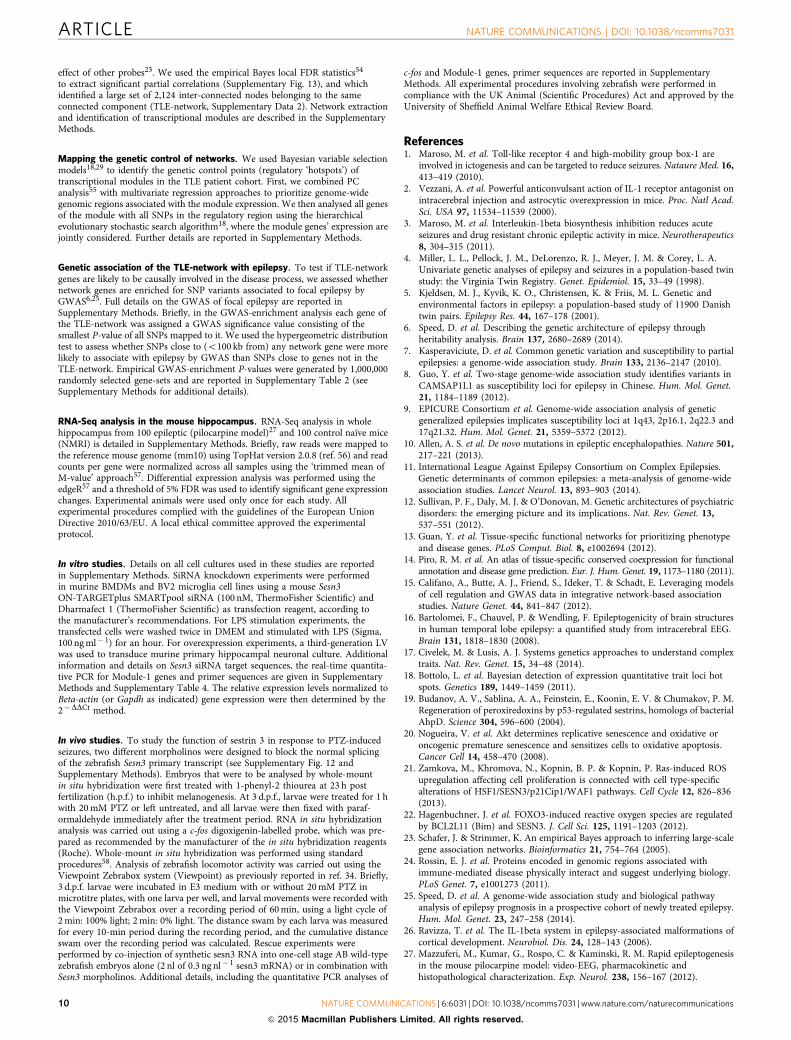
To this aim, we have developed a multi-step strategy to identifySNPs that regulate the expression of a transcriptional module (ornetwork) as a whole. As first step, we summarize the expressionof the genes in each module using principal component (PC)analysis and detect regulatory ‘hotspots’ using a Bayesianregression model at the genome-wide level29. This analysisprioritizes genomic regions associated with variation in mRNAexpression of the genes in each module. As a second step, torefine the genetic mapping results, we regress jointly the mRNAlevels of module genes to all SNPs within the regulatory locusidentified in the first step18. Given the functional specializationwithin the large TLE-network (Fig. 1d), we investigated thegenetic regulation of both Module-1 and Module-2, by analysing
527,684 genome-wide SNPs in the TLE patient cohort. In the firststep, we identified a single locus on chromosome 11q21 centredon SNP rs10501829, which was significantly associated with thefirst PC of Module-1 expression (FDRo5%; Fig. 3a). Module-2showed no significant genome-wide associations (SupplementaryFig. 6). In the second step, we investigated in detail the locus onchromosome 11q21 regulating Module-1 and carried out jointmRNA levels-SNPs analysis of all genes in Module-1 and all SNPsgenotyped within a 1-Mbp region centred on SNP rs10501829.This analysis identified three additional SNPs (rs530190,rs7107661 and rs6483435) in the Best Model Visited (that is,the best combination of SNPs predicting mRNA level of modulegenes, see Supplementary Methods) that were associated with the
Chromosome
KDM4DLSRSF8
ENDOD1SESN3
FAM76BCEP57
MTMR2MAML2
Mbp95.7595.595.259594.75
Pro
port
ion
of M
odul
e-1
gene
sas
soci
ated
with
eac
h S
NP
Chromosome 11q21 locus
383 kb
rs10501829
rs10501829
rs7107661 rs6483435
rs530190
SESN3
ENDOD1
SFRS2B
CEP57
MTMR2
MTMR2 FAM76B
MAML2
KDM4DL
ENDOD1
Ave
rage
cor
rela
tion
with
mod
ule-
1ge
nes
expr
essi
on
Upr
egul
atio
n in
mou
se e
pile
ptic
hipp
ocam
pus
log 1
0 (f
old
chan
ge)
0.40.30.20.10.0–0.1–0.2–0.3–0.4
3
2
1
0
–1
–2
FOS
IL1AIL1B
CCL8OSM
TNF
CCL8 CCL2
CCL4
IL1RN
JUNBFOSB
NR4A2
KLF4
TSC22D3
APOLD1
SIK1
NFKBIZIER2 ZBTB16BTG2
KLF15PHLDA1
EGR3
FKBP5 PDK4
GADD45BC2CD4B
CDKN1A
MCL1
CD83HBEGF
PTGS2 PDGFB
ARRDC2 ITPRIP
SDPR ADMMAFF SERPINH1CYR61
LDLR
TNFRSF12ACH25H
C2CD4B KIF19
NLRP3CHST3
ZFP36GEMPIM1
ATF3GPR183
ECHDC3
EMP1CD14
CD69IP6K3
RGS1SERPINH1
100%
80%
60%
40%
20%
0%
Log 1
0 (B
ayes
fact
or)
10
8
6
4
2
0
–1
R2 = 0.35 (P = 5.4 x 10⁻⁶)
Correlation between Sesn3 and module-1 geneexpression in mouse hippocampus
0.20
0.15
0.10
0.05
0.00
–0.05
–0.10
–0.15
–0.200 4
2 3 4 5 6 7 8 9 10 11 12 13 14 15 16 17 18 19 20 21 221
2 6 8 10
Significance of correlation –log10 (P-value)
12 14
Figure 3 | SESN3 is a trans-acting genetic regulator of Module-1 in epileptic hippocampus. (a) Genome-wide mapping of the genetic regulation of
Module-1. For each autosome (horizontal axis), the strength of evidence for each SNP (filled dot) being a regulatory locus for the first PC of Module-1
expression is measured by the log10(Bayes factor) (vertical axis). The Bayes factor quantifies evidence in favour of genetic regulation versus no genetic
control of module expression, and is reported as a ratio between the strengths of these models. At 5% FDR (that is, log10(Bayes factor)46, dashed line),
SNP rs10501829 (11q21, highlighted in red) was significantly correlated with Module-1 expression. (b) Joint mRNA levels and SNPs analysis within the
1-Mbp region centred on SNP rs10501829, comprising 178 SNPs genotyped in the TLE patient cohort. We carried out multivariate Bayesian regression
modelling18 of all Module-1 probes (n¼80) and all SNPs (n¼ 178) to identify the most informative SNPs in the region predicting Module-1 expression. For
each SNP, we report the proportion of associated genes in Module-1 (vertical axes): four SNPs (rs10501829, rs530190, rs7107661 and rs6483435) that are
individually associated with 58–74% of Module-1 genes are highlighted. The grey box indicates the boundaries of the associated regulatory region
(delimited by SNPs rs530190 and rs6483435), spanning 383 kb. (c) For each candidate gene at the 1-Mbp regulatory locus, we report the average Pearson
correlation (r; ±s.e.m.) between the candidate gene’s expression and the expression of Module-1 genes (y axes) and its statistical significance for deviation
from r¼0 (x axes). Two-tailed P-values are reported on a negative log scale and were calculated using one sample Wilcoxon Signed Rank test. Two genes
(ENDOD1 and MTMR2) were represented by two microarray probes and were analysed separately. (d) Association between increased Sesn3 mRNA
expression and upregulation of Module-1 genes in epileptic mouse hippocampus. For each gene, we report its log10(fold change) in epilepsy versus
control (y axes) and its correlation with Sesn3 mRNA expression (x axes). The 95% confidence interval of the slope of the regression line is indicated.
TLR-signalling and cytokines genes are highlighted in blue.
NATURE COMMUNICATIONS | DOI: 10.1038/ncomms7031 ARTICLE
NATURE COMMUNICATIONS | 6:6031 | DOI: 10.1038/ncomms7031 | www.nature.com/naturecommunications 5
& 2015 Macmillan Publishers Limited. All rights reserved.

majority of genes of Module-1 (58–74% of Module-1 genes arepredicted by individual SNPs, Fig. 3b). The set of SNPs regulatingin trans the expression of Module-1 genes defined the boundariesof a minimal regulatory region spanning B383 kb (Fig. 3b).
The larger 1-Mbp region centred on SNP rs10501829contained eight annotated protein-coding genes (Fig. 3b). Tofurther prioritize candidate genes, we carried out co-expressionanalysis between each of these genes and all genes in Module-1,and found that Sestrin 3 (SESN3) was, on average, most stronglyand positively correlated with Module-1 gene expression (P¼ 1.7� 10� 13, Fig. 3c). The positive association between SESN3and Module-1 gene expression remained significant followinggenome-wide correlation analysis in human hippocampus(Po0.00001, Supplementary Fig. 7). In summary, SESN3 is theonly gene within the minimal regulatory region and, whencompared with all genes within a 1-Mbp window around SNPrs10501829, showed the strongest correlation with Module-1 geneexpression. Similarly, in the epileptic mouse hippocampus,we found that increased Sesn3 mRNA expression was alsosignificantly associated with upregulation of Module-1 genes(P¼ 5.4� 10� 6, Fig. 3d), therefore providing independent, cross-species evidence supporting SESN3 as a positive regulator ofModule-1 genes in epileptic hippocampus.
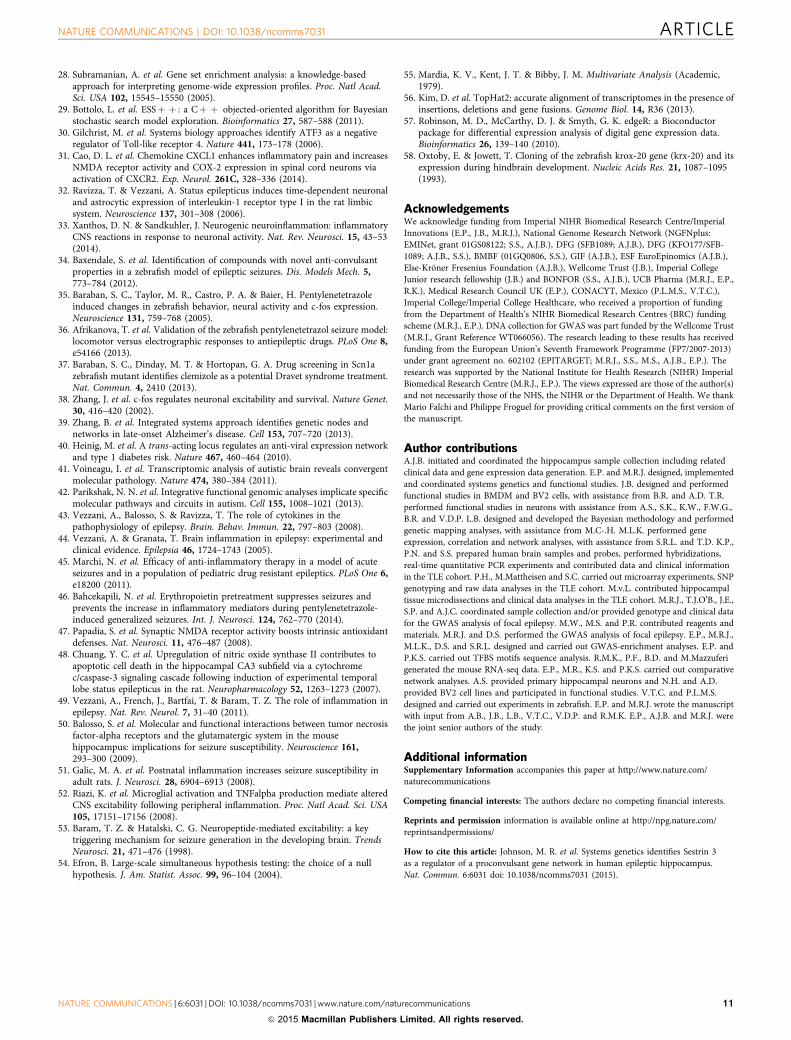
Taken together, these data prioritize SESN3 as a candidate genefor the trans-acting genetic regulation of Module-1. To test thishypothesis, we first carried out gene knockdown experimentsfollowed by transcriptional analysis of Module-1 genes by meansof RNA interference using short interfering RNA (siRNA).Initially, we used murine bone marrow-derived macrophages(BMDMs) and BV2 microglia cell line as an in vitro system asModule-1 recapitulates the ATF3/AP1 transcriptional complexand IL-1 signalling (Supplementary Fig. 8), known to be highlyexpressed in lipopolysaccharide (LPS)-stimulated macrophages30.Consistent with the positive correlation of Module-1 genes withSESN3 mRNA expression (Fig. 3c,d and Supplementary Fig. 7),we observed decreased expression of Module-1 genes aftersiRNA-mediated knockdown of SESN3 in both LPS-stimulatedBMDMs and BV2 microglia cells (Fig. 4a,b). Similar results werefound in unstimulated BV2 microglial cells, suggesting thatSESN3 can modulate expression of proinflammatory genes(for example, IL-1b, IL-1RN, IL-1a, TNFa) even in theabsence of a strong inflammatory stimulus (Fig. 4c). Within thehuman brain we localized SESN3 expression to neurons byimmunohistochemistry (Fig. 4d), and found that it is highlyexpressed in the hippocampus of TLE patients as compared withhippocampus from control autopsy samples (Fig. 4e andSupplementary Fig. 9). In keeping with this, we found increased
Sesn3 mRNA expression in the mouse hippocampus afterpilocarpine-induced status epilepticus (Supplementary Fig. 10),suggesting an association between SESN3 gene expression andepilepsy that is conserved across-species. We then tested whetherModule-1 genes are upregulated when SESN3 is overexpressed inneurons. To address this aim, we used an integrating lentiviralvector (LV) for gene overexpression in primary murine neurons(see Supplementary Methods) and quantitative PCR analysisshowed that the relative levels of Sesn3 mRNA were markedlyincreased in transduced neurons compared with the levelsobserved in mock transduction (Fig. 4f). Consistent with theobserved positive correlation between increased Sesn3 expressionand Module-1 genes in the hippocampus (Fig. 3c,d), lentiviral-mediated overexpression of Sesn3 resulted in significantupregulation of Module-1 genes in hippocampal neurons(Fig. 4f). These in vitro experiments show that Sesn3 is capableof regulating Module-1 gene expression in different cell types andin particular of inducing upregulation of proinflammatory genesin hippocampal neuronal cells. Our findings in primary neuronsare in keeping with previous data reporting the activity of severalinflammatory molecules in neuronal cells under pathologicalconditions31, including IL-1b and its receptor32. Furthermore, theupregulation of proinflammatory genes in neurons supports the‘neurogenic inflammation’ hypothesis, wherein neurons areproposed as triggers of innate and adaptive immune-cellactivation in the central nervous system (CNS; reviewed inXanthos and Sandkuhler33).
SESN3 regulates chemically induced behavioural seizures. Thein vitro data, combined with the positive association betweenSESN3 and Module-1 gene expression in human and mouseepileptic hippocampus, indicate that SESN3 is a positive regulatorof Module-1. We hypothesized that inhibiting SESN3 wouldreduce the activity of genes in functional pathways enriched inModule-1, including proconvulsant signalling molecules, andthus by extension could have seizure-suppressing effects. To testthis hypothesis in vivo, we investigated the role of SESN3 in azebrafish model of convulsant-induced seizures34,35. In thismodel, exposure of 2- or 3-day-old zebrafish larvae to theconvulsant agent pentylenetetrazole (PTZ) rapidly induces theexpression of synaptic activity-regulated genes in the CNS andcauses vigorous episodes of calcium flux in muscle cells as well asintense locomotor activity characteristic of epileptic seizures34,35.This acute seizure model has been primarily used to investigatethe anti-/proconvulsant activity of compounds36 and for in vivodrug discovery34. In particular, molecular and behavioural
Figure 4 | SESN3 regulates expression of Module-1 genes in macrophages, microglial cells and neurons. Effect of siRNA-mediated knockdown of Sesn3
as compared with control siRNA (siControl), showing significant inhibition of Sesn3 mRNA expression and downregulation of Module-1 genes in murine
LPS-stimulated (1 h) BMDM (a) and BV2 microglial cells (b), as well as in unstimulated BV2 microglial cells (c). Five independent biological replicates were
used for BMDM experiments and at least three replicates in the BV2 microglia cells experiments. Data normalized to b-actin levels are shown as means
relative to control ±s.e.m. (d) SESN3 immunofluorescence of human hippocampal slices from TLE patients: co-immunostainings with NeuN (green)
antibody showed that SESN3 (red) is localized in neurons. Scale bar, 100 mm. (e) Quantification of SESN3 expression in human hippocampal tissue by
immunofluorescence analysis. Maximum intensity projections of confocal z-stack images of immunohistochemical stainings with antibody against SESN3
were used. For determination of SESN3 cell fluorescence as a measure of SESN3 expression level, SESN3-expressing cells in the CA2 region of the
hippocampus in both TLE patients samples (n¼ 7) and autopsy samples (n¼ 8) were measured using ImageJ software. Cell fluorescence was assessed as
follows: integrated density—(area of selected cell�mean fluorescence of background readings). SESN3 total cell fluorescence in TLE patients is
significantly increased as compared with the SESN3 total cell fluorescence in autopsy samples (two-tailed Mann–Whitney test, Po0.001). Fluorescence
intensity data are reported as means±s.e.m. (f) Effect of lentiviral-mediated Sesn3 overexpression on Module-1 genes in primary hippocampal neurons.
Left, relative levels of Sesn3 mRNA in transduced neurons (LV-CMV-Sesn3) compared with the levels in mock transduction (Mock). Right, relative mRNA
levels of Module-1 genes and a control gene not in the network (Hprt) in transduced neurons compared with levels in mock transduction. Data normalized
to Gapdh levels are shown as means relative to control ±s.e.m. Four (Mock group) and twelve (LV-CMV-Sesn3 group) replicates were used in neuronal cell
experiments. Statistical significance of the differences (P-value) between siSESN3 (or LV-CMV-Sesn3) and siControl (or Mock) was assessed by t-test
(two-tailed) and adjusting for unequal variances across different groups. *Po0.05; **Po0.01; ***Po0.001; ****Po0.0001; NS, not significant (P40.05).
ARTICLE NATURE COMMUNICATIONS | DOI: 10.1038/ncomms7031
6 NATURE COMMUNICATIONS | 6:6031 | DOI: 10.1038/ncomms7031 | www.nature.com/naturecommunications
& 2015 Macmillan Publishers Limited. All rights reserved.
phenotypes in the zebrafish PTZ-induced seizure model havebeen employed to identify compounds that attenuate seizureactivity37. We employed this model to correlate the locomotorresponses with gene network dynamics, that is, transcriptional
activation of the neuronal activity-regulated gene c-fos38 and anadditional subset of Module-1 genes in response to PTZtreatment in Sesn3 morphant and control morphant larvae.Sesn3 showed widespread expression in the brain of 3 and 4 days
0
1
2
3
4
5
6
7
8
JUNB
IL1B
NLRP3
GADD45B
FOSCCL4
IL1R
NEGR2
EGR3ATF3
IL1A
FOSBTNF
Rel
ativ
e ge
ne e
xpre
ssio
n
Rel
ativ
e S
ES
N3
expr
essi
on
0
10
20
30
40
50
60
70
80
90
100
Moc
kLV
-CM
V-Ses
n3
ns
***
***
******
***
***
***
** **
**
**
*
*****
NeuNSesn3NeuNSesn3
siControl
siSESN3
Mock
LV-CMV-Sesn3
Primary neurons
LPS-stimulated macrophages
LPS-stimulated microglial cells
Unstimulated microglial cells
HPRT(controlgene)
0
20
40
60
80
100x106
Flu
ores
cenc
e in
tens
ity in
SE
SN
3-ex
pres
sing
cel
ls
P<0.001
Autopsysamples
TLE-patient’ssamples
0.0
0.3
0.5
0.8
1.0
1.3
1.5
0.0
0.3
0.5
0.8
1.0
1.3
1.5
IL1B IL
1A
IL1R
N
NLRP3
ATF3
EGR2
EGR3FOS
JUNB
FOSBCD69
TNFCCL4
0.0
0.3
0.5
0.8
1.0
1.3
1.5
IL1B IL
1A
IL1R
N
NLRP3
ATF3
EGR2
EGR3FOS
JUNB
FOSBCD69
TNF
GADD45B
0.0
0.3
0.5
0.8
1.0
1.3
1.5
IL1B IL
1A
IL1R
N
NLRP3
ATF3
EGR2
EGR3FOS
JUNB
FOSBCD69
TNF
GADD45B
HPRT
0.0
0.3
0.5
0.8
1.0
1.3
1.5
Rel
ativ
e ge
ne e
xpre
ssio
nR
elat
ive
gene
exp
ress
ion
**
***
*
**
**
****
****
**
***
* *
*
***
ns
*****
*** ******
*****
***
**
**
siCon
trol
siSESN3
siCon
trol
siSESN3
**
*** **
***
*****
**
***
***
NS
**
Rel
ativ
e ge
ne e
xpre
ssio
nns
HPRT(control gene)
siControl
siSESN3
siControl
siSESN3
Rel
ativ
e S
ES
N3
expr
essi
onR
elat
ive
SE
SN
3 ex
pres
sion
NATURE COMMUNICATIONS | DOI: 10.1038/ncomms7031 ARTICLE
NATURE COMMUNICATIONS | 6:6031 | DOI: 10.1038/ncomms7031 | www.nature.com/naturecommunications 7
& 2015 Macmillan Publishers Limited. All rights reserved.
post fertilization (d.p.f.) zebrafish larvae (Supplementary Fig. 11)and, following PTZ treatment, we found that Sesn3 morphantzebrafish larvae exhibited significantly reduced locomotor activityas compared with control morphant larvae (Fig. 5a). To test thespecificity of the morpholino effect, we co-injected the Sesn3morpholinos (Supplementary Fig. 12) along with synthetic Sesn3mRNA, which cannot be targeted by either of the splice-blockingmorpholinos (see Supplementary Methods), and assessed whetherthe Sesn3 mRNA could rescue the morphant phenotype. Weobserved an almost complete rescue of the locomotor activity
phenotype (only 10% difference between uninjected larvae andlarvae co-injected with Sesn3 morpholinos and Sesn3 mRNA),with no significant differences in the locomotor activities betweenthe uninjected larvae and the larvae injected with synthetic Sesn3mRNA alone (Fig. 5b).
To further confirm Sesn3-dependent modification of neuronalresponse to PTZ, we measured transcriptional activation of theneuronal activity-regulated gene c-fos, an important regulatorfor cellular mechanisms mediating neuronal excitability andsurvival38. Consistent with the behavioural assay (Fig. 5a), there
0
1
2
3
4
5
6
7
8
0
1
10
100
1,000
1,000
800
600
400
200
0
Cum
ulat
ive
dist
ance
sw
am (
mm
)
0
200
400
600
800
1,000
1,200D
ista
nce
swam
(m
m)
Control morpholinoControl morpholino + PTZSesn3 morpholinosSesn3 morpholinos + PTZ
0–10 m
in
10–20
min
20–30
min
30–40
min
40–50
min
50–60
min
Sesn3morpholinos
Sesn3 morpholinos+ mRNA rescue
Sesn3mRNA
Cum
ulat
ive
dist
ance
sw
am (
mm
)
Controlmorpholino
0
100
200
300
400
500
600
700
800
900 P = 1 x 10⁻⁴
P = 8 x 10⁻⁴P = 8 x 10⁻⁴
41% 8% 10%
Ses
n3m
orph
olin
osC
ontr
olm
orph
olin
o
Controlmorpholino
Sesn3morpholinos
c-fo
s m
RN
A e
xpre
ssio
n
0
20
40
60
80
100
120
Fol
d ch
ange
in g
ene
expr
essi
onfo
llow
ing
PT
Z in
duct
ion
Control (uninjected larvae)Sesn3 morpholinos
fosb atf3 egr2b gapdh
NS
fosb atf3 egr2bsesn3
P = 0.0001
P = 0.007 P = 0.02 P = 0.05
Control (uninjected embryos)Embryos injected with Sesn3 mRNA
mR
NA
exp
ress
ion
NS
gapdh
Untreated PTZtreated
Untreated
PTZ treated
Untreated
PTZ treated
Untreated
PTZ treated
P = 2.7 x 10⁻⁴
P = 6.4 x 10⁻⁴
P = 5.6 x 10⁻⁵
P = 4.0 x 10⁻⁴
P = 7.8 x 10⁻³
Controlmorpholino
Sesn3morpholinos
Figure 5 | Sesn3 modulates PTZ-induced c-fos expression, locomotor convulsions and Module-1 genes in zebrafish. (a) Left, Sesn3 promotes convulsive
locomotor response of zebrafish larvae exposed to PTZ. Three days post fertilization (d.p.f.) zebrafish larvae were incubated with and without 20 mM PTZ
for 1 h and locomotor activity was monitored continuously. Larvae microinjected with Sesn3 morpholinos exhibited a sustained reduction in locomotor
activity throughout the period of PTZ incubation, in comparison with control morphant larvae. Both Sesn3 morphant and control morphant larvae (n¼ 12)
exhibited similarly low levels of locomotor activity in the absence of PTZ. Right, Sesn3 morpholinos reduced the cumulative locomotor activity of zebrafish
exposed to 20 mM PTZ (black columns) without appreciably affecting basal locomotor activity of larvae incubated in the absence of PTZ (white columns).
(b) Co-injecting Sesn3 morpholinos with synthetic Sesn3 mRNA showed that Sesn3 mRNA rescued the locomotor activity phenotype (total distance swam,
y axis). For each group, 16–18 larvae were analysed. Black bars, 1 h PTZ treatment (20 mM). (c) Sesn3 morpholinos attenuate seizure-induced expression of
the synaptic activity-regulated gene c-fos. Left and central images, dorsal views of the brains of 3 d.p.f. control morphant (top) and Sesn3 morphant larvae
(bottom) maintained for 1 h in the absence and presence of 20 mM PTZ, after which larvae were fixed and analysed for c-fos expression by whole-mount
in situ hybridization. Red arrowheads: position of the transverse sections of the brains; scale bar, 200mm. Following PTZ treatment (20 mM, 1 h),
quantitative PCR (qPCR) analysis revealed that Sesn3 morphant larvae exhibited significantly lower mRNA expression of c-fos in the brain than control
morphant larvae (c, right panel). (d) PTZ-induced transcriptional response of Module-1 genes was significantly lower in Sesn3 morphants as compared with
uninjected larvae; six samples were used in the qPCR experiments (one sample¼ 15–20 pooled larvae). (e) Upregulation of Module-1 genes upon injection
of synthetic mRNA (1 ng) in zebrafish embryos (n¼ 30) as compared with uninjected control embryos (n¼ 30). Total RNA was extracted 28 h post
fertilization and qPCR experiments were performed for the two pools of embryos using six technical replicates. Data reported as means±s.e.m. were
determined by the 2�DDCt method and normalized to the housekeeping gene b-actin. P-values calculated by t-test (two-tailed) adjusting for unequal
variances across different groups. NS, not significant (P40.05).
ARTICLE NATURE COMMUNICATIONS | DOI: 10.1038/ncomms7031
8 NATURE COMMUNICATIONS | 6:6031 | DOI: 10.1038/ncomms7031 | www.nature.com/naturecommunications
& 2015 Macmillan Publishers Limited. All rights reserved.
was decreased expression of c-fos in the brain (mostly in forebrainand midbrain) following PTZ exposure in Sesn3 morphant larvaeas compared with control morphant larvae (Fig. 5c andSupplementary Fig. 12). As silencing of Sesn3 resulted indownregulation of Module-1 genes in vitro (Fig. 4a–c), wetested whether inhibiting Sesn3 could similarly reduce the activityof Module-1 genes following PTZ exposure in vivo. We observedsignificant reduction in the PTZ-induced mRNA expression ofModule-1 genes in the Sesn3 morphant as compared with controlmorphant larvae (Fig. 5d), and we also found that transientoverexpression of Sesn3 in zebrafish larvae increased expressionof Module-1 genes independently of PTZ treatment (Fig. 5e).Taken together, these data show that Sesn3 knockdown attenuatesboth PTZ-induced locomotor convulsive behaviour and thetranscriptional responses of c-fos and Module-1 genes totreatment with PTZ. These findings in the zebrafish modelsupport the evidence from our studies of human and mouseepileptic hippocampus and primary murine neurons that SESN3positively regulates expression of proconvulsive molecules(Module-1 genes).
DiscussionDeciphering the complex regulatory processes of pathophysiolo-gical pathways in human brain remains a challenge due to theinaccessibility of ante-mortem tissue but can have importantmechanistic and therapeutic implications39. In this study, we haveused surgical hippocampal tissue samples and employed systemsgenetics approaches17 to investigate transcriptional networks forepilepsy and their genetic regulation. We identified a large geneco-expression network in the human epileptic hippocampus thatwas conserved in mouse epileptic hippocampus and was enrichedfor GWAS genetic signals of focal epilepsy. In keeping withsimilar network-based studies of complex disease such as type-1diabetes40 and autism spectrum disorder41,42, our approachleverages the combined evidence from genetic susceptibilityvariants across multiple genes15 to link the TLE-hippocampusnetwork with susceptibility to focal epilepsy. Within the TLE-network, we identified a functionally coherent and coordinatedtranscriptional programme (Module-1), which was overexpressedin the hippocampus of TLE patients, and which encodedepileptogenic IL-1 (refs 2,3,43) and TLR-signalling pathways1.We confirmed the upregulation TLR-signalling genes andproinflammatory cytokines in chronic epilepsy by RNA-Seqanalysis in 200 mouse hippocampi. Preclinical studies inexperimental models of epilepsy have consistently shown thatindividual proinflammatory cytokines such as IL-1b or tumornecrosis factor (TNF)-a are overexpressed in brain areas ofseizure generation and propagation44. Therefore, targeting TLRand IL-1 signalling has been proposed as a possible avenue fortherapeutic intervention in epilepsy and antiepileptogenesis1,3,including reduction of acute seizures45 and drug-resistant chronicepileptic activity46. The identification of upstream geneticregulators of these pathways in the human epileptic brainmight suggest opportunities for novel targets for diseasemodification. To investigate the genetic regulation of theTLE-network and the proinflammatory module therein, weemployed Bayesian expression QTL mapping approaches18,which identified SESN3 as a trans-acting genetic regulator of aproinflammatory transcriptional programme in the epileptichuman hippocampus. The positive regulation of this networkby SESN3 was confirmed in vitro across different cell types bygene silencing (resulting in B50% reduction of Module-1 geneexpression) and overexpression experiments (resulting inapproximately two- to sevenfold activation of Module-1 genes,Fig. 4), and in vivo using a zebrafish model of chemically inducedseizures (Fig. 5e).
SESN3 is a member of the Sestrin family of proteins that havebeen shown to decrease intracellular reactive oxygen species andto confer resistance to oxidative stress19. Intrinsic antioxidantdefenses are important for neuronal longevity and the genesthat regulate these processes might well influence pathologicalprocesses associated with oxidative damage in the brain, acommon feature of many neurodegenerative diseases includingepilepsy47,48. Therefore, we hypothesize that SESN3 mightregulate neuro-inflammatory molecules, previously implicatedin epilepsy1,33,43,49, through modulation of oxidative stress inthe brain.
Our systems genetics analysis in the human hippocampus,combined with in vitro and in vivo data, revealed SESN3-dependent regulation of epileptogenic IL-1b3 and TLR-signallinggenes1. The upstream genetic control of the proconvulsanttranscriptional programme by SESN3 in human TLE-hippocampus suggested a role for this gene in modulatingseizures. To test the potential functional role of SESN3 in vivo, weused an experimental model of acute epileptic seizures34,37 andfound that knockdown of Sesn3 attenuated chemical convulsant-induced locomotor activity and c-fos expression, as well asmodulating Module-1 gene expression (Fig. 5). Our in vitro datain macrophages, BV2 microglial cells and primary neuronsshowed that SESN3 is a positive regulator of proinflammatorymolecules (Fig. 4), including IL-1b and TNF-a, major mediatorsof inflammation, which are capable of inducing changes inneuronal excitability50. The finding of reduced severity ofPTZ-induced seizures upon knockdown of Sesn3 in thezebrafish model is consistent with previous studies in rodentsdescribing the effects of proinflammatory cytokines on seizures.In the context of pre-existing brain inflammation, antibody-mediated antagonism of TNF-a function inhibited susceptibilityto PTZ-induced seizures in rats51, whereas administration ofexogenous TNF-a increased susceptibility to PTZ-inducedseizures52. Our findings in zebrafish are therefore in keepingwith a role for SESN3 in regulating proinflammatory cytokinesand their downstream effect on CNS excitability and seizuresusceptibility.
Taken together, our data provide the first evidence of afunction for SESN3 in regulating proconvulsant agents (forexample, TNF-a, IL-1 and TLR-signalling genes) in humanepileptic hippocampus, and suggest SESN3 as a new potentialtarget for modulating brain inflammation3,44 and CNSexcitability53. Our systems genetics approach builds on andextends previous methods correlating individual genetic variationwith disease susceptibility by identifying disease-associated genenetworks, pathophysiological pathways and their upstreamgenetic regulators in human brain. More generally, the systemsgenetics framework described here can be employed to identifygenes and regulatory networks across diverse neuropsychiatricdisorders where genetic factors can perturb underlying molecularpathways in the brain.
MethodsGene expression profiling in the human hippocampus. All 129 patientsconsidered in this study had mesial TLE and all tissue samples were fromindistinguishable hippocampal tissue portions. Sample preparation and microarrayanalysis of human hippocampi are detailed in Supplementary Methods. Expressiondata were analysed using Illumina’s GenomeStudio Gene Expression Module andnormalized by quantile normalization with background subtraction. Microarrayprobes were annotated using either the Human HT-12 v3 annotation file orEnsembl (release 72). All patients gave informed consent for use of their tissue andall procedures were conducted in accordance with the Declaration of Helsinki andapproved by the Ethics Committee of the University of Bonn Medical Center.
Gene co-expression network analysis. Gene co-expression networks werereconstructed using GGMs, which use partial correlations to infer co-expressionrelationships between any microarray probe pair in the data set, removing the
NATURE COMMUNICATIONS | DOI: 10.1038/ncomms7031 ARTICLE
NATURE COMMUNICATIONS | 6:6031 | DOI: 10.1038/ncomms7031 | www.nature.com/naturecommunications 9
& 2015 Macmillan Publishers Limited. All rights reserved.
effect of other probes23. We used the empirical Bayes local FDR statistics54
to extract significant partial correlations (Supplementary Fig. 13), and whichidentified a large set of 2,124 inter-connected nodes belonging to the sameconnected component (TLE-network, Supplementary Data 2). Network extractionand identification of transcriptional modules are described in the SupplementaryMethods.
Mapping the genetic control of networks. We used Bayesian variable selectionmodels18,29 to identify the genetic control points (regulatory ‘hotspots’) oftranscriptional modules in the TLE patient cohort. First, we combined PCanalysis55 with multivariate regression approaches to prioritize genome-widegenomic regions associated with the module expression. We then analysed all genesof the module with all SNPs in the regulatory region using the hierarchicalevolutionary stochastic search algorithm18, where the module genes’ expression arejointly considered. Further details are reported in Supplementary Methods.
Genetic association of the TLE-network with epilepsy. To test if TLE-networkgenes are likely to be causally involved in the disease process, we assessed whethernetwork genes are enriched for SNP variants associated to focal epilepsy byGWAS6,25. Full details on the GWAS of focal epilepsy are reported inSupplementary Methods. Briefly, in the GWAS-enrichment analysis each gene ofthe TLE-network was assigned a GWAS significance value consisting of thesmallest P-value of all SNPs mapped to it. We used the hypergeometric distributiontest to assess whether SNPs close to (o100 kb from) any network gene were morelikely to associate with epilepsy by GWAS than SNPs close to genes not in theTLE-network. Empirical GWAS-enrichment P-values were generated by 1,000,000randomly selected gene-sets and are reported in Supplementary Table 2 (seeSupplementary Methods for additional details).
RNA-Seq analysis in the mouse hippocampus. RNA-Seq analysis in wholehippocampus from 100 epileptic (pilocarpine model)27 and 100 control naıve mice(NMRI) is detailed in Supplementary Methods. Briefly, raw reads were mapped tothe reference mouse genome (mm10) using TopHat version 2.0.8 (ref. 56) and readcounts per gene were normalized across all samples using the ‘trimmed mean ofM-value’ approach57. Differential expression analysis was performed using theedgeR57 and a threshold of 5% FDR was used to identify significant gene expressionchanges. Experimental animals were used only once for each study. Allexperimental procedures complied with the guidelines of the European UnionDirective 2010/63/EU. A local ethical committee approved the experimentalprotocol.
In vitro studies. Details on all cell cultures used in these studies are reportedin Supplementary Methods. SiRNA knockdown experiments were performedin murine BMDMs and BV2 microglia cell lines using a mouse Sesn3ON-TARGETplus SMARTpool siRNA (100 nM, ThermoFisher Scientific) andDharmafect 1 (ThermoFisher Scientific) as transfection reagent, according tothe manufacturer’s recommendations. For LPS stimulation experiments, thetransfected cells were washed twice in DMEM and stimulated with LPS (Sigma,100 ng ml� 1) for an hour. For overexpression experiments, a third-generation LVwas used to transduce murine primary hippocampal neuronal culture. Additionalinformation and details on Sesn3 siRNA target sequences, the real-time quantita-tive PCR for Module-1 genes and primer sequences are given in SupplementaryMethods and Supplementary Table 4. The relative expression levels normalized toBeta-actin (or Gapdh as indicated) gene expression were then determined by the2�DDCt method.
In vivo studies. To study the function of sestrin 3 in response to PTZ-inducedseizures, two different morpholinos were designed to block the normal splicingof the zebrafish Sesn3 primary transcript (see Supplementary Fig. 12 andSupplementary Methods). Embryos that were to be analysed by whole-mountin situ hybridization were first treated with 1-phenyl-2 thiourea at 23 h postfertilization (h.p.f.) to inhibit melanogenesis. At 3 d.p.f., larvae were treated for 1 hwith 20 mM PTZ or left untreated, and all larvae were then fixed with paraf-ormaldehyde immediately after the treatment period. RNA in situ hybridizationanalysis was carried out using a c-fos digoxigenin-labelled probe, which was pre-pared as recommended by the manufacturer of the in situ hybridization reagents(Roche). Whole-mount in situ hybridization was performed using standardprocedures58. Analysis of zebrafish locomotor activity was carried out using theViewpoint Zebrabox system (Viewpoint) as previously reported in ref. 34. Briefly,3 d.p.f. larvae were incubated in E3 medium with or without 20 mM PTZ inmicrotitre plates, with one larva per well, and larval movements were recorded withthe Viewpoint Zebrabox over a recording period of 60 min, using a light cycle of2 min: 100% light; 2 min: 0% light. The distance swam by each larva was measuredfor every 10-min period during the recording period, and the cumulative distanceswam over the recording period was calculated. Rescue experiments wereperformed by co-injection of synthetic sesn3 RNA into one-cell stage AB wild-typezebrafish embryos alone (2 nl of 0.3 ng nl� 1 sesn3 mRNA) or in combination withSesn3 morpholinos. Additional details, including the quantitative PCR analyses of
c-fos and Module-1 genes, primer sequences are reported in SupplementaryMethods. All experimental procedures involving zebrafish were performed incompliance with the UK Animal (Scientific Procedures) Act and approved by theUniversity of Sheffield Animal Welfare Ethical Review Board.
References1. Maroso, M. et al. Toll-like receptor 4 and high-mobility group box-1 are
involved in ictogenesis and can be targeted to reduce seizures. Nataure Med. 16,413–419 (2010).
2. Vezzani, A. et al. Powerful anticonvulsant action of IL-1 receptor antagonist onintracerebral injection and astrocytic overexpression in mice. Proc. Natl Acad.Sci. USA 97, 11534–11539 (2000).
3. Maroso, M. et al. Interleukin-1beta biosynthesis inhibition reduces acuteseizures and drug resistant chronic epileptic activity in mice. Neurotherapeutics8, 304–315 (2011).
4. Miller, L. L., Pellock, J. M., DeLorenzo, R. J., Meyer, J. M. & Corey, L. A.Univariate genetic analyses of epilepsy and seizures in a population-based twinstudy: the Virginia Twin Registry. Genet. Epidemiol. 15, 33–49 (1998).
5. Kjeldsen, M. J., Kyvik, K. O., Christensen, K. & Friis, M. L. Genetic andenvironmental factors in epilepsy: a population-based study of 11900 Danishtwin pairs. Epilepsy Res. 44, 167–178 (2001).
6. Speed, D. et al. Describing the genetic architecture of epilepsy throughheritability analysis. Brain 137, 2680–2689 (2014).
7. Kasperaviciute, D. et al. Common genetic variation and susceptibility to partialepilepsies: a genome-wide association study. Brain 133, 2136–2147 (2010).
8. Guo, Y. et al. Two-stage genome-wide association study identifies variants inCAMSAP1L1 as susceptibility loci for epilepsy in Chinese. Hum. Mol. Genet.21, 1184–1189 (2012).
9. EPICURE Consortium et al. Genome-wide association analysis of geneticgeneralized epilepsies implicates susceptibility loci at 1q43, 2p16.1, 2q22.3 and17q21.32. Hum. Mol. Genet. 21, 5359–5372 (2012).
10. Allen, A. S. et al. De novo mutations in epileptic encephalopathies. Nature 501,217–221 (2013).
11. International League Against Epilepsy Consortium on Complex Epilepsies.Genetic determinants of common epilepsies: a meta-analysis of genome-wideassociation studies. Lancet Neurol. 13, 893–903 (2014).
12. Sullivan, P. F., Daly, M. J. & O’Donovan, M. Genetic architectures of psychiatricdisorders: the emerging picture and its implications. Nat. Rev. Genet. 13,537–551 (2012).
13. Guan, Y. et al. Tissue-specific functional networks for prioritizing phenotypeand disease genes. PLoS Comput. Biol. 8, e1002694 (2012).
14. Piro, R. M. et al. An atlas of tissue-specific conserved coexpression for functionalannotation and disease gene prediction. Eur. J. Hum. Genet. 19, 1173–1180 (2011).
15. Califano, A., Butte, A. J., Friend, S., Ideker, T. & Schadt, E. Leveraging modelsof cell regulation and GWAS data in integrative network-based associationstudies. Nature Genet. 44, 841–847 (2012).
16. Bartolomei, F., Chauvel, P. & Wendling, F. Epileptogenicity of brain structuresin human temporal lobe epilepsy: a quantified study from intracerebral EEG.Brain 131, 1818–1830 (2008).
17. Civelek, M. & Lusis, A. J. Systems genetics approaches to understand complextraits. Nat. Rev. Genet. 15, 34–48 (2014).
18. Bottolo, L. et al. Bayesian detection of expression quantitative trait loci hotspots. Genetics 189, 1449–1459 (2011).
19. Budanov, A. V., Sablina, A. A., Feinstein, E., Koonin, E. V. & Chumakov, P. M.Regeneration of peroxiredoxins by p53-regulated sestrins, homologs of bacterialAhpD. Science 304, 596–600 (2004).
20. Nogueira, V. et al. Akt determines replicative senescence and oxidative oroncogenic premature senescence and sensitizes cells to oxidative apoptosis.Cancer Cell 14, 458–470 (2008).
21. Zamkova, M., Khromova, N., Kopnin, B. P. & Kopnin, P. Ras-induced ROSupregulation affecting cell proliferation is connected with cell type-specificalterations of HSF1/SESN3/p21Cip1/WAF1 pathways. Cell Cycle 12, 826–836(2013).
22. Hagenbuchner, J. et al. FOXO3-induced reactive oxygen species are regulatedby BCL2L11 (Bim) and SESN3. J. Cell Sci. 125, 1191–1203 (2012).
23. Schafer, J. & Strimmer, K. An empirical Bayes approach to inferring large-scalegene association networks. Bioinformatics 21, 754–764 (2005).
24. Rossin, E. J. et al. Proteins encoded in genomic regions associated withimmune-mediated disease physically interact and suggest underlying biology.PLoS Genet. 7, e1001273 (2011).
25. Speed, D. et al. A genome-wide association study and biological pathwayanalysis of epilepsy prognosis in a prospective cohort of newly treated epilepsy.Hum. Mol. Genet. 23, 247–258 (2014).
26. Ravizza, T. et al. The IL-1beta system in epilepsy-associated malformations ofcortical development. Neurobiol. Dis. 24, 128–143 (2006).
27. Mazzuferi, M., Kumar, G., Rospo, C. & Kaminski, R. M. Rapid epileptogenesisin the mouse pilocarpine model: video-EEG, pharmacokinetic andhistopathological characterization. Exp. Neurol. 238, 156–167 (2012).
ARTICLE NATURE COMMUNICATIONS | DOI: 10.1038/ncomms7031
10 NATURE COMMUNICATIONS | 6:6031 | DOI: 10.1038/ncomms7031 | www.nature.com/naturecommunications
& 2015 Macmillan Publishers Limited. All rights reserved.
28. Subramanian, A. et al. Gene set enrichment analysis: a knowledge-basedapproach for interpreting genome-wide expression profiles. Proc. Natl Acad.Sci. USA 102, 15545–15550 (2005).
29. Bottolo, L. et al. ESSþ þ : a Cþ þ objected-oriented algorithm for Bayesianstochastic search model exploration. Bioinformatics 27, 587–588 (2011).
30. Gilchrist, M. et al. Systems biology approaches identify ATF3 as a negativeregulator of Toll-like receptor 4. Nature 441, 173–178 (2006).
31. Cao, D. L. et al. Chemokine CXCL1 enhances inflammatory pain and increasesNMDA receptor activity and COX-2 expression in spinal cord neurons viaactivation of CXCR2. Exp. Neurol. 261C, 328–336 (2014).
32. Ravizza, T. & Vezzani, A. Status epilepticus induces time-dependent neuronaland astrocytic expression of interleukin-1 receptor type I in the rat limbicsystem. Neuroscience 137, 301–308 (2006).
33. Xanthos, D. N. & Sandkuhler, J. Neurogenic neuroinflammation: inflammatoryCNS reactions in response to neuronal activity. Nat. Rev. Neurosci. 15, 43–53(2014).
34. Baxendale, S. et al. Identification of compounds with novel anti-convulsantproperties in a zebrafish model of epileptic seizures. Dis. Models Mech. 5,773–784 (2012).
35. Baraban, S. C., Taylor, M. R., Castro, P. A. & Baier, H. Pentylenetetrazoleinduced changes in zebrafish behavior, neural activity and c-fos expression.Neuroscience 131, 759–768 (2005).
36. Afrikanova, T. et al. Validation of the zebrafish pentylenetetrazol seizure model:locomotor versus electrographic responses to antiepileptic drugs. PLoS One 8,e54166 (2013).
37. Baraban, S. C., Dinday, M. T. & Hortopan, G. A. Drug screening in Scn1azebrafish mutant identifies clemizole as a potential Dravet syndrome treatment.Nat. Commun. 4, 2410 (2013).
38. Zhang, J. et al. c-fos regulates neuronal excitability and survival. Nature Genet.30, 416–420 (2002).
39. Zhang, B. et al. Integrated systems approach identifies genetic nodes andnetworks in late-onset Alzheimer’s disease. Cell 153, 707–720 (2013).
40. Heinig, M. et al. A trans-acting locus regulates an anti-viral expression networkand type 1 diabetes risk. Nature 467, 460–464 (2010).
41. Voineagu, I. et al. Transcriptomic analysis of autistic brain reveals convergentmolecular pathology. Nature 474, 380–384 (2011).
42. Parikshak, N. N. et al. Integrative functional genomic analyses implicate specificmolecular pathways and circuits in autism. Cell 155, 1008–1021 (2013).
43. Vezzani, A., Balosso, S. & Ravizza, T. The role of cytokines in thepathophysiology of epilepsy. Brain. Behav. Immun. 22, 797–803 (2008).
44. Vezzani, A. & Granata, T. Brain inflammation in epilepsy: experimental andclinical evidence. Epilepsia 46, 1724–1743 (2005).
45. Marchi, N. et al. Efficacy of anti-inflammatory therapy in a model of acuteseizures and in a population of pediatric drug resistant epileptics. PLoS One 6,e18200 (2011).
46. Bahcekapili, N. et al. Erythropoietin pretreatment suppresses seizures andprevents the increase in inflammatory mediators during pentylenetetrazole-induced generalized seizures. Int. J. Neurosci. 124, 762–770 (2014).
47. Papadia, S. et al. Synaptic NMDA receptor activity boosts intrinsic antioxidantdefenses. Nat. Neurosci. 11, 476–487 (2008).
48. Chuang, Y. C. et al. Upregulation of nitric oxide synthase II contributes toapoptotic cell death in the hippocampal CA3 subfield via a cytochromec/caspase-3 signaling cascade following induction of experimental temporallobe status epilepticus in the rat. Neuropharmacology 52, 1263–1273 (2007).
49. Vezzani, A., French, J., Bartfai, T. & Baram, T. Z. The role of inflammation inepilepsy. Nat. Rev. Neurol. 7, 31–40 (2011).
50. Balosso, S. et al. Molecular and functional interactions between tumor necrosisfactor-alpha receptors and the glutamatergic system in the mousehippocampus: implications for seizure susceptibility. Neuroscience 161,293–300 (2009).
51. Galic, M. A. et al. Postnatal inflammation increases seizure susceptibility inadult rats. J. Neurosci. 28, 6904–6913 (2008).
52. Riazi, K. et al. Microglial activation and TNFalpha production mediate alteredCNS excitability following peripheral inflammation. Proc. Natl Acad. Sci. USA105, 17151–17156 (2008).
53. Baram, T. Z. & Hatalski, C. G. Neuropeptide-mediated excitability: a keytriggering mechanism for seizure generation in the developing brain. TrendsNeurosci. 21, 471–476 (1998).
54. Efron, B. Large-scale simultaneous hypothesis testing: the choice of a nullhypothesis. J. Am. Statist. Assoc. 99, 96–104 (2004).
55. Mardia, K. V., Kent, J. T. & Bibby, J. M. Multivariate Analysis (Academic,1979).
56. Kim, D. et al. TopHat2: accurate alignment of transcriptomes in the presence ofinsertions, deletions and gene fusions. Genome Biol. 14, R36 (2013).
57. Robinson, M. D., McCarthy, D. J. & Smyth, G. K. edgeR: a Bioconductorpackage for differential expression analysis of digital gene expression data.Bioinformatics 26, 139–140 (2010).
58. Oxtoby, E. & Jowett, T. Cloning of the zebrafish krox-20 gene (krx-20) and itsexpression during hindbrain development. Nucleic Acids Res. 21, 1087–1095(1993).
AcknowledgementsWe acknowledge funding from Imperial NIHR Biomedical Research Centre/ImperialInnovations (E.P., J.B., M.R.J.), National Genome Research Network (NGFNplus:EMINet, grant 01GS08122; S.S., A.J.B.), DFG (SFB1089; A.J.B.), DFG (KFO177/SFB-1089; A.J.B., S.S.), BMBF (01GQ0806, S.S.), GIF (A.J.B.), ESF EuroEpinomics (A.J.B.),Else-Kroner Fresenius Foundation (A.J.B.), Wellcome Trust (J.B.), Imperial CollegeJunior research fellowship (J.B.) and BONFOR (S.S., A.J.B.), UCB Pharma (M.R.J., E.P.,R.K.), Medical Research Council UK (E.P.), CONACYT, Mexico (P.L.M.S., V.T.C.),Imperial College/Imperial College Healthcare, who received a proportion of fundingfrom the Department of Health’s NIHR Biomedical Research Centres (BRC) fundingscheme (M.R.J., E.P.). DNA collection for GWAS was part funded by the Wellcome Trust(M.R.J., Grant Reference WT066056). The research leading to these results has receivedfunding from the European Union’s Seventh Framework Programme (FP7/2007-2013)under grant agreement no. 602102 (EPITARGET; M.R.J., S.S., M.S., A.J.B., E.P.). Theresearch was supported by the National Institute for Health Research (NIHR) ImperialBiomedical Research Centre (M.R.J., E.P.). The views expressed are those of the author(s)and not necessarily those of the NHS, the NIHR or the Department of Health. We thankMario Falchi and Philippe Froguel for providing critical comments on the first version ofthe manuscript.
Author contributionsA.J.B. initiated and coordinated the hippocampus sample collection including relatedclinical data and gene expression data generation. E.P. and M.R.J. designed, implementedand coordinated systems genetics and functional studies. J.B. designed and performedfunctional studies in BMDM and BV2 cells, with assistance from B.R. and A.D. T.R.performed functional studies in neurons with assistance from A.S., S.K., K.W., F.W.G.,B.R. and V.D.P. L.B. designed and developed the Bayesian methodology and performedgenetic mapping analyses, with assistance from M.C-.H. M.L.K. performed geneexpression, correlation and network analyses, with assistance from S.R.L. and T.D. K.P.,P.N. and S.S. prepared human brain samples and probes, performed hybridizations,real-time quantitative PCR experiments and contributed data and clinical informationin the TLE cohort. P.H., M.Mattheisen and S.C. carried out microarray experiments, SNPgenotyping and raw data analyses in the TLE cohort. M.v.L. contributed hippocampaltissue microdissections and clinical data analyses in the TLE cohort. M.R.J., T.J.O’B., J.E.,S.P. and A.J.C. coordinated sample collection and/or provided genotype and clinical datafor the GWAS analysis of focal epilepsy. M.W., M.S. and P.R. contributed reagents andmaterials. M.R.J. and D.S. performed the GWAS analysis of focal epilepsy. E.P., M.R.J.,M.L.K., D.S. and S.R.L. designed and carried out GWAS-enrichment analyses. E.P. andP.K.S. carried out TFBS motifs sequence analysis. R.M.K., P.F., B.D. and M.Mazzuferigenerated the mouse RNA-seq data. E.P., M.R., K.S. and P.K.S. carried out comparativenetwork analyses. A.S. provided primary hippocampal neurons and N.H. and A.D.provided BV2 cell lines and participated in functional studies. V.T.C. and P.L.M.S.designed and carried out experiments in zebrafish. E.P. and M.R.J. wrote the manuscriptwith input from A.B., J.B., L.B., V.T.C., V.D.P. and R.M.K. E.P., A.J.B. and M.R.J. werethe joint senior authors of the study.
Additional informationSupplementary Information accompanies this paper at http://www.nature.com/naturecommunications
Competing financial interests: The authors declare no competing financial interests.
Reprints and permission information is available online at http://npg.nature.com/reprintsandpermissions/
How to cite this article: Johnson, M. R. et al. Systems genetics identifies Sestrin 3as a regulator of a proconvulsant gene network in human epileptic hippocampus.Nat. Commun. 6:6031 doi: 10.1038/ncomms7031 (2015).
NATURE COMMUNICATIONS | DOI: 10.1038/ncomms7031 ARTICLE
NATURE COMMUNICATIONS | 6:6031 | DOI: 10.1038/ncomms7031 | www.nature.com/naturecommunications 11
& 2015 Macmillan Publishers Limited. All rights reserved.