Embed Size (px)
Citation preview
IEEE Transactions on Power Apparatus and Systems, Vol.PAS-98, No.2 March/April 1979
ANALYTICAL DEVELOPMENT OF LOADABILITY CHARACTERISTICSFOR EHV AND UHV TRANSMISSION LINES
R. GUTMAN, Member IEEE
AMERICAN ELECTRIC POWER SERVICE CORPORATIONNEW YORK, N.Y.
A BSTRACT
This paper contains the development of an analytical basis for the St. Clairline loadability curve and presents the extension of its use into the EHV andUHV transmission area. A brief historical background describes the origin andpertinent aspects of the St. Clair curve including the fact that the old curve, ori-ginally intended for transmission voltages up to 330-kV, is derived empiricallybased upon practical considerations and experience. In order to extend the use-fulness of such line loadability characteristics into the EHV and UHV range, asimplified representation of the system, which incorporates flexibility to includeboth line and system parameters, is utilized to compute maximum line loadabilitysubject to assumed system performance criteria. It is shown that, for a reason-able and consistent set of assumptions, with regard to system parameters and per-formance criteria, EHV and UHV transmission line loadability characteristics arenearly identical to the original St. Clair curve. The paper further illustrates therelative influence of these assumptions on the derived characteristics, In parti-cular, the electrical strength of the sending- and receiving-end systems is foundto have an increasingly important influence on the loadability of transmissionlines as the voltage class increases. The analytical approach to determinationof transmission line loadability curves enables the user to examine specific situ-ations and assumptions and to avoid possible misinterpretation of generalizedconceptual guides particularly in the EHV/UHV range where system parameters
can have a significant impact on loadability.
INTRODUCTION
The transmission line power-transfer capability curves, also known as "St.Clair curves," have been a valuable tool for planning engineers ever since theirpublication in 1953.(1) These curves, having been extrapolated for use with long-er lines, are generally accepted in the industry as a convenient reference for esti-mating the maximum loading limits on transmission lines.
The widespread use of these curves warrants the extension of their develop-ment for application into the UHV area. This, unlike the development of existingcurves, cannot be done by using "judgment based upon practical considerationsand experience,"'1) for no such experience yet exists. While the conception ofexisting curves and their proven validity over many years clearly demonstrate thegenius of their author, it should be stressed that at higher voltage classes theloading limits depend not only on the transmission line itself, but also, to a grow-
ing degree, on the strength of terminal systems. This new element, the systemstrength, becomes especially important when considering UHV lines.
Since the expression "line capability" -- as traditionally used in the past-- is easily confused with physical properties of a line (such as thermal capa-
bility), a modified expression "line loadability" is used throughout this paper todescribe the load carrying ability of a transmission line operating under a speci-fied set of performance criteria.
HISTORICAL BACKGROUND
The original St. Clair curves of 1953, presented in Figure 1 below, showthe loadability of transmission lines in terms of their surge impedance loading
F 78 260-2. A paper recamnended and approved bythe Power System DEgineering Canittee of theIEE Power Engiering Society for presentaticn at theTEEE; PES Winter Mieting, New York, NY, January 29 -
February 3, 1978. Manuscript submitted Septer 6,1977; made available for printing December 12, 1977.
3.0O
2.5
* 2.0
z
-c 1.50-J
w
z1.0
0f
P. P. MARCHENKO, Member IEEE(Retired)
LINE SURGE IMPEDANCE CHARGINGVOLTAGE LOADING KVA PER
KV KW AMP. 100 mi.
34.5 3,000 50 60069 12,000 100 2,500138 48,000 200 10,000161 65,000 233 13,000230 132,000 330 27,000287 205,000 412 42,000330 295,000** 515** 60,000O
M*ACTUAL VALUES FOR AGE DE31N
_ CURVE A -NORMAL RATING _CURVE B = HEAVY LOADING _
100 200 300 400LINE LENGTH IN MILES
500 600
Figure 1. St. Clair curves
(SIL) for line lengths of up to 400 miles. It is interesting to note how thesecurves, and in particular the "Heavy Loading" curve B, came about. It hadbeen a well established fact, even long before 1953, that a conventional 60-Hzline approaching 300 miles in length has a loadability of about 1.0 SIL. Linesof that length were known to operate with very little or no reactive power suppliedfrom either end,owingto the equalization of stored inductive and capacitive energythat oscillates between the magnetic and electric fields of the line. This 300-mile rating of 1.0 SIL was taken by St. Clair as one of the two bench-mark pointshe used in establishing his line loadability characteristic.
The other bench-mark point on the curve B in Figure 1 is the 50-mile linelength at which the thermal limits, more than any other factor, were responsiblefor setting a ceiling of 3.0 SIL on the line loadability. It appeared at first thatthe entire curve, above and below 300 miles, could have been constructed on thebasis of a constant kW-mile product; but, if such were the case, then the 50-mileline loadability would need be equal to 6.0 SIL, which was deemed "impracticablenot only from a current and loss standpoint but also from the standpoint of reason-able amount of power to be concentrated in a single circuit, with due regard toservice and reliability."(1) Thus, for lines shorter than 300 miles, this kW-mileproduct was progressively reduced and "the extent of this reduction was a matterof judgment based upon practical considerations and experience. (1)
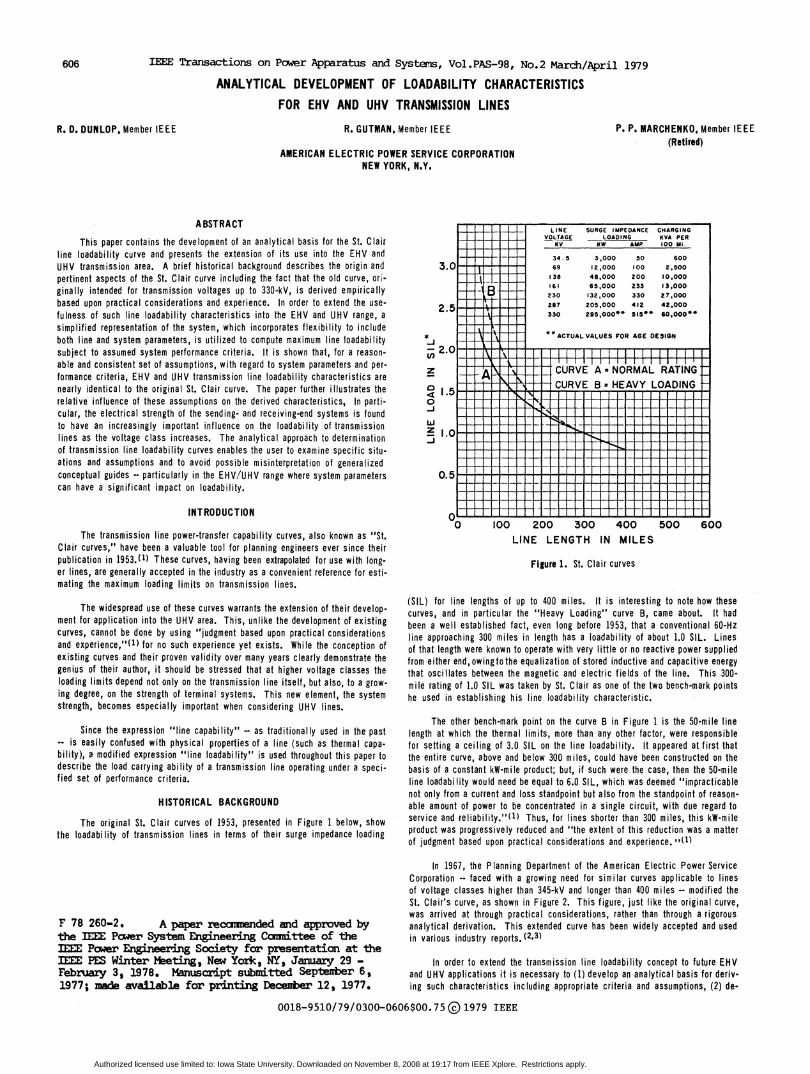
In 1967, the Planning Department of the American Electric Power ServiceCorporation -- faced with a growing need for similar curves applicable to linesof voltage classes higher than 345-kV and longer than 400 miles -- modified theSt. Clair's curve, as shown in Figure 2. This figure, just like the original curve,was arrived at through practical considerations, rather than through a rigorousanalytical derivation. This extended curve has been widely accepted and usedin various industry reports.(2,3)
In order to extend the transmission line loadability concept to future EHVand UHV applications it is necessary to (1) develop an analytical basis for deriv-ing such characteristics including appropriate criteria and assumptions, (2) de-
0018-9510/79/0300-0606$00. 75 1979 IEEE
606
R. D. DUNLOP, Member IEEE
Authorized licensed use limited to: Iowa State University. Downloaded on November 8, 2008 at 19:17 from IEEE Xplore. Restrictions apply.
607
X1, X2 - equivalent sending- and receiving-end system positive-sequence reactances (includes reactance value ofgenerators, transformers, and any associated transmis-sion)
N - percent series compensation
percent shunt compensation at the line sending- andreceiving-end, respectively
specified voltage quantities
limiting value of receiving-end line-voltage (uniquelydefines line-voltage-drop criterion)
1.0O
0 100 200 300 400 500 600
LINE LENGTH IN MILESWITH NO SERIES COMPENSATION
Figure 2. Revised line loadability curve (heavy loading)
monstrate its validity when applied to existing levels of transmission line volt-ages by verifying against the empirically derived St. Clair curve, and (3) extendthe concepts to EHV and UHV lines incorporating consistent assumptions andcriteria. This will be the subject of the remainder of this paper.
ANALYTICAL APPROACH AND VERIFICATION
In this part of the paper, attention is focused on the development of themodel and computational procedures for establishing loadability characteristics,on limitingfactors and assumptions, and on verification of the analytical approach.The extension of this analytical approach to the development of EHV and UHVtransmission loadability characteristics will be treated separately in the nextsection.
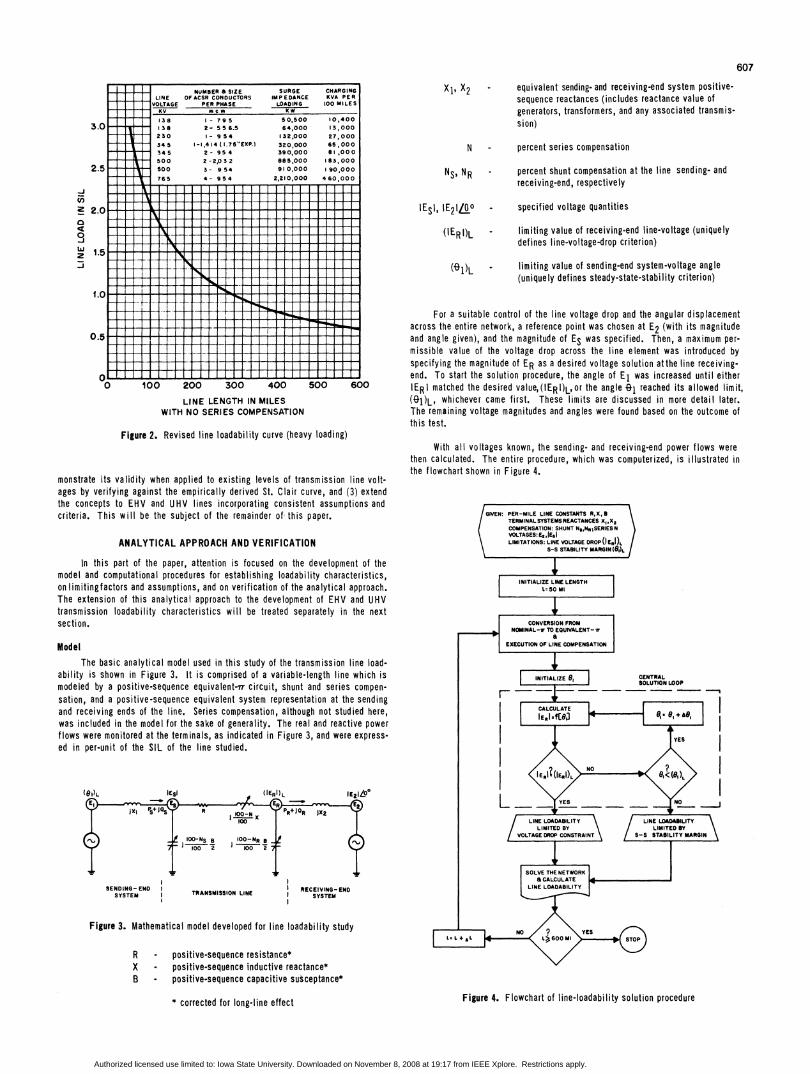
ModelThe basic analytical model used in this study of the transmission line load-
ability is shown in Figure 3. It is comprised of a variable-length line which ismodeled by a positive-sequence equivalent-Tr circuit, shunt and series compen-
sation, and a positive-sequence equivalent system representation at the sendingand receiving ends of the line. Series compensation, although not studied here,was included in the model for the sake of generality. The real and reactive powerflows were monitored at the terminals, as indicated in Figure 3, and were express-ed in per-unit of the SIL of the line studied.
SENDING-END RECEIVING- ENDSYSTEM TRANSMISSION LINE SYSTEM
Figure 3. Mathematical model developed for line loadability study
R - positive-sequence resistance*X - positive-sequence inductive reactance*B - positive-sequence capacitive susceptance*
(-Gj)L limiting value of sending-end system-voltage angle(uniquely defines steady-state-stability criterion)
For a suitable control of the line voltage drop and the angular displacementacross the entire network, a reference point was chosen at E2 (with its magnitudeand angle given), and the magnitude of ES was specified. Then, a maximum per-
missible value of the voltage drop across the line element was introduced byspecifying the magnitude of ER as a desired voltage solution atthe line receiving-end. To start the solution procedure, the angle of E1 was increased until eitherIERI matched the desired value,(IERI)L,or the angle 01 reached its allowed limit,(4s)L, whichever came first. These limits are discussed in more detail later.The remaining voltage magnitudes and angles were found based on the outcome ofthis test.
With all voltages known, the sending- and receiving-end power flows werethen calculated. The entire procedure, which was computerized, is illustrated inthe flowchart shown in Figure 4.
GIEN: ER-MILE LINE CONSTANTS R,X,BTERMINALSYSTEMSREACTANCES X,,X2COMPENSATION: SHUNT NS,Nm;SERIESNVOLTAGES: Et, ESLIMITATIONS: LINE VOLTAGE DROP(I E,l)L
S-S STABILITY MARGIN(8I)/
Figure 4. Flowchart of line-loadability solution procedure
3.0
2.5
-J-i
: 2.0a
-J0w 1.5
NS, NR
IESI, IE21LfO
(IER )L
r
* corrected for long-line effect
Authorized licensed use limited to: Iowa State University. Downloaded on November 8, 2008 at 19:17 from IEEE Xplore. Restrictions apply.
608
Limiting Factors and Assumptions
Of all limiting factors that normally set a ceiling on how much power canbe carried by a particular transmission line, three major line loading limitationswere considered here:
(1) thermal limitation(2) line-voltage-drop limitation(3) steady-state-stability limitation
The thermal limitation can be qualified as a line design -- rather than oper-ating -- problem. It is basically a problem of proper conductor selection, once itscurrent-carrying requirements and its ambient operating conditions are known. Thethermal limitation is critical primarily in case of lower voltage lines of 50 milesor less.
At the EHV, and even more so at the UHV transmission level, environmentalconsiderations such as corona discharges and field effects dictate line designcharacteristics which result in very high thermal capabilities. The thermalcapability derived from typical bundle-conductor arrangements at EHV and UHVoperating levels generally exceeds, by a significant margin, network requirementsfor transfer of power through a given line. In such cases line terminating equip-ment, wave traps, and substation design provide a more restrictive thermal limitthan the line itself.
Consequently, from the viewpoint of determining line loadability, thermalcapability is significant only for very short lines at 138-kV and below. Thus,for EHV and UHV transmission lines, the only practical limitations to line load-ability are provided by line-voltage-drop and by steady-state-stability consider-ations.
In the initial stages of this work, it became apparent that some of the exist-ing literature on the subject assume a flat voltage profile over the entire linelength, and some do not even mention the concept of a voltage-drop criterion alto-gether in their analysis of the line loadability. It will be shown here, that thevoltage-drop limitation is a very important one; in fact; fo.r moderate-length EHVlines of up to 200 miles it is the controlling factor on line loadability. Thus, itneeds to be considered on an equal basis with the steady-state-stability limitation.
The voltage-drop limitation across the line was set at 5% maximum. Lineloadings at more severe voltage drops could be investigated but, it is the consid-ered judgment of the authors that this value (5%) adequately represents the con-dition of a line carrying heavy, but permissible, loads without encountering un-usual operating problems.
In contrast with the line-voltage-drop limitation, the steady-state-stabilitylimitation has been discussed quite extensively in the technical literature. How-ever, one important point is rarely made or given proper emphasis; that is, thestability limitation should take the complete system into account, not just theline alone.(4) This has been a common oversight which, for the lower voltagelines generally considered in the past, has not led to significant misinterpretationsconcerning line loadability. This is because at lower voltage levels, say 345-kVand below, the line impedance comprises a major portion of the total equivalentreactance from source to load -- provided this line is long enough (over 200 miles)in the firstplace,to be limited by stability rather than voltage-drop considerations.
At higher voltage classes such as 765-kV and above, the typical levels ofequivalent system reactance at the sending- and receiving-end of a line become asignificant factor which cannot be ignored in determining line loadability as lim-ited by stability considerations.
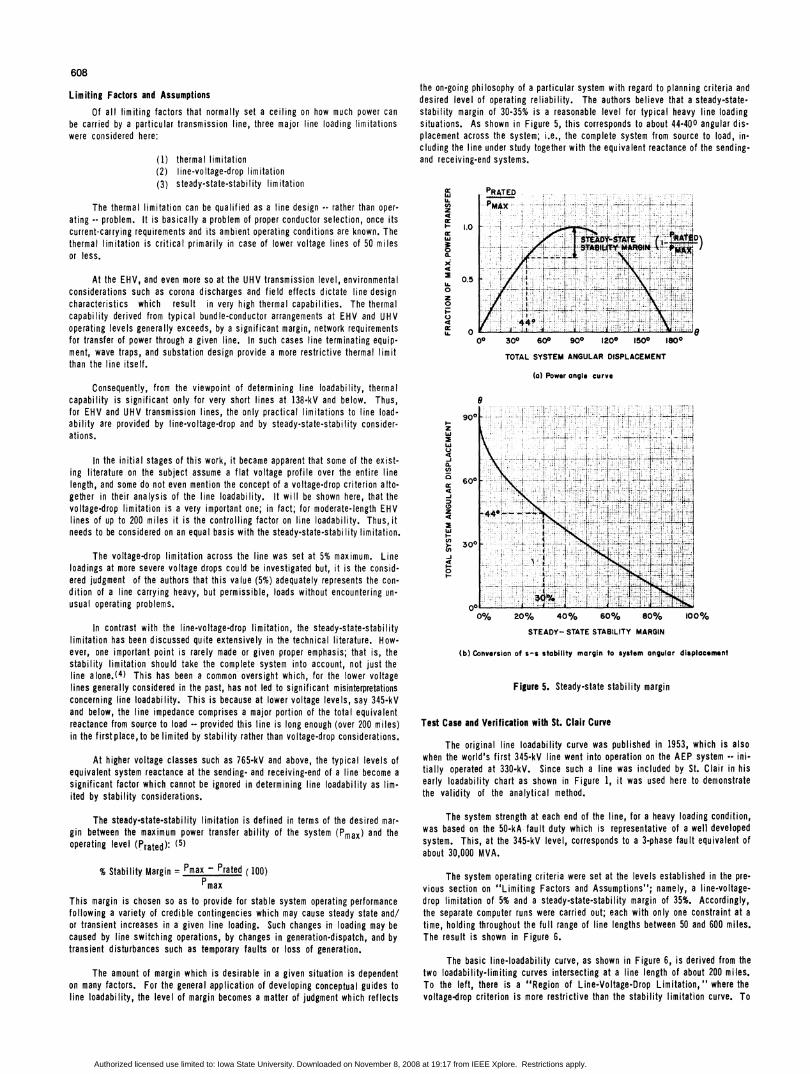
The steady-state-stability limitation is defined in terms of the desired mar-gin between the maximum power transfer ability of the system (Pmax) and theoperating level (Prated) (5)
% Stability Margin = Pmax - Prated ( 100)Pmax
This margin is chosen so as to provide for stable system operating performancefollowing a variety of credible contingencies which may cause steady state and/or transient increases in a given line loading. Such changes in loading may becaused by line switching operations, by changes in generation-dispatch, and bytransient disturbances such as temporary faults or loss of generation.
The amount of margin which is desirable in a given situation is dependenton many factors. For the general application of developing conceptual guides toline loadability, the level of margin becomes a matter of judgment which reflects
the on-going philosophy of a particular system with regard to planning criteria anddesired level of operating reliability. The authors believe that a steady-state-stability margin of 30-35% is a reasonable level for typical heavy line loadingsituations. As shown in Figure 5, this corresponds to about 44-400 angular dis-placement across the system; i.e., the complete system from source to load, in-cluding the line under study together with the equivalent reactance of the sending-and receiving-end systems.
crwU)z
'-1.0Lir0
a-49a 0.5LLO0z0
4u. 0
zw
w
U)
0 0
4-JCD
4
Cn-j
40
00 300 600 9g0 1200 1500 1800
TOTAL SYSTEM ANGULAR DISPLACEMENT
(a) Power angle curve
4- -~~~~~~~~~~~~~~~~~~~~~- A~~~~~~~~~~~4
-1.- {-.t 1 1+tI.j
0% 20% 40% 60% 80% 100%STEADY- STATE STABILITY MARGIN
(b) Conversion of s-s stability margin to system angular displacement
Figure 5. Steady-state stability margin
Test Case and Verification with St. Clair Curve
The original line loadability curve was published in 1953, which is alsowhen the world's first 345-kV line went into operation on the AEP system -- ini-tially operated at 330-kV. Since such a line was included by St. Clair in hisearly loadability chart as shown in Figure 1, it was used here to demonstratethe validity of the analytical method.
The system strength at each end of the line, for a heavy loading condition,was based on the 50-kA fault duty which is representative of a well developedsystem. This, at the 345-kV level, corresponds to a 3-phase fault equivalent ofabout 30,000 MVA.
The system operating criteria were set at the levels established in the pre-vious section on "Limiting Factors and Assumptions"; namely, a line-voltage-drop limitation of 5% and a steady-state-stability margin of 35%. Accordingly,the separate computer runs were carried out; each with only one constraint at a
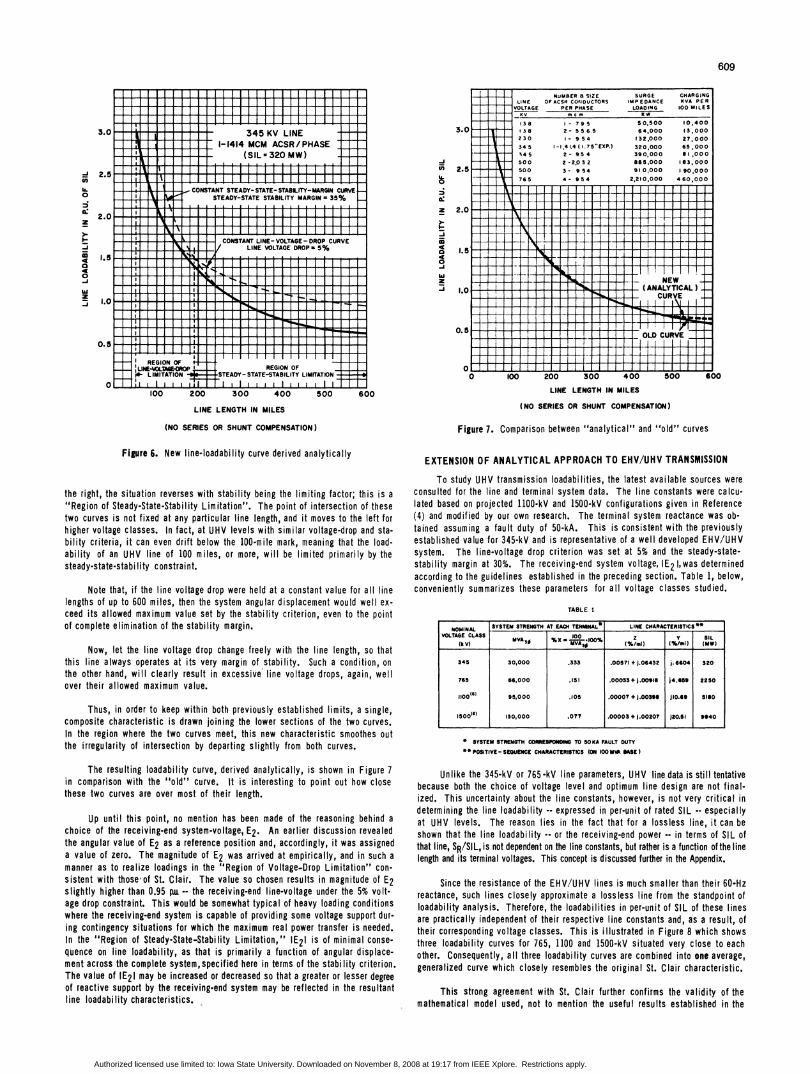
time, holding throughout the full range of line lengths between 50 and 600 miles.The result is shown in Figure 6.
The basic line-loadability curve, as shown in Figure 6, is derived from thetwo loadability-limiting curves intersecting at a line length of about 200 miles.To the left, there is a "Region of Line-Voltage-Drop Limitation," where thevoltage-drop criterion is more restrictive than the stability limitation curve. To
L:::.,.t~.....4 _:-. ;t1_~!--. - 'j.'rJ.
...A....t.---L- - .. - - "- ..l1- .: .'4 w. 1, i-.. ... a-' .; .: f) .. l..-, 4' :.. .1-1 lt-.-.r.t
.71-4.717
no
Authorized licensed use limited to: Iowa State University. Downloaded on November 8, 2008 at 19:17 from IEEE Xplore. Restrictions apply.
345 KV LINE_ 1-1414 MCM ACSR/PHASE -
(SIL 320 MW)I..............
[. CONSTANT STEADY-STATE-STABILITY-MARGIN CRVEL;. STEADY-STATE STABILITY MARGIN a 35%
1aI Ii1H ii i I 1-II l T l l 1 I I
L_ | CONSTANT LINE- VOLTAGE -DROP CURVELi. L.V/ LINE VOLTAGE DROP 5%
-JUS
a:-
z
3-I-j.4a
ahi2..1
NUMBER a SIZE_+_l_l_l_ LINE OF ACSR COtIOUCTORS
VOLTAGE PER PHASE___ V inc in
3.0 _ __ ,3 8 2,'1- 769530 1
_ 2 360 1- 95
434 5 1- 1,4 1.4 ( 1.7
230EXP0414 5 2 -954500 2-2,032
2.5 500 3- 954765 4- 954
SURGE CHARGINGIMP EDANCE KVA PERLOADING 100 MILESKw
50,50064,000132,000320,000390,00088 5,00091 0,000
2,210,000
lIT
-
NE_ (ANALY_ CUf_ lI
10,40013,00027, 00065,000$I ,00 0163,00090,000
4 60,000
riCAL) .
V IL
OLD CURVE liI 1
REGION OFISTEADY-STATESTABILITY LIMfTATON7
I100 200 300 400 500 600
LINE LENGTH IN MILES
(NO SERIES OR SHUNT COMPENSATION)
Figure 6. New line-loadability curve derived analytically
the right, the situation reverses with stability being the limiting factor; this is a"Region of Steady-State-Stability Limitation". The point of intersection of thesetwo curves is not fixed at any particular line length, and it moves to the left forhigher voltage classes. In fact, at UHV levels with similar voltage-drop and sta-bility criteria, it can even drift below the 100-mile mark, meaning that the load-ability of an UHV line of 100 miles, or more, will be limited primarily by thesteady-state-stability constraint.
Note that, if the line voltage drop were held at a constant value for all linelengths of up to 600 miles, then the system angular displacement would well ex-ceed its allowed maximum value set by the stability criterion, even to the pointof complete elimination of the stability margin.
Now, let the line voltage drop change freely with the line length, so thatthis line always operates at its very margin of stability. Such a condition, onthe other hand, will clearly result in excessive line voltage drops, again, wellover their allowed maximum value.
Thus, in order to keep within both previously established limits, a single,composite characteristic is drawn joining the lower sections of the two curves.In the region where the two curves meet, this new characteristic smoothes outthe irregularity of intersection by departing slightly from both curves.
The resulting loadability curve, derived analytically, is shown in Figure 7in comparison with the "old" curve. It is interesting to point out how closethese two curves are over most of their length.
Up until this point, no mention has been made of the reasoning behind achoice of the receiving-end system-voltage, E2. An earlier discussion revealedthe angular value of E2 as a reference position and, accordingly, it was assigneda value of zero. The magnitude of E2 was arrived at empirically, and in such amanner as to realize loadings in the "Region of Voltage-Drop Limitation" con-sistent with those of St. Clair. The value so chosen results in magnitude of E2slightly higher than 0.95 pa -- the receiving-end line-voltage under the 5% volt-age drop constraint. This would be somewhat typical of heavy loading conditionswhere the receiving-end system is capable of providing some voltage support dur-ing contingency situations for which the maximum real power transfer is needed.In the "Region of Steady-State-Stability Limitation," IE21 is of minimal conse-quence on line loadability, as that is primarily a function of angular displace-ment across the complete system,specified here in terms of the stability criterion.The value of IE21 may be increased or decreased so that a greater or lesser degreeof reactive support by the receiving-end system may be reflected in the resultantline loadability characteristics.
oil 1 1 I I I I II I0 100 200 300 400 500 600
LINE LENGTH IN MILES
(NO SERIES OR SHUNT COMPENSATION)
Figure 7. Comparison between "analytical" and "old" curves
EXTENSION OF ANALYTICAL APPROACH TO EHV/UHV TRANSMISSION
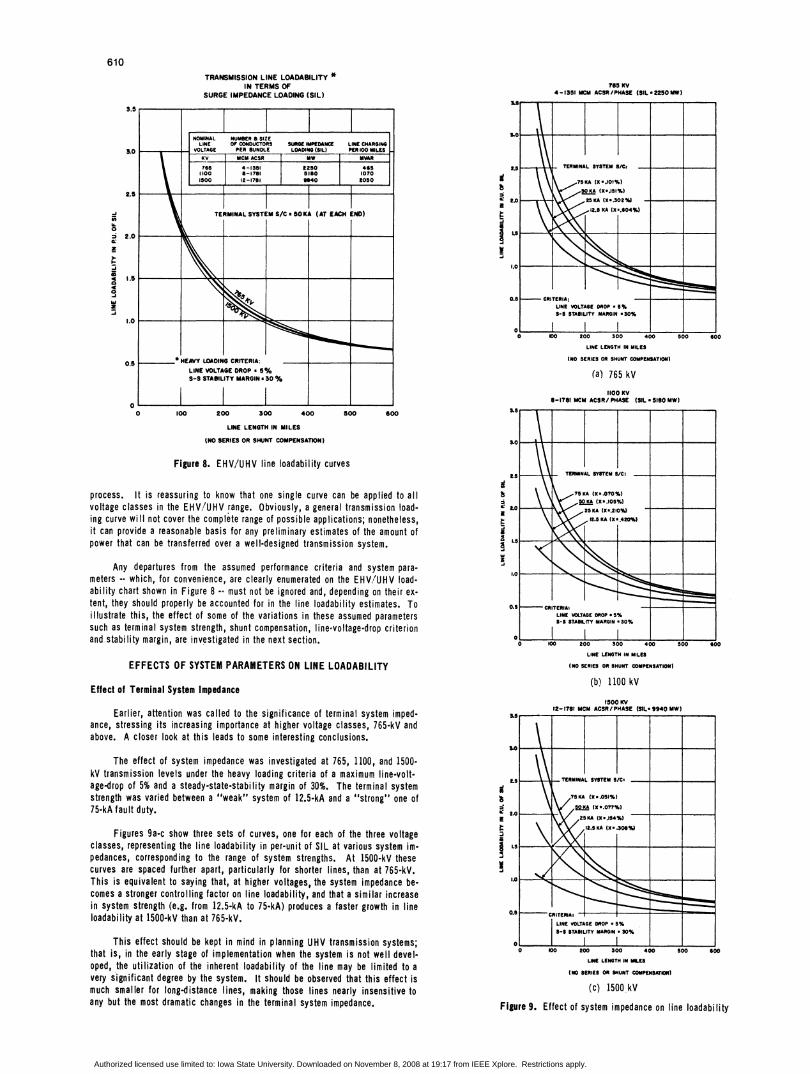
To study UHV transmission loadabilities, the latest available sources wereconsulted for the line and terminal system data. The line constants were calcu-lated based on projected 1100-kV and 1500-kV configurations given in Reference(4) and modified by our own research. The terminal system reactance was ob-tained assuming a fault duty of 50-kA. This is consistent with the previouslyestablished value for 345-kV and is representative of a well developed EHV/UHVsystem. The line-voltage drop criterion was set at 5% and the steady-state-stability margin at 30%. The receiving-end system voltage, IE2 l,was determinedaccording to the guidelines established in the preceding section. Table 1, below,conveniently summarizes these parameters for all voltage classes studied.
TA8LE 1
NOMIlNAL SYSTEM STRENGTH AT EACH TEHMINAL LINE CHARACTERISTICS98VOLTAGE CLASS
MA0 %X~.~.Itoo0% Z Y SIL1k V) MVA3 rMVA. (%/ml) (%/Mi (MW)
345 30,000 .333 .00571 +1.06432 j.6604 320
765 66,000 .151 .OOOS + J.00618 j4.659 2250
1100(° 95,000 .105 .00007 + J.0036 J10.69 510I
I500(l 130,000 .077 .00003 +1.00207 120.51 5940
* SYSTEM STREWTH CORESPONDIN TO 50GA FAULT DUTY**POSITIVE- SEQUENCE CHARACTERISTICS (ON 100 MV BASE )
Unlike the 345-kV or 765-kV line parameters, UHV line data is still tentativebecause both the choice of voltage level and optimum line design are not final-ized. This uncertainty about the line constants, however, is not very critical indetermining the line loadability -- expressed in per-unit of rated SIL -- especiallyat UHV levels. The reason lies in the fact that for a lossless line, it can beshown that the line loadability -- or the receiving-end power -- in terms of SIL ofthat line, SR/SIL, is not dependent on the line constants, but rather is a function of the linelength and its terminal voltages. This concept is discussed further in the Appendix.
Since the resistance of the EHV/UHV lines is much smaller than their 60-Hzreactance, such lines closely approximate a lossless line from the standpoint ofloadability analysis. Therefore, the loadabilities in per-unit of SIL of these linesare practically independent of their respective line constants and, as a result, oftheir corresponding voltage classes. This is illustrated in Figure 8 which showsthree loadability curves for 765, 1100 and 1500-kV situated very close to eachother. Consequently, all three loadability curves are combined into one average,generalized curve which closely resembles the original St. Clair characteristic.
This strong agreement with St. Clair further confirms the validity of themathematical model used, not to mention the useful results established in the
609
-j
U.0
za:
I.--JI1a4
z-I
REGION OFI LINE-LER0PH| FLIMITATION i
ol I' ,I
Authorized licensed use limited to: Iowa State University. Downloaded on November 8, 2008 at 19:17 from IEEE Xplore. Restrictions apply.
610
a
z
I
2
-i
TRANSMISSION LINE LOADABILITY *IN TERMS OF
SURGE IMPEDANCE LOADING (SIL)
3.5
NOMINAL NUMBER SIZELINE OP CONDUCTORS SURE IMPEDANCE LINE CHARGING
3.0 VOLTAGE PER BUNDLE LOADING ISIL) PER I00 MILESKV __MCM ACSR MW MVAR765 4-:1351 t250 4651100 -I17 1 510 10701500 12-1761 6640 2050
2.5
TERMINAL SYSTEM S/C * SOKA (AT EACH END)
2.0
1.0
0.5 *HEAVY LOADING CRITERIA:_-. lLINE VOLTAGE DROP * 5%S-S STABILITY MARGINs30%30
0_ _ _
0 100 200 300 400 500 600
LINE LENGTH IN MILES
(NO SERIES OR SHUNT COMPENSATION)
Figure 8. EHV/UHV line loadability curves
6
S
,i
J
B
a,
.a
process. It is reassuring to know that one single curve can be applied to allvoltage classes in the EHV/UHV range. Obviously, a general transmission load-ing curve will not cover the complete range of possible applications; nonetheless,it can provide a reasonable basis for any preliminary estimates of the amount ofpower that can be transferred over a well-designed transmission system.
Any departures from the assumed performance criteria and system para-meters -- which, for convenience, are clearly enumerated on the EHV/UHV load-ability chart shown in Figure 8 -- must not be ignored and, depending on their ex-tent, they should properly be accounted for in the line loadability estimates. Toillustrate this, the effect of some of the variations in these assumed parameterssuch as terminal system strength, shunt compensation, line-voltage-drop criterionand stability margin, are investigated in the next section.
EFFECTS OF SYSTEM PARAMETERS ON LINE LOADABILITY
Effect of Terminal System Impedance
Earlier, attention was called to the significance of terminal system imped-ance, stressing its increasing importance at higher voltage classes, 765-kV andabove. A closer look at this leads to some interesting conclusions.
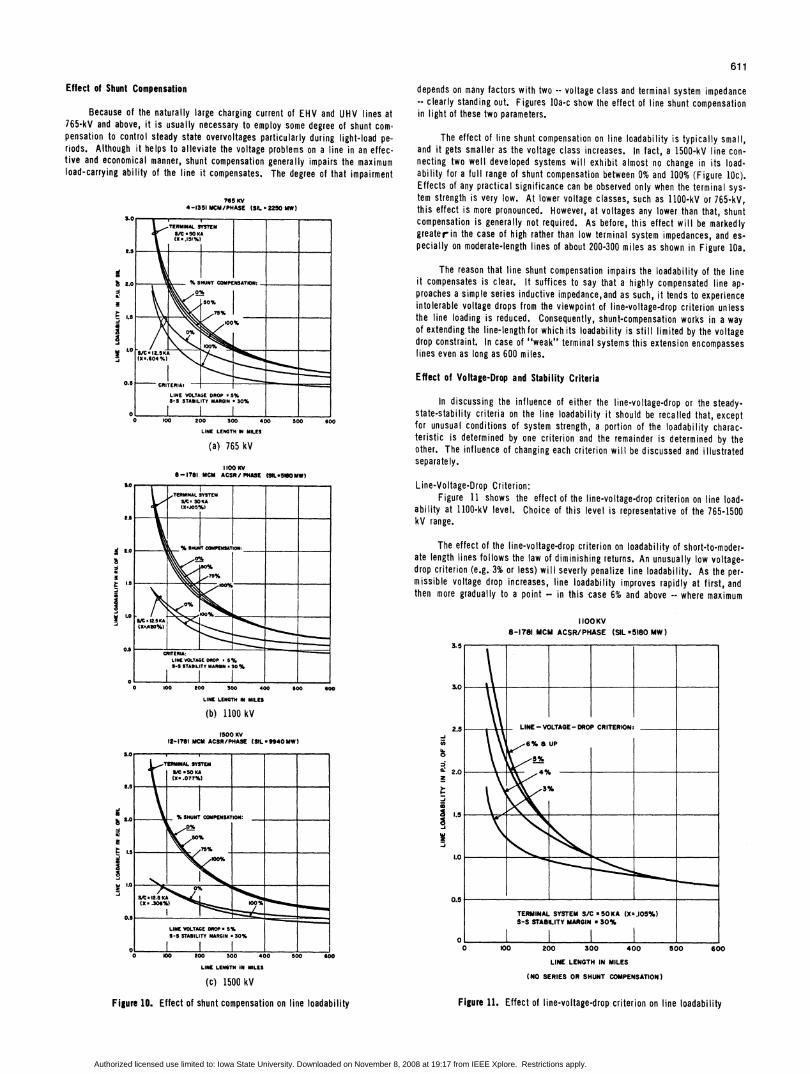
The effect of system impedance was investigated at 765, 1100, and 1500-kV transmission levels under the heavy loading criteria of a maximum line-volt-age-drop of 5% and a steady-state-stability margin of 30%. The terminal systemstrength was varied between a "weak" system of 12.5-kA and a "strong" one of75-kA fault duty. 6,:
ta§Figures 9a-c show three sets of curves, one for each of the three voltage
classes, representing the line loadability in per-unit of SIL at various system im-pedances, corresponding to the range of system strengths. At 1500-kV thesecurves are spaced further apart, particularly for shorter lines, than at 765-kV.This is equivalent to saying that, at higher voltages, the system impedance be-comes a stronger controlling factor on line loadability, and that a similar increasein system strength (e.g. from 12.5-kA to 75-kA) produces a faster growth in lineloadability at 1500-kV than at 765-kV.
This effect should be kept in mind in planning UHV transmission systems;that is, in the early stage of implementation when the system is not well devel-oped, the utilization of the inherent loadability of the line may be limited to avery significant degree by the system. It should be observed that this effect ismuch smaller for long-distance lines, making those lines nearly insensitive toany but the most dramatic changes in the terminal system impedance.
765 KV4-1351 MCM ACSR/PHASE ISL-2250 MW)
2.1 -
.5 TERMINAL SYSTEM S/Cs
?SKA (X*JOI%)SOKA IS-.IsI%I
O.0
0.5 CRITERIA:LINE VOLTAGE IDROP * §%S-S STABILITY MARGIN *30%
0 100 200 300 400 500 60
LINE LENGTH IN MILES
INO SERIES OR SHUNT COMPENSATION)
(a) 765 kV1100 KV
8-17C1 MCM ACSR/ PHASE (SIL * 5160 MW)
S.C - ____
TER\_ NAL SYSTEM S/C:
\ TEKA 1X?.070%)S50 KA (1X.105%)LO c ,25KA (X-.210Yw)
\102.5 KA {X j.420%)
0.5 CRITERIA:LINCE VOLTAGE DPtOP - 5%S-S STABLITY MARGIN * 30%
O 100 200 300 400 500 60
LINE LENGTH IN MILES
(NO SERIES OR SHUNT COMPENSATION)
(b) 1100 kV
1500 KV12-1761 MCM ACSR/PHASE (SIL- 9940 MW)
LB A _TERMINAL SYSTEM S/C _
\ 5KA (XS.051%)
2OKA IX-.OT7%)Z2SKA {X-.154%)
2.0
O.5 ~~ CRITERIA -.
LINE VOLTAGE DROP * 5%S-S STABILITY MARGIN * 30%
o ~ . 1. ,- -.0 lo0 200 300 400 500 600
UNE LENGTH IN MLES
I0NG SERIES OR SHUNT CMPENSATO
(c) 1500 kV
Figure 9. Effect of system impedance on line loadability
Authorized licensed use limited to: Iowa State University. Downloaded on November 8, 2008 at 19:17 from IEEE Xplore. Restrictions apply.
Effect of Shunt Compensation
Because of the naturally large charging current of EHV and UHV lines at765-kV and above, it is usually necessary to employ some degree of shunt com-pensation to control steady state overvoltages particularly during light-load pe-riods. Although it helps to alleviate the voltage problems on a line in an effec-tive and economical manner, shunt compensation generally impairs the maximumload-carrying ability of the line it compensates. The degree of that impairment
9tda:
C:3:ei5v
765 KV4-1351 MCM/PNASE (SIt 225 MW)
S.0 _ -TERMINAL SYSTEM
S/C * 50 KA(5X.151%)
..rz.0 % SHUNT COMPENSATION:
0%
50%
75%1.5
1.0~~~~~~10
LINE LENGTH MI MILES
(a) 765 kV
I 100KVe-1781 MCM ACSR/PASE ISIL.-540MM
TYERMINAL SYSTEM
(X.JO5%)2. OA
NIlE":_
2.0 % SHLW C~~OMPENSAT10N0
S-S STANILITY MAGI * 30%
10 _
10400% 0 40 50 0
LINE LENGTH IN MILES
(b) 1100 kV
1500KV12-1761 MCM ACSR/PNASE (SIL.840MW)
s.o
2.s
b 2.0
.s
3I
611
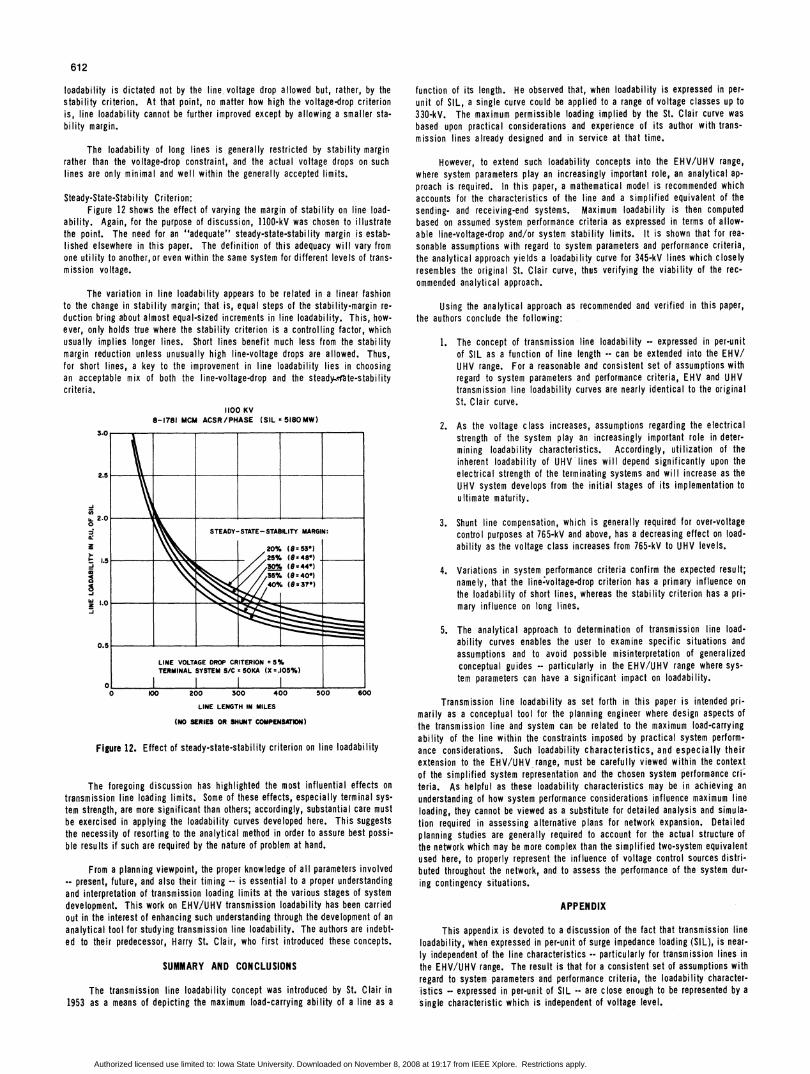
depends on many factors with two -- voltage class and terminal system impedance-- clearly standing out. Figures lOa-c show the effect of line shunt compensationin light of these two parameters.
The effect of line shunt compensation on line loadability is typically small,and it gets smaller as the voltage class increases. In fact, a 1500-kV line con-necting two well developed systems will exhibit almost no change in its load-ability for a full range of shunt compensation between 0% and 100% (Figure lOc).Effects of any practical significance can be observed only when the terminal sys-tem strength is very low. At lower voltage classes, such as 1100-kV or 765-kV,this effect is more pronounced. However, at voltages any lower than that, shuntcompensation is generally not required. As before, this effect will be markedlygreaterin the case of high rather than low terminal system impedances, and es-pecially on moderate-length lines of about 200-300 miles as shown in Figure 10a.
The reason that line shunt compensation impairs the loadability of the lineit compensates is clear. It suffices to say that a highly compensated line ap-proaches a simple series inductive impedance,and as such, it tends to experienceintolerable voltage drops from the viewpoint of line-voltage-drop criterion unlessthe line loading is reduced. Consequently, shunt-compensation works in a wayof extending the line-lengthfor which its loadability is still limited by the voltagedrop constraint. In case of "weak" terminal systems this extension encompasseslines even as long as 600 miles.
Effect of Voltage-Drop and Stability Criteria
In discussing the influence of either the line-voltage-drop or the steady-state-stability criteria on the line loadability it should be recalled that, exceptfor unusual conditions of system strength, a portion of the loadability charac-teristic is determined by one criterion and the remainder is determined by theother. The influence of changing each criterion will be discussed and illustratedseparately.
Line-Voltage-Drop Criterion:Figure 11 shows the effect of the line-voltage-drop criterion on line load-
ability at 1100-kV level. Choice of this level is representative of the 765-1500kV range.
The effect of the line-voltage-drop criterion on loadability of short-to-moder-ate length lines follows the law of diminishing returns. An unusually low voltage-drop criterion (e.g. 3% or less) will severly penalize line loadability. As the per-missible voltage drop increases, line loadability improves rapidly at first, andthen more gradually to a point -- in this case 6% and above -- where maximum
IIOOKV8-1781 MCM ACSR/PHASE (SIL-5180 MW)
-i
0
a:z
t-
3
LINE LENTH IN MILES
(c) 1500 kV
Figure 10. Effect of shunt compensation on line loadability
3.
2.5 LIN4E - VOLTAGE- DROP CRITERION:
6%So UP
5%
2.0 4%
3%
1.0 -40.5
TERMINAL SYSTEM S/C *50KA (X-.105%)S-S STABITY MARGIN *30%
0 100 200 300 400 500 600LINE LENGTH IN MILES
(NO SERIES OR SHUNT COMPENSATION)
Figure 11. Effect of line-voltage-drop criterion on line loadability
4)
Authorized licensed use limited to: Iowa State University. Downloaded on November 8, 2008 at 19:17 from IEEE Xplore. Restrictions apply.
612
loadability is dictated not by the line, voltage drop allowed but, rather, by thestability criterion. At that point, no matter how high the voltage-drop criterionis, line loadability cannot be further improved except by allowing a smaller sta-bility margin.
The loadability of long lines is generally restricted by stability marginrather than the voltage-drop constraint, and the actual voltage drops on suchlines are only minimal and well within the generally accepted limits.
Steady-State-Stability Criterion:Figure 12 shows the effect of varying the margin of stability on line load-
ability. Again, for the purpose of discussion, 1100-kV was chosen to illustratethe point. The need for an "adequate" steady-state-stability margin is estab-lished elsewhere in this paper. The definition of this adequacy will vary fromone utility to another,or even within the same system for different levels of trans-mission voltage.
The variation in line loadability appears to be related in a linear fashionto the change in stability margin; that is, equal steps of the stability-margin re-duction bring about almost equal-sized increments in line loadability. This, how-ever, only holds true where the stability criterion is a controlling factor, whichusually implies longer lines. Short lines benefit much less from the stabilitymargin reduction unless unusually high line-voltage drops are allowed. Thus,for short lines, a key to the improvement in line loadability lies in choosingan acceptable mix of both the line-voltage-drop and the steady..ate-stabilitycriteria.
1100 KV8-1781 MCM ACSR/PHASE (SIL * 5180 MW)
0
0:
z-i
3.0__ _ ___ _ _
2.5
2.0
STEADY-STATE-STABILITY MARGIN:
. X 1 ~~~~~~~~~~~~20°%(O a 538 )
1.0
0.!LINE VOLTAGE DROP CRITERION = 5%TERMINAL SYSTEM S/C S50KA (X .105%)
O0 100 200 300 400 500 600
LINE LENGTH IN MILES
(NO SERIES OR SHUNT COMPENSATIO)
Figure 12. Effect of steady-state-stability criterion on line loadability
The foregoing discussion has highlighted the most influential effects on
transmission line loading limits. Some of these effects, especially terminal sys-tem strength, are more significant than others; accordingly, substantial care mustbe exercised in applying the loadability curves developed here. This suggeststhe necessity of resorting to the analytical method in order to assure best possi-ble results if such are required by the nature of problem at hand.
From a planning viewpoint, the proper knowledge of all parameters involved-- present, future, and also their timing -- is essential to a proper understandingand interpretation of transmission loading limits at the various stages of systemdevelopment. This work on EHV/UHV transmission loadability has been carriedout in the interest of enhancing such understanding through the development of an
analytical tool for studying transmission line loadability. The authors are indebt-ed to their predecessor, Harry St. Clair, who first introduced these concepts.
SUMMARY AND CONCLUSIONS
The transmission line loadability concept was introduced by St. Clair in1953 as a means of depicting the maximum load-carrying ability of a line as a
function of its length. He observed that, when loadability is expressed in per-unit of SIL, a single curve could be applied to a range of voltage classes up to330-kV. The maximum permissible loading implied by the St. Clair curve wasbased upon practical considerations and experience of its author with trans-mission lines already designed and in service at that time.
However, to extend such loadability concepts into the EHV/UHV range,where system parameters play an increasingly important role, an analytical ap-proach is required. In this paper, a mathematical model is recommended whichaccounts for the characteristics of the line and a simplified equivalent of thesending- and receiving-end systems. Maximum loadability is then computedbased on assumed system performance criteria as expressed in terms of allow-able line-voltage-drop and/or system stability limits. It is shown that for rea-sonable assumptions with regard to system parameters and performance criteria,the analytical approach yields a loadability curve for 345-kV lines which closelyresembles the original St. Clair curve, thus verifying the viability of the rec-ommended analytical approach.
Using the analytical approach as recommended and verified in this paper,the authors conclude the following:
1. The concept of transmission line loadability -- expressed in per-unitof SIL as a function of line length -- can be extended into the EHV/UHV range. For a reasonable and consistent set of assumptions withregard to system parameters and performance criteria, EHV and UHVtransmission line loadability curves are nearly identical to the originalSt. C lair curve.
2. As the voltage class increases, assumptions regarding the electricalstrength of the system play an increasingly important role in deter-mining loadability characteristics. Accordingly, utilization of theinherent loadability of UHV lines will depend significantly upon theelectrical strength of the terminating systems and will increase as theUHV system develops from the initial stages of its implementation toultimate maturity.
3. Shunt line compensation, which is generally required for over-voltagecontrol purposes at 765-kV and above, has a decreasing effect on load-ability as the voltage class increases from 765-kV to UHV levels.
4. Variations in system performance criteria confirm the expected result;namely, that the line voltage-drop criterion has a primary influence on
the loadability of short lines, whereas the stability criterion has a pri-mary influence on long lines.
5. The analytical approach to determination of transmission line load-ability curves enables the user to examine specific situations andassumptions and to avoid possible misinterpretation of generalizedconceptual guides -- particularly in the EHV/UHV range where sys-tem parameters can have a significant impact on loadability.
Transmission line loadability as set forth in this paper is intended pri-marily as a conceptual tool for the planning engineer where design aspects ofthe transmission line and system can be related to the maximum load-carryingability of the line within the constraints imposed by practical system perform-ance considerations. Such loadability characteristics, and especially theirextension to the EHV/UHV range, must be carefully viewed within the contextof the simplified system representation and the chosen system performance cri-
teria. As helpful as these loadability characteristics may be in achieving an
understanding of how system performance considerations influence maximum lineloading, they cannot be viewed as a substitute for detailed analysis and simula-tion required in assessing alternative plans for network expansion. Detailedplanning studies are generally required to account for the actual structure ofthe network which may be more complex than the simplified two-system equivalentused here, to properly represent the influence of voltage control sources distri-buted throughout the network, and to assess the performance of the system dur-ing contingency situations.
APPENDIX
This appendix is devoted to a discussion of the fact that transmission lineloadability, when expressed in per-unit of surge impedance loading (SIL), is near-
ly independent of the line characteristics -- particularly for transmission lines inthe EHV/UHV range. The result is that for a consistent set of assumptions withregard to system parameters and performance criteria, the loadability character-istics -- expressed in per-unit of SIL -- are close enough to be represented by a
single characteristic which is independent of voltage level.
Authorized licensed use limited to: Iowa State University. Downloaded on November 8, 2008 at 19:17 from IEEE Xplore. Restrictions apply.
613
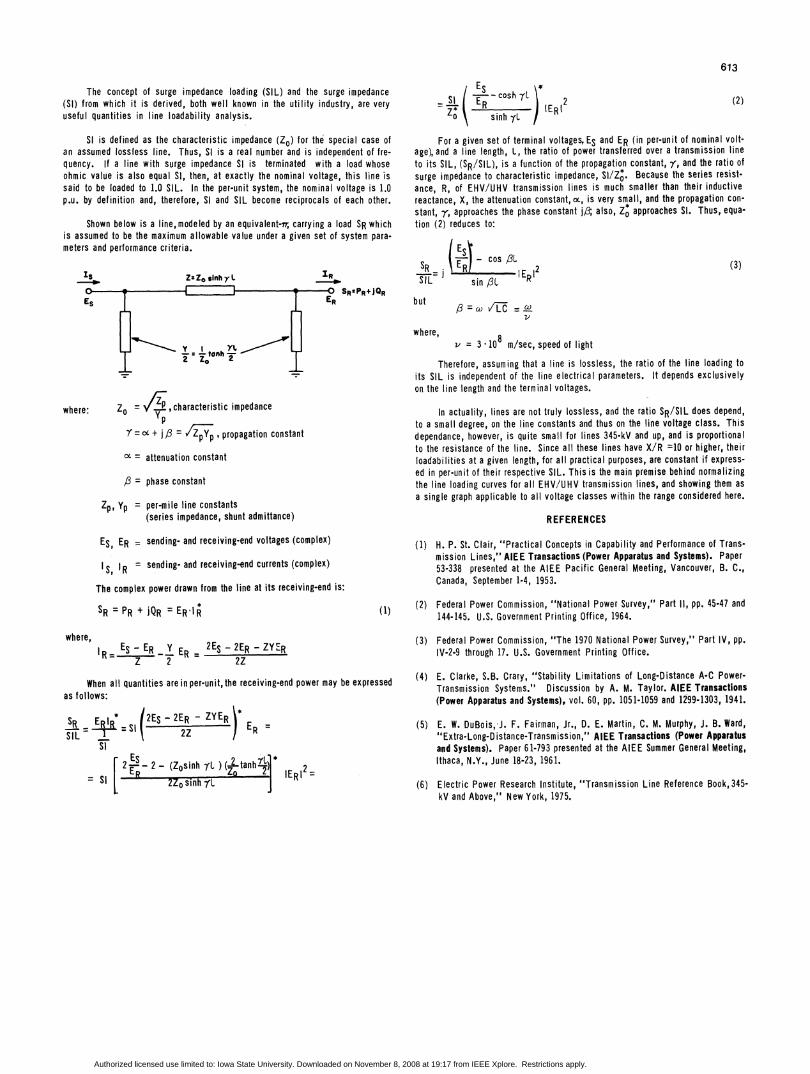
The concept of surge impedance loading (SIL) and the surge impedance(SI) from which it is derived, both well known in the utility industry, are veryuseful quantities in line loadability analysis.
SI is defined as the characteristic impedance (ZO) for the special case ofan assumed lossless line. Thus, Si is a real number and is independent of fre-quency. If a line with surge impedance Si is terminated with a load whoseohmic value is also equal Si, then, at exactly the nominal voltage, this line issaid to be loaded to 1.0 SIL. In the per-unit system, the nominal voltage is 1.0p.u. by definition and, therefore, SI and SIL become reciprocals of each other.
Shown below is a line, modeled by an equivalent-xr, carrying a load SR whichis assumed to be the maximum allowable value under a given set of system para-meters and performance criteria.
IS Z:ZO sInh YL IRSRSPR+JQR
ES ER
_ - tonh
where: ZO = _characteristic impedanceYp= oc + j /3 = /ZpYp, propagation constant
o = attenuation constant
,/ = phase constant
Zp, Yp = per-mile line constants(series impedance, shunt admittance)
ES, ER = sending- and receiving-end voltages (complex)
I S I R = sending- and receiving-end currents (complex)
The complex power drawn from the line at its receiving-end is:
SR =PR +jQR =ERIR (1)
where,IR ES ER Y ER = 2ES - 2ER ZYER
Z 2Z
When all quantities are in per-unit, the receiving-end power may be expressedas follows:
S L$ = Sl ZYE2ESR )*-ER =
SRE Si EtSi
2 - 2 - (ZOsinh rL ) ( t2anh-)L ER2ER n12
ES
I- oh2
TO* sinh rL IERI(2)
For a given set of terminal voltages, ES and ER (in per-unit of nominal volt-age), and a line length, L, the ratio of power transferred over a transmission lineto its SIL, (SR/SIL), is a function of the propagation constant, Y, and the ratio ofsurge impedance to characteristic impedance, SI/Z*. Because the series resist-ance, R, of EHV/UHV transmission lines is much smaller than their inductivereactance, X, the attenuation constant, oL, is very small, and the propagation con-stant, r, approaches the phase constant j,/, also, ZO approaches Si. Thus, equa-tion (2) reduces to:
SR E clos/3L2
-S-L = sin Al ERIsin L
but
where,
= a VTg = a)
v
v = 3 * 108 m/sec, speed of light
Therefore, assuming that a line is lossless, the ratio of the line loading toits SIL is independent of the line electrical parameters. It depends exclusivelyon the line length and the terminal voltages.
In actuality, lines are not truly lossless, and the ratio SR/SIL does depend,to a small degree, on the line constants and thus on the line voltage class. Thisdependance, however, is quite small for lines 345-kV and up, and is proportionalto the resistance of the line. Since all these lines have X/R =10 or higher, theirloadabilities at a given length, for all practical purposes, are constant if express-ed in per-unit of their respective SIL. This is the main premise behind normalizingthe line loading curves for all EHV/UHV transmission lines, and showing them as
a single graph applicable to all voltage classes within the range considered here.
REFERENCES
(1) H. P. St. Clair, "Practical Concepts in Capability and Performance of Trans-mission Lines," AIEE Transactions (Power Apparatus and Systems). Paper53-338 presented at the AIEE Pacific General Meeting, Vancouver, B. C.,Canada, September 1-4, 1953.
(2) Federal Power Commission, "National Power Survey," Part 11, pp. 45-47 and144-145. U.S. Government Printing Office, 1964.
(3) Federal Power Commission, "The 1970 National Power Survey," Part IV, pp.
IV-2-9 through 17. U.S. Government Printing Office.
(4) E. Clarke, S.B. Crary, "Stability Limitations of Long-Distance A-C Power-Transmission Systems." Discussion by A. M. Taylor. AIEE Transactions(Power Apparatus and Systems), vol. 60, pp. 1051-1059 and 1299-1303, 1941.
(5) E. W. DuBois,-J. F. Fairman, Jr., D. E. Martin, C. M. Murphy, J. B. Ward,"Extra-Long-Distance-Transmission," AIEE Transactions (Power Apparatusand Systems). Paper 61-793 presented at the AIEE Summer General Meeting,Ithaca, N.Y., June 18-23, 1961.
(6) Electric Power Research Institute, "Transmission Line Reference Book,345-kV and Above," New York, 1975.
(3)
Authorized licensed use limited to: Iowa State University. Downloaded on November 8, 2008 at 19:17 from IEEE Xplore. Restrictions apply.
614
Raymond 0. Dunlop (M'60) was born on August 4,1938 in Stowhegan, Maine. He received the B.S.E.E.
degree from the University of Maine, Drono, in 1960,and the M.S. and Ph. D. degrees in electrical engi-
neering from Illinois Institute of Technology, Chicago,in 1963 and 1969, respectively.
t s _ He was employed in 1960 by the Central Illinois
Electric and Gas Company, Rockford, Illinois. In 1961,he received the Power Systems Fellowship at the Illi-
nois Institute of Technology and worked for the Depart-
ment of Electrical Engineering as an Instructor from
1962 to 1966. Since 1966, he has been employed by the American Electric Power
Service Corporation, New York, N.Y., where he presently holds the position of
Head, Technical and Special Studies Section in the Bulk Transmission Planning
Division. His responsibilities include analysis and simulation of bulk power
systems for evaluation of dynamic performance, steady state and transient over-
voltages, transmission line characteristics, and his particular area of interest is
in assessment of the electromechanical dynamic performance of large interconnect-
ed power systems.
Dr. Dunlop is a member of IEEE, CIGRE, Tao Beta Pi, Sigma Xi, and Phi
Kappa Phi.
RichardGutman(M' 77) was born on July 8,1948.He received the B.S.E.E. degree (magna cum laude) in1974 and M.S.E.E. degree in 1975, both from the Poly-technic Institute of Brooklyn, New York. In 1977, he
had completed a two-year course in Electric PowerSystems Engineering given by the Power Technologies,
Inc., Schenectady, New York.
He has been in employment with the American
Electric Power Service Corporation, New Yurk, N.Y.since 1968, where he presently is responsible for tech-nical and special studies in EHV transmission in the
System Planning Department. His experience includes short circuit and X/R ratio
studies, three-phase transmission line modeling and unbalance analysis, groundwire selection, and most recently, UHV transmission research.
Mr. Gutman is a member of Tau Beta Pi, and is a Registered ProfessionalEngineer in the State of New York.
Peter P. Marchenko (M'49) was born in Poltava,
Ukraine, on July 11, 1909. He received a degree in
<-; electrical engineering from Kharkov ElectrotechnicalInstitute, Kharkov, Ukraine, in 1937.
From 1937 to 1948 he was an electrical engineerX in the construction and maintenance of various power
plants in eastern and central Europe. He joined the
American Electric Power Service Corporation, New
York, N. Y., in 1948 and had held several positions in
Operating,Generation Planning, and Bulk TransmissionPlanning Divisions. In 1974, upon his retirement, he
was named a Consulting Engineer to the System Planning Department, and served
in this capacity until 1977.
Discussion
N. B. Johnsen (Tucson Gas & Electric Co., Tucson, AZ): The authors
are to be complimented for presenting a paper which so clearlydescribes the capabilities of EHV and UHV transmission systems. It is
comforting to know that the more rigorous approach taken by theauthors confirms the original St. Clair curves which the industry has
used extensively over the past 25 years.
Will the authors please comment on the application of this ap-
proach to series compensated transmission lines. Do you plan to
prepare a set of St. Clair curves for series compensated lines?
Manuscript received February 24, 1978.
Harry B. Smith (C. T. Main, Engineers, Boston, MA): The authorshave made an excellent contribution to the collection of tools for thesystem planner. Perhaps because I am an old fossil of the Harry St.Clair age, I was particularly gratified to find that a thorough analyticalapproach yielded a generalized transmission line capability curve that
is, for practical purposes, identical with the old St. Clair curve (re
Figure 7 in the paper).I was somewhat disappointed in that the authors make no mention
of the effect on line capability of intermediate switching stations.This subject was investigated by Butler, Fiedler and Saline of the
General Electric Co., and reported to the industry in a paper presentedat an AIEE district meeting in Toledo, Ohio, October 1952. At thetime, the study concerned a 230 kV transmission system and, amongother things, yielded data for a set of curves of optimum number of in-termediate switching stations vs length of a double circuit transmissionline. From these curves, it is possible to obtain a de-rating factor to
apply to capability numbers read directly from the generalized capabili-ty curve, in cases where actual number of intermediate switching sta-tions is less than optimum.
While it is acknowledged that the above is not a precise type ofcalculation, it has been found that results check reasonably well withthe results of detailed system stability studies and with actual systemperformance.
As the authors imply, the generalized capability curve is a systemplanners tool, to be used with discretion and good judgement, andanswers obtained should eventually be checked by detailed load flowand stability tests. It has been found that intelligent use of the generaliz-ed capability curve enables the system planner to quickly make the cor-rect choice of transmission voltage level.
Manuscript received February 21, 1978.
S. Linke (Cornell University, Ithaca, NY): In this paper the authorshave presented some interesting and worthwhile additions to theliterature of surge-impedance loading (SIL) and transmission-linecapability/loadability, with emphasis on applications to EHV and UHVtransmission. The comments on the well-known St. Clair curves are
particularly welcome in that the impacts of constant steady-state stabili-ty and constant line-voltage drop on the genesis of the curves are clearlyset forth. The introduction of the term "loadability curve" is alsouseful. Apparently, the authors may have been unfamiliar with my re-
cent paper [11 in which the theoretical basis for loadability curves is
presented in detail, together with several convenient generalized equa-tions that may be used to generate families of curves, for a wide varietyof design conditions, without requiring a complex digital computer pro-gram for the solution of a network for each condition. This discussionwill demonstrate that the expressions derived in my paper, whenmodified by the authors' constant steady-state-stability and constantline-voltage-drop limitations, will provide sufficiently accuratereproductions of the St. Clair curves. Some general comments will alsobe made on the procedures that the authors have used to prove the
validity of the St. Clair curves, and a question will be raised on thechoice of sending and receiving-end impedances as they relate to systemstrength and steady-state-stability criteria.
It is important to realize that the solution of a transmission-linenetwork in great detail, for a wide variety of conditions, is not necessaryin order to prove the validity of the St. Clair curves. In the strict sense,going through such an exercise is not an "analytical" solution. It is
simply a verification of the fundamental behavior of the lines.Therefore, it should not be surprising that the authors achieved such ex-act correspondence with the results of earlier published work. In fact,their digital-computer solution only provides a much more complete,and undoubtedly more accurate, rendition of the network-analyzersolutions obtained by Clarke and Crary [2] in 1941. Using the results ofthese early solutions, Mr. St. Clair later developed and published[3] thevery useful curves that have become standards for the industry.
Any solution for transmission-line loadability, as a function of linelength, depends upon the combination of the power-angle equations ofthe line with the classic solution of the transmission-line HeavisideEquations, as demonstrated in my paper. A similar combined equation,in complex form, is given in equation (3) of the Appendix of theauthors' paper. Although this expression is based upon the same con-siderations outlined in my paper, it cannot be used to develop theloadability curves while in its present form. In their derivation theauthors have assumed a per-unit value of I for SIL, so that SI becomesequal to SIL, a condition that can only be true at one particular line
Authorized licensed use limited to: Iowa State University. Downloaded on November 8, 2008 at 19:17 from IEEE Xplore. Restrictions apply.
3.
3.
2.
2.
1.
1.
615
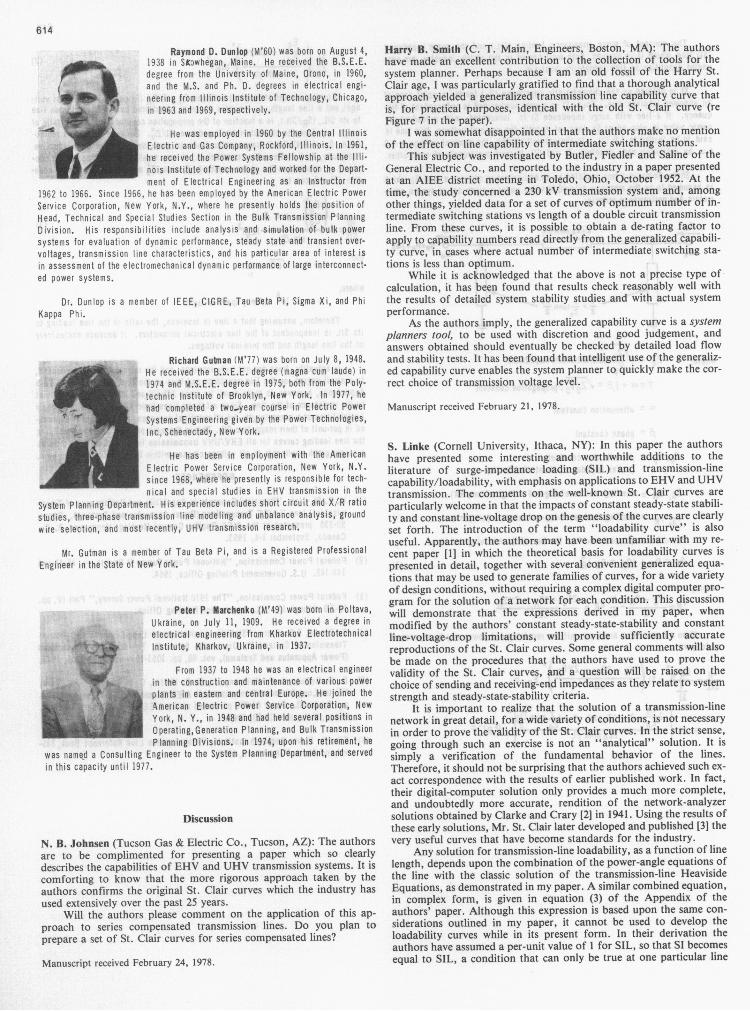
length, l, (equal to 300 miles for the example used in the authors'paper). Consequently, their Equation (3) gives the incorrect impressionthat the loadability is a function of the voltage level of the line becauseof the factor ER, whereas in actuality the theoretical loadability is vir-tually independent of the line-voltage level, as the authors themselvespoint out in the discussion of their Figure 8. Subsequently in Figure 9,and their related discussion, the authors correctly state that variousvoltage levels will affect the actual line loadability due to the influenceof specific terminal impedances used for each voltage level. If the fac-tor, E,2 is deleted, and if the complex power-angle equation istransformed into its real-power and reactive-power components, theauthors' Equation (3) can be readily used to determine loadability as afunction of line length, provided proper stability and line-voltage droplimitations are imposed. The influence of the power angle, 6SR, betweenthe sending-end and receiving-end terminals, and the importance of vartransfer will also become evident. These procedures were followed inmy paper and will now be demonstrated for the conditions assumed inthe authors' paper.
In my paper, power loadability is defined as the ratio of sending-end power, Ps, to SIL for a lossless line, and a quantity which could betermed "var loadability" is defined as the ratio of sending-end vars, Q5,to SIL for the same line. These definitions result in the following twoexpressions:
k = P5/SIL = m sindSR/sinfl/ = m sin 6SR/sin(O. 116/) (1)
q = QS/SIL = m2/tan PI- m cos dSR/sin P 1
= (m/sin(0. 116) [m cos(0. 1161) - cos dsR]
0
uzP4
.
EvA
¢-
-:4Cl
0
O.
(2)
where: 65 = power angle between ES and ER in degrees
m = IEsI/IERjI = length of line in milesP = co(LC)"2 = co/c = (377 x 180)/(186,282 x Tr) = 0.116 degrees permile.
In the authors' paper, a constant voltage drop of 5 percent was assumedbetween Es and ER so that the factor, m, would be equal to 1.05. Also,they chose a benchmark of SIL = 1 at 300 miles to conform with theoriginal St. Clair curve. It should be recalled that for SIL = 1, the var
transfer, Qs, will be zero. Solving Equation (1) for 6SR at SIL = 1
results in an angle of 32.90. Based on their assumed values of terminalreactances at the sending and receiving ends of the line, the authors'digital-computer solution apparently determined that the overall anglebetween their input voltage, E,, and their terminal voltage, E2, wouldbe within the 440 (35%) stability margin that was to be maintained.Thus, holding 6SR constant at 32.90, Equation (1) can be solved for kfor line lengths between 50 and 600 miles. Figure A shows the result ofthis computation as a set of dots superimposed upon the constantsteady-state-stability-margin curve of Figure 6 of the authors' paper.The close correspondence is obvious.
To solve for the condition of constant line-voltage drop, it isnecessary to obtain values of 6SR as the line length is varied. Since theline is assumed to be lossless, the var loss for any particular length, 1, ofthe line is given by:
Q, = El/Xi
But the voltage drop along the line, E,, is assumed to be constant for alllengths, and the reactance of the line, X, varies directly with the lengthof the line. Consequently, Ql, is inversely proportional to the linelength. If a benchmark of 3 per-unit SIL at 50 miles is chosen, substitu-tion into Equation (1) results in an angle, 6sR, of 22.64°. Placing thisangle in Equation (2) at 50 miles provides the corresponding value of qat m = 1.05. Since the vars vary inversely with distance, the value of qat 100 miles will be one-half of the value at 50 miles. Substitution of thisvalue of q into Equation (2) for 100 miles provides the new value of 6,SR,which can then be used in Equation (1) to find the corresponding valueof k at 100 miles. Similar calculations for greater distances result in thecomplete loadability curve at constant line-voltage drop. This calcula-tion at the benchmark of k = 3 at 50 miles was found to match the up-per portion of the original St. Clair Curve A (Normal Loading). Use ofan assumed benchmark of k = 4 at 50 miles was found to produce acurve that was very close to St. Clair Curve B (Heavy Load) that alsomatched the corresponding curve of the authors' Figure 6. The plot ofFigure A also displays the result of this latter computation as a series of
0_ _
l CONSTANT STEADY-STATE-STABILITY-MARGIN CURVE (35% MARGIN)
5 _______SS
CONSTAINT LINE-VOLTAGE-DROP-CURVE (LINE VOLTAGEDROP =5%)
REGION
OF LINE- _ _ __-__5 VOLTAGE- J REGION OF STEADY-STATE-
DROP- STABILITY LIMITATION
LIMITATION:'__ . _.
0 100 200 300 400 500 600
LINE LENGTH IN MILES
(NO SERIES OR SHUNT COMPENSATION)
Figure A. Comparison of curves of authors' Figure 6 with points ob-tained by use of gener-alized equations.
dots superimposed upon the authors' curve. Again the close cor-respondence is clearly shown.
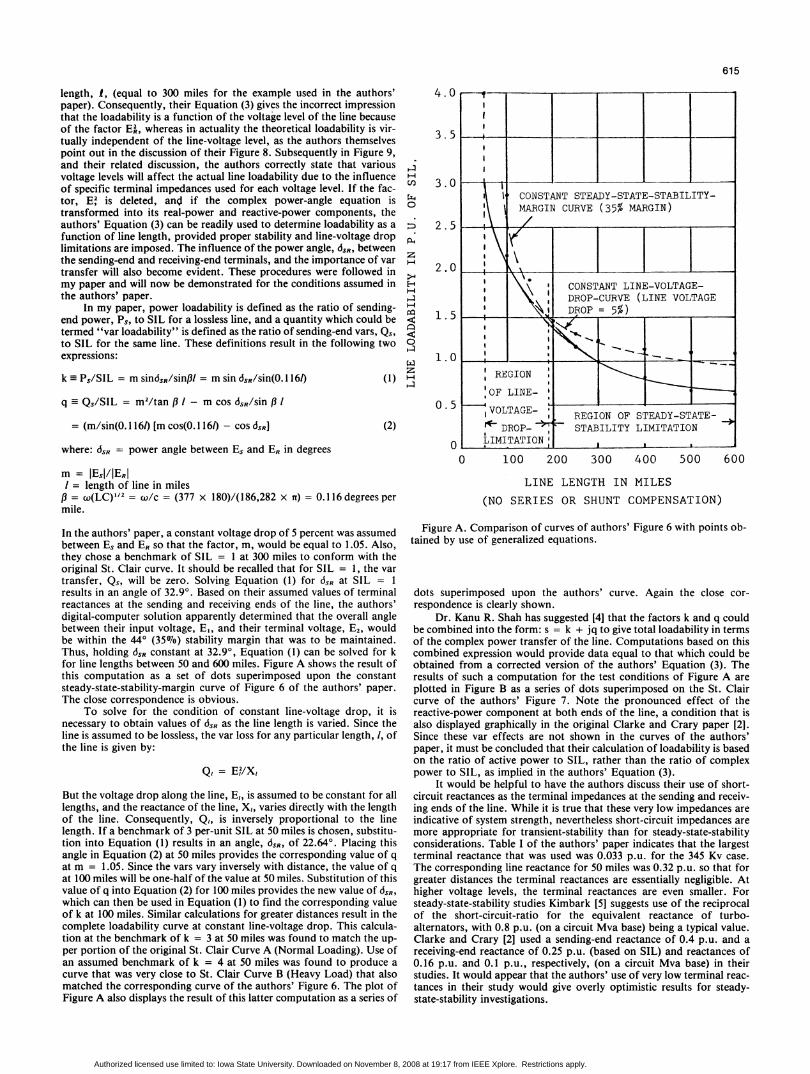
Dr. Kanu R. Shah has suggested [4] that the factors k and q couldbe combined into the form: s = k + jq to give total loadability in termsof the complex power transfer of the line. Computations based on thiscombined expression would provide data equal to that which could beobtained from a corrected version of the authors' Equation (3). Theresults of such a computation for the test conditions of Figure A areplotted in Figure B as a series of dots superimposed on the St. Claircurve of the authors' Figure 7. Note the pronounced effect of thereactive-power component at both ends of the line, a condition that isalso displayed graphically in the original Clarke and Crary paper [2].Since these var effects are not shown in the curves of the authors'paper, it must be concluded that their calculation of loadability is basedon the ratio of active power to SIL, rather than the ratio of complexpower to SIL, as implied in the authors' Equation (3).
It would be helpful to have the authors discuss their use of short-circuit reactances as the terminal impedances at the sending and receiv-ing ends of the line. While it is true that these very low impedances areindicative of system strength, nevertheless short-circuit impedances aremore appropriate for transient-stability than for steady-state-stabilityconsiderations. Table I of the authors' paper indicates that the largestterminal reactance that was used was 0.033 p.u. for the 345 Kv case.The corresponding line reactance for 50 miles was 0.32 p.u. so that forgreater distances the terminal reactances are essentially negligible. Athigher voltage levels, the terminal reactances are even smaller. Forsteady-state-stability studies Kimbark [5] suggests use of the reciprocalof the short-circuit-ratio for the equivalent reactance of turbo-alternators, with 0.8 p.u. (on a circuit Mva base) being a typical value.Clarke and Crary [2] used a sending-end reactance of 0.4 p.u. and areceiving-end reactance of 0.25 p.u. (based on SIL) and reactances of0.16 p.u. and 0.1 p.u., respectively, (on a circuit Mva base) in theirstudies. It would appear that the authors' use of very low terminal reac-tances in their study would give overly optimistic results for steady-state-stability investigations.
Authorized licensed use limited to: Iowa State University. Downloaded on November 8, 2008 at 19:17 from IEEE Xplore. Restrictions apply.
616
4.0
3.5
z
H
H4
0
z
E-4
-:
z
3.0
2.5
2.0
1.5
1.0
0.5
0
0 100 200 300 400 500 600
LINE LENGTH IN MILES
(NO SERIES OR SHUNT COMPENSATION)
Figure B. Comparison of curves of authors' Figure 7 with points ob-tained by use of complex form of the generalized equations.
This discussion is in no way meant to detract from the value of theauthors' paper but rather to clarify and enhance their findings. It isclear that the combination of their paper with mine provides a set ofvery useful tools for the transmission-line design engineer.
REFERENCES
[1] S. Linke, "Surge-Impedance Loading and Power-TransmissionCapability Revisited", Paper No. A77-249-6, IEEE TransactionsPAS-96 No. 4, July/August, 1977, p. 1079. Full text in IEEEPublication 77CH1 190-8 PWR.
[21 Edith Clarke and S. B. Crary, "Stability Limitations of Long-Distance A-C Transmission Systems". AIEE Transactions, Vol.60, 1941, pp. 1051-9, 1299-1303.
[3] H. P. St. Clair, "Practical Concepts in Capability and Perfor-mance of Transmission Lines", AIEE Transactions, Vol. 72,1953, pp. 1152-1157.
[41 K. R. Shah, Discussion of Paper A-77-249-6 by S. Linke, "SurgeImpedance Loading and Power Transmission CapabilityRevisited" IEEE Publication No. 77 CHI 191-6-PWR, November,1977.
[5] E. W. Kimbark, Power Systems Stability, Volume III-Syn-chronous Machines, a textbook published by John Wiley & Sons,Inc. New York, 1956, pp. 290-293.
Manuscript received February 21, 1978.
R. D. Dunlop, R. Gutman, and P. P. Marchenko: The authors wish tothank the discussors for their comments and interest in this paper.
In reply to the comments of Mr. Smith regarding the effect of in-termediate switching stations, this subject has been treated at most in anindirect manner in the paper. The central purpose of this paper was toprovide an analytical basis for loadability characteristics of simplepoint-to-point transmission lines, and to demonstrate that system
parameters and the choice of performance criteria can play an increas-ingly important role as the use of such generalized characteristics is ex-
tended to the UHV range. In the context of this paper, the impact of in-termediate switching stations could be evaluated indirectly in terms oftheir effect on the strength of the sending- and/or receiving-endsystems. This would in turn affect the voltage drop and/or stability per-
formance of the transmission line being studied. This subject has beendiscussed extensively in the technical literature including references tothis paper. Generally, the use of intermediate switching stations hasbeen justified primarily on the basis of enhanced stability margins andimproved reliability for parallel transmission lines associated withremote generating stations or load centers.
Mr. Smith's favorable comments on the practical usefulness ofcurves presented in this paper are appreciated. It was the authors' ob-jective to show the importance of considering all pertinent factors inevaluating transmission line loadabilities through prudent applicationof generalized loadability characteristics to any specific problem.
At Mr. Johnsen's request, the authors welcome the opportunity tocomment on the application of the approach developed in this paper toseries-compensated transmission lines. The effect of series compensa-tion was included in the formulation of the model (Figure 3), but wasnot illustrated in the results. The approach described in this paper islimited only to distributed series-capacitor compensation. No attempthas been made to evaluate the individual merits of various discreteseries-compensation schemes on line loadability.
In simplified terms, series compensation reduces the apparent elec-trical line length and, thus, increases the limits of power transfer. Adirect application of the loadability curves by means of a simple reduc-tion in line length equal to the degree of series compensation installed,however, is not recommended by the authors. This is because seriescompensation affects the series reactance component of the line and notthe shunt line charging component and, thus, does not influence voltageand stability performance in a similar manner.
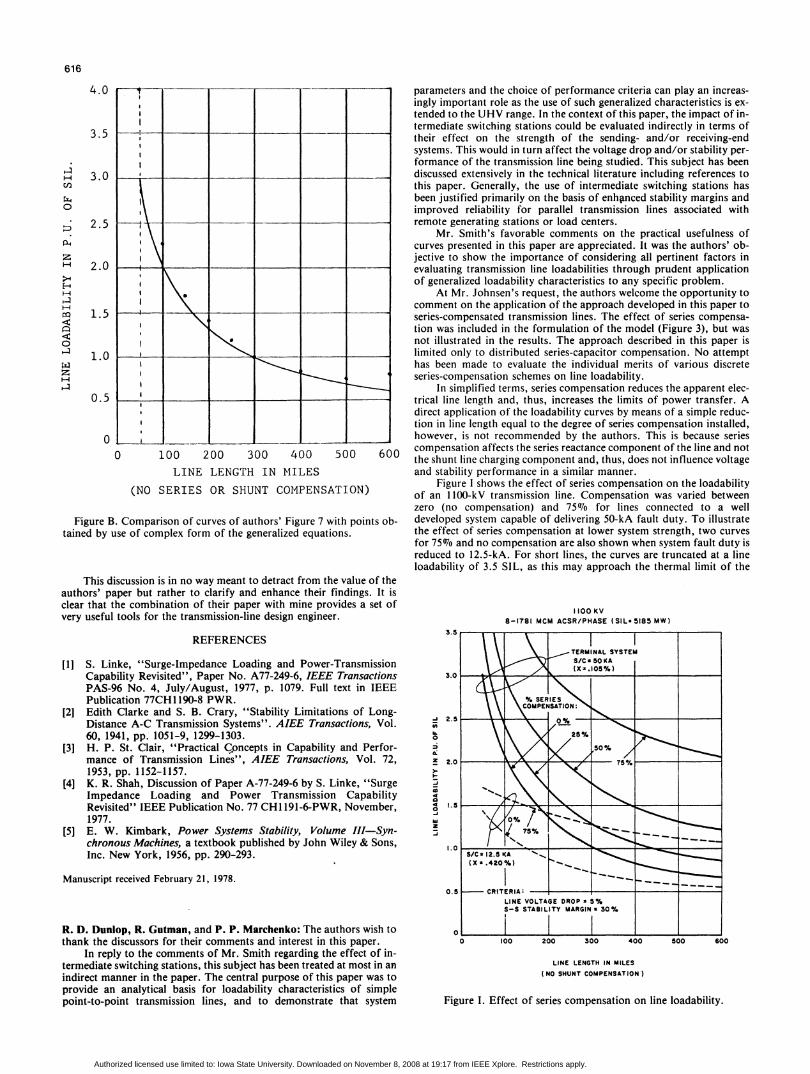
Figure I shows the effect of series compensation on the loadabilityof an I 100-kV transmission line. Compensation was varied betweenzero (no compensation) and 75% for lines connected to a welldeveloped system capable of delivering 50-kA fault duty. To illustratethe effect of series compensation at lower system strength, two curvesfor 75% and no compensation are also shown when system fault duty isreduced to 12.5-kA. For short lines, the curves are truncated at a lineloadability of 3.5 SIL, as this may approach the thermal limit of the
100 KV8-1781 MCM ACSR/PHASE (SILs 5185 MW)
z
0
<t
-9
LINE LENGTH IN MILES
(NO SHUNT COMPENSATION )
Figure I. Effect of series compensation on line loadability.
ITI1 :I
It,I N
.
Authorized licensed use limited to: Iowa State University. Downloaded on November 8, 2008 at 19:17 from IEEE Xplore. Restrictions apply.
conductors used. The results demonstrate the performance aspects ofseries compensation for the levels indicated. The technical andeconomic feasibility for such a range of application at any particularlength of line is another matter which will not be discussed here.
The effect of series compensation on UHV line loadability isespecially significant when lines are long and terminal systems are welldeveloped. For example, compensating a 400-mile line at 50% couldnearly double the line loadability. Clearly, the stronger the system, thelower is its portion of overall reactance and, thus, the more pronouncedis the reduction of that total reactance for every percent of line compen-sation. One point worth noting is that every additional percent of seriescompensation yields increasingly greater improvement in line loadabili-ty; e.g., increasing line compensation from 25% to 50% brings a largerincrement in loadability than that between 07o and 25%. In fact, toachieve a greater economy of installed line compensation, one might betempted to increase it beyond what is necessary-losing sight of anumber of the compounding technical problems which are commen-surate with an increasing degree of series compensation.
Mr. Linke bases his discussion on his recent paper on the relatedsubject. Although the work reported on in this paper was essentiallycompleted when Mr. Linke's paper was presented, the authors did notchoose to include it as a reference because we concluded that his ap-proach was founded on the basis of inadequate and misleading assump-tions. It does not seem at all correct to define power limits of transmis-sion lines solely in terms of the maximum stability limit. It is especiallymisleading when this maximum stability limit is defined as the angulardisplacement in the line itself and not that across the entire systemunder study-a point which was so emphatically made in this paper andyet totally ignored in Mr. Linke's analysis. Precisely, as Mr. Linkepoints out, his expressions need to be "modified by the authors' cons-tant steady-state-stability and constant line-voltage-drop limitations[to] provide sufficiently accurate reproductions of the St. Clair curves."
Mr. Linke, also, appears to have misunderstood the purpose of theAppendix, evidently assuming that it gives a derivation of the principalequations used in the development of loadability curves. The purposeof the Appendix, which is clearly stated in its first paragraph, is todiscuss the fact that the EHV/UHV transmission line loadability, whenexpressed in per-unit of surge impedance loading (SIL), is nearly in-dependent of the line characteristics. It is only a conceptual analysis ap-
617
pended to the paper to show the general formulation of ideas, and itwas not used in the actual development of loadability curves-the exactderivation being much too involved to be shown here. Further, in Equa-tion (3), Mr. Linke confuses the voltage class with per-unit voltagevalue, which is the reason why he is left with the "incorrect impressionthat the loadability is a function of the voltage level."
More confusion still, results from his statement, "...the authorshave assumed a per-unit value of 1 for SIL, so that SI becomes equal toSIL, a condition that can only be true at one particular line length...".This assertion is nowhere made or implied in this paper. Rather, it is ex-plicitly stated that, in the per-unit system, SI and SIL are reciprocals ofeach other. Surely, Mr. Linke must have forgotten the relation betweenthese two quantities which is,
SIL = IEINOM= I
Si Si C
where
SI = f L, surge impedance in per-unitand which, obviously, is independent of the length of line.
Lastly, to answer Mr. Linke's question regarding the use of short-circuit reactances as the terminal impedances, the authors agree with thediscussor that the fault duty levels, from which these reactances arederived, are quite indicative of system strength, the fact stated in thispaper. Furthermore, the authors' definition of stability margin does in-clude certain aspects of transient stability (see section "Limiting Factorsand Assumptions") and, as such, it was only reasonable to use the faultduty levels in describing the system strength for the purpose of thisstudy.
In closing the authors would like to stress once again the impor-tance of all the underlying assumptions made in arriving at thegeneralized EHV/UHV transmission loadability characteristics, and re-mind the reader that such characteristics should not be construed as asubstitute for detailed planning studies.
Manuscript received August 11, 1978.
Authorized licensed use limited to: Iowa State University. Downloaded on November 8, 2008 at 19:17 from IEEE Xplore. Restrictions apply.