Embed Size (px)
Citation preview

SYSTEMS METABOLIC ENGINEERING OF ARABIDOPSIS FOR INCREASED
CELLULOSE PRODUCTION
Jiun Y. Yen
Thesis submitted to the faculty of the Virginia Polytechnic Institute and State University
in partial fulfillment of the requirements for the degree of
Master of Science
In
Biological Systems Engineering
Ryan S. Senger, Chair
Glenda E. Gillaspy, Co-Chair
Chenming Zhang
December 5th, 2013
Blacksburg, VA
Keywords: cellulose, Arabidopsis thaliana, genome-scale model, flux ratio, flux balance
analysis, mitochondrial malate dehydrogenase, biomass

Systems Metabolic Engineering of Arabidopsis for Increased Cellulose Production
Jiun Y. Yen
ABSTRACT
Computational biology enabled us to manage vast amount of experimental data
and make inferences on observations that we had not made. Among the many methods,
predicting metabolic functions with genome-scale models had shown promising results in
the recent years. Using sophisticated algorithms, such as flux balance analysis,
OptKnock, and OptForce, we can predict flux distributions and design metabolic
engineering strategies at a greater efficiency. The caveat of these current methods is the
accuracy of the predictions. We proposed using flux balance analysis with flux ratios as
a possible solution to improving the accuracy of the conventional methods. To examine
the accuracy of our approach, we implemented flux balance analyses with flux ratios in
five publicly available genome-scale models of five different organisms, including
Arabidopsis thaliana, yeast, cyanobacteria, Escherichia coli, and Clostridium
acetobutylicum, using published metabolic engineering strategies for improving product
yields in these organisms. We examined the limitations of the published strategies,
searched for possible improvements, and evaluated the impact of these strategies on
growth and product yields.
The flux balance analysis with flux ratio method requires a prior knowledge on
the critical regions of the metabolic network where altering flux ratios can have
significant impact on flux redistribution. Thus, we further developed the reverse flux
balance analysis with flux ratio algorithm as a possible solution to automatically identify
these critical regions and suggest metabolic engineering strategies. We examined the

iii
accuracy of this algorithm using an Arabidopsis genome-scale model and found
consistency in the prediction with our experimental data.

iv
ACKNOWLEDGEMENTS
First I would like to express my sincerest gratitude to my advisors, Dr. Ryan
Senger and Dr. Glenda Gillaspy, for their guidance and financial support throughout this
research. They have given me new skills as well as made me a better critical thinker.
They are not just teachers who guided me in science but in life as well. All of my
accomplishments are the result of their undivided attentions to my every need and their
unweaving patience to my inexperience, stubbornness, and other difficulties. Often time,
I feel that I am blessed with biological parents and professional parents who are willing
to consider me as more than who I am.
I would also like to thank Dr. Chenming Zhang for serving on my graduate
committee providing invaluable advice and guidance through our meetings. Additional
thanks are extended to the members of the Senger research group for providing their
computational and engineering expertise. I want to extend a special thanks to the
members of the Gillaspy research group, whom I have spent most of my professional
time with. They have enthusiastically offered their time and expertise to help me to my
goals. I am reluctant to describe the members of the Senger research group and the
Gillaspy research group as my co-workers because I value them more as my closest
friends.

v
TABLE OF CONTENTS
ABSTRACT ii
ACKNOWLEDGEMENTS iv
TABLE OF CONTENTS v
LIST OF FIGURES viii
LIST OF TABLES x
LIST OF ABBREVIATIONS xi
CHAPTER I 1
INTRODUCTION 1
LITERATURE REVIEW 4
An Introduction to Genome-Scale Model 4
AraGEM – an Arabidopsis thaliana Genome-Scale Model 7
CHAPTER II 10
DERIVING METABOLIC ENGINEERING STRATEGIES FROM
GENOME-SCALE MODELING WITH FLUX RATIO CONSTRAINTS 10
ABSTRACT 11
INTRODUCTION 12
Systems metabolic engineering using genome-scale models 12
Incorporation of flux ratios 13
Using FBrAtio to evaluate and improve metabolic engineering strategies 15
METHODS 17
Genome-scale models and simulation methods 17
Construction and installation of flux ratio constraints 18
Simulations with flux ratios 21
RESULTS 21
Case Study 1: Cellulose production from Arabidopsis 21
Case Study 2: Isobutanol production from yeast 26
Case Study 3: Acetone production from cyanobacteria 33
Case Study 4: Hydrogen production from E. coli 39
Case Study 5: Isopropanol, butanol, and ethanol (IBE) production from
clostridia 45
DISCUSSION 54
ACKNOWLEDGEMENT 57

vi
CONFLICT OF INTEREST STATEMENT 57
REFERENCES 58
CHAPTER III 66
INCREASED CELLULOSE PRODUCTION BY ARABIDOPSIS THALIANA
THROUGH SYSTEMS METABOLIC ENGINEERING 66
ABSTRACT 67
INTRODUCTION 68
Engineering higher cellulose content in plants 68
Deriving metabolic engineering strategies genome-scale metabolic flux
modelling 69
Using FBrAtio to increase cellulose production 71
MATERIALS AND METHODS 72
Gene candidate prediction by Reverse FBrAtio 72
Step 1: Identification of the genome-scale model, constraints, and cases 72
Step 2: Identification of nodes and effective reactions 75
Step 3: Computation of flux ratios and changes of flux ratios per
reaction/node pair 76
Step 4: Evaluation of ∆ values to identify metabolic engineering targets 77
Plant growth conditions 79
Gene cloning 79
Tissue collection 80
Protein analysis 80
Quantitation of cellulose 81
Quantitation of biomass 82
RESULTS 83
Gene candidate prediction by Reverse FBrAtio 83
Step 1 – Adjustment of constraints and generation of cases 83
Step 2 – Identification of reaction/node pairs 83
Step 3 – Computation of flux ratios and changes of flux ratios 85
Step 4 – Evaluation of ∆ for genetic engineering candidates 88
Constrasting Reverse FBrAtio evaluations with conventional FBA 92
Validating the predicted phenotypes of over-expression of mMDH2 in
Arabidopsis thaliana 96
DISCUSSION 105

vii
Predicting genes useful for metabolic engineering strategies with Reverse
FBrAtio 105
Contrasting Reverse FBrAtio with conventional FBA 106
Further implications from Reverse FBrAtio 107
Validating the predicted phenotypes of over-expression of mMDH2 in
Arabidopsis thaliana 107
CONCLUSION 109
REFERENCES 110
CHAPTER IV 114
CONCLUSION 114
FUTURE DIRECTION 116
What else were suggested from the Reverse FBrAtio results and how should
they be tested? 116
What were the biochemical changes that lead to the mMDH phenotypes? 118
REFERENCES 120

viii
LIST OF FIGURES
Figure II-1. An example of a critical node at an acetyl-CoA metabolite. 20
Figure II-2. The metabolic pathway leading to the production of cellulose in
Arabidopsis. 24
Figure II-3. Simulations of the AraGEM genome-scale model for constrained
values of the UTP flux ratio. 25
Figure II-4. The metabolic network of yeast leading to isobutanol formation. 29
Figure II-5. Simulations of the iND750 genome-scale model of S. cerevisiae with
an added pathway to isobutanol and flux ratios around the pyruvate and
L-valine critical nodes. 30
Figure II-6. The metabolic network of Synechocystis sp. PCC6803 containing
the synthetic pathway to acetone. 35
Figure II-7. Simulation of the iJN678 genome-scale model for Synechocystis sp.
PCC6803 with the synthetic pathway leading to acetone formation. 38
Figure II-8. The metabolic network of E. coli used to model hydrogen production. 41
Figure II-9. Simulation of the iAF1260 genome-scale model for E. coli MG1655
with flux ratios leading to enhanced hydrogen production. 42
Figure II-10. The modified primary metabolic network of C. acetobutylicum
leading to isopropanol, butanol, and ethanol (IBE) production. 47
Figure II-11. IBE yields per g of glucose and acetate uptake (g/g) with growth
rate (h-1) for all unique flux ratio combinations explored in C. acetobutylicum. 52
Figure III-1. The illustrated algorithm of computing genetic engineering candidates. 74
Figure III-2. The change in growth rate and cellulose accumulation rate over the
change of cellulose concentration. 84
Figure III-3. Examples of flux ratios and change in flux ratios for two reaction/node
pairs. 87
Figure III-4. The predicted flux distribution for the enhancement of cellulose
accumulation. 94
Figure III-5. The relationships between FBA solutions, flux ratios, and change of
flux ratios. 95
Figure III-6. The mMDH2:2×HA transgene construct. 98

ix
Figure III-7. Western blot analysis of five transgenic lines expressing mMDH2:HA. 99
Figure III-8. The rosette leaf phenotype of mMDH2:HA plants. 100
Figure III-9. Rosette leaf surface area of WT and mMDH2:HA plants. 101
Figure III-10. Comparison of WT and mMDH2:HA plant stems. 102
Figure III-11. Biomass and cellulose content of WT and mMDH2:HA plants. 103

x
LIST OF TABLES
Table II-1. Comparisons between FBrAtio and FBA using the iND750 model of S.
cerevisiae containing an added pathway to isobutanol. 32
Table II-2. Comparisons between FBrAtio and FBA using the iAF1260 model of
E. coli MG1655 with flux ratios modified for increased hydrogen (H2) production. 44
Table II-3. Optimized flux ratios leading to production of solvents from engineered
C. acetobutylicum ATCC 824. 50
Table II-4. Sensitivity analysis of flux ratios leading to optimized solvent yields
from C. acetobutylicum ATCC 824. 53
Table III-1a. An example of the flux ratio matrix. 86
Table III-1b. An example of the change of flux ratio matrix. 86
Table III-2. Candidate reaction/node pairs for enhancement of cellulose
accumulation. 90
Table III-3. Estimated cellulose content in WT and mMDH2:HA. 104
xi
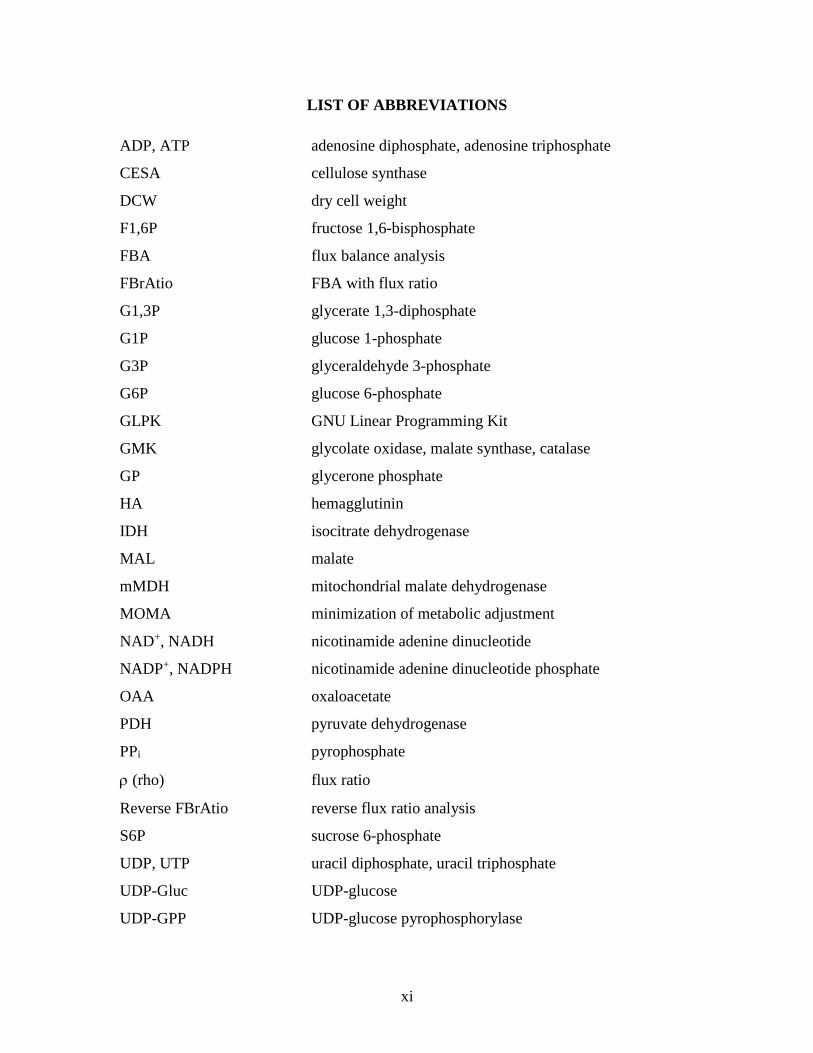
LIST OF ABBREVIATIONS
ADP, ATP adenosine diphosphate, adenosine triphosphate
CESA cellulose synthase
DCW dry cell weight
F1,6P fructose 1,6-bisphosphate
FBA flux balance analysis
FBrAtio FBA with flux ratio
G1,3P glycerate 1,3-diphosphate
G1P glucose 1-phosphate
G3P glyceraldehyde 3-phosphate
G6P glucose 6-phosphate
GLPK GNU Linear Programming Kit
GMK glycolate oxidase, malate synthase, catalase
GP glycerone phosphate
HA hemagglutinin
IDH isocitrate dehydrogenase
MAL malate
mMDH mitochondrial malate dehydrogenase
MOMA minimization of metabolic adjustment
NAD+, NADH nicotinamide adenine dinucleotide
NADP+, NADPH nicotinamide adenine dinucleotide phosphate
OAA oxaloacetate
PDH pyruvate dehydrogenase
PPi pyrophosphate
(rho) flux ratio
Reverse FBrAtio reverse flux ratio analysis
S6P sucrose 6-phosphate
UDP, UTP uracil diphosphate, uracil triphosphate
UDP-Gluc UDP-glucose
UDP-GPP UDP-glucose pyrophosphorylase

1
CHAPTER I
I Chap 1
INTRODUCTION
In 2011, the global petroleum consumption was on average 2.1 million gallons per
day, and one-fifth was consumed by the United States alone (Statistics from the U.S.
Energy Information Administration). To assist the high demand, ethanol has been
produced in large-scale as fuel and fuel additive. In 2011, the global fuel ethanol
production reached 35 thousand gallons per day, but it was still unmatched to the global
fuel energy demand. To improve the production of fuel ethanol, many researchers have
focused on modifying the plant feedstock to reduce the cost of sugar extraction and
refinement. The major topics for genetic engineering have been to increase the cell wall
degrading enzyme activity, improve digestibility by reduce cell wall rigidity, and enhance
cellulose or lignocellulose and biomass accumulation (Demura and Ye, 2010; Hames,
2009; Jung et al., 2012; Wang and Dixon, 2012). Most metabolic engineering have been
dedicated to modifying genes that are known to associate with these properties, while
more ambiguous genes are rapidly being identified through methods such as quantitative
trait loci (QTL) and computational prediction (Capron et al., 2013; Shiringani and Friedt,
2011). One of the rising computational methods is the use of genome-scale metabolic
models (GEM). The GEM modeling approach utilizes the current knowledge of the
metabolism of an organism in form of metabolic reactions, and computationally
determines the optimal distribution of metabolite conversion rates, the metabolic fluxes.
Optimization of metabolic flux distribution in a metabolic network can be accomplished
using flux balance analysis (FBA) after assigning proper constraints and an objective

2
function of maximizing the growth rate of the organism (Orth et al., 2010; Varma and
Palsson, 1994a). Recently, a GEM reconstruction of Arabidopsis thaliana, AraGEM,
was published by de Oliveira Dal’molin, et al. 2010 and was used to model redox
metabolism of photosynthetic and non-photosynthetic cells as well as predicting
photorespiratory cycles (de Oliveira Dal'Molin et al., 2010). In the current research,
AraGEM was used to derive metabolic engineering strategies for increasing the cellulose
content in plant biomass.
This work focused on the implementation of flux balance analysis with flux ratios
(FBrAtio) method and the reverse flux balance analysis with flux ratios (reverse FBrAtio)
algorithm. The FBrAtio method further constrain a genome-scale model to adjust the
proportions of flux distribution of the competing reactions for a substrate. This method
had been shown to reduce the degrees of freedom in complex pathways and offered
greater control in flux distribution than the conventional flux constraints (McAnulty et
al., 2012). The limitation of this method is the need for prior knowledge on the metabolic
network to properly assign flux ratios at region that can critically alter the flux
distribution. Thus, we developed the reverse FBrAtio to automatically predict the critical
regions with high flux redistribution.
In order to determine the accuracy and limitation of these algorithms, I have
developed the following objectives:
1. To examine known metabolic engineering strategies and predict new
strategies for altering metabolite productions in different organisms by
implementing the FBrAtio method with well-constructed genome-scale
models.

3
2. To predict and test metabolic engineering strategies that can increase
cellulose accumulation in Arabidopsis thaliana by implementing reverse
FBrAtio in AraGEM.

4
LITERATURE REVIEW
An Introduction to Genome-Scale Model
The use of computational methods to model systems of biochemical pathways can
dated back to 1959 when Britton Chance, David Garfinkel, Joseph Higgins, and Benno
Hess began to publish a large series of careful analyses on metabolic control mechanisms
in Ehrlich ascites tumor cells (Chance and Hess, 1959). The result of their studies was a
well-defined model of the respiratory and glycolytic pathway of the tumor cell with 89
reactions and 65 chemical molecules (Garfinkel and Hess, 1964). With this model, they
were able to qualitatively characterize aerobic glycolysis; however, there were no
significant quantitative evaluations due to their lack of enzyme kinetics and regulation as
well as computational power (Varma and Palsson, 1993). Later, Abhay Joshi and
Bernhard Palsson described the most complex model of the metabolism in a human red
blood cell at the time, which accounted for the dynamic mass balance of 33 metabolites
and the kinetics of 41 enzymes (Joshi and Palsson, 1989a). They then described an ionic-
osmotic model to illustrate the cells interactions with the environment over various
osmotic states (Joshi and Palsson, 1989b). They completed the model by gathering
information on enzyme kinetics to constrain the previously described metabolic model
along with the osmotic constraints (Joshi and Palsson, 1990a). Even so, the model could
only provide good qualitative predictions that correlates well with some experiments
(Joshi and Palsson, 1990b).
At that time, David Fell and Rankin Small were investigating the potential of
determining reaction fluxes by balancing the stoichiometry of reactions as a system of
linear equations using linear programming (Fell and Small, 1986). They organized the

5
reactions in their model of adipocyte metabolism into an 𝑚 × 𝑛 stoichiometric matrix,
𝑎𝑖𝑗, where 𝑚 is the array of metabolites and 𝑛 is the array of reactions. The values in the
matrix are the stoichiometric coefficients of the metabolites in the reactions. For each
reaction, there was a flux, 𝑥𝑗. The fluxes could only be zero or positive; therefore, if a
reaction was reversible, the forward and the reverse versions must be included. The
model was presented as a system of linear equations such that 𝑎𝑖𝑗 × 𝑥𝑗 = 𝑜𝑟 > 𝑜𝑟 < 𝑏𝑗 ,
where 𝑏𝑗, at steady-state, was zero for all internal metabolite, less than zero for all
reactants, and greater than zero for all products. The optimal flux solution, 𝑥𝑗, was one
that minimizes the cost function (Fell and Small, 1986):
𝑓(𝑥) = 𝑐1𝑥1 + 𝑐2𝑥2 ⋯ + 𝑐𝑛𝑥𝑛 (Eq. 1)
For a reaction that was to be minimized, a positive cost coefficient, 𝑐, was
assigned, and for one that was to be maximized, a negative coefficient was given. All
other reactions were given zero costs since they were not the objective. In their study,
they wanted to model the flux distribution under minimal glucose uptake to achieve
maximal triacylglycerol production. Although they showed that this method could
rapidly balance large sets of reactions under stoichiometric constraints, they were not
able to properly compare the computational evaluations with experimental results. In
1993, Amit Varma and Bernhard Palsson published their attempt to determine reaction
flux of their stoichiometric metabolic network of Escherichia coli using the linear
programming approach. Their objective was to model the cofactor synthesis as well as
the synthesis of the 12 basic biosynthetic precursors. Again, they adapted the steady-
state analysis from Fell and Small, 1986, and formulated:
𝑆 ∙ 𝑣 = 𝑏 (Varma and Palsson, 1993)

6
This is simply a revision of the previous equation where 𝑆 is the stoichiometric
matrix, 𝑣 is the flux vector for the reactions, and 𝑏 is the metabolite constraint. Their
revision also included bi-directionality of the flux values so each reversible reaction did
not need two representing equations. The reversibility of reactions was
thermodynamically determined. The maximizing reaction was given a non-zero 𝑏 value
in the objective function while all the other reactions were assigned zeros. The
optimization searched for one of the optimal flux solutions to stoichiometrically balance
all of the reactions while maximizing or minimizing the objective function. This method
was eventually termed and thoroughly reviewed as flux balance analysis, or FBA
(Bonarius et al., 1997; Varma and Palsson, 1994a). Although this method was limited by
the lack of enzyme regulation constraints and thermodynamic data on reaction rates, the
authors were able to successfully model the syntheses of the cofactors and the precursors.
Because the model could not account for metabolic concentrations, all flux values were
simply relative. However, this, along with their subsequent research on this model
(Varma and Palsson, 1994b), opened many opportunities to using metabolic flux-balance
models for deriving genetic engineering strategies.
In 1999, Christophe Schilling, Jeremy Edwards, and Bernhard Palsson introduced
the concept of using genomic data to build a large-scale metabolic model that
encompasses all the phenotypes from all the identified genes of an organism (Schilling et
al., 1999). This idea gave rise to the construction of “genome-scale” models, which
incorporated information from genome annotation, in many well-studied species,
including E. coli (Edwards and Palsson, 2000), Helicobacter pylori (Schilling et al.,
2002; Thiele et al., 2005), Saccharomyces cerevisiae (Forster et al., 2003; Herrgard et al.,

7
2008), and eventually Mus musculus (Sheikh et al., 2005), Arabidopsis thaliana (de
Oliveira Dal'Molin et al., 2010; Poolman et al., 2009), and Homo sapiens (Duarte et al.,
2007). For any organism, as long as there is a well curated genomic data, it is possible to
compile a list of reactions catalyzed by the enzymes encoded by annotated genes. This
list of reactions can then be mapped to a stoichiometric matrix (with 𝑚 × 𝑛 dimensions)
and be used in FBA. The concept may be simple, but this approach inevitably requires
much manual curation to build a high-quality model. Problems such as finding gaps
between reactions and assigning thermodynamic constraints will require extra research
and knowledge about the organism. Recently, Ines Thiele and Bernhard Palsson
published a protocol for constructing high-quality genome-scale metabolic models in
effort to develop a standard for generating reliable models (Thiele and Palsson, 2010)
AraGEM – an Arabidopsis thaliana Genome-Scale Model
In 2009, the first genome-scale model reconstruction of the Arabidopsis genome
was published (Poolman et al., 2009). It was consisted of 1,406 reactions using 1,253
metabolites. Most of the reactions were gathered from the AraCyc database and
compartmentalization was limited. The model also allowed the production of new
biomass (i.e., growth), which consisted of amino acids, nucleotides, lipids, starch, and
cellulose as the major components. The objective was to model the metabolism of
cultured Arabidopsis cells when grown on minimal media. When optimized using linear
programming, it was shown that only 232 reactions were utilized. The authors defended
that it was the result of their specific focus on a subset of the organism’s biosynthesis and
the computational caveat when minimizing total flux leading to lesser reactions

8
consuming flux. However, this result also implied that only a very small subset of
metabolism was required to achieve experimental cell growth. Furthermore, the
predicted flux paths and results aligned with many experimental data and known facts,
which strengthened this author’s confidence in the flux-balanced metabolic modeling
approach.
At the same time, Cristiana Dal’Molin and colleagues went in depth to develop
their own version of Arabidopsis genome-scale model. Their goal was to construct a
compartmentalized cellular model that encompassed the primary metabolism. They
developed AraGEM using available reaction databases, including the Kyoto
Encyclopedia of Genes and Genomes (KEGG) and AraCyc, as well as manually curated
additional reactions (de Oliveira Dal'Molin et al., 2010). AraGEM was
compartmentalized into 5 organelles: cytoplasm (c), mitochondrion (m), plastid (p),
peroxisome (x), and vacuole (v). The authors gave AraGEM the necessary reactions to
model cells undergoing photorespiration as well as photosynthetic and non-
photosynthetic cells. It was published, in 2010, with 1,748 compartmentalized
metabolites used in 1,567 unique reactions. Since then, updates have been made to
AraGEM, and it is currently consisted of 1,737 metabolites in 1,601 reactions associated
with 1,404 unique open reading frames (ORF). The compartmentalization was
accomplished with data from The Arabidopsis Information Resource (TAIR) and
AraPerox for peroxisomal proteins (Cui et al., 2008; Reumann et al., 2004). AraGEM
was shown to accurately model photon utilization in photosynthesis and photorespiration
and successfully compare the energy distribution under the two conditions. It could also

9
model the enzyme favorability and the redox metabolism to achieve the optimal growth
and maintenance in non-photosynthetic cells.
Although AraGEM was proven to be accurate in modeling multiple Arabidopsis
pathways, there were still many necessary improvements to be made. It had been
suggested that the addition of secondary metabolism could further improve the accuracy
of the model in more pathways (Collakova et al., 2012). Other comments were on the
lack of regulatory constraints, a critical caveat of metabolic flux models (Collakova et al.,
2012; Price et al., 2004).

10
CHAPTER II
II Chap 2
DERIVING METABOLIC ENGINEERING STRATEGIES FROM GENOME-
SCALE MODELING WITH FLUX RATIO CONSTRAINTS
Jiun Y. Yen, Hadi Nazem-Bokaee, Benjamin G. Freedman, Ahmad I. M. Athamneh,
Ryan S. Senger*
Department of Biological Systems Engineering; Virginia Tech; Blacksburg, VA 24061
*Corresponding Author
Corresponding Author Contact:
Email: [email protected]
This published article Yen, J. Y., Nazem-Bokaee, H., Freedman, B. G., Athamneh,
A. I. M., Senger, R. S., 2013. Deriving metabolic engineering strategies from
genome-scale modeling with flux ratio constraints. Biotechnology Journal. 8, 581-
594 was used with permission from John Wiley and Sons, Inc.

11
ABSTRACT
A new method of using flux balance analysis with flux ratios (FBrAtio) was
further developed in this research and applied to five case studies to evaluate and design
metabolic engineering strategies for microbial cell factories. The method was
implemented using publicly available genome-scale metabolic flux models. Synthetic
pathways were added to these models along with flux ratio constraints by FBrAtio to
achieve increased (i) cellulose production from Arabidopsis; (ii) isobutanol production
from yeast; (iii) acetone production from Synechocystis sp. PCC6803; (iv) H2 production
from Escherichia coli MG1655; and (v) isopropanol, butanol, and ethanol (IBE)
production from engineered Clostridium acetobutylicum. The FBrAtio approach was
applied to each case to simulate a metabolic engineering strategy already implemented
experimentally, and flux ratios were continually adjusted to find (i) the end-limit of
increased production using the existing strategy, (ii) new potential strategies to increase
production, and (iii) the impact of these metabolic engineering strategies on product yield
and culture growth. The FBrAtio approach has the potential to design “fine-tuned”
metabolic engineering strategies in silico that can be implemented directly with available
genomic tools.
12
INTRODUCTION
Systems metabolic engineering using genome-scale models
The continued advancement of computing power and integration with biology that
gave rise to bioinformatics and computational biology is also now enabling the field of
systems metabolic engineering. In this burgeoning field of research, potential metabolic
engineering strategies are derived and evaluated in silico using “global” models of
metabolism, an entire cell, or eventually tissues/organs/organisms (Becker et al., 2011;
Blazeck and Alper, 2010; Lee et al., 2011). These models are typically “genome-scale”
and can be based on metabolic flux (Edwards et al., 2001; Papoutsakis, 1984; Varma and
Palsson, 1994) or enzyme kinetics (Jamshidi and Palsson, 2008). Ultimately, the goal is
to alleviate the time- and resource-intensive exploratory research in the laboratory to
design microbial cell factories and therapeutics. The research presented here is focused
on genome-scale metabolic flux modeling. This approach gained popularity since it was
shown that one can accurately model the growth rate of Escherichia coli over entire
ranges of carbon and oxygen uptake rates (Edwards et al., 2001). Several reviews of
genome-scale modeling exist (Feist and Palsson, 2008; Milne et al., 2009; Papin et al.,
2003; Price et al., 2003), and genome-scale models are now under construction for
thousands of microbial species due to automated metabolic network reconstruction
procedures (DeJongh et al., 2007; Henry et al., 2010; Liolios et al., 2010; Notebaart et al.,
2006). Multiple tools have been built to utilize genome-scale modeling in deriving and
evaluating metabolic engineering strategies, and many success stories are now available
in the literature. In particular, OptKnock (Burgard et al., 2003) was developed to
identify multiple gene knockouts that lead to increased formation of a product of interest

13
and tie it to the growth rate of the organism. The more recent OptForce (Ranganathan et
al., 2010) approach not only considers gene knockouts but also suggests “up/down”
strategies for gene expression leading to increased product formation. The OptORF (Kim
and Reed, 2010) algorithm takes into account the gene/reaction and regulatory mappings
of an annotated genome and suggests gene knockout, over-expression, or changes to
transcription factors that will ultimately result in increased target product formation.
Finally, the OptFlux platform provides open-source and modular software to incorporate
several different algorithms designed to guide metabolic engineering (Rocha et al., 2010).
Incorporation of flux ratios
The concept of flux balance analysis with flux ratios (FBrAtio) was developed in
recent research to model metabolism of wild-type and metabolically engineered strains of
the butanol-producer Clostridium acetobutylicum ATCC 824 (McAnulty et al., 2012).
The metabolism of the solvent-producing clostridia have shown to provide unique
challenges to genome-scale modeling (Lee et al., 2008; Milne et al., 2011; Salimi et al.,
2010; Senger, 2010b; Senger and Papoutsakis, 2008a; Senger and Papoutsakis, 2008b).
The number of degrees of freedom of the primary energy and reducing power pathways is
much greater in these organisms than most others. For example, acetyl-CoA can be used
to regenerate NAD(P) by the production of ethanol or butanol, and ATP is formed in the
production of both acetate and butyrate. These weak acids are also re-consumed by the
organism and converted to solvents during the stationary phase of culture growth. The
specific proton flux (SPF) was initially developed as a constraint to relate cell membrane
potential to whether acids or solvents would be produced (Senger and Papoutsakis,
2008b). However, it was shown that additional constraints were needed to specify
14
selectivity between the different weak acids and solvents being produced (McAnulty et
al., 2012; Milne et al., 2011). The FBrAtio algorithm was developed by McAnulty et al.
(McAnulty et al., 2012) to address this issue. The FBrAtio algorithm considers
metabolites at branch points in the metabolic network as “critical nodes.” The underlying
concept of FBrAtio is that multiple enzymes “compete” for the metabolite at the critical
node. For example, in clostridial metabolism, acetyl-CoA can be used by (i) the
phosphotransacetylase (PTA) leading to acetate production, (ii) the aldehyde alcohol
dehydrogenase (AAD) leading to ethanol, (iii) the thiolase (THL) leading to butyrate
and/or butanol, or (iv) a large number of enzymes that use acetyl-CoA in the formation of
macromolecules required for cell growth. The way that the acetyl-CoA pool is
partitioned between these competing enzymes is determined by thermodynamics,
including the relative availabilities of the competing enzymes. The FBrAtio algorithm
allows a user to artificially specify how a metabolite at a critical node (e.g., acetyl-CoA)
is distributed among competing reactions. For example, acetyl-CoA may be distributed
(i) 30% to PTA, (ii) 30% to AAD, (iii) 30% to THL, and (iv) 10% toward macromolecule
biosynthesis. Genome-scale metabolic flux modeling is then used to calculate the
resulting phenotype of this modified strain in silico. FBrAtio allows different flux ratios
to be implemented simultaneously at one or multiple critical nodes to evaluate resulting
phenotypes. Since flux ratios can be defined as floating point decimal numbers, the
FBrAtio approach produces “fine-tuned” metabolic engineering strategies.
After optimizing a flux ratio in silico to produce a desired phenotype, the flux
ratios are translated into metabolic engineering strategies. This is a significant advantage
of FBrAtio because flux ratios have the potential to be translatable directly. For example,

15
if re-directing flux of acetyl-CoA through the THL enzyme (relative to PTA, AAD, and
macromolecule biosynthesis) is desired, this is accomplished by (i) over-expression of the
gene encoding THL, (ii) knockout of competing reactions, or (iii) knock-down of mRNA
translation of competing pathways. Recent developments in (i) promoter tuning (Alper et
al., 2005), (ii) ribosome binding site (RBS) design (Salis, 2011; Salis et al., 2009), and
(iii) antisense RNA design (Matveeva et al., 2003; Tummala et al., 2003; Walton et al.,
2002) can be used (among others) as tools by the metabolic engineer to physically
achieve desired flux ratios at critical nodes of metabolism. Another significant
advantage of the FBrAtio approach is that it is easily implemented into the stoichiometric
matrix of genome-scale metabolic flux models, and models are solved using simple linear
programing solvers (e.g., open-source GLPK) and the COBRA (v2.0) Toolbox
(Schellenberger et al., 2011) in MATALB.
Using FBrAtio to evaluate and improve metabolic engineering strategies
To further examine the potential of the FBrAtio algorithm, five case studies were
selected from the literature. In each case study, the authors implemented an effective
metabolic engineering strategy to enhance product formation. In this research, critical
nodes of these metabolic networks were found for each case. FBrAtio was then used to
verify the metabolic engineering strategies employed and suggest additional
improvements. In the first case study, Wang et al. (Wang et al., 2011) over-expressed the
cotton UDP-glucose pyrophosphorylase (UDP-GPP) in Arabidopsis thaliana and
achieved increased accumulation of cellulose in the biomass. In this case, a critical node
was identified at the UTP substrate. FBrAtio was used to confirm the over-expression of
UDP-GPP led to increased cellulose accumulation. This case study demonstrates how

16
FBrAtio can reveal the tightly regulated distribution of the UTP cofactor in global
metabolism and how metabolic engineering strategies leading to slight re-distribution can
lead to massively different phenotypes. The second case study showed that by increasing
the expressions of an aminotransferase and lyase in yeast, isobutanol synthesis could be
increased. This case study provides an example for implementing two critical nodes (i.e.,
around mitochondrial pyruvate and cytosolic L-valine) simultaneously. This case study
also includes a comparison of FBrAtio with standard flux balance analysis (FBA)
techniques. In the third case study, Zhou et al. (Zhou et al., 2012) over-expressed
coenzyme A transferase and acetoacetate decarboxylase in the cyanobacterium
Synechocystis sp. PCC6803 to achieve synthetic production of acetone from CO2. This
case study provides an example for placing two critical nodes around the same metabolite
(acetyl-CoA in this case). This case study was also used to determine the differences in
resulting phenotypes when either acetate or succinate was used as an acceptor for the
CoA molecule released from the synthetic pathway. The FBrAtio approach was also
applied to the production of hydrogen (H2) from E. coli. This case study illustrates how
complex metabolic engineering strategies can be reduced to a minimal number of flux
ratio constraints for simulation studies. A comprehensive comparison to standard FBA is
also presented for this case study. Finally, the complex primary metabolic network of C.
acetobutylicum is revisited in the fifth case study. Here, Lee et al. (Lee et al., 2012)
knocked-out butyrate production and installed an additional primary/secondary alcohol
dehydrogenase from C. beijerinckii NRRL B-593 to convert acetone to isopropanol.
FBrAtio was applied to this metabolic network to derive strategies for optimized
production of isopropanol, butanol, and ethanol (IBE). A sensitivity analysis was also

17
performed in this case study to determine the impact of varying optimized flux ratios on
the IBE yield. This is a critical study that will further guide experimental design as
certain flux ratio combinations were found much more sensitive to deviations that could
occur during implementation. In all case studies, the results of FBrAtio were (i)
consistent with the improved phenotypes observed from implementing metabolic
engineering or (ii) able to suggest more optimized strategies for increased product
formation. It is noted that quantitative results of genome-scale modeling (with and
without added flux ratios) are presented in this paper. The genome-scale models have
been used “as-published” by the original authors, with the exceptions of added synthetic
pathways where noted. While significant progress is being made, not all genome-scale
modeling results agree with laboratory observations, and the “biomass equation” of these
models has shown to sometimes impact quantitative results dramatically (Senger, 2010a).
METHODS
Genome-scale models and simulation methods
Genome-scale modeling was performed in MATLAB using the open-source
GLPK linear programming software and the COBRA (v2.0) Toolbox (Schellenberger et
al., 2011). The following published genome-scale models were used in simulation
studies with FBrAtio: (i) AraGEM (Arabidopsis thaliana) (de Oliveira Dal'Molin et al.,
2010b), (ii) iND750 (Saccharomyces cerevisiae) (Duarte et al., 2004), (iii) iJN678
(Synechocystis sp. PCC6803) (Nogales et al., 2012), (iv) iAF1260 (E. coli MG1655)
(Feist et al., 2007a), and (v) iCAC490 (C. acetobutylicum ATCC 824) (McAnulty et al.,
2012). Synthetic pathways were added to these existing models (where appropriate)

18
using a novel web-based application to be soon available through the authors’ website
(manuscript under review). In all cases, maximizing the specific growth rate was used as
the objective function of the optimization procedure.
Construction and installation of flux ratio constraints
Instead of constraining reaction fluxes directly through their upper and lower
bounds, flux ratios constrain how a specific metabolite is distributed between competing
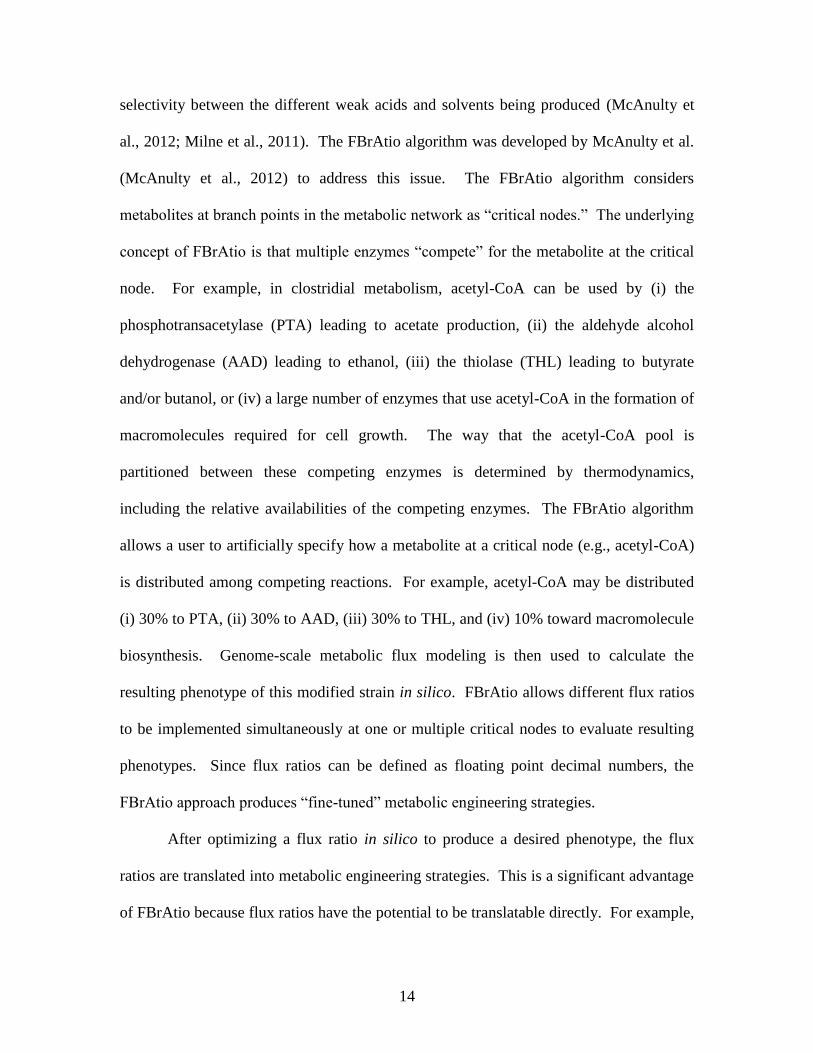
reactions. This is shown in the elementary example shown in Figure II-1. In this case,
reactions R1-R4 all compete for the acetyl-CoA substrate. The reactions that produce
acetyl-CoA are not considered in the FBrAtio approach. In the case shown in Figure II-1,
an appropriate metabolic engineering strategy will be to increase product formation by
increasing flux through R4 and decreasing flux through R1-R3. In this simple example, it
may appear beneficial to simply knockout R1-R3 and over-express R4. However, as is
often the case, critical cofactor balancing or macromolecule biosynthesis may occur
through R1-R3. Knockouts may prove lethal, but controlled knock-down strategies may
reduce cell growth while improving product formation. This is an ideal strategy for
yield-driven approaches. In the case of Figure II-1, the flux through R4 relative to the
flux through R1-R3 is of interest. To specify this value, the fluxes through these
reactions are written as follows. For this test case, 90% of acetyl-CoA will be directed
through R4.
𝑣𝑅4
𝑣𝑅1 + 𝑣𝑅2 + 𝑣𝑅3 + 𝑣𝑅4= 0.9 (1)

19
This equation is re-arranged and set equal to zero.
0.1𝑣𝑅4 − 0.9𝑣𝑅1 − 0.9𝑣𝑅2 − 0.9𝑣𝑅3 = 0 (2)
Genome-scale metabolic flux modeling traditionally uses the flux balance
equation 𝑆 ∙ 𝑣 = 0, where S is the stoichiometric coefficient matrix and v is a vector of
optimized flux values (Edwards et al., 2001). In the FBrAtio approach, Eq. 2 is added to
the stoichiometric matrix (S) directly. This is done by first adding a new row to S. Then,
in the new row of S, the coefficients of Eq. 2 are added to the columns corresponding to
each reaction. For example, the column of R4 would receive a value of 0.1, and columns
corresponding to R1-R3 would receive values of -0.9. When the flux balance equation
(containing S with the new row) is solved using simple linear programming, the flux
through R4 will constitute 90% of all of the flux that uses acetyl-CoA as a substrate. This
procedure does not specify any upper or lower limits on R4. It simply specifies flux of
R4 relative to all possible routes of the acetyl-CoA substrate.
20
Figure II-1. An example of a critical node at an acetyl-CoA metabolite. Reactions consuming
acetyl-CoA (R1-R4) are considered in the flux ratio calculation. The flux of interest (R4) is
constrained relative to all reactions competing for the acetyl-CoA substrate (R1-R4). Reactions
producing acetyl-CoA are not considered in the flux ratio calculation.

21
Simulations with flux ratios
Flux ratios were installed in genome-scale models using the methods described
above. Models were then simulated using the COBRA (v2.0) Toolbox in MATLAB by
maximizing the specific growth rate of the cell model. The impacts of one and multiple
installed flux ratios were studied systematically by constraining flux ratio(s) and
calculating the resulting phenotype characteristics (e.g., growth rate, product yield). In
the case of Arabidopsis, only a single flux ratio was varied in steps of 0.0002, and the
cellulose yield was calculated in each instance. For the S. cerevisiae, Synechocystis sp.
PCC6803 and E. coli case studies, two flux ratios were varied (step size = 0.01), allowing
results of product yield and culture growth to be presented in three-dimensional plots.
For the case of C. acetobutylicum, four flux ratios were evaluated simultaneously. All
combinations of flux ratios were evaluated and a step size of 0.1 was used for this case.
RESULTS
Case Study 1: Cellulose production from Arabidopsis
It has been shown that the over-expression of cotton UDP-glucose
pyrophosphorylase (UDP-GPP) in Arabidopsis thaliana yields increased production of
cellulose by about 25% (Wang et al., 2011). The FBrAtio approach was used to model
this metabolic engineering strategy using the AraGEM genome-scale model of
Arabidopsis. AraGEM was one of the first comprehensive plant genome-scale models
(Collakova et al., 2012) and consists of 1737 metabolites involved in 1601 reactions (de
Oliveira Dal'Molin et al., 2010a). A flux ratio constraint was constructed around the
22
metabolite (cofactor) uridine-triphosphate (UTP) to increase the flux of the UDP-GPP
reaction in AraGEM. UDP-GPP catalyzes the conversion of D-glucose 1-phosphate to
UDP-glucose at the cost of one UTP. This is shown in Figure II-2, along with UTP as a
critical node. UTP was chosen as the critical node for this reaction because it is also a
substrate of several other reactions in the metabolic network. Thus, the distribution of
UTP to the UDP-GPP-catalyzed reaction was adjusted by FBrAtio relative to all other
reactions using UTP as a substrate. Prior to constraining the flux ratio, the fluxes of the
CO2 and light uptake rates were constrained to 2.3148 mmol (gDCW∙h)⁄ and 23.2904
mmol photons (gDCW∙h)⁄ , respectively, to produce a wild-type growth rate of 0.11 h-1
.
This previously reported wild-type condition allowed the optimal fluxes of UDP-GPP
and cellulose synthase to be 0.0499 and 0.0335 mmol (gDCW∙h)⁄ , respectively. With no
modifications, AraGEM allowed 98.25% of UTP to be utilized in the UDP-GPP reaction;
therefore, the flux ratio study enabled the identification of the upper limit of cellulose
production through manipulation of UDP-GPP only. These results are shown in Figure
II-3. Simulation results show that the flux ratios can be used to model re-distribution of
UTP at the critical node. This is more effective than setting arbitrary upper and lower
limits on the UDP-GPP-catalyzed reaction. Simulation results of the cellulose yield and
growth rate as a function of the UTP flux ratio (i.e., re-distribution to the UDP-GPP-
catalyzed reaction) are provided in Figure II-3. Cellulose yield is defined as the mass of
cellulose produced per g biomass (i.e., gDCW). The molecular weight of the cellulose
monomer (i.e., C6H10O5) and the specific growth rate were used to convert the cellulose
synthesis flux (mmol (gDCW∙h)⁄ ) to mass. The simulations were run for two different
stoichiometries of cellulose in the biomass equation of AraGEM (i) wild-type levels

23
included in the AraGEM model and (ii) 1.8-times the wild-type level to represent a high-
cellulose accumulating plant. By manipulating flux at the UTP critical node only, results
show that increases of cellulose yield of roughly 30-50% are possible before the re-
distribution of UTP results in a decreased growth rate of the plant. Further analyses
suggest UTP availability to be the primary metabolic bottleneck to the synthesis of more
cellulose. When the flux ratio at the UTP critical node was increased, an accompanying
increase in cellulose formation followed until the ratio exceeded 0.9868. This is because
UDP-glucose was also used to synthesize UDP to compensate for the UTP consumption.
Since UTP is also a component of plant biomass, the reduction of UTP availability
reduces the growth after the maximum UTP synthesis threshold is reached. This also
explains the significantly lower growth rate of the plant when cellulose accumulation was
increased to 1.8-times the wild-type level in Figure II-3b. Thus, in addition to UDP-GPP
over-expression, additional methods of re-allocating UTP to the UDP-GPP-catalyzed
reaction will yield significant returns, but these are likely at the expense of the growth
rate. FBrAtio can be used elsewhere in the metabolic network to derive these strategies.

24
Figure II-2. The metabolic pathway leading to the production of cellulose in Arabidopsis.
UTP (underlined) is identified as the critical node. The flux ratio of UTP distributed to the UDP-
GPP-catalyzed reaction was constrained by FBrAtio. The flux ratio numerator is flux through
UDP-GPP, and the flux ratio denominator is the summation of flux of all reactions using UTP as
a substrate. The following enzymes are shown: Phosphoglucomutase (PGM), UDP-glucose
pyrophosphorylase (UDP-GPP), and cellulose synthase (CS).

25
Figure II-3. Simulations of the AraGEM genome-scale model for constrained values of the
UTP flux ratio. The flux ratio describes the fraction of UTP consumed by UDP-GPP. The
following are shown: (a) the yield of cellulose per biomass (g/g) and (b) the growth rate (h-1) of
the plant cells. The two scenarios represented are (i) the wild-type biomass equation of AraGEM
(black line) and (ii) a biomass equation with 1.8-times the amount to cellulose per gram biomass
(grey line). The following constraints were used in all simulations: CO2 uptake = 2.3148
mmol/(gDCW∙h) and light uptake = 23.2904 mmol photons/(gDCW∙h). The cellulose yield is
calculated for these uptake parameters only and disagrees (in absolute value) with published
experimental results for this reason.

26
Case Study 2: Isobutanol production from yeast
Higher alcohols, including n-propanol, isoamyl alcohol, and isobutanol have been
observed as metabolic byproducts from the common yeast strain, S. cerevisiae (Giudici et
al., 1990). Investigation into isobutanol for use as a biofuel has demonstrated advantages
over ethanol (Connor and Liao, 2009). However, natural isobutanol production in yeast is
not a fermentative product. Instead, it is produced from the degradation of the amino
acid L-valine (Dickinson et al., 1998). Recently, a metabolic engineering strategy aimed
at increasing isobutanol production in S. cerevisiae was implemented (Chen et al., 2011).
It consisted of the over-expression of the native (i) acetolactate synthase (ILV2), (ii)
acetohydroxyacid reductoisomerase (ILV5), (iii) dihydroxy-acid dehydratase (ILV3), and
(iv) branched-chain amino acid transaminase (BAT2). The resulting strain showed a
1300% increase in isobutanol production, from 0.16 mg isobutanol/g glucose to 2.13
mg/g. Gene transcript levels of ILV2, ILV3, and ILV5 were increased over 3-fold relative
to the control, and BAT2 was increased 90-fold. Isobutanol was also obtained in both
aerobic and anaerobic cultures (Chen et al., 2011).
The first objective to modeling isobutanol production from S. cerevisiae using
FBrAtio was to install the missing reactions leading to isobutanol from L-valine in the
iND750 genome-scale model of S. cerevisiae (Duarte et al., 2004). These enzyme-
catalyzed reactions included (i) BAT1 for converting 3-keto-isovalerate into L-valine in
the mitochondria, (ii) Pdc6 for converting 3-keto-isovalerate into isobutanol in the
cytosol, and (iii) an alcohol dehydrogenase capable of reducing isobutanal to isobutanol.
An isobutanol transport and exchange reaction was also added to the model and
constrained for export only. The transport of 2-keto-isovalerate out of the mitochondria

27
was also constrained to be irreversible. Flux ratio constraints were constructed around
the mitochondrial pyruvate and cytosolic L-valine critical nodes. This is shown in Figure
II-4. Both ILV3 and ILV5 required no flux ratio adjustment since they both reside in a
linear pathway.
The specific growth rate of the culture under aerobic conditions was 0.36 h-1 for
the wild-type strain and 0.11 h-1 for the engineered strain. In all simulations performed,
the glucose uptake rate was constrained to 7 mmol (gDCW∙h)⁄ , so genome-scale model
predictions may not necessarily match observed growth rates. Results of isobutanol yield
(g isobutanol/g glucose) and growth with varying pyruvate and L-valine flux ratios are
shown in Figure II-5. The yield of isobutanol was found to vary non-linearly with both
flux ratios, leading to an upper limit of 0.36 g isobutanol/g glucose when both flux ratios
exceeded 0.95 (Figure II-5a). A stronger correlation between the L-valine flux ratio and
isobutanol yield was observed than between the pyruvate flux ratio and isobutanol yield.
This suggests that additional critical nodes exist in the mitochondria that should be
constrained with flux ratios to drive the production of L-valine. This result confirms the
importance of over-expressing BAT2 by 90-fold. As shown in the results for culture
growth (Figure II-5b), as excess L-valine is forced into the isobutanol pathway, a
decrease in culture growth results. This is consistent with experimental findings (very
little isobutanol is produced natively), and the results generated from FBrAtio simulations
will provide a means to “fine-tune” BAT2 expression levels to maximize productivity.
Since strains evolve to higher growth rates (Fong et al., 2005), it is recognized that
additional engineering may be required to produce strains with long-term stability. Since
the growth rate was also relatively un-altered by changes in the pyruvate flux ratios as

28
well, this result demonstrates that additional flux ratio constraints are required
downstream of the pyruvate critical node to constrain additional interconnectivity present
in the iND750 genome-scale model.

29
Figure II-4. The metabolic network of yeast leading to isobutanol formation. Critical nodes
were identified around the usage of pyruvate and L-valine (underlined). The pyruvate flux ratio
numerator consisted of the flux through AS to 2-acetolactate, and the denominator contained
fluxes through reactions leading to 2-aceto-2-hydroxybutanoate, acetyl-CoA, and 2-acetolactate.
The L-valine flux ratio specified the contribution to isobutanol. The numerator of the L-valine
flux ratio contained the flux through the linear pathway leading to isobutanol, and the
denominator contained fluxes of all reactions using cytosolic L-valine as a substrate. The
following enzymes are shown: pyruvate dehydrogenase (PDH), acetolactate synthase (AS),
acetohydroxyacid reductoisomerase (ILV5), dihydroxyacid dehydratase (ILV3), branched-chain
amino acid aminotransferase (BAT1), branched-chain amino acid aminotransferase (BAT2),
pyruvate decarboxylase (PDC6), and alcohol dehydrogenase (ADH).

30
Figure II-5. Simulations of the iND750 genome-scale model of S. cerevisiae with an added
pathway to isobutanol and flux ratios around the pyruvate and L-valine critical nodes. The
following are shown: (a) yield of isobutanol per g glucose uptake (g/g) and (b) the specific
growth rate (h-1) of the culture. The glucose uptake rate was constrained to 7 mmol/(gDCW∙h)
for all simulations, and aerobic conditions were used.

31
FBrAtio was also compared to standard FBA methods in this case study. Results
are shown in Table II-1. Simulations using the FBrAtio method are shown for
constraining the L-valine flux ratio (to values of 0.7 and 0.9) and pyruvate flux ratio (to
0.1 and 0.4, respectively). By maximizing the specific growth rate as the objective
function, FBrAtio calculates the specific growth rate and production of isobutanol given a
constrained glucose uptake rate (7 mmol (gDCW∙h)⁄ ). Results of isobutanol yield (g
isobutanol produced per g glucose consumed) are reported in Table II-1. Both sets of
flux ratios yielded strains capable of growth and isobutanol production. On the other
hand, FBA simulations require maximizing the specific growth rate or product formation
rate given other flux constraints (e.g., substrate uptake rate, growth, or product secretion
rates). FBA cannot simulate the flux distribution at a critical node; only absolute flux
values can be constrained. This was done for two scenarios in this case study: (i)
maximizing the specific growth rate of the culture and (ii) maximizing the isobutanol
formation rate. When maximizing the specific growth rate only, no isobutanol was
produced by the culture, and when maximizing the isobutanol formation rate, the specific
growth rate was found to be zero (Table II-1). These examples show the utility of
FBrAtio in that performing genetic manipulations around a single node can result in a
culture capable of producing up to 50% of the maximum theoretical yield while reducing
the specific growth rate of the culture by half. Optimization of flux ratios can be used to
“fine-tune” these values to desired levels. An additional comparison to FBrAtio to FBA
is given with Case Study 4.

32
Table II-1. Comparisons between FBrAtio and FBA using the iND750 model of S. cerevisiae containing an added pathway to isobutanol.
Sim.
Number
Method L-Valine
Flux Ratioa
Pyruvate
Flux Ratiob
Glucose
Uptake Rate [mmol (gDCW∙h)⁄ ]
Objective
Function
Growth
Rate [h-1]
Isobutanol
Yield [g/g Glucose]
1 FBrAtio 0.7 0.1 7 Maximize
Growth
0.48 0.06
2 FBrAtio 0.9 0.4 7 Maximize
Growth
0.36 0.18
3 FBA Unconstrained Unconstrained 7 Maximize
Growth
0.68 0
4 FBA Unconstrained Unconstrained 7 Maximize
Isobutanol
0 0.41d
a The L-valine flux ratio describes the fraction of cytosolic L-valine diverted into the isobutanol pathway (Figure II-4).
b The pyruvate flux ratio describes the fraction of mitochondrial pyruvate converted to 2-acetolactate (Figure II-4).
c The glucose uptake rate was constrained to 7 mmol (gDCW∙h)⁄ and was the sole carbon source. The culture was simulated under aerobic
conditions (unconstrained O2 uptake), and the sole nitrogen source (ammonia) was also unconstrained.
d The isobutanol yield of 0.41 g isobutanol per g glucose consumed is the theoretical upper limit returned by the iND750 model.

33
Case Study 3: Acetone production from cyanobacteria
The cyanobacteria have become of significant interest to industrial microbiology
in recent years due to their ability to utilize photosynthesis. Their faster growth rates, in
comparison to plants, and easier genetic engineering, in comparison to algae, make them
attractive as microbial cell factories (Ducat et al., 2011; Lindblad et al., 2012). In a
recent study by Zhou et al. (Zhou et al., 2012), a synthetic pathway to acetone was
introduced into Synechocystis sp. PCC6803, and the cyanobacterium produced up to 36
mg/L acetone with CO2 as the sole carbon source. Synechocystis sp. PCC6803 can
natively convert acetyl-CoA to acetoacetyl-CoA (using the 3-ketothiolase, PHAA) but it
is unable to further convert acetoacetyl-CoA to acetone. To enable the production of
acetone from acetyl-CoA in this cyanobacterium, Zhou et al. (Zhou et al., 2012)
introduced a synthetic pathway by adding coenzyme A transferase (CTFAB) and
acetoacetate decarboxylase (ADC) from Clostridium acetobutylicum. The complete
pathway is shown in Figure II-6. Synechocystis sp. PCC6803 natively converts CO2 to
glycogen and other storage molecules through photosynthesis when grown
photoautotrophically. Then, these carbon storage molecules are converted to acetyl-CoA
through glycogenolysis or β–oxidation. In the published experiments (Zhou et al., 2012),
the cells were first grown photoautotrophically. Then they were grown in a nitrogen-free
phosphate-free medium to metabolize stored carbon sources (i.e., glycogen). During this
metabolic program, there are three routes downstream of acetyl-CoA: (i) formation of
acetoacetyl-CoA that is followed by the production of acetone and/or PHB, (ii) formation
of acetate, and (iii) use in macromolecule biosynthesis. Zhou et al. (Zhou et al., 2012)
knocked-out genes comprising the acetate and PHB pathways. The FBrAtio algorithm
34
was applied to the iJN678 genome-scale model of Synechocystis sp. PCC6803 (Nogales
et al., 2012) to determine if this was an optimal metabolic engineering strategy. The
knockout of acetate production was interesting because CTFAB requires either an acetate
or butyrate substrate in clostridia (Zhou et al., 2012). However, other studies have
documented the use of succinate as a CoA acceptor with CTFAB in other organisms
(Mullins et al., 2008; Riviere et al., 2004). Using the FBrAtio approach, the resulting
phenotypes were also determined for the scenario in which CTFAB could accept
succinate as the CoA acceptor, in place of acetate.

35
Figure II-6. The metabolic network of Synechocystis sp. PCC6803 containing the synthetic
pathway to acetone. Two flux ratio constraints were constructed at the acetyl-CoA critical node
(underlined). First, the distribution of acetyl-CoA to acetyl-phosphate was specified relative to
all other reactions consuming acetyl-CoA (Acetyl-CoA Flux Ratio 1). Next, the distribution of
acetyl-CoA to acetoacetyl-CoA was specified relative to all other reactions (Acetyl-CoA Flux
Ratio 2). The following enzymes are shown: phophotransacetylase (PTA), acetate kinase (ACK),
3-ketothiolase (PHAA), coenzyme A transferase (CFTAB), acetoacetate decarboxylase (ADC),
acetoacetyl-CoA reductase (PHAB), PHB synthase (PHACE).

36
To apply FBrAtio, acetyl-CoA was chosen as a critical node. In this case study,
acetyl-CoA was constrained to proceed toward acetate or acetoacetyl-CoA. Thus, two
flux ratio constraints were constructed at the acetyl-CoA critical node. To simulate
acetone production in silico, first the synthetic acetone pathway was added to the iJN678
genome-scale model along with an acetone transport and exchange reaction. To simulate
growth on stored glycogen, an exchange reaction for glycogen was also added to iJN678.
To ensure heterotrophic growth, CO2 transport was constrained to production only. As
stated previously, the CTFAB requires a CoA acceptor, which is either acetate or butyrate
in solvent-producing clostridia. Since butyrate is not a native metabolite, both acetate and
succinate were used as CoA acceptors. These reactions were also added to iJN678 and
used where appropriate. Through initial simulations (results not shown), it was found that
the knockout of the PHB pathway conclusively increased acetone production. This was
consistent with experimental observations by Zhou et al. (Zhou et al., 2012), and this
pathway remained knocked-out (i.e., constrained to zero flux) in the following simulation
studies.
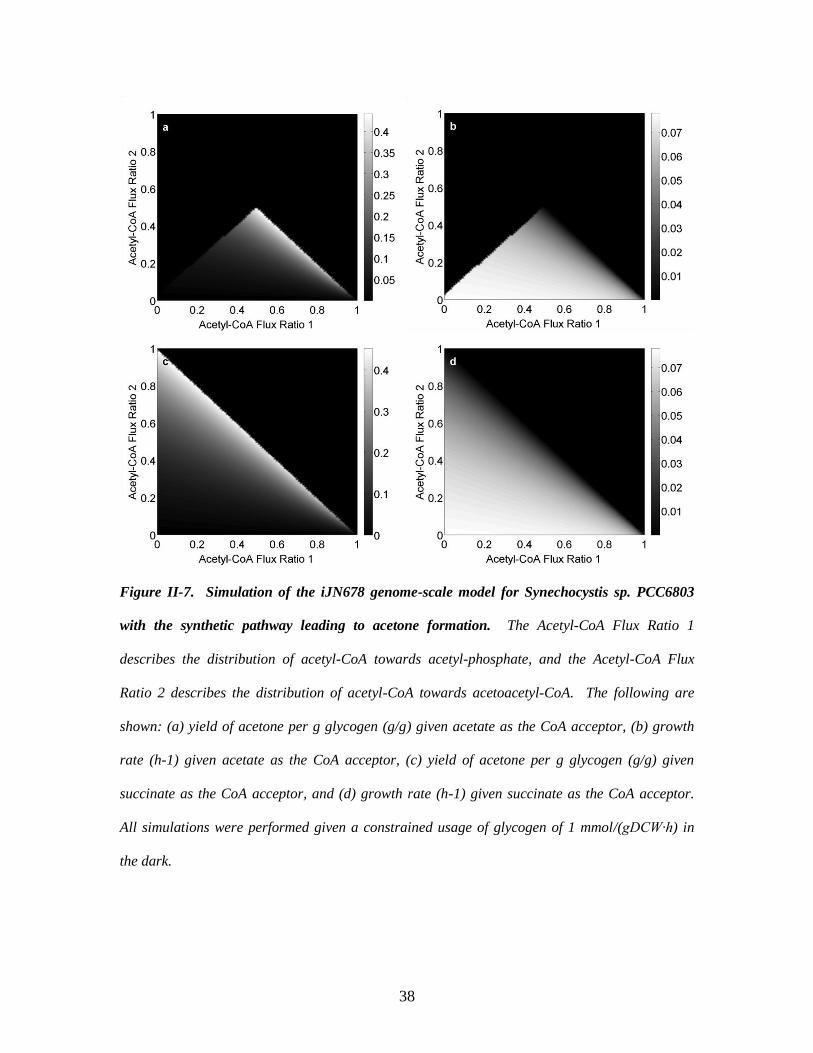
Case 3a: Acetate as the CoA acceptor. Simulation results using FBrAtio with two
flux ratio constraints around acetyl-CoA are shown in Figure II-7. In the first sub-case,
acetate was used as the CoA acceptor in the synthetic acetone pathway (Figure II-7a,b).
In these figures, “Acetyl-CoA Flux Ratio 1” refers to setting the flux distribution from
acetyl-CoA to acetyl-phosphate (i.e., towards acetate production). Acetate production is
knocked-out by setting this ratio to zero. The “Acetyl-CoA Flux Ratio 2” refers to setting
the distribution from acetyl-CoA to acetoacetyl-CoA. By definition, the sum of these two
ratios must be less than one to achieve cell growth. The yield of acetone (g acetone

37
produced/g glycogen consumed) is maximized as the sum of the two flux ratios
approaches a value of 1. This also leads to a minimized growth rate of the culture. Small
values of the acetyl-CoA flux ratio 1 lead to poor acetone yields. This is due in part to
the high growth rates achieved and insufficient acetate to accept CoA from the synthetic
pathway. Engineering a 50/40/10% split between acetyl-CoA being converted to acetate,
acetoacetyl-CoA, and macromolecules would lead to a strain with high acetone yields
and a sufficient growth rate.
Case 3b: Succinate as the CoA acceptor. This case study demonstrates the
potential of FBrAtio for evaluating scenarios that could be accomplished by engineering
cofactor specificity and enzyme promiscuity. Increased acetone yields were observed
when using succinate as the CoA acceptor (Figure II-7c,d). The maximum yield
approaches 0.45 g acetone/g glycogen as the two acetyl-CoA flux ratios converge to the
same value. When using succinate as the acceptor, the metabolic engineering strategy
changes to minimizing acetate flux, a strategy employed by Zhou et al. (Zhou et al.,
2012). Although, acetone productivity (not shown) suggests that knocking-down the
acetate pathway is more beneficial to a complete knockout.
38
Figure II-7. Simulation of the iJN678 genome-scale model for Synechocystis sp. PCC6803
with the synthetic pathway leading to acetone formation. The Acetyl-CoA Flux Ratio 1
describes the distribution of acetyl-CoA towards acetyl-phosphate, and the Acetyl-CoA Flux
Ratio 2 describes the distribution of acetyl-CoA towards acetoacetyl-CoA. The following are
shown: (a) yield of acetone per g glycogen (g/g) given acetate as the CoA acceptor, (b) growth
rate (h-1) given acetate as the CoA acceptor, (c) yield of acetone per g glycogen (g/g) given
succinate as the CoA acceptor, and (d) growth rate (h-1) given succinate as the CoA acceptor.
All simulations were performed given a constrained usage of glycogen of 1 mmol/(gDCW∙h) in
the dark.

39
Case Study 4: Hydrogen production from E. coli
E. coli has been engineered for enhanced hydrogen production (Maeda et al.,
2007). E. coli naturally produces hydrogen (H2) from formate by the formate hydrogen-
lyase (FHL) system that consists of hydrogenase 3 (encoded by hycABCDEFGHI
(Bagramyan and Trchounian, 2003)) and formate dehydrogenase-H (encoded by
dehydrogenase-H by fdhF (Axley et al., 1990)). A high hydrogen yield was achieved
experimentally by (i) increasing FHL activity by over-expressing fhlA (an FHL activator)
and deleting hycA (an FHL repressor) (ii) removing hydrogen re-uptake activity by
deleting hyaB and hybC (that encode the hydrogen-consuming hydrogenase 1 and
hydrogenase 2, respectively), and (iii) directing glucose metabolism to formate by
knocking-out multiple genes. These knockouts include (i) fdoG, which encodes the
formate-consuming -subunit of formate dehydrogenase-O, (ii) aceE which encodes
pyruvate-consuming pyruvate dehydrogenase, and (iii) frdC and ldhA to inactivated the
succinate and lactate synthesis pathways. The engineered strains increased hydrogen
yield twofold from 0.65 to 1.3 mol H2/mol glucose (0.007 to 0.014 g H2/g glucose)
(Axley et al., 1990).
The metabolic engineering strategy adapted by Maeda et al. (Maeda et al., 2007)
was simulated using FBrAtio with the iAF1260 genome-scale model (Feist et al., 2007b)
of E. coli MG1655. Two critical nodes were identified around pyruvate and formate. To
simulate FHL over-expression, a flux ratio was constructed at the formate node to control
metabolic flux through the hydrogen-producing reaction. A second flux ratio was
constructed at the pyruvate node to simulate directing of metabolic flux from glucose
toward formate. This is shown in Figure II-8. Reactions that correspond to the
40
hydrogen-consuming hydrogenase 1 and hydrogenase 2 were constrained to zero flux to
simulate the knockouts. Furthermore, the glucose uptake rate was constrained to 10
mmol (gDCW∙h)⁄ . While current efforts have achieved a yield of 0.014 g H2/g glucose,
simulation results shown in Figure II-9 suggest higher yields are possible with this
metabolic engineering strategy at the pyruvate and formate critical nodes. In addition,
the maximum yield is not approached at the expense of the cellular growth rate growth
rate in this case until extreme values are reached. An adequate metabolic engineering
strategy will keep the flux through the pyruvate node below 98% of the total pyruvate
flux, while maximizing the flux of formate toward hydrogen.

41
Figure II-8. The metabolic network of E. coli used to model hydrogen production. The two
critical nodes of this system are pyruvate and formate (underlined). Flux ratios constrained the
distribution of (i) pyruvate to formate and (ii) formate to hydrogen. The numerator of the flux
ratios contained fluxes from pyruvate to formate and formate to hydrogen, respectively. The
denominators consisted of all reactions consuming pyruvate and all reactions consuming
formate, respectively. These included reactions that transport formate as well. The following
enzymes are shown: pyruvate formate lyase (PFL) and formate hydrogenlyase (FHL).

42
Figure II-9. Simulation of the iAF1260 genome-scale model for E. coli MG1655 with flux
ratios leading to enhanced hydrogen production. The following are shown: (a) the yield of
hydrogen per g glucose consumed (g/g) and (b) the growth rate of the culture (h-1). The glucose
uptake rate was constrained to 10 mmol/(gDCW∙h) in all simulations.

43
FBrAtio was again compared to FBA in this case study. FBrAtio simulations
with different pyruvate and formate flux ratios are presented in Table II-2. In these
simulations, it is shown that increasing the values of both flux ratios (up to a 0.98
pyruvate flux ratio limit) leads to both higher hydrogen yields and growth rates when the
objective function is set to maximize the specific growth rate of the culture. In the first
FBA simulation (Sim. 4, Table II-2), the maximum theoretical yield of 0.06 g hydrogen/g
glucose was calculated by maximizing the hydrogen formation rate as the objective
function. Next, the specific growth rates were constrained to values of 0.3, 0.4, and 0.5 h-
1, and the hydrogen formation rate was maximized in simulations (Sims. 5-7, Table II-2).
From here, the flux ratios at the pyruvate and formate nodes were calculated from the
resulting global flux profiles. In all three cases, these values were 0.97 (or 0.98) and 1
for the pyruvate and formate critical nodes, respectively, and hydrogen yields decreased
as growth rates increased. The FBrAtio simulations produced significantly reduced
hydrogen yields when compared to the technique of constraining the specific growth rate
of a model and maximizing the rate of product formation through FBA. This is
particularly apparent by comparing Sims. 3 and 5 of Table II-2. However, this does not
mean that FBrAtio is an inferior method. Performing FBA with maximized product
formation and constrained growth rates (or vice versa) produces global flux distributions
that may require metabolic engineering at several critical nodes simultaneously to
implement experimentally. FBrAtio, on the other hand, allows simulations in which only
a controlled number of critical nodes are modified. This strategy greatly favors
experimental implementation. To compete with the maximized yields returned by FBA,
multiple critical nodes must be identified and simulated using FBrAtio.

44
Table II-2. Comparisons between FBrAtio and FBA using the iAF1260 model of E. coli MG1655 with flux ratios modified for increased
hydrogen (H2) production.
Sim.
Number
Method Pyruvate
Flux Ratioa
(Constrained)
Formate
Flux Ratiob
(Constrained)
Glucose
Uptake Ratec
(Constrained)
Objective
Function
Growth Rate [h-1]
(Calculated)
H2 Yield
[g/g Glucose]
(Calculated)
1 FBrAtio 0.8 0.8 10 Maximize Growth 0.30 0.012
2 FBrAtio 0.9 0.9 10 Maximize Growth 0.31 0.016
3 FBrAtio 0.98 1 10 Maximize Growth 0.31 0.018
Sim.
Number
Method Pyruvate
Flux Ratioa
(Calculated)
Formate
Flux Ratiob
(Calculated)
Glucose
Uptake Ratec
(Constrained)
Objective
Function
Growth Rate [h-1]
(Constrained)
H2 Yield
[g/g Glucose]
(Calculated)
4 FBA 1 1 10 Maximize H2 Production 0 0.06d
5 FBA 0.98 1 10 Maximize H2 Production 0.3 0.051
6 FBA 0.97 1 10 Maximize H2 Production 0.4 0.047
7 FBA 0.97 1 10 Maximize H2 Production 0.5 0.041
a The pyruvate flux ratio describes the fraction of cytosolic pyruvate converted to formate (Figure II-8).
b The formate flux ratio describes the fraction of cytosolic formate converted to hydrogen (H2) (Figure II-8).
c The glucose uptake rate was constrained to 10 mmol/(gDCW·h) and was the sole carbon source. The culture was simulated under aerobic
conditions (unconstrained O2 uptake), and the sole nitrogen source (ammonia) was also unconstrained.
d The hydrogen yield of 0.06 g hydrogen per g glucose consumed is the theoretical upper limit returned by the iAF1260 model.

45
Case Study 5: Isopropanol, butanol, and ethanol (IBE) production from clostridia
The traditional acetone, butanol, ethanol (ABE) fermenting anaerobe C.
acetobutylicum ATCC 824 was recently engineered to convert acetone to isopropanol
through the expression of a primary/secondary alcohol dehydrogenase gene form
Clostridium beijerinckii NRRL B-593 (Lee et al., 2012). Since acetone is not useful as a
biofuel, a strain producing isopropanol, butanol, and ethanol (IBE) is potentially much
more valuable to the biofuels industry. To engineer higher isopropanol titers, the acetone
operon (encoding ADC and CTFAB) was over-expressed, and butyrate production was
eliminated by using the PJC4BK strain (which lacks the buk gene encoding butyrate
kinase). This altered primary metabolic network is shown in Figure II-10 and was
constructed in the existing iCAC490 (McAnulty et al., 2012) genome-scale model of C.
acetobutylicum ATCC 824. The model was simulated using FBrAtio in attempt to derive
additional metabolic engineering targets that would (i) increase the total production of
IBE and (ii) maximize the production of isopropanol, butanol, and ethanol individually.
The model was simulated for culture conditions nearing the stationary phase of growth.
The glucose uptake rate was constrained to 5 and 1 mmol (gDCW∙h)⁄ . The net acetate
re-uptake rate was allowed to vary between 0 and 2 mmol (gDCW∙h)⁄ . The specific
proton flux (SPF) was constrained to a range of values typically associated with
solventogenesis (-10 to 5 mmol (gDCW∙h)⁄ ) (Senger and Papoutsakis, 2008b). Other
flux ratios found critical to modeling wild-type metabolism (McAnulty et al., 2012) were
applied: (i) the ratio of CO2 export to conversion to HCO3- was held equal to 5 and (ii)
the ratio of the conversion of pyruvate to acetyl-CoA relative to lactate was held equal to
10. The following flux ratios were studied in the altered primary metabolic network

46
(shown in Figure II-10): (i) the distribution of acetyl-CoA to acetyl-phosphate and
acetate, (ii) the distribution of acetyl-CoA to acetaldehyde and ethanol, (iii) the
distribution of acetyl-CoA to acetoacetyl-CoA, and (iv) the distribution of acetoacetyl-
CoA towards acetoacetate and isopropanol.

47
Figure II-10. The modified primary metabolic network of C. acetobutylicum leading to
isopropanol, butanol, and ethanol (IBE) production. Three flux ratios were constructed around
acetyl-CoA (underlined) (one to each acetate, acetoacetyl-CoA, and ethanol), and one flux ratio
was constructed at the acetyacetyl-CoA critical node to describe the distribution of flux to
butyryl-CoA. The following enzymes are shown: thiolase (THL), aldehyde alcohol
dehydrogenase (AAD), acetate kinase (AK), phosphotransacetylase (PTA), coenzyme A
transferase (CoAT), acetoacetate decarboxylase (ADC), primary/secondary alcohol
dehydrogenase from C. beijerinckii NRRL-B-593 (ADH), crotonase (CRO), butyryl-CoA
dehydrogenase (BCD), butanol dehydrogenase A,B (BDHA, BDHB).
48
Results of this case study are summarized in Table II-3. Optimal values of flux
ratios are given in Table II-3 that are predicted to lead to optimal yields (g produced per g
of glucose and acetate uptake) of (i) isopropanol, (ii) butanol, (iii) ethanol, and (iv) total
IBE. The optimal IBE productivity (yield per h) is also reported in Table II-3. Not all of
the flux ratios leading to optimal yields are 0 or 1. This suggests that simple gene
knockouts are not optimal for maximizing product formation in this system. Rather, a
unique combination of “fine-tuned” gene over-expression and knock-down should be
employed to achieve the optimum ratios calculated by FBrAtio. For example, to
maximize ethanol yield, (Sims. 1 and 7, Table II-3) metabolic flux from acetyl-CoA
should be directed toward ethanol and away from acetate and acetoacetyl-CoA, but a
large fraction of acetyl-CoA was required of macromolecular biosynthesis, where
additional acetaldehyde (i.e., ethanol precursor) was produced. While this alternative
route was preferred, to limit acetaldehyde production from acetyl-CoA would require
knock-down of AAD activity (Figure II-10). This is infeasible because AAD catalyzes
both the conversions of acetyl-CoA to acetaldehyde and acetaldehyde to ethanol.
However, optimizing IBE and ethanol productivity (Sims. 4 and 10, Table II-3) required
a unique combination of acetate and ethanol pathway usage (20% and 70% of available
acetyl-CoA, respectively) while allocating 10% of acetyl-CoA to macromolecular
biosynthesis. Flux ratio combinations that produced different combinations of mixed IBE
solvents (Sims. 5,6,11, and 12, Table II-3) are also presented and demonstrate that small
variations in these flux ratios can dramatically impact the expressed phenotype of the
engineered culture. To further demonstrate these impacts, the IBE yield was plotted with
growth rate for all unique flux ratio combinations simulated. Results are shown in Figure

49
II-11 and reveal the locations of optimal phenotypes that maximize both IBE yields and
growth rate of the culture.

50
Table II-3. Optimized flux ratios leading to production of solvents from engineered C. acetobutylicum ATCC 824.
Sim.
Number
Glucose
Uptake Rate
[mmol (gDCW∙h)⁄ ]
Specific
Growth
Rate [h-1]
Ratio 1a Ratio 2b Ratio 3c Ratio 4d IBE
Yielde,f
[g/g]
IBE
Productivityg
[g/g h]
Isopropanol
Yielde,f
[g/g]
Butanol
Yielde,f
[g/g]
Ethanol
Yielde,f
[g/g]
1 1 0.021 0.1 0.4 0 0 0.27* 5.5x10-3 0 0 0.27*
2 1 0.018 0 0 0.9 1 0.24 4.4x10⁻³ 0.13* 0.11 0
3 1 0.016 0.1 0 0.8 0 0.25 4.0x10⁻³ 0 0.25* 0
4 1 0.028 0.2 0.7 0 0 0.24 6.8x10-3* 0 0 0.24
5 1 0.024 0.1 0.5 0.3 0.6 0.25 5.8x10⁻³ 0.06 0.05 0.14
6 1 0.026 0 0.3 0.5 0.3 0.22 5.8x10⁻³ 0.03 0.13 0.06
7 5 0.094 0 0.5 0 0 0.27* 2.5x10-2 0 0 0.27*
8 5 0.097 0.1 0 0.8 1 0.23 2.2x10⁻² 0.11* 0.12 0
9 5 0.089 0.2 0 0.7 0 0.24 2.1x10⁻² 0 0.24* 0
10 5 0.14 0.2 0.7 0 0 0.23 3.2x10-2* 0 0 0.23
11 5 0.12 0.1 0.6 0.2 0.8 0.23 2.7x10⁻² 0.06 0.02 0.15
12 5 0.12 0 0.3 0.5 0.8 0.22 2.6x10⁻² 0.04 0.12 0.06
a Ratio 1: The fraction of acetyl-CoA directed to acetyl-phosphate and acetate (Figure II-10).
b Ratio 2: The fraction of acetyl-CoA directed to acetaldehyde and ethanol (Figure II-10).
c Ratio 3: The fraction of acetyl-CoA directed to acetoacetyl-CoA (Figure II-10).
d Ratio 4: The fraction of acetoacetyl-CoA directed to acetoacetate (Figure II-10).
e Yields are represented as g solvent per g glucose and acetate (combined) uptake.
f Starred values (*) represent optimum yield values given an unconstrained acetate uptake rate and a constrained glucose uptake rate of either 1
or 5 (mmol (gDCW∙h)⁄ ).

51
Although the flux ratios listed in Table II-3 represent unique and optimum
solutions, implementation is the next challenge. This has proven especially difficult for
the case of C. acetobutylicum where the same aldehyde alcohol dehydrogenase (AAD)
catalyzes the conversion of acetyl-CoA to ethanol and is required to convert butyryl-CoA
to butanol. In addition, design and installation of genomic tools (e.g., for gene over-
expression, knock-down, etc.) to achieve a desired flux ratio is not yet an exact science.
So, a sensitivity analysis was performed on flux ratios reported in Table II-3 to determine
the phenotypic effects of slight variations in flux ratios. This is especially important
when multiple flux ratios are necessary to control metabolism. Results of the sensitivity
analysis for IBE yield and the SPF are shown in Table II-4. The rate of change of the
IBE yield with respect to changes in the SPF and the four flux ratios is significant. Low
pH operating conditions are required to promote the uptake of protons in all scenarios
simulated. The sensitivity of IBE yield with respect to the flux ratios installed varied in
each case, with some cases proving to be highly sensitive. It is noted that infeasible
solutions to the iCAC490 model were returned in some scenarios where the flux ratio was
deviated by 0.1 during the sensitivity analysis. It is unknown whether this is an artifact of
the iCAC490 model or whether this engineered flux ratio combination would truly lead to
cells unable to grow. However, when considering experimental implementation, a
combination of flux ratios promoting low sensitivity of product yields is advantageous, as
precise “fine tuning” of flux ratios remains difficult.

52
Figure II-11. IBE yields per g of glucose and acetate uptake (g/g) with growth rate (h-1) for
all unique flux ratio combinations explored in C. acetobutylicum. The glucose uptake rate was
constrained to the following values: (a) 1 mmol/(gDCW∙h) and (b) 5 mmol/(gDCW∙h).

53
Table II-4. Sensitivity analysis of flux ratios leading to optimized solvent yields from C. acetobutylicum ATCC 824.
Sim.a SPFb d(IBE Yield)c
d(SPF)
d(IBE Yield)c
d(Ratio 1)
d(IBE Yield)c
d(Ratio 2)
d(IBE Yield)c
d(Ratio 3)
d(IBE Yield)c
d(Ratio 4)
1 1.0 0.14 0.082 0.028 0.075 0
2 1.0 0.10 0.54 0.60 0.95 0.011
3 0.66 0.19 0.96 5.8 0.33 0.48
4 0.78 0.19 1.3 0.38 1.2 0
5 0.87 0.045 0.81 0.40 0.86 0.01
6 0.80 0.050 0.24 0.18 0.17 0.02
7 5.0 0.035 0.072 0.084 0.21 0
8 5.0 0.019 0.12 1.1 0.53 0.013
9 3.8 0.042 1.05 1.03 1.03 0
10 4.2 0.049 0.26 0.35 1.1 0
11 4.7 0.053 1.9 1.4 1.5 0.02
12 4.4 0.077 0.030 0.21 0.18 0
a Simulation numbers (column 1) in Table II-4 correspond to those in Table II-3.
b The SPF was constrained between -10 and 5 mmol H+ (gDCW∙h)⁄ for all simulations. Negative values are efflux and positive values are influx
of protons.
c Sensitivity analysis result for the change in IBE yield (g IBE produced per g glucose and acetate consumed). The sensitivity analysis was
performed around the values of the flux ratios listed in the Table II-3.

54
DISCUSSION
Flux ratio constraints are built upon the concept that multiple enzymes “compete”
for a limited metabolite resource. Of course, this competition is thermodynamically
driven and explains why some metabolites accumulate in the cell to higher levels than
others. When installed in a genome-scale metabolic flux model, flux ratios specify how a
metabolite of interest is distributed among these competing reactions. Generally, one
flux ratio is used to specify one degree of freedom; thus, multiple flux ratios can be
applied to a central carbon metabolite (e.g., acetyl-CoA) that is involved in several
reactions as a substrate. It was recently found that flux ratio constraints are required to
model wild-type metabolism of acid- and solvent-producing clostridia because of the
exceedingly large number of degrees of freedom associated with the primary central
carbon network (McAnulty et al., 2012). In the case studies presented here, flux ratios
were implemented using the FBrAtio algorithm to evaluate and optimize metabolic
engineering strategies for microbial cell factories. In all cases, the FBrAtio approach was
able to find the end-limits of the metabolic engineering strategy employed and suggest
how improvements are possible. Although the focuses in these case studies were
primarily on critical nodes close to the product of interest, the goal of this simulation
study was to provide evidence of the practicality of FBrAtio by showing accurate
modeling of existing experimental results in silico and by providing suggested
improvements to these existing metabolic engineering strategies. Of course, translating
FBrAtio results into concrete metabolic engineering strategies will require additional
expertise. For example, a unique combination of promoter and RBS tuning for gene
over-expression coupled with thermodynamically designed non-coding RNA for “fine-

55
tuned” gene expression knock-down is one possible approach for obtaining desired flux
ratios. Recent studies in E. coli have shown that increasing simple sequence repeats
(SSR) in the spacer regions of an RBS can proportionally reduce gene expression level
(Egbert and Klavins, 2012). It may require a combination of gene over-expression
methods and SSR/RBS tuning to precisely engineer a cell to meet the proper flux ratio
adjustment. Since expression level does not necessarily infer flux activity, using 13C
labeled substrates with MS/MS technologies and metabolic flux analysis will be crucial
for verifying engineered flux ratios experimentally.
Several challenges still exist for broad implementation of FBrAtio to derive
metabolic engineering strategies in silico. First, it still remains difficult to locate an
optimal set of critical nodes (i.e., metabolites at which to constrain a flux ratio), and
several combinations exist in under-determined genome-scale metabolic networks.
Automated methods for critical node identification are currently in development.
However, the following basic guidelines have been developed for identifying critical
nodes and are aided greatly by the availability of a map of the metabolic network
reconstruction. First, a critical node occurs at a metabolite, and this metabolite must have
multiple reactions competing for it as a substrate. The number of reactions producing the
metabolite is not taken into consideration. Second, the fraction of the metabolite
distributed to a specific reaction per all possible reactions is defined as the flux ratio. The
flux ratio must change over the range of the analysis to be considered a critical node. To
identify this, multiple objective functions (e.g., maximize growth rate, maximize product
formation, etc.) are used with FBA to identify nodes with significantly different flux
distributions. Then, a candidate node can be tested by constraining it using FBrAtio and

56
determining the impact on product yield. Additional critical nodes can be identified
sequentially and retained if their inclusion further increases product yield. It has been
found that identifying critical nodes in close proximity to the product (i.e., close in the
metabolic map) is necessary first. Then, critical nodes located further from the product
can be added. The sensitivity analysis presented in Case Study 5 also provides critical
insight to how critical nodes should be selected. Some FBrAtio derived metabolic
engineering strategies will have a much greater probability for successful experimental
implementation. Those strategies that maximize product yield yet minimize changes in
product yield with slight deviations in flux ratios will be preferred. These scenarios can
be identified by computational analyses.
Additional challenges to the FBrAtio approach include that a flux ratio may be
determined in the metabolic network by an enzymatic bottleneck downstream of the
critical node (i.e., not at the critical node itself). This situation is under consideration,
and it is not yet known how common this occurrence may be. Also, several metabolic
engineering strategies may be required to physically obtain a single desired flux ratio at a
critical node. Pathways highly regulated by feedback inhibition will likely fall into this
category, and implementing only a simple metabolic engineering (i.e., gene over-
expression) at the critical node in this situation is unlikely to achieve a desired flux ratio.
Currently, the experimentalist must address these cases individually, but systems-level
approaches to this problem using FBrAtio are under development. The possibility exists
that a synthetic biology approach with a circuit/biosensor may ultimately provide an
effective means of fixing flux ratios at critical nodes, and it is possible that FBrAtio
derived strategies may provide distinct challenges for the experimentalist. The case

57
studies presented here represent useful implementations of FBrAtio, but more advanced
topics such as (i) automated critical node identification and flux ratios optimization and
(ii) derivation of complex metabolic engineering strategies to achieve a desired flux ratio
remain as future challenges that are currently being investigated by the systems metabolic
engineering community. Finally, although application to systems metabolic engineering
was the focus of this paper, FBrAtio holds significant promise for modeling cell
regulatory networks. These methods are also under development, and a rule-based
system describing “on/partially-on/off” is seen as a significant challenge.
ACKNOWLEDGEMENT
The authors acknowledge financial support from the USDA AFRI Biobased Products and
Bioenergy Production Program (Award Number 2010-65504-20346). Financial support
was also received from the Institute of Critical Technologies and Applied Science
(ICTAS) at Virginia Tech.
CONFLICT OF INTEREST STATEMENT
The authors declare they have no competing interests.

58
REFERENCES
Alper, H., Fischer, C., Nevoigt, E., Stephanopoulos, G., 2005. Tuning genetic control
through promoter engineering. Proceedings of the National Academy of Sciences
of the United States of America. 102, 12678-83.
Axley, M. J., Grahame, D. A., Stadtman, T. C., 1990. Escherichia coli formate-hydrogen
lyase. Purification and properties of the selenium-dependent formate
dehydrogenase component. Journal of Biological Chemistry. 265, 18213-18218.
Bagramyan, K., Trchounian, A., 2003. Structural and functional features of formate
hydrogen lyase, an enzyme of mixed-acid fermentation from Escherichia coli.
Biochemistry (Moscow). 68, 1159-1170.
Becker, J., Zelder, O., Hafner, S., Schroder, H., Wittmann, C., 2011. From zero to hero--
design-based systems metabolic engineering of Corynebacterium glutamicum for
L-lysine production. Metabolic engineering. 13, 159-68.
Blazeck, J., Alper, H., 2010. Systems metabolic engineering: genome-scale models and
beyond. Biotechnology journal. 5, 647-59.
Burgard, A. P., Pharkya, P., Maranas, C. D., 2003. Optknock: a bilevel programming
framework for identifying gene knockout strategies for microbial strain
optimization. Biotechnology and bioengineering. 84, 647-57.
Chen, X., Nielsen, K., Borodina, I., Kielland-Brandt, M., Karhumaa, K., 2011. Increased
isobutanol production in Saccharomyces cerevisiae by overexpression of genes in
valine metabolism. Biotechnology for Biofuels. 4, 21.

59
Collakova, E., Yen, J. Y., Senger, R. S., 2012. Are we ready for genome-scale modeling
in plants? Plant science : an international journal of experimental plant biology.
191-192, 53-70.
Connor, M. R., Liao, J. C., 2009. Microbial production of advanced transportation fuels
in non-natural hosts. Current Opinion in Biotechnology. 20, 307-315.
de Oliveira Dal'Molin, C. G., Quek, L. E., Palfreyman, R. W., Brumbley, S. M., Nielsen,
L. K., 2010a. AraGEM, a genome-scale reconstruction of the primary metabolic
network in Arabidopsis. Plant physiology. 152, 579-89.
de Oliveira Dal'Molin, C. G., Quek, L. E., Palfreyman, R. W., Brumbley, S. M., Nielsen,
L. K., 2010b. AraGEM, a genome-scale reconstruction of the primary metabolic
network in Arabidopsis. Plant physiology. 152, 579-89.
DeJongh, M., Formsma, K., Boillot, P., Gould, J., Rycenga, M., Best, A., 2007. Toward
the automated generation of genome-scale metabolic networks in the SEED.
BMC bioinformatics. 8, 139.
Dickinson, J. R., Harrison, S. J., Hewlins, M. J. E., 1998. An investigation of the
metabolism of valine to isobutyl alcohol in Saccharomyces cerevisiae. Journal of
Biological Chemistry. 273, 25751-25756.
Duarte, N. C., Herrgard, M. J., Palsson, B. O., 2004. Reconstruction and validation of
Saccharomyces cerevisiae iND750, a fully compartmentalized genome-scale
metabolic model. Genome research. 14, 1298-309.
Ducat, D. C., Way, J. C., Silver, P. A., 2011. Engineering cyanobacteria to generate high-
value products. Trends in biotechnology. 29, 95-103.

60
Edwards, J. S., Ibarra, R. U., Palsson, B. O., 2001. In silico predictions of Escherichia
coli metabolic capabilities are consistent with experimental data. Nature
biotechnology. 19, 125-30.
Egbert, R. G., Klavins, E., 2012. Fine-tuning gene networks using simple sequence
repeats. Proceedings of the National Academy of Sciences.
Feist, A. M., Henry, C. S., Reed, J. L., Krummenacker, M., Joyce, A. R., Karp, P. D.,
Broadbelt, L. J., Hatzimanikatis, V., Palsson, B. O., 2007a. A genome-scale
metabolic reconstruction for Escherichia coli K-12 MG1655 that accounts for
1260 ORFs and thermodynamic information. Molecular systems biology. 3, 121.
Feist, A. M., Henry, C. S., Reed, J. L., Krummenacker, M., Joyce, A. R., Karp, P. D.,
Broadbelt, L. J., Hatzimanikatis, V., Palsson, B. O., 2007b. A genome-scale
metabolic reconstruction for Escherichia coli K-12 MG1655 that accounts for
1260 ORFs and thermodynamic information. Mol Syst Biol. 3.
Feist, A. M., Palsson, B. O., 2008. The growing scope of applications of genome-scale
metabolic reconstructions using Escherichia coli. Nature biotechnology. 26, 659-
67.
Fong, S. S., Joyce, A. R., Palsson, B. O., 2005. Parallel adaptive evolution cultures of
Escherichia coli lead to convergent growth phenotypes with different gene
expression states. Genome research. 15, 1365-72.
Giudici, P., Romano, P., Zambonelli, C., 1990. A biometric study of higher alcohol
production in Saccharomyces cerevisiae. Canadian Journal of Microbiology. 36,
61-64.

61
Henry, C. S., DeJongh, M., Best, A. A., Frybarger, P. M., Linsay, B., Stevens, R. L.,
2010. High-throughput generation, optimization and analysis of genome-scale
metabolic models. Nature biotechnology. 28, 977-82.
Jamshidi, N., Palsson, B. O., 2008. Formulating genome-scale kinetic models in the post-
genome era. Molecular systems biology. 4, 171.
Kim, J., Reed, J. L., 2010. OptORF: Optimal metabolic and regulatory perturbations for
metabolic engineering of microbial strains. BMC systems biology. 4, 53.
Lee, J., Jang, Y. S., Choi, S. J., Im, J. A., Song, H., Cho, J. H., Seung do, Y., Papoutsakis,
E. T., Bennett, G. N., Lee, S. Y., 2012. Metabolic engineering of Clostridium
acetobutylicum ATCC 824 for isopropanol-butanol-ethanol fermentation. Applied
and environmental microbiology. 78, 1416-23.
Lee, J. W., Kim, T. Y., Jang, Y. S., Choi, S., Lee, S. Y., 2011. Systems metabolic
engineering for chemicals and materials. Trends in biotechnology. 29, 370-8.
Lee, S. Y., Park, J. H., Jang, S. H., Nielsen, L. K., Kim, J., Jung, K. S., 2008.
Fermentative butanol production by Clostridia. Biotechnology and
bioengineering. 101, 209-28.
Lindblad, P., Lindberg, P., Oliveira, P., Stensjo, K., Heidorn, T., 2012. Design,
engineering, and construction of photosynthetic microbial cell factories for
renewable solar fuel production. Ambio. 41 Suppl 2, 163-8.
Liolios, K., Chen, I. M., Mavromatis, K., Tavernarakis, N., Hugenholtz, P., Markowitz,
V. M., Kyrpides, N. C., 2010. The Genomes On Line Database (GOLD) in 2009:
status of genomic and metagenomic projects and their associated metadata.
Nucleic acids research. 38, D346-54.

62
Maeda, T., Sanchez-Torres, V., Wood, T. K., 2007. Enhanced hydrogen production from
glucose by metabolically engineered Escherichia coli. Applied microbiology and
biotechnology. 77, 879-90.
Matveeva, O. V., Mathews, D. H., Tsodikov, A. D., Shabalina, S. A., Gesteland, R. F.,
Atkins, J. F., Freier, S. M., 2003. Thermodynamic criteria for high hit rate
antisense oligonucleotide design. Nucleic acids research. 31, 4989-94.
McAnulty, M. J., Yen, J. Y., Freedman, B. G., Senger, R. S., 2012. Genome-scale
modeling using flux ratio constraints to enable metabolic engineering of
clostridial metabolism in silico. BMC systems biology. 6, 42.
Milne, C. B., Eddy, J. A., Raju, R., Ardekani, S., Kim, P. J., Senger, R. S., Jin, Y. S.,
Blaschek, H. P., Price, N. D., 2011. Metabolic network reconstruction and
genome-scale model of butanol-producing strain Clostridium beijerinckii NCIMB
8052. BMC systems biology. 5, 130.
Milne, C. B., Kim, P. J., Eddy, J. A., Price, N. D., 2009. Accomplishments in genome-
scale in silico modeling for industrial and medical biotechnology. Biotechnology
journal. 4, 1653-70.
Mullins, E. A., Francois, J. A., Kappock, T. J., 2008. A specialized citric acid cycle
requiring succinyl-coenzyme A (CoA):acetate CoA-transferase (AarC) confers
acetic acid resistance on the acidophile Acetobacter aceti. Journal of bacteriology.
190, 4933-40.
Nogales, J., Gudmundsson, S., Knight, E. M., Palsson, B. O., Thiele, I., 2012. Detailing
the optimality of photosynthesis in cyanobacteria through systems biology

63
analysis. Proceedings of the National Academy of Sciences of the United States
of America. 109, 2678-83.
Notebaart, R. A., van Enckevort, F. H., Francke, C., Siezen, R. J., Teusink, B., 2006.
Accelerating the reconstruction of genome-scale metabolic networks. BMC
bioinformatics. 7, 296.
Papin, J. A., Price, N. D., Wiback, S. J., Fell, D. A., Palsson, B. O., 2003. Metabolic
pathways in the post-genome era. Trends in biochemical sciences. 28, 250-8.
Papoutsakis, E. T., 1984. Equations and calculations for fermentations of butyric acid
bacteria. Biotechnology and bioengineering. 26, 174-87.
Price, N. D., Papin, J. A., Schilling, C. H., Palsson, B. O., 2003. Genome-scale microbial
in silico models: the constraints-based approach. Trends in biotechnology. 21,
162-9.
Ranganathan, S., Suthers, P. F., Maranas, C. D., 2010. OptForce: an optimization
procedure for identifying all genetic manipulations leading to targeted
overproductions. PLoS computational biology. 6, e1000744.
Riviere, L., van Weelden, S. W., Glass, P., Vegh, P., Coustou, V., Biran, M., van
Hellemond, J. J., Bringaud, F., Tielens, A. G., Boshart, M., 2004.
Acetyl:succinate CoA-transferase in procyclic Trypanosoma brucei. Gene
identification and role in carbohydrate metabolism. J Biol Chem. 279, 45337-46.
Rocha, I., Maia, P., Evangelista, P., Vilaca, P., Soares, S., Pinto, J. P., Nielsen, J., Patil,
K. R., Ferreira, E. C., Rocha, M., 2010. OptFlux: an open-source software
platform for in silico metabolic engineering. BMC systems biology. 4, 45.

64
Salimi, F., Zhuang, K., Mahadevan, R., 2010. Genome-scale metabolic modeling of a
clostridial co-culture for consolidated bioprocessing. Biotechnology journal. 5,
726-38.
Salis, H. M., 2011. The ribosome binding site calculator. Methods in enzymology. 498,
19-42.
Salis, H. M., Mirsky, E. A., Voigt, C. A., 2009. Automated design of synthetic ribosome
binding sites to control protein expression. Nature biotechnology. 27, 946-50.
Schellenberger, J., Que, R., Fleming, R. M., Thiele, I., Orth, J. D., Feist, A. M., Zielinski,
D. C., Bordbar, A., Lewis, N. E., Rahmanian, S., Kang, J., Hyduke, D. R.,
Palsson, B. O., 2011. Quantitative prediction of cellular metabolism with
constraint-based models: the COBRA Toolbox v2.0. Nature protocols. 6, 1290-
307.
Senger, R. S., 2010a. Biofuel production improvement with genome-scale models: The
role of cell composition. Biotechnology Journal. 5, 671-85.
Senger, R. S., 2010b. Biofuel production improvement with genome-scale models: The
role of cell composition. Biotechnology journal. 5, 671-85.
Senger, R. S., Papoutsakis, E. T., 2008a. Genome-scale model for Clostridium
acetobutylicum: Part I. Metabolic network resolution and analysis. Biotechnology
and bioengineering. 101, 1036-52.
Senger, R. S., Papoutsakis, E. T., 2008b. Genome-scale model for Clostridium
acetobutylicum: Part II. Development of specific proton flux states and
numerically determined sub-systems. Biotechnology and bioengineering. 101,
1053-71.

65
Tummala, S. B., Welker, N. E., Papoutsakis, E. T., 2003. Design of antisense RNA
constructs for downregulation of the acetone formation pathway of Clostridium
acetobutylicum. Journal of bacteriology. 185, 1923-34.
Varma, A., Palsson, B. O., 1994. Stoichiometric flux balance models quantitatively
predict growth and metabolic by-product secretion in wild-type Escherichia coli
W3110. Applied and environmental microbiology. 60, 3724-31.
Walton, S. P., Stephanopoulos, G. N., Yarmush, M. L., Roth, C. M., 2002.
Thermodynamic and kinetic characterization of antisense oligodeoxynucleotide
binding to a structured mRNA. Biophysical journal. 82, 366-77.
Wang, Q., Zhang, X., Li, F., Hou, Y., Liu, X., Zhang, X., 2011. Identification of a UDP-
glucose pyrophosphorylase from cotton (Gossypium hirsutum L.) involved in
cellulose biosynthesis in Arabidopsis thaliana. Plant cell reports. 30, 1303-12.
Zhou, J., Zhang, H., Zhang, Y., Li, Y., Ma, Y., 2012. Designing and creating a
modularized synthetic pathway in cyanobacterium Synechocystis enables
production of acetone from carbon dioxide. Metabolic engineering. 14, 394-400.

66
CHAPTER III
III Chap3
INCREASED CELLULOSE PRODUCTION BY ARABIDOPSIS THALIANA
THROUGH SYSTEMS METABOLIC ENGINEERING
Jiun Y. Yen, Daniel Neighbors, Glenda Gillaspy, Ryan S. Senger*
*Corresponding author
Corresponding author contact information:
Department of Biological Systems Engineering
155 Ag Quad Lane, RM 202A
Virginia Tech
Blacksburg, VA 24061
Email: [email protected]
Phone: 540-231-9501

67
ABSTRACT
A new method of systems metabolic engineering, called reverse flux balance
analysis with flux ratios, was developed in this research, and was used to design
metabolic engineering strategies capable of increasing cellulose accumulation in
Arabidopsis thaliana. The development of in silico methods to accurately predict
metabolic engineering strategies to over-produce a desired product will bring dramatic
improvements to the speed and cost at which production strains are engineered. Recent
achievements have been made in utilizing genome-scale models to predict genetic
modifications for microbial organisms, with promising results, however, few advances
have been made towards multicellular organisms. Using the reverse flux balance analysis
with flux ratio approach on the Arabidopsis genome-scale metabolic flux model of
Arabidopsis, the over-expression of the mitochondrial malate dehydrogenase was
predicted to have a positive impact on the accumulation of cellulose. In response, the
plants were physically engineered by the over-expression mitochondrial malate
dehydrogenase 2 gene. The validation of the reverse flux balance analysis with flux ratio
approach was realized as the engineered plants displayed an increase in estimated
crystalline cellulose per plant up to 95 percent. Here, the reverse flux balance analysis
with flux ratio methodology is detailed so that it can be applied broadly to any cellular
system with an available genome-scale metabolic flux model.

68
INTRODUCTION
Engineering higher cellulose content in plants
Bioethanol and several other next-generation biofuels have been targeted as
potential renewable energy sources, however, production relies on fermentation of a
renewable substrate. To raise biofuel production to meet market demand, a high
abundance of cheap substrate be readily available. A lot of attention has been given to
using plant cellulose, the most abundant biopolymer in the world, as the source of
carbohydrate. Many approaches for increasing cellulose yield efficiency have been
proposed and studied intensively. These include reducing cell wall rigidity to improve
digestibility, enhancing cell wall degrading enzyme efficiency, and increasing cellulose
and biomass of the plants (Demura and Ye, 2010; Hames, 2009; Jung et al., 2012; Wang
and Dixon, 2012). The methods for generating plants with altered cell wall or biomass
are generally either through selective breading or genetic engineering. The advantages of
selective breeding are the enlargement of diversity and the ability of hybrids to survive in
natural cultivars. The primary disadvantage is the time required to obtain significant
heterosis. The more rapid method to improving plants would be through genetic
engineering, however, such approach requires some prior metabolic knowledge to
increase success rate.
Many studies that successfully increased cellulose content in the plant model
organism, Arabidopsis thaliana, have focused on up-regulating the cellulose synthases
(CESA) by over-expressing relevant transcription factors. An example would be the
MYB46 transcription factor that up-regulates three CESA genes: CESA4, CESA7, and

69
CESA8 (Ko et al., 2009; Zhong et al., 2007). It has been shown recently that the over-
expression of MYB46 in WT Arabidopsis can up-regulate these CESA genes and
increase cellulose content by 30 percent in the leaf tissues of 3-week-old plants, however,
this over-expression was shown to stunt plant growth development (Kim et al., 2013; Ko
et al., 2009). Other studies experimented with increasing UDP-glucose by over-
expressing UDP-glucose pyrophosphorylase to increase substrate availability for
cellulose synthesis. They were able to successfully elevate cellulose content in
Arabidopsis by 6.3 percent as well as in other species, such as jute (Corchorus capsularis
L.), by 25 percent (Wang et al., 2011; Zhang et al.). The commonalities between these
metabolic engineering methods are the pathway of interest, which is centered on the
obvious cellulose synthesis pathway. Thus, well-developed computational methods on
analyzing metabolic networks becomes advantageous in deriving more robust metabolic
engineering strategies.
Deriving metabolic engineering strategies genome-scale metabolic flux modelling
Although computational modeling of biochemical pathways dates back to 1959
when the metabolic control mechanisms in Ehrlich ascites tumor cells was analyzed,
using computational methods to analyze large scale metabolic network and predict
genetic modification candidates was not accomplished until recent developments with
genome-scale models (Chance and Hess, 1959). Since the first construction of a genome-
scale model of E. coli in 2000, the number genome-scale models with greater complexity
of various species continued to rise with the aid of automated procedures existing
databases (Edwards and Palsson, 2000; Henry et al., 2010; Liolios et al., 2010).
Analyzing these complex metabolic networks was made possible and fast with the flux

70
balance analysis (FBA) linear programming method (Bonarius et al., 1997; Varma and
Palsson, 1994a). Although FBA could suggest possible metabolic flux distributions, it
was algorithms, such as OptKnock and OptiForce, which utilized FBA solutions to
predict outcomes of gene knockout or over-expression (Burgard et al., 2003;
Ranganathan et al., 2010). Multiple reviews had reported successful prediction of
metabolic engineering strategies using OptKnock, OptForce, FVA, MOMA, and other
methods in microbial organisms; however, the performances of these methods on multi-
cellular complexities, such as plants, remained in question (Collakova et al., 2012;
McCloskey et al., 2013; Seaver et al., 2012; Xu et al., 2013). We have previously shown
that by applying an alternative constraint, called flux ratios, we can improve the
predictive capacity in microbes and plants (McAnulty et al., 2012; Yen et al., 2013).
Details of incorporating flux ratios with the FBrAtio method had been described
in Yen et al. In brief, FBrAtio further constrain a genome-scale model by implementing
additional linear equations that define the proportions of distribution of some metabolites
to specific ratios. A group that include the substrate of interest and the reactions that
consume it is termed a node. We have shown that FBA with flux ratios can accurately
predict flux redistributions in Arabidopsis with UDP-pyrophosphorylase over-expression
for enhanced cellulose content, yeast with multiple gene over-expression to elevate
isobutanol production, cyanobacteria with synthetic acetone synthesis pathway, E. coli
with altered expression level in multiple genes to increase hydrogen production.
However, these studies focused on adjusted flux ratios at critical nodes that had been
shown to alter metabolism in experimental studies. For this to assist in the design of

71
metabolic engineering strategies, it would be necessary to further develop this method to
automatically identify critical nodes and assess the proper flux ratios.
Using FBrAtio to increase cellulose production
In this research, a novel algorithm, reversed flux balance analysis with flux ratios
(Reverse FBrAtio), was developed to instantaneously identify nodes of metabolism
where changes in flux ratios provide strategies for increasing formation of a product of
interest. Reverse FBrAtio was implemented using a well-constructed Arabidopsis
genome-scale metabolic flux model (AraGEM) (de Oliveira Dal'Molin et al., 2010) with
the goal of improving cellulose accumulation in photosynthetic cells. Reverse FBrAtio
suggested the over-expression of mitochondrial malate dehydrogenase (mMDH) as a
possible strategy to increase cellulose content. The computational prediction was
implemented experimentally, and record level increases in cellulose content were
obtained. A full description of the Reverse FBrAtio algorithm is provided so that it can
be implemented broadly to derive metabolic engineering strategies for production of any
targeted metabolite from any cell type for which a high-quality genome-scale metabolic
flux model exists. In addition, full descriptions of the experimental implementation and
cellulose measurements are given in the following sections.

72
MATERIALS AND METHODS
Gene candidate prediction by Reverse FBrAtio
The following methods describe how gene candidates were selected as metabolic
engineering targets for the over-production of cellulose from Arabidopsis thaliana. In
particular, the new technique is called Reverse FBrAtio (pronounced F-B-Ratio), and its
implementation is described in the steps below and illustrated in Figure III-1. Following
the description of the novel Reverse FBrAtio genome-scale metabolic flux modeling
algorithm, experimental methods are described that allowed for experimental
investigation of these gene candidates.
Step 1: Identification of the genome-scale model, constraints, and cases
All computations were performed using MATLAB (R2012a) (MathWorks;
Natick, MA) with the COBRA Toolbox v2.0 along with the open-source GNU Linear
Programming Kit (GLPK), libSBML 5.8.0, and the SBML Toolbox 4.0.1 (Bornstein et
al., 2008; Hyduke et al., 2011; Keating et al., 2006; Schellenberger et al., 2011). The
AraGEM genome-scale model of Arabidopsis thaliana was modified slightly and used
for calculations (de Oliveira Dal'Molin et al., 2010). The version of AraGEM used in this
work contained 1,737 metabolites in 1,601 reactions that are associated with 1,404 genes.
The original AraGEM constraints for analyzing photosynthetic metabolism were altered
slightly for the purposes of this research. These changes included (i) constraining the
photon uptake flux to the previously calculated minimal requirement (23.290
mmolgDW-1h-1) for a growth rate of 0.110 h-1 and (ii) adjusting the objective function

73
from minimizing photon uptake to maximizing growth (de Oliveira Dal'Molin et al.,
2010). In addition, the primary modification in simulations was varying the cellulose
stoichiometry of the biomass growth equation from 0.305 to 0.488 mmolgDW-1 at 0.061
mmolgDW-1 increments. This allowed for 31 increments (cases) to be evaluated by flux
balance analysis (FBA). The FBA was performed using the COBRA Toolbox with the
dual objectives of maximizing cell growth while minimizing the total flux of the system.
The optimal solution for each case provided maximal growth for the specified cellulose
demand.

74
Figure III-1. The illustrated algorithm of computing genetic engineering candidates. The
algorithm consists of four major steps: 1. Adjustment of constraints and generation of cases, 2.
Identification of nodes and effective reactions, 3. Computation of flux ratios and changes of flux
ratios, and 4. Evaluation of Ratios to identify metabolic engineering targets.

75
Step 2: Identification of nodes and effective reactions
In this modeling approach to derive a metabolic engineering strategy, a “node” is
defined at a specific metabolite in the metabolic network (e.g., in the AraGEM model).
All nodes (metabolites) are associated with reactions that both produce and consume it
(i.e., only “dead-end” metabolites are not consumed in the model). For a metabolite to be
considered a node of interest, there must be multiple reactions that consume it (i.e.,
multiple reactions that “compete” to deplete a limited metabolite pool). This means that
at a node of interest there must be at least two reactions that consume this metabolite and
at least one other that produces it. Reactions that do not carry flux were removed from
evaluation. All absolute flux values lower than a significant-threshold (see
supplementary methods) were considered to be zero. In the case of AraGEM, this
threshold was set to 10-8 mmolgDW-1h-1. Since this is an evaluation over a very small
interval, the reactions should carry fluxes in a consistent direction over all cases;
therefore, reactions that change direction (e.g., from positive to negative) were removed
as well. The remaining reactions were collected into a list of “effective reactions” and
were used to evaluate nodes. Under the previously described criteria, a node of interest
must have at least three reactions; therefore, all metabolites that were involved in fewer
than three effective reactions were removed from consideration as well. Of the remaining
metabolites, only those that were reactants in two or more effective reactions were
considered nodes of interest. This was determined by the sign of the product of the
reaction flux and the stoichiometry of the metabolite in this reaction. Implementing these
rules resulted in 352 effective reactions and 92 nodes in the modified AraGEM model for
the enhanced production of cellulose.

76
Step 3: Computation of flux ratios and changes of flux ratios per reaction/node pair
The concept of flux ratios as they pertain to FBA (i.e., the FBrAtio approach) has
been described (Yen et al., 2013). In general, the flux ratio is defined as the flux of a
target reaction consuming metabolite i per the summation of total flux from all reactions
consuming metabolite i. This is shown in Eq. 1a, where 𝐽𝑀𝑖 is the set of fluxes that
consume metabolite i.
𝜌(𝑗, 𝑀𝑖) =𝑗𝑀𝑖
∑ 𝐽𝑀𝑖
, 𝑤ℎ𝑒𝑟𝑒 𝑗𝑀𝑖∈ 𝐽𝑀𝑖
(1)
𝜌𝑖,𝑐 =𝑗𝑖,𝑐
∑ 𝐽𝑖,𝑐, 𝑤ℎ𝑒𝑟𝑒 𝑗𝑖,𝑐 ∈ 𝐽𝑖,𝑐
Based on the definition of the flux ratio, each metabolite consuming reaction was
paired with an associated node. This resulted in 396 reaction/node (R/N) pairs involving
252 reactions of the 352 effective reactions actually used. The flux ratios of the 396 R/N
pairs over the 31 cases were computed with Eq. 1b, where 𝐽𝑖,𝑐 was a set of fluxes
consuming the metabolite in R/N pair 𝑖 of case 𝑐 (i.e., a specified cellulose stoichiometry
in the biomass equation). To determine the magnitude of competition between two or
more reactions for the same metabolite, the change of flux ratios for each competing
reaction were evaluated. This was calculated according to Eq. 2, where 𝑐 started at 2.
∆𝜌𝑖,𝑐−1 = 𝜌𝑖,𝑐 − 𝜌𝑖,𝑐−1 (2)
The flux ratio maintains a value between 0 and 1, and a flux ratio value near 1
signifies favorability in the competition for 𝑀𝑖, and vice versa for a value close to 0. A
∆𝜌 value is equal to zero when flux ratios of that R/N pair are consistent over two
adjacent cases (i.e., the change is equal to zero). All absolute values of ∆𝜌 less than the
same significant-threshold (i.e., 10-8 mmolgDW-1h-1) were considered zero as well.

77
Step 4: Evaluation of ∆ values to identify metabolic engineering targets
Since this method is solely an evaluation of metabolic flux based of balancing of
stoichiometry, it was assumed that the reaction that contributed the most to the increase
in cellulose is the one with the largest magnitude of ∆𝜌. Under this assumption, reactions
with the largest ∆𝜌 magnitude over all cases were identified as candidates for altering
metabolism. The scoring of a R/N pair was based on the quality and quantity of the ∆𝜌
values. Specifically, the final score is the product of three separate scores. Score 1 is the
average direction of all ∆𝜌 values for a R/N pair. Since it was possible for a reaction to
vary its “competitiveness” over all cases simulated, this value determined the favorability
of the reaction for its competing metabolite. This score was calculated as follows (where
𝑐 ≥ 2).
𝑆1𝑖 = ∑ 𝑓(∆𝜌𝑖,𝑐−1), where 𝑓(∆𝜌) = {
1, ∆𝜌 > 𝑡ℎ𝑟𝑒𝑠ℎ𝑜𝑙𝑑0, −𝑡ℎ𝑟𝑒𝑠ℎ𝑜𝑙𝑑 < ∆𝜌 < 𝑡ℎ𝑟𝑒𝑠ℎ𝑜𝑙𝑑
−1, ∆𝜌 < −𝑡ℎ𝑟𝑒𝑠ℎ𝑜𝑙𝑑 (3)
Score 2 is the coefficient of determination (R2) of the flux ratios for a R/N pair
that define its fitness to a linear curve. An R2 value greater than 0.9 signals that the flux
ratios over all cases are fairly continuous and linear; therefore, only R/N pairs with R2
values greater than 0.9 had the R2 assigned to Score 2. The other R/N pairs were
assigned 0 to Score 2, essentially eliminating them as candidates. Score 3 is the sum of
the absolute values of ∆𝜌. This score quantified the magnitude of change. The products
of these three scores were sorted from highest to lowest among all candidates. All R/N
pairs with positive values signified phenotype improvement (i.e., increased cellulose
accumulation in this research) as a result of gain-of-function (i.e., gene over-expression);
whereas, negative values pointed phenotype improvement due to loss-of-function (i.e.,

78
gene expression knockdown). Thus, the final candidates had largely positive scores for
gain-of-function metabolic engineering and highly negative scores for loss-of-function
manipulation. The candidates with final score absolute values greater than 0.01 (i.e., gene
over-expression and knockdown) were selected for experimental evaluation. The
enzymes that catalyze the reactions in these R/N pairs and their genes were retrieved
from the AraGEM annotations. Each gene was researched in available literature to form
hypotheses on how it could influence cellulose synthesis prior to validation in vivo.

79
Plant growth conditions
Arabidopsis thaliana ecotype Columbia (Col-0) plants served as wild-type (WT)
and background ecotype for experiments. All seedling and plants were grown in a
controlled growth chamber at 22°C under 16 hours of day/light (long days). Visible
radiation was provided with fluorescent/incandescent lamps. Soil-grown plants were
maintained on Sunshine Mix #1 and watered with Miracle-Gro Liquid Houseplant Food
(8-7-6: 8% total nitrogen, 7% available phosphate, P2O5, 6% soluble potash, K2O, 0.1%
Iron, Fe; Scotts Miracle-Gro Products, Inc.). Seed for plate-grown seedlings were
sterilized with 33% Chlorox, rinsed, and germinated on 0.5x Murashige and Skoog Basal
Salt Mixture (MS Salts) (Sigma) ± 50 µL/mL kanamycin antibiotics. All plant materials
were harvested between 12 PM and 3 PM.
Gene cloning
The mMDH2 full-length cDNA without the stop codon was amplified by PCR
from pUni51 cloning vector (U12920) obtained from the Arabidopsis Biological
Resource Center (http://abrc.osu.edu/) using primer pair 5’-
CACCATGTTCCGATCAATGAT-3’ and 5’-TTGGTTGGCAAATTTGATGC-3’. The
resulting product was inserted into the pENTRTM/SD/D-TOPO (Invitrogen) vector. The
recombination reaction was carried out using Gateway® LR ClonaseTM II enzyme mix
(Invitrogen) on pENTRTM/SD/D-TOPO:mMDH2 as an entry vector and pPWHTkan as a
destination vector, yielding a CaMV35S:mMDH2:2×HA construct. The
CaMV35S:mMDH2:2×HA construct was subsequently introduced into Agrobacterium
tumefacien (GV3101), which was next transferred to Arabidopsis thaliana using the

80
floral dip method (Clough and Bent, 1998). Transgenic plants were selected on 0.5x MS
Salt agar plates containing the kanamycin at 50 µg/mL. F3 homozygous plants were used
in all experiments.
Tissue collection
Leaf tissues for protein analyses were harvested from 21 day-old Arabidopsis
plants. Whole rosette and whole stem tissues were harvest from 35 day-old Arabidopsis
plants and used for biomass quantitation. Developmentally identical leaf samples for
biomass and cellulose quantitation were sectioned from 35 day-old whole rosettes of WT
and mMDH2:HA transgenic plants. Stem segment samples for biomass and cellulose
quantitation were sectioned 10 cm from the base of the primary stem of 35 day-old
plants.
Protein analysis
Plant tissues were frozen in liquid nitrogen and ground into a fine powder using a
mortar and pestle. Samples were homogenized in an extraction buffer (50 mM Tris-HCl
pH 7.5, 150 mM NaCl, 5 mM MgCl2, 0.05% Triton X-100, 10% glycerol, 1 mM
Dithiothreitol (DTT), and Protein Inhibitor Cocktail for plant extract, Sigma-Aldrich) and
centrifuged at 4ºC for two minutes at max speed on a table-top microcentrifuge. The
supernatant was retained, quantified by Bradford Assay, and mixed with protein loading
buffer (100 mM Tris-HCl pH 6.8, 4% Sodium dodecyl sulfate (SDS), 0.2% bromophenol
blue, and 20% glycerol), and boiled for 10 minutes. Samples were centrifuged and used
for Western blot analysis or stored at -20ºC.

81
Proteins were electrophoresed on 10% SDS-PAGE gels and transferred to
nitrocellulose using a semi-dry transfer apparatus (Bio-Rad Laboratories, Hercules, CA).
The nitrocellulose membranes were incubated in blocking solution: 5% non-fat dry milk
in TBST (50 mM Tris-HCl pH 7.5, 0.9% [w,v] NaCl, and 0.01% [v,v] Tween-20) buffer
at 4ºC overnight. For detection of HA tag, a 1:5,000 dilution of the rabbit anti-HA
antibody (Santa Cruz Biotechnology Inc., CA) was used. Membranes were probed with a
1:2,500 dilution of goat anti-rabbit horseradish peroxidase-conjugated (H + L) antibody
(Bio-Rad Laboratories, Hercules, CA). All antibody solutions were in 2.5% non-fat dry
milk in TBST buffer. Primary antibody was incubated overnight at 4ºC, while secondary
antibody was incubated for at least 1 hour at room temperature. The nitrocellulose
membranes were washed three times for 20 minutes with 1x TBST buffer before and
after application of the secondary antibody. Membranes were activated with the
Amersham ECL Plus Western Blot Detection kit (GE Healthcare, UK) and exposed to X-
ray film for signal dectection. To ensure equal loading of proteins, Ponceau S filters
were used.
Quantitation of cellulose
For determination of crystalline cellulose contents, rosette leaf tissues or stem
tissues harvested as describe in Tissue Collection were dried via lyophilization and
pulverized with 3 mm steel beads. The powder sample was washed using 1 mL of 70%
ethanol and centrifuged for 10 minutes at top speed on a table-top microcentrifuge. The
pellet was suspended in 1 mL of Updegraff reagent (acetic acid:nitric acid:water, 8:1:2
[v/v]) before boiling for 30 minutes on a heating block at 98ºC. Remaining crystalline
cellulose was pelleted by centrifugation and dissolved in 1 mL of 67% (v/v) sulfuric acid.

82
Crystalline cellulose amount was quantified colorimetrically at 620 nm in a
spectrophotometer using the anthrone reagent (Updegraff, 1969).
Cellulose per plant estimation was calculated as the sum of the estimated cellulose
per whole stem and the estimated cellulose per whole rosettes. We assumed the
cellulose-to-fresh weight ratio was consistent in whole stem or whole rosette. The
estimated cellulose per whole stem or whole rosette was calculate by taking the product
of the whole stem or whole rosette fresh weight and the mg cellulose per mg fresh weight
ratio of the 10 cm stem segment or the single leaf sample.
Quantitation of biomass
Fresh weight was measured on an analytical scale immediately after harvesting.
The dry weight was measured after overnight lyopholization at -50ºC. Leaf surface area
was measured by first flattening the leaves between two glass slides and photographing
the entire slide with the leaf surface positioned parallel to the camera lens. The
photograph was processed in Adobe Photoshop CS6 to select only the leaf or the glass
slide. The pixel count under the leaf selection was normalized to the pixel count under
the glass slide selection. The surface area for the leaf sample was calculated by
multiplying the normalized pixel count by the known surface area of the glass slide. The
stem thickness was measured at 1 cm from the base of the 10 cm stem segment with a
Kobalt 0.5-ft Metric and SAE caliper.

83
RESULTS
Gene candidate prediction by Reverse FBrAtio
The results below are presented from each of the four steps of the Reverse
FBrAtio algorithm development that led to the identification of metabolic engineering
strategies to increase cellulose production by Arabisopsis thaliana.
Step 1 – Adjustment of constraints and generation of cases
The growth function in the original AraGEM model was modified to increase
cellulose in the biomass equation from 0.305 to 0.488 mmolg-DW-1 over 30 increments
(cases) of 0.061 mmolg-DW-1. When the flux distribution was optimized under the
photosynthetic constraints and adjusted photon uptake (as described in Materials and
Methods) for maximal growth of all cases, the predicted growth rate only reduced
slightly, from 0.11 to 0.1045 g-DWh-1. In addition, the rate of cellulose accumulation
increased from 0.0335 to 0.051 mmolh-1 (Figure III-2).
Step 2 – Identification of reaction/node pairs
AraGEM contains 1,601 reactions, but only 352 reactions were found to carry
non-zero flux that were not artifacts from simulations. These reactions were also
required to carry flux in consistent directions over all 31 cases. Of the 352 effective
reactions, only 252 reactions were paired with nodes. The other 100 reactions did not
consume metabolites that are considered nodes of interest. These 252 reactions were
coupled with 92 nodes to generated 396 R/N pairs.

84
Figure III-2. The change in growth rate and cellulose accumulation rate over the change of
cellulose concentration. Photon uptake was constrained to 23.290 mmolg-DW-1h-1. The
cellulose concentration in the biomass changes from 0.305 to 0.488 mmolg-DW-1 at 0.061
mmolg-DW-1. The growth rate reduces from 0.11 to 0.1045 g-DWh-1 and the cellulose
accumulation rate increases from 0.0335 to 0.051 mmolh-1.

85
Step 3 – Computation of flux ratios and changes of flux ratios
The flux ratios for all R/N pairs of interest over all cases were computed into a
31-by-396 matrix (an example of this matrix shown as Table III-1a). These values were
used to compute the ∆𝜌 values for all nodes of interest (an example of this matrix shown
as Table III-1b). The matrix of ∆𝜌 values contained 5,211 values below the significant-
threshold (10-8) out of the total 11,880 values. These values are reassigned as zeros. As
shown in the examples in Figure III-3, the increasing flux ratios would produce positive
∆𝜌 values and the reducing flux ratios would result in negative ∆𝜌 values. The slope of
the ∆𝜌 values with cellulose concentration showed the magnitude of changes for each
increment, or between two adjacent cases. The R/N pair with the largest sum of
magnitude of changes was the pyrophosphate phosphoribosyltransferase consuming
xanthosine 5-phosphate, however, this R/N pair did not have a linear . Furthermore,
there were 313 other R/N pairs out of the 396 total that had non-linear . Comparing
the R/N pairs based on magnitude of changes alone would be insufficient. Thus, a
scoring algorithm became necessary to evaluate the matrix.

86
Table III-1a. An example of the flux ratio matrix.
Cases 1 2 3 4 5
Cellulose in biomass 0.305 0.311 0.317 0.323 0.329
R/N pair ID Node Reaction names
121 Octadecenoyl ATP-citrate synthase, putative -0.293 -0.299 -0.306 -0.312 -0.320
122 Octadecenoyl aconitate hydratase, cytoplasmic -0.707 -0.701 -0.694 -0.688 -0.680
124 Tetracosahexa-enoyl-CoA aconitate hydratase, cytoplasmic, putative -0.611 -0.616 -0.621 -0.626 -0.631
126 Tetracosahepta-enoyl-CoA 4-coumarate--CoA ligase 1 -0.141 -0.141 -0.141 -0.141 -0.141
Table III-1b. An example of the change of flux ratio matrix.
Cases 1-2 2-3 3-4 4-5
Cellulose in biomass 0.0061 0.0061 0.0061 0.0061
R/N pair ID Node Reaction names
121 Octadecenoyl ATP-citrate synthase, putative 0.0063 0.0066 0.0069 0.0072
122 Octadecenoyl aconitate hydratase, cytoplasmic -0.0063 -0.0066 -0.0069 -0.0072
124 Tetracosahexa-enoyl-CoA aconitate hydratase, cytoplasmic, putative 0.0050 0.0051 0.0052 0.0053
126 Tetracosahepta-enoyl-CoA 4-coumarate--CoA ligase 1 0.0000* 0.0000* 0.0000* 0.0000*
* ∆𝜌 with absolute values below significant-threshold (10-8).

87
Figure III-3. Examples of flux ratios and change in flux ratios for two reaction/node pairs.
The mMDH reaction increasingly consumed (negative) more NAD+ resulting in positive changes
in flux ratios (a). The rate of this reaction also increased between each increments, which lead to
positive slopes. The SPP reaction gradually reduced its consumption of UDP-glucose resulting
in negative changes in flux ratios (b). This rate also reduced between each increments leading to
negative slopes.

88
Step 4 – Evaluation of ∆ for genetic engineering candidates
The final score was the product of three different scores given for each
reaction/node pair. There were 327 reaction/node pairs that scored zero, which leaves 24
pairs with positive scores and 45 negative scores. The reaction/node pairs with non-zero
scores and have annotated enzymes and genes were ranked from highest to lowest. The
genes that catalyze the reactions for pairs with positive scores and negative scores were
predicted to be the likely gene over-expression and knock-down candidates for enhancing
cellulose content in photosynthetic cells. The top over-expression candidates include
ATP-citrate synthase, mitochondrial aconitate hydratase, cellulose synthase, and malate
dehydrogenase. The top knock-down candidates include cytosolic aconitate hydratase,
sucrose-phosphate synthase, phosphoglucomutase, mitochondrial citrate synthase.
Some reactions were duplicated in the list (Table III-2) because of their
competitiveness for reactants in other nodes. An example is the plastidic ribulose
bisphosphate carboxylase (RuBisCO) small chain 1A. In AraGEM, this enzyme is
involved in two forms of catalyses: (i) the consumption of water and carbon dioxide to
convert ribulose bisphosphate to two phosphoglycerates in C3 carbon fixation
(R00024_p, in Calvin Cycle) and (ii) the consumption of oxygen to break-down ribulose
bisphosphate to phosphoglycolate and phosphoglycerate in photorespiration (R03140_p,
in photorespiration). The RuBisCO catalyzing RuBP via photorespiration was duplicated
as a target for over-expression because it was competing in two different nodes. The
same RuBisCO catalyzing RuBP via carbon fixation were repeated as a knock-down
candidate for the same reason. The RuBisCO catalyzing RuBP via carbon fixation was
also predicted to be an over-expression candidate because it was predicted to have a small

89
advantage in CO2 consumption than the other CO2 consuming reactions; however, this
prediction carried the lowest score among the relevant over-expression candidates. In
summary, this evaluation suggested that an increase in activity of photorespiration
coupling with a reduced activity in carbon fixation from RuBisCO could enhance
cellulose accumulation.
Each of the candidates was evaluated similarly, and strong evidence was found
that identified the mitochondrial malate dehydrogenase (mMDH) as a potential gene
over-expression metabolic engineering target. The mMDH is encoded in Araibidopsis by
two genes (Lee et al., 2008). Previous work by others has shown that a loss-of-function
in the mMDH1 and mMDH2 genes can lead to a plant with reduced growth and defective
photorespiratory functions (Tomaz et al., 2010). This further supports the simulation
results of this research that suggested the over-expression of mMDH may result in a plant
with metabolic alterations that favors the accumulation of cellulose. Thus, plants with
mMDH over-expression were constructed in the laboratory and analyzed in detail. The
experimental results are discussed in sections below. However, first the differences
between FBA and FBrAtio simulations are discussed, and the potential mechanism(s)
leading to increased cellulose accumulation are elucidated.

90
Table III-2. Candidate reaction/node pairs for enhancement of cellulose accumulation.
Rxn-node pair Final score Node Reaction ID Reactions
121 4.68×10⁻¹ Citrate_cyt R00352_cyt ATP-citrate synthase, putative
124 1.98×10⁻¹ Citrate_mit R01324_mit aconitate hydratase, mitochondrial, putative
373 9.35×10⁻² UDP-glucose R02889_cyt cellulose synthase
264 3.68×10⁻² NAD+ R00342_mit malate dehydrogenase [NAD], mitochondrial
132 1.27×10⁻² D-Ribulose 1,5-bisphosphate R03140_chl ribulose bisphosphate carboxylase small chain 1A
339 1.09×10⁻² Oxygen_chl R03140_chl ribulose bisphosphate carboxylase small chain 1A
40 9.72×10⁻³ ADP_cyt R00127_cyt adenylate kinase -related protein
394 7.47×10⁻³ beta-D-Fructose 6-phosphate R02740_chl glucose-6-phosphate isomerase, putative
377 4.93×10⁻³ UTP_cyt R00289_cyt UDP-glucose pyrophosphorylase
55 3.61×10⁻³ ATP_cyt R00156_cyt nucleoside diphosphate kinase 1 (NDK1)
201 3.13×10⁻³ H2O_chl R01334_chl phosphoglycolate phosphatase
374 1.69×10⁻³ UDP R00156_cyt nucleoside diphosphate kinase 1 (NDK1)
199 1.05×10⁻³ H2O_chl R04780_chl fructose-1,6-bisphosphatase, putative
35 5.39×10⁻⁴ 5-Phospho-alpha-D-ribose 1-
diphosphate
R01049_cyt ribose-phosphate pyrophosphokinase 2
265 4.58×10⁻⁴ NAD+ R00709_mit isocitrate dehydrogenase subunit 2
115 2.68×10⁻⁵ CO2_chl R00024_chl ribulose bisphosphate carboxylase small chain 1A
203 -1.38×10⁻⁵ H2O_chl R01706_chl Oleoyl-[acyl-carrier-protein] hydrolase
113 -1.46×10⁻⁵ CO2_cyt R00905_cyt beta-ureidopropionase
114 -1.50×10⁻⁵ CO2_cyt R04209_cyt phosphoribosylaminoimidazole carboxylase family
protein
304 -2.44×10⁻⁵ NADPH R04533_chl 3-oxoacyl-[acyl-carrier protein] reductase, chloroplast
305 -2.44×10⁻⁵ NADPH R04534_chl 3-oxoacyl-[acyl-carrier protein] reductase, chloroplast
306 -2.44×10⁻⁵ NADPH R04536_chl 3-oxoacyl-[acyl-carrier protein] reductase, chloroplast
307 -2.44×10⁻⁵ NADPH R04543_chl 3-oxoacyl-[acyl-carrier protein] reductase, chloroplast
308 -2.44×10⁻⁵ NADPH R04566_chl 3-oxoacyl-[acyl-carrier protein] reductase, chloroplast
309 -2.44×10⁻⁵ NADPH R04953_chl 3-oxoacyl-[acyl-carrier protein] reductase, chloroplast
310 -2.44×10⁻⁵ NADPH R04964_chl 3-oxoacyl-[acyl-carrier protein] reductase, chloroplast
335 -8.28×10⁻⁵ Oxygen_cyt R07440_cyt ferulate-5-hydroxylase
104 -9.37×10⁻⁵ ATP_chl R00742_chl acetyl-CoA carboxylase 1
198 -9.66×10⁻⁵ H2O_chl R00132N_chl carbonic anhydrase 1, chloroplast
36 -1.18×10⁻⁴ 5-Phospho-alpha-D-ribose 1-
diphosphate
R01072_cyt amidophosphoribosyltransferase
334 -1.54×10⁻⁴ Oxygen_cyt R02950_cyt 4-Coumarate:oxygen oxidoreductase
116 -2.68×10⁻⁴ CO2_chl R00132N_chl carbonic anhydrase 1, chloroplast
105 -2.73×10⁻⁴ ATP_chl R00948_chl glucose-1-phosphate adenylyltransferase, putative
37 -4.21×10⁻⁴ 5-Phospho-alpha-D-ribose 1-
diphosphate
R01073_cyt anthranilate phosphoribosyltransferase
103 -1.42×10⁻³ ATP_chl R00253_chl glutamine synthetase, chloroplast
375 -1.69×10⁻³ UDP R02018_cyt ribonucleoside-diphosphate reductase small chain,
putative
197 -2.83×10⁻³ H2O_chl R00024_chl ribulose bisphosphate carboxylase small chain 1A

91
Table III-2. Candidate reaction/node pairs for enhancement of cellulose accumulation,
continue
Rxn-node pair Final score Node Reaction ID Reactions
378 -3.17×10⁻³ UTP_cyt R00571_cyt CTP synthase, putative
392 -3.73×10⁻³ beta-D-Fructose 6-phosphate R01827_chl Sedoheptulose-7-phosphate:D-glyceraldehyde-3-
phosphate glyceronetransferase
393 -3.73×10⁻³ beta-D-Fructose 6-phosphate R01830_chl transketolase, putative
170 -5.12×10⁻³ H+_chl R01195_chl Ferredoxin:NADP+ oxidoreductase
311 -5.16×10⁻³ NADPH R01195_chl Ferredoxin:NADP+ oxidoreductase
326 -9.30×10⁻³ Oxaloacetate_cyt R00355_cyt aspartate aminotransferase, cytoplasmic isozyme 2
131 -1.27×10⁻² D-Ribulose 1,5-bisphosphate R00024_chl ribulose bisphosphate carboxylase small chain 1A
319 -1.41×10⁻² Orthophosphate_cyt TCM19
195 -3.15×10⁻² H2O_mit R00351_mit citrate synthase, mitochondrial, putative
196 -3.60×10⁻² H2O_mit R01082_mit fumarate hydratase, putative
263 -3.73×10⁻² NAD+ R00209_mit pyruvate dehydrogenase E1 component alpha subunit,
mitochondrial, putative
328 -5.68×10⁻² Oxaloacetate_mit R00351_mit citrate synthase, mitochondrial, putative
384 -8.43×10⁻² alpha-D-Glucose 6-phosphate_chl R00959_chl phosphoglucomutase, cytoplasmic, putative
372 -9.35×10⁻² UDP-glucose R00766_cyt sucrose-phosphate synthase, putative
123 -1.98×10⁻¹ Citrate_mit TCM4
122 -4.68×10⁻¹ Citrate_cyt R01324_cyt aconitate hydratase, cytoplasmic
Only pairs annotated with enzyme names or gene names are listed. The compartments are shown
as _cyt (cytosolic), _chl (chloroplastic), and _mit (mitochondrial).
92
Constrasting Reverse FBrAtio evaluations with conventional FBA
The FBA solutions to the optimal flux distributions of AraGEM with increasing
cellulose content predicted that the necessary additional carbon source for the production
of cellulose was contributed by the chloroplast. This is depicted in Figure III-4. Under
the constrained photon and CO2 uptake rates, excess NADPH or carbon source was
unavailable. The reduction of glucose 6-phosphate (G6P) utilization in starch synthesis
and the reduction of fructose 6-phosphate (F6P) and glyceraldehyde 3-phosphate (G3P)
utilization in the pentose phosphate pathway provided the additional G6P needed to
increase cellulose production. Most of the plastidic NADPH was consumed by
glyceraldehyde 3-phosphate dehydrogenase to convert D-glycerate 1,3-bisphosphate
(G1,3P) to G3P. The second largest consumer of plastidic NADPH was the NADPH-
dependent chloroplastic malate dehydrogenase (NADPH-cMDH). The NADPH-cMDH,
together with the NADH-dependent cMDH (NADH-cMDH), converted oxaloacetate
(OAA) to malate. The malate generated in the chloroplast was transported to the cytosol.
Together with the malate produced by the cytosolic malate dehydrogenases (cytMDH),
all the malate was transported to the mitochondria and used to generate NADH and OAA
by the mitochondrial malate dehydrogenases (mMDH). The OAA generated in the
mitochondria was transported to the cytosol and then the chloroplast to continue the
shuttling of energy.
As the cellulose concentration in the biomass increased in Reverse FBrAtio
simulations, the flux of the NADPH-cMDH reaction increased slightly; however, the flux
of the NADH-cMDH reaction was greatly reduced. In turn, this reduced the total OAA
to malate conversion in the chloroplast. The fluxes for cytMDH and mMDH reduced as

93
well to balance the total reduction of function in the malate-OAA shuttle. Although the
fluxes reduced, it was found that the flux ratio of the mMDH/NAD+ R/N pair increased
most significantly when competing with two other reactions for NAD+ (Figure III-5).
This suggested that mMDH carrying a flux that had advantage in the competition for
NAD+ was a factor to increasing cellulose accumulation in the biomass.

94
Figure III-4. The predicted flux distribution for the enhancement of cellulose accumulation.
Given that photosynthesis is the sole generator of NADPH, under a constrained photon uptake
rate, the NADPH availability became limited for carbon fixation in the chloroplast. The
consumptions of G3P and F6P by the pentose phosphate pathway and the consumption of G6P by
starch synthesis were reduced to redirect more G6P for cellulose synthesis. The malate
dehydrogenases in all three organelles were essential in the conservation of the reducing
equivalent pools to permit non-obvious functionalities within the cell for the enrichment of
cellulose content.

95
Figure III-5. The relationships between FBA solutions, flux ratios, and change of flux ratios.
The fluxes for all consuming reactions reduced due to the reduction in NAD+ availability;
however, the flux ratios of the reactions in term of NAD+ consumption varied. The sums of
∆𝑓𝑙𝑢𝑥 𝑟𝑎𝑡𝑖𝑜𝑠 of the reactions showed that PDH had reduced consumption of NAD+ while
mMDH and IDH had increased consumptions. mMDH had a much greater change in
consumption rate than that of IDH.

96
Validating the predicted phenotypes of over-expression of mMDH2 in Arabidopsis
thaliana
In order to validate the predicted cellulose accumulation in Arabidopsis plants
ectopically expressing mMDH, plants were engineered to express an epitope-tagged
mMDH transgene. Arabidopsis plants were transformed with an mMDH2 gene fusion to
a C-terminal 2× HA epitope tag under the control of the 35S promoter (mMDH2:HA
transgenic plants) (Figure III-6). The resulting transgenic seed were screened on
kanamycin plates and five different transgenic lines were obtained (M2-12, M2-21, M2-
22, M2-24, M2-25). To determine whether these transgenic plants accumulate
mMDH2:HA protein, protein extracts from segregating plants of each line were
examined with Western blot using an anti-HA antibody (Figure III-7). Detection of the
55 kDa RuBisCO large subunit protein was used to assess the amount of protein loaded
on the gel. The anti-HA antibody detects a 38 kDa protein which correlates well with the
predicted size of the mMDH2:HA protein. When the mMDH2:HA bands were
normalized to RuBisCO expression, we found that four of the five lines (M2-12, M2-22,
M2-24, M2-25) had similar amounts of mMDH2:HA accumulation, while the M2-21 line
contained less mMDH2:HA protein less Founder plants from lines M2-12 and M2-24
were used to produce homozygous progeny for further analysis.
To test whether transgenic mMDH2:HA plants are altered in their growth and
development, transgenic and control plants were grown and observed throughout their
development. Changes in rosette leaf shape in the mMDH2:HA transgenic plants were
observed at 14 days of growth (Figure III-8). Rosette leaves of mMDH2:HA were flatter
and grew to exceed the size of the equivalent leaves in WT at 16 days old (Figure III-9).

97
This difference in rosette leaf size persisted until the plants were harvested at 35 day-old.
In addition, stems from mMDH2:HA plants were thicker (Figure III-10).
To determine if mMDH2:HA plants have elevated biomass, the fresh weights of
whole rosettes and whole stems were measured (Figure III-11A). No differences were
found in the fresh weights of whole rosettes from WT and mMDH2:HA plants (Figure
III-11A). In contrast, the fresh weights of whole stems of mMDH2:HA plants was
increased by 54 percent (Figure III-11A).
To determine if cellulose levels were impacted by the increased expression of the
mMDH2:HA transgene, cellulose contents were measured. We measured a 22 percent
significant increase in crystalline cellulose from ethanol-insoluble cell wall in the
mMDH2:HA plant stem segments, however, there was no significant increase in the
rosette leaves (Figure III-11B). We also found a 73 percent significant increase in total
cellulose in the 10 cm stem segments of mMDH2:HA as compared to WT (Figure III-
11C). In considering the total cellulose increase per plant, we estimated that
mMDH2:HA plants have an increase of 28 to 95 percent (Table III-3).

98
Figure III-6. The mMDH2:2×HA transgene construct. The full length cDNA of mMDH2 was
fused with hemagglutinin epitope tag (2× HA) and expressed under the CaMV35S promoter.

99
Figure III-7. Western blot analysis of five transgenic lines expressing mMDH2:HA. Proteins
were extracted from leaf tissues of 21 day old transgenic progenies of five segregating
mMDH2:HA lines (M2-12, M2-21, M2-22, M2-24, and M2-25) and analyzed by western blotting,
using an anti-HA antibody. Ponceau S staining of the blots is shown in the top panel.

100
Figure III-8. The rosette leaf phenotype of mMDH2:HA plants. WT (A,C,E,G) and
mMDH2:HA(B,D,F,H) plants were grown side-by-side under 16 h day-light cycles at 120 µE for
14 days (A,B), 15 days (C,D), 16 days (E,F), and 17 days (G,H).

101
Figure III-9. Rosette leaf surface area of WT and mMDH2:HA plants. At the indicated day,
one leaf of the third pair of leaves was removed from WT and mMDH2:HA plants and the surface
area was measured as described in the Materials and Methods. The asterisk (*) indicates a p-
value of < 0.01 (n = 16).

102
Figure III-10. Comparison of WT and mMDH2:HA plant stems. WT (left) and mMDH2:HA
transgenic (right) primary stems isolated from 35 day old plants (A) and a cross-section from
each (B).

103
Figure III-11. Biomass and cellulose content of WT and mMDH2:HA plants. Biomass
measurement was taken from 35 day-old plants. Cellulose was measured in one leaf of the 4th
pair of rosette leaves and 10 cm stem segment. (A) Whole rosette and whole stem biomass (g
fresh weight / plant). (B) Cellulose content expressed as a proportion of the ethanol-insoluble
cell wall material (mg cellulose / mg cell wall). (C) Cellulose content per leaf of the 4th pair of
rosette leaves and cellulose content per 10 cm stem segment. Values are the mean ± SE (n = 10)
with asterisks (*) indicating a significant difference from WT in Student’s T-test (P < 0.01).

104
Table III-3. Estimated cellulose content in WT and mMDH2:HA.
mg cellulose / whole rosette mg cellulose / whole stem mg cellulose / plant
WT 1 15.7 ± 1.0 31.2 ± 2.7 * 46.0 ± 2.6 *
mMDH2:HA 1 16.1 ± 1.2 42.7 ± 3.5 * 58.8 ± 3.2 *
WT 2 7.9 ± 0.4 32.2 ± 4.2 * 40.1 ± 4.4 *
mMDH2:HA 2 7.7 ± 0.5 71.1 ± 7.7 * 78.3 ± 7.7 *
Estimates were calculated from two experimental replicates (1 and 2) as described in Materials
and Methods. Values are the mean ± SE with asterisks (*) indicating a significant difference
between WT and mMDH2:HA in Student’s T-test (P < 0.01).

105
DISCUSSION
Predicting genes useful for metabolic engineering strategies with Reverse FBrAtio
To use systems metabolic engineering to determine potentially successful genetic
modification candidates, flux redistributions were identified in the metabolic network
where it was critical to satisfy increased cellulose accumulation in AraGEM. This new
computational technique is called Reverse FBrAtio, and it has been demonstrated and
validated in this research. Incremental FBA solutions and the respective flux ratios of the
R/N pairs were computed for the increasing cellulose accumulation in the biomass
equation. Although it was predicted that the maximum growth rate must be sacrificed for
the gain in cellulose; however, the predicted loss was 10.7 percent of growth for cellulose
concentration to double in biomass, which was small for the return. The overall cellulose
accumulation rate was also predicted to increase by 113 percent for every doubling of
cellulose concentration in the biomass equation of AraGEM.
The candidate R/N pairs were identified simultaneously from the same
constraints. This meant that all of the metabolic changes should occur together to
improve cellulose accumulation. In a steady-state analysis, when the constraints and
objective were unchanged, altering the flux ratio of one of the candidate R/N pairs in a
linear metabolic network, such as AraGEM, would immediately alter the others
proportionally. This implied that it was unnecessary to modify all candidate R/N, and the
adjustment made to one would be sufficient to initiate metabolic reprogramming.
106
Contrasting Reverse FBrAtio with conventional FBA
The conventional interpretation of the FBA results suggests that mMDH flux
should be reduced in the process of improving cellulose accumulation. This
interpretation would infer a loss-of-function metabolic engineering strategy for increasing
cellulose accumulation in plants. However, this interpretation is incorrect because it fails
to consider the reduction in the availability of the reactants as a potential cause of the
reduction of mMDH flux. Since FBA simply solved the metabolic network to its steady-
state, it alone could not specify reactions that were critically associated to a change in the
metabolic network use, such as that resulting from increase of cellulose production.
Reverse FBrAtio analyzed the FBA solutions over a continuous change of a constraint
(i.e. increasing cellulose stoichiometry in the biomass equation) and reported regions of
the metabolic network where critical flux redistributions occurred. The value of Reverse
FBrAtio was its ability to distinguish the difference between mMDH flux converting
malate to OAA and mMDH flux converting NAD+ to NADH. Although both
conversions were part of the same reaction, the flux was dictated by two separate pools of
metabolites. AraGEM regarded the mMDH enzyme as the sole consumer of malate in
the mitochondria; thus, at steady-state, mMDH could catalyze the conversion of malate as
quickly as it was provided. This meant that if malate was the only reactant, then mMDH
played no critical role in the functioning of the metabolic network. Fortunately, mMDH
also simultaneously converted NAD+ to NADH, and NAD+ was the reactant to two other
reactions (PDH and IDH) in the mitochondria. Reverse FBrAtio showed that mMDH
gained advantage in the utilization of NAD+ over the other two reactions as cellulose
accumulation increased. The increased flux ratio of mMDH/NAD+ was balanced by the

107
reduction of flux ratio for PDH/NAD+. The flux ratio for IDH/NAD+ also increased, but
this change was too little in comparison to the changes for mMDH/NAD+ and
PDH/NAD+. This prediction suggested that it was necessary for mMDH to maintain its
advantage for NAD+ over PDH and IDH to allow increase in cellulose accumulation.
This advantage could be accomplished by the over-expression of mMDH.
Further implications from Reverse FBrAtio
There has been much effort in improving energy utilization by optimizing the
efficiency of RuBisCO in the Calvin Cycle. Most of the studies focused on reducing the
oxygenation of RuBP to improve the consumption of CO2, thus reducing
photorespiration. Reverse FBrAtio predicted an alternative to utilize carbon more
efficiently for cellulose synthesis. This prediction suggested that by enhancing the use of
RuBP through photorespiration and the reduction of CO2 incorporation (Calvin Cycle)
would allow greater cellulose synthesis while maintaining growth.
Validating the predicted phenotypes of over-expression of mMDH2 in Arabidopsis
thaliana
It was known that Arabidopsis mitochondria contains two functionally redundant
isoforms of malate dehydrogenases – mMDH1 and mMDH2 (Tomaz et al., 2010). Our
focus was on the increase in cellulose content predicted from over-expression of the
mMDH genes. Because the two isoforms were functionally redundant, we concluded that
the over-expression of either would produce similar results. Thus we chose to over-
express the mMDH2 gene in WT Arabidopsis.

108
The most distinguishable phenotypic changes resulting from mMDH over-
expression were the flattening, broadening, and thinning of the rosette leaves and the
lateral expansion of the stems. The over-expression of mMDH2 gene gave rise to a
larger plant, which was opposite of the dwarfed phenotype in the mmdh1mmdh2 double
knockout plants (Tomaz et al., 2010). It was shown that the mmdh1mmdh2 plants
exhibited elevated respiration rate and defective photorespiration function. Conventional
interpretation of FBA solutions would have suggested reducing mMDH function as a
solution to reduce respiration and increase photorespiration. The Reverse FBrAtio
interpretation more accurately suggested the enhancement of mMDH function to
potentially produce phenotypes that were opposite of the mmdh1mmdh2 plants. Together
these data suggest that the mMDH-catalyzed reactions in plants are rate-limiting for
processes indirectly linked to cellulose accumulation.

109
CONCLUSION
Reverse FBrAtio can instantaneously predict metabolic engineering strategies by
analyzing the computed FBA solutions using a reverse approach to the existing FBrATio
methodology (Yen et al., 2013). Instead of the conventional comparison of flux changes,
the change in proportions of flux distribution at relevant metabolic nodes was
investigated. This method can identify redistributions of fluxes that are critical to a
change in metabolism and are non-obvious to human interpretation. Reverse FBrAtio
was validated using the AraGEM genome-scale metabolic flux model of Arabidopsis
thaliana and an objective to increase the accumulation of cellulose. Reverse FBrAtio
predicted the over-expression of mMDH to increase cellulose concentration in the plant
biomass. In response, the mMDH2:HA over-expression plant was constructed and
validated. Experimental results confirmed the predicted increase in cellulose content.
This proof-of-concept provides an effective new tool for systems metabolic engineering
and will have broad applicability to all cell types for the production of targeted
molecules.

110
REFERENCES
Bonarius, H. P. J., Schmid, G., Tramper, J., 1997. Flux analysis of underdetermined
metabolic networks: the quest for the missing constraints. Trends in
Biotechnology. 15, 308-314.
Bornstein, B. J., Keating, S. M., Jouraku, A., Hucka, M., 2008. LibSBML: an API library
for SBML. Bioinformatics. 24, 880-1.
Burgard, A. P., Pharkya, P., Maranas, C. D., 2003. Optknock: A bilevel programming
framework for identifying gene knockout strategies for microbial strain
optimization. Biotechnology and Bioengineering. 84, 647-657.
Chance, B., Hess, B., 1959. Metabolic control mechanisms. I. Electron transfer in the
mammalian cell. The Journal of biological chemistry. 234, 2404-12.
Clough, S. J., Bent, A. F., 1998. Floral dip: a simplified method for Agrobacterium-
mediated transformation of Arabidopsis thaliana. The Plant Journal. 16, 735-743.
Collakova, E., Yen, J. Y., Senger, R. S., 2012. Are we ready for genome-scale modeling
in plants? Plant Science. 191–192, 53-70.
de Oliveira Dal'Molin, C. G., Quek, L. E., Palfreyman, R. W., Brumbley, S. M., Nielsen,
L. K., 2010. AraGEM, a genome-scale reconstruction of the primary metabolic
network in Arabidopsis. Plant physiology. 152, 579-89.
Demura, T., Ye, Z. H., 2010. Regulation of plant biomass production. Current opinion in
plant biology. 13, 299-304.
Edwards, J. S., Palsson, B. O., 2000. The Escherichia coli MG1655 in silico metabolic
genotype: Its definition, characteristics, and capabilities. Proceedings of the
National Academy of Sciences. 97, 5528-5533.

111
Hames, B. R., 2009. Biomass compositional analysis for energy applications. Methods
Mol Biol. 581, 145-67.
Henry, C. S., DeJongh, M., Best, A. A., Frybarger, P. M., Linsay, B., Stevens, R. L.,
2010. High-throughput generation, optimization and analysis of genome-scale
metabolic models. Nat Biotech. 28, 977-982.
Hyduke, D., Schellenberger, J., Que, R., Fleming, R., Thiele, I., Orth, J., Feist, A.,
Zielinski, D., Bordbar, A., Lewis, N., Rahmanian, S., Kang, J., Palsson, B., 2011.
COBRA Toolbox 2.0. Nat Protocol Exchange.
Jung, S. K., Parisutham, V., Jeong, S. H., Lee, S. K., 2012. Heterologous expression of
plant cell wall degrading enzymes for effective production of cellulosic biofuels.
Journal of biomedicine & biotechnology. 2012, 405842.
Keating, S. M., Bornstein, B. J., Finney, A., Hucka, M., 2006. SBMLToolbox: an SBML
toolbox for MATLAB users. Bioinformatics. 22, 1275-7.
Kim, W. C., Ko, J. H., Kim, J. Y., Kim, J., Bae, H. J., Han, K. H., 2013. MYB46 directly
regulates the gene expression of secondary wall‐associated cellulose synthases in
Arabidopsis. The Plant Journal. 73, 26-36.
Ko, J.-H., Kim, W.-C., Han, K.-H., 2009. Ectopic expression of MYB46 identifies
transcriptional regulatory genes involved in secondary wall biosynthesis in
Arabidopsis. The Plant Journal. 60, 649-665.
Lee, C. P., Eubel, H., O'Toole, N., Millar, A. H., 2008. Heterogeneity of the
mitochondrial proteome for photosynthetic and non-photosynthetic Arabidopsis
metabolism. Molecular & Cellular Proteomics. 7, 1297-1316.

112
Liolios, K., Chen, I.-M. A., Mavromatis, K., Tavernarakis, N., Hugenholtz, P.,
Markowitz, V. M., Kyrpides, N. C., 2010. The Genomes On Line Database
(GOLD) in 2009: status of genomic and metagenomic projects and their
associated metadata. Nucleic acids research. 38, D346-D354.
McAnulty, M. J., Yen, J. Y., Freedman, B. G., Senger, R. S., 2012. Genome-scale
modeling using flux ratio constraints to enable metabolic engineering of
clostridial metabolism in silico. BMC systems biology. 6, 42.
McCloskey, D., Palsson, B. O., Feist, A. M., 2013. Basic and applied uses of genome-
scale metabolic network reconstructions of Escherichia coli. Mol Syst Biol. 9.
Ranganathan, S., Suthers, P. F., Maranas, C. D., 2010. OptForce: An Optimization
Procedure for Identifying All Genetic Manipulations Leading to Targeted
Overproductions. PLoS Comput Biol. 6, e1000744.
Seaver, S. M. D., Henry, C. S., Hanson, A. D., 2012. Frontiers in metabolic
reconstruction and modeling of plant genomes. Journal of Experimental Botany.
63, 2247-2258.
Tomaz, T., Bagard, M., Pracharoenwattana, I., Lindén, P., Lee, C. P., Carroll, A. J.,
Ströher, E., Smith, S. M., Gardeström, P., Millar, A. H., 2010. Mitochondrial
malate dehydrogenase lowers leaf respiration and alters photorespiration and plant
growth in Arabidopsis. Plant physiology. 154, 1143-1157.
Updegraff, D. M., 1969. Semimicro determination of cellulose inbiological materials.
Analytical Biochemistry. 32, 420-424.
Varma, A., Palsson, B. O., 1994. Metabolic flux balancing: basic concepts, scientific and
practical use. Nat Biotech. 12, 994-998.

113
Wang, H. Z., Dixon, R. A., 2012. On-off switches for secondary cell wall biosynthesis.
Molecular plant. 5, 297-303.
Wang, Q., Zhang, X., Li, F., Hou, Y., Liu, X., Zhang, X., 2011. Identification of a UDP-
glucose pyrophosphorylase from cotton (Gossypium hirsutum L.) involved in
cellulose biosynthesis in Arabidopsis thaliana. Plant Cell Rep. 30, 1303-1312.
Xu, C., Liu, L., Zhang, Z., Jin, D., Qiu, J., Chen, M., 2013. Genome-scale metabolic
model in guiding metabolic engineering of microbial improvement. Appl
Microbiol Biotechnol. 97, 519-539.
Yen, J. Y., Nazem-Bokaee, H., Freedman, B. G., Athamneh, A. I. M., Senger, R. S.,
2013. Deriving metabolic engineering strategies from genome-scale modeling
with flux ratio constraints. Biotechnology Journal. 8, 581-594.
Zhang, G., Qi, J., Xu, J., Niu, X., Zhang, Y., Tao, A., Zhang, L., Fang, P., Lin, L., Over-
expression of UDP-glucose pyrophosphorylase gene could increase cellulose
content in Jute (Corchorus capsularis L.). Biochemical and Biophysical Research
Communications.
Zhong, R., Richardson, E. A., Ye, Z.-H., 2007. The MYB46 transcription factor is a
direct target of SND1 and regulates secondary wall biosynthesis in Arabidopsis.
The Plant Cell Online. 19, 2776-2792.

114
CHAPTER IV
IV Chap 4
CONCLUSION
In the effort to advancing the predictive power of FBA, we introduced the
FBrAtio method to further constrain a genome-scale model at critical nodes with large
degree of freedom. We utilized the genome-scale models of five different organisms,
including Arabidopsis thaliana, yeast, cyanobacteria, E. coli, and C. acetobutylicum, to
incorporate flux ratios that simulate the genetic modification in four published
experiments. The predicted product yields using FBrAtio were consistent with the
published results.
To identify critical nodes where metabolic redistribution can significantly alter the
metabolism, we developed the Reverse FBrAtio algorithm. The Reverse FBrAtio
algorithm can predict metabolic engineering strategies that favor the production of the
metabolite of interest. We performed the Reverse FBrAtio algorithm on AraGEM and
mMDH was predicted to be a gene over-expression target for increasing crystalline
cellulose content in Arabidopsis thaliana. To examine the accuracy of this prediction, we
constructed the mMDH2:HA transgenic plant and measured the crystalline cellulose
content. We found a significant increase in cellulose in stem tissues as well as a
significant increase in total biomass.
To summarize, we introduced the use of flux ratios in integrating flux
redistribution in genome-scale models to predict change in metabolism. We further
developed this concept to predicted metabolic engineering strategies to elevate yield of
favored products. As a proof of principle, we examined the accuracy of a prediction from

115
the Reverse FBrAtio method and found consistency with experimental results. We
believe the concept of flux ratio can play an important role in predicting metabolic
engineering strategies with computational methods.

116
FUTURE DIRECTION
Designing metabolic engineering strategies with the aid of FBrAtio and Reverse
FBrAtio had shown to be successful in the discussed cases. The manually installed flux
ratios at the UTP node to increase the function of UDP-glucose pyrophosphorylase
showed gained in cellulose content similar to the published findings (Chapter II). The
Reverse FBrAtio predicted increase in cellulose content following the elevated mMDH
activity was shown to be consistent with our experimental study (Chapter III). Although
these computational methods have shown promising results to assessing metabolic
engineering outcomes and predicting genetic modification candidates, it is necessary to
further consider the implications of these results and evaluate limitations to make proper
improvements. The following questions could be addressed using the knowledge gained
and tools developed from my research.
What else were suggested from the Reverse FBrAtio results and how should they be
tested?
My result on the increase of the overall cellulose content in mMDH2:HA
transgenic plant was qualitatively consistent with the prediction from Reverse FBrAtio,
however, there were many aspects to this prediction that had not been confirmed.
Reverse FBrAtio identified the conversion of NAD+ to NADH by mMDH to be
necessary for increasing cellulose content; however, the mMDH/NAD+ R/N pair was
only one of the many necessary alterations predicted by Reverse FBrAtio. All of the
critical R/N pairs identified with Reverse FBrAtio altered flux ratios simultaneously to
yield the increase cellulose content. Because Reverse FBrAtio is an analysis of the FBA

117
solutions of cells at consecutive steady-states over an incremental change, it disregards
the flux changes and metabolite accumulations between two steady-states. Thus the FBA
solution computed using the original AraGEM with one of the predicted flux ratios for
any of the critical R/N pairs would contain the predicted flux ratios for all remaining R/N
pairs. In other word, installing the predicted flux ratio to one of the predicted R/N pairs
would yield the same FBA solution as if it was done for another predicted R/N pair.
Although this effect may be true for FBA solutions, it is unlikely for metabolism in vivo.
Ideally, we would engineer a plant that is equivalent to AraGEM with all of the predicted
flux ratios installed for the predicted critical R/N pairs. This implies a minimum of 16
genetic modifications if we exclude all predictions with scores between -0.01 and 0.01.
The alternative is to construct a plant with the same goal as the one used for Reverse
FBrAtio. Although the objective function for performing FBA was to maximize growth,
the incremental cellulose concentration was the cause for changes in flux distribution.
Under this assumption, a plant with elevated mMDH activity as well as elevated
expressions of the cellulose synthases would be a better candidate for examining the
accuracy of Reverse FBrAtio.
The other aspect is regarding metabolic engineering of flux ratios. A flux ratio is
the proportion of flux distribution between reactions competing for the same substrate.
To properly engineer flux ratio into the metabolism, it would require controlling of the
rates of enzyme catalysis. For example, the Reverse FBrAtio predicted that it is
necessary for RuBisCO to catalyze RuBP via the oxidative pathway more than via Calvin
cycle to increase cellulose content (Chapter III, Table III-2). It also predicted that
RuBisCO must consume more oxygen than the other competing reactions in the

118
chloroplast. In addition, the RuBisCO catalyzing through Calvin cycle must carry a
slightly higher flux ratio than the other reactions in the chloroplast for CO2. This same
reaction must also have slightly reduced flux ratio when competing for water. There are
three options to engineering each of the flux ratios in the plant metabolism. The first
option is to elevate the conversion rate of the target reaction. The second option is to
reduce the conversion rate of the other reactions. The third option is to perform both the
first and second options. Elevating the catalytic rate of RuBisCO may not force the
reaction to undergo the oxidative pathway more often. It may be necessary to
engineering RuBisCO to favor the oxidative reaction. In order to raise the proportion of
consumption of oxygen, the first option may be ideal for RuBisCO; however, this imply
the need to elevate all other reactions that consume water so RuBisCO can be at a
disadvantage. It is necessary to explore all possible methods that can alter the flux of a
reaction in plants to gain control over engineering flux ratios. We should also examine
the magnitude of metabolic engineering that is necessary to reconstruct the plant
metabolism to follow the predictions. Finally, it would be beneficial to understand
relationship between the predicted scores for each metabolic engineering candidate and
its actual effect on the metabolism.
What were the biochemical changes that lead to the mMDH phenotypes?
Although the mMDH2:HA plants exhibited elevated cellulose content in the stem,
this was not observed for the rosette leaves where photosynthetic cells were more
abundant. The predicted slight reduction in growth rate was also not an observed
phenotype. Qualitative assessment had shown a possible increase in rate of development;
thus there were likely discrepancies between the predicted phenotypes and the observed

119
phenotypes. As emphasized before (Chapter III), the mMDH2:HA transgenic plants
showed rosette leaf phenotypes similar to that of the GMK3 transgenic plants. Rosette
leaves from both transgenic plants exhibited flatness and thinness; however, GMK3
showed statistically significant increase in rosette biomass when mMDH2:HA did not
(Maier et al., 2012). Nevertheless, it is possible that there are similarities between the
biochemical mechanisms in the two plant lines. Thus comparing the known similarities
will aid in hypothesis building. Further examinations of the mechanisms that gave rise to
the observed phenotypes will help validate the consistencies and discrepancies between
the predicted metabolism and the actual metabolic changes. It may enrich our current
understanding of plant cellular energy transport as well as improve the accuracy of
AraGEM and advance the development of computational biology in plants.

120
REFERENCES
Bonarius, H. P. J., Schmid, G., Tramper, J., 1997. Flux analysis of underdetermined
metabolic networks: the quest for the missing constraints. Trends in
Biotechnology. 15, 308-314.
Capron, A., Chang, X. F., Hall, H., Ellis, B., Beatson, R. P., Berleth, T., 2013.
Identification of quantitative trait loci controlling fibre length and lignin content
in Arabidopsis thaliana stems. J Exp Bot. 64, 185-97.
Chance, B., Hess, B., 1959. Metabolic control mechanisms. I. Electron transfer in the
mammalian cell. The Journal of biological chemistry. 234, 2404-12.
Collakova, E., Yen, J. Y., Senger, R. S., 2012. Are we ready for genome-scale modeling
in plants? Plant Science. 191–192, 53-70.
Cui, J., Li, P., Li, G., Xu, F., Zhao, C., Li, Y., Yang, Z., Wang, G., Yu, Q., Shi, T., 2008.
AtPID: Arabidopsis thaliana protein interactome database--an integrative
platform for plant systems biology. Nucleic acids research. 36, D999-1008.
de Oliveira Dal'Molin, C. G., Quek, L. E., Palfreyman, R. W., Brumbley, S. M., Nielsen,
L. K., 2010. AraGEM, a genome-scale reconstruction of the primary metabolic
network in Arabidopsis. Plant physiology. 152, 579-89.
Duarte, N. C., Becker, S. A., Jamshidi, N., Thiele, I., Mo, M. L., Vo, T. D., Srivas, R.,
Palsson, B. O., 2007. Global reconstruction of the human metabolic network
based on genomic and bibliomic data. Proceedings of the National Academy of
Sciences of the United States of America. 104, 1777-82.

121
Edwards, J. S., Palsson, B. O., 2000. The Escherichia coli MG1655 in silico metabolic
genotype: Its definition, characteristics, and capabilities. Proceedings of the
National Academy of Sciences. 97, 5528-5533.
Fell, D. A., Small, J. R., 1986. Fat synthesis in adipose tissue. An examination of
stoichiometric constraints. The Biochemical journal. 238, 781-6.
Forster, J., Famili, I., Fu, P., Palsson, B. O., Nielsen, J., 2003. Genome-scale
reconstruction of the Saccharomyces cerevisiae metabolic network. Genome
research. 13, 244-53.
Garfinkel, D., Hess, B., 1964. Metabolic Control Mechanisms. VII. A detailed computer
model of the glycolytic pathway in ascites cells. The Journal of biological
chemistry. 239, 971-83.
Herrgard, M. J., Swainston, N., Dobson, P., Dunn, W. B., Arga, K. Y., Arvas, M.,
Bluthgen, N., Borger, S., Costenoble, R., Heinemann, M., Hucka, M., Le Novere,
N., Li, P., Liebermeister, W., Mo, M. L., Oliveira, A. P., Petranovic, D., Pettifer,
S., Simeonidis, E., Smallbone, K., Spasie, I., Weichart, D., Brent, R., Broomhead,
D. S., Westerhoff, H. V., Kurdar, B., Penttila, M., Klipp, E., Palsson, B. O.,
Sauer, U., Oliver, S. G., Mendes, P., Nielsen, J., Kell, D. B., 2008. A consensus
yeast metabolic network reconstruction obtained from a community approach to
systems biology. Nat Biotech. 26, 1155-1160.
Joshi, A., Palsson, B. O., 1989a. Metabolic dynamics in the human red cell: Part I—A
comprehensive kinetic model. Journal of theoretical biology. 141, 515-528.
Joshi, A., Palsson, B. O., 1989b. Metabolic dynamics in the human red cell: Part II—
Interactions with the environment. Journal of theoretical biology. 141, 529-545.

122
Joshi, A., Palsson, B. O., 1990a. Metabolic dynamics in the human red cell. Part III—
Metabolic reaction rates. Journal of theoretical biology. 142, 41-68.
Joshi, A., Palsson, B. O., 1990b. Metabolic dynamics in the human red cell. Part IV—
Data prediction and some model computations. Journal of theoretical biology.
142, 69-85.
Maier, A., Fahnenstich, H., Von Caemmerer, S., Engqvist, M. K., Weber, A. P. M.,
Flügge, U.-I., Maurino, V. G., 2012. Glycolate oxidation in A. thaliana
chloroplasts improves biomass production. Frontiers in Plant Science. 3.
McAnulty, M. J., Yen, J. Y., Freedman, B. G., Senger, R. S., 2012. Genome-scale
modeling using flux ratio constraints to enable metabolic engineering of
clostridial metabolism in silico. BMC systems biology. 6, 42.
Orth, J. D., Thiele, I., Palsson, B. O., 2010. What is flux balance analysis? Nat Biotech.
28, 245-248.
Poolman, M. G., Miguet, L., Sweetlove, L. J., Fell, D. A., 2009. A genome-scale
metabolic model of Arabidopsis and some of its properties. Plant physiology. 151,
1570-1581.
Price, N. D., Reed, J. L., Palsson, B. O., 2004. Genome-scale models of microbial cells:
evaluating the consequences of constraints. Nat Rev Micro. 2, 886-897.
Reumann, S., Ma, C., Lemke, S., Babujee, L., 2004. AraPerox. A database of putative
Arabidopsis proteins from plant peroxisomes. Plant physiology. 136, 2587-2608.
Schilling, C. H., Covert, M. W., Famili, I., Church, G. M., Edwards, J. S., Palsson, B. O.,
2002. Genome-scale metabolic model of Helicobacter pylori 26695. Journal of
bacteriology. 184, 4582-93.

123
Schilling, C. H., Edwards, J. S., Palsson, B. O., 1999. Toward metabolic phenomics:
analysis of genomic data using flux balances. Biotechnol Prog. 15, 288-295.
Sheikh, K., Förster, J., Nielsen, L. K., 2005. Modeling hybridoma cell metabolism using
a generic genome-scale metabolic model of Mus musculus. Biotechnol Prog. 21,
112-121.
Shiringani, A., Friedt, W., 2011. QTL for fibre-related traits in grain × sweet sorghum as
a tool for the enhancement of sorghum as a biomass crop. Theor Appl Genet. 123,
999-1011.
Thiele, I., Palsson, B. O., 2010. A protocol for generating a high-quality genome-scale
metabolic reconstruction. Nat. Protocols. 5, 93-121.
Thiele, I., Vo, T. D., Price, N. D., Palsson, B. O., 2005. Expanded metabolic
reconstruction of Helicobacter pylori (iIT341 GSM/GPR): an in silico genome-
scale characterization of single- and double-deletion mutants. Journal of
bacteriology. 187, 5818-30.
Varma, A., Palsson, B. O., 1993. Metabolic capabilities of Escherichia coli: I. synthesis
of biosynthetic precursors and cofactors. Journal of theoretical biology. 165, 477-
502.
Varma, A., Palsson, B. O., 1994a. Metabolic flux balancing: basic concepts, scientific
and practical use. Nat Biotech. 12, 994-998.
Varma, A., Palsson, B. O., 1994b. Stoichiometric flux balance models quantitatively
predict growth and metabolic by-product secretion in wild-type Escherichia coli
W3110. Applied and environmental microbiology. 60, 3724-31.


![Assessment of metabolic flux distribution in the thermophilic … · shift towards production of more reduced metabolites, such as lactate, ethanol, acetone, butanol, or alanine [5]](https://img.pdfslide.net/doc/110x75/60edf04d7522e00c0c3c7439/assessment-of-metabolic-flux-distribution-in-the-thermophilic-shift-towards-production.jpg)