Embed Size (px)
Citation preview

Insurance Ireland Factfile
20
Fact

2
INSURANCE IRELAND
3 About Us
4 AboutFactfile
5 ExecutiveSummary
7 TheIrishInsuranceMarket
11 LifeAssuranceandPensionsMarket
18 Non-LifeInsuranceMarket
27 InternationalMarket
Contents
Representing95%ofthedomesticinsurancecompaniesand80%oftheInternationalLifeinsurancemarket,InsuranceIrelandisthevoiceofthesectorinthiscountry,makingimportantrepresentationsonbehalfofmembercompaniestoallofourstakeholders,includingGovernment,media,customersandthewiderpublic.
InsuranceIrelandmemberspayoutmorethan€10billioninclaimsandbenefitstoIrishcustomersandcontributeover€1.8billionintaxtotheIrishexchequerperannum.Ourindustryholdsover€200billioninassetsinIrelandofwhich€35billionisinvestedinIrishinfrastructureandgovernmentdebt.Itgenerates€32bninpremiumincome(domesticandoverseas)andemploysmorethan28,000people.
Asthevoiceoftheindustry,InsuranceIreland’skeyfunctionsinclude:
• Representingitsmembers’intereststoGovernment,stateagencies,regulatorybodies,publicrepresentatives,othernationalinterestgroups,themediaandthegeneralpublic.
• RepresentingthepositionofmembersataEuropeanlevel,particularlyviaInsuranceEurope,theEuropeanAssociationfornationalinsurancecompanyrepresentativebodies,andatagloballevelviatheGlobalFederationofInsuranceAssociations(GFIA).
• Keepingmembersabreastofrelevantpolicyandregulatorydevelopmentsandprovidingaforumformemberdebatesonsuchissues.
• ProvidinginformationtoGovernment,thewiderpolicymakingcommunityandthepublicaboutinsurance.
About Us
3
INSURANCE IRELAND
THE
VO
ICE
OF
INSU
RAN
CE
IN
SUR
AN
CE
IREL
AN
D

4
INSURANCE IRELAND
Factfile2014ispartofaseriespublishedbyInsuranceIrelandannually,providingthekeyfactsandfiguresontheindustryinIreland.Thisisthetwenty-secondyearofpublicationandtheFactfileisnowawellestablishedprimarysourceofinformationonthedomesticandinternationalbusinessofinsurersbasedinIreland.
ThedataisderivedfromdatacollectedfrommembersofInsuranceIrelandunlessotherwiseindicated.
AXAIrelandareincludedinthe2010-2011InsuranceIrelandnon-lifemarketfigures,notincludedin2012andareincludedinthe2013and2014analysis.
About Factfile Y
EARS
IN P
ROD
UC
TIO
N

5
INSURANCE IRELAND
The Irish Insurance Market - A Comparative Overview • Grossinsurancepremiumincomeforlifeandnon-lifeinsurancecombinedwas€11,645min2014,comparedto€11,313min2013–anincreaseof2.9%.PremiumincomeasapercentageofGDPwas6.2%.Premiumspercapitaincreasedfrom€2,459in2013to€2,532in2014.
• Thecapitalvaluesofassetsinmanyinvestmentareasincreasedin2014.Assetscomprisinglifepolicyholders’fundsandnon-lifetechnicalreserveswas€96bnattheendoftheyear.
• TheinsurancesectorisamajoremployerintheIrisheconomy.InsuranceIrelandlifeandnon-lifemembercompaniesemployedover15,104peopleinIrelandasoftheendofDecember2014.
•Life Assurance and Pensions Market • InsuranceIreland’slifeassurancemembers’aggregatedomesticpremiumincomewas€8,989mfor2014,whichisanincreaseof2.9%onthepreviousyear(€8,739m).
• Newannualpremium(AP)businesswas€490m,up15%from€426min2013.
• Anincreaseof5.1%wasrecordedfornewsinglepremium(SP)businessin2014(€6,103m).
• NewbusinessAnnualPremiumEquivalent(APsales+10%ofSPsales)rose9%to€1,100mcomparedwith€1,006min2013.
• €8,292minbenefitsandclaimswaspaidbydomesticlifeassurancecompaniesduring2014,adecreaseof7%on2013.
• Thetotalvalueoflifeassuranceprotectioninforceattheendof2014wasestimatedat€382bn,comparedto€371bnattheendof2013,whichisanincreaseof3%.
• Theaggregatevalueofpolicyholders’fundsmanagedbyInsuranceIrelandlifemembersincreasedby8%to€89,217min2014.Thevalueofequityinvestmentsincreased6%from€42,273in2013to€44,972in2014.
Executive Summary
Equitiesrepresented50.4%oftotalpolicyholders’fundsat31/12/14,comparedto51.4%attheendof2013.
• Thevalueoflifeassurancefundsinvestedingiltsincreasedby18%to€27,517min2014,andnowrepresents30.8%oflifeassuranceinvestments.
• Cashholdingsdecreasedfrom11.8%in2013to8.9%in2014.
• Propertyassetsincreasedfrom€2,758min2013to€3,606in2014andnowrepresent4%oftotalinvestments.
•Non-Life Insurance Market • InsuranceIreland’s19domesticnon-lifememberswriteinexcessof95%ofIrishnon-lifeinsurancebusinessintheestablishedmarket.Combined,InsuranceIrelandmemberswrotegrosspremiumsof€2,656min2014(up3.2%on2013).
• Motorinsuranceremainsthelargestclassofnon-lifeinsuranceat€1190m(45%ofallnon-lifebusiness).Propertyisthesecondlargestclassofnon-lifebusiness(31%).Liabilityinsuranceaccountsfor18%ofnon-lifebusinessandisthethirdlargestclass.
• Netwrittenpremiumsin2014(i.e.totalpremiumsafterreinsurancecostshavebeendeducted)were€2,164m(up0.7%on2013).Netearnedpremiumswere€2,163m(down1.5%on2013).
• ThenumberofnewclaimsnotifiedtoInsuranceIrelandmembersin2014was445,505.57%ofnewclaimsweremotorclaimswhile23%weremadeonpropertyinsurancepolicies(householdandcommercialproperty).
• Netincurredclaimscostsin2014amountedto€1675m(down1%on2013)leadingtoanetunderwritinglossin2014of€241m.Afterinvestmentincomeisadded,themarketmadeanoperatinglossof€78m.
6
INSURANCE IRELAND
International Life Assurance Market • Thevastmajorityofinternationalpremiumincomeisnewsinglepremiumincome.In2014,thefigureforInsuranceIreland’sInternationallifememberswas€19,450m,up60%on2013(€12,131m).Annualpremiumincomereducedfrom€412in2013to€247min2014(areductionof40%).
• Someoftheincreaseinsinglepremiumbusinessisaccountedforbythehighernumberofcompaniesparticipatinginthisstatisticalexercise,reflectingtheincreasednumberofInsuranceIrelandinternationalmembers.
• Overthe5-yearperiod2010to2014,singlepremiumbusinesshasgrownfrom€6,118min2010to€19,450min2014whilstannualpremiumincomeincreasedfrom€73.5min2010to€247min2014.
• Thetop2countriesforsinglepremiumbusinesswereItalyandtheUK.
• Thevastmajorityofinternationalsinglepremiumincome(95%)isrepresentedbyunitlinkedsinglepremiumbusiness(ClassIII).
•Health Insurance Market • InsuranceIreland’sfourhealthinsurancememberswriteapproximately96%ofhealthinsuranceintheIrishdomesticmarket.Combined,InsuranceIrelandmemberswrotegrosspremiumsof€2324min2014.Grossincurredclaimsin2014amountedto€2011mwhilethenumberofnewclaimsnotifiedtoInsuranceIrelandhealthinsurancemembersin2014was1,445,846.
7
INSURANCE IRELAND
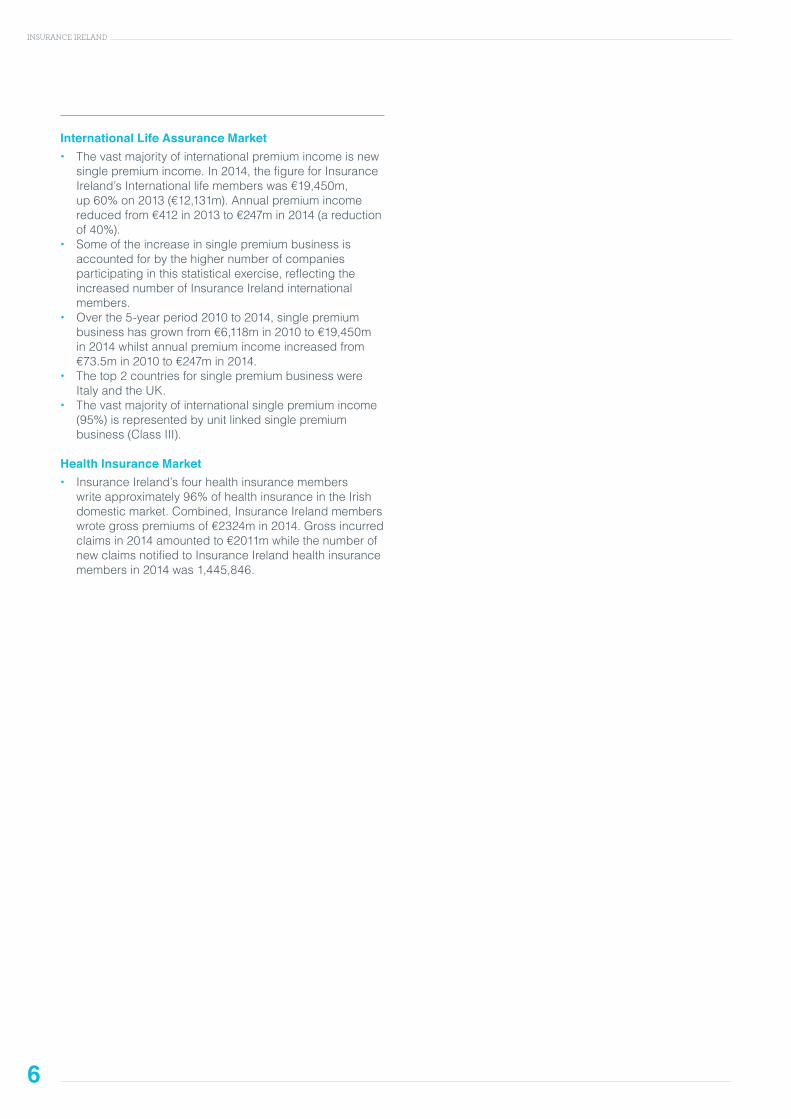
ThischapterprovidesanoverviewoftrendsintheIrishinsurancemarket,bothfromarecenthistoricalperspective(2010-2014)andinaninternationalcontext.Inaddition,dataisprovidedwhichsetstheinsurancesectorinthecontextofthewidereconomyintermsofGrossDomesticProduct
(GDP),premiumsperheadofpopulationandemployment.TheinsurancedatapresentedinthischapterisprovidedbyInsuranceIrelanddomesticinsurancemembersanddoesnotrepresentinternationalorhealthinsurancemembers.
The Irish Insurance Market
THE INSURANCE MARKET IN THE ECONOMY2014 Premium Income - Life and Non-Life
Year Life Non-Non Non Life TotalGross Premium Income (€m) 8988.6 2656.4 11,645.0
Premium Income: GDP (%) 4.76 1.41 6.17
Premiums per capita (€) 1954 577 2532
Investments* (€m) 89217 6343 95560* Policyholders’ funds (life assurance) and Technical Reserves (non-life) at 31st December 2014
Grossinsurancepremiumincomeforlifeandnon-lifeinsurancecombinedwas€11,645min2014,comparedto€11,313min2013–anincreaseof2.9%.PremiumincomeasapercentageofGDPwas6.2%.Premiumspercapitaincreasedfrom€2,459in2012to€2,532in2013.
Thecapitalvaluesofassetsinmanyinvestmentareasincreasedin2014.Assetscomprisinglifepolicyholders’fundsandnon-lifetechnicalreserveswas€96bnattheendoftheyear.
II Members’ Gross Premium Income 2010-2014
Year Life €m Non-Non Non Life €m Total €m2010 9687.6 3035.2 12722.8
2011 8485.6 2893.7 11379.3
2012 8150.2 2433.8 10584.0
2013 8739.0 2573.6 11312.6
2014 8988.6 2656.4 11645.0
Lifegrosspremiumincomedecreasedfrom€9,688min2010andcontinuedtofalltill2012andthenincreasedandstandsat€8,988.6min2014.Non-lifegrosswritten
premiumdeclined.Itwas€3,035min2010anddeclinedinsubsequentyearsbeforeincreasingto€2,574min2013and€2,656min2014.

8
INSURANCE IRELAND
8
INSURANCE IRELAND
Gross Premium Income and Domestic Product 2010-2014
Year Gross Insurance Premium Income €m GDP * €m Premium Income:GDP %
2010 12722.8 172187 7.4
2011 11379.3 176643 6.4
2012 10584.0 176910 6.0
2013 11312.6 179448 6.3
2014 11645.0 188778 6.2
Marketcombinedlifeandnon-lifepremiumincomedeclinedeachyearfrom€12,723min2010to€10,584min2012andincreasedto€11,313min2013andagainto€11645min
2014.PremiumincomeasapercentageofGDPdecreasedovertheyearsfrom2010to2012beforeincreasingto6.3%in2013andthendecreasingto6.2%in2014
Life & Non-Life premiums as a Percentage of GDP for Ireland 2010-2014
Year Life Premium as % of GDP Non-Life Premium as % of GDP Total w/out Intl %2010 5.6 1.8 7.4
2011 4.8 1.6 6.4
2012 4.6 1.4 6.0
2013 4.9 1.4 6.3
2014 4.8 1.4 6.2
LifepremiumsasapercentageofGDPfellfrom5.6%in2010to4.6%in2012beforerisingto4.9%in2013anddecreasingto4.8%in2014.Non-lifepremiumsas
apercentageofGDPfellfrom1.8%in2010andthenremained1.4%until2014.
Year-End Value of Investments
2010 €bn 2011 €bn 2012 €bn 2013 €bn 2014 €bn % Change p.a.Life 73.430 71.838 79.208 82.309 89.217 4.9
Non-life 8.142 7.761 5.696 6.462 6.343 -6.1
Total 81.572 79.599 84.904 88.771 95.560 4.0
Thevalueoflifepolicyholders’fundsincreasedfrom€81.5bnin2010to€95.6bnin2014,anaveragegrowthrateof4%overtheperiod.Non-lifetechnicalreservesfellfrom€8.1bnin2010to€5.7bnin2012,butrosein2013to€6.5bn
beforefallingto€6.3bnwithanaveragepercentagechangeof-6.1%overthefiveyears.
Thetotalvalueoflifeandnon-lifeassetswas€95.6bnin2014.
Life Assurance Benefits and Claims Paid 2010-2014
Year Amount €m2010 8222
2011 8736
2012 8996
2013 8923
2014 8292
€8,292mwaspaidoutbylifeassurancecompaniesinbenefitsandclaimsin2014.Thesepaymentsandbenefitscoverawiderangeofareas,including:
• Incomeandpayoutsoninvestmentpoliciesforpolicyholders. • Paymentofdeathbenefitswhichprotectfamilyincome. • Paymentofannuityincometopensionpolicyholders. • Repaymentofmortgagesintheeventofdeathofapolicyholder.
• Lumpsumpayoutstopolicyholderswithseriousillnesscover.
9
INSURANCE IRELAND
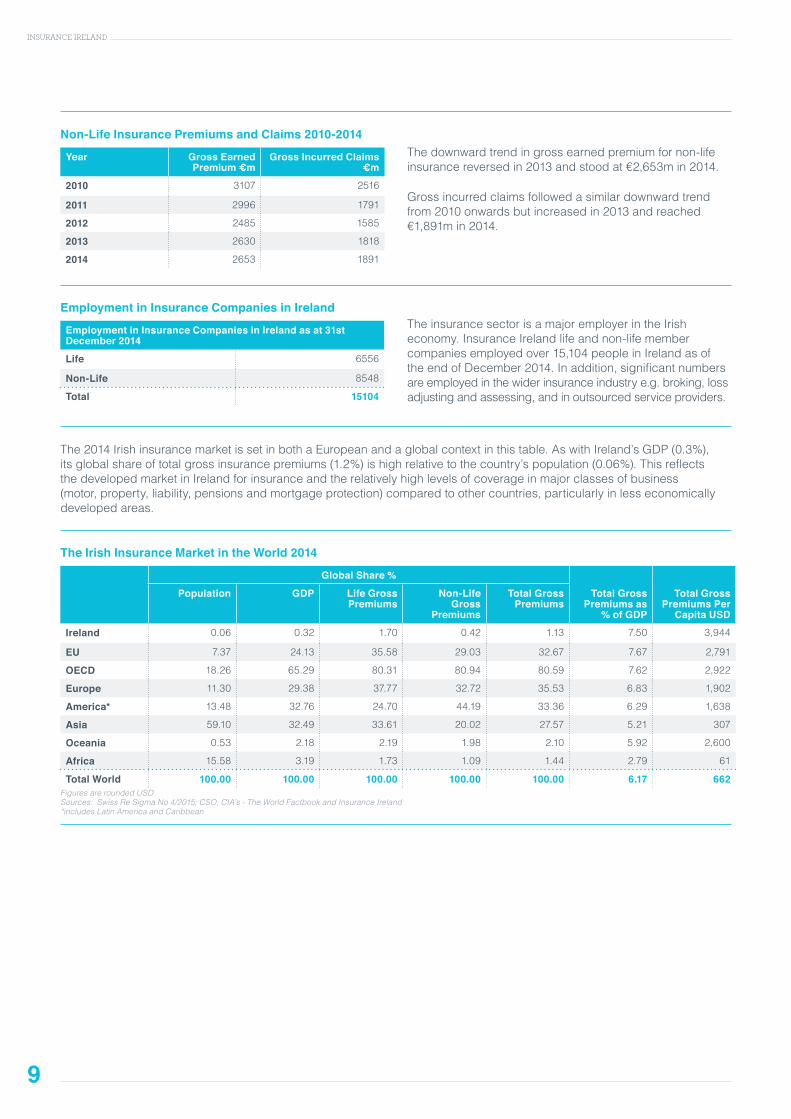
Non-Life Insurance Premiums and Claims 2010-2014
Year Gross Earned Premium €m
Gross Incurred Claims €m
2010 3107 2516
2011 2996 1791
2012 2485 1585
2013 2630 1818
2014 2653 1891
Thedownwardtrendingrossearnedpremiumfornon-lifeinsurancereversedin2013andstoodat€2,653min2014.
Grossincurredclaimsfollowedasimilardownwardtrendfrom2010onwardsbutincreasedin2013andreached€1,891min2014.
Employment in Insurance Companies in Ireland
Employment in Insurance Companies in Ireland as at 31st December 2014
Life 6556
Non-Life 8548
Total 15104
TheinsurancesectorisamajoremployerintheIrisheconomy.InsuranceIrelandlifeandnon-lifemembercompaniesemployedover15,104peopleinIrelandasoftheendofDecember2014.Inaddition,significantnumbersareemployedinthewiderinsuranceindustrye.g.broking,lossadjustingandassessing,andinoutsourcedserviceproviders.
The2014IrishinsurancemarketissetinbothaEuropeanandaglobalcontextinthistable.AswithIreland’sGDP(0.3%),itsglobalshareoftotalgrossinsurancepremiums(1.2%)ishighrelativetothecountry’spopulation(0.06%).ThisreflectsthedevelopedmarketinIrelandforinsuranceandtherelativelyhighlevelsofcoverageinmajorclassesofbusiness(motor,property,liability,pensionsandmortgageprotection)comparedtoothercountries,particularlyinlesseconomicallydevelopedareas.
The Irish Insurance Market in the World 2014
Global Share %
Population GDP Life Gross Premiums
Non-Life Gross
Premiums
Total Gross Premiums
Total Gross Premiums as
% of GDP
Total Gross Premiums Per
Capita USD
Ireland 0.06 0.32 1.70 0.42 1.13 7.50 3,944
EU 7.37 24.13 35.58 29.03 32.67 7.67 2,791
OECD 18.26 65.29 80.31 80.94 80.59 7.62 2,922
Europe 11.30 29.38 37.77 32.72 35.53 6.83 1,902
America* 13.48 32.76 24.70 44.19 33.36 6.29 1,638
Asia 59.10 32.49 33.61 20.02 27.57 5.21 307
Oceania 0.53 2.18 2.19 1.98 2.10 5.92 2,600
Africa 15.58 3.19 1.73 1.09 1.44 2.79 61
Total World 100.00 100.00 100.00 100.00 100.00 6.17 662Figures are rounded USDSources: Swiss Re Sigma No 4/2015; CSO; CIA’s - The World Factbook and Insurance Ireland*includes Latin America and Caribbean
10
INSURANCE IRELAND
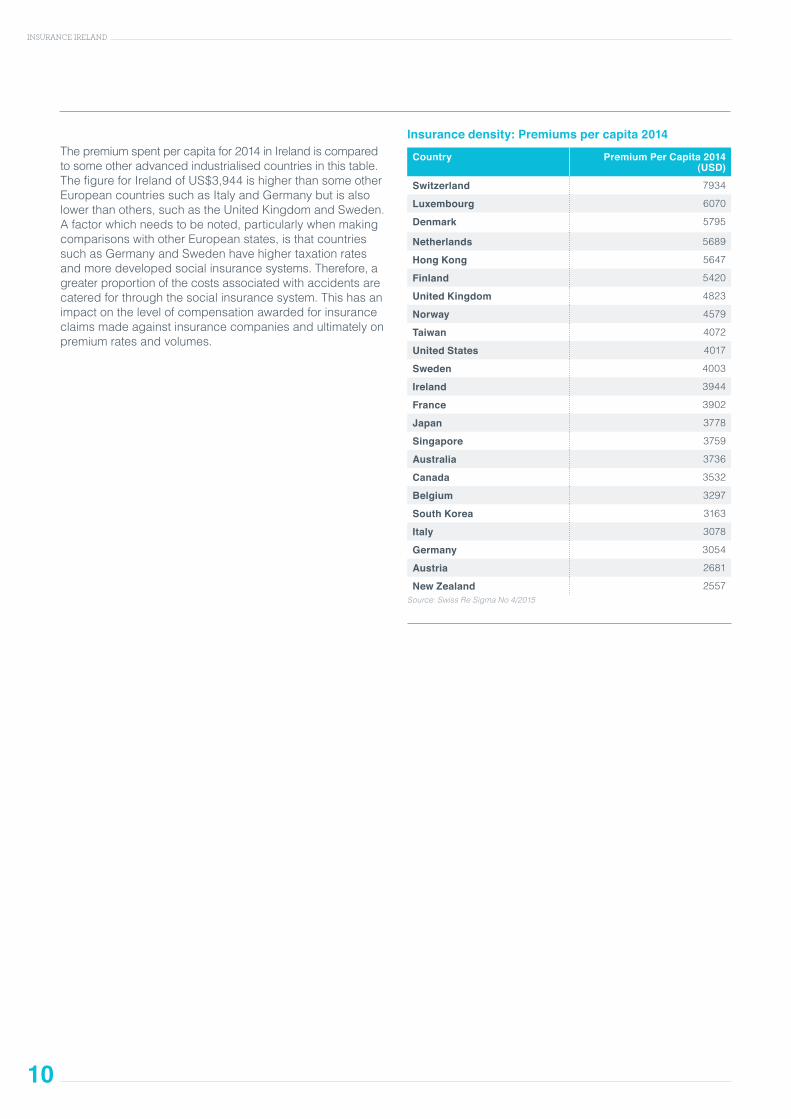
Thepremiumspentpercapitafor2014inIrelandiscomparedtosomeotheradvancedindustrialisedcountriesinthistable.ThefigureforIrelandofUS$3,944ishigherthansomeotherEuropeancountriessuchasItalyandGermanybutisalsolowerthanothers,suchastheUnitedKingdomandSweden.Afactorwhichneedstobenoted,particularlywhenmakingcomparisonswithotherEuropeanstates,isthatcountriessuchasGermanyandSwedenhavehighertaxationratesandmoredevelopedsocialinsurancesystems.Therefore,agreaterproportionofthecostsassociatedwithaccidentsarecateredforthroughthesocialinsurancesystem.Thishasanimpactonthelevelofcompensationawardedforinsuranceclaimsmadeagainstinsurancecompaniesandultimatelyonpremiumratesandvolumes.
Insurance density: Premiums per capita 2014
Country Premium Per Capita 2014 (USD)
Switzerland 7934
Luxembourg 6070
Denmark 5795
Netherlands 5689
Hong Kong 5647
Finland 5420
United Kingdom 4823
Norway 4579
Taiwan 4072
United States 4017
Sweden 4003
Ireland 3944
France 3902
Japan 3778
Singapore 3759
Australia 3736
Canada 3532
Belgium 3297
South Korea 3163
Italy 3078
Germany 3054
Austria 2681
New Zealand 2557Source: Swiss Re Sigma No 4/2015
GLOSSARY OF LIFE ASSURANCE TERMS
Annual/Regular Premium PolicyApolicyunderwhichthepolicyholdermakesannual/regularpaymentsofpremiumtofinancelifeassuranceprotectioncoverortobuildupaninvestmentorretirementfund.
Annual Premium Equivalent (APE)Anindustrystandardformulaforcalculatinglevelsofnewlifeandpensionsbusinessoveraperiodoftime,tosmoothouttheeffectoflarge,one-offpayments.It’sthetotalofnewannualpremiumsplus10%ofsinglepremiums.
Critical Illness InsuranceCriticalillnessinsurancepaysthepolicyholderanagreedsumifhe/shecontractsoneoftheseriousillnessesspecifiedinthepolicydocumentation.Typicalillnessescoveredincludecancer,stroke,heartattack,multiplesclerosisandkidneyfailure.
Industrial Branch BusinessThisreferstoregularpremiumprotectionbusinesswherethelifeassurancecompanyrepresentativecollectspremiums,usuallyonaweeklybasis.Theimportanceofthistypeofbusinesshasdeclinedovertheyears.
IntermediaryAnintermediaryisabrokeroragentwhoadvisesclientsabouttheirinsuranceneeds,helpsthemtoselectthemostappropriatepolicyandprovidesanongoingserviceinallsubsequentmattersrelatingtothepolicy.
Maturity ValueThisisthefinalvalueofasavingspolicyifitisallowedtorunforthefulltermspecifiedinthecontract.
Pensions/AnnuitiesFormanypeople,theincometheyreceivefromtheStateonretirementwillnotbesufficienttosupportthem.Forthisreason,increasingnumbersofpeoplehavechosentoprovidefortheirretirementsbytakingoutpensionswithalifeassurancecompany.Thisisusuallydonebywayofacontractwhere,inreturnforalumpsumoraseriesofregularpaymentstothelifeassurancecompany,thepolicyholderwillreceivearegularincomeatretirement.Thisregularincomeduringretirementiscalledan“annuity.”
Income Protection InsuranceIncomeProtectionInsurance(alsoknownasPermanentHealthInsurance)isaprotectionpolicythatprovidesanincomeifthepolicyholderisunabletoworkbecauseofsicknessordisability.Eachpolicyincludesa“deferredperiod”.Theindividualmustbeoffworkbecauseofillnessforlongerthanthedeferredperiodbeforeanincomeispayableunderthepolicy.Thedeferredperiodisusually13,26or52weeks.Coverisavailableonanindividualorgroupbasis(e.g.whereanemployerestablishesaschemeforemployees).
Personal Retirement Savings AccountsPersonalRetirementSavingsAccountswereintroducedasneweasyaccess,lowcost,andflexiblepersonalpensions,toencourageindividualswhohavenotalreadydonesotomakeaprovisionforretirement.
Single PremiumAlumpsumlifeinvestmentorpensionpolicyunderwhichthepolicyholdermakesaone-offpaymenttothelifeoffice.Thelifeofficeusesthemoneytoprovidelifeassuranceprotectionorinvestsitonthepolicyholder’sbehalfforrepayment,withinvestmentgains,attheendofthepolicyterm(orinthecaseofapension,purchasesretirementbenefitsforthepolicyholderatretirement).
Life Assurance and Pensions Market
11
INSURANCE IRELAND
2010–2014
12
INSURANCE IRELAND
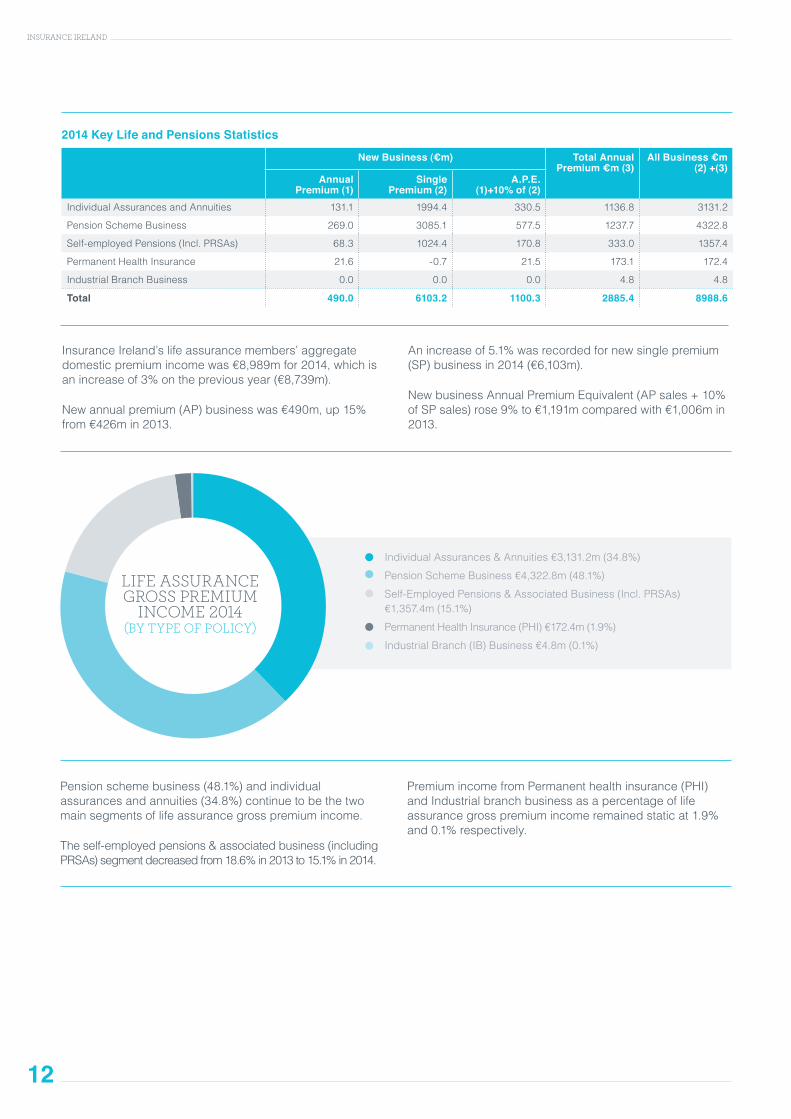
InsuranceIreland’slifeassurancemembers’aggregatedomesticpremiumincomewas€8,989mfor2014,whichisanincreaseof3%onthepreviousyear(€8,739m).
Newannualpremium(AP)businesswas€490m,up15%from€426min2013.
Anincreaseof5.1%wasrecordedfornewsinglepremium(SP)businessin2014(€6,103m).
NewbusinessAnnualPremiumEquivalent(APsales+10%ofSPsales)rose9%to€1,191mcomparedwith€1,006min2013.
LIFE ASSURANCE GROSS PREMIUM
INCOME 2014 (BY TYPE OF POLICY)
IndividualAssurances&Annuities€3,131.2m(34.8%)
PensionSchemeBusiness€4,322.8m(48.1%)
Self-EmployedPensions&AssociatedBusiness(Incl.PRSAs)€1,357.4m(15.1%)
PermanentHealthInsurance(PHI)€172.4m(1.9%)
IndustrialBranch(IB)Business€4.8m(0.1%)
2014 Key Life and Pensions Statistics
New Business (€m) Total Annual Premium €m (3)
All Business €m (2) +(3)
Annual Premium (1)
SinglePremium (2)
A.P.E. (1)+10% of (2)
IndividualAssurancesandAnnuities 131.1 1994.4 330.5 1136.8 3131.2
PensionSchemeBusiness 269.0 3085.1 577.5 1237.7 4322.8
Self-employedPensions(Incl.PRSAs) 68.3 1024.4 170.8 333.0 1357.4
PermanentHealthInsurance 21.6 -0.7 21.5 173.1 172.4
IndustrialBranchBusiness 0.0 0.0 0.0 4.8 4.8
Total 490.0 6103.2 1100.3 2885.4 8988.6
Pensionschemebusiness(48.1%)andindividualassurancesandannuities(34.8%)continuetobethetwomainsegmentsoflifeassurancegrosspremiumincome.
Theself-employedpensions&associatedbusiness(includingPRSAs)segmentdecreasedfrom18.6%in2013to15.1%in2014.
PremiumincomefromPermanenthealthinsurance(PHI)andIndustrialbranchbusinessasapercentageoflifeassurancegrosspremiumincomeremainedstaticat1.9%and0.1%respectively.
13
INSURANCE IRELAND
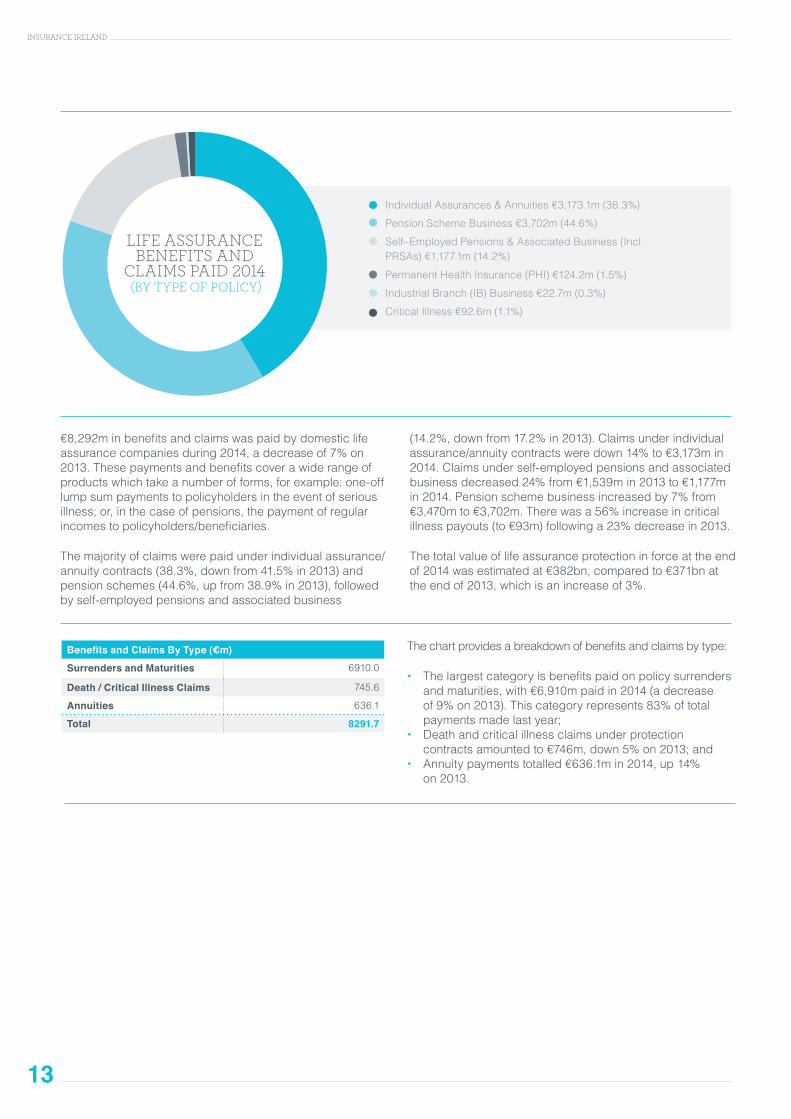
IndividualAssurances&Annuities€3,173.1m(38.3%)
PensionSchemeBusiness€3,702m(44.6%)
Self–EmployedPensions&AssociatedBusiness(Incl.PRSAs)€1,177.1m(14.2%)
PermanentHealthInsurance(PHI)€124.2m(1.5%)
IndustrialBranch(IB)Business€22.7m(0.3%)
CriticalIllness€92.6m(1.1%)
LIFE ASSURANCE BENEFITS AND
CLAIMS PAID 2014 (BY TYPE OF POLICY)
€8,292minbenefitsandclaimswaspaidbydomesticlifeassurancecompaniesduring2014,adecreaseof7%on2013.Thesepaymentsandbenefitscoverawiderangeofproductswhichtakeanumberofforms,forexample:one-offlumpsumpaymentstopolicyholdersintheeventofseriousillness;or,inthecaseofpensions,thepaymentofregularincomestopolicyholders/beneficiaries.
Themajorityofclaimswerepaidunderindividualassurance/annuitycontracts(38.3%,downfrom41.5%in2013)andpensionschemes(44.6%,upfrom38.9%in2013),followedbyself-employedpensionsandassociatedbusiness
(14.2%,downfrom17.2%in2013).Claimsunderindividualassurance/annuitycontractsweredown14%to€3,173min2014.Claimsunderself-employedpensionsandassociatedbusinessdecreased24%from€1,539min2013to€1,177min2014.Pensionschemebusinessincreasedby7%from€3,470mto€3,702m.Therewasa56%increaseincriticalillnesspayouts(to€93m)followinga23%decreasein2013.
Thetotalvalueoflifeassuranceprotectioninforceattheendof2014wasestimatedat€382bn,comparedto€371bnattheendof2013,whichisanincreaseof3%.
Benefits and Claims By Type (€m)
Surrenders and Maturities 6910.0
Death / Critical Illness Claims 745.6
Annuities 636.1
Total 8291.7
Thechartprovidesabreakdownofbenefitsandclaimsbytype:
• Thelargestcategoryisbenefitspaidonpolicysurrendersandmaturities,with€6,910mpaidin2014(adecreaseof9%on2013).Thiscategoryrepresents83%oftotalpaymentsmadelastyear;
• Deathandcriticalillnessclaimsunderprotectioncontractsamountedto€746m,down5%on2013;and
• Annuitypaymentstotalled€636.1min2014,up14%on2013.
14
INSURANCE IRELAND
Thechartprovidesabreakdownoftheproportionofnewbusinesswrittenthroughthevarioussaleschannels.In2014,brokers’newbusinessmarketshareincreasedby3percentagepointsto65%(havingdecreasedby1%in2013to62%)forannualpremium(AP)business,andby7percentagepointsforsinglepremium(SP)businessto41%.
Brokers’APpensionsbusinessincreasedby3%on2012to53%in2014.SPpensionsbusinessdippedin2013beforereturningto35%in2014.APforlifebusinessreducedmarginallyto12%andSPlifebusinessincreasedfrom4%to6%overthesameperiod.
Lifeofficeemployeesandcompanyrepresentatives(directsalesforces)sawtheirshareofAPincreaseby1%overthe
period(to15%),withtheirshareofSPbusinessincreasingfrom3%in2012to6%in2014.
Directsalesotherthanthroughemployedsalespeople(e.g.telephone,internetanddirectresponsesales)remainedbroadlystaticforAP,whilstSPdirectsalesfellbackto46%in2014.
Independentagents’APbusinessremainedstaticat2%,whiletheirSPbusinessreducedfrom1%to0%.
ThepercentageofAPbusinesswrittenthroughtiedagentsdecreasedfrom18%in2012to15%in2013,whileSPbusinesswrittenviatiedagentsdecreasedfrom7%in2012to5%in2013and2014.
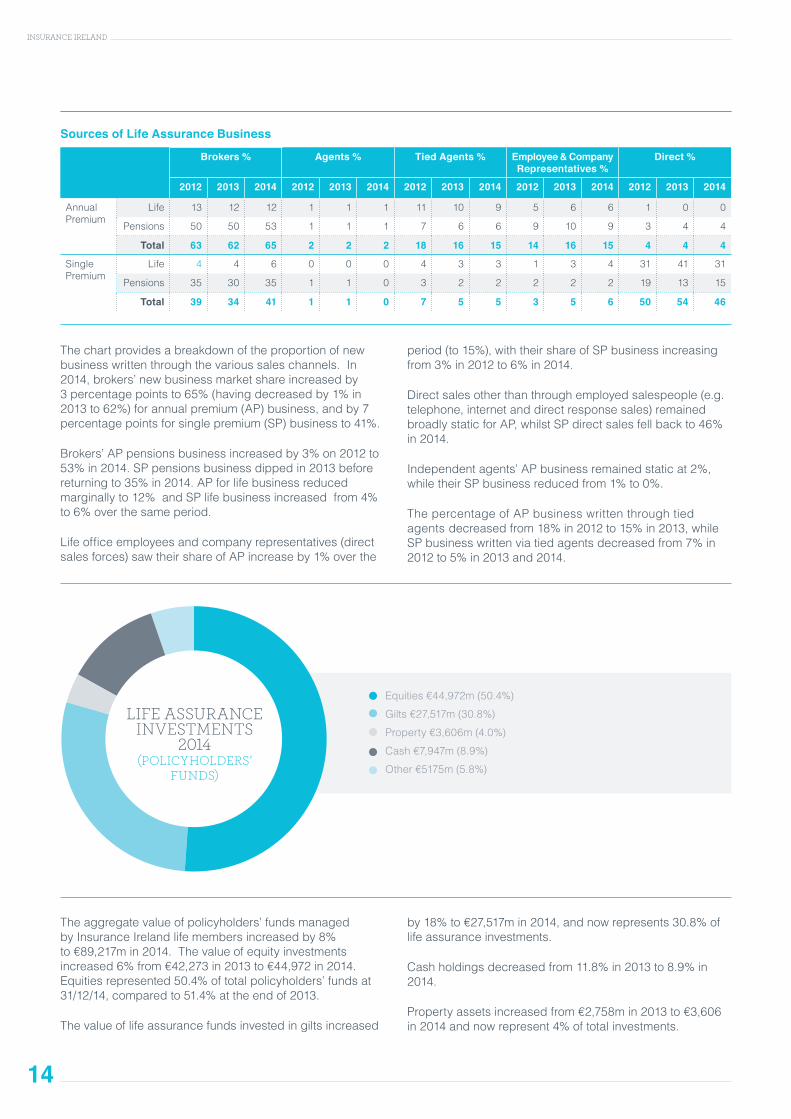
Equities€44,972m(50.4%)
Gilts€27,517m(30.8%)
Property€3,606m(4.0%)
Cash€7,947m(8.9%)
Other€5175m(5.8%)
LIFE ASSURANCE INVESTMENTS
2014 (POLICYHOLDERS’
FUNDS)
Theaggregatevalueofpolicyholders’fundsmanagedbyInsuranceIrelandlifemembersincreasedby8%to€89,217min2014.Thevalueofequityinvestmentsincreased6%from€42,273in2013to€44,972in2014.Equitiesrepresented50.4%oftotalpolicyholders’fundsat31/12/14,comparedto51.4%attheendof2013.
Thevalueoflifeassurancefundsinvestedingiltsincreased
by18%to€27,517min2014,andnowrepresents30.8%oflifeassuranceinvestments.
Cashholdingsdecreasedfrom11.8%in2013to8.9%in2014.
Propertyassetsincreasedfrom€2,758min2013to€3,606in2014andnowrepresent4%oftotalinvestments.
Sources of Life Assurance Business
Brokers % Agents % Tied Agents % Employee & Company Representatives %
Direct %
2012 2013 2014 2012 2013 2014 2012 2013 2014 2012 2013 2014 2012 2013 2014
AnnualPremium
Life 13 12 12 1 1 1 11 10 9 5 6 6 1 0 0
Pensions 50 50 53 1 1 1 7 6 6 9 10 9 3 4 4
Total 63 62 65 2 2 2 18 16 15 14 16 15 4 4 4
SinglePremium
Life 4 4 6 0 0 0 4 3 3 1 3 4 31 41 31
Pensions 35 30 35 1 1 0 3 2 2 2 2 2 19 13 15
Total 39 34 41 1 1 0 7 5 5 3 5 6 50 54 46
15
INSURANCE IRELAND
Market Trends 2010 – 2014
2010 €m 2011 €m 2012 €m 2013 €m 2014 €m Annual Change2010-2014 %
Premium Income (Annual Premium Business)
3541 3246 3172 2934 2885 -5.0
Premium Income (All Business)
9688 8486 8150 8739 8989 -1.9
New BusinessAnnualPremiums 529 448 434 426 490 -1.9
SinglePremiums 6147 5239 4978 5805 6103 -0.2
AnnualPremiumEquivalent(APE) 1143 972 931 1006 1100 -1.0
Benefits & Claims 8222 8736 8996 8923 8292 0.2
Life Assurance Premium Income 2010 – 2014
TotalPremiumIncome
NewBusiness(AnnualPremiumEquivalent)
10000
8000
6000
4000
2000
0
2010
2011
2012
2013
2014
€m
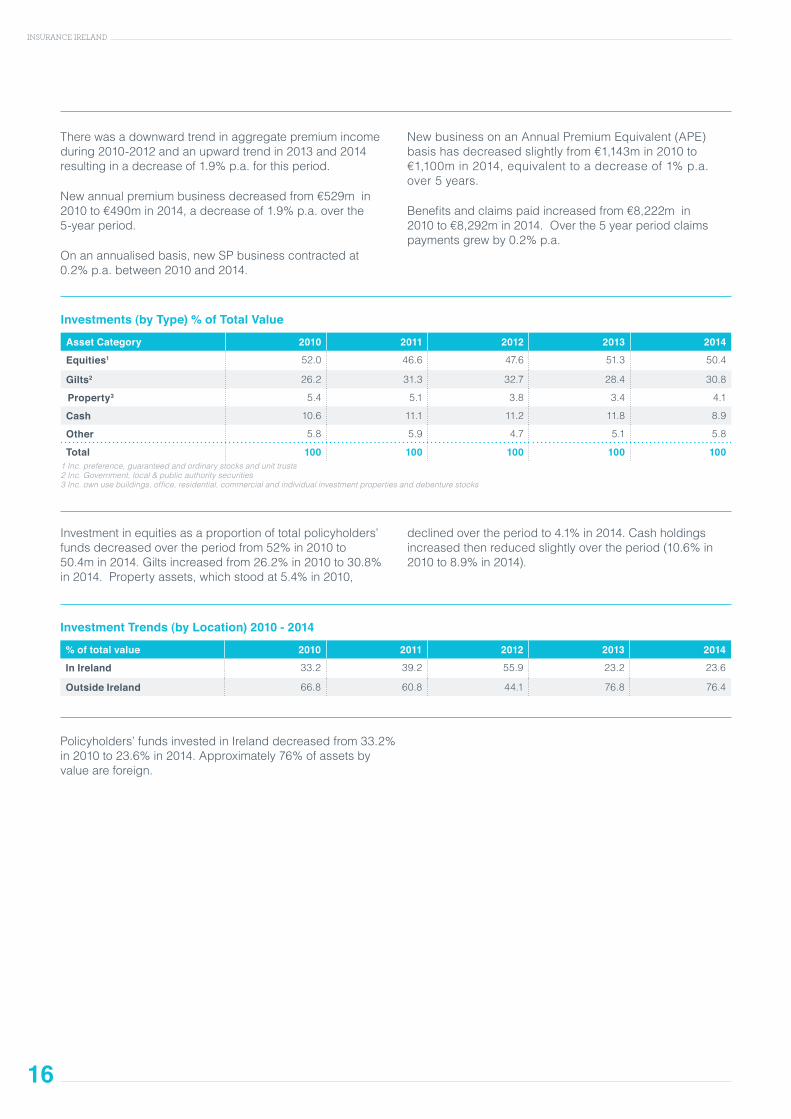
Thetableillustratesthebreakdownofinvestmentsbylocation.24%ofinvestmentswereinIrelandin2014.Thevalueofdomesticinvestmentsattheendof2014was€21,037m.Foreigninvestmentsin2014were€68,180m,76%oftotalinvestments.
40%ofIrishinvestmentsareinequities.10%areincash,
with16%ingilts.Propertyholdingswere12%ofIrishinvestmentsin2014.
54%oftheforeignholdingsareequities.Thesecondlargestforeignassetclassisgiltsat35%.Theproportionofforeignholdingsinvestedinpropertywas1.7%.Thepercentageinvestedincashwas8.6%in2014.
Investments (Policyholders’ funds) By Type & Location 2014
Irish €m Foreign €m Total €m
Equities1 8468 36504 44972
Gilts2 3405 24112 27517
Property3 2439 1167 3606
Cash 2054 5893 7947
Other 4671 504 5175
Total 21037 68180 892171 Inc. preference, guaranteed and ordinary stocks and unit trusts2 Inc. Government, local & public authority securities3 Inc. own use buildings, office, residential, commercial and individual investment properties and debenture stocks.
16
INSURANCE IRELAND
Investmentinequitiesasaproportionoftotalpolicyholders’fundsdecreasedovertheperiodfrom52%in2010to50.4min2014.Giltsincreasedfrom26.2%in2010to30.8%in2014.Propertyassets,whichstoodat5.4%in2010,
declinedovertheperiodto4.1%in2014.Cashholdingsincreasedthenreducedslightlyovertheperiod(10.6%in2010to8.9%in2014).
Investment Trends (by Location) 2010 - 2014
% of total value 2010 2011 2012 2013 2014
In Ireland 33.2 39.2 55.9 23.2 23.6
Outside Ireland 66.8 60.8 44.1 76.8 76.4
Policyholders’fundsinvestedinIrelanddecreasedfrom33.2%in2010to23.6%in2014.Approximately76%ofassetsbyvalueareforeign.
Investments (by Type) % of Total Value
Asset Category 2010 2011 2012 2013 2014
Equities1 52.0 46.6 47.6 51.3 50.4
Gilts2 26.2 31.3 32.7 28.4 30.8 Property3 5.4 5.1 3.8 3.4 4.1
Cash 10.6 11.1 11.2 11.8 8.9
Other 5.8 5.9 4.7 5.1 5.8
Total 100 100 100 100 1001 Inc. preference, guaranteed and ordinary stocks and unit trusts2 Inc. Government, local & public authority securities3 Inc. own use buildings, office, residential, commercial and individual investment properties and debenture stocks
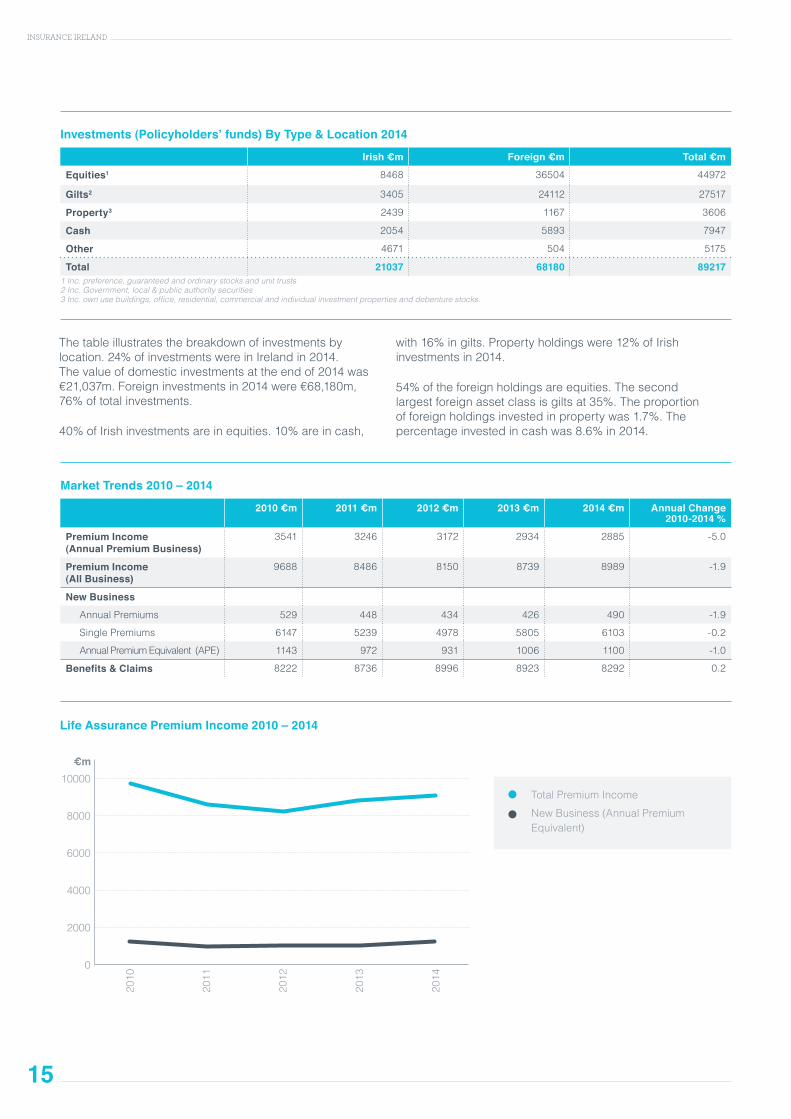
Therewasadownwardtrendinaggregatepremiumincomeduring2010-2012andanupwardtrendin2013and2014resultinginadecreaseof1.9%p.a.forthisperiod.
Newannualpremiumbusinessdecreasedfrom€529min2010to€490min2014,adecreaseof1.9%p.a.overthe5-yearperiod.
Onanannualisedbasis,newSPbusinesscontractedat0.2%p.a.between2010and2014.
NewbusinessonanAnnualPremiumEquivalent(APE)basishasdecreasedslightlyfrom€1,143min2010to€1,100min2014,equivalenttoadecreaseof1%p.a.over5years.
Benefitsandclaimspaidincreasedfrom€8,222min2010to€8,292min2014.Overthe5yearperiodclaimspaymentsgrewby0.2%p.a.
17
INSURANCE IRELAND
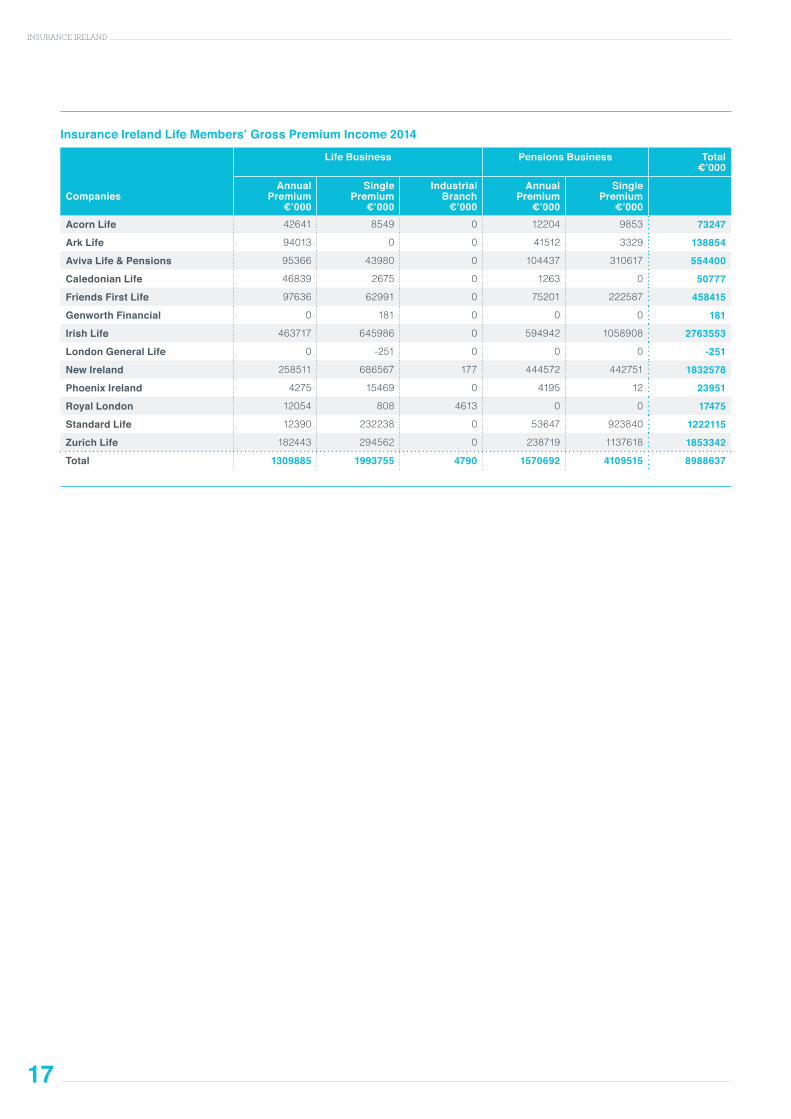
Insurance Ireland Life Members’ Gross Premium Income 2014
Life Business Pensions Business Total€’000
CompaniesAnnual
Premium €’000
SinglePremium
€’000
IndustrialBranch
€’000
Annual Premium
€’000
SinglePremium
€’000Acorn Life 42641 8549 0 12204 9853 73247
Ark Life 94013 0 0 41512 3329 138854
Aviva Life & Pensions 95366 43980 0 104437 310617 554400
Caledonian Life 46839 2675 0 1263 0 50777
Friends First Life 97636 62991 0 75201 222587 458415
Genworth Financial 0 181 0 0 0 181
Irish Life 463717 645986 0 594942 1058908 2763553
London General Life 0 -251 0 0 0 -251
New Ireland 258511 686567 177 444572 442751 1832578
Phoenix Ireland 4275 15469 0 4195 12 23951
Royal London 12054 808 4613 0 0 17475
Standard Life 12390 232238 0 53647 923840 1222115
Zurich Life 182443 294562 0 238719 1137618 1853342
Total 1309885 1993755 4790 1570692 4109515 8988637

18
INSURANCE IRELAND
Non-Life Insurance Market
GLOSSARY OF NON-LIFE INSURANCE TERMS
CommissionThemoneypaidouttoaninsuranceintermediaryinrecognitionofthebusinesswrittenbytheinsurerthroughtheagencyoftheintermediary.
Cost of Claims IncurredThetotalamountpaidoutinclaimsduringagivenperiod,plusthemovementintechnicalreservesduringthatperiod.Forexample,ifaninsurerpaysout€10minclaimsduring2014,andtechnicalreservesstoodat€50matthebeginningoftheyearandincreaseto€55mbytheendoftheyear,thentheinsurer’sclaimsincurredcostfor2014wouldbe€15m(€10m+€(55m-50m).
Investment IncomeIncomereceivedoninvestmentsPLUSgains/lossesrealisedondisposalofinvestmentsPLUSunrealisedgains/lossesovertheperiodinquestiononinvestmentsheldthroughouttheperiod.
Management ExpensesTheinternalexpensesofaninsurerincurredinacquiringandservicinginsurancebusiness.
Operating ResultAnon-lifeinsurer’sprofitorlossafteritsinvestmentincomehasbeenaddedtoitsunderwritingresult.
Gross and Net PremiumGrosspremiumisthetotalamountofpremiumincomeofaninsurer.Netpremiumisthepremiumretainedbytheinsurerafteritpaysforitsreinsuranceprotection.Similarly,grossclaimscostsarethetotalclaimscostsforwhichtheinsurerisliableunderthepoliciesitissues.Netclaimscoststakeaccountofreinsuranceclaimsrecoveriesduetotheinsurerfromitsreinsurers.
Written and Earned PremiumWrittenpremiumistheactualpremiumpaidbyapolicyholderforaninsurancepolicy.Earnedpremiumisthepremiumallocatedtotheactualexposuretoriskarisingduringaparticularperiod.Forexample,ifaninsurancecompanyissuesa12-monthpolicyforapremiumof€500on1stJanuary2014,thewrittenpremiumfor2014willbe€500,andsowilltheearnedpremium.Butifthesamepolicyisissuedon1stJuly2014,thewrittenpremiumwillbe€500,buttheearnedpremiumwillonlybe€250;theotherhalfofthepremiumwillbeallocatedtoanunearnedpremiumreservewhichwillbecreditedto2015earnedpremium.Thisisbecausehalfofthepremiumisinrespectoftheexposuretolossduringthefirsthalfof2015.
ReinsuranceInsuranceprotectionboughtbyaninsurertolimititsownexposure.Theavailabilityofreinsuranceprotectionallowsaninsurertoexpanditsowncapacitytotakeonrisk.Withoutareinsurancefacility,eachinsurerwouldbeabletoacceptlessbusiness.
Technical ReservesTheamountsinsurersholdagainstfuturepaymentofclaims.ThereissupervisorycontrolbytheCentralBankoftheproperestimationofoutstandingclaimsandthenatureandspreadofassetswhichcanbeusedtocovertechnicalreserves.
Underwriting ResultAnon-lifeinsurer’sunderwritingresultistheprofitorlossleftafterthecostofincurredclaims,managementexpenses,commissionsandothercostsaredeductedfromearnedpremiumincome.
2010–2014
19
INSURANCE IRELAND
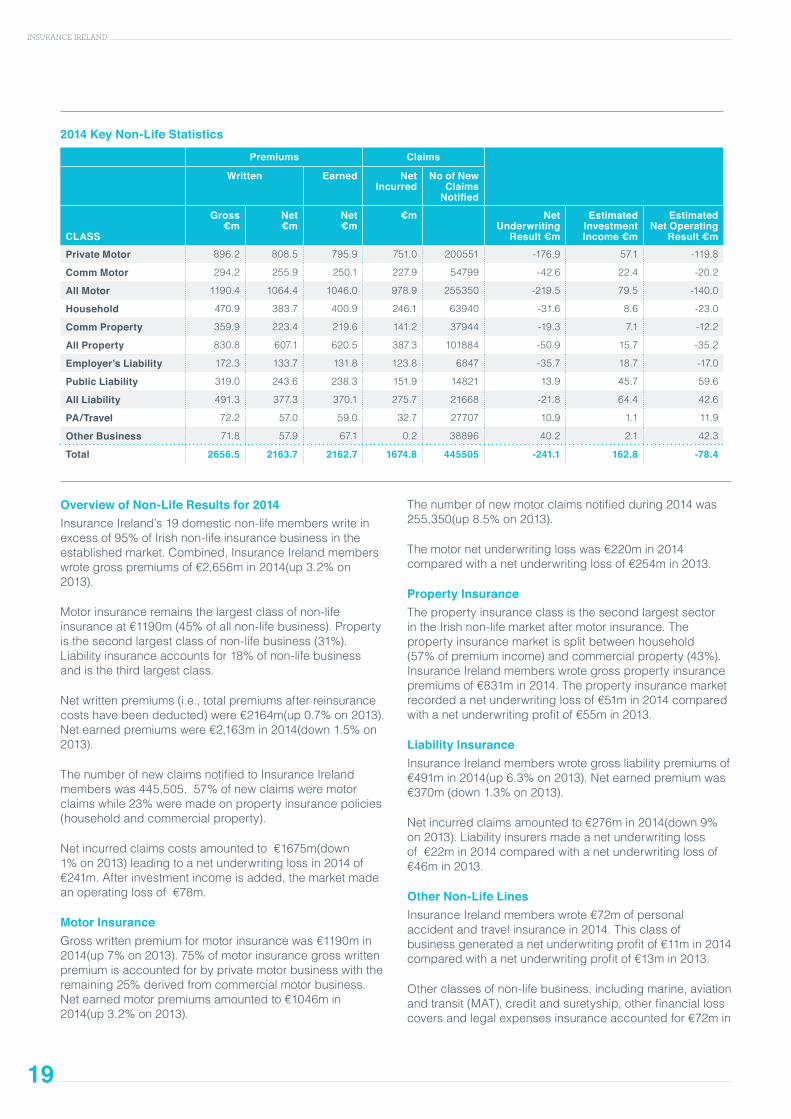
2014 Key Non-Life Statistics
Premiums Claims
Written Earned Net Incurred
No of New Claims
Notified
CLASS
Gross€m
Net€m
Net€m
€m NetUnderwriting
Result €m
Estimated Investment Income €m
Estimated Net Operating
Result €mPrivate Motor 896.2 808.5 795.9 751.0 200551 -176.9 57.1 -119.8
Comm Motor 294.2 255.9 250.1 227.9 54799 -42.6 22.4 -20.2
All Motor 1190.4 1064.4 1046.0 978.9 255350 -219.5 79.5 -140.0
Household 470.9 383.7 400.9 246.1 63940 -31.6 8.6 -23.0
Comm Property 359.9 223.4 219.6 141.2 37944 -19.3 7.1 -12.2
All Property 830.8 607.1 620.5 387.3 101884 -50.9 15.7 -35.2
Employer’s Liability 172.3 133.7 131.8 123.8 6847 -35.7 18.7 -17.0
Public Liability 319.0 243.6 238.3 151.9 14821 13.9 45.7 59.6
All Liability 491.3 377.3 370.1 275.7 21668 -21.8 64.4 42.6
PA/Travel 72.2 57.0 59.0 32.7 27707 10.9 1.1 11.9
Other Business 71.8 57.9 67.1 0.2 38896 40.2 2.1 42.3
Total 2656.5 2163.7 2162.7 1674.8 445505 -241.1 162.8 -78.4
Overview of Non-Life Results for 2014InsuranceIreland’s19domesticnon-lifememberswriteinexcessof95%ofIrishnon-lifeinsurancebusinessintheestablishedmarket.Combined,InsuranceIrelandmemberswrotegrosspremiumsof€2,656min2014(up3.2%on2013).
Motorinsuranceremainsthelargestclassofnon-lifeinsuranceat€1190m(45%ofallnon-lifebusiness).Propertyisthesecondlargestclassofnon-lifebusiness(31%).Liabilityinsuranceaccountsfor18%ofnon-lifebusinessandisthethirdlargestclass.
Netwrittenpremiums(i.e.,totalpremiumsafterreinsurancecostshavebeendeducted)were€2164m(up0.7%on2013).Netearnedpremiumswere€2,163min2014(down1.5%on2013).
ThenumberofnewclaimsnotifiedtoInsuranceIrelandmemberswas445,505.57%ofnewclaimsweremotorclaimswhile23%weremadeonpropertyinsurancepolicies(householdandcommercialproperty).
Netincurredclaimscostsamountedto€1675m(down1%on2013)leadingtoanetunderwritinglossin2014of€241m.Afterinvestmentincomeisadded,themarketmadeanoperatinglossof€78m.
Motor InsuranceGrosswrittenpremiumformotorinsurancewas€1190min2014(up7%on2013).75%ofmotorinsurancegrosswrittenpremiumisaccountedforbyprivatemotorbusinesswiththeremaining25%derivedfromcommercialmotorbusiness.Netearnedmotorpremiumsamountedto€1046min2014(up3.2%on2013).
Thenumberofnewmotorclaimsnotifiedduring2014was255,350(up8.5%on2013).
Themotornetunderwritinglosswas€220min2014comparedwithanetunderwritinglossof€254min2013.
Property InsuranceThepropertyinsuranceclassisthesecondlargestsectorintheIrishnon-lifemarketaftermotorinsurance.Thepropertyinsurancemarketissplitbetweenhousehold(57%ofpremiumincome)andcommercialproperty(43%).InsuranceIrelandmemberswrotegrosspropertyinsurancepremiumsof€831min2014.Thepropertyinsurancemarketrecordedanetunderwritinglossof€51min2014comparedwithanetunderwritingprofitof€55min2013.
Liability InsuranceInsuranceIrelandmemberswrotegrossliabilitypremiumsof€491min2014(up6.3%on2013).Netearnedpremiumwas€370m(down1.3%on2013).
Netincurredclaimsamountedto€276min2014(down9%on2013).Liabilityinsurersmadeanetunderwritinglossof€22min2014comparedwithanetunderwritinglossof€46min2013.
Other Non-Life LinesInsuranceIrelandmemberswrote€72mofpersonalaccidentandtravelinsurancein2014.Thisclassofbusinessgeneratedanetunderwritingprofitof€11min2014comparedwithanetunderwritingprofitof€13min2013.
Otherclassesofnon-lifebusiness,includingmarine,aviationandtransit(MAT),creditandsuretyship,otherfinanciallosscoversandlegalexpensesinsuranceaccountedfor€72min

20
INSURANCE IRELAND
grosswrittenpremiumin2014(down11%on2013).Theseclassesofbusinessproducedanetunderwritingprofitof€40min2014comparedwithanetunderwritingprofitof€21min2013.
Investing Non-Life Premium IncomeNon-lifeinsurers’technicalreservesaremainlyinvestedincashandgilts,withonlyapproximately23%investedin
equities.Thisisbecauseoftheneedforsecuritybalancedbyliquidityinordertomeetclaimsandothershort-termliabilities.Thisinvestmentapproachisincontrasttotheinvestmentportfoliosoflifeandpensionscompanies,whichareprincipallyinvestedinassetsthathistoricallygiveabetterlong-termreturn,inparticularequities.
INSURANCE OPERATING RATIOS
Non-Life Insurance Operating Ratios 2014
Claims Ratio % Commission Ratio % Management Expenses Ratio %
Combined Operating Ratio %
Total 77.4 10.8 22.9 111.1
Motor 93.6 6.7 20.2 120.5
Liability 74.5 10.9 19.9 105.3
Property 62.4 17.3 29.5 109.2
PA/Travel 55.4 1.4 25.7 82.5
Other 0.3 27.8 18.3 46.5
Anumberofkeyratiosareusedtoassessthecostofclaims,andtheefficiencyandprofitabilityofnon-lifeinsurancebusiness.
• Theclaims ratiomeasuresthecostofclaimsincurredasaproportionofpremiumsearned.In2014theInsuranceIrelandnon-lifemarketproducedanetclaimsratioof77%.Inotherwords,claimscost77centoutofevery€1earnedinpremium.Theclaimsratiovariedbetweensectors:inmotorinsuranceitwas94%whileinliabilityandpropertytheclaimsratiowas75%and62%respectively.
• Themanagement expensesandcommission ratios arecalculatedbycomparingtheinternalmanagementexpensesofinsurancecompaniesandcommissionspaidtointermediarieswithpremiums.In2014thenetcommissionratiowas11%andthenetmanagementexpensesratiowas23%.
• Thenet combinedoroperating ratiocombinestheclaims,commissionsandmanagementexpensesratios.Theoperatingratioforthenon-lifemarketwas111%in2014.Inotherwords,thismeantthatthenon-lifemarketmadealossof11centonunderwritinginsuranceforevery€1ofpremiumin2014.
Non-Life Insurance Market Results 2010 -2014
Gross Written Premium €m
Net Underwriting Result €m
Investment Income €m
Operating Result€m
Profit Premium %
2010 3702 -103 169 66 1.78
2011 3554 213 191 404 11.37
2012 3331 -87 278 191 5.73
2013 2993 -222 107 -116 -3.88
2014 2656 -241 163 -78 -2.94
5 Years 16236 -440 908 467 2.88
Sources: 2010-2013 data is taken from the Central Bank’s Insurance Statistics (2010 - 2013); and 2014 data - Insurance Ireland 1. The data for 2010-2013 is taken from the Central Bank’s Insurance Statistics (2010 - 2013). These publications contain returns for all insurers. The data for 2014 is based on data supplied by Insurance Ireland members. As the Insurance Statistics publications do not provide a breakdown for every class of business, the data in the seven subsequent charts has been created from data supplied by Insurance Ireland members for all years. This explains the discrepancies between the first and the seven subsequent charts.
21
INSURANCE IRELAND
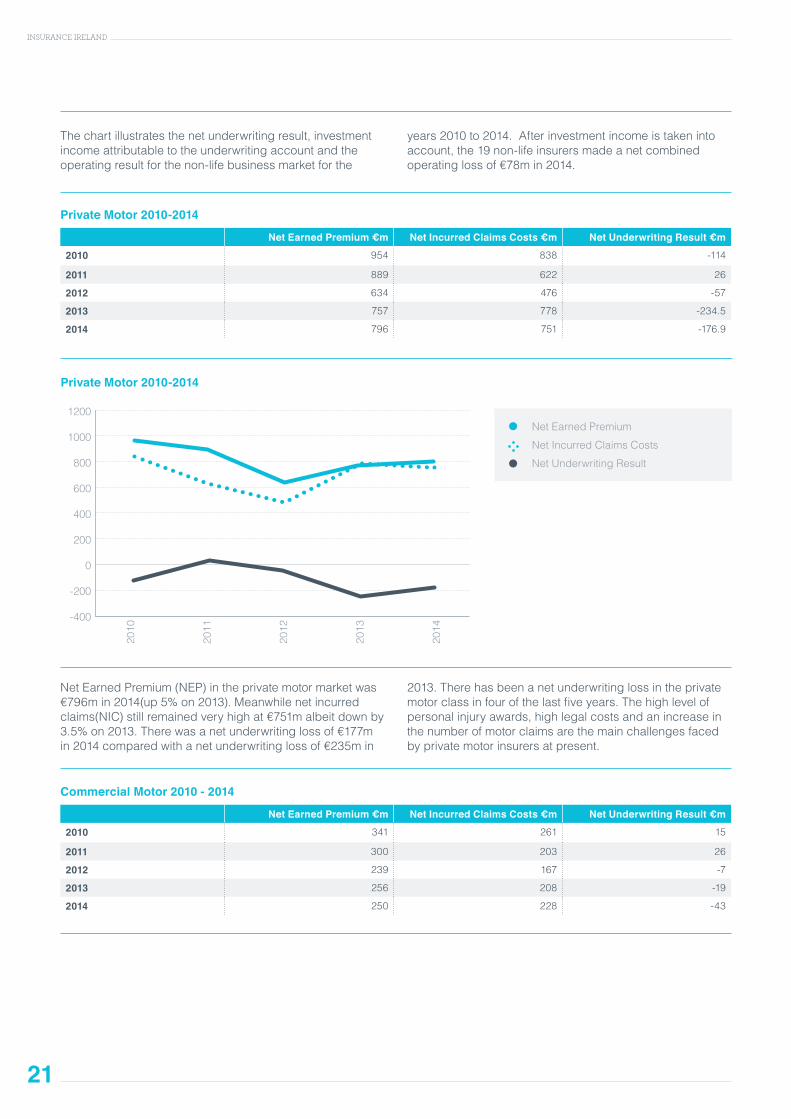
Thechartillustratesthenetunderwritingresult,investmentincomeattributabletotheunderwritingaccountandtheoperatingresultforthenon-lifebusinessmarketforthe
years2010to2014.Afterinvestmentincomeistakenintoaccount,the19non-lifeinsurersmadeanetcombinedoperatinglossof€78min2014.
Private Motor 2010-2014
Net Earned Premium €m Net Incurred Claims Costs €m Net Underwriting Result €m
2010 954 838 -114
2011 889 622 26
2012 634 476 -57
2013 757 778 -234.5
2014 796 751 -176.9
Commercial Motor 2010 - 2014
Net Earned Premium €m Net Incurred Claims Costs €m Net Underwriting Result €m
2010 341 261 15
2011 300 203 26
2012 239 167 -7
2013 256 208 -19
2014 250 228 -43
NetEarnedPremium(NEP)intheprivatemotormarketwas€796min2014(up5%on2013).Meanwhilenetincurredclaims(NIC)stillremainedveryhighat€751malbeitdownby3.5%on2013.Therewasanetunderwritinglossof€177min2014comparedwithanetunderwritinglossof€235min
2013.Therehasbeenanetunderwritinglossintheprivatemotorclassinfourofthelastfiveyears.Thehighlevelofpersonalinjuryawards,highlegalcostsandanincreaseinthenumberofmotorclaimsarethemainchallengesfacedbyprivatemotorinsurersatpresent.
1200
1000
800
600
400
200
0
-200
-400
2010
2011
2012
2013
2014
Private Motor 2010-2014
NetEarnedPremium
NetIncurredClaimsCosts
NetUnderwritingResult

22
INSURANCE IRELAND
400
350
300
250
200
150
100
50
0
-50
-100
2010
2011
2012
2013
2014
600
500
400
300
200
100
0
-100
-200
2010
2011
2012
2013
2014
Commercial Motor 2010 – 2014
Household 2010 – 2014
NetEarnedPremium
NetIncurredClaimsCosts
NetUnderwritingResult
NetEarnedPremium
NetIncurredClaimsCosts
NetUnderwritingResult
Netearnedpremiuminthecommercialmotorinsurancemarketfellby2.3%in2014comparedwith2013.Atthesametimenetincurredclaimsincreasedby10%overthesameperiodleadingtoanetunderwritinglossof€43min2014comparedwithanetunderwritinglossof
€19min2013.Therehasbeenanetunderwritinglossinthecommercialmotorclassinthreeofthelastfiveyearsandcommercialmotorinsurersarefacedwiththesamechallengesintheunderlyingclaimsenvironmentasprivatemotorinsurers.
Household 2010 – 2014Net Earned Premium €m Net Incurred Claims Costs €m Net Underwriting Result €m
2010 510 430 -83
2011 508 245 95
2012 415 194 59
2013 434 210 54
2014 401 246 -32
23
INSURANCE IRELAND
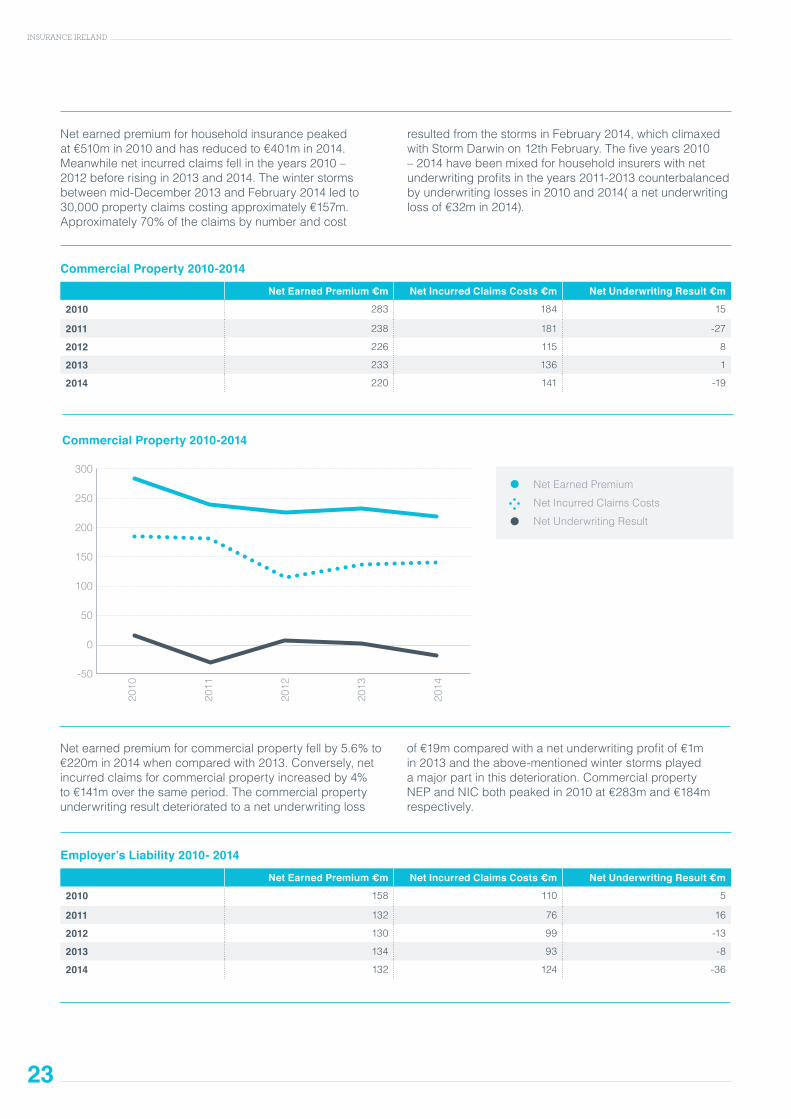
Commercial Property 2010-2014
Net Earned Premium €m Net Incurred Claims Costs €m Net Underwriting Result €m
2010 283 184 15
2011 238 181 -27
2012 226 115 8
2013 233 136 1
2014 220 141 -19
Employer’s Liability 2010- 2014
Net Earned Premium €m Net Incurred Claims Costs €m Net Underwriting Result €m
2010 158 110 5
2011 132 76 16
2012 130 99 -13
2013 134 93 -8
2014 132 124 -36
300
250
200
150
100
50
0
-50
2010
2011
2012
2013
2014
Commercial Property 2010-2014
NetEarnedPremium
NetIncurredClaimsCosts
NetUnderwritingResult
Netearnedpremiumforhouseholdinsurancepeakedat€510min2010andhasreducedto€401min2014.Meanwhilenetincurredclaimsfellintheyears2010–2012beforerisingin2013and2014.Thewinterstormsbetweenmid-December2013andFebruary2014ledto30,000propertyclaimscostingapproximately€157m.Approximately70%oftheclaimsbynumberandcost
resultedfromthestormsinFebruary2014,whichclimaxedwithStormDarwinon12thFebruary.Thefiveyears2010–2014havebeenmixedforhouseholdinsurerswithnetunderwritingprofitsintheyears2011-2013counterbalancedbyunderwritinglossesin2010and2014(anetunderwritinglossof€32min2014).
Netearnedpremiumforcommercialpropertyfellby5.6%to€220min2014whencomparedwith2013.Conversely,netincurredclaimsforcommercialpropertyincreasedby4%to€141moverthesameperiod.Thecommercialpropertyunderwritingresultdeterioratedtoanetunderwritingloss
of€19mcomparedwithanetunderwritingprofitof€1min2013andtheabove-mentionedwinterstormsplayedamajorpartinthisdeterioration.CommercialpropertyNEPandNICbothpeakedin2010at€283mand€184mrespectively.

24
INSURANCE IRELAND
Public Liability 2010-2014
Net Earned Premium €m Net Incurred Claims Costs €m Net Underwriting Result €m
2010 241 149 22
2011 235 125 45
2012 204 268 -128
2013 241 209 -38
2014 238 152 14
Netearnedpremiumforemployer’sliabilityhasbeenflatforthepastfouryears,fluctuatingbetween€130mand€134m.In2014NEPforemployer’sliabilityreducedby2%when
comparedwith2013.Thenetunderwritingresultdeterioratedtoanetunderwritinglossof€36mcomparedwithanetunderwritinglossof€8min2013.
Netearnedpremiumat€238mwasmarginally(1%)lowerin2014whencomparedwith2013.Aftertwoyears
ofunderwritinglossestherewasapublicliabilitynetunderwritingprofitin2014of€14m.
200
150
100
50
0
-50
2010
2011
2012
2013
2014
300
250
200
150
100
50
0
-50
-100
-150
2010
2011
2012
2013
2014
Employer’s Liability 2010- 2014
Public Liability 2010-2014
NetEarnedPremium
NetIncurredClaimsCosts
NetUnderwritingResult
NetEarnedPremium
NetIncurredClaimsCosts
NetUnderwritingResult

25
INSURANCE IRELAND
Other Classes 2010 – 2014
Net Earned Premium €m Net Incurred Claims Costs €m Net Underwriting Result €m
2010 216 125 18
2011 179 89 30
2012 165 82 19
2013 141 58 34
2014 126 33 51
Otherclassesofinsuranceincludepersonalaccident,travel,andfinanciallossinsurances.Netearnedpremiumshavereducedeachyearoverthefiveyearperiodtoalowof
€126min2014.Thenetunderwritingprofitforotherclassesincreasedto€51min2014from€34min2013.
250
200
150
100
50
0
2010
2011
2012
2013
2014
Other Classes 2010 – 2014
NetEarnedPremium
NetIncurredClaimsCosts
NetUnderwritingResult
26
INSURANCE IRELAND
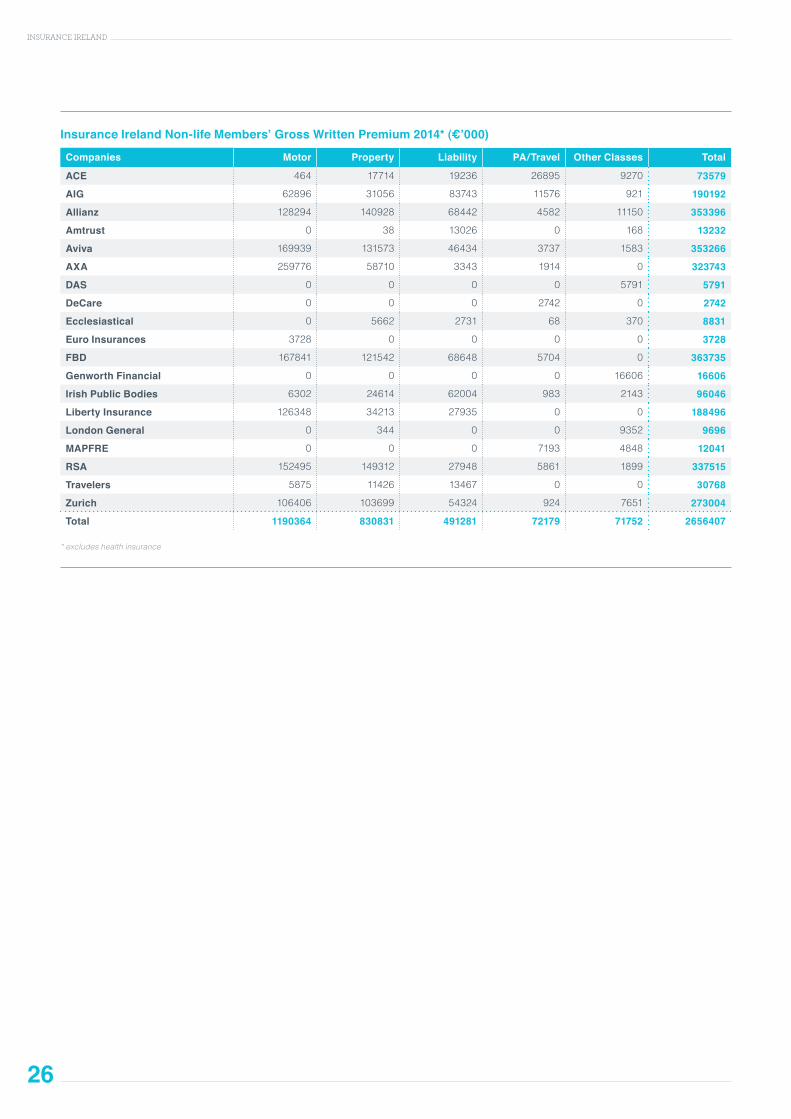
Insurance Ireland Non-life Members’ Gross Written Premium 2014* (€’000)
Companies Motor Property Liability PA/Travel Other Classes Total
ACE 464 17714 19236 26895 9270 73579
AIG 62896 31056 83743 11576 921 190192
Allianz 128294 140928 68442 4582 11150 353396
Amtrust 0 38 13026 0 168 13232
Aviva 169939 131573 46434 3737 1583 353266
AXA 259776 58710 3343 1914 0 323743
DAS 0 0 0 0 5791 5791
DeCare 0 0 0 2742 0 2742
Ecclesiastical 0 5662 2731 68 370 8831
Euro Insurances 3728 0 0 0 0 3728
FBD 167841 121542 68648 5704 0 363735
Genworth Financial 0 0 0 0 16606 16606
Irish Public Bodies 6302 24614 62004 983 2143 96046
Liberty Insurance 126348 34213 27935 0 0 188496
London General 0 344 0 0 9352 9696
MAPFRE 0 0 0 7193 4848 12041
RSA 152495 149312 27948 5861 1899 337515
Travelers 5875 11426 13467 0 0 30768
Zurich 106406 103699 54324 924 7651 273004
Total 1190364 830831 491281 72179 71752 2656407
* excludes health insurance
International Market
27
INSURANCE IRELAND
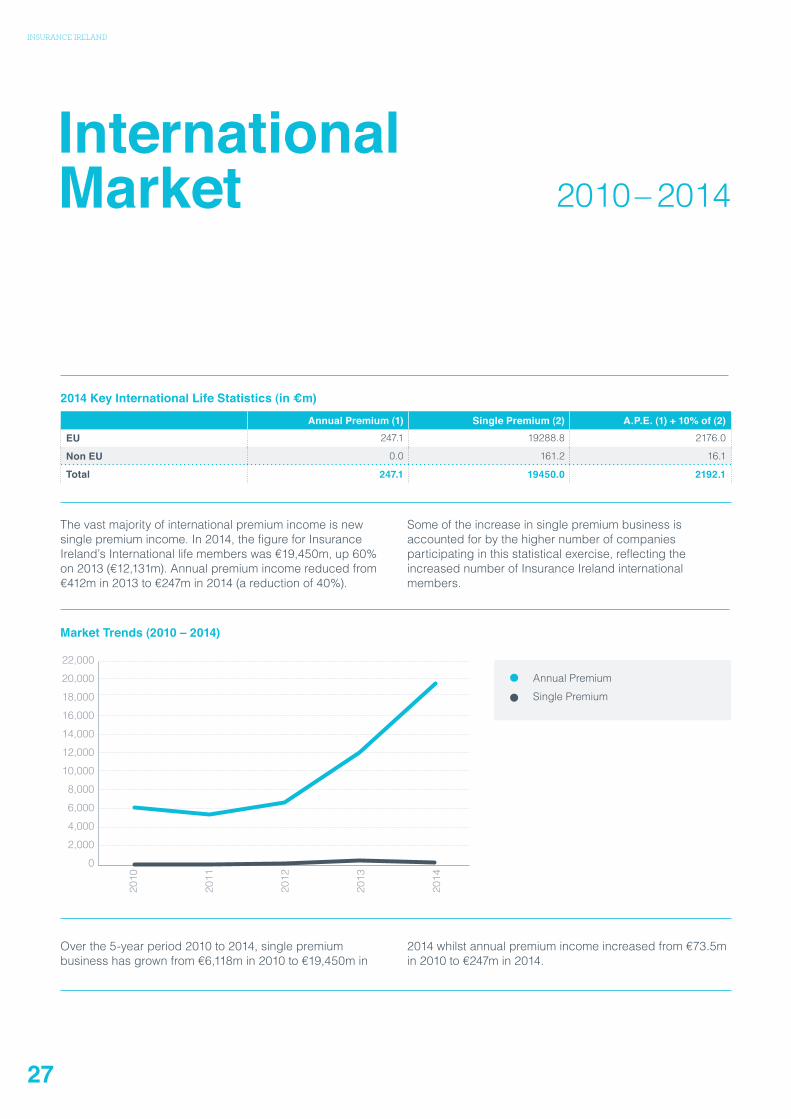
2014 Key International Life Statistics (in €m)
Annual Premium (1) Single Premium (2) A.P.E. (1) + 10% of (2)EU 247.1 19288.8 2176.0
Non EU 0.0 161.2 16.1
Total 247.1 19450.0 2192.1
Thevastmajorityofinternationalpremiumincomeisnewsinglepremiumincome.In2014,thefigureforInsuranceIreland’sInternationallifememberswas€19,450m,up60%on2013(€12,131m).Annualpremiumincomereducedfrom€412min2013to€247min2014(areductionof40%).
Someoftheincreaseinsinglepremiumbusinessisaccountedforbythehighernumberofcompaniesparticipatinginthisstatisticalexercise,reflectingtheincreasednumberofInsuranceIrelandinternationalmembers.
Overthe5-yearperiod2010to2014,singlepremiumbusinesshasgrownfrom€6,118min2010to€19,450min
2014whilstannualpremiumincomeincreasedfrom€73.5min2010to€247min2014.
22,000
20,000
18,000
16,000
14,000
12,000
10,000
8,000
6,000
4,000
2,000
0
2010
2011
2012
2013
2014
Market Trends (2010 – 2014)
AnnualPremium
SinglePremium
2010–2014
28
INSURANCE IRELAND
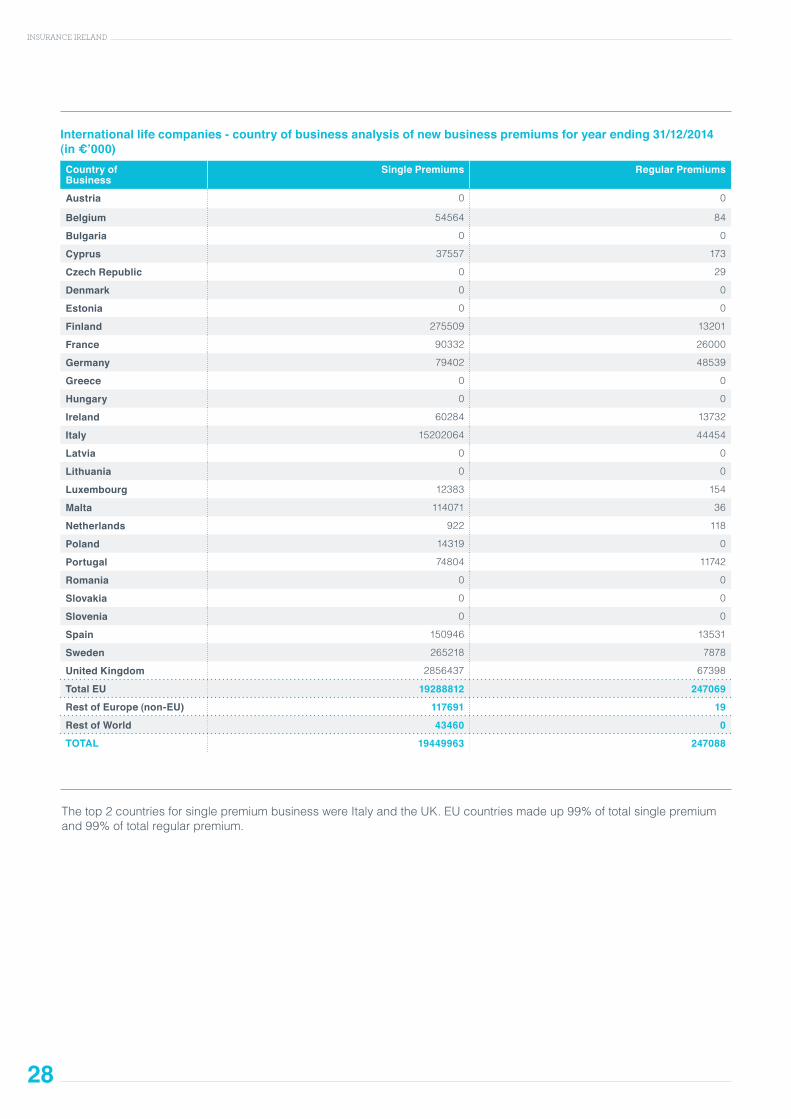
International life companies - country of business analysis of new business premiums for year ending 31/12/2014 (in €’000)Country of Business
Single Premiums Regular Premiums
Austria 0 0
Belgium 54564 84
Bulgaria 0 0
Cyprus 37557 173
Czech Republic 0 29
Denmark 0 0
Estonia 0 0
Finland 275509 13201
France 90332 26000
Germany 79402 48539
Greece 0 0
Hungary 0 0
Ireland 60284 13732
Italy 15202064 44454
Latvia 0 0
Lithuania 0 0
Luxembourg 12383 154
Malta 114071 36
Netherlands 922 118
Poland 14319 0
Portugal 74804 11742
Romania 0 0
Slovakia 0 0
Slovenia 0 0
Spain 150946 13531
Sweden 265218 7878
United Kingdom 2856437 67398
Total EU 19288812 247069
Rest of Europe (non-EU) 117691 19
Rest of World 43460 0
TOTAL 19449963 247088
Thetop2countriesforsinglepremiumbusinesswereItalyandtheUK.EUcountriesmadeup99%oftotalsinglepremiumand99%oftotalregularpremium.
29
INSURANCE IRELAND
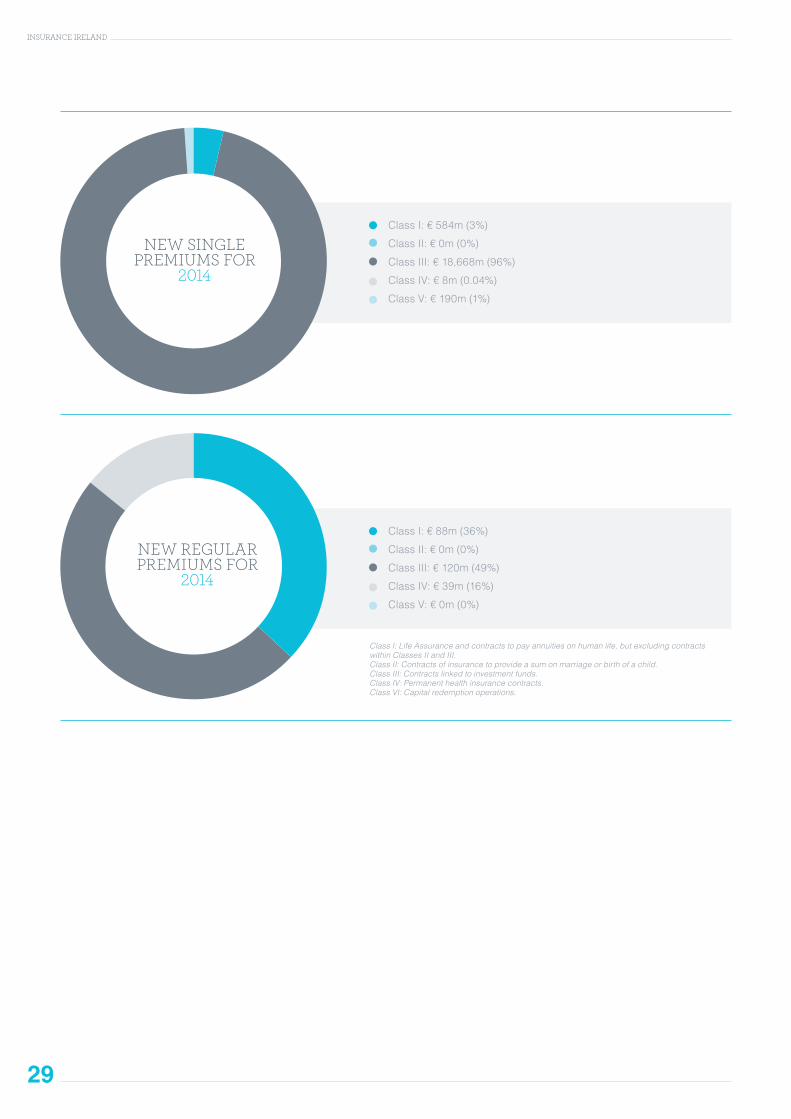
ClassI:€584m(3%)
ClassII:€0m(0%)
ClassIII:€18,668m(96%)
ClassIV:€8m(0.04%)
ClassV:€190m(1%)
ClassI:€88m(36%)
ClassII:€0m(0%)
ClassIII:€120m(49%)
ClassIV:€39m(16%)
ClassV:€0m(0%)
NEW SINGLE PREMIUMS FOR
2014
NEW REGULAR PREMIUMS FOR
2014
Class I: Life Assurance and contracts to pay annuities on human life, but excluding contracts within Classes II and III.Class II: Contracts of insurance to provide a sum on marriage or birth of a child.Class III: Contracts linked to investment funds.Class IV: Permanent health insurance contracts. Class VI: Capital redemption operations.
30
INSURANCE IRELAND
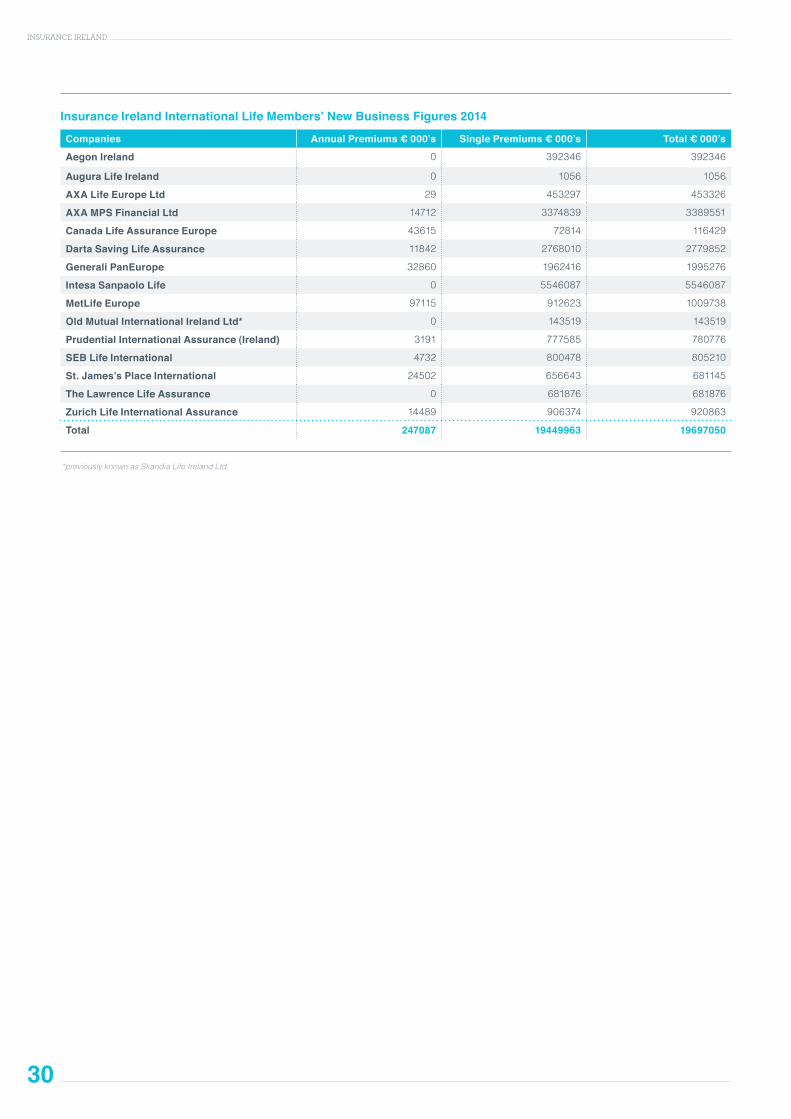
Insurance Ireland International Life Members’ New Business Figures 2014
Companies Annual Premiums € 000’s Single Premiums € 000’s Total € 000’s
Aegon Ireland 0 392346 392346
Augura Life Ireland 0 1056 1056
AXA Life Europe Ltd 29 453297 453326
AXA MPS Financial Ltd 14712 3374839 3389551
Canada Life Assurance Europe 43615 72814 116429
Darta Saving Life Assurance 11842 2768010 2779852
Generali PanEurope 32860 1962416 1995276
Intesa Sanpaolo Life 0 5546087 5546087
MetLife Europe 97115 912623 1009738
Old Mutual International Ireland Ltd* 0 143519 143519
Prudential International Assurance (Ireland) 3191 777585 780776
SEB Life International 4732 800478 805210
St. James’s Place International 24502 656643 681145
The Lawrence Life Assurance 0 681876 681876
Zurich Life International Assurance 14489 906374 920863
Total 247087 19449963 19697050
*previously known as Skandia Life Ireland Ltd.

Published:SEPTEMBER2015
MaterialfromFactfilemaybereproducedprovidedthesourceisfullyacknowledged.
DisclaimerThedatapublishedinthisreporthasbeencompiledfrominformationsuppliedbyInsuranceIrelandmembercompaniesunlessotherwiseindicated.Whileeveryefforthasbeenmadetoensuretheaccuracyofthecollatedinformation,InsuranceIrelanddoesnotacceptresponsibilityforerrorsoromissions.
InsuranceIreland,InsuranceCentre,5HarbourmasterPlace,IFSC,Dublin1,DO1E7E8
T:(01)6761820E:[email protected]:www.insuranceireland.eu
InsuranceIreland(MemberAssociation)LimitedtradingasInsuranceIrelandisalimitedliabilitycompany.RegisteredinIreland.No.553048.Registeredoffice:FirstFloor,5HarbourmasterPlace,IFSC,Dublin1,DO1E7E8