Embed Size (px)
Citation preview

3 4 4 5 6 0 3 5 5 0 7 2 5
T. E. Kent c. B. Scott
D. J. Peterson P. T. 5artton

. .- . . . . . . . . . . . . . . . . . . , . ..... ~ .~ ~~ ..

ORNupu-11877
OAK RIDGE NATIONAL, LABORATORY NONRADIOLOGICAL, WASTEWATER TREATMENT PLANT
OPTIMIZATION REPORT
Date Published: June 1991
T. E. Kent C. B. Scott
J. J. Maddox D. J. Peterson P. T. Barton
Prepared for Environmental Restoration and
Waste Management EW 3010250
Prepared by Oak Ridge National Laboratory
Oak Ridge, Tennessee 37831 managed by
Martin Marietta Energy System for the
U.S. Department of Energy under Contract No. DE-AC05-MOR2 1400
3 4 4 5 b 0 3 5 5 0 7 2 5


CONTENTS
FIGURES . . . . . . . . . . . . . . . . . . . . . . . . . . . . . . . . . . . . . . . . . . . . . . . . . . . . . . . . . . . . . . . v
TABLES . . . . . . . . . . . . . . . . . . . . . . . . . . . . . . . . . . . . . . . . . . . . . . . . . . . . . . . . . . . . . . . . vi
1 . INTRODUCTION . . . . . . . . . . . . . . . . . . . . . . . . . . . . . . . . . . . . . . . . . . . . . . . . . . . 1
1.1HISTORY . . . . . . . . . . . . . . . . . . . . . . . . . . . . . . . . . . . . . . . . . . . . . . . . . . . . . . 1 1.2 FACILITY DESIGN BASIS . . . . . . . . . . . . . . . . . . . . . . . . . . . . . . . . . . . . . . . . 2 1.3 FACILITY DESCRIPTION ......................................... 4 1.4 PERMIT REQUIREMENTS ........................................ 7
2 . OPERATIONAL OBSERVATIONS AND OPTIMIZATION ACTIVITIES . . . . . . . 11
2.1START-UP . . . . . . . . . . . . . . . . . . . . . . . . . . . . . . . . . . . . . . . . . . . . . . . . . . . . . 11 2.2 EQUALIZATION TANKS . . . . . . . . . . . . . . . . . . . . . . . . . . . . . . . . . . . . . . . . . 13 2.3 SODIUM HYDROXIDE AND SULFURIC ACID FEED SYSTEMS . . . . . . . . . 17 2.4 HEAVY METALS REMOVAL SYSTEM .............................. 18
2.6 DUAL MEDIA FILTERS . . . . . . . . . . . . . . . . . . . . . . . . . . . . . . . . . . . . . . . . . . 26 2.7 AIR STRIPPER . . . . . . . . . . . . . . . . . . . . . . . . . . . . . . . . . . . . . . . . . . . . . . . . . . 34 2.8 GAC SYSTEM . . . . . . . . . . . . . . . . . . . . . . . . . . . . . . . . . . . . . . . . . . . . . . . . . . . 35 2.9 EFFLUENT TANK . . . . . . . . . . . . . . . . . . . . . . . . . . . . . . . . . . . . . . . . . . . . . . . 47
2.5 FILTER PRESS . . . . . . . . . . . . . . . . . . . . . . . . . . . . . . . . . . . . . . . . . . . . . . . . . . 25
3 . MAINTENANCE. SAFETY. AND TRAINING ACTIVITIES . . . . . . . . . . . . . . . . . 47
3.1MAINTENANCE . . . . . . . . . . . . . . . . . . . . . . . . . . . . . . . . . . . . . . . . . . . . . . . . . 47 3.2sAFETY . . . . . . . . . . . . . . . . . . . . . . . . . . . . . . . . . . . . . . . . . . . . . . . . . . . . . . . 50 3.3 TRAINING . . . . . . . . . . . . . . . . . . . . . . . . . . . . . . . . . . . . . . . . . . . . . . . . . . . . . 51
4 . OPERATIONAL DATA AND ANALYTICAL RESULTS .................... 51
4.1 GENERAL SYSTEM MONITORING ................................ 51 4.2 HYDRAULIC LOADING . . . . . . . . . . . . . . . . . . . . . . . . . . . . . . . . . . . . . . . . . . 52 4.3 CHEMICAL USAGE AND SLUDGE GENERATION .................... 52 4.4 PLANT INFLUENT AND EFFLUENT CONTAMINANT LEVELS . . . . . . . . . 52 4.5 REACTOR CLARIFIER PERFORMANCE SAMPLING . . . . . . . . . . . . . . . . . . 61 4.6 AIR STRIPPER SAMPLING . . . . . . . . . . . . . . . . . . . . . . . . . . . . . . . . . . . . . . . 64 4.7 GAC SYSTEM SAMPLING . . . . . . . . . . . . . . . . . . . . . . . . . . . . . . . . . . . . . . . . 65 4.8 SLUDGESAMPLING . . . . . . . . . . . . . . . . . . . . . . . . . . . . . . . . . . . . . . . . . . . . . 66 4.9 EFFLUENT TOXICITY MONITORING . . . . . . . . . . . . . . . . . . . . . . . . . . . . . . 66
... 111

CONTENTS (Cont’d)
5 . DESIGN IMPROVEMENTS AND FUTURE ACTIVITIES . . . . . . . . . . . . . . . . . . . 67
5.1 PHASE 1 IMPROVEMENTS . . . . . . . . . . . . . . . . . . . . . . . . . . . . . . . . . . . . . . . 67 5.2 SULFURIC ACID SYSTEM . . . . . . . . . . . . . . . . . . . . . . . . . . . . . . . . . . . . . . . . 67 5.3 IMPROVEMENT OF TRANSFER PUMP BASE STRUCTURES . . . . . . . . . . . 68 5.4 EQUIPMENT ACCESS IMPROVEMENTS AND ROOF DRAIN
REROUTING . . . . . . . . . . . . . . . . . . . . . . . . . . . . . . . . . . . . . . . . . . . . . . . . . . . 68 5.5 REACTOR CLARIFIER MODIFICATIONS . . . . . . . . . . . . . . . . . . . . . . . . . . . 69
6 . SUMMARY AND CONCLUSIONS . . . . . . . . . . . . . . . . . . . . . . . . . . . . . . . . . . . . . 69
7 . REFERENCES . . . . . . . . . . . . . . . . . . . . . . . . . . . . . . . . . . . . . . . . . . . . . . . . . . . . . 70
iv

FIGURES
Page
1.1 NRWTP process flow diagram . . . . . . . . . . . . . . . . . . . . . . . . . . . . . . . . . . . . . . . . . 5
4.1 3608checksheet . . . . . . . . . . . . . . . . . . . . . . . . . . . . . . . . . . . . . . . . . . . . . . . . . . . 53
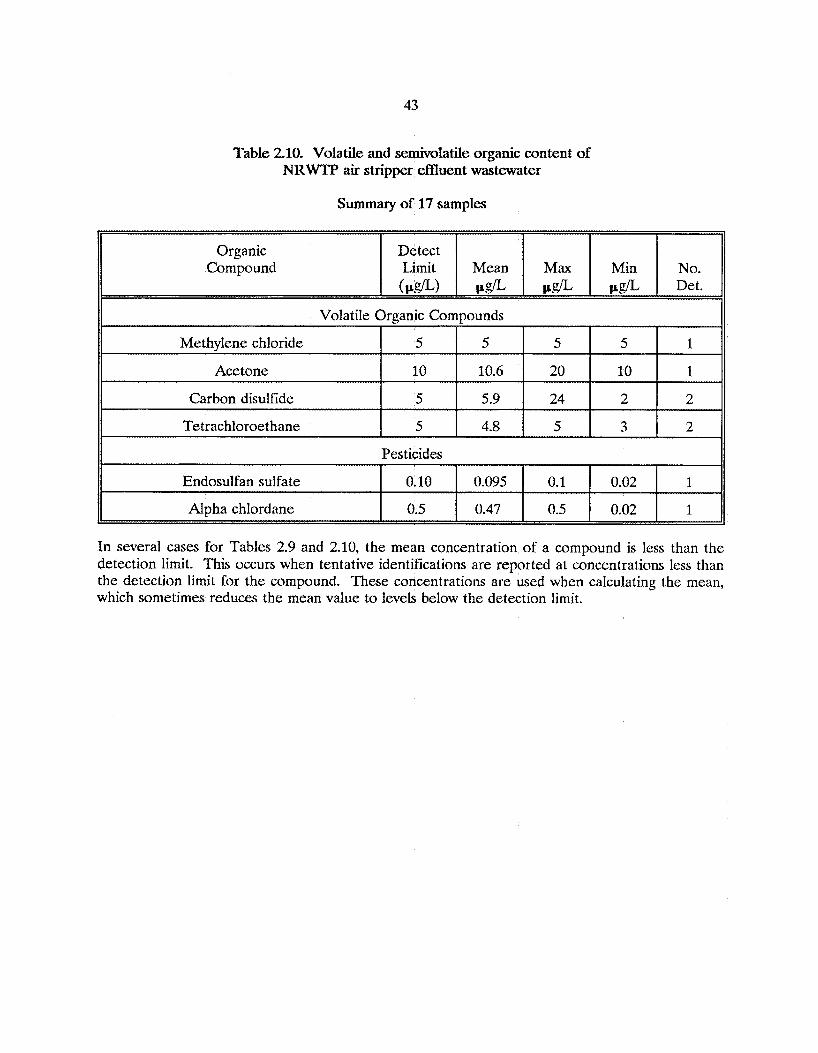
4.2 3608 shift checks . . . . . . . . . . . . . . . . . . . . . . . . . . . . . . . . . . . . . . . . . . . . . . . . . . . 54
4.3 GAC columns (log sheet) . . . . . . . . . . . . . . . . . . . . . . . . . . . . . . . . . . . . . . . . . . . . . 55
4.4 Non-rad pump discharge pressure (log sheet) . . . . . . . . . . . . . . . . . . . . . . . . . . . . . . 56
V

TABLES
Page
1.1
1.2
2.2
2.3
2.4
2.5
2.6
2.7
2.8
2.9
2.10
2.11
2.12
ORNL NPDES permit no. TN0002941 effluent limits foroutfallX12 . . . . . . . . . . . . . . . . . . . . . . . . . . . . . . . . . . . . . . . . . . . . . . . . . . . . 8, 9
ORNL NPDES permit application no. TN0002941 proposed effluent limits for outfall X12 . . . . . . . . . . . . . . . . . . . . . . . . . . . . . . . . . 10
NRWTP effluent radiological content . . . . . . . . . . . . . . . . . . . . . . . . . . . . . . . . . . . 16
NRWTP reactor clarifier influent and effluent metals concentrations . . . . . . . . . . . . . . . . . . . . . . . . . . . . . . . . . . . . . . . . . . . . . . 21, 22
NRWTP reactor clarifier performance - removal rate of selected metals . . . . . . . . . . . . . . . . . . . . . . . . . . . . . . . . . . . . . . . . . . . . . . 23
Comparison of NRWTP reactor clarifier performance for batch and continuous treatment of metals wastewater . . . . . . . . . . . . . . . . . . . . . . . . . . . . . . . . . . . . . . . . . . . . . . . . . 24
NRWTP metals sludge EP tox analysis and other characeristics (Sample 1 taken 3/20/90) . . . . . . . . . . . . . . . . . . . . . . . . . . . . . . . . . 27, 28
NRWTP metals sludge E P tox analysis and other characeristics (Sample 2 taken 3/20/90) . . . . . . . . . . . . . . . . . . . . . . . . . . . . . . . . . 29, 30
NRWTP metals sludge EP tox analysis and other characteristics (Sample 3 taken 6120190) . . . . . . . . . . . . . . . . . . . . . . . . . . . . . . . . 31, 32
List of volatile and semivolatile organics analyzed for evaluation of NRWTP air stripper and GAC system performance . . . . . . . . . . . . . . . . . . . . . . . . . . . . . . . . . . . . . . . 36-41
Volatile and semivolatile organic content of NRWTP air stripper feed wastewater . . . . . . . . . . . . . . . . . . . . . . . . . . . . . . . . . . . 42
Volatile and semivolatile organic content of NRWTF' air stripper effluent wastewater . . . . . . . . . . . . . . . . . . . . . . . . . . . . . . . . 43
Volatile and semivolatile organic content of NRWTP GAC lead column feed wastewater . . . . . . . . . . . . . . . . . . . . . . . . . . . . . 45
Volatile and scmivolatile organic content of NRWTP GAC lead column effluent wastewater . . . . . . . . . . . . . . . . . . . . . . . . . . . 45
vi

TABLES (continued)
2.13 Volatile and semivolatile organic content of NRWTP GAC lag column effluent wastewater ............................ 46
2.14 NRWTP GAC system mercury removal data ............................. 46
3.1 Significant NRWTP maintenance activities from January 1990 to March 1991 . . . . . . . . . . . . . . . . . . . . . . . . . . . . . . . . . . . . 4s. 49
4.1 NRWTP monthly wastewater flows . . . . . . . . . . . . . . . . . . . . . . . . . . . . . . . . . . . . . 57
4.2 Metals content of NRWTP non-metals wastewater ......................... 59
4.3 Metals content of NRWTP effluent wastewater ........................... 60
4.4 Volatile and semivolatile organic content of NRWTP plant feed wastewater ....................................... 62
4.5 Volatile and semivolatile organic content of NRWTP effluent wastewater . . . . . . . . . . . . . . . . . . . . . . . . . . . . . . . . . . . . . . . . . 63
vii


1
1. INTRODUCTION
1.1 HISTORY
Oak Ridge National Laboratory (ORNL), in Oak Ridge, Tennessee, is operated by Martin
Marietta Energy Systems, Inc. for the United States Department of Energy (DOE). The primary
missions of ORNL are:
1) Conduct applied research and engineering development in support of the Department of
Energy's programs in fusion, fission, conservation, fossil, and other energy technologies; and
to perform basic scientific research in selected areas of the physical and life sciences.
2) Operate "user facilities" for the benefit of researchers in universities and private industry,
transfer science and technology to U.S. industry and universities, provide educational
programs to help prepare the future scientific and technical work force, and supply
radioactive isotopes that are not commercially available.
In carrying out these missions, various dilute liquid process wastewater streams are generated.
For many years, non-radiological process wastewater streams which mainly consist of once-through
cooling water underwent little or no treatment and were discharged directly to White Oak Creek
(WOC). WOC flows across ORNL in a south-westerly direction and empties into the Clinch Rivcr.
However, since the non-radiological process waste streams could potentially contain small quantities
of organic and heavy metal pollutants, it was determined by the US Environmental Protection Agency
(EPA) and the Tennessee Department of Health and Environment (TDHE) that the discharge of
many of the process waste streams into WOC was not in compliance with state and federal
environmental regulations. The Non-radiological Wastewater Treatment Project (NRWTP) was
conceived as a means of collecting and treating non-radiological process wastewaters fram a variety
of outfalls and complying with the Clean Water Act's National Pollutant Discharge Elimination
System (NPDES) regulations.

2
The conceptual design report' for the NRWTP was completed in May, 1985. The design
criteria2 for defining functional/systcm requirements for the NRWTP was completed in July, 1985.
To resolve some of the design uncertainties facing thc wastewater treatment systems of the NRWTP,
the Environmental Control Technology (ECT) group of the Chemical Tcchnology Division performed
a pilot-plant treatability stud?. The results of the study were published in ORNL/TM-10046 on July
1986.
Final design and equipment selection for the NRWTP was completed on January 30, 1987
and construction began on February 4, 1987. Construction of the wastewater collection and
treatment facilities was completed on August 31, 1989. By January 8,1990, preoperational equipment
checks were complete and chemical testing began. On February 3, 1990, chemical testing of the
system was complete and approval was received by the ORNL Readiness Review Committee and thc
Environmental & Health Protection Division to began processing wastewater. The facility was
opcrated effectively during February and March. On February 8, 1990, a Readiness Review Team
from DOE-Oak Ridge Operations (DOE-ORO) was established to evaluate the plant during the final
phasc of testing. Their review resulted in several recommendations for improvement at the NRWTP;
nonc of which were considered to have an impact on the start-up date of the facility. Official
permission was granted by DOE-OR0 to place the NRWTP in full operational service on March 30,
1990. With this startup date, the NRWTP successfully met the Compliance-Level-Attained date of
March 31, 1990, mandated by the Federal Facility Compliance Agreement (FFCA).
The facility has operated under a one year evaluation period as specified in the NPDES
permit. During the evaluation period, operation of the plant has been monitored and adjusted to
optimize treatment performance. This report is intended to provide documentation of efforts to
evaluate and optimize NRWTP performance and present the results obtained for submittal to the
TDHE and EPA.
1.2 FACILITTY DESIGN BASIS
The NRWTP was designed to remove heavy metals and toxic organic compounds from process
wastewaters generated at various ORNL facilities. A maximum flow of 760 gallons per minute (gpm)

3
may be treated at the facility with an anticipated yearly average volume of 213 million gallons.
Specific waste streams include, but are not limited to, many formerly permitted outfalls listed as
follows:
I Description
1500 Area including Greenhouse Complex, Aquatic Sciences Lab,
Controlled Environment and Animal Building, Mobile Office Unit,
and the Environmental Sciences Lab.
2000 Area including Inspection Engineering Lab and Solid State
Lab Annex
Wastewater formerly collected in and discharged from ponds 3539
and 3540 (also known as the 190 ponds) for the 4500 area and the
High Temperature Materials Lab
Wastewater treated €or removal of radioactive contaminants and
discharged from the Process Waste Treatment Plant (PWTP)
Radiochemical Engineering Development Center (REDC)
wastewaters formerly collected in 7909 and 7908 basins. Mow
collected in Melton Valley Process Waste Collection Tanks
(MVCT) and pumped to the NRWTP.
High-Flux Isotope Reactor (HFIR) process wastewaters formerly
collected in 790.5 basin. Now collected in the MVCT and pumped
to the NRWTP.
Steam plant boiler blowdown and ion-exchange demineralizer
regeneration wastewater receiving pretreatment at the Acid
Neutralization Facility.
Although waste minimization efforts at ORNL have reduced the waste load at the facility, it
is anticipated that additional flow will be received in the future as a result of new research efforts,

4
decommissioning work, and environmental restoration activities. Control of the additional waste
streams will be maintained by the Waste Acceptance Criteria (WAC) developed for the facility by
the ORNL Waste Management organization. Wastewater that may be amenable to treatment by the
NRWTP but does not comply with the WAC may be accepted only through treatment scrutiny and
approval by the ORNL Office of Waste Management and Remedial Actions and the Office of
Environmental Compliance and Documentation.
1.3 FAcIllTy DESCRlPTION
The N R W consists of many unit operations: collection, flow equalization, chemical
precipitation, clarification, filtration, sludge dewatering, air stripping, activated carbon adsorption, and
pH adjustment. A process flow diagram is shown in Figure 1.1. The plant is located on a 2-acre site
south of White Oak Creek and west of the High Temperature Materials Laboratory (HTML).
Prior to entering the NRWTP, wastewater from the various sources undergoes on-line
segregation based on radioactivity or pH. There are two collection tanks at the NRWTP cach with
a capacity of 325,000 gallons. Tank F-1001, the Metals Equalization Tank, collects wastewaters which
could potentially contain signikant concentrations of heavy metals such as filter backwash, activated
carbon backwash, containment area sump wastewaters, air stripper acid washes, and ion-exchange
regenerant solutions. Tank F-1002, the Non-metals Equalization Tank collects wastewaters not likely
to contain hcavy metals, which includes most of the above former outfalls. Each of the collection
tanks is equipped with pumps which recirculate the tank contents through jet mixers for wastewater
equalization. On-line radiation monitors are used to determine the radiological content of the
wastewater prior to reaching the NRWTP collection tanks. If the monitors indicate that the
radioactive content of the wastewater exceeds predetermined levels, the wastewater is diverted to the
Bethel Valley Storage Tanks (BVST) where it combines with other potentially contaminated process
wastewater. This wastewater is treated for removal of radioactive contaminants at the PWTP and
is then transferred to NRWTF' tank F-1002. A development study4 completed in Novembcr 1989
has shown that wastewater with pH levels lcss than 6 has a much greater likelihood of containing
significant amounts of dissolved heavy metals. In addition, some heavy metals such as zinc can
resolubilize at excessively alkaline conditions. As a result of these studies, on-line pH instrumentation
has been installed which continuously monitors wastewater pH and automatically diverts the

5
OPXL-DWG-9 1 - 1 1 2 4 3
T CN. suf L
1
;1: > - f .............
-4- ; W c ~ M U u I S I
L ......................... .:.. .................... : .......... +. .... .: .... a m w m wrn
mc w S W P
Fig. 1 .1 WRWTP Process f low diagram

6
wastewater for heavy metals removal treatment when the pH is less than 6 or greater than 11. These
pH diversions are routed to either the PWTP or the NRWTP alkaline precipitation systems which
remove heavy metals from the wastewater. Former outfalls X04, XO6, X08, and XO9 each have on-
line radiation monitors and former outfalls XO3, X04, and X06 have on-line pH monitors.
Metals wastewater in tank F-1001 is treated for removal of heavy metals by chemical
precipitation and clarification. A controlled wastewater flow is fed from F-1001 to the Rapid Mix
Tank F-1003. At F-1003, the pH of the wastewater is elevated to 10.5 using sodium hydroxide. The
pH adjusted wastewater flows to one or both 60,000 gallon reactor clarifiers F-1006 and F-1007.
Each reactor clarifier is dcsigned to treat 380 gpm maximum and they can be used in parallel or
individually. The polymer used €or flocculation and settling of the metal precipitates can be added
either at the outlet of the rapid mix tank or at the center-located recirculator of the reactor clarifier.
At the reactor clarifier recirculator, the incoming wastewater mixes with previously formed floc and
enters a settling zone within a frustoconical skirt. The flocculated precipitates fall to the bottom
where a sludge rake continuously moves the sludge toward a center well. The sludge in the center
well is periodically drawn off and transferred to the Sludge Hold Tank F-1022 which can hold up to
10,000 gallons. The collected sludge is dewatered by a 24 cubic foot capacity filter press PFP-1024
and is containerized for disposal. The effluent from the reactor clarifier flows to the 3200 gallon
Filter Feed Tank F-1008 where it combines with non-metals wastewater from tank F-1002. The
combined waste stream is transferred through the Dual Media Filters F-1009 and F-1010 for removal
of suspended solids. The filters are used in parallel and can treat up to 380 gpm each. The filtered
wastewater then flows through a pH adjustment station where sulfuric acid is added to adjust pW to
betwecn 6 and 8.
After pH adjustment, the wastewater enters the top of Air Stripper S-1014 where it is
discharged through four spray nozzles onto the tower packing. As the wastewater passes through the
packing, air is blown into the bottom of the stripper and up through the packing to strip volatile
organics out of the wastewater. The organics are released into the atmosphere in the gaseous form.
A deniister at the top of the stripper prevents release of water droplets.
Wastewater from the air stripper enters sump F-1017 where it is transferred to the Granular
Activated Carbon (GAC) system. The GAC system consists of three columns, F-1018, F-1019, and
F-1020, each of which holds about 22,000 pounds o€ carbon. The columns are piped such that two
are operated in series while a third is on standby. The wastewater flows in downflow mode through
the columns and organics are adsorbed and held onto the carbon. From the GAC system, the
.

7
wastewater flows to a stirred 26,500 gallon effluent tank F-1021 where the pH is adjusted to between
6.5 and 8.5. The plant effluent flows through the NPDES monitoring station prior to discharge to
White Oak Creek at outfall number X12.
The facility operations are controlled using a centralized distributed control system (DCS).
The DCS provides all the necessary monitoring, indication, control, alarms, and recording functions
for the plant. A DCS network is set up which allows these functions to be manipulated from several
control stations at ORNL. DCS interfaces are located at the N R W " control room, the PWTP
control room, and at the Waste Operations Control Center (WOCC) at Building 3130 where the
DCS is monitored 24 hours per day. There are local controls available for the more critical systems
in case of computer outage.
1.4 PERMlT REQUIREMENIS
The discharge requirements of effluent from the NRWTP to White Oak Creek are currently
defined in the Oak Ridge National Laboratory NPDES Permit No. TN0002941. The NPDES permit
effluent limits for outfall X12 are shown in Table 1.1. Discharge limitations for permit compliance
are established for seven heavy metals, cyanide, total toxic organics (no), oil and grease (O&G),
total suspended solids (TSS), temperature, and pH. In addition, periodic monitoring is required for
flow rate, biochemical oxygen demand, and 17 other contaminants. The permit is currently based on
the EPA Best Available Technology (BAT) limits for metal finishing industries. The existing permit
expired in March of 1991, and an application for renewal of the permit was submitted to TDHE by
ORNL in September 1990. The proposed discharge limits for outfall X12 are shown in Table 1.2.
The new permit proposes limits based on operational sampling of the system which has given a
representation of treatment capability. Substantially lower limits for six heavy metals are proposed
with a new limit for mercury, unchanged limits for some parameters, and continued manitoring for
four other contaminants. Effluent quality will be further verified by continued NRWTP toxicity
monitoring under the Toxicity Control and Monitoring Plan (TCMP).
This optimization report is intended to satisfy the conditions specified in Note "A", page 1-41
of the former permit, which states that "Records indicating the optimization of treatment plant
performance shall be made available to EPA and TDHE."

8
Table 1.1. Former permit limits
Cyanide 0.65 1.2
Cadmium 0.26 0.69
Selenium Monitor only
Benzene Monitor onlv
(continued)

9
Parameter
Chlorobenzene
Chloroform
Dichlorobromomethane
Methylene Chloride
Tetrachloroethylene
Trichloroethylene
1,l Dichloroethane
pH, standard units
Table 1.1 (continued)
Monthly Average Daily Maximum
Monitor only
Monitor only
Monitor only
Monitor only
Monitor only
Monitor only
Monitor only
6.0 to 9.0

10
Table 1.2 O W NPDES permit application no. TN0002941 proposed etlluent limits*
Parameter Monthly Average Daily Maximum
Flow, MGD I Monitor
I Copper I 0.10
I Lead I 0.17
7 only T
30.5
60.0
15.0
2.13
Silver ---
---
Selenium Monitor only
11 pH, standard units I 6.0 to 9.0
* Units are mg/l unless otherwise noted

11
2. OPERATIONAL OBSERVATIONS AND OPTIMIZATION
21 START-UP
Equipment testing for the NRWTP treatment system by ORNL Engineering and Waste
Management Operations (WMO) began on June 13, 1989. Fire protection water (fire-water) was
used to begin testing of tank and containment sump level controls, alarms, and alarm interlocks.
Equalization tank level controllers were tuned to respond slowly so that flow rate changes to
treatment systems are gradual and not likely to cause treatment upsets. Pump flow capacity tests,
valve operations, flow controller tuning, and distributed control system (DCS) operational checks
were also performed. On July 24, 1989, checkout began on the operation of air blowers, agitators,
and sludge rakes. On August 15, 1989, most of the equipment checkout was complete and tests were
being performed to determine optimum backwash flow rates For GAC columns and dual media (DM)
filters and to develop automatic backwash valving sequence and other procedures. In addition,
operational checkout was initiated for the filter press systems. On October 19, 1989, the facility was
officially turned over to WMO for further operational testing.
During initial check-out of the transfer pumps for the equalization tanks, a small amount of
vibration was detected during operation. Though the level of vibration was not considered to be an
immediate safety concern, it was decided that improved support structures would be installed at the
pumps to dampen the vibration. This work was performed as part of a separate "Phase I1
Improvements" project. The work began on November 13,1990 and included improved base support
structures for the equalization tank transfer pumps, improved base support structures for DM filter
feed pumps, and also several ladders and access platforms to allow maintenance of ventilation fans
and other equipment.
On November 20, 1989, WMO began preparation of the sulfuric acid storage and transfer
systems. The sulfuric acid holding tank and lines were dried in preparation for loading. After loading
the acid, tuning of the pH controller at the air stripper inlet commenced. Problems were
encountered with pH control at this point due to the slow response of acid metering pumps and the
lack of adequate acidhastewater backmixing where the pH sensor was locatcd. The sensor was
located in a two gallon "pot" which received a sidestream from the process line where pH adjustment
was being performed. The flow to the pot was inconsistent and the lag time between acid addition

12
and pH sensing was variable, therefore, pH controller tuning was impossible. The problem was solved
by installing a flow meter on the inlet line to the pH sensor pot and replacing the single-
speedhariable stroke acid metering pumps with more responsive variable-speedhariable-stroke pumps.
Some difficulty was encountered in the tuning of the pH controller for the effluent tank F-1021. The
controller is equipped for either base or acid addition and in certain cases, both base and acid
additions would occur simultaneously. The problem was solved by modifying the controller logic to
prevent coinciding acid and base addition. Tuning of pH controllers for tanks F-1001 and F-1003 was
accomplished without significant difficulty.
On January 8,1990, testing of reactor clarifier F-1006 began. Fire-water and backwash water
from DM filters and GAC columns had been collected in tank F-1001 and was fed to the rapid mixing
tank for p H adjustment. Reactor clarifier performance was evaluated by periodic sampling and
observation. The effective polymer feed rate was chosen and the polymer metering pump was
calibrated to ensure the correct feed rates. Once the reactor clarifiers were operational, additional
tuning of the air stripper pH controller was necessary due to the addition of higher pH reactor
clarifier effluent to the air stripper feed wastewater.
On January 19, enough sludge had been collected in the sludge holding tank F-1022 to test
the operation of the filter press. The operation of the filter press is almost entirely automatic. The
only manual operations are the mixing of the diatomaceous earth (DE) slurries and the placement
and removal of filter cake disposal containers. The operation involves precoating the filtering
surfaces with DE and pumping the sludge from F-1022 to the press for a certain duration determined
by either elapsed time or by the time between strokes of the sludge feed pump (as the press fills, the
period of time between strokes of the feed pump lengthens). The filtering cycle duration was 7 hours
for the first run. The filter cake produced was sufficiently dewatered and fell from the filter platcs
without manual scraping. The first several batches of cake were very dark in color (almost black) due
to the presence of activated carbon fines from backwash exercises. A slight problem was caused by
a small volume of water that was captured in thc inlet line to the press when the filtering cycle was
complete. When the press was opened, a gallon or so of this water would spill into the disposal
containers. This problem was resolved by adding an air tap on the press to blow the water out of the
inlet line prior to opening the press. To enhance safety, a "man in distress" alarm pull-cord (wired
to the DCS) was added in the operating area in case of an accident while performing manual work
on the press.

13
On January 24, 1990, a malfunction occurred at DM filter feed pump J-1008k Maintenance
investigation revealed that the shaft of the pump had broken. On January 28, the shaft of DM filter
feed pump J-1008B also failed (at the same shaft location). After consultation with pump
manufacturers, it was believed to be a flaw in the design of the shaft and possible cavitation of the
pump. New shafts were provided by the manufacturer and both pumps were repaired and returned
to operation by February 1, 1990. To reduce the potential of pump cavitation, the operating level
of F-1008 was increased from 35% to 60%. Later during the year, additional shaft failures occurred.
Additional measures taken to prevent shaft failure have included retuning of filter feed tank level
controller, replacement of shafts with another design provided by an ORNL machine shop, and
replacement of pump base structures.
On February 3, 1990 the plant began receiving and treating actual process wastewater.
2.2 EQUAZ;IZATION TANKS
The metals and non-metals equalization tanks F-1001 and F-1002 each have a 325,000 gallon
capacity. The purpose of the two tanks is to provide surge capacity and uniform wastewater
composition for the treatment system. Both tanks are equipped with pumps which recirculate
wastewater at a flow of 5800 gpm through jet mixers installed in the tanks. Tank F-1001 is used to
collect wastewater which could potentially contain heavy metals, filter and GAC column backwash
waters, sump waters, acidic air stripper cleaning solutions, and Steam Plant wastewaters (former
outfall Xll). To avoid corrosion problems and to provide a uniform pH wastewater for the metals
removal system, F-1001 is equipped for pH control by caustic addition. The pH is controlled at a
level between 9 and 10. Tank F-1002 collects all flows from the former outfalls described in Section
1.2 unless diversions are necessary due to radiological content or pH deviations. Tank F-1002
wastewater is not likely to contain heavy metals. The pH of wastewater entering F-1002 is expected
to be uniform and slightly above 7, so caustic addition capability is not provided. A representative
sampling of F-1001 pH data taken between August 1, 1990 and November 1, 1990 indicates that a
pH of 9.5 +/- 0.5 is well maintained with a high of 9.82 and low of 8.98. During the same time
period, the pH in tank F-1002 averaged 7.16 within a range of 6.5 to 7.8.
The wastewater collection procedures for tank F-1001 were modified during the year to allow
€or changes in the metab removal treatment procedures. It was anticipated before startup that the
metals removal system would not be used at or near design capacity during normal operation. Wastc

14
management activities, wastewater segregation, and general employee awareness of the wastewater
regulations have contributed to a decline in the amount of process wastewater which contains heavy
metals. Estimates indicated that metals wastewater flow on a continuous basis would be less than 10
gpm. The lower limit of controllability is 70 gpm for the flow control system and pumps feeding the
reactor clarifiers from F-1001. Based on these factors, it was decided to operate the reactor clarifiers
in semi-batch mode at a flow rate of 100 gpm. The level of the metals equalization tank F-1001 was
allowed to fluctuate between 50 and 15 percent operating levels for the semi-batch treatment. For
the time period between February and September 1990, metals wastewater treatments were
performed every 15 days (on the average). In each metals treatment campaign, approximately
123,000 gallons were treated from tank F-1001. In September, however, tank F-1001 began receiving
all wastewater from former outfall X11, the spent regenerant solutions from the Steam Plant ion-
exchange systems. Prior to this date, these wastewaters were being treated at the Coal Yard Runoff
Treatment Facility. With the extra wastewater volumes entering F-1001, the frequency of metals
removal treatments increased to one every 3 to 4 days. This complicated the semi-batch operating
procedures significantly. On January 13, 1991, the decision was made to run the metals removal
system at a constant flow of about 25 gpm. Since the pumps feeding wastewater from F-1001 and
the flow control system cannot operate below 70 gpm, the pumps were deenergized and the
wastewater was allowed to gravity flow from F-1001 to thc metals treatment system. The operating
level in tank F-1001 is allowed to vary between 40 and 70 percent to maintain the necessary hydraulic
hcad for gravity flow. To date, the flow controller which manipulates the feed control valve has
maintained constant flows of 10 to 25 gpm. The sustained level of flow depends on the height of the
fluid in F-1001. Chemical additions are adjusted in accordance with the flow.
The level of tank F-1002 is controlled by adjusting the flow controller to maintain a tank level
of about 30%. Flow adjustments are made by the plant operator based on tank level monitored by
the DCS and also recorded by the operator on a log sheet every two hours. Flow control is preferred
in order to facilitate gradual flow changes and avoid upsetting treatment systems.
On-line radiation monitors are used to determine the radiological content of the wastewater
prior to reaching the NRWTP collection tanks. The monitors are very sensitive and are able to
detect increases in wastewater activity. If the monitors indicate that the radioactive content of thc
wastewater exceeds a preset level, the wastewater is automatically diverted from the NRWTP tank
F-1002 to the Bethel Valley Storage Tanks (BVST) where it combines with other potentially
contaminated process wastewater. This Wastewater is treated for removal of radioactive contaminants

15
at the PWTP. The PWTP effluent stream (former outfall X07) is transferred to NRWTP tank F-
1002. Former outfalls X04, X06, X08, and XO9 each have on-line radiation monitors. Results of
radiological analysis of wastewater samples from the NRWTP outfall are given in Table 2.1. The unit
operations at the NRWTP do not significantly remove radioactive contaminants, therefore, the levels
of radioactive contaminants in the plant effluent reflect very nearly what is present in the plant feed
wastewater. (The sludges generated from metals wastewater treatment are very slightly contaminated,
indicating that a small amount of activity in the metals wastewater is removed and concentrated in
the sludge.) The data indicates that average contaminant levels are lower than the Derived
Concentration Guidelines (DCG) of DOE Order 5400S5.
Wastewaters of former outfalls X03, X04, and X06 are diverted for metals removal treatment
if the pH of the wastewater is greater than 11 or less than 6. I t was originally planned to divert this
wastewater to tank F-1001 for subsequent metals removal treatment at the NRWTP. However, it
was decided in November 1989 that it would be important to minimize the amount of heavy metals
sludge generated at the NRWTP and that the pH diversions of former outfall X06 would be routed
to the PWTP collection system instead of the NRWTP. Former outfalls X03 and X04 divert to F-
1001 due to their low flows and insignificant impact on sludge generation. At the PWTI?, the X06
wastewater is treated in an existing chemical softening process at pH 11.5 followed by filtration and
ion-exchange polishing. The wastewater from the PWTP is transferred to the NRWTP for treatment
as a nonmetals waste stream. The precipitated metals combine with the sludge created in the PWTP
softening process. This sludge is dewatered using the existing PWTP filter press and is drummed for
storage.
In November and December of 1990, problems were experienced with the equalization tank
transfer pumps. Shaft failures occurred on both J-1002A and J-1002B of the nonmetals equalization
tank and J-1001A of the metals equalization tank. The pumps are the same manufacturer and design
as those used for the filter feed tank which have experienced shaft failures frequently during the year.
The base plates for both sets of transfer pumps were replaced as part of the Phase I1 Improvements
project. Two of the failures occurred before replacement of the base plates which took place in
December 1990. One failure occurred immediately after a base replacement and may have been
caused by shaft misalignment. No further shaft failures have occurred since December.

16
Table 2.1. N R W Effluent Radiological Content
Cs-137 * 111 10 28 140 10 755 741
* Routine gamma scan of the wastewater detects any gamma emitter at levels greater than 10 BqA.
* * DCG: Derived Concentration Guideline of DOE Order 5400.5

17
2.3 SODIUM HYDROXIDE AND SULFURIC ACID FEED SYSTEMS
Sodium hydroxide (caustic) is used to adjust the pH of the wastewater in equalization tank
F-1001, rapid mix tank F-1003, and effluent tank F-1021. The caustic system consists of a storage
tank F-1025 and a recirculation system which distributes the caustic to the feed points. The DCS pH
control systems independently regulate each of the control valves located at the three feed points.
The caustic is delivered to the plant as a 50% solution which is diluted to 18% in tank F-1025. The
dilution lowers the freezing point of the solution. The only startup problem experienced with the
caustic system involved freezing of the 50% caustic solution in the piping during loading of tank F-
1025. The lines were externally heated to thaw the caustic and complete the loading. To prevent
a recurrence, all caustic lines where subsequently heat traced and insulated. In January 1991, the F-
1001 caustic flow control by-pass valve, which normally remains closed, began to leak and allow too
much caustic to enter F-1001. This resulted in high pR wastewater entering the metals removal
system. This, however, had no adverse effect on metals removal systems and the pH controller on
the air stripper successfully compensated and brought the pH down to within acceptable values.
Within hours, the valve was repaired and F-1001 pH control was restored.
The sulfuric acid system consists of the holding tank F-1026 and two acid metering pumps.
The acid is supplied to the pH adjustment station at the air stripper inlet and to the effluent tank F-
1021. The sulfuric acid concentration is 93%. To improve pH control, the two single-speed, variable-
stroke metering pumps were replaced with two variable-speed, variable-stroke pumps. In September,
1990, pH control at the effluent tank F-1021 became difficult. It was found that the acid feed line
between the acid holding tank F-1026 and the effluent tank was plugged with sludge. The acid
supplier was consulted and it was suggested that the linc could be plugged with iron sulfate caused
by intrusion of water and corrosion of the steel pipeline. Prior to plant startup, the tank and lines
had been dried and the tank vent is equipped with a desiccant unit, therefore, water intrusion was
considered unlikely. The line to the effluent tank is open to the atmosphere, however, and may have
collected moisture as a result of the line draining back to the holding tank and bringing in humid air
(also unlikely due to the presence of check-valves at thc metering pumps). To reestablish flow and
to mitigate possible iron sulfate formation, the steel pipe between the metering pumps and the
effluent holding tank was replaced with a 316L stainless steel line. ORNL Quality Assurance
personnel performed ultrasound testing to evaluate the wall thickness of the holding tank F-1026.
The results of the test were compared to results of a similar test performed before the tank had
18
received any acid. It was concluded that the results of the tests were not significantly different and
that F-1026 was not exhibiting signs of corrosion. Further investigation is planned for inspection of
the acid holding tank interior and determining the amount of sludge in the tank.
2 4 IXEAVY METALS REMOVAL SYSTEM
The NRWTP metals removal system treats several waste streams including backwash waters,
plant sump waters, acid cleaning solutions, and former outfalls X03 and X04 when diverted to F-1001
due to pH value. The treatment process involves addition of sodium hydroxide to adjust raise pH
to 10.5 and precipitate the metals as hydroxide compounds. This is followed by addition of flocculants
to speed the settling of precipitates and clarify the wastewater in the reactor clarifier units.
Preoperational testing of the metals removal systems was performed using fire-water as a
surrogate waste stream. Since the source of a large portion of the actual process wastewater is once-
through cooling water, i t was felt that fire-water would cxhibit similar characteristics. According to
the pilot plant treatability s tudy the optimum pH for metals removal was 10.5. However, due to the
lack of significant heavy metals concentrations in the fire-water, the optimum pH could not be
verified in preoperational testing. The polymer recommended in the treatability study for flocculation
of precipitates was Betzl 1100. Adequate performance of this polymer was verified by observing
precipitation and flocculation of hardness compounds naturally present in the fire-water. Jar tests
performed using samples from F-1001 had indicated that very little precipitation of hardness
compounds could be expected at pH 10.5, therefore, it was decided to elevate the pH to 11.5 to
improve precipitation and provide better conditions for observing clarifier performance. The initial
pH tuning for the rapid mix tank was performed without significant difficulty. The mechanical
systems of the reactor clarifier (recirculator and rake) operated flawlessly. Using an operational pH
of 11.5, various polymer dosages were used while observing the reactor clarifier effluent and analyzing
effluent grab samples for total suspended solids. Total hardness titrations were performed for reactor
clarifier inlet and outlet samples to verify precipitation of hardness compounds. The reactor clarifier
inlet hardness concentrations were usually within the range of 100 to 140 ppm. The effluent hardness
concentrations after filtration through DM filters were 40 to 60 ppm. Total suspended solids (TSS)
'Trademark of Betz Laboratories, Inc.

19
in the effluent stream averaged about 14 ppm. Based on these tests, a polymer dosage of 2.5 ppm
was chosen.
While performing these tests, an optimum polymer feed tank mixture concentration was
chosen which would allow operation of the polymer metering pumps within the designed operating
range and also minimize the waste of short-shelf-life polymer solutions. Betz 1100 polymer is
supplied as a dry powder and water solutions of the polymer have only a two day shelf life. The use
concentration chosen for the Betz 1100 was 0.08%. At a wastewater flow of 100 gpm, the required
flow of the Betz solution is 18.5 gallons per hour. The two polymer feed pumps were calibrated to
verify correct feed rates.
For the initial 10 months of operation, the metals removal system was operated in semi-batch
mode. In the initial design phases for the NRWTP, it was anticipated that all wastewater entering
the plant would require removal of heavy metals, therefore, the reactor clarifiers are designed to treat
up to 380 gpm each on a continuous basis. However, the total flow of wastewater requiring metals
removal treatment including X03 and X04 pH diversions, backwash waters, acid cleaning wastes, and
plant sump waters, was less than 6 gpm for the first 6 months of operation. To maintain a near-
design flow capacity, it was necessary to operate in semi-batch mode. Metals wastewater was allowed
to collect in tank F-1001 until the SO% level was attained. About 123,000 gallons of the wastewater
was then treated in the reactor clarifier at a flow rate of 100 gpm lowering the tank level to about
15%. The reactor clarifiers are designed for continuous flow and recirculation of previously
precipitated sludge to enhance the precipitation reaction. Since generation of a sludge layer requires
many hours of operation, the reactor clarifiers are not well suited for semi-batch operation. In
consideration of this, it became a routine procedure to leave some sludge in the reactor clarifier after
a metals treatment run. When a subsequent metals treatment run was performed, the sludge from
the previous run was recirculated with the feed to enhance precipitation. From March 1990 until
October 1990, batches were treated €or heavy metals removal every 15 days on the average.
Starting in October, 1990, the plant began to receive greater quantities of wastewater from
the former outfall X11, ORNL steam plant wastewater from boiler blowdown and regeneration of
ion-exchange resins. This wastewater was previously being treated at the Coal Yard Runoff
Treatment Facility (CYRTF). Due to permit restrictions, however, CYRTF treatment of this
wastewater had to be discontinued. Due to the metals content of this wastewater, it is received in
the NRWTP metals equalization tank F-1001 and treated through the metals removal system. As a
result of receiving this wastewater, the frequency of metals removal semi-batch treatments increased

20
from one every 15 days to one every 3 to 4 days. In addition, the concentration of calcium,
magnesium, and other metals increased as did the amount of sludge generated from the precipitation
reaction. The frequent startup and shutdown of the system was awkward from an operational
standpoint and sludge carryover from the startup operation began to plug the dual media filters more
frequently. To improve operations, it was decided to attempt to run the metals treatment system on
a continuous basis at a low flow rate. The wastewater transfer pumps for the metals wastewater could
not be used at such low flows due to the design of the flow control system, however, by allowing the
operating level in the metals equalization tank to increase to the 40 to 70 percent range, the
hydrostatic head pressure was sufficient for gravity flow through the reactor clarifier system. A constant flow of 10 to 25 gpm has successfully been maintained since January 13, 1991. The polymer
feed system procedures were modified for metering a more dilute (0.02% by weight) polymer solution
at a feed rate proportional to the wastewatcr flow.
Table 2.2 is a summary of the metals content of the reactor clarifier inlet and outlet
wastewaters. Table 2.3 is a summary of removal rates for many of the metals regulated by the EPA
and TDHE. As indicated in Table 2.2 and 2.3, removal of heavy metals has been effective. The
metal concentrations of the reactor clarifier effluent were well below the former permit levels (Table
1.1). Some of the metals exceed the new limits proposed in the September 1990 NPDES permit
application (Table 1.2), however, subsequent filtration and mixing with the non-metals wastewater
reduces the metal concentrations to levels below the proposed limits. The change in mode of
operation from semi-batch to continuous appears (based on limited monitoring) to have reduced DM
filter plugging and improved removal of iron, copper, aluminum, and lead. A slightly negative impact
is shown for removal of chromium and manganese, and no significant change in removal ratcs for
nickel and zinc. Table 2.4 shows a comparison of the metals effluent concentrations for semi-batch
and continuous operations.
As discussed in Section 2.2, former outfall XO6 is diverted to the PWTP for removal of heavy
metals which occurs in conjunction with the PWTP softening process. Based o n monitoring of pH
diversions, the total volume of metals wastewater diverted to the PWTP is only about 27,000 gallons
per month. This small amount of wastewater has an insignificant impact on PWTP operations where
an average 5.7 million gallons of wastewater are treated per month. Analysis of wastewaters
collecting in the nonmetals tank F-1002 indicates that metals are effectively removed from PWTP
wastewaters prior to entering the NRWTP.

21
Metal Mean Max.
Table 22. NRWTP reactor clarifier influent and effluent metals concentrations
Min.
Summary of 38 samples
0.0055
Reactor Clarifier Inlet Concentral ( m d u
0.02 0.005 2
As
B
I I I
Ag: I 0.023 0.22 0.005
0.055 0.13 0.05
0.084 0.17 0.08
Al I 3.3 I 53.0 I 0.05
0.054
0.082
0.14 0.05 3
0.16 0.08 2
Ba
Be
Ca
cd
co Cr I 0.061 I 0.41 I 0.011
0.23 1.7 0.012
0.0008 0.01 0.0002
422 900 23
0.007 0.046 0.005
0.0056 0.03 1 0.004
Cu I 0.45 I 2.7 1 0.023
0.0005
325
0.006
17 0.0042
0.01 o.Oo02 4
720 17 38
0.02 0.005 5
0.013 0.004 1
Mo I 0.04 I 0.04 I 0.04
Fe
Li
Mg
Mn
11.6 77 0.13
15 15 15
54.6 170 4.9
0.32 3.7 0.0015
0.55
15
30.1
0.0093
0.04
Reactor Clarifier Effluent Concentrations (m@)
9.8 0.05 35
15 15 0
76.7 2 38
0.1 0.001 33
0.04 0.04 0
No. 11 Mean I Max. I Min. 1 No.
Na
Ni
P
Pb
Det -
301 580 40
0,066 0.35 0.004
5.9 89 0.3
0.21 0.9 0.046
~ 30
321
0.0071
0.36
0.057
550 ' 70 38
0.05 0.004 9
1.1 0.3 9
0.18 0.03 4
35 (1 0.13 1 0.86 I 0.03 1 17
Sb 0.052 0.12 0.05
~ 36 11 0.077 1 0.17 1 0.001 I 37
1 0.05 ~
0.05 0.05 0
38 11 0.016 1 0.059 1 0.004 133
38 11 0.045 1 0.3 1 0.007 1 37
38
32
36
26
(continued)

22
Table 22 (continued)
Metal
Reactor C
I Mean
0.049 G Sn I 0.053
Sr I 0.58
Ti I 0.10
V I 0.0060
Zr I 0.021
Max. I Min.
0.053 0.02
100 1
0.15 0.05
1.4 0.05
1.5 0.02
0.053
0.01s
0.043 1 0.6
Det No. /I Mean I Max-
2 11 0.05 I 0.072
Reactor Clarifier Effluent Concentrations (m.gk)
No. Det
1
3s
0
3s
0
S
37
0
larifier Inlet Concentrations
Min.
0.04
0.59
0.05
0.038
0.02
0.002
0.005
0.02
Reactor clarifier inlet samples were taken at the transfer pumps of the metals equalization tank F- 1001. Reactor clarifier effluent samples were taken from the reactor clarifier effluent weir. The effluent samples were set aside for one hour (to allow settling of suspended solids) and decanted to another sample container. Both inlet and effluent samples were acidified with nitric acid after collecting.

23
- Mean Inlet
Metal Concentration (ms/l)
As 0.023
Al 3.3
As 0.055
Ba 0.23
cd 0.007
Cr 0.061
c u 0.45
Fe 11.6
Mn 0.32
Ni 0.066
P 5.9
Pb 0.214
Table 23. NRWTP reactor clarifier performance - removal rates of selected metals
Mean Outlet Average Percent Concentration (m@) Removal
0.0055 76.1
0.13 96.1
0.054 1.8
0.077 66.5
0.0062 11.4
0.016 73.8
0.045 90.0
0.55 95.3
0.0093 97.1
0.0067 89.8
0.36 93.9
0.057 73.3
Se
Si
Zn
0.049 0.05 -2.0
12.5 3.4 72.8
2.2 0.12 94.5

24
Table 24. Comparison of NRWTP reactor clarifier performance for batch and continuous treatment of metals wastewater
I Batch treatment effluent metal concentrations 9/27/90 to 1/8/91
Metal
As
Ba
Cd
Mean of 15 samples (mg/l)
0.005
0.20
0.058
0.092
0.005
Cr I 0.011
c u I 0.029
0.0051
0.005
Continuous treatment effluent metal concentrations 1/28/91 to 3/31/91
Mean of 9 samples ( m d )
0.005
0.063
0.050
0.130
0.005
0.025
0.017
0.10
0.0073
0.004
0.33
0.050
0.050
7.9
0.056

25
2 5 FILTERPRESS
When a metals removal batch is complete, the metals sludge is transferred to a sludge holding
tank to await dewatering in a Perrin recessed-plate filter press. Positive-displacement double
diaphragm pumps transfer sludge from the sludge tank into the filter press. The sludge is compressed
into a cake by pumping it into filter chambers formed by the recessed plates. The sludge, which is
retained by the filter media, fills the chambers and the water is displaced or "squeezed" out. It is
important that enough sludge be available in the sludge holding tank to fill all the chambers of the
filter press. If there is not enough sludge in the holding tank to fill the press, the free space in the
press will be occupied by water and a wet cake will be produced. Filter cake containing free water
is not acceptable from a disposal standpoint. The filter press is designed to hold a maximum of 24
cubic feet of dewatered sludge (or filter cake). The filtrate from the filter press operation could
potentially contain sludges, particularly if the filter material of the filter press is damaged. The
filtrate, therefore, is transferred to the plant sump where it is recycled to the metals equalization tank
F-1001. Some modification of operating p r d u r e s and resolution of additional details were needed
to operate the filter press. The initial operating procedures stated that the sludge holding tank
needed to be filled to the 40 percent operating level before operating the press. However, it was also
necessary to know the solids content of the dilute sludge in order to determine if the filter press
could be filled and produce a cake with no free water. Samples were taken from the sludge holding
tank and the solids content was determined to be about 2.7 percent. A minimum sludge tank level
was determined by assuming a filter cake solids content of 40 percent and a specific gravity of 1.4.
The first run of the filter press produced an acceptable dewatered cake. The solids content of the
cake was 27 percent and the specific gravity was 1.15. This data was used to recalculate the minimum
sludge tank level for running the filter press. However, the solids content of the holding tank sludge
was found to vary by a large degree after subsequent sludge transfers from the reactor clarifier to the
tank. I t was found to be too dilute in some cases to justify operating the filter press, even though
the tank level was high. To allow concentration of the dilute sludge in the holding tank, a decanting
pipeline was installed at the 40 percent operating level of the tank. To decant water from the tank,
the sludge mixer is deenergized and the sludge is allowed to settle for 90 minutes. This waiting period
typically allows the sludge to settle below the 40 percent level. The valve on the decant line is then
opened to allow the extra water to drain to the plant sump for recycle to tank F-1001, The decanting
increases sludge concentration and allows for addition of more dilute sludge to the tank. A sample

26
line was also installed at the 10 percent level of the sludge tank to allow sampling and determination
of sludgc concentrations. A simple test was developed which uses the settled height of the sludge
in a sample from the sludge tank to estimate the solids content. Once solids content reaches 3
percent or higher (on a dry basis) at a sludge tank level of 40 percent, there is more than enough
sludge to fill the filter press and produce a dewatered cake.
The filter press has been operated 28 times in the first year of operation and has consistently
produced adequately dewatered filter cake. The operation requires little in terms of manual
operation. The length of the filtering cycle may be controlled by one of two timers. The first timer
automatically shuts the press down after a preset cycle time, usually 6 hours. The second timer
monitors the time between the strokes of the double diaphragm pump which transfers sludge to the
press. When the time between strokes increases to a preset duration, usually 90 seconds, the press
automatically shuts down. A cycle time of 1.5 hours has been found to adequately dewater the
sludge. The press is remotely opened and the plates are remotely and automatically separated, The
filter cake typically drops from the plate into the disposal container without manual scraping of the
filtering surfaces. Diatomaceous earth (DE) is used as a precoat and is prepared in tank F-1023.
Centrifugal pumps recirculate a slurry of DE through the filter press which precoats all filtering
surfaces. The precoat inhibits plugging of the filter media and acts as a release agent to allow the
filter cake to fall off the filter media without manual scraping.
The sludges are loaded into 64 cubic foot capacity steel boxes and each box is sampled for
characterization purposes. Results of EPA Extraction Procedure (EP) toxicity testing summarized
in Tables 2.5,2.6,2.7 indicate that the sludge is not likely to be considered a RCRA hazardous waste.
It does, however, contain small quantities of radioactive contaminants and will be handled and stored
as a Low Specific Activity (LSA) waste. The currently required EPA Toxicity Characteristic Leaching
Procedure (TCLP) testing will be pcrformed on samples that have been archived from each disposal
box and on future sludge samples as needed to characterize hazardous properties.
26 DUAL MEDIA FILTERS
The dual media filters receive wastewater effluent from the reactor clarifiers and wastewater
from the Non-metals Equalization Tank F-1002. The two filter feed streams combine in the Filter
Feed Tank F-1008 and are pumped through the two filters in parallel. Each filter is designed for a
maximum flow of 380 gpm. As the name implies, each filter is packed with a two-layer bed of sand

27
Sludge Metal RCRA Limit (md) Concentration
(ma)
Ag 5 6
As 5 < 9.4
Ba 100 42
cd 1 < 0.5 1
Cr 5 9.1
Hg 0.2 3
Ni 7.1
Pb 5 23
Se 1 < 7.2
TI < 3
Table 25. NRWTP metals sludge EP Tox analysis and other charawristics
EP Tox Leachate Concentration (mg)
< 0.022
<0.17
0.044
< o m <0.01
<0.008
4 . 0 3 1
<0.061
<0.18
co.1
I1 Samnle #I taken 3/20/90 11 EP Tox
0 ther Characteris tics
To tal Organic Carbon
Total Solids
analysis
Concentration (%)
1.13
28.3
(Continued)

28
Table 25 (continued)
Radionuclide Concentration (Bq/g)
\I C-14 296
II (3-60 < 11

29
EP Tox analysis
Sludge EP Tox Leachate Metal RCRA Limit (mg) Concentration Concentration (mg)
(m&4
Ag 5 6.1 c0.022 -
As 5 < 7.5 C0.17
Ba 100 50 0.068
Cd 1 ~ 0 . 4 1 CO.01
Cr 5 9.1 <0.01
Hg 0.2 3.2 cO.008
Ni 7.4 <0.031
Pb 5 23 <0.061
Se 1 <5.8 cO.18
Tl ~ 2 . 4 co.1
0 ther Characteristics Concentration (%)
Total Organic Carbon 2.2
It Total Solids 1 30.9 -
Table 26. NRW" metals sludge EP Tox analysis and other characteristics
II
II Sample #2 taken 3/20/90 II
(Continued)

30
Table 2.6. (continued)

31
Cr
Hg
Ni
Pb
Table 27. NRW" metals sludge Ep Tox analysis and other characteristics
5 45
0.2 c 165
< 165 5 0.9
1 Sample #3 taken 6/20/90
Other Characteristics
Total Organic Carbon
Total Solids
II EP Tox analysis
Concentration (%)
1.52
20.1
Metal Sludge I Concentration
Ba I 100 I 71
cd 1 c 47
EP Tox Leachate Concentration (md)
1.1
0.36
0.05
< 0.05
c 0.18
0.11
0.03
II Se I 1 I < 29 I c 0.18
ll TI I e 3 1 c 0.1
(Continued)

32
Table 27. (continued)
Sample #3 taken 6/20/90
Radiological content
11 Radionuclide I Concentration (Bq/g)
n C-14 I 238
II Co-60 I c 15
II Cs-137 I 4.4

33
and anthracite which removes suspended solids from the wastewater before reaching the air stripper
and activated carbon system. As the filters collect solids, the pressure drop across the filters
increases. When the pressure drop reaches 15 psig, the operator initiates the backwashing cycle
which removes the collected solids from the filter media and typically reduces the pressure drop to
less than 1 psi. A 2-minute air scour process is used as part of the bachwash cycle to assist in
removing particles from the filter media. Backwash water is transferred from the effluent tank F-1021
at a flow rate of 800 gpm for a 5 minute duration. On the average, the filters have required
backwashing once every 48 hours of operation. The filters can be taken off-line and Qackwashed
individually without interrupting flow through the system. If both filters need backwashing, the filters
may be bypassed with flow going directly to the air stripper until backwashing is complete. The spent
backwash water is returned to the Metals Equalization Tank F-1001 for treatment through the metals
removal system.
Due to experience with other granular media filters and the difficulty encountered when
replacement of the media is required, it was decided that a routine periodic backwash schedule was
preferred rather than delaying until the pressure drop showed a significant increase. Under certain
conditions, large quantities of sludge can build up on filter media surfaces before the pressure drop
begins to increase. This sludge buildup can be difficult toremove if allowed to accumulate for lengthy
time periods. The accumulated sludge can cause the media to cake together, which leads to flow
channelling and reduced filtering efficiency. When the media is to be replaced, the caked media is
very difficult to remove from the filter vessel. For these reasons, the DM filters were placed on a
48-hour backwash schedule. High pressure drop across the filter, however, will always take priority
in indicating the need for a backwash operation.
A significant problem associated with filter operation has been the filter feed pump difficulties
(discussed in Section 2.1). On four separate occasions, a shaft failure has occurred on one of the two
pumps. The manufacturer supplied several replacement shafts with siightly different designs to
correct what appeared to be a weak point in the previous shaft. In September 1990, it was discovered
that the level controller of tank F-1008 was causing the pump discharge valve to open and close
wildly in responding to level changes, thus causing erratic and severe cavitation. The controller was
retuned to respond smoothly and gradually to level changes. Despite the retuning and new shaft
design, however, a shaft failure occurred in October. Yet another designed shaft was supplied by an
ORNL machine shop to replace one of the suppliers shafts. This shaft performed well until, during
a seal replacement activity, the shaft was damaged and had to be replaced with another vendor shaft.

34
To reduce pump vibration, the pump base plates were replaced as part of the Phase I1 Improvements
project which began in November 1990. Shaft failure for the filter feed pumps has not occurred since
October 23, 1990.
Minor problems were experienced with a pressure relief rupture disc which was replaced after
prematurely failing, and with two check valves which had to be replaced after allowing water to enter
the air scour blower.
27 AIR STRIPPER
The Air Stripper S-1014 is designed for removal of small amounts of volatile organic
contaminants from the waste stream. The feed stream to the air stripper consists of the combined
and filtered streams from the Non-metals tank F-1002 and the reactor clarifiers. Prior to entering
the air stripper, the pH of the Wastewater is adjusted to 7 to prevent precipitation of water hardness
compounds and possible plugging of air stripper packing and activated carbon columns. The
wastewater enters the top of air stripper where it is discharged through four spray nozzles onto the
towers packing. The packing disperses the wastewater as it makes contact with air which is blown
into the bottom of the stripper and up through the packing. The organic compounds in the
wastewater are dcsorbed or stripped from the water into the air stream. The organics are released
into the atmosphere in the gaseous form. A demister at the top of the stripper prevents release of
water droplets.
The air flow to the air stripper is regulated to a range of 5500 to 8000 cfm. This provides an
average 184 to 1 air to liquid ratio. The pressure drop across the column is monitored on a
continuous basis to track the accumulation of materials which can plug the column packing,
particularly algae growth. The air stripper is cleaned if an increase in pressure drop or decrease in
air flow is observed. A pressure drop of 2 psig or an air flow less than 5500 cfm triggers the need
for air stripper cleaning. The cleaning procedure consists of recirculating a solution of 5% sulfuric
acid for 4 to 5 hours. From the startup of operations, algae had been observed slowly building up
inside the air stripper column. A site glass is provided near the bottom of the column which had
become coated with algae after several months of operation. Although high pressure drop or low
air flow wcrc not observed, sampling indicated that conditions in the air stripper were approaching
those which support the growth of the bacteria associated with Legionnaires’ disease. For this reason
and to reduce algae accumulation, the air stripper was shut down for cleaning in March 1990. At that

35
time, it was decided that the air stripper would be acid
pressure drop or low air flow indicated the need for a
cleanings have since been performed each quarter and
cleaned on a quarterly basis unless high
more frequent cleaning schedule. The
control of algae accumulation has been
adequate. Pressure drop and air flow data have not indicated the need for additional cleanings.
To assess the performance of the air stripper, the wastewater entering and leaving the air
stripper is analyzed for volatile and semi-volatile organics. Table 2.8 lists all the organic compounds
analyzed and the detection limit for each compound. The data summarized in Tables 2.9 and 2.10
give a summary of the compounds detected in the waste water entering and leaving the air stripper.
The tables identify only those organic compounds which were either confirmed to be present at levels
above the detection limit or tentatively identified at levels below the detection limit. In many cases,
the mean concentration of the compound is lower than the detection limit. This is because the mean
is calculated using the tentatively identified concentrations which are below the detection limit of the
compound. The number of organic compounds and the mean concentrations of the compounds are
lower in the wastewater leaving the air stripper, indicating that the air stripping is effective.
z.a GAC SYSTEM
The effluent from the air stripper enters the GAC feed sump F-1017 and is transferred to the
GAC columns for removal of mercury and organic contaminants not removed by air stripping. The
GAC system consists of three columns, two on-line in series flow and the third on standby. Each
column contains about 22,000 pounds of Cecarbon2 GAC 30 granular activated carbon. When the
plant officially began treating wastewater on March 31, 1990, column F-1020 was in the lead position,
column F-1019 was in the lag position, and column F-1018 was on standby. On December 6, 1990,
column F-1020 was taken out of service for repair of a leaking pressure relief device. By this time,
columns F-1020 and F-1019 had accumulated throughputs of 115.3 million gallons while the standby
column F-1018 had been used for only short periods of time during backwash of the other columns.
Column F-1019 was then placed in the lead position and column F-1018 was placed in the lag
position with column F-1020 on standby. This column arrangement was used through March 31,
1991. From December 6, 1990 to March 31, 1991 column F-1019 received an additional 53.1 million
Trademark of Atochem Inc., Ceca Division

36
Table 28. List of volatile and semivolatile organics analyzed for evaluation of NRW" air stripper and GAC system performance
ll Organic Compound
Detection Limit
Chloroethane
II Acetone I 10
Carbon disulfide I 5
1,l-dichloroethene 5
2-butanone
1,1.2-trichloroethane 5
(Continued)

37 Table 28. (continued)
Trans- 1,3-dichloropropene
Bromoform
4-methyl-2-pentanone
2-hexanone
Tetrachloroethene
1,1,2,2-tetrachloroethane
Toluene
Chlorobenzene
Ethylbenzene
Organic Detection Compound Limit
Benzene .__ ~
5
5
10
10
5
5
5
5
5
Xylene
Styrene
5
I __
Phenol
Bis (2-chloroe t hyl)e t her
2-chlorophenol
1,3-dichlorobenzene
10
10
10
10
l,.rt-dichlorobenzene
Benzyl alcohol
1 ,Zdichlorobenzene
2-methylphenol
Bis(2-chloroisopropy1)ether
4-methyl phenol
N-ni troso-di-n-propylamine
Hexachloroethane
~ ~-
lo
10
10
10
10
10
10
(Continued)

38 Table 28. (continued)
Organic Compound
Detection Limit
10 Nitrobenzene _ _ ~
Isophorone 10
2-nitrophenol 10
2,4-dimethylphenol 10
Benzoic acid 50
10 Bis(2-ch1oroethoxy)methane
2,4-dichlorophenol
1,2,4-trichlorobenzene
Naphthalene
4-chloroaniline
10
10
10
10
Hexachlorobutadiene 10
4-chloro-3-methyl phenol 10
2-methvlnanhthalene 10
10
10
50
Hexachlorcyclopentadiene
2,4,6-trichlorophenoI
2,4,5-trichlorophenol
2-chloronaphthalene
2-nitroaniline
Dimethyphthalate
10
50
10
Acenaphthalene 10
2.6-dini tro toluene 10
50 3-nitroaniline
Acenaphthene 10
2.4-dinitronhenol 50
50 4-nitrophenol
(Continued)

39 Table 28. (continued)
~~
Organic Detection Compound Limit
( v i m Dibenzofuran 10
2,4-dinitrotoluene 10
Diethylphthalate 10
4-chlorophenyl-phenylet her 10
Fluorene so 4-nitroaniline 50
4,6-dinitro-2-methylphenol 50
N-nitrosodiphenylamine (1) 10
4-bromo phenyl-phenylether so Hexachlorobenzene 10
Pentachlorophenol 50
Phenanthrene 10
Anthracene so Di-n-butylphthalate 10
Fluor ant hene 10
Pyrene 10
Butylbenzylphthalate 10
3,3’-dichlorobenzidine 20
Benzo( a)anthracene 10
Chrysene 10
Di-n-octyl ph thala te 10
Benzo( b)fluoran t hene 10
Benzo(k)fluoranthene 10
Benzo( a) pyrene 10
Bis (2-e t hyl hexy1)p h thala te 10
-
(Con tin ued)

40 Table 2.8. (continued)
Organic Compound
Detection Limit
II Aldrin I 0.05
II Endrin I 0.10
II Endosulfan I1 I 0.10
44’-DDD
(Continued)

41 Table 2.8. (continued)
Organic Compound
Aroclor- 1221
Aroclor-1232
Aroclor-1242
Aroclor-1248
Aroclor-1254
Detection Limit ( P a 4
0.50
0.50
0.50
0.50
1.00
Aroclor-1260 1 .00

42
r
Organic Detect Compound Limit Mean Max Min No.
(,p/L) IdL ,s/L Dct.
Table 2.9. Volatile and semivolatile organic content of NRW" air stripper feed wastewater
Summary of 17 samples
43
Organic Detect Compound Limit Mean Max Min No.
(Pa) I@ Cr.@ FrdL Det. .
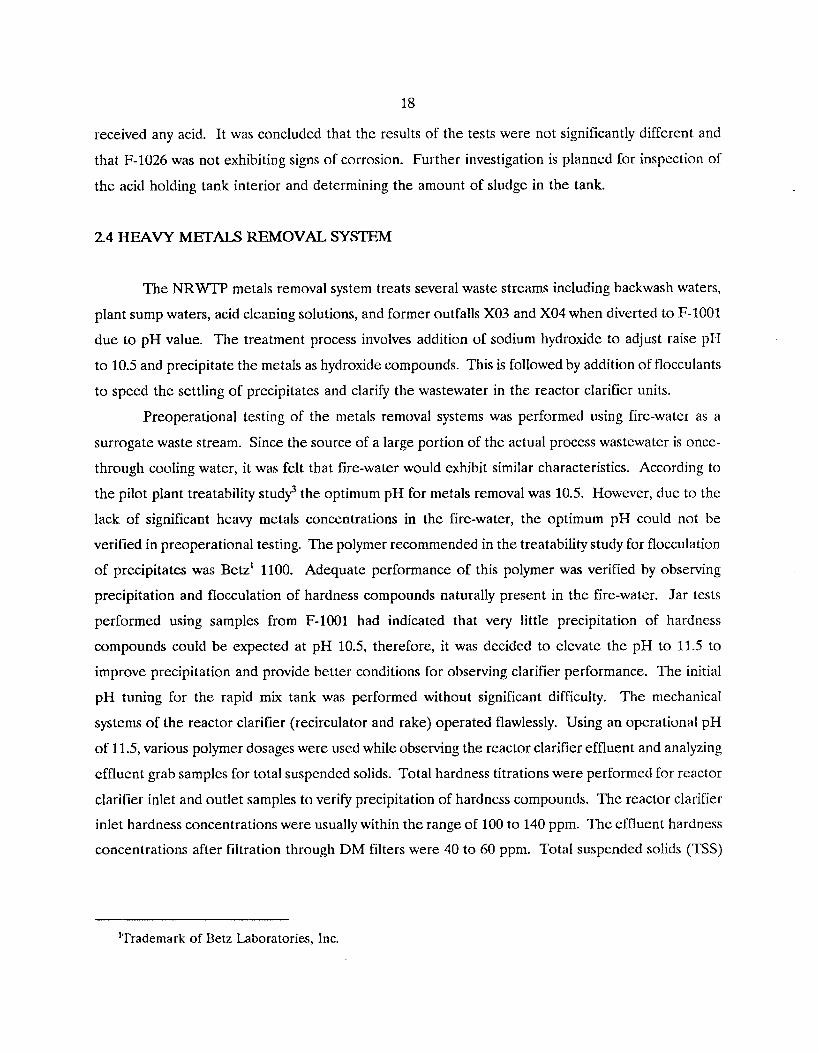
Table 2.10. Volatile and semivolatile organic content of NRWTP air stripper effluent wastewater
Methylene chloride 5 5 5 5 1
Carbon disulfide
Acetone 10
I ~~
Tetrachloroethane 5 4.8 5 3 2
10.6 20 10 1
Endosulfan sulfate 0.10
Alpha chlordane 0.5
In several cases for Tables 2.9 and 2.10, the mean concentration of a compound is less than the detection limit. This occurs when tentative identifications are reported at concentrations less than the detection limit for the compound. These concentrations are used when calculating the mean, which sometimes reduces the mean value to levels below the detection limit.
0.095 0.1 0.02 1
0.47 0.5 0.02 1

44
gallons throughput in the lead position, column F-1018 received 52.1 million gallons throughput in
the lag position, and column F-1020 remained on standby for use during backwash of the other
columns.
Like the air stripper, samples of waste water from the inlet and outlet of the columns are
analyzed for organic materials. Analytical data summarized in Tables 2.11,2.12, and 2.13 indicate that
very few detectable organic pollutants have either entered or exited the GAC system. As shown in
Table 2.14, mercury is detected at very low levels in the GAC influent stream and is removed to
levels below the detection limit in the effluent wastewater. When organic or mercury analytical data
for thc lcad column indicates breakthrough of compounds that should normally be adsorbed by the
carbon, the standby column will be placed on-line (in the lag position), the former lag column will
be placed in the lead position, and the former lead column will be takcn off line for reloading with
fresh carbon. The spent activated carbon will be dewatered, containerized, and disposed of. Though
radiological contaminants enter the plant at levels lower than discharge limits, some accumulation may
occur on activated carbon making it slightly radioactive. ORNL Health Physics personnel have
performed surveys at the NRWTP and results indicate that the radiation field on the surface of the
GAC columns is no higher than background levels. Radiological analysis will be performed on spent
activated carbon samples prior to disposal. In addition, TCLP tests will be performed on the carbon
to determine if it is a characteristically hazardous waste.
The GAC system is equipped for backwashing to remove accumulated solids (mostly algae
from the air stripper). When the pressure drop across a column reaches 13 psig, an alarm is received
and the operator initiates the automatic backwash cycle. Backwashing is preceded by a 2-minute air
scour which agitates the carbon and loosens the accumulated particles. Following the air scour, the
backwash pumps are energized and transferwastewater from the effluent tank F-1021 to the column
at a flow rate of 800 gpm for a 7 minute duration. On the average, thc GAC columns have operated
440 hours between backwashes.
The current schedule of once-per-month sampling for the lead GAC column will continue.
Conservatively assuming that the wastewater contains 1.0 ppm of organics that are adsorbed by the
GAC system and that each column can remove 1000 pounds of organics, it will take 120 million
gallons to exhaust one GAC column. At an average flow ratc of 320 gpni, a single column should
last 261 days. Other factors, however, may reduce the life of the carbon such as accumulation of
algae or calcium carbonate. If high pressure drop across a column and excessive backwashing

45
Organic Compound
Table 211. Volatile and semivolatile organic content of NRWTP GAC lead column feed wastewater
Detcct Limit Mean Max Min No. (.lrs/L) irgfl; Cr& crs/L Dct.
Summary of 17 samples
Methylene chloride 5 5 5 5 1
Acetone
Carbon disulfide
Tetrachloroethane
Table 212 Volatile and semivolatile organic content of NRWTP GAC fead column emuent wastewater
Summary of 7 samples
10 10.6 20 10 1
5 5.9 24 2 2
5 4.8 5 3 2
Endosulfan sulfate 0.10 0.095 0.1 0.02 1 I
Alpha chlordane 0.5 0.47 0.5 0.02 1
Organic Compound
Detect Limit Mean Max Min No. (Pg/L) ws/L Pg/L Cr@ Det.
Methylene chloride
Tetrachloroethane
5 4.9 5 4 1
5 4.6 5 2 1
Endosulfan sulfate
Alpha chlordane
0.10 0.089 0.1 0.02 1
0.5 0.43 0.5 0.02 1

46
Min. Cr@
0.16
Table 213
Number Detected
24
Volatile and semivolatile organic content of NRWTP GAC lag column effluent wastewater
Summary of 6 samples
In many cases for Tables 2.11,2.12, and 2.13, the reported mean concentration of a compound is less than the detection limit. This occurs when tentative identifications are reported by the analytical laboratory at concentrations less than the detection limit for the compound. These concentrations are used when calculating the mean, which sometimes reduces the mean value to levels below the detection limit.
Table 214
NRWTP GAC system mercury removal data
Sample source
Nonmetals equalization tank F- 1002
Number of Samples
Detect Limit
Plant effluent 55
66.4
0.2

47
becomes a problem, replacement of the carbon will be performed regardless of the extent of
exhaustion.
2.9 EFFLUENT TANK
The effluent from the GAC system enters Effluent Tank F-1021 for pH adjustment prior to
discharge to White Oak Creek. The tank also serves as a 26,300 gallon reservoir for backwash water
used for DM filters and GAC columns. A continuous mixer and built-in tank baffles ensure uniform
pW of the wastewater prior to discharge.
Two backwash pumps, each designed for up to 1600 gpm are provided along with discharge
control valves. The backwash system is controlled by DM filter and GAC system automatic backwash
cycles. When the backwash cycle starts, a pump is energized and the discharge flow control valve is
opened until the desired flow rate is achieved. Alarms and interlocks are provided to ensure that the
level in the effluent tank is high enough to perform the backwash without dropping the tank level
lower than mid-level.
During startup, some difficulty was encountered in tuning of the pH controller for the effluent
tank. The controller is equipped for either base or acid addition and in certain cases, both base and
acid additions would occur simultaneously. The problem was alleviated by modifying the controller
logic to prevent coinciding acid and base addition. Since there are separate controllers €or acid and
base addition, the set points for each controller can be adjusted independently. When the set points
are adjusted such that there is at least a 0.25 pfl unit span between the two (ie, 7.00 for base
controller and 7.25 for acid controller), competing acid a base addition does not occur. pH sampling
data indicates that adequate pH control has been achieved. The average pH of the NRWTP effluent
has been 7.5 with a maximum of 8.0 and a low of 6.9.
3. MAINTENANCE, SAFTiTY, ANDTRATNINGACTTVITPES
3.1 MAINTENANCE
Significant maintenance activities performed as a result of operational problems during the
first year of operation are shown in Table 3.1. There are many routine activities performed on a

4s
Table 3.1. Significant NRWTP maiatenance activities from January 1990 to March 1991
Datc Circumstance Activity
Jan. 25, 1990
Jan. 29, 1990
Feb., 1990
Mar. 17, 1990
Mar., 1990
Apr., 1990
May 13, 1990
May, 1990
J1008A D M filter feed pump shaft failed.
JlOOSB D M filter feed pump shaft failed.
Problcms with sulfuric acid metering pump used for air stripper.
Transformer feeding power to NRWTP failed.
None
F-1002 jet mixer seal leaking.
Fallen tree knocked out power to NRWTP.
Filter feed pump seal leaking.
Shaft was replaced with vendor- supplied improved shaft.
Shaft was replaced with vendor- supplied improved shaft.
Pump was replaced with a differcnt model pump with no adverse operational impacts.
Spare transformer on alternate power feed placed in service. No adverse impacts.
Replaced acid metering pump used for plant effluent pH adjustment.
Replaced seal. No impact on onerations.
Power rerouted and restored in 7 hours.
Replaced seal. No impact on operations.
May, 1990
July, 1990
July 2, 1990
Transformer failure in March. Replaced transformer with no impact on operations.
Short power loss. Power feed switched to other transformer. Additional grounding added to transformers.
Switched flow to standby pump. No
several daw later.
Transformer feeding 3608 damaged by lightning.
J100SA D M filter feed pump shaft failed. impact on operations. Shaft replaced
Sept., 1990 Improperly adjusted timer relay causing abnormal alarms during DM filter backwash.
Acid feed line to effluent tank plugged with sludge.
Sept., 1990
Timer relay adjusted with no impact on operations.
Acid feed at air stripper used to control effluent pH. Problem being investigated.
(continued)

49
Table 3-1- (continued)
Date
Oct. 6, 1990
Circumstance Activity
Relief valve on 1020 GAC column leaking.
1020 GAC column was taken off line until the valve could be repaired.
Oct. 23, 1990
Nov. 12, 1990
Nov., 1990
Nov., 1990
-
Dee. 20, 1990
Shaft broke on DM filter feed Switched flow to standby pump. No
pump. impact on operations. Shaft replaced several days later.
JlOOlA Metals wastewater transfer Flow switched to standby pump. Shaft pump shaft failed. replaced with no impact on operations.
Previous shaft failures of DM filter Level controller for filter feed tank feed pumps. retuned for smoother response.
Operator Interface Unit (OW) Spare OIU monitor installed with no monitor problems. impact on operations.
Dec. 26, 1990 J1002A Non-metals wastewater , transfer pump shaft failed.
Problems with polymer feed pump.
~ Check valve on air scour blower ' leaking water back into blower ' discharge.
JlOOl Jet mixer seal leaking.
l None
J1002B Non-metals wastewater transfer pump shaft failed.
Rupture disc failed on DM filter vessel
Used spare pump and replaced malfunctioning pump with no impact on operations.
Flow switched to standby pump. Shaft replaced with no impact on operations.
Flow switched to standby pump. Shaft replaced with no impact on operations.
Switched to standby DM filter until repairs could be made.
Replaced check valve with no impact on operations.
Jan. 22, 1991
Feb. 20, 1991
Feb. 28, 1991
Mar. 28, 1991 impact on operations.
Shut down jet mixer until repairs could be made.
JlOOl Jet mixer seal replaced. No

50
periodic basis to ensure uninterrupted and reliable plant operation. No attempt is made to detail the
routine maintenance activities in this report.
As shown in Table 3.1, there is a high frequency of pump shaft failures. The failures have
been investigated and attributed to many potential problems including poor shaft design, cavitation
of pump due to low head pressure, vibration from poorly designed support structures, and shaft
misalignment. The manufacturer supplied a redesigned shaft which also failed in several cases. One
of the shafts was replaced with a shaft manufactured at the ORNL machine shop, however, this shaft
was damaged during a pump seal replacement and was replaced with a vendor shaft. Nearly all the
pump base plates were replaced with improved structures to reduce vibration. The level controller
for the filter feed tank was retuned to respond gradually to changing feed flow rates and eliminate
cavitation. Shaft failure has not recurred since December 1990, however, pump seals have bcgun to
leak on a fairly frequent basis. Due to the ongoing difficulties with these pumps, WMO plans to
replace all of these pumps with similar type pumps made by another company. It is expected that
the replacements will be installed within the next year.
3.2 SAFETY
Safety is a key to the successful operation of any facility. The site specific safety program for
the NRWTP is an integral part of a comprehensive ORNL safety program. Safety reviews were
performed during every phase of development, engineering, and construction of the plant. Safety is
an ongoing process at the N R W " involving worker safety training, routine facility safety inspections,
weekly safcty meetings, routine maintenance of safety systems, preparation of safe work procedures,
and other activities. Procedures prepared for operation of the NRWTP include emergency
procedures used in case of power outage or other uncontrolled situations. Operators are drilled on
these emergency procedures as part of the training exercises. Managers, supervisors, and plant
operators all receive training for handling hazardous chemicals as required by the Superfund
Amendments Reauthorization Act (SARA) and the Occupational Safety and Health Act (OSHA).
In order for any non-WMO support employee to gain access to the N R W " , he must complete the
General Employee Access Training provided periodically by WMO. This training describes the
activities at the plant,potential hazards, minimum safety equipment needed for access, and emergency
procedures.

51
Design improvements have been implemented at the NRWTP which have enhanced
operational safety. Platforms have been added and exkting ladders and platforms modified to
improve accessibility of equipment which requires frequent maintenance. Discharge lines from
pressure relief devices have been piped to sump drains where workers cannot be exposed should a
over-pressuring problem occur. A "man-in-distress" pull-rope alarm was added near the filter press
in case of emergency. The pull-rope is wired to the DCS to ensure communication to the control
center operator. Employees are encouraged to point out safety related problems and to make safety
improvements through maintenance work orders.
3.3 TRAIMNG
There was a considerable amount of work performed in ensuring that the operating personnel
were well qualified to operate the plant. Training and operating procedures were developed for the
NRWTP and have undergone intense scrutiny and revision by ORNL and DOE staff personnel. The
result has been a well-trained, qualified operating group who have successfully brought the plant on-
line and maintained its operation with a minimum of errors. As operation of the plant continues,
procedures and training are continually evaluated and will remain a high priority in maintaining
successful operation of the plant.
4. OPERATIONAL DATA AND ANALYTICAL RESULTS
4.1 GENERAL SYSTEM MONITORING
Three operational check sheets are used on a routine basis by plant operating personnel. The
3608 Check Sheet is used to record wastewater flow rates, pH, polymer tank level, and effluent
radiological readings. pH readings are recorded every two hours from system controller indicators
and twice per shift for samples taken from six sample locations. Wastewater flows are recorded every
two hours and effluent radiological results are recorded every 4 hours. The 3608 Shift Check Sheet
is used by plant operators to emure that important visual checks are performed and operating
parameters are monitored. The sheet includes information vital to the operation of wastewater filters,
air filters, pumps, the air stripper, chemical feed tanks, and the plant sump. The GAC Columns sheet
is used to monitor the operation of the GAC system. A separate sheet is maintained for each column

52
and includes run dates, flow rates, cumulative flow, cumulative run time, and pressure drop data.
Pump discharge pressures are recorded periodically on the Non-rad Pump Discharge Pressure log
sheet. Figures 4.1, 4.2, 4.3, and 4.4 show the above described check sheets.
4.2 HYDRAULIC LOADING
The NRWTF' has treated and discharged 168.4 million gallons of wastewater since April 1,
1990. Table 4.1 shows the monthly volumes discharged during this time period. The maximum flow
during this time period was 730,000 gallondday with an average flow of 460,000 gallons/day. The
plant is designed to treat up to 1.09 million gallons/day. The flow rate is continuously monitored by
a NPDES monitoring station installed at the outlet of the plant effluent tank F-1021.
4 3 CHEMICAL USAGE AND SLUDGE GENERATION
The NRWTP uses sodium hydroxide and sulfuric acid on a continuous basis for pH
adjustment. In the first year of operation, the plant has used about 9000 gallons of 50% by wcight
sodium hydroxide and 2300 gallons of 93% by wt. sulfuric acid. Betz 1100 polymer is used to
flocculate and improve the settling characteristics of precipitated metals and diatomaceous earth is
used the precoat the filter press for sludge dewatering. Approximately 650 pounds of dry Betz 1100
and 1400 pounds of diatomaceous earth were used in the first year of operation.
Based on a filter press capacity of 24 cubic feet and a total of 28 filter press runs performed
during the first year of operation, 672 cubic feet of sludge from the N R W " metals treatment
process have been generated, The sludge has been packaged in 14 steel boxes, each with a capacity
of 64 cubic feet. It is further handled by the Solid Waste Operations Department as an LSA waste
and will be transported for storage to the DOE K-25 facility in Oak Ridge, TN.
4.4 PLANT 'INFLUENT AND EFFLUENT CONTAMINANT LEVELS
Samples of influent and effluent wastewaters are taken at the plant to monitor the
composition of the plant feed wastewater, assess the performance of treatment systems, and to
demonstrate compliance with the NPDES permit. Plant influent grab samples to be analyzed for
organic contaminants are taken from the non-metals equalization tank F-1002. The wastewater from

53 3608 CHECK SHEET
Date Operator (0700-1 900) (1 900-0700)
I I I Polymer
r
F-1017 I ! 2400 I F-1021 0400
Reviewed 1900-0700 Shift Foreman
TX-5537, R 0 (1 0/23/90)
F i g . 4.1 . 3608 Check Sheet
54 3603 SHIFT CHECKS
Date Operator
1.
2.
3.
4.
5.
6.
7.
8.
9.
10.
Check the containment area sumps once per shift to confirm no leaks (indicate by check).
Check caustic tank and pumps once per shift and record tank level. If <20%, notdy Supervisor.
Check the acid feed pumps once per shift and record tank level. If <20%, notrfy Supervisor.
Record the level in the polymer tank once per shift at the indicated times.
Check flow through F-1013 at least twice per shift (indicate by checks).
Check pump oil cups at least twice per shift (indicate by checks).
Record the pressure drop across the air stripper and confirm each rotameter is set at 112 scale ( i the pressure drop exceeds 2 psi, clean the air stripper).
Record the pressure drop across the F-1009 dual-media fitters once per shift (id (0900) the pressure drop exceeds 15 psi, F-lo09 backwash the filters). (21 DO)
F-1010 (0900)
(21 00) F-1010
Record the pressure drop across the HEPA fitters once per day in fitter press room.
Visually check final effluent tank discharge for inadvertent chemical or GAC discharge.
(0700-1 900)
(0900)
--
psi (0900)
(1 900-0700)
(21 00)
_ I ~
--
psi (21 00)
/LocaQ Inlet Outlet DCS A P
psi psi psi
psi psi psi
p s i psi psi
psi psi psi
--- Pre ABS1 ABS2
Comments
Reviewed 1900-0700 Shift Foreman TX-5536, R 2 (04/17/91)
F i g . 4 . 2 . 3608 S h i f t Checks
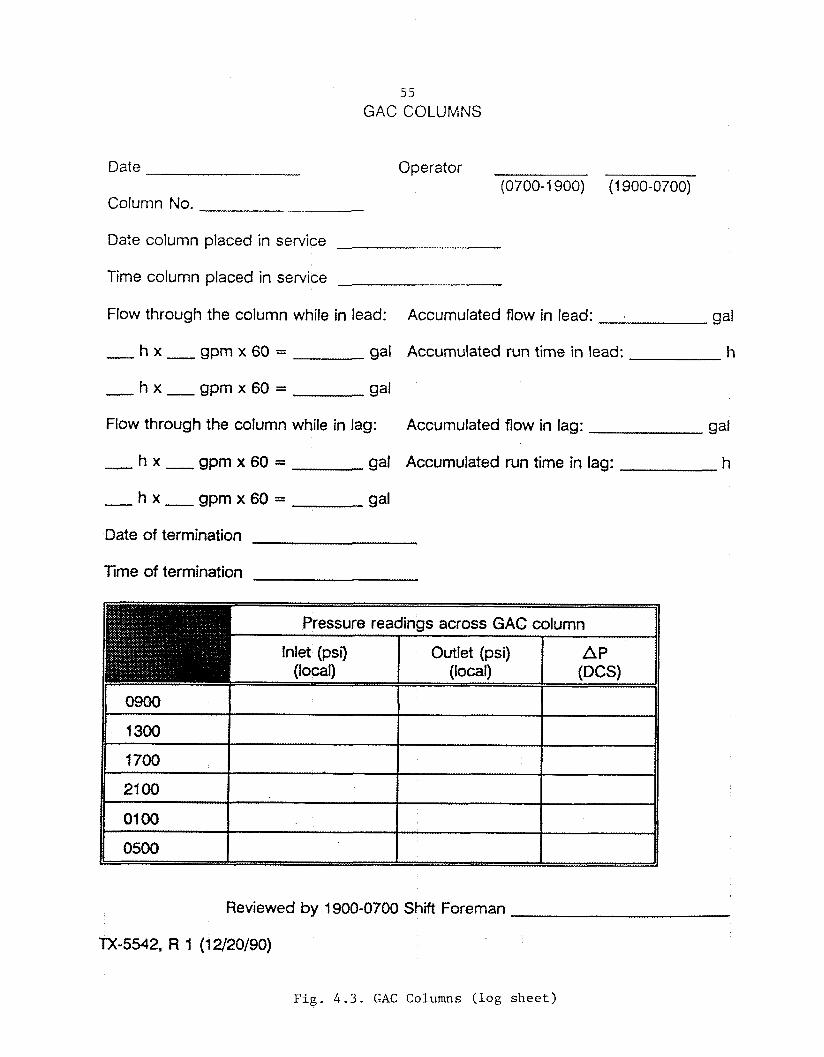
55
GAC COLUMNS
Date Operator (0700-1 900) (1 900-0700)
Column No.
Date column placed in service
Time column placed in service
Flow through the column while in lead: Accumulated flow in lead: 9aJ
- h x - gpm x 60 = gal Accumulated run time in lead: h
Flow through the column while in lag: Accumulated flow in lag: gal
- h x - gpm x 60 = gal Accumulated run time in lag: h
Date of termination
Time of termination
Reviewed by 1900-0700 Shift Foreman
TX-5542, R 1 (12/20/90)
F i g . 4 . 3 . GAC Columns ( log sheet)
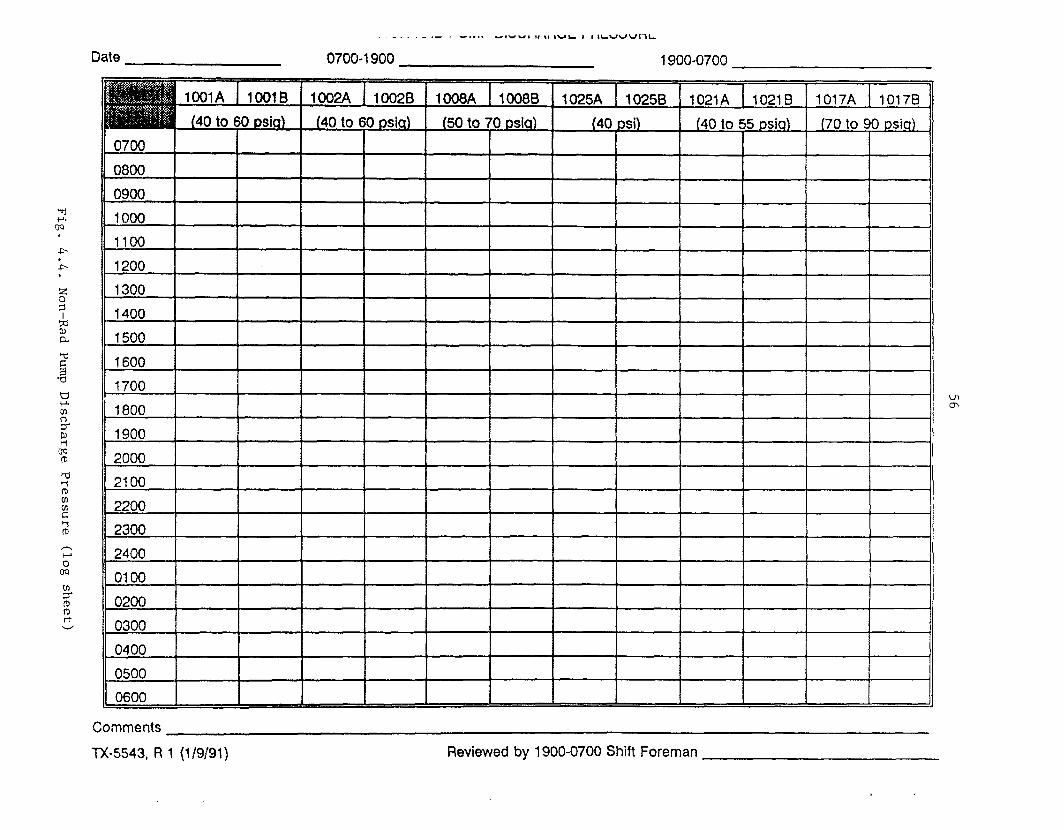
Date . - . . . - ._ . -.... I1wwI IUL I I ILwuuriL
0700-1 900 1900-0700
Comments
TX-5543, R 1 (1/9/91) Reviewed by 1900-0700 Shift Foreman
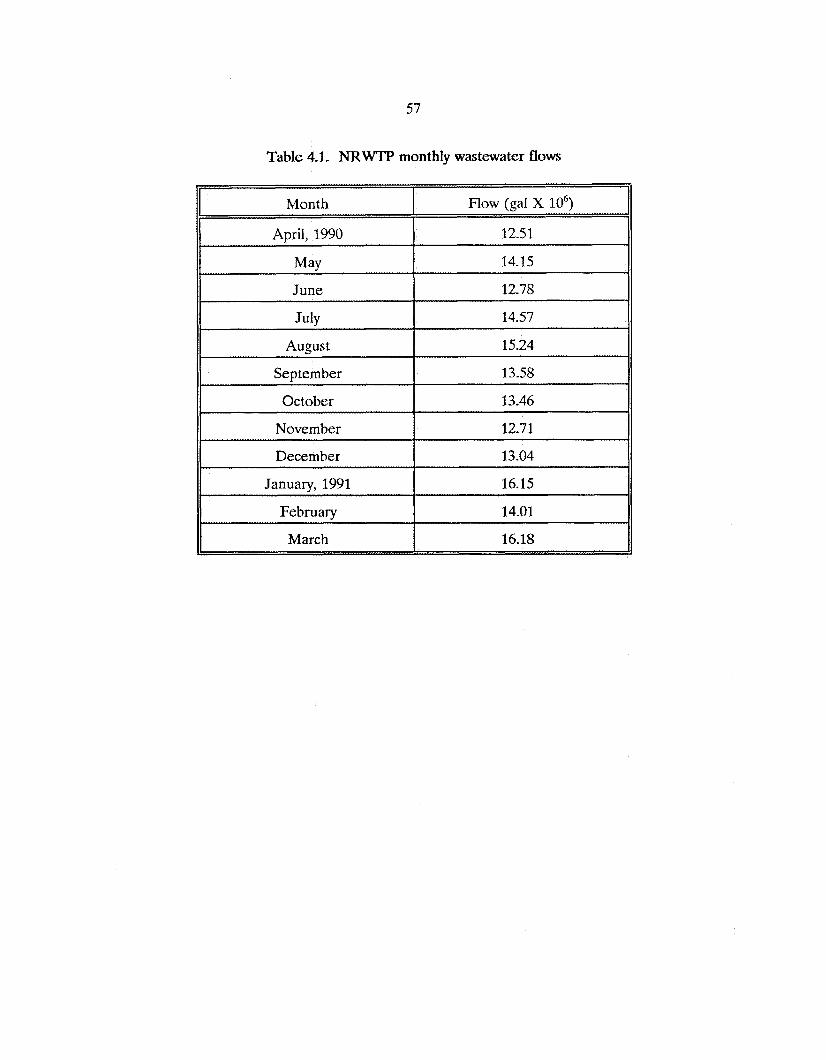
57
Table 4.1. NRWTP monthly wastewater flows
Month
April, 1990
May
June
July
August
September
October
November
December
January, 1991
February
March
Flow (gal x lo6)
12.51
14.15
12.78
14.57
15.24
13-58
13.46
12.71
13.04
16.15
14.01
16.18

58
metals equalization tank F-1001 which comprises less than 8 percent of the total plant flow is not
likely to contain organic contaminants. It is composed of ion-exchange regenerant solutions from the
Steam Plant, acid cleaning solutions, and recycled backwash water which contains essentially no
organic contaminants. The non-metals wastcwater from F-1002, therefore, is used to monitor the
levels of organic contaminants entering the plant. Grab samples are also taken from F-1002 for
metals analysis to verify that metals and non-metals wastewaters are adequately segregated. The
samples are taken at the F-1002 transfer pumps by Waste Management Operations and submitted
to ORNL Analytical Chemistry Division for analysis of volatile organics, semi-volatile organics, and
total metals. To characterize the plant feed wastewater during the. plant startup, samples were taken
on a daily basis for the entire month of March, 1990. After March, sampling frequency was rcduced
to once per month.
Additional grab samples are taken to verify pH and analyze for radiological composition. To
verify the pH readings of the on-line pH monitors located in F-1002 equalization tank and F-1021
effluent tank, grab samples are drawn every 12 hours and checked using a bench-top pH metcr. pH
discrepancies are reported to the shift foreman. Plant effluent grab samples are drawn every 4 hours
and submitted for radiological analysis.
To demonstrate compliance with the NPDES permit, plant effluent samples are taken by the
Office of Environmental and Health Protection €or analysis of the regulated contaminants. The
compliance samples are taken by an automatic sampler once per week as a 24 hour composite.
The results of mctals analysis of the influent wastewater which collects in the non-metals
equalization tank F-1002 is summarized in Table 4.2. The samples are grab samples taken from the
discharge of the F-1002 pump which transfers wastewater to the filter feed tank F-1008. The samples
are collected in one-liter containers and acidified with nitric acid which dissolves any metals that may
have existcd as a suspended precipitate. In some cases, the metal concentrations exceed the discharge
limits proposed in the September 1990 NPDES permit renewal application, however, they are usually
in the form of suspended precipitates which are removed by the plant D M filters. The results
confirm that the segregation of metals and non-metals wastewater for the two equalization tanks has
been successful. Table 4.3 summarizes the metals analysis results of compliance samples taken at the
plant effluent. The samples are 24-hour composites taken once per week. The metal concentrations
are well below the former discharge permit levels and only one exceedance (copper at 0.23 ppm) of
the proposed discharge limits of the renewal application is indicated. The zinc concentration has
approached, but not exceeded the proposed discharge limit on several occasions.

59
A separate grab a m p l e was obtained and submitted for mercury analysis. A total of 24 samples were acquired for mercury analysis during the year
Samples from the nonmetals equalization tank F-1002 were grab samples taLen from the discharge of the F-1002 transfer pumps A one liter sample IS taken and acidified wth nitnc acid to preserve Any precipitated suspended metals in the sample are dissolved as a result of the acidification
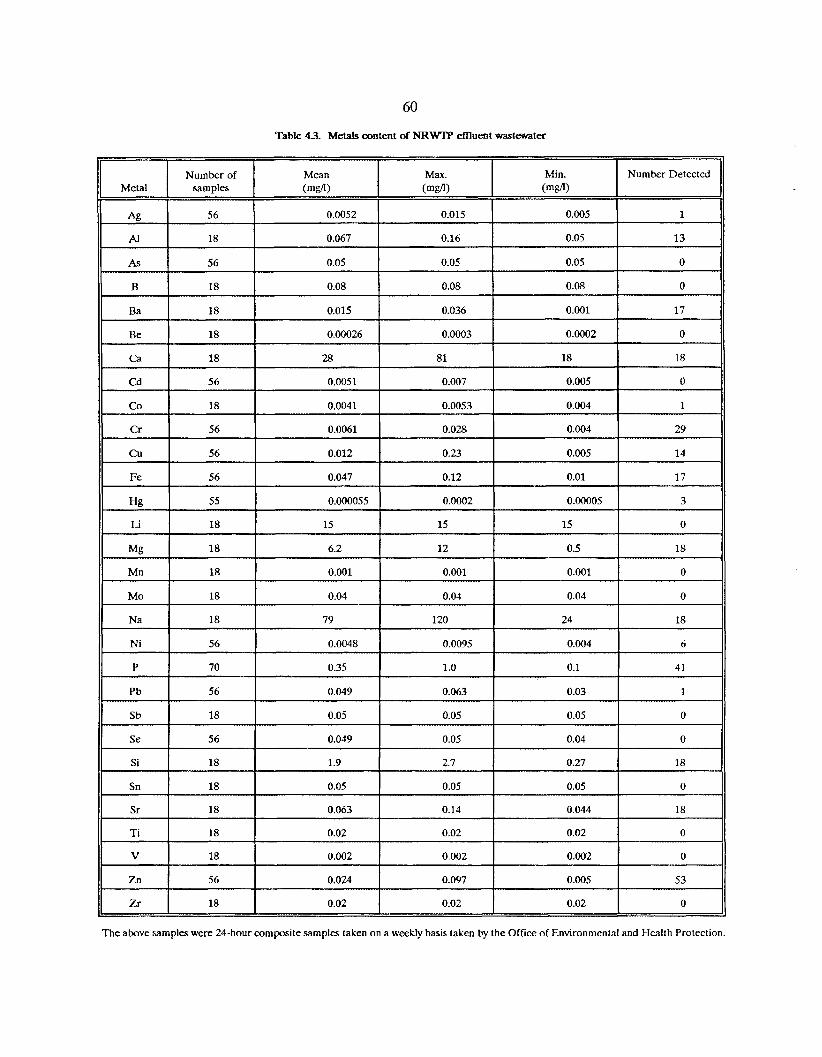
60
Table 43. Metals content of NRWTP effluent wastewater
Cr 56 0.0061 0.028 0.004 29
56 0.012 0.23 0.005 14
Fe 56 0.047 0.12 0.01 17
Hg 55 0.000055 0.0002 0.00005 3
Li 18 15 15 15 0
Mg 18 6.2 12 0.5 18
Mn 18 0.001 0.001 0.001 0
Mo 18 0.04 0.04 0.04 0
Na 18 19 120 24 18
56 0.0048 0.0095 0.004 6
70 0.35 1.0 0.1 41
Pb 56 0.049 0.063 0.03 1 I Sb 18 0.05 0.05 0.05 0
0.049 I 0.05 I 0.04 I 0
Si I 18 I 1.9 I 2.7 I 0.27 I 18
Sn I 18 I 0.05 I 0.05 I 0.05 I 0
Zr 18 0.02 0.02 0.02 0
The above samples were 24-hour composite samples taken on a weekly basis taken by the Office of Environmental and Health Protection.

61
An NPDES monitoring station is provided which continuously monitors wastewater pH and flow rate
at the outlet of the effluent holding tank F-1021. The average pH of the plant effluent for the first
year of operation was 7.5 with a maximum of 8.0 and a minimum of 6.9. The average flow through
the plant for the first year of operation was 460,000 gallons/day with a maximum of 730,000
gallons/day and a minimum of 240,000 gallons/day. No permit violations were experienced for these
two parameters.
Table 4.4 summarizes the results of volatile and semivolatile organic analyses of wastewater from
tank F-1002. As shown, organics that are typically detected in the wastewater include acetone,
chloroform, and methylene chloride. They are present at levels below 1 ppm and are effectively
removed from the wastewater by the air stripper and GAC system. Plant effluent organic analyses
are summarized in Table 4.5. In most cases, effluent organic compounds are non-detectable. The
only organic compounds detected at measurable levels above the detection limit were bis(2-
ethythexy1)phthalate and di-n-octylphthalate. These compounds are not regulated for waters where
f s h and aquatic life must be protected. Although White Oak Creek is not used for recreation, the
Tennessee Water Quality Criteria Summary regulates these compounds in recreational waters at levels
several orders of magnitude above the concentrations found in these samples. In many cases in
Tables 4.4 and 4.5, organic compounds are only tentatively identified at levels below the actual
detection limit. When these concentration values are used to calculate the mean concentration of
the material, the mean values are sometimes below the detection limit of the compound.
Analysis of mercury concentrations of the wastewater grab samples from tank F-1002 and the
plant effluent compliance sampling indicates that effective mercury removal is performed. The
mercury is adsorbed by activated carbon of the GAC system. Table 2.14 summarizes the analytical
data.
45 REACTOR CLARIFIER PERFORMANCE SAMPLING
Grab samples of wastewater from the metals equalization tank F-1001 and the effluent of the
reactor clarifiers were taken by Waste Management Operations once during each semi-batch
treatment and once per week once continuous treatment commenced. The samples are submitted
for metals analysis to monitor the performance of the metals removal systems. pH readings and
polymer tank level are recorded on check sheets every two hours to ensure proper conditions for
metals removal.

62
Table 4.4. Volatile and semivolatile organic content of NRWTP plant feed wastewater
Summary of 36 samples
Detect Organic Compound Limit Mean
(Crs/L) Crs/L
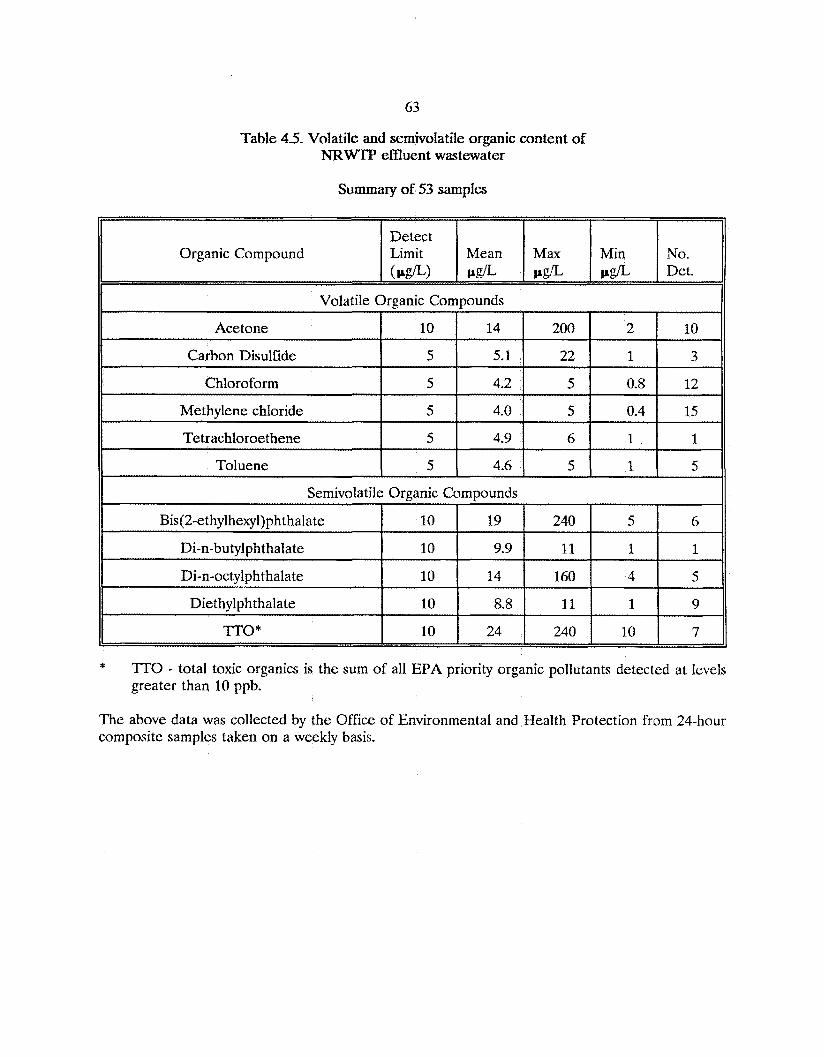
63
Organic Compound
Table 4.5. Volatile and semivolatile organic content of NRWTP effluent wastewater
Detect Limit Mean Max Min No. (CrG/L) PdL PdL Prg/L Det.
Acetone
Carbon Disulfide
Chloroform
Methylene chloride
Te trachloroet hene
Toluene
10 14 200 2 10
5 5.1 22 1 3
5 4.2 5 0.8 12
5 4.0 5 0.4 15
5 4.9 6 1 1
5 4.6 5 1 5
Bis(2-ethylhexy1)phthalate
Di-n-butylphthalate
Di-n-octylphthalate
Diethylphthalate
TTO*
10 19 240 5 6
10 9.9 11 1 1
10 14 160 4 5
10 8.8 11 1 9
10 24 240 10 7

64
Samples of wastewater entering and exiting the reactor clarifiers indicate that heavy metals were
effectively removed. Table 2.2 gives the reactor clarifier influent and effluent concentrations of
metals during the semi-batch operation. To remove some of the suspended solids prior to analysis,
the effluent samples were allowed to settle for one hour and were decanted into another sample
container. After decanting, the effluent samples were acidified with nitric acid to preserve the
sample. Since the samples were not filtered, any remaining suspended solids were redissolved upon
acidification. In many cases, the effluent concentration of the metal was less than the detection limit
making it impossible to determine the full extent to which the metal was removed. Table 2.3 gives
the average percent removals of the metals. The use of the detection limit as the lower limit of
removal, and the fact that the effluent samples were not filtered gives significant conservativeness to
the removal rates. When the operation of the metals removal system was changed from semi-batch
to continuous, samples of the reactor clarifier inlet and outlet wastewater were taken on a weekly
basis. Table 2.4 summarizes the results of the sample analyses. The data indicates that metals
removal is improved for some metals and not quite as good for others, although NPDES permit
compliance is maintained. The operational difficulties and suspended solids carry-over from semi-
batch treatment are no longer a problem with the continuous treatment mode.
4.6 AIR STRIPPER SAMPLING
Initial sampling of the plant influent and effluent wastewaters indicated that organic
contaminants were effectively removed by the GAC system and air stripper. After 7 months of
operation, sampling of air stripper inlet and outlet wastewaters commenced. Grab samples are taken
once per week by Waste Management Operations. The samples are analyzed €or volatile and semi-
volatile organic content to evaluate air stripper performance.
Sample results given in Tables 2.9 and 2.10 indicate that volatile organic contaminants are
successfully removed. The tables indicate only those organics that were detectable during the
complete volatile and semi-volatile organic analyses as given in Table 2.8. The levels of organics are
typically very low at the air stripper inlet and in many cases, the levels are below the detection limit
and are only tentatively identified. It is clear, however, that the number of tentative identifications
is much lower in the air stripper effluent stream.

65
4.7 GAC SYS'IEM SAMPLING
In the early months of plant operation, the removal of organics was evaluated based on analysis
of samples taken at the plant inlet (tank F-1002) and outlet (tank F-1021). Based on the organic
content of the feed wastewater, it was decided that breakthrough of the activated carbon was
extremely unlikely until several months of operation had transpired. After 5 months of plant
operation, sampling of GAC column inlet and outlet wastewater commenced to determine the extent
of carbon exhaustion. Grab samples at the inlet and outlet of the lead GAC column and the outlet
of the lag column are taken once per month by Waste Management Operations. The samples are
analyzed for volatile and semi-volatile organics and mercury. Plant effluent wastewater samples
(which are essentially samples of the lag column outlet wastewater) are taken more frequently by
Environmental Compliance, and are also used as a means of evaluating GAG system performance.
In most cases, the test results indicate very low or non-detectable levels of organic materials and
mercury in the GAC system influent stream. Table 2.11, the lead GAC column inlet data, is also the
data which represents the organic content of the air stripper outlet wastewater. Tables 2.12 and 2.13
give a summary of lead and lag column effluent streams for a limited number of samples. Only those
organics that were detected during the full volatile and semivolatile organic analysis are given. In
every case, the organic compounds were detected on a tentative basis at levels below the normal
detection limit. The analysis of the plant effluent wastewater given in Table 4.5 represents a more
extensive analysis of the lag GAC column outlet. The effluent data indicates that acetone is the only
volatile organic compound whose mean level is above the detection limit. Acetone is not removed
by activated carbon as well as many other organic materials due to its polar nature and high solubility
in water. The higher levels of acetone in the plant feed wastewater (Table 4.4), however, is an
indication that air stripping and activated carbon remove a large portion of the acetone. Several
phthalate compounds were detected both in the plant feed and effluent wastewaters. As discussed
in Section 4.4, the levels of these compounds are not of concern based on the TDHE Water Quality
Criteria Summary and the non-recreational use of White Oak Creek.
Table 2.14 summarizes the GAC system influent and effluent concentrations of mercury. In
most cases, mercury concentrations are reduced to levels below the detection limit. With the
detection limit as the baseline mercury concentration, the average removal rate is 98%.

66
The analytical data collected since plant startup has not indicated that the carbon in any of the
columns has been exhausted. Monthly grab samples will continue to be taken for complete organic
and mercury analyses of the influent and effluent wastewater for the lead GAC column.
4.8 SLUDGE SAMPLING
In characterization of filter cake samples in the pilot plant treatability study, it was found that
the sludge did not contain heavy metals in high enough concentrations to be considered a hazardous
waste based on the Resource Conservation and Recovery Act (RCRA) Extraction Procedure (EP)
toxicity tests. However, the sludge was found to contain low amounts of radioactive contaminants
and it was therefore anticipitated that the sludges would be handled as Low Specific Activity (LSA)
wastes. E P toxicity tests and radionuclide analyses have been conducted on the actual sludge
produced at the NRWTP with similar results as shown in Tables 2.5, 2.6, and 2.7.
Radiation field intensity on the surface of the sludge containers as measured by ORNL
Radiation Protection representatives has varied from 0.2 to 1.0 m r h r which is far below the K-25
Waste Acceptance Criteria limit of 50 mrhr and the Department of Transportation limit of 200 mrhr
for LSA waste. A total of 672 cubic feet of waste sludge has been produced since February 1990.
Further testing of the sludges is being performed using the Toxicity Characteristic Leaching
Procedure (TCLP), now required by the EPA, to verify the non-hazardous nature of these sludges.
4.9 EFlFlLuENT TOXICITY MONITORING
As required in Part V of the existing ORNL NPDES permit, toxicity testing has been conducted
every two months since February 1990. The required 7-day chronic tests were conducted using both
Cetiodnphnia and fathead minnows. In all of the seven tests conducted, the no-observed-efFect-
concentration (NOEC), the highest tested concentration causing no reduction in survival or
reproduction of Ceriodnphnin was 100 percent. In the case of the fathead minnow, the NOEC for
survival and growth was also 100 percent in every case.

67
5.0 DESIGN IMPROVEMENTS AND FUTURE A-
Many design improvements have been made during the first year of plant operation to improve
performance and safety at the NRWTP. In addition to these, there are plans for future upgrades
which will more fully utilize the NRWTP systems for process wastewater treatment.
5.1 PHASE 1 IMPROVEMENTS
In April 1990, a group of miscellaneous design improvements were identified and implemented
in a package designated "Phase 1 Improvements". The design improvements included the. following:
1) Rerouting of air release valve discharge lines on the GAC columns and D M filters to the trench
drain.
2) Installation of a platform for access to the top of the caustic tank F-1025.
3 ) Platform improvements for maintenance in the filter press room.
4) Rerouting the air stripper acid wash discharge to the diked area sump.
These improvements enhanced the safe operation of the plant and reduced the risk of accidental
uncontrolled release of wastewater. T h e Phase 1 improvements were complete in November 1990.
5.2 SuI;FuRIC ACID SYSTEM
T h e problem experienced with the sulfuric acid system is still under investigation. The source
of the sludge which plugged the transfer line from the holding tank to the effluent tank F-1021 is yet
to be determined. The transfer line has been replaced with a 316 L stainless steel line and the flow
of acid through the line has gone uninterrupted for several weeks. In removing the old carbon steel
line, visual inspection revealed that the line was plugged along the entire length and that the pipe
walls had not undergone significant thinning. This would indicate that the source of the sludge may
be the holding tank. The holding tank has been inspected by ORNL Quality Assurancc personnel

68
and no significant thinning of the tank walls was detected. Since there is little evidence of excessive
corrosion of transfer lines or the holding tank, it is suspected that the acid, as supplied, may have
contained large amounts of sludge. Samples of the suppliers acid, however, were not obtained in the
past on a routine basis and recent samples do not appear to have a high sludge content.
The tank contents must be inspected to determine the amount of sludge present, however,
breaching of a sulfuric acid holding tank for inspection and cleaning is a major undertaking. All the
acid must be removed and the tank must be redried before reloading with acid. Safety and work
proccdures must be extensive and very carefully prepared. At the present time, the volume of acid
in the tank is being reduced to a minimum with normal usage. In addition, options are being
investigated for inspection and detection of sludge in the tank using ultrasonic or sonar equipment.
This equipment might be used to inspect the tank contents without breaching the tank.
5.3 IMF'ROVEMENT OF TRANSFER PUMP BASE STRUCTURES
During pre-startup checkout or NRWTP systems, vibration was noted in the vicinity of several
wastewater transfer pumps. Though the Vibration was not at a level that would have justified delay
of plant startup, plans were made to modi@ and improve the base and support structures of the
transfer pumps. These activities began in November, 1990 as a part of the Phase I1 Improvements
project. The support structures of wastewater transfcr pumps for equalization tanks F-1001 and F-
1002, and the filter feed tank F-1008 were modified and improved to dampen vibration. The work
was complete by January 1991.
5.4 EQUIPMENT ACCESS II"ROVEMEN?S AND ROOF DRAIN REROUTING
Phase I1 improvements also included addition and modification of equipment access structures
and rerouting of roof drains from the NRWTP plant sump to a storm drain location. These activities
improve the safety of maintenance activities and prevent unnecessary treatment of the rainwater
runoff from the roof of building 3608. Modifications to existing access ladders were performed and
additional access platforms were constructed for several areas of the plant. The access ladder for
tank F-1001 was modified to improve the safety of two ladder platforms. Platforms with handrails

69
were added for maintenance activities for the HVAC system located over the control room and
restroom areas in building 3608. The roof drains for building 3608 were modified to divert the
rainwater from the plant sump to a storm drain and a Category I1 outfall at White Oak Creek These
improvements were completed in January 1991.
5 5 REACTOR CLARIFlER MODIFICATIONS
A General Plant Project is currently being planned for increasing the wastewater feed capacity
of the PWTP, which treats wastewater for removal of trace quantities of radioactive contaminants and
discharges effluent to the NRWTP non-metals equalization tank F-1002. The plan involves making
use of the extra capacity of the NRWTP metals treatment system by modifying one of the two reactor
clarifiers and using it to soften radiological process wastewater prior to ion-exchange treatment. The
existing softenedclarifier at the PWTP limits the throughput of the plant. The metals wastewater
currently generated for treatment at the N R W " would be combined with the radiological
wastewater in tank F-1001. The softening reaction will be performed at a wastewater pH of 11.5
which is suitable for removal of heavy metals. The existing reactor clarifier will be modified to allow
operation as a sludge-blanket clarifier. This will involve installation of internals which will provide
a larger slow-mix zone and an up-flow sludge blanket zone. The effluent from the modified reactor
clarifier will be transferred to the PWTP for ion-exchange treatment. The additional quantities of
sludge generated at the NRWTP will be handled using the existing sludge holding tank and filter
press. The current schedule for this upgrade shows construction beginning in late 1992 or early 1993.
6. SUMMARY AND CONCLUSIONS
During the first year of operation, the NRWTP received and successfully treated 165.4 million
gallons of process wastewater. With the help of effective training programs and operating
procedures, the plant operating staff has successfully brought the plant on-line and maintained its
operation with a minimum of errors. The system has performed very well despite some equipment
problems that were encountered. None of the former NPDES permit limits were violated and
wastewater effluent toxicity studies indicate no detrimental effect to aquatic life. Some changes were

70
necessary to improve operation of the metals removal system due to the change in fcedwater
conditions. Based on analytical results, there was no basis for changing the operating conditions of
either the air stripper or the GAC system. Sludge handling systems, likewise, have operated in an
acceptable manner. Many design improvements have been provided which have enhanced employee
safety and plant reliability. Safety will continue to be a top priority in operation of the plant.
Optimization activities will not end with completion of this report, but will continue as an ongoing
process to ensure the highest possible wastewater quality and to respond effectively to addition of
new feed wastewaters and changing wastewater conditions.
7. REFERENCES
1.
2.
3.
4.
5.
Conceptual Design Report for Nonradiological Wastewater Treatment Project, Document Number X-OE-293, Martin Marietta Energy Systems, Inc., Oak Ridge National Laboratory, prepared for the United States Department of Energy, May 1985.
Design Criteria for Nonradiological Wastewater Treatment Project, Document Number X-OE- 299, Martin Marietta Energy Systems, Inc., Oak Ridge National Laboratory, prepared for the United States Department of Energy, July 1985.
Begovich, J. M., Brown, C. H., Villiers-Fisher, J. V., and Fowler, V. L., Treatability Studies in Support of the Nonradiological Wastewater Treatment Project, ORNLITM-10046, Martin Marietta Energy Systems, Inc., Oak Ridge National Laboratory, Oak Ridge, TN, July 1986.
Taylor, P. A, and McTaggart, D. R., Segregation of Metals-Containing Wastewater by pH, ORNLKM-11406, Martin Marietta Energy Systems, Inc., Oak Ridge National Laboratory, Oak Ridge, TN, October 1990.
DOE Order 5400.5: Radiation Protection of the Public and the Environment, United States Department of Energy, Oak Ridge Operations, Oak Ridge, TN, April 1990.

INTEiRNAL DISTIUBUTlON
1. 2. 3. 4. 5-9. 10. 11-12. 13. 14. 1s. 16. 17. 18. 19. 20-22. 23. 24. 25-29. 30. 31. 32. 33-34. 35. 36.
37.
38.
39.
40-51.
P. T. Barton S. E. Breeding R. A. Dean S. M. DePaoli T. E. Kent C. M. Kendrick J. J. Maddox C. A. Manrod L. E. McNeese J. C. Nix J. R. Parrott, Jr. D. J. Peterson S . M. Robinson T. F. Scanlan C. B. Scott P. A. Taylor W. T. Thompson C. K. Valentine Waste Management Documentation Management Center ORNL Central Research Library Y-12 Technical Library Laboratory Records Department Laboratory Records, RC ORNL Patent Section
EXTERNAL DISTRIBUTION
J. S . Greer, U.S. Department of Energy, Oak Ridgc Operations, Federal Building, Oak Ridge, T N 37831
Tony Ferre', US. Department of Energy, Oak Ridge Operations, Federal Building, Oak Ridge, T N 37831
OEfice of Assistant Manager, Energy Research and Developmcnt, DOE-ORO, Oak Ridge, TN 37831
Office of Scientific and Technical Information, P.O. Box 62, Oak Ridge, TN 37830
![X M J N W T P V M U T P S M J R M Q P O N M L … i U P a m l b k ^ _ j i a Q P b c P d b ` i _ ] h g M P b f ] ` e d a \ P _ c P b ] ^ a ` _ ^ ] X T X O T M J \ P M T U K [ S M P](https://img.pdfslide.net/doc/110x75/5c611d2e09d3f21b6a8c8fb5/x-m-j-n-w-t-p-v-m-u-t-p-s-m-j-r-m-q-p-o-n-m-l-i-u-p-a-m-l-b-k-j-i-a-q-p-b-c.jpg)


![576 8 69;: =@?BADCEC Fskuhlman/SLIDEIMP.pdfwyi p tBH}J"`b plJztBi plSPiEH &Wqp S w T»XYWYcui T H H}ik uHKi j iDc pÉT p W]Jzc M raj}j `P\ i p S T p WYj j}`um S p S T p](https://img.pdfslide.net/doc/110x75/5d3335b388c993d91a8c79b0/576-8-69-badcec-f-skuhlman-p-tbhjb-pljztbi-plspieh-wqp-s-w-txywycui.jpg)