Embed Size (px)
Citation preview

THE HEALTH THE HEALTH SYSTEMS OF SYSTEMS OF
CANADA & THE USACANADA & THE USA
Pauline Vaillancourt Rosenau, Ph.D.Pauline Vaillancourt Rosenau, Ph.D.Division of Management, Policy, and Division of Management, Policy, and
Community Health Community Health UT Houston - School of Public Health UT Houston - School of Public Health
forforDoctor of Nursing Practice students
Room 706Room 706University of Texas School of Nursing
Thursday, February 17, 2011

OVERVIEW
Describe the Canadian health system and clear up some myths
Compare the two countries on CostsHow patients experience it How hospitals and doctors experience it Judging Canada and the USA on
performanceStrengths and Weakness of eachTry to figure out why
2

THE FIVE PILLARS OF THE “CANADA HEALTH ACT”
Public administration
Comprehensiveness
Portability
Universality
Accessibility
3
LIVING AND WORKING IN THE CANADIAN SYSTEM
With few exceptions, Canadians NEVER worry about incurring health care expenses.
Nor do Canadians have to submit claims to insurers.
Providers have ONE payer to submit claims to: the provincial government.
Canadian system is largely funded by general tax revenue - 25-50% federal.
4
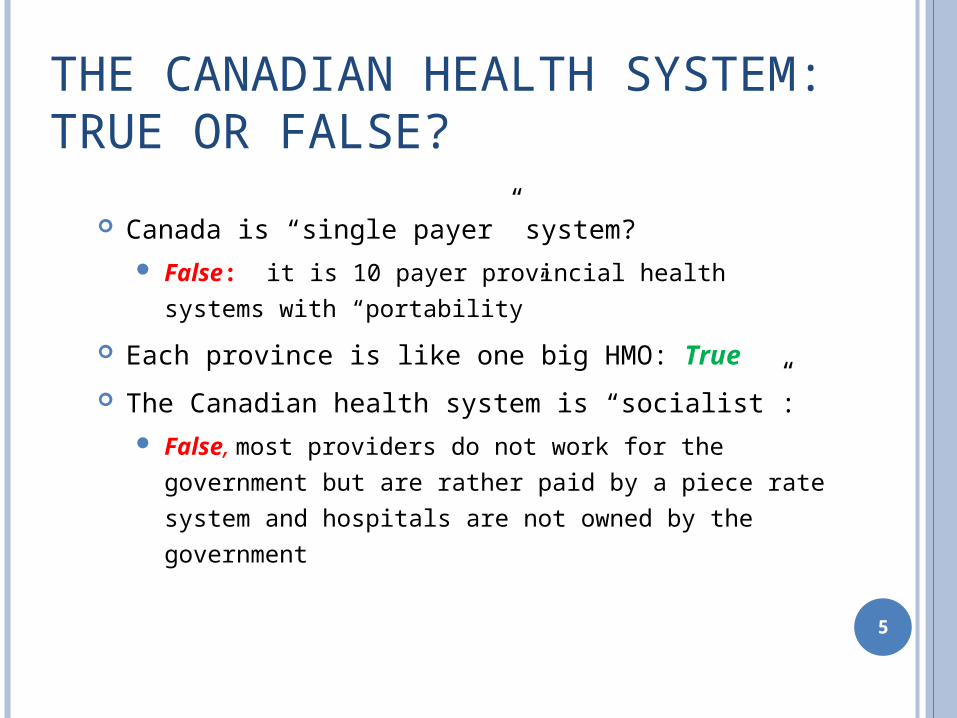
THE CANADIAN HEALTH SYSTEM:TRUE OR FALSE?
Canada is “single payer” system? False: it is 10 payer provincial health systems with
“portability”
Each province is like one big HMO: True
The Canadian health system is “socialist”: False, most providers do not work for the government
but are rather paid by a piece rate system and
hospitals are not owned by the government
5

THE CANADIAN HEALTH SYSTEM:TRUE OR FALSE? The Canadian government controls the
health system top – down False: federal – provincial authorities negotiate the
basics ; for example privatization
In Canada the bureaucracy wastes precious health care resources? False: The % of $ used for administration is much lower in
Canada than in the USA Billing is straightforward and electronic with 95% of
requested reimbursements completed.
6

THE CANADIAN HEALTH SYSTEM:TRUE OR FALSE?
In Canada the government controls prices? False: The government sets a budget, the
doctors set the payment rates in most provinces Canadians ration care by age, need, and
SES False: there are no policies that restrict care
on the basis of age, need, or socioeconomic status. Such discrimination is illegal
Canada allows euthanasia. False: Some US states have laws permitting
euthanasia but none of the provinces in Canada do. 7

8
USA COSTS WAY MORE THAN OTHER COUNTRIES

Health expenditure per capita varies widely across OECD countries.
The United States spends almost two-and-a-half times the OECD Average20
07
1. Health expenditure is for the insured population rather than resident population.2. Current health expenditure.
Source: OECD Health Data 2009, OECD (http://www.oecd.org/health/healthdata).
9
See slide : Commonwealth Fund International Health Policy Survey: Adults’ Health Experiences in seven Countries, 2007 – for methodology
10

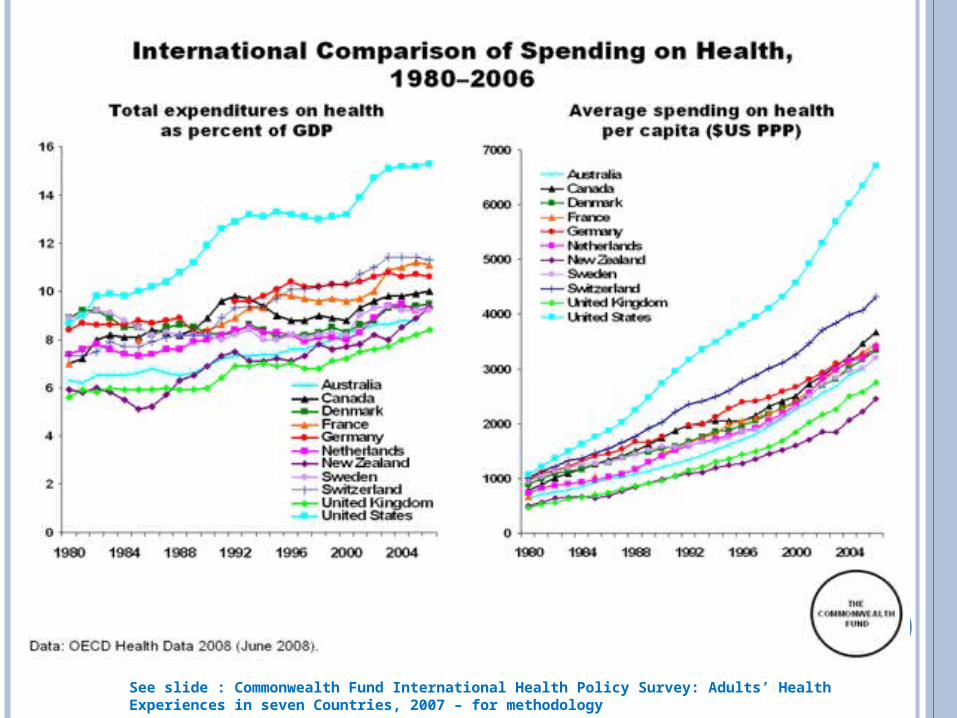
INTERNATIONAL COMPARISON OF SPENDING ON HEALTH, 1980–2008
0
1000
2000
3000
4000
5000
6000
7000
8000
1980
1981
1982
1983
1984
1985
1986
1987
1988
1989
1990
1991
1992
1993
1994
1995
1996
1997
1998
1999
2000
2001
2002
2003
2004
2005
2006
2007
2008
United StatesNorwaySwitzerlandCanadaNetherlandsGermanyFranceDenmarkAustraliaSwedenUnited KingdomNew Zealand
Average spending on healthper capita ($US PPP)
0
2
4
6
8
10
12
14
16
1980
1981
1982
1983
1984
1985
1986
1987
1988
1989
1990
1991
1992
1993
1994
1995
1996
1997
1998
1999
2000
2001
2002
2003
2004
2005
2006
2007
2008
United StatesFranceSwitzerlandGermanyCanadaNetherlandsNew ZealandDenmarkSwedenUnited KingdomNorwayAustralia
Total expenditures on healthas percent of GDP
Source: OECD Health Data 2010 (June 2010).

See slide : Commonwealth Fund International Health Policy Survey: Adults’ Health Experiences in seven Countries, 2007 – for methodology
12

WHY IS DOES THE US HEALTH SYSTEM COST SO MUCH?
Administration accounted for the largest share of this difference (39%),
Payments to MDs and hospitals accounted for (31%) of the next most important variables explaining difference
More intensive provision of medical services accounted for the was the third most important variable in explaining the difference (14%).
Research by professors from Harvard and Un. Of California in summer 2010; Inquiry
13

Pozen and Cutler. Inquiry. 2010 Summer;47(2):124-34
14

EXHIBIT 12. HIGH U.S. INSURANCE OVERHEAD: INSURANCE-RELATED ADMINISTRATIVE COSTS
Fragmented payers + complexity = high transaction costs and overhead costs
McKinsey estimates adds $90 billion per year*
Insurance and providers
Variation in benefits; lack of coherence in payment
Time and people expense for doctors/hospitals
$76$86
$140$191$198
$220$247
$516
$0
$100
$200
$300
$400
$500
$600
US FR SWIZ NETH GER CAN AUS* OECDMedian* 2006
Source: 2009 OECD Health Data (June 2009).
Spending on Health Insurance Administration per Capita, 2007
* McKinsey Global Institute, Accounting for the Costs of U.S. Health Care: A New Look at Why Americans Spend More (New York: McKinsey, Nov. 2008).

AND IT IS ALSO ABOUT GOVERNMENT INTERVENTION AND REGULATION
Canadians think they have “good government”
Americans distrust their government Canadians are comfortable with price
controls in the health sector Price controls in the health sector yield
lower costs Unlike other economic sectors unfettered
market competition does not lower costs
16

PHARMACEUTICAL SPENDING PER CAPITA: 1995 AND 2007ADJUSTED FOR DIFFERENCES IN COST OF LIVING
$385
$319
$335
$317
$228
$210$422
$431
$542
$588
$691
$878
$0 $200 $400 $600 $800 $1,000
US
CAN
FR
GER
AUS
NETH 1995
2007
Source: OECD Health Data 2009 (June 2009).* 2006
*

ANNUAL SALARY RANGE FOR REGISTERED NURSING JOBS IN CANADA
18
Province step One Top of scale
Quebec $40,927 $60,319
Ontario $57,252 $81,315
$82,258 after 25 yrs of service

19
HOW MEDICINE IS PRACTICED IN CANADA AND THE USA: FROM THE PATIENT’S POINT OF VIEW – ABOUT THE SAME
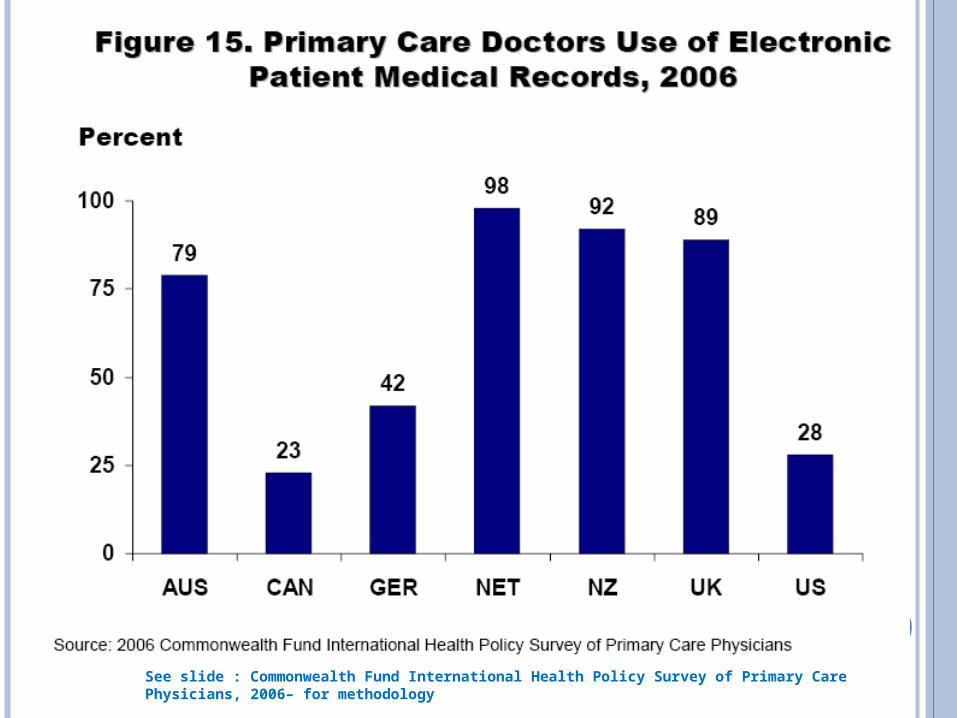
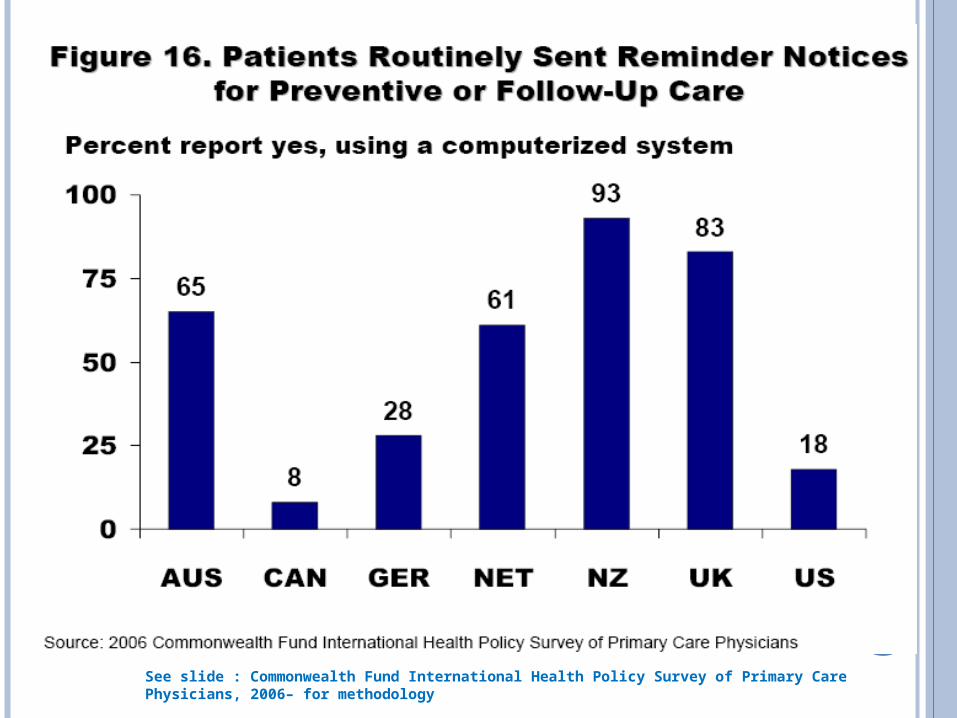
See slide : Commonwealth Fund International Health Policy Survey of Primary Care Physicians, 2006– for methodology
20
See slide : Commonwealth Fund International Health Policy Survey of Primary Care Physicians, 2006– for methodology
21

See slide : Commonwealth Fund International Health Policy Survey of Primary Care Physicians, 2006– for methodology
22
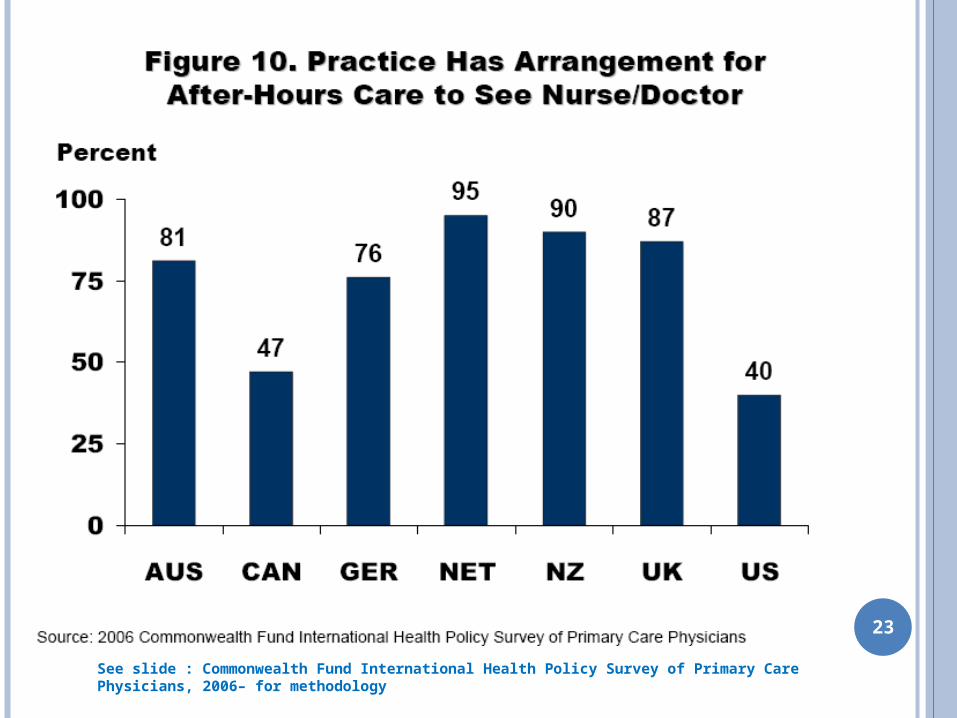
See slide : Commonwealth Fund International Health Policy Survey of Primary Care Physicians, 2006– for methodology
23

24
HOW DO DOCTORS AND HOSPITALS GET PAID IN CANADA AND THE USA
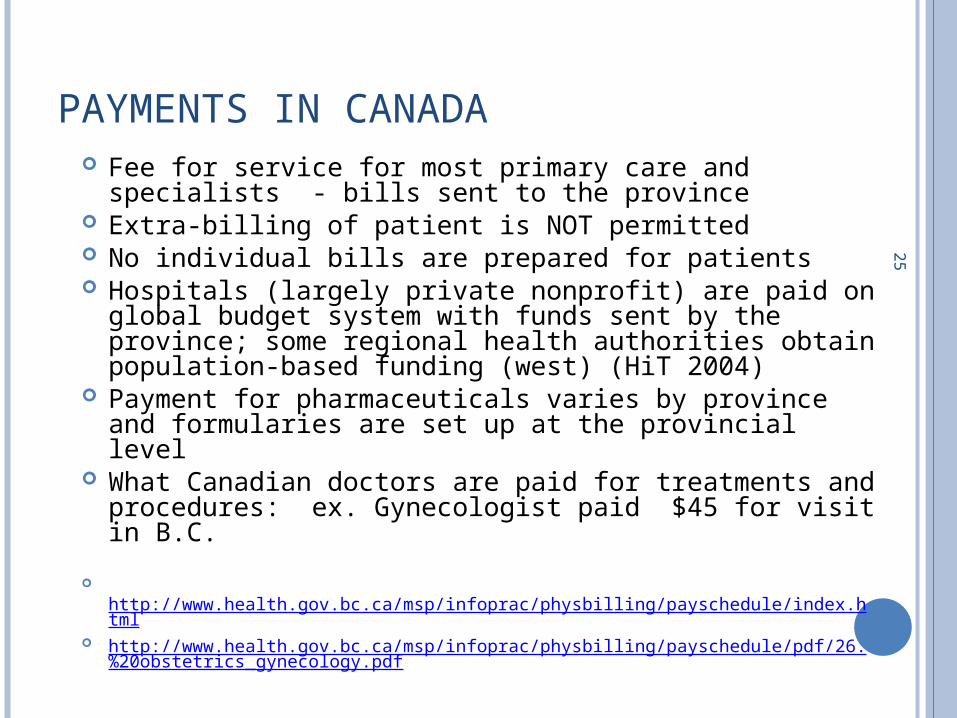
PAYMENTS IN CANADA
25
Fee for service for most primary care and specialists - bills sent to the province
Extra-billing of patient is NOT permitted No individual bills are prepared for patients Hospitals (largely private nonprofit) are paid on global
budget system with funds sent by the province; some regional health authorities obtain population-based funding (west) (HiT 2004)
Payment for pharmaceuticals varies by province and formularies are set up at the provincial level
What Canadian doctors are paid for treatments and procedures: ex. Gynecologist paid $45 for visit in B.C.
http://www.health.gov.bc.ca/msp/infoprac/physbilling/payschedule/index.html http://www.health.gov.bc.ca/msp/infoprac/physbilling/payschedule/pdf/26.%20ob
stetrics_gynecology.pdf

HOW DOCTORS BILL IN CANADA
26
Billing is straightforward but lots of variation across provinces as each takes care of its on billing
Doctor must be registered as a practitioner in the province
Doctor must have a billing number – and not automatic
Doctor must be eligible and qualified to bill for the specific code indicated: ex. neurologist won’t be paid for doing an appendectomy.
The amount billed must be for the amount allowed by the fee schedule (Medical Services Plan)

HOW DOCTORS BILL IN CANADA (CONT..)
27
Bills are submitted electronically on forms online through the web or via a direct connection to the MSP office – daily or weekly- and 98% reimbursed
The provincial payer organization sends payment twice monthly directly to the MD and pay interest on reimbursements that are delayed more than 30 days.
Ease of billing is a big plus in Canada and doctors who have billed in both Texas and Canada are in agreement on this : “One insurer, one fee schedule, rarely any question of eligibility and no incentive to withhold payment – its heaven compared to the US”.

28
OUTCOMES IN THE CANADIAN HEALTH SYSTEM:CANADA DOESN’T DO TOO BADLY…

OVERVIEW: AMERICANS AND CANADIANS ON ACCESS AND HEALTH OUTCOMES
Very poor Americans are in poorer health than their Canadian counterparts
Wealthy Americans and Canadians – equally healthy
Little difference between insured Americans and Canadians as a whole -- on access to health care and health status
Americans without health insurance are – different, with low access to health care and more “unmet health care needs”
Alexis Pozen, David M. Cutler (2010) Medical Spending Differences in the United States and Canada: The Role of Prices, Procedures, and Administrative Expenses. Inquiry: Summer 2010, Vol. 47, No. 2, pp. 124-134.
29

BUT THERE ARE WIDE VARIATIONS ON HEALTH LIFESTYLES
30
Reference: Krueger, Bhaloo, & Rosenau; “Health Lifestyles in the U.S. and Canada: Are We Really So Different? “Forthcoming Social Science Quarterly, December 2009
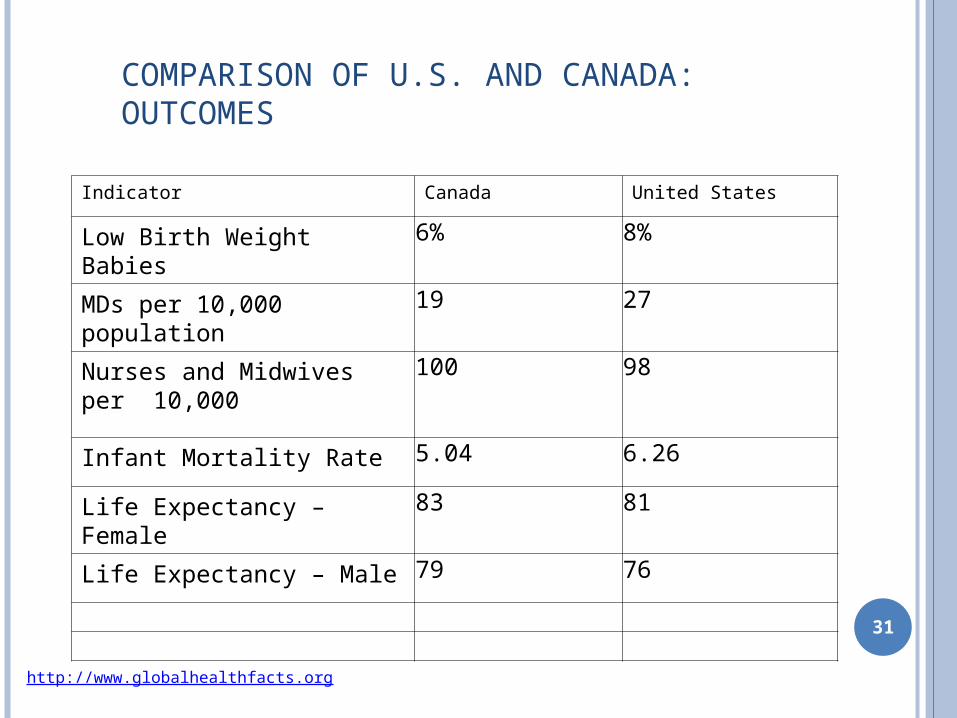
COMPARISON OF U.S. AND CANADA: OUTCOMES
31
Indicator Canada United States
Low Birth Weight Babies 6% 8%
MDs per 10,000 population
19 27
Nurses and Midwives per 10,000
100 98
Infant Mortality Rate 5.04 6.26
Life Expectancy – Female 83 81
Life Expectancy – Male 79 76
http://www.globalhealthfacts.org

The BEST Outcomes Measure
See slide : Measuring The Health of Nations: Mortality Amenable to Health Care, 2008– for methodology
32

SPECIFIC OUTCOMES - MORTALITY RATES
Seven diseases favored CanadaColorectal cancer
Childhood leukemia
Kidney transplants
Liver transplants
One disease favors the U.S.Breast cancer
Hussey, P. et al, “How Does the Quality of Care Compare in Five Countries?” Health Affairs 23(3) May/June 2004
33

SPECIFIC OUTCOMES- MORTALITY RATES
Overall RR of mortality 0.95 in favor
of Canada (CI 0.92 to 0.98)
Results quite heterogeneous
No explanation for heterogeneity
Guyatt, G. et al, “A Systematic Review of Studies Comparing Health Outcomes in Canada and the United States”, Open Medicine 2007;1(1):E27-36
34

WAIT TIMES
Historically this has been the Achilles heel of the Canadian systemResult of budget cuts 1990’s
Today the situation is much improved
But the U.S. also has a “waiting times” problem, but for different reasons
In the US we wait because of cost….. In Canada patients because of scarcity
35

See slide : Commonwealth Fund International Health Policy Survey: Adults’ Health Experiences in seven Countries, 2007 – for methodology
36

See slide : Commonwealth Fund International Health Policy Survey: Adults’ Health Experiences in seven Countries, 2007 – for methodology
37

SUMMING IT ALL UP
Strengths and Weaknesses And figuring out why….

CANADA – HEALTH POLICY STRENGTHS
Federal leadership, with state
autonomy on implementation, is a
workable compromise
Access is best when it is universal
Choice is ok – one big HMO
Primary care emphasis is important
Electronic medical records are not
essential39
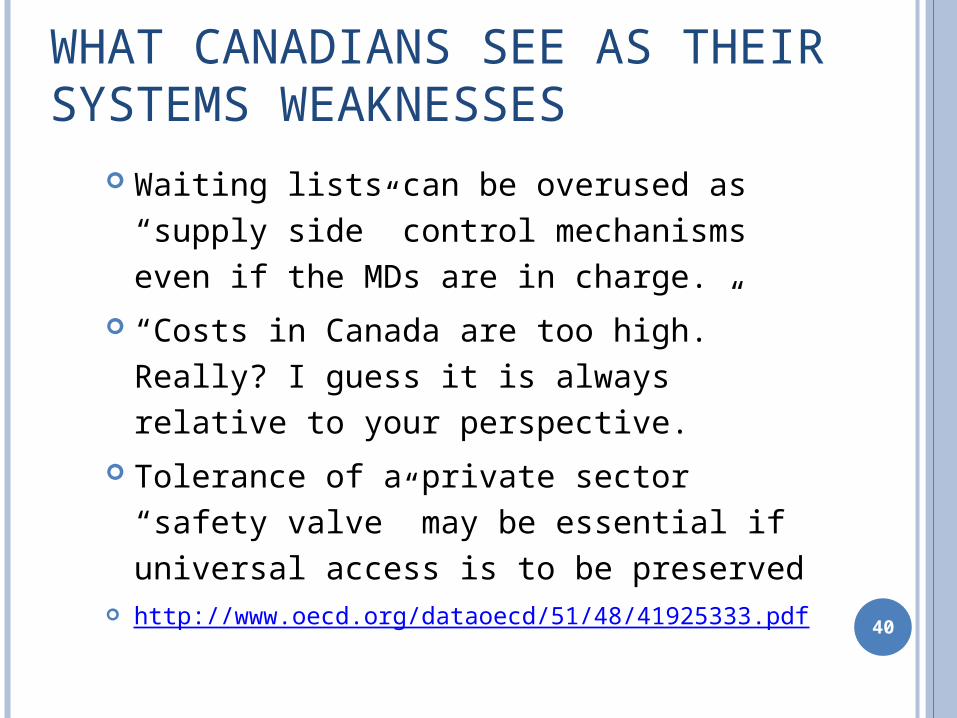
WHAT CANADIANS SEE AS THEIR SYSTEMS WEAKNESSES
Waiting lists can be overused as “supply side” control mechanisms even if the MDs are in charge.
“Costs in Canada are too high.” Really? I guess it is always relative to your perspective.
Tolerance of a private sector “safety valve” may be essential if universal access is to be preserved
http://www.oecd.org/dataoecd/51/48/41925333.pdf40

41
USA - STRENGTHS
Quality generally highLots of evidence that “more is not always better” when it comes to healthcare
But many patients don’t understand this or believe it.
Medical technology is available…if you are well insured…if not insured or underinsured… ?
No waiting if you pay out of pocket.
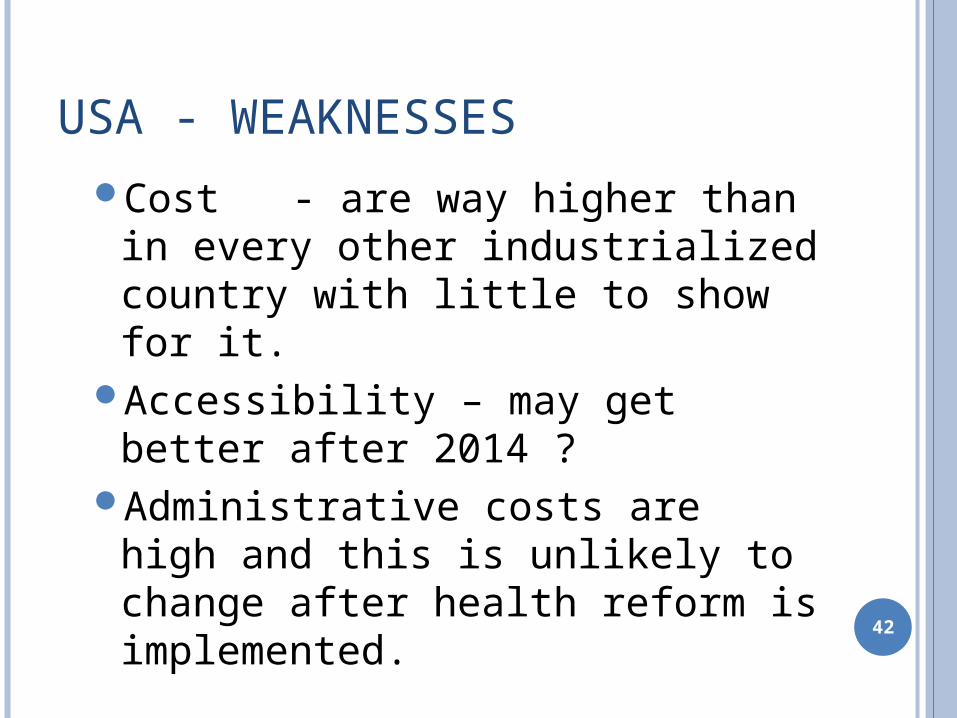
USA - WEAKNESSES
Cost - are way higher than in every other industrialized country with little to show for it.
Accessibility – may get better after 2014 ?
Administrative costs are high and this is unlikely to change after health reform is implemented. 42

WHY DO THE TWO COUNTRIES DIFFER AS TO HEALTH SYSTEM PREFERENCE? Culture – maybe but USA and Canada are converging; media,
proximity, culture diffusion, geographic mobility and immigration
History – Yes More distrust of government in US More emphasis on individual liberty
Form of government – yes Presidential system in the USA
Roots in the constitution Designed to require incremental policy rather than
comprehensive policy
Parliamentary system in Canada Good at implementing comprehensive change quickly and
efficiently Responsible party model Important role for party leadership
43
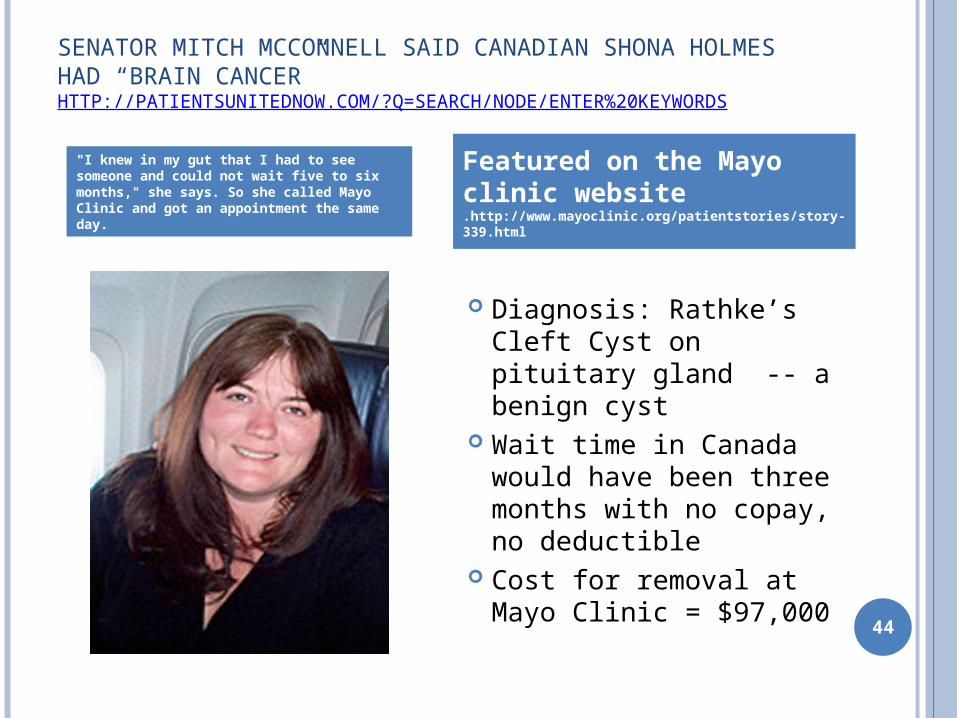
SENATOR MITCH MCCONNELL SAID CANADIAN SHONA HOLMES HAD “BRAIN CANCER” HTTP://PATIENTSUNITEDNOW.COM/?Q=SEARCH/NODE/ENTER%20KEYWORDS
Diagnosis: Rathke’s Cleft Cyst on pituitary gland -- a benign cyst
Wait time in Canada would have been three months with no copay, no deductible
Cost for removal at Mayo Clinic = $97,000
"I knew in my gut that I had to see someone and could not wait five to six months," she says. So she called Mayo Clinic and got an appointment the same day.
Featured on the Mayo clinic website .http://www.mayoclinic.org/patientstories/story-339.html
44

EXAMPLE OF MEDIA COVERAGE IN THE USA
The Case of Shona Holmes: http://www.youtube.com/watch?v=cahvnCBVXXU&feature=related
http://factcheck.org/2009/08/dying-on-a-wait-list/ same as above with Fact Check information
Mayo clinic charged 100,000$ - Shona’s story is no longer posted at Mayo Clinic’s website
Dr. Jason Huse, a pathologist at the Sloan-Kettering Cancer Center, in the USA . Factcheck.org says: “He told us something different.” "By strict definitions it’s not even a tumor," he said, but a remnant of embryological structures that eventually develop into the pituitary gland. Huse stressed that without having examined Holmes, he couldn’t know the prognosis of her RCC: "It is not out of the realm of possibility," he told us, "that this could have been impeding her hormone secretions to the extent that it was a life-threatening situation." And of course, we don’t know what Holmes’ American doctors told her. However, Huse said, RCC "is not typically a malignant lesion and it is not typically life-threatening."
45

“U.S. NEWSPAPER COVERAGE OF THE CANADIAN HEALTH SYSTEM: A CASE OF SERIOUSLY MISTAKEN IDENTITY” AMER. REV. OF CANADIAN STUDIES – SPRING 2006, PP 27-58
Objective: This study assesses the fairness, accuracy, and comprehensiveness of U.S. newspaper coverage of the Canadian health system in two of the most influential newspapers published in the U.S.
Methods: Quantitative methods, interpretative assessments, and thematic analyses are employed to evaluate coverage of the Canadian health system in the New York Times and the Wall Street Journal between 2000 and 2005 46

U.S. NEWSPAPER COVERAGE …2 Findings: U.S. newspaper reporting on the topic of the Canadian
health system is found to be poor. Points of misinformation are indicated, misrepresentations are specified, and inadequate explanations are denoted.
Overall, ongoing themes and controversial issues regarding the Canadian health system receive almost as much notice in U.S. newspapers as actual news events.
Anecdotal information plays nearly as great a role in coverage as facts and evidence.
U.S. newspaper reports about the Canadian health system are found to be oversimplified.
Information, all too often, is presented out of context and sources are not always sufficiently identified.
Coverage is incomplete: all provinces are underrepresented in the U.S. newspapers studied, except Ontario.
Some articles are confused and a few were found to contain errors.
Conclusions: These inadequacies in newspaper coverage mean that the U.S. public is sadly misinformed with regard to the Canadian health system.
47

REFERENCES FOR LEARNING MORE
And documentation for this lecture
48

RESOURCES FOR LEARNING MORE ABOUT CANADA
Listen or View: “Does Canada's Health Care System Need Fixing? 10 August 2009” NPR http://www.npr.org/templates/story/story.php?storyId=111721651
Read: Ross and Detsky “Health Care Choices and Decisions in the U.S. and Canada”; JAMA 10/28/2009 ; 2009;302(16):1803-4, http://jama.ama-assn.org/cgi/reprint/302/16/1803
Read; Sanmartin, et al “Comparing Health and Health Care Use In Canada and the United States,” Health Affairs, vol. 25, July/August 2006 “ (Abstract ) http://content.healthaffairs.org/cgi/content/abstract/25/4/1133
View : “Sicko” by Michael Moore; Scene Selection # 7 Only “Canada!”: about 10 minutes that begins at minute= 40. See especially the Conservative party member (golfer interview) at Minute 48 http://freedocumentaries.org/teatro.php?filmID=133&lan=undefined&size=undefined
Listen: Audio Interview and Review of “Sicko” by Jonathan Oberlander – University of North Carolina; for ‘NPR’s program, Fresh Air” 2007. only the first 15 minutes are relevant - about Sicko’s presentation of Canada http://www.npr.org/templates/story/story.php?storyId=11826524
And investigate other countries such as Britain, Germany, Japan, Taiwan, Switzerland at: http://www.pbs.org/wgbh/pages/frontline/sickaroundtheworld/view/ 49

METHODOLOGY: COMMONWEALTH FUND INTERNATIONAL HEALTH POLICY SURVEY: ADULTS’ HEALTH EXPERIENCES IN SEVEN COUNTRIES, 2007
Survey of comparing Adults’ health care experiences in Australia, Canada, Germany, New Zealand, the Netherlands, the United Kingdom and the United States.
Method: Interviews with representative sample of adults, Age >17years, 2,500 in the United
States and 3,000 in Canada. Funded by the Commonwealth Fund, partnered with the Health Council of Canada to expand Canadian Sample.
Interviews conducted by telephone between 6 March and 7 May 2007 by Harris Interactive and Country affiliates
Conducted in different languages; French and English for Canada while Spanish and English in US
The margin of sample error for country averages is approximately + 2 percent for the US and Canada and + 3 percent for other five countries, at 95% confidence interval.
Peer Reviewed Publication Citation: Schoen, C., Osborn, R., Doty, MM., et al. Toward Higher-Performance Health Systems: Adults’ Health Care Experience in Seven Countries, 2007. Health Affairs (2007) 26(6) w717-w734
50

METHODOLOGY: COMMONWEALTH FUND INTERNATIONAL HEALTH POLICY SURVEY OF PRIMARY CARE PHYSICIANS, 2006
Countries involved are Australia, Canada, Germany, New Zealand, the Netherlands, the United Kingdom and the United States
Methods: The survey consists of interviews with representative samples of primary
care physicians in seven countries using common questionnaire. Harris Interactive; country affiliates and in the Netherlands, the Center for
Quality of Care Research, Radbound University Nijmegen, conducted interviews by mail and telephone from late February through July 2006
Survey was conducted in English in the US and Canada. The margin of sample error ranges from +3 percent to +5 percent, at 95
percent confidence interval. Peer Reviewed Publication Citation: Schoen, C., Osborn, R., Huynh, P.T., et
al. On the Front Lines of Care: Primary Care Doctors’ Office Systems, Experiences and Views in Seven Countries. Health Affairs 25 (2006) w555-w571
51

METHODOLOGY: SPECIFIC OUTCOMES-MORTALITY RATES
Joint US, Canadian authors from McMaster University, Hamilton, Canada
Meta-analysis of outcome studies 38 studies meeting most criteria for high quality (only one
missed criteria allowed) Publish or unpublished prospective or retrospective
observational studies comparing health outcomes data for patients with any age with same diagnosis in US and Canada
Sources included: EMBASE (1980-Feb 2003), MEDLINE (1966- Feb 2003), healthSTAR (1975-Feb 2003), EBM (2003) and dissertation abstracts ondisc (1969- Feb 2003).
Results were pooled using a random-effects model Cochrane’s Q-test was assessed to check heterogeneity and
relative risk was used as a summary statistics
Guyatt, G. et al, “A Systematic Review of Studies Comparing Health Outcomes in Canada and the United States”, Open Medicine 2007;1(1):E27-36
52

METHODOLOGY: MEASURING THE HEALTH OF NATIONS: MORTALITY AMENABLE TO HEALTH CARE, 2008
Comparison of trends in deaths considered amenable to healthcare in the US, Canada and in 17 other industrialized countries.
Data and Analysis: Mortality and population data extracted from WHO files Data include deaths coded according to ICD-9-CM and ICD-10 by
sex and five-year age band. The general Age limit was set at 75 years. The causes of death considered are bacterial infection, diabetes, CVD,
treatable cancers, cerebrovascular disease and complications of common surgical procedures.
Age-standardized death rates (SDRs) per 100,000 population by sex was calculated for years 1998 and 2003.
Peer Reviewed Publication Citation: Nolte, E., & McKee, C. M. (2008). Measuring the Health Of Nations: Updating An Earlier Analysis. Health Affairs, 27(1), 58-71
Previous Publication Citation: Nolte, E., & McKee, C.M. (2003). Measuring The Health Of Nations: Analysis Of Mortality Amenable To Health Care. BM, 327, 1129-34
53
Chen, Duanjie, and Jack M. Mintz. 2009. “The Path to Prosperity: International Competitive Rates and a Level PlayingField.” C.D. Howe Institute Commentary. No. 295. Toronto: C.D. Howe Institute. September
54