Embed Size (px)
Citation preview

Metabolic Network Control of Oxidative PhosphorylationMULTIPLE ROLES OF INORGANIC PHOSPHATE*
Received for publication, June 17, 2003, and in revised form, July 7, 2003Published, JBC Papers in Press, July 18, 2003, DOI 10.1074/jbc.M306409200
Salil Bose, Stephanie French, Frank J. Evans, Fredric Joubert, and Robert S. Balaban‡
From the Laboratory of Cardiac Energetics, NHLBI, National Institutes of Health, Department of Health andHuman Services, Bethesda, Maryland 20892
Phosphate (Pi) is a putative cytosolic signaling mole-cule in the regulation of oxidative phosphorylation.Here, by using a multiparameter monitoring system, weshow that Pi controls oxidative phosphorylation in abalanced fashion, modulating both the generation ofuseful potential energy and the formation of ATP byF1F0-ATPase in heart and skeletal muscle mitochondria.In these studies the effect of Pi was determined on themitochondria [NADH], NADH generating capacity, ma-trix pH, membrane potential, oxygen consumption, andcytochrome reduction level. Pi enhanced NADH genera-tion and was obligatory for electron flow under uncou-pled conditions. Pi oxidized cytochrome b (cyto-b) andreduced cytochrome c (cyto-c), potentially improvingthe coupling between the NADH free energy and theproton motive force. The apparent limitation in reduc-ing equivalent flow between cyto-b and cyto-c in theabsence of Pi was confirmed in the intact heart by usingoptical spectroscopic techniques under conditions withlow cytosolic [Pi]. These results demonstrate that Pi sig-naling results in the balanced modulation of oxidativephosphorylation, by influencing both �GH� generationand ATP production, which may contribute to theenergy metabolism homeostasis observed in intactsystems.
Phosphate (Pi)1 is the substrate for the phosphorylation of
ADP to ATP in oxidative phosphorylation. Because ADP and Pi
are generated by ATPases in the cytosol, the potential roles ofADP and Pi as cytosolic feedback signaling molecules regulat-ing the rate of ATP production was one of the first models of thecytosolic regulation of mitochondrial ATP production (1, 2).
However, over the years it has become apparent that the cel-lular regulation of oxidative phosphorylation is a very complexcontrol network, with numerous potential rate-limiting stepsaffected by a variety of signaling molecules, including ADP, Pi,Ca2�, creatine, and Mg2� (3–7). This network results in theability of tissues to change significantly the rate of ATP gen-eration without significantly modifying the metabolic interme-diates coupled to many other processes in the cell. This hasbeen termed an energy metabolism homeostasis (8). Toward abetter understanding of this regulatory network, the effects ofeach putative signaling molecule on oxidative phosphorylationneed to be characterized. The purpose of the current work wasto further evaluate the effects of Pi on different regulatory sitesof oxidative phosphorylation in cardiac mitochondria.
Phosphate is believed to enter cardiac mitochondria via aneutral phosphate transporter (Pt) in exchange for OH� or byco-transport with H� (9). Thus, Pi transport is linked to themitochondrial inner membrane pH gradient (�pHm) and thephosphate concentration gradient but not to the membranepotential (��). Although Pi transport has not been ascribed asa rate-limiting step for phosphate utilization in oxidative phos-phorylation, this particular aspect of phosphate metabolismhas not been extensively studied, especially in the intact cellconditions where the driving forces (matrix membrane gradientof pH and matrix [Pi]) are ill defined. With regard to theregulation of oxidative phosphorylation, Pi is a primary sub-strate for the phosphorylation of ADP by the F1F0-ATPase. Inaddition, Pi has also been implicated in modifying the freeconcentration of Mg2� or Ca2� ions, via chelation, resulting inthe modulation of these ions effects on mitochondrial metabolicprocesses (10–12). Pi also has been shown to increase themitochondria volume (13, 14) that could also lead to metabolicconsequences (15). The mechanism for the volume increasewith Pi is complex, although likely involves the osmotic load ofmatrix [Pi] together with the enhancement of �� (via dissipa-tion of �pHm (16) through Pt activity) and electrophoretic up-take of K� (17). Pi has also been suggested to affect the mito-chondrial transition pore (18). Phosphate has been shown toaffect directly dehydrogenases and other enzymes involved inoxidative phosphorylation (19). The most notable effect wasreported by Hansford and Chappell (20) who showed that Pi
was obligatory for electron flow in isolated blowfly mitochon-dria. These potential multiple sites of action of Pi on oxidativephosphorylation suggest that Pi may play a much more com-plex role in this process than simply a substrate for ADPphosphorylation.
The purpose of this study was to evaluate the hypothesis thatPi regulates several sites in oxidative phosphorylation, in ad-dition to its role as a substrate for the F1F0-ATPase. Specifi-cally, we propose that Pi is one of the primary regulators ofNADH generation. To test this hypothesis, isolated porcine
* The costs of publication of this article were defrayed in part by thepayment of page charges. This article must therefore be hereby marked“advertisement” in accordance with 18 U.S.C. Section 1734 solely toindicate this fact.
‡ To whom correspondence should be addressed: Laboratory of Car-diac Energetics, NHLBI, National Institutes of Health, Department ofHealth and Human Services, Bldg. 10, Rm. BID-161, Bethesda, MD20892.
1 The abbreviations used are: Pi, inorganic phosphate; �GH�, protonmotive force; cyto-b, cytochrome b; cyto-c, cytochrome c; Pt, mitochon-drial phosphate transporter; �pHm, mitochondria inner membrane pHgradient; ��, mitochondria inner membrane potential; MVO2
, mito-chondrial oxygen consumption; TPP�, tetraphenylphosphonium cation;SNARF, seminaphthorhodafluors; ANEPPS, aminonaphthylethe-nylpyridinium; FCCP, carbonyl cyanide p-trifluoromethoxyphenylhy-drazone; pHm, mitochondrial matrix pH; cyto-a, cytochrome a; cytoabs,cytochrome absorbance; (cytoabs)ox, oxidized cytochrome absorbance;(cytoabs)red, reduced cytochrome absorbance; ED-FRAP, enzyme-de-pendent fluorescence recovery after photobleaching; G/M, glutamateand malate; �GNADH, free energy of mitochondrial NADH; NMR, nu-clear magnetic resonance; CK, creatine kinase; CrP, creatinephosphate.
THE JOURNAL OF BIOLOGICAL CHEMISTRY Vol. 278, No. 40, Issue of October 3, pp. 39155–39165, 2003Printed in U.S.A.
This paper is available on line at http://www.jbc.org 39155
by guest on May 4, 2018
http://ww
w.jbc.org/
Dow
nloaded from

heart mitochondria were used with simultaneous measure-ments of ATP synthetic rates, NADH, cytochrome redox poten-tials, �pHm, and �� during systematic alterations of the [Pi].The results of these studies suggest that Pi is remarkably wellsuited to regulate oxidative phosphorylation on several levels,including the generation of NADH, the flow of reducing equiv-alents in the cytochrome chain, and as a substrate for ATPproduction. As a result of these multiple sites of action, Pi hasthe potential of providing the balanced activation of mitochon-drial ATP production in the cytosolic network controlling oxi-dative phosphorylation.
EXPERIMENTAL PROCEDURES
Porcine Heart and Skeletal Muscle Mitochondria Isolation—Heartmitochondria were isolated from in situ perfused porcine hearts asdescribed previously (21). For comparison purposes, skeletal musclemitochondria were prepared using the same protocol without in situperfusion. The standard experimental buffer for these studies wasbuffer A, composed of 125.0 mM KCl; 15.0 mM NaCl; 20.0 mM K-Hepes;1.0 mM KEGTA; 1.0 mM K2EDTA; 5.0 mM MgCl2; 4 �M tetraphenylphos-phonium (TPP�), at pH 7.1. The pH needed to be titrated separately forroom temperature and 37 °C. Phosphate was added as the K� saltpre-titrated to pH 7.1. ATP was also added as the Na� salt at pH 7.1.The free [Ca2�] was estimated as described previously (21) and wasgenerally held at 500–600 nM with CaCl2, unless specified otherwise.
Measurements of Mitochondrial Oxygen Consumption (MVO2),
NADH, and ��—Most experiments were conducted in a chamber (22)that permitted simultaneous monitoring of mitochondria oxygen con-sumption (MVO2
), NADH fluorescence, seminaphthorhodafluors(SNARF) fluorescence (matrix pH), aminonaphthylethenylpyridinium(ANEPPS) fluorescence (��), light scattering (mitochondrial volume),and TPP� distribution (��) in a closed system at 37 °C. Some of theoptical measurements could only be made in paired experiments, due tooverlaps in excitation or emission spectra.
Mitochondrial oxygen consumption was measured by determiningthe decrease in oxygen tension in the chamber as a function of time. Theoxygen electrode was standardized using room air (0.2 mM O2) andanoxia (0) generated by the mitochondria or the addition of sodiumhydrosulfite. All data were digitized and stored using an analog todigital conversion system (DASYLab32) attached to a personalcomputer.
The NADH fluorescence data were collected in the presence of afluorescence reference standard, fluorescein dextran, to correct for boththe primary and secondary inner filter effects (23). The 100% NADHfluorescence signal was obtained at anoxia or in the presence of rote-none. The background fluorescence (100% NAD) was determined byincubating mitochondria, in the absence of carbon substrates, with ADPand Pi. �GNADH was calculated by using Equation 1,
�GNADH � �GNADH0 � ��2.3RT/F�log(NADH/NAD)) (Eq. 1)
where �GNADH0 � �0.32 V, and 2.3 RT/F � 0.0616 (37 °C). �GNADH was
calculated in mV to minimize the types of units used. Volts/mol can beconverted to kcal/mol by multiplying the voltage data by 0.0427.
The TPP� distribution was determined with a TPP�-sensitive micro-electrode (World Precision Instruments, model KWIKTPP). Correctionsfor TPP� binding to the mitochondria were made as described earlier(21).
Measurement of Matrix pH—The matrix pH was estimated fromSNARF fluorescence trapped in the matrix space (24). SNARF wasexcited using the 532-nm line from a diode pumped laser (Power Tech-nologies Inc., Little Rock, AR). The entire SNARF emission spectrumwas collected using the PC-based rapid scanning spectrometer outlinedabove. Standard curves were generated using either Triton X-100 ex-tracts of mitochondria or intact mitochondria treated with carbonylcyanide p-trifluoromethoxyphenylhydrazone (FCCP) (1 �M) and nigeri-cin (1 �M). Both the Triton X-100 and FCCP/nigericin-treated mitochon-dria gave essentially identical titration curves, once the light scatteringeffects were eliminated using approaches published previously (23).From difference spectra between the acid and base solutions, the fre-quency optima for the acid and base forms of SNARF were determinedat 580 and 638 nm, respectively. By using the calibration curves, thematrix pH (pHm) was estimated directly from the 638/580 nm intensityratio. The extramitochondrial pH was held constant at 7.1, and thus thepH gradient across the matrix membrane (�pHm) was calculated byusing Equation 2,
�pHm � pHm � 7.10 (Eq. 2)
By using the �pHm data together with ��, the proton motive forcefor the inner membrane can be calculated by using Equation 3,
�GH� � �� � 61.6 mV(�pHm) (Eq. 3)
It is important to express the driving force for ATP synthesis in termsof the �GH�, because �pHm or �� can compensate for changes in oneelement alone (for example see Ref. 16).
Mitochondria Light Scattering—Light scattering experiments wereperformed by determining the transmission of multiple wavelengthsthrough the mixing chamber, as described previously (25). A “white”light source (Ocean Optics) was impinged on the mitochondrial suspen-sion via a fiber optic, whereas the transmitted light was directed to thesame spectrophotometer used for the fluorescence measurements. Op-tical absorbance was calculated by taking the log of the ratio of trans-mitted light in the presence of buffer (I0) and in the presence of thesuspension (I). The spectral characteristics were determined at theisosbestic frequencies of this suspension and summed.
Mitochondria Optical Absorption Studies—To minimize the mito-chondrial light scattering effects on the measurement of the opticalabsorbance properties, an integrating sphere was used with a center-mounted cuvette (1 � 1 cm) (PerkinElmer Life Sciences model Lambda800). Due to the configuration of this instrument, all experiments wereconducted at room temperature, and no time courses were collected,because the sample had to be removed to make additions. By using thisapproach, all of the photons scattered by the sample were collected andanalyzed. The only corrections necessary were for background absorb-ance and path length calibrations. This arrangement permitted thesimultaneous monitoring of the entire UV and visible spectra of themitochondria, from 310 to 700 nM. Quantitative analysis was performedby calculating the �A of peak absorbance (i.e. sample) versus a linedrawn between two isosbestic reference points (i.e. reference) (26).These wavelength combinations were as follows: cytochrome c (cyto-c)sample:550 nm and cytochrome b (cyto-b) sample:563 nm, both refer-enced between 535 nm and 575 nm; cytochrome a (cyto-a):sample 605nm, referenced between 575 nm and 630 nm. No attempt to quantitatethe reduction levels using the � band was attempted, due to the overlapin the oxidized absorbance at 414 nm, which was shared by all of thecytochromes. The � peaks were useful for a qualitative independentconfirmation of the reduction level changes of the cytochromes, becausethe extinction differences between the oxidized and reduced cyto-chromes were roughly 10 times higher in this region. All optical absorb-ance data are reported as the % reduction level, as determined inEquation 4,
%red � 100 � ((cytoabs) � (cytoabs)ox)/((cytoabs)red � (cytoabs)ox) (Eq. 4)
where cytoabs refers to the cytochrome sample absorbance value afterbase-line correction, using the reference points as outlined above. Thesame conditions were used to determine the fully oxidized (cytoabs)ox)and reduced (cytoabs)red) cytochromes as were used for NADH:NAD.
Perfused Heart Optical Spectroscopy—The resting redox state of themitochondrial cytochromes was determined in a Langendorf perfusedheart preparation, as described previously (27). Briefly, the rabbitswere anesthetized by an IV injection of ketamine HCl (20 mg/kg) withacepromazine maleate (0.2 mg/kg) and were anticoagulated by an IVinjection of heparin (2000 units). The hearts were arrested by an intra-venous injection of KCl (4 mEq), quickly excised, and perfused at 37 °Cwith a modified high KCl Krebs-Henseleit solution composed of 115 mM
NaCl, 25 mM KCl, 1.6 mM CaCl2, 1.4 mM MgSO4, 1.0 mM KH2PO4, 25mM NaHCO3, 5.6 mM glucose, 3.0 mM L-lactic acid, and 3.0 mM NaOHand gassed with 95% O2, 5% CO2. The high KCl perfusate maintainedthe arrested condition, which minimized the motion of the heart andreduced the cytosolic Pi to the lowest values possible (27). By using abifurcated fiber optic (Oceans Optics), a white light source (Titan Tool,FO-150) was impinged on the free left ventricle wall of the heart. Thereflected light was collected through the other fiber of the cable anddirected to a rapid scanning spectrometer (Oceans Optics, PC2000)embedded in a personal computer. Optical spectra were continuouslyobtained from 300 to 700 nm. After collecting a base-line control, 1 �M
KCN was added to the perfusate to reduce selectively the mitochondrialcytochromes without influencing the myoglobin oxygenation (see Ref.28). Cytochrome optical differences were calculated using the sameprocedures as outlined above for mitochondria.
NADH Enzyme-dependent Fluorescence Recovery after Photobleach-ing (ED-FRAP)—The NADH ED-FRAP method (29) was used to meas-ure the capacity of the mitochondria to generate NADH by summing all
Phosphate Regulation of Oxidative Phosphorylation39156
by guest on May 4, 2018
http://ww
w.jbc.org/
Dow
nloaded from

of the dehydrogenase activity using a previously described micro-pho-tolysis system (30). NADH ED-FRAP measures the dehydrogenaseactivity by rapidly photolyzing NADH to NAD� and observing the rateof NADH re-synthesis. NADH ED-FRAP experiments were conductedat room temperature due to the complexity of the irradiation apparatus.To facilitate their correlation with other measurements, studies wereroutinely conducted by using a mitochondria suspension (1.6 ml) in asealed water-jacketed chamber at room temperature. By using a Clark-type oxygen electrode (YSI Inc.), the MVO2
was monitored in this wellmixed chamber. When a steady state was attained, a 50-�l sample wasremoved from the chamber, injected into the small quartz cuvette, andimmediately analyzed by the NADH ED-FRAP method (30).
The NADH ED-FRAP studies were all performed in buffer A with 5mM glutamate and malate (G/M) for carbon substrates and 500 nM freeCa2�. Rotenone was added to prevent any net flux or competing FADH-linked reactions in the NADH recovery process (29, 30). The NADHfluorescence was continuously monitored in the 50-�l cuvette, using afiber optic rapid scanning spectrophotometer (Oceans Optics) and a UVexcitation source. Data are reported as the initial rate of NADH regen-eration from NAD� after photolysis.
RESULTS
Two basic protocols were followed in this study. The firstprotocol was a dose-response of [Pi] on quiescent mitochondria(no net oxidative phosphorylation), performed by adding Pi inthe absence of ADP. ADP was then added to evaluate the activestate during net ATP synthesis. The second protocol involvedadding ADP first and then performing a dose-response of [Pi] toactivate ATP production. These two protocols permitted theseparation of the individual effects of these key substrates forthe F1F0-ATPase reaction.
Effects of Pi on “Quiescent” Mitochondria—The effects of the
Pi on the resting [NADH], ��, and �pHm in the absence of ADPwere determined. An example from this series is presented inFig. 1A, with the data summarized in Table I. The mitochon-dria were initially energized with 5 mM G/M at the time indi-cated. The addition of G/M increased [NADH] and �pHm, hy-perpolarized �� (net increase in calculated �GH�), andincreased MVO2
, consistent with the energization of the innermembrane by the G/M-supported dehydrogenase activity. Theincrease in MVO2
is likely due to an increase in the leak cur-rent, due to the hyperpolarization (31). Pi (3 mM) increased the[NADH], decreased �pHm, hyperpolarized ��, and increasedMVO2
. The calculated �GH� increased despite the reduction in�pHm due to the Pt activity (Table I).
These results are inconsistent with an activation of the F1F0-ATPase activity by Pi in conjunction with the residual ADP inthe matrix, because that would have depolarized �� and de-creased the [NADH] as well as �GH�. In several experiments(30%), the resting NADH levels were nearly 90% reducedafter the G/M addition, resulting in much smaller, but quali-tatively similar, effects of Pi on the NADH levels. This wasaccompanied by the very low resting respiratory rates, suggest-ing that these particular preparations had exceedingly low leakvalues resulting in the high resting NADH levels. These prep-arations were not significantly different from other prepara-tions with regard to all of the measured parameters in theactive (i.e. presence of ADP and Pi) condition, where the mem-brane resistance was dominated by the F1F0-ATPase activity.
The dose-response curves for Pi on resting NADH (normal-
FIG. 1. Effects of Pi-ADP additions on isolated heart mitochondria. Black bars indicate the times of addition into the chamber. G/M 5 mM,Pi 3 mM, ADP 1.3 mM. A, time course of NADH and ��. NADH is normalized to the fully oxidized condition before G/M addition (0) and is fullyreduced at anoxia (1.0). B, time course of oxygen tension, with the slope representing the MVO2
. Numbers next to the tracing report the slope innanomoles of O2/min/nmol of cyto-a. C, Pi dose-response curve for NADH and ��.
Phosphate Regulation of Oxidative Phosphorylation 39157
by guest on May 4, 2018
http://ww
w.jbc.org/
Dow
nloaded from

ized) and �� are presented in Fig. 1C. The normalization of theNADH concentration was required, due to the sensitivity of theresting conditions to small variations in inner membrane leak-age from preparation to preparation as discussed above. Datawere modeled as a simple exponentially increasing functionwith the form shown in Equation 5,
Y � a � b�1 � e�[Pi]/Kp� (Eq. 5)
The Kp for Pi was 0.56 mM for [NADH] and 0.47 mM for ��. Nosignificant improvement in the fit was obtained by using mul-tiexponential functions.
The effect of Pi was different from that of ADP, the othersubstrate for the F1F0-ATPase. The addition of ADP (1.3 mM),in the absence of Pi, resulted in a decrease in the [NADH], anincrease in �pHm, a slight depolarization of ��, and a decreasein �GH�, whereas MVO2
decreased (Fig. 2A and Table I). Thesustained oxidation of NADH, as well as the slight reduction in�GH�, is consistent with the removal of a small amount ofresidual Pi from the bath and the mitochondrial matrix by theactive phosphorylation of ADP, resulting in the decrease in thedehydrogenase activity observed in the previous study. TheADP-induced decrease in �� is probably due to the electrogenicnature of the adenylate translocase dissipating the �� but iscompensated by an increase in �pHm. In summary, ADP doesnot mimic the effects of Pi on mitochondrial metabolism and inmany ways results in opposite net metabolic effects.
Effects of Pi on the Maximum Rate of ATP Synthesis—Theeffects of Pi on mitochondrial metabolism were evaluated at themaximum rate of ATP production. Examples of these studiesare presented in Figs. 1 and 3, in which both ADP and Pi arepresent. The order of addition of ADP or Pi had no measurableeffect on the steady state processes, and the data are combinedin Table I, but the approaches to this new steady state underthe two conditions are revealing. The maximum rate of ATPproduction was estimated from the initial rate of respiration,after the addition of ADP or Pi to the system. This was done toavoid any effects of Pi or ADP consumption on the observedrate. All experiments were conducted in the absence of addedATP.
In the first series, ADP was added after Pi. Under theseconditions, the addition of ADP was accompanied by a largeincrease in respiration, associated with a depolarization of ��from its highly polarized state back to its control levels withG/M alone, whereas the [NADH] was significantly decreased.
When Pi was added after ADP (Fig. 2A and Table I), thecombined effects of Pi on the F1F0-ATPase, NADH generation,and redox equivalent flux can be observed. With the addition ofPi, the [NADH] decreased, suggesting that the rate of NADHoxidation initially exceeded the rate of production, even withthe predicted activation of the NADH generating capacity by
Pi. However, �� hyperpolarized while �pHm decreased, andsurprisingly, �GH� remained essentially constant or increasedslightly. The constant �GH� is surprising, because the reducingequivalent flux through NADH had increased more than 10-fold, and �GNADH, the driving force for �GH�, had been signif-icantly reduced. These latter data suggest that Pi is causing amore efficient transmission of the �GNADH to �GH�.
The dose dependence plots of Pi on NADH, ��, and MVO2in
the active state are presented in Fig. 2, B and C. Note that Pi
increased �� and MVO2in almost an identical fashion, with Kp
values of 1.0 mM MVO2and 0.8 mM �� obtained by simply
modeling the data by using Equation 2. However, the complexeffect on NADH resulted in an initial drop in the [NADH],which remained essentially constant with all subsequent addi-tions. Modeling this as a simple exponential decay resulted ina Kp of 0.08 mM.
The effects of Ca2�, another putative cytosolic signaling mol-ecule capable of controlling multiple steps within oxidativephosphorylation (8), were evaluated under these active condi-tions by performing these studies in the presence and absenceof added Ca2�. The addition of Ca2� (500 nM free) did not affectthe calculated Kp for Pi for MVO2
, but it did increase themaximum rate of respiration by 120 � 15% (data not shown).Thus, the Pi and Ca2� effects are additive on oxidativephosphorylation.
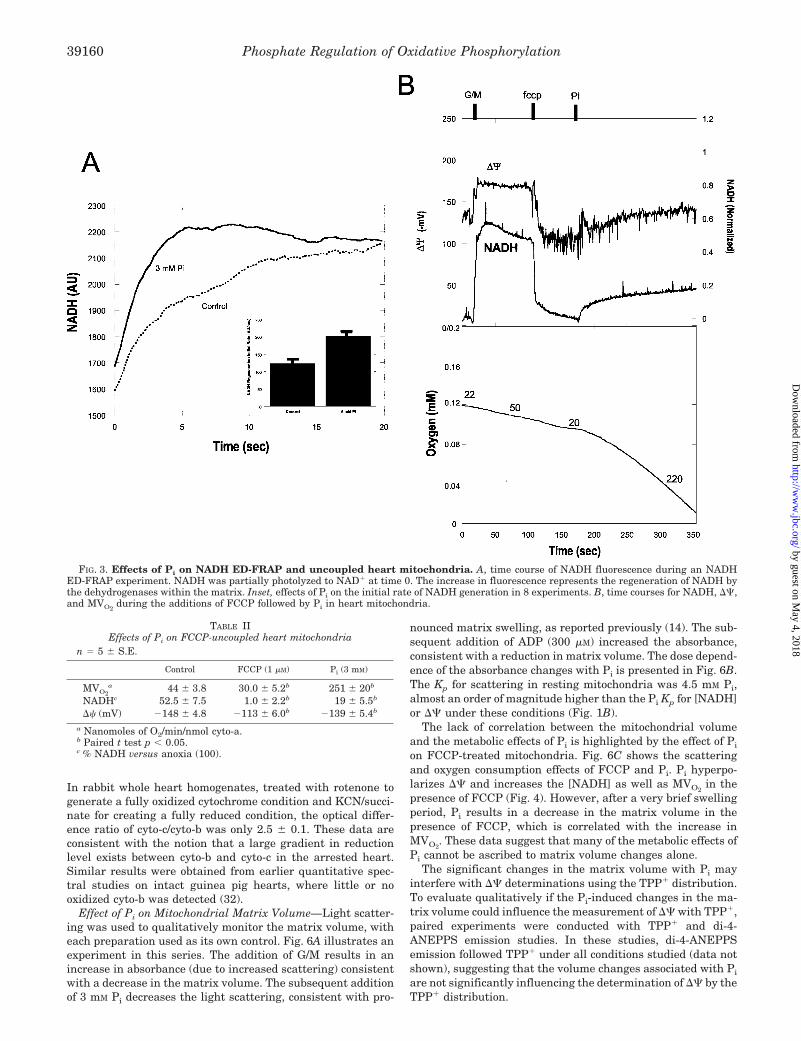
Effects of Pi on NADH ED-FRAP—NADH ED-FRAP experi-ments were conducted in intact mitochondria to confirm thedirect activation of the dehydrogenase activity by Pi. NADHED-FRAP permits the direct observation of the net productionof NADH in intact mitochondria. These studies were conductedat room temperature (25 °C) on suspensions of heart mito-chondria (2 mg/ml) in the presence of 600 nM free Ca2� and 5mM G/M. To avoid any effect of reverse or forward electron flowin the cytochrome chain on this measurement, rotenone (40 �M)was added to the medium to stop electron transfer beyond site1. The addition of rotenone also forced the NADH level toessentially 100%, eliminating any base-line differences in the[NADH] between the control and Pi additions. Pi increased theinitial rate of NADH regeneration, as shown in Fig. 3A. Thesedata are consistent with Pi activating the net NADH genera-tion capacity of the mitochondria, at the level of dehydroge-nases or site 1.
Effects of Pi on Uncoupled Respiration—In uncoupled mito-chondria the reducing equivalent flux is independent of theF1F0-ATPase activity, and the actions of Pi on reducing equiv-alent generation can be directly observed. The addition of 0.2�M FCCP in the presence of 5 mM G/M and 600 nM free Ca2�,without ADP, ATP, or Pi, resulted in a transient increase inMVO2
followed by an inhibition (Fig. 3B). The subsequent ad-dition of 3 mM Pi resulted in a large increase (10-fold) in the
TABLE IEffects of Pi and ADP on heart mitochondria
G/M (control) Pia (3 mM) ADPb (1.3 mM) Active statec
MVO2d 30.8 � 0.9 40 � 3.4e 24.6 � 4.4e 256 � 20e
NADHf 60 � 3 76 � 9e 45 � 7e 29 � 8e
�� �172 � 2.0 �194 � 6.0e �148 � 1.0e �163 � 4e
pHm 7.14 � .002 7.13 � .02e 7.16 � .005e 7.10 � .02e
�GH�g �175 � 2.0 �195 � 6.0e �152 � 1.0e �163 � 5e
�GNADHg �331 �350 �314 �297
N 20 8 10 18a Pi added to resting mitochondria (Fig. 1).b ADP added to resting mitochondria (Fig. 3);c Combined data for all experiments after both ADP and Pi were added.d Nanomoles O2/min/nmol cyta.e Paired t test to control p � 0.05f % NADH versus anoxia (100).g Millivolts.
Phosphate Regulation of Oxidative Phosphorylation39158
by guest on May 4, 2018
http://ww
w.jbc.org/
Dow
nloaded from

respiratory rate, coincident with an increase in [NADH] andthe hyperpolarization of ��. These data, summarized in TableII, are consistent with the notion that Pi activates NADHgeneration.
Effects of Pi on the Mitochondrial Cytochrome Redox States—The evidence presented above suggested that Pi enhances cou-pling between �GNADH and �GH�. This enhanced coupling im-plies that a more efficient distribution of redox potential energymight be occurring down the cytochrome chain, increasing theavailable driving force for proton extrusion at sites II and III.The cytochrome redox state was evaluated using both the � and� absorbance bands to test this hypothesis. The absolute ab-sorbance spectra are presented in Fig. 4A for fully oxidized (nocarbon substrate, ADP, and Pi) and fully reduced (5 mM G/M atanoxia) mitochondria, and a difference spectrum is presentedin Fig. 4B. The spectral assignments are as follows: cytochromea and a3, 605 and 444 nm; cyto-b, 563 and 430 nm; and cyto-c,550 and 416 nm. NADH and FAD have broad absorbance bandscentered at 340 and 465 nm. The absolute absorption spectrumof FAD is difficult to assess, due to the strong interference fromthe cytochrome absorbance.
To evaluate the effect of Pi on the cytochrome redox state,experiments were conducted in which Pi (3 mM) was added,before or after ADP (1.3 mM), to mitochondria incubated in thepresence of 600 nM Ca2� and 5 mM G/M. Difference spectra forADP (0.3 mM) versus the control or 3 mM phosphate versus
control are presented in Fig. 4C. The addition of Pi resulted inthe oxidation of cyto-b, as seen at both 430 and 565 nm. How-ever, cyto-c became more reduced, as seen at 416 and 550 nm.ADP additions in the absence of Pi had no significant effect onthe cytochrome redox state. Quantitative redox changes arepresented in Table III. Whether Pi was added alone or after theaddition of ADP, cyto-b became more oxidized, and cyto-c be-came more reduced. These data are consistent with the notionthat Pi enhances the ability of cyto-b to maintain cyto-c in thereduced state under these conditions.
Cytochrome Reduction Level in the Perfused RabbitHeart—To determine whether a similar reduction level gradi-ent between cyto-b and cyto-c exists in the intact heart, thecytochrome reduction level in perfused rabbit hearts was de-termined during KCl arrest, when the tissue Pi was belowdetectable limits by 13P NMR (0.1 mM) (27). An example ofthese studies is presented in Fig. 5. The difference spectrabetween the KCl-arrested heart and the fully reduced statewith KCN reveals no significant absorbance in the cyto-b re-gion at 563 nm, as compared with fully oxidized versus reducedisolated heart mitochondria or homogenates made from intactrabbit heart (Fig. 5, inset). The optical difference value forcyto-b and cyto-c was calculated using the isosbestic points forthe cytochromes described earlier. The ratio of the optical dif-ference under these conditions (i.e. control versus KCN infu-sion) of cyto-c/cyto-b in the perfused heart was 7.3 � 0.8 (n � 5).
FIG. 2. Effects of ADP-Pi additions on isolated heart mitochondria. Conditions are identical to those in Fig. 1, with the exception that ADP(1.3 mM) was added before Pi. A, NADH and ��. B, MVO2
. C and D, Pi dose-response curves for active heart mitochondria. C, MVO2, D, NADH.
Note that in skeletal muscle, the NADH increases in the active state with the addition of Pi (see Table IV).
Phosphate Regulation of Oxidative Phosphorylation 39159
by guest on May 4, 2018
http://ww
w.jbc.org/
Dow
nloaded from
In rabbit whole heart homogenates, treated with rotenone togenerate a fully oxidized cytochrome condition and KCN/succi-nate for creating a fully reduced condition, the optical differ-ence ratio of cyto-c/cyto-b was only 2.5 � 0.1. These data areconsistent with the notion that a large gradient in reductionlevel exists between cyto-b and cyto-c in the arrested heart.Similar results were obtained from earlier quantitative spec-tral studies on intact guinea pig hearts, where little or nooxidized cyto-b was detected (32).
Effect of Pi on Mitochondrial Matrix Volume—Light scatter-ing was used to qualitatively monitor the matrix volume, witheach preparation used as its own control. Fig. 6A illustrates anexperiment in this series. The addition of G/M results in anincrease in absorbance (due to increased scattering) consistentwith a decrease in the matrix volume. The subsequent additionof 3 mM Pi decreases the light scattering, consistent with pro-
nounced matrix swelling, as reported previously (14). The sub-sequent addition of ADP (300 �M) increased the absorbance,consistent with a reduction in matrix volume. The dose depend-ence of the absorbance changes with Pi is presented in Fig. 6B.The Kp for scattering in resting mitochondria was 4.5 mM Pi,almost an order of magnitude higher than the Pi Kp for [NADH]or �� under these conditions (Fig. 1B).
The lack of correlation between the mitochondrial volumeand the metabolic effects of Pi is highlighted by the effect of Pi
on FCCP-treated mitochondria. Fig. 6C shows the scatteringand oxygen consumption effects of FCCP and Pi. Pi hyperpo-larizes �� and increases the [NADH] as well as MVO2
in thepresence of FCCP (Fig. 4). However, after a very brief swellingperiod, Pi results in a decrease in the matrix volume in thepresence of FCCP, which is correlated with the increase inMVO2
. These data suggest that many of the metabolic effects ofPi cannot be ascribed to matrix volume changes alone.
The significant changes in the matrix volume with Pi mayinterfere with �� determinations using the TPP� distribution.To evaluate qualitatively if the Pi-induced changes in the ma-trix volume could influence the measurement of �� with TPP�,paired experiments were conducted with TPP� and di-4-ANEPPS emission studies. In these studies, di-4-ANEPPSemission followed TPP� under all conditions studied (data notshown), suggesting that the volume changes associated with Pi
are not significantly influencing the determination of �� by theTPP� distribution.
FIG. 3. Effects of Pi on NADH ED-FRAP and uncoupled heart mitochondria. A, time course of NADH fluorescence during an NADHED-FRAP experiment. NADH was partially photolyzed to NAD� at time 0. The increase in fluorescence represents the regeneration of NADH bythe dehydrogenases within the matrix. Inset, effects of Pi on the initial rate of NADH generation in 8 experiments. B, time courses for NADH, ��,and MVO2
during the additions of FCCP followed by Pi in heart mitochondria.
TABLE IIEffects of Pi on FCCP-uncoupled heart mitochondria
n � 5 � S.E.
Control FCCP (1 �M) Pi (3 mM)
MVO2a 44 � 3.8 30.0 � 5.2b 251 � 20b
NADHc 52.5 � 7.5 1.0 � 2.2b 19 � 5.5b
�� (mV) �148 � 4.8 �113 � 6.0b �139 � 5.4b
a Nanomoles of O2/min/nmol cyto-a.b Paired t test p � 0.05.c % NADH versus anoxia (100).
Phosphate Regulation of Oxidative Phosphorylation39160
by guest on May 4, 2018
http://ww
w.jbc.org/
Dow
nloaded from

Skeletal Muscle Mitochondria—Several comparative studieswere performed on skeletal muscle mitochondria to evaluatewhether the effects observed with Pi were limited to heartmitochondria. Due to the lower yield of mitochondria fromskeletal muscle, presumably related to the much lower concen-tration/gram of muscle, experiments were conducted at half theconcentration of mitochondria (0.5 nmol of cyto-a/ml) and weresomewhat limited in number. The matrix pH was not deter-mined in these studies. As summarized in Table IV, the en-hancement of the dehydrogenase activity in the skeletal musclemitochondria was more pronounced than that in the heartmitochondria, based on the larger increase in �GNADH with theaddition of Pi in the resting or active state. Otherwise, theoverall effects of Pi on the parameters measured were verysimilar in heart and skeletal muscle mitochondria.
DISCUSSION
This study demonstrates that extra-mitochondrial Pi canmodulate the rate of mitochondrial ATP production on severallevels in vitro. Evidence is presented that Pi activates themitochondrial NADH generating capacity and improves thedistribution of energy between cyto-b and cyto-c as well asserving as the primary substrate for the F1F0-ATPase produc-tion of ATP. These effects are summarized schematically in Fig.7. These sites of Pi activation suggest the efficient balancedactivation of oxidative phosphorylation by this putative cytoso-lic signaling molecule.
The Pi-induced increase in the mitochondrial dehydrogenaseactivity was directly demonstrated using NADH ED-FRAP inintact mitochondria. The 70% activation of the mitochondrialNADH generation capacity suggests that Pi impacts severaldehydrogenases simultaneously. This is supported by the netincrease in the [NADH] in resting mitochondria and duringuncoupled respiration in heart mitochondria. This was evenmore prominent in skeletal muscle mitochondria, where a netincrease in �GNADH was observed even when the addition of Pi
was associated with a 5-fold increase in NADH consumption.Previous studies demonstrated that Pi can activate Krebs cycledehydrogenases including 2-oxoglutarate dehydrogenase (19),NAD-isocitrate dehydrogenase (33), and malate dehydrogenase(34). Which, if any, of these enzymes are responsible for the Pi
effects observed in this study is unknown. Different carbonsubstrates were used to probe different NADH-generating
FIG. 4. Optical spectra of isolated heart mitochondria, using an optical integrating sphere. A, absolute spectra of mitochondria (1 nmolcyto-a/ml) in the fully oxidized (no carbon substrate, ADP, and Pi) and fully reduced (G/M at anoxia) forms. B, difference spectrum (reduced-oxidized). C, serial difference spectra of additions to the heart mitochondria suspension, starting with ADP and followed by Pi.
TABLE IIIEffects of Pi, added before and after ADP, on the cytochrome
redox staten � 4 � S.E.
Cyto-b(% reduced)
Cyto-c(% reduced)
Control (no ADP) 46.7 � 1.5 9.2 � 0.7Pi (3 mM) 39.0 � 1.7a 10.5 � 0.8a
Control (1 mM ADP) 53 � 2.6 8.4 � 0.8Pi (3 mM) 38 � 1.6a 17.1 � 1.2a
a Paired t test versus control p � 0.05.
Phosphate Regulation of Oxidative Phosphorylation 39161
by guest on May 4, 2018
http://ww
w.jbc.org/
Dow
nloaded from

pathways. Pi-activated NADH generation with pyruvate or car-nitine-palmitate (not shown) was very similar to glutamate/malate, despite the fact that these substrates are oxidizedthrough different pathways. Pi activation apparently worksglobally on the dehydrogenase activity, consistent with Pi ac-tivation of numerous dehydrogenases in vitro. However, spe-cific enzymatic confirmation of these processes in extracts orwith other substrate/inhibitor regimes will be required to re-fine further the dehydrogenase activation process. It is alsointeresting to note that ADP, the other substrate for the F1F0-ATPase and a putative cytosolic signaling molecule, did notdemonstrate any activation of the dehydrogenase activity, ineither the steady state measurements (Fig. 2) or the NADHED-FRAP measurements (30). Thus, despite the fact that ADPhas been reported to activate several dehydrogenase reactionsin vitro, no evidence for this interaction was observed.
One of the unique findings in the current study was thediscrepancy between �GNADH and �GH� with the initiation ofoxidative phosphorylation with Pi (Fig. 2 and Table I). Themaintenance of �GH� as �GNADH declines during this tran-sition suggests that Pi facilitates the coupling between �GH�
and �GNADH. A spectroscopic investigation of the reductionstate of the cytochrome chain revealed that this increasedcoupling was associated with a crossover between cyto-b andcyto-c, i.e. cyto-b becomes more oxidized as cyto-c becomesreduced. One would predict that this increase in cyto-c re-duction level enhances the available potential energy in thelast two proton ejection sites of the cytochrome chain, therebyincreasing the ability to generate ��. The underlying mech-anism of the coupling enhancement between cyto-b and cyto-cis unknown. Possible mechanisms include the mobility ofcyto-c in the matrix membrane and the redox coupling ofcyto-c1 and cyto-b as well as cyto-c. To our knowledge, no
studies of the effects of Pi on the redox coupling of cyto-c and-b in vitro have been performed.
One of the consequences of the electron flow control betweencyto-b and cyto-c is that cyto-c will remain relatively oxidized,whereas cyto-b will be highly reduced under inactive, arrestedconditions in the heart, where the free Pi is extremely low. Thiswas confirmed in the arrested perfused rabbit heart, where thecyto-b was almost fully reduced whereas the cyto-c was highlyoxidized (Fig. 5). Similar results for the guinea pig heart wereobtained by Hoffmann et al. (32) where no oxidized cyto-b couldbe detected. We also confirmed this redox poise between cyto-band cyto-c in isolated rabbit heart myocytes, placed in theintegrating sphere system, using an uncoupler (FCCP) andKCN to generate oxidized and reduced reference points (datanot shown). These intact tissue studies are consistent with anincomplete equilibrium between cyto-b and cyto-c in restingtissues with low Pi. It is interesting to consider the conse-quences of the inhibition of electron flow between cyto-b andcyto-c. Site III might be an important site of reactive oxygenspecies generation in the heart (35). We speculate that bykeeping cyto-c as oxidized as possible, to just meet the ATPsynthetic needs of the tissue, the generation of free radicals inthe mitochondria may be minimized. These data suggest thatthe flux of reducing equivalents between cyto-b and cyto-c ishighly regulated, and this step is under the control of [Pi] andlikely other factors.
Based on the steady state kinetics of the Pi effects on mito-chondrial metabolism, what role would Pi predictably play inthe regulation of oxidative phosphorylation in the intact cell? Pi
has been considered for some time to play a role in regulatorycytosolic feedback, by balancing ATP hydrolysis with oxidativephosphorylation (1, 2). However, the role of Pi in the regulationof oxidative phosphorylation in vivo has usually been consid-
FIG. 5. Optical spectra from intactperfused rabbit heart. Absolute reflec-tion spectra are shown for arrested andKCN-treated heart. The difference spec-trum (KCN-Control) is overlaid upon theabsolute spectra. Inset, see the text.
Phosphate Regulation of Oxidative Phosphorylation39162
by guest on May 4, 2018
http://ww
w.jbc.org/
Dow
nloaded from

ered to be small, due to the relatively high affinity for themetabolic effects as compared with the tissue concentrations.The resting concentration of Pi in heart and skeletal muscle hasbeen a controversial issue for some time. Physical or chemicalextraction of tissue yields very high Pi concentrations, on theorder of several mM (36). However, several investigators using31P NMR approaches have shown that most of this extracted Pi
is immobile and not chemically active (36, 37). In perfusedhearts, the Pi concentration has ranged from being essentiallyundetectable in arrested or pyruvate-perfused hearts (27, 36) to1.3 to 1.8 mM with glucose (36). By using quantitative 31P NMRspectroscopy in the canine heart in vivo, Katz et al. (38) deter-mined the Pi concentration to be 800 �M at rest, which is closeto the Kp value determined in this study for many of theobserved metabolic effects. Despite the fact that the [Pi] is closeto the Kp, the [Pi] is very stable in the heart during physiolog-ical changes in workload (39, 40). However, at near-maximumworkloads (39, 41), with pharmacological stimulation (42) orduring partial ischemia or hypoxia, increases in [Pi] have been
observed in the heart by several groups. Thus, under theseconditions, changes in the [Pi] might contribute to the regula-tion of cardiac oxidative phosphorylation. In the post-ischemiccondition, the high [Pi] might contribute to free radical gener-ation (35) due to the enhanced reducing equivalent delivery tocyto-c.
In human skeletal muscle, the resting [Pi] is higher than thatin the heart and approaches 4 mM, but it is much more labile tochanges in the workload, due to the breakdown of creatinephosphate (CrP) (43) (further discussed below). However, basedon the steady state Kp (500 �M) determined for heart mito-chondria, it is likely that the effects of Pi might already bemaximized in skeletal muscle, even at rest. It has been pro-posed that most of the previous measurements of metabolitesusing NMR or classical chemical techniques might not accu-rately reflect the metabolite pools in the vicinity of the mito-chondria or, more importantly, in the inner membrane space ofthe mitochondria (for example see Refs. 44 and 45). This isespecially a concern because OpHm, the driving force for Pi, isunknown in the intact muscle. Although these hypotheses lackample direct experimental evidence, it is possible that thecytosolic compartmentation of Pi could complicate the interpre-tations of these bulk biochemical assays.
With regard to the mechanisms of Pi action on these differentsites in oxidative phosphorylation, very few are understood, butseveral conclusions can be made. First, the net effects of Pi areadditive with Ca2�, so it is unlikely that the modification of
FIG. 6. Light scattering and respiration in isolated heart mitochondria. The absorbance was determined at the cytochrome isosbesticpoint at 535 nm. A, control mitochondria. B, dose-response curve of Pi on light scattering in resting mitochondria. C, effect of Pi in the presenceof FCCP.
TABLE IVEffect of Pi on skeletal muscle mitochondria
Units and conditions are same as in Table I.
G/M (control) Pi (3 mM) ADP (1.3 mM) Active state
MVO227 � 2 (6) 39 � 3* (4) 30 � 4 (2) 186 � 10* (4)
NADH 54 � 3 (5) 84 � 4* (4) 46 (1) 60 � 1 (3)�� �148 � 2 (5) �183 � 0.3* (3) �143 � 2 (2) �162 � 8* (4)
Phosphate Regulation of Oxidative Phosphorylation 39163
by guest on May 4, 2018
http://ww
w.jbc.org/
Dow
nloaded from

matrix Ca2� by Pi chelation is occurring. This additive behavioralso suggests that Ca2� and Pi are acting on different sites. Thedifficulty in determining the mechanism of Pi action is relatedto the numerous aspects of the matrix milieu that are affectedby this agent. For example, Pi alters both the matrix pH andvolume, which could indirectly affect several metabolic reac-tions. The matrix membrane pH gradient was small (�0.1 pHunit) in this preparation, as compared with those of previousstudies at room temperature in simpler media (24). The low�pHm was presumably a consequence of the higher tempera-ture (37 °C) and the complex ionic incubation medium. Specif-ically, we found that just the addition of Ca2� reduced �pHm
0.05 (not shown). As a result of the small �pHm, the effects ofPi on pHm were very limited, only changing �0.05 in the steadystate. Most enzymatic processes require much larger changesin the pH to change the kinetics by the magnitude (2–3-fold)observed in this study. We attempted to clamp the pHm usingpotassium acetate (2–10 mM) and several other organic ions.However, we found that acetate nearly abolished the �pHm ina similar fashion as Pi but caused a marked inhibition of boththe NADH generating capacity and the maximum ATP produc-tion rates under control conditions. Because these are the op-posite effects of Pi, we discontinued these studies and assumedthat these organic ions were exerting other nonspecific effects.We believe that the small magnitude of the changes in pHm
with Pi makes it unlikely that it is primarily responsible for theobserved metabolic changes. Pi also results in marked in-creases in the matrix volume, which could have numerousmetabolic consequences (15). However, the Pi dose response forthe matrix volume was nearly 5 times that required for theobserved metabolic effects. One of the most significant dissoci-ation of Pi-induced swelling from its metabolic actions was theeffect of Pi in uncoupled mitochondria. Pi addition after uncou-pling revealed most of the metabolic effects, such as the in-crease in �� and �GNADH, whereas Pi decreased volume underthese conditions. Thus, it is unlikely that the volume alone isresponsible for the metabolic effects of Pi. One clear mechanismis that Pi activates the F1F0-ATPase by providing a substratefor ADP phosphorylation. To our knowledge, the allosteric in-teractions of Pi on the F1F0-ATPase have not been evaluated.Based on these observations, we believe the most reasonablehypothesis is that the matrix Pi is directly modulating thedehydrogenase activity, via some of the mechanisms alreadydescribed in vitro, as well as the redox coupling of cyto-b andcyto-c. Clearly, further investigations will be needed to deter-
mine whether this general hypothesis on the action of Pi iscorrect.
In considering the role of Pi in regulating oxidative phospho-rylation in muscle cells, it is important to consider the role ofthe creatine kinase (CK) reaction in the generation of Pi. Withincreases in ADP and Pi, due to work-related ATP hydrolysis,the increases in Pi will be amplified through the CK equilib-rium by effectively converting CrP into Pi (46, 47). Due to theCK equilibrium constant (1.66 � 10�9), �M changes in [ADP]are reflected in mM decreases in [CrP] and mM increases in[Pi]. This is one of the reasons that 31P NMR of CrP and Pi is souseful in muscle tissues (46). Simulating a resting heart with a[Pi] of 800 �M and [ADP] of 50 �M, it can be shown that theincrease in Pi is almost 150-fold that of ADP, on a mole to molebasis, during �M changes in ADP. This amplification of cytoso-lic [Pi] in response to [ADP] is significantly greater than theratio of the apparent affinity constants of ADP and Pi foractivating oxidative phosphorylation (Km(Pi)/Km(ADP) � 800/30�M � 27). By using these resting concentrations and Km values,the relative kinetic driving force for oxidative phosphorylation(i.e. [S]/Km[S] for each substrate) can be estimated. Underthese conditions, the Pi kinetic driving force rises much morequickly than ADP, during �M increases in [ADP], due to theinterplay of the CK reaction. These simulations are consistentwith the notion that the kinetic driving force for cardiac oxida-tive phosphorylation is dominated by Pi during increases in thecytosolic [ADP] through the CK reaction. If the affinity for ADPis lower in intact cells, as suggested by Saks et al. (44), then thePi would become even more dominate. Because the CK equilib-rium reaction predictably results in increasing the importanceof Pi, the removal of the CK should compromise the metabolicresponse of the heart near peak workloads. Consistent withthis notion is the observation that in CK knockout mice, theskeletal and cardiac muscles do not generate the same level ofPi as in the controls, and they do not perform well whileapproaching maximum workloads (48). Thus, the inability ofCK knockout mice to reach maximum performance may berelated to the level of cytosolic Pi generated and not due to onlythe specific enzymology or localization of CK.
In summary, Pi was shown to activate oxidative phosphoryl-ation at three levels: the generation of NADH, the distributionof free energy throughout the cytochrome chain, and as a sub-strate for ADP phosphorylation at the F1F0-ATPase. This bal-anced activation of oxidative phosphorylation results in Pi be-ing capable of increasing the generation of ATP, without large
FIG. 7. Summary of Pi effects on mito-chondrial oxidative phosphorylation.
Phosphate Regulation of Oxidative Phosphorylation39164
by guest on May 4, 2018
http://ww
w.jbc.org/
Dow
nloaded from

swings in the concentrations or free energies of the metabolicintermediates involved in this process. These actions of Pi,working together with other cytosolic signaling networks,might help to explain the metabolic homeostasis observed inintact hearts during physiological increases in workload. Fi-nally, the relative kinetics of the two major substrates and theputative cytosolic signaling molecules for the control of ATPproduction, Pi and ADP, in the presence of CK suggest that thekinetic driving force for Pi is greater than that of ADP in theintact heart. The mechanism of Pi action on these differentsites is unresolved. The global effects on pHm or matrix volumedo not seem to explain these phenomena. Elucidating the spe-cific mechanisms of Pi action on the dehydrogenases and thecytochrome reducing equivalent transfer will require morestudies in the future.
REFERENCES
1. Chance, B., and Williams, C. M. (1956) Adv. Enzymol. 17, 65–1342. Lardy, H. A., and Wellman, H. (1952) J. Biol. Chem. 185, 215–2243. Ernster, L., Lee, C., and Jnada, S. (1966) in Biochemistry of Mitochondria
(Slater, E., Kaniuga, Z., and Wojtczak, L., eds) pp. 29–51, Academic Press,London
4. Tager, J. M., Wanders, R. J., Groen, A. K., Kunz, W., Bohnensack, R., Kuster,U., Letko, G., Bohme, G., Duszynski, J., and Wojtczak, J. (1983) FEBS Lett.151, 1–9
5. Brown, G. C. (1992) Biochem. J. 284, 1–136. Balaban, R. S. (1989) Am. J. Physiol. 258, C377–C3897. Brand, M. D., and Kesseler, A. (1995) Biochem. Soc. Trans. 23, 371–3768. Balaban, R. S. (2002) J. Mol. Cell. Cardiol. 34, 1259–12719. Wohlrab, H. (1986) Biochim. Biophys. Acta 853, 115–134
10. Jung, D. W., Apel, L., and Brierley, G. P. (1990) Biochemistry 29, 4121–412811. Gunter, T. E., Restrepo, D., and Gunter, K. K. (1988) Am. J. Physiol. 255,
C304–C31012. Garlid, K. D. (1980) J. Biol. Chem. 255, 11273–1127913. Izzard, S., and Tedeschi, H. (1970) Proc. Natl. Acad. Sci. U. S. A. 67, 702–70914. Izzard, S., and Tedeschi, H. (1973) Arch. Biochem. Biophys. 154, 527–53915. Halestrap, A. P. (1994) Biochem. Soc. Trans. 22, 522–52916. Rottenberg, H., and Scarpa, A. (1974) Biochemistry 13, 4811–481717. Jung, D. W., and Brierley, G. P. (1999) Am. J. Physiol. 277, C1194–C120118. Kushnareva, Y. E., Haley, L. M., and Sokolove, P. M. (1999) Arch. Biochem.
Biophys. 363, 155–16219. Rodriguez-Zavala, J. S., Pardo, J. P., and Moreno-Sanchez, R. (2000) Arch.
Biochem. Biophys. 379, 78–8420. Hansford, R. G., and Chappell, J. B. (1968) Biochim. Biophys. Res. Commun.
30, 643–64821. Territo, P. R., Mootha, V. K., French, S. A., and Balaban, R. S. (2000) Am. J.
Physiol. 278, C423–C43522. Territo, P. R., and Balaban, R. S. (2000) Anal. Biochem. 286, 156–16323. French, S. A., Territo, P. R., and Balaban, R. S. (1998) Am. J. Physiol. 275,
C900–C90924. Baysal, K., Brierley, G. P., Novgorodov, S., and Jung, D. W. (1991) Arch.
Biochem. Biophys. 291, 383–38925. Territo, P. R., French, S. A., Dunleavy, M. C., Evans, F. J., and Balaban, R. S.
(2001) J. Biol. Chem. 276, 2586–259926. Balaban, R. S., Soltoff, S. P., Storey, J. M., and Mandel, L. J. (1980) Am. J.
Physiol. 238, F50–F5927. Heineman, F. W., Kupriyanov, V. V., Marshall, R., Fralix, T. A., and Balaban,
R. S. (1992) Am. J. Physiol. 262, H255–H26728. Balaban, R. S., Mootha, V. K., and Arai, A. (1996) Anal. Biochem. 237,
274–27829. Combs, C. A., and Balaban, R. S. (2001) Biophys. J. 80, 2018–202830. Joubert, F. F. H. J., Wen, H., Combs, C. A., and Balaban, R. S. (2004) Biophys.
J., in press31. Harper, M., and Brand, M. D. (1993) J. Biol. Chem. 268, 14850–1486032. Hoffmann, J., Lubbers, D. W., and Heise, H. M. (1998) Phys. Med. Biol. 43,
3571–358733. Hansford, R. G. (1972) Biochem. J. 127, 271–28334. Blonde, D. J., Kresack, E. J., and Kosicki, G. W. (1967) Can. J. Biochem. 45,
641–65035. Ambrosio, G., Zweier, J. L., Duilio, C., Kuppusamy, P., Santoro, G., Elai, P. P.,
Tritto, I., Cirillo, P., Condorelli, M., Chiariello, M., and Flauherty, J. (1993)J. Biol. Chem. 268, 18532–18541
36. Garlick, P. B., and Townsend, R. M. (1992) Am. J. Physiol. 263, H497–H50237. Gard, J. K., Kichura, G. M., Ackerman, J. J. H., Eisenberg, J. D., Billadello,
J. J., Sobel, B. E., and Gross, R. W. (1985) Biophys. J. 48, 803–81338. Katz, L. A., Swain, J. A., Portman, M. A., and Balaban, R. S. (1988) Am. J.
Physiol. 255, H189–H19639. Katz, L. A., Swain, J. A., Portman, M. A., and Balaban, R. S. (1989) Am. J.
Physiol. 256, H265–H27440. Balaban, R. S., Kantor, H. L., Katz, L. A., and Briggs, R. W. (1986) Science 232,
1121–112341. Zhang, J., Duncker, D. J., Zu, Y., Zhang, Y., Path, G., Merkle, H., Hendrich, K.,
From, A. H., Bache, R. J., and Ugurbil, K. (1995) Am. J. Physiol. 268,H1891–H1905
42. Gorman, M. W., Ning, X. H., He, M. X., Portman, M. A., and Sparks, H. V.(1992) Circ. Res. 70, 1146–1151
43. Vicini, P., and Kushmerick, M. J. (2000) Am. J. Physiol. 279, C213–C22444. Saks, V. A., Vasil’eva, E., Belikova, Y. O., Kuznetsov, A. V., Lyapina, S.,
Petrova, L., and Perov, N. A. (1993) Biochim. Biophys. Acta 1144, 134–14845. Aliev, M. K., van Dorsten, F. A., Nederhoff, M. G., Van Echteld, C. J., Veksler,
V., Nicolay, K., and Saks, V. A. (1998) Mol. Cell. Biochem. 184, 209–22946. Chance, B., Eleff, S., Leigh, J. S., Jr., Sokolow, D., and Sapega, A. (1981) Proc.
Natl. Acad. Sci. U. S. A. 78, 6714–671847. Meyer, R. A., Sweeney, H. L., and Kushmerick, M. J. (1984) Am. J. Physiol.
242, 1–1148. Spindler, M., Niebler, R., Remkes, H., Horn, M., Lanz, T., and Neubauer, S.
(2002) Am. J. Physiol. 283, H680–H687
Phosphate Regulation of Oxidative Phosphorylation 39165
by guest on May 4, 2018
http://ww
w.jbc.org/
Dow
nloaded from

Salil Bose, Stephanie French, Frank J. Evans, Fredric Joubert and Robert S. BalabanINORGANIC PHOSPHATE
Metabolic Network Control of Oxidative Phosphorylation: MULTIPLE ROLES OF
doi: 10.1074/jbc.M306409200 originally published online July 18, 20032003, 278:39155-39165.J. Biol. Chem.
10.1074/jbc.M306409200Access the most updated version of this article at doi:
Alerts:
When a correction for this article is posted•
When this article is cited•
to choose from all of JBC's e-mail alertsClick here
http://www.jbc.org/content/278/40/39155.full.html#ref-list-1
This article cites 36 references, 11 of which can be accessed free at
by guest on May 4, 2018
http://ww
w.jbc.org/
Dow
nloaded from