Embed Size (px)
Citation preview
THE NEW JERSEY INITIATIVE:Building Management Capacity
in New Jersey Municipalities
TH
EN
EWJE
RSEY
INIT
IAT
IVE:
Bu
ildin
g Ma
na
gemen
t Ca
pacity in
New
Jersey Mu
nicipa
lities
THE NEW JERSEY INITIATIVE:Building Management Capacity
in New Jersey Municipalities
Maxwell School of Citizenship and Public AffairsSyracuse University, New York
Eagleton Institute of PoliticsRutgers, The State University of New Jersey
Funded by
The Pew Charitable Trusts
and
State of New Jersey Department of Community Affairs
2002

© 2002 by The Maxwell School of Citizenship and Public Affairs at Syracuse University.All rights reserved including the right of reproduction in whole or in part in any form.
Address inquiries to:The New Jersey InitiativeAlan K. Campbell Public Affairs Institute Maxwell School of Citizenship and Public Affairs Syracuse University306 Eggers HallSyracuse NY 13244-1090
315-443-9707315-443-9734 (Fax)www.campbellinstitute.org
ISBN 0-9723595-0-8

To all the dedicated public employees who serve in New Jersey’s 566 municipalities and state government.
iv
Dale JonesDirector
Managing for Results FacultyExpert
Dana Michael HarsellProject Manager
Managing for Results ResearchAssociate
Stuart BretschneiderInformation Technology
Management Faculty Expert
Sally Coleman SeldenHuman Resources
Management Faculty Expert
Yilin HouFinancial Management
Faculty Expert
Connie BawcumMax BohnstedtSuzette Denslow
Carol EbdonCapital Management Project
Consultants
Amy K. DonahuePublic Management
Consultant
Bethany WalawenderProject Finance and
Administration
Kelley ColemanOffice Coordinator
Willow JacobsonHuman Resources
Management ResearchAssociate
Ora-orn PoocharoenManaging for Results Research
Associate
New Jersey InitiativeProject Staff
Yonghong WuFinancial Management
Research Associate
Jessica CrawfordPublic Relations Coordinator
Human ResourcesManagement Senior Research
Assistant
Tiffany TannerPublication CoordinatorFinancial Management
Senior Research Assistant
Figen GungorProject Senior Research
Assistant
Chris FoltsProject ManagementResearch Assistant
Sharif NankoeProject ManagementResearch Assistant
Paula AcostaFinancial Management
Research Assistant
Kingsley ChukwuMelissa Mink
Human ResourcesManagement Research
Assistants
Alyssa ColonnaEditor
Kari ParsonsProject Consultant
Chris BronkWeb Site Designer
Dana CookeLogo Designer
Eagleton Institute of PoliticsRutgers, The State
University of New Jersey
Ingrid W. ReedAssociate Director
New Jersey Government Advisor
Jon EricksonProject Manager
Financial Management Advisor
Lucy BaruchProject Finance and Administration
Joanne PfeifferOffice Coordinator
Genikwa WilliamsProject Research Assistant
The Maxwell School of Citizenship and Public Affairs,
Syracuse University
v
Loretta BuckelewAssistant to the Deputy Director
Division of Local Government ServicesState of New Jersey
Henry A. ColemanDirector
Center for Government ServicesRutgers, The State University of New Jersey
Jon EricksonDirector
Master of Public Administration ProgramKean University
Michele Tuck-PonderPresident
Ponder Solutions
William A. WatsonExecutive Director
John S. Watson Institute for Public PolicyThomas Edison State College
John WeingartAssociate Director
Eagleton Institute of PoliticsRutgers, The State University of New Jersey
New Jersey InitiativeAdvisory Committee
vi
Funders
The New Jersey Initiative acknowledges with gratitude that the project is funded by grants from the following:
The Pew Charitable Trusts
State of New Jersey Department of Community Affairs
The opinions expressed in this report are those of the authors anddo not necessarily reflect the views of The Pew Charitable Trusts and
the State of New Jersey Department of Community Affairs. The New Jersey Initiative is solely responsible for the content of this report.
Table of Contents vii
Table of Contents
List of Tables and Figures . . . . . . . . . . . . . . . . . . . . . . . . . . . . . . . . . . . . . . . . . . . . . . . . . . . . . .ix
List of Appendices . . . . . . . . . . . . . . . . . . . . . . . . . . . . . . . . . . . . . . . . . . . . . . . . . . . . . . . . . . .xi
Foreword . . . . . . . . . . . . . . . . . . . . . . . . . . . . . . . . . . . . . . . . . . . . . . . . . . . . . . . . . . . . . . . . . .xiii
Acknowledgments . . . . . . . . . . . . . . . . . . . . . . . . . . . . . . . . . . . . . . . . . . . . . . . . . . . . . . . . . . . .xv
Executive Summary . . . . . . . . . . . . . . . . . . . . . . . . . . . . . . . . . . . . . . . . . . . . . . . . . . . . . . . . .xvii
1 Assessing Management Capacity in New Jersey Municipalities . . . . . . . . . . . . . . . . . . . . .1The Government Performance Project: Foundation for the New Jersey Initiative . . . . . . . . . . .1The New Jersey Initiative . . . . . . . . . . . . . . . . . . . . . . . . . . . . . . . . . . . . . . . . . . . . . . . . . . . . . . .4Management Capacity . . . . . . . . . . . . . . . . . . . . . . . . . . . . . . . . . . . . . . . . . . . . . . . . . . . . . . . . .7New Jersey Laws Governing Municipal Administration . . . . . . . . . . . . . . . . . . . . . . . . . . . . . .13Backgrounds of Municipalities . . . . . . . . . . . . . . . . . . . . . . . . . . . . . . . . . . . . . . . . . . . . . . . . . .22
2 Financial Management . . . . . . . . . . . . . . . . . . . . . . . . . . . . . . . . . . . . . . . . . . . . . . . . . . . . .33Financial Management Capacity and Systems . . . . . . . . . . . . . . . . . . . . . . . . . . . . . . . . . . . . . .33Financial Management Environment for New Jersey Municipalities . . . . . . . . . . . . . . . . . . . .34Criteria for Assessing Financial Management . . . . . . . . . . . . . . . . . . . . . . . . . . . . . . . . . . . . . . .36Methodology and Data Collection . . . . . . . . . . . . . . . . . . . . . . . . . . . . . . . . . . . . . . . . . . . . . . .37Results: Financial Management in New Jersey Municipalities . . . . . . . . . . . . . . . . . . . . . . . . . .38Summary . . . . . . . . . . . . . . . . . . . . . . . . . . . . . . . . . . . . . . . . . . . . . . . . . . . . . . . . . . . . . . . . . . .54Recommendations for New Jersey Municipalities and the State of New Jersey . . . . . . . . . . . .55
3 Capital Management . . . . . . . . . . . . . . . . . . . . . . . . . . . . . . . . . . . . . . . . . . . . . . . . . . . . . . .61Capital Management Capacity and Systems . . . . . . . . . . . . . . . . . . . . . . . . . . . . . . . . . . . . . . .61Capital Management Environment for New Jersey Municipalities . . . . . . . . . . . . . . . . . . . . . .63Criteria for Assessing Capital Management . . . . . . . . . . . . . . . . . . . . . . . . . . . . . . . . . . . . . . . .64Methodology and Data Collection . . . . . . . . . . . . . . . . . . . . . . . . . . . . . . . . . . . . . . . . . . . . . .65Results: Capital Management in New Jersey Municipalities . . . . . . . . . . . . . . . . . . . . . . . . . . .66Summary . . . . . . . . . . . . . . . . . . . . . . . . . . . . . . . . . . . . . . . . . . . . . . . . . . . . . . . . . . . . . . . . . . .70Recommendations for New Jersey Municipalities . . . . . . . . . . . . . . . . . . . . . . . . . . . . . . . . . . .71Recommendations for the State of New Jersey . . . . . . . . . . . . . . . . . . . . . . . . . . . . . . . . . . . . . .72
4 Human Resources Management . . . . . . . . . . . . . . . . . . . . . . . . . . . . . . . . . . . . . . . . . . . . . .75Human Resources Management Capacity and Systems . . . . . . . . . . . . . . . . . . . . . . . . . . . . . . .75Human Resources Management Environment for New Jersey Municipalities . . . . . . . . . . . . .76Criteria for Assessing Human Resources Management . . . . . . . . . . . . . . . . . . . . . . . . . . . . . . .80Methodology and Data Collection . . . . . . . . . . . . . . . . . . . . . . . . . . . . . . . . . . . . . . . . . . . . . . .80Results: Human Resources Management in New Jersey Municipalities . . . . . . . . . . . . . . . . . . .81Summary . . . . . . . . . . . . . . . . . . . . . . . . . . . . . . . . . . . . . . . . . . . . . . . . . . . . . . . . . . . . . . . . . .108Recommendations for New Jersey Municipalities . . . . . . . . . . . . . . . . . . . . . . . . . . . . . . . . . .109Recommendations for the State of New Jersey . . . . . . . . . . . . . . . . . . . . . . . . . . . . . . . . . . . . .110
viii THE NEW JERSEY INITIATIVE: Building Management Capacity in New Jersey Municipalities
5 Information Technology Management . . . . . . . . . . . . . . . . . . . . . . . . . . . . . . . . . . . . . . .113Information Technology Management Capacity and Systems . . . . . . . . . . . . . . . . . . . . . . . .113Information Technology Management Environment for New Jersey Municipalities . . . . . . .114Criteria for Assessing Information Technology Management . . . . . . . . . . . . . . . . . . . . . . . . .116Methodology and Data Collection . . . . . . . . . . . . . . . . . . . . . . . . . . . . . . . . . . . . . . . . . . . . .117Results: Information Technology Management in New Jersey Municipalities . . . . . . . . . . . .118Summary . . . . . . . . . . . . . . . . . . . . . . . . . . . . . . . . . . . . . . . . . . . . . . . . . . . . . . . . . . . . . . . . . .127Recommendations for New Jersey Municipalities . . . . . . . . . . . . . . . . . . . . . . . . . . . . . . . . . .127Recommendations for the State of New Jersey . . . . . . . . . . . . . . . . . . . . . . . . . . . . . . . . . . . . .128
6 Managing for Results . . . . . . . . . . . . . . . . . . . . . . . . . . . . . . . . . . . . . . . . . . . . . . . . . . . . . .131Managing for Results Capacity and Systems . . . . . . . . . . . . . . . . . . . . . . . . . . . . . . . . . . . . . .133Managing for Results Environment for New Jersey Municipalities . . . . . . . . . . . . . . . . . . . . .137Criteria for Assessing Managing for Results . . . . . . . . . . . . . . . . . . . . . . . . . . . . . . . . . . . . . . .137Methodology and Data Collection . . . . . . . . . . . . . . . . . . . . . . . . . . . . . . . . . . . . . . . . . . . . .139Results: Managing for Results in New Jersey Municipalities . . . . . . . . . . . . . . . . . . . . . . . . . .139Summary . . . . . . . . . . . . . . . . . . . . . . . . . . . . . . . . . . . . . . . . . . . . . . . . . . . . . . . . . . . . . . . . . .146Recommendations for New Jersey Municipalities . . . . . . . . . . . . . . . . . . . . . . . . . . . . . . . . . .147Recommendations for the State of New Jersey . . . . . . . . . . . . . . . . . . . . . . . . . . . . . . . . . . . . .147Recommendations for New Jersey Municipalities and the State of New Jersey . . . . . . . . . . .148
7 Conclusion: Improving Management Capacity in New Jersey Municipalities . . . . . . . .151Collaborative Approach From Municipalities and the State . . . . . . . . . . . . . . . . . . . . . . . . . .151Vital Reforms . . . . . . . . . . . . . . . . . . . . . . . . . . . . . . . . . . . . . . . . . . . . . . . . . . . . . . . . . . . . . . .152Bold Actions . . . . . . . . . . . . . . . . . . . . . . . . . . . . . . . . . . . . . . . . . . . . . . . . . . . . . . . . . . . . . . .153
Appendices . . . . . . . . . . . . . . . . . . . . . . . . . . . . . . . . . . . . . . . . . . . . . . . . . . . . . . . . . . . . . . . .157
Bibliography . . . . . . . . . . . . . . . . . . . . . . . . . . . . . . . . . . . . . . . . . . . . . . . . . . . . . . . . . . . . . . .188
List of Tables and Figures ix
List of Tables and FiguresTables
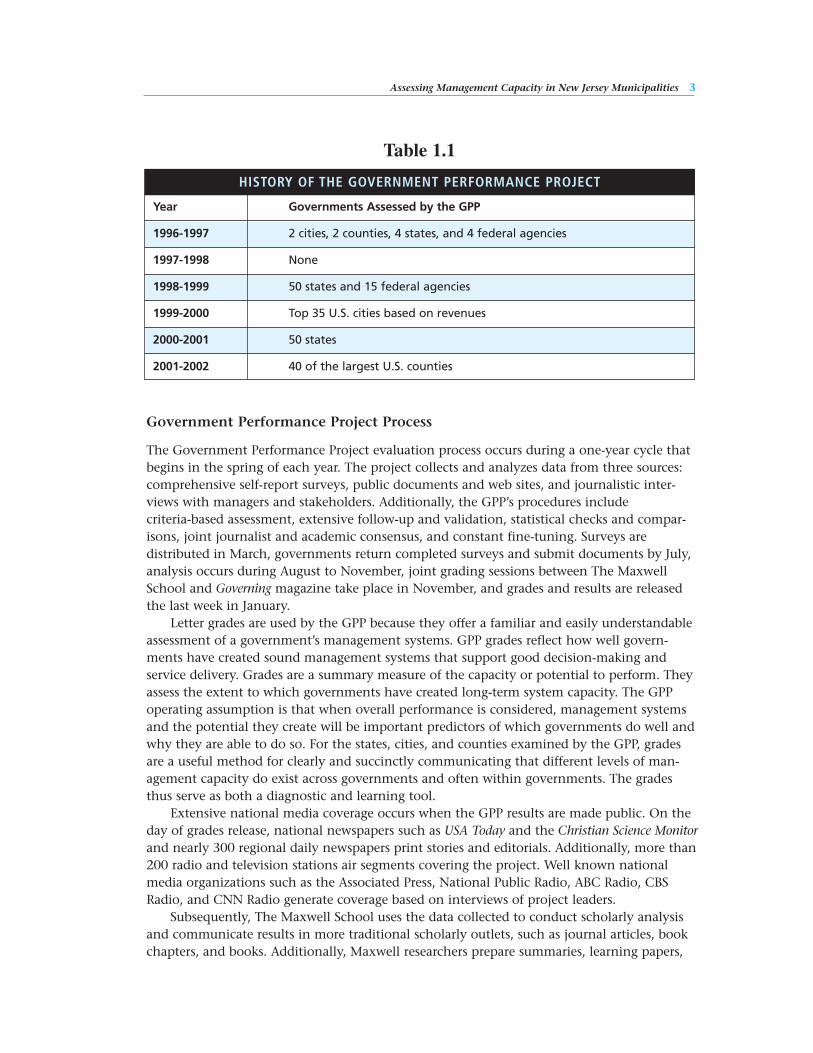
1.1 History of the Government Performance Project . . . . . . . . . . . . . . . . . . . . . . . . . . . . . . . . . . 3
1.2 Characteristics of Municipalities in the New Jersey Initiative. . . . . . . . . . . . . . . . . . . . . . . . . 5
1.3 Forms of Government for New Jersey’s 566 Municipalities. . . . . . . . . . . . . . . . . . . . . . . . . . 21
2.1 Area and Population of the Seven Municipalities . . . . . . . . . . . . . . . . . . . . . . . . . . . . . . . . . 34
2.2 Per Capita Municipal Taxes . . . . . . . . . . . . . . . . . . . . . . . . . . . . . . . . . . . . . . . . . . . . . . . . . . 35
2.3 Per Capita General Revenue and Appropriations. . . . . . . . . . . . . . . . . . . . . . . . . . . . . . . . . . 36
2.4 Financial Management Criteria . . . . . . . . . . . . . . . . . . . . . . . . . . . . . . . . . . . . . . . . . . . . . . . 37
2.5 Background Information on Interviewees . . . . . . . . . . . . . . . . . . . . . . . . . . . . . . . . . . . . . . . 39
2.6 Accuracy of Own-Source Revenue Estimation . . . . . . . . . . . . . . . . . . . . . . . . . . . . . . . . . . . . 43
2.7 Accuracy of General Fund Expenditure Estimation . . . . . . . . . . . . . . . . . . . . . . . . . . . . . . . . 44
2.8 Total General Revenues Anticipated (R) vs. Total GeneralExpenditures Appropriated (A) . . . . . . . . . . . . . . . . . . . . . . . . . . . . . . . . . . . . . . . . . . . . . . . . 46
2.9 Total General Revenues Realized (R) vs. Total General Appropriations Expended (A) . . . . . . . . . . . . . . . . . . . . . . . . . . . . . . . . . . . . . . . . . . . . . . . . . 46
2.10 Total General Fund Revenue (R) vs. Total General Fund Expenditure (A) . . . . . . . . . . . . . . 47
2.11 Fiscal-Year End General Fund Balance as a Percent of Actual General Fund Expenditure . . . . . . . . . . . . . . . . . . . . . . . . . . . . . . . . . . . . . . . . . . . . . 48
2.12 Revaluation Dates and Assessment Ratios . . . . . . . . . . . . . . . . . . . . . . . . . . . . . . . . . . . . . . . 49
2.13 Overall Property Tax Rates . . . . . . . . . . . . . . . . . . . . . . . . . . . . . . . . . . . . . . . . . . . . . . . . . . . 49
2.14 Number of Days after End of Fiscal Year Audited Annual Financial Statements Were Produced . . . . . . . . . . . . . . . . . . . . . . . . . . . . . . . . . . . . . . . . . . . 51
2.15 Federal and State Aid as a Percent of Total General Fund Revenue. . . . . . . . . . . . . . . . . . . . 53
3.1 Capital Management Criteria . . . . . . . . . . . . . . . . . . . . . . . . . . . . . . . . . . . . . . . . . . . . . . . . . 65
4.1 Characteristics of Participating Municipalities. . . . . . . . . . . . . . . . . . . . . . . . . . . . . . . . . . . . 77
4.2 Number of Employees Covered by Each Union Contract . . . . . . . . . . . . . . . . . . . . . . . . . . . 78
4.3 Human Resources Management Criteria . . . . . . . . . . . . . . . . . . . . . . . . . . . . . . . . . . . . . . . . 80
4.4 Role and Structure of Participating Municipalities . . . . . . . . . . . . . . . . . . . . . . . . . . . . . . . . 82
4.5 Personnel Responsibilities in Fire and Police Departments . . . . . . . . . . . . . . . . . . . . . . . . . . 83
4.6 Nature of Workforce Planning . . . . . . . . . . . . . . . . . . . . . . . . . . . . . . . . . . . . . . . . . . . . . . . . 84
4.7 Testing and Use of Provisional and Temporary Employees . . . . . . . . . . . . . . . . . . . . . . . . . . 86
4.8 Residency Requirements . . . . . . . . . . . . . . . . . . . . . . . . . . . . . . . . . . . . . . . . . . . . . . . . . . . . . 87
4.9 Recruiting Techniques. . . . . . . . . . . . . . . . . . . . . . . . . . . . . . . . . . . . . . . . . . . . . . . . . . . . . . . 89
4.10 Position Openings, Applications, and Quality of Hires . . . . . . . . . . . . . . . . . . . . . . . . . . . . . 90
4.11 Training Expenditures, Fiscal Year 2000 . . . . . . . . . . . . . . . . . . . . . . . . . . . . . . . . . . . . . . . . . 91
4.12 Training Provided by Central Human Resources Unit . . . . . . . . . . . . . . . . . . . . . . . . . . . . . . 92
4.13 Training Provided by Departments. . . . . . . . . . . . . . . . . . . . . . . . . . . . . . . . . . . . . . . . . . . . . 93
4.14 Training Provided by State Government . . . . . . . . . . . . . . . . . . . . . . . . . . . . . . . . . . . . . . . . 94
x THE NEW JERSEY INITIATIVE: Building Management Capacity in New Jersey Municipalities
4.15 Tuition Reimbursement Based on Contracts and Educational Incentives . . . . . . . . . . . . . . . . . . . . . . . . . . . . . . . . . . . . . . . . . . . . . . . . . . . . . . 96
4.16 Percent Turnover, Municipalities, Fiscal Year 2000 . . . . . . . . . . . . . . . . . . . . . . . . . . . . . . . . 98
4.17 Percent of Total Turnover from Each Category, Fiscal Year 2000 . . . . . . . . . . . . . . . . . . . . . 98
4.18 Termination and Discipline . . . . . . . . . . . . . . . . . . . . . . . . . . . . . . . . . . . . . . . . . . . . . . . . . . 99
4.19 Feedback Mechanisms. . . . . . . . . . . . . . . . . . . . . . . . . . . . . . . . . . . . . . . . . . . . . . . . . . . . . . 100
4.20 Longevity Pay by Municipality. . . . . . . . . . . . . . . . . . . . . . . . . . . . . . . . . . . . . . . . . . . . . . . 102
4.21 Nonmonetary Rewards . . . . . . . . . . . . . . . . . . . . . . . . . . . . . . . . . . . . . . . . . . . . . . . . . . . . . 103
4.22 Health Benefits Based on Contracts . . . . . . . . . . . . . . . . . . . . . . . . . . . . . . . . . . . . . . . . . . . 104
4.23 Classification Titles . . . . . . . . . . . . . . . . . . . . . . . . . . . . . . . . . . . . . . . . . . . . . . . . . . . . . . . . 107
4.24 Labor-Management Partnerships . . . . . . . . . . . . . . . . . . . . . . . . . . . . . . . . . . . . . . . . . . . . . 108
5.1 Information Technology Management Criteria . . . . . . . . . . . . . . . . . . . . . . . . . . . . . . . . . . 116
5.2 Summary of Data Collection Process . . . . . . . . . . . . . . . . . . . . . . . . . . . . . . . . . . . . . . . . . . 117
5.3 Summary of Consumer Survey Responses from Five New Jersey Municipalities. . . . . . . . . . . . . . . . . . . . . . . . . . . . . . . . . . . . . . . . . . . . . . . . . . . 124
5.4 Average Scores on Ease of Gaining Help (7-high, 1-low). . . . . . . . . . . . . . . . . . . . . . . . . . . 125
5.5 Average System Performance Scores by Source of Training . . . . . . . . . . . . . . . . . . . . . . . . . 125
6.1 Managing for Results Criteria . . . . . . . . . . . . . . . . . . . . . . . . . . . . . . . . . . . . . . . . . . . . . . . . 138
6.2 Strategic Planning in Municipalities. . . . . . . . . . . . . . . . . . . . . . . . . . . . . . . . . . . . . . . . . . . 140
6.3 Results Measurement, Use, and Reporting in Municipalities . . . . . . . . . . . . . . . . . . . . . . . 141
6.4 Examples of Performance Measures in Municipalities. . . . . . . . . . . . . . . . . . . . . . . . . . . . . 143
E.1 Effective Property Tax Rates and Estimated Property Market Value Per Capita 1998-2001 . . . . . . . . . . . . . . . . . . . . . . . . . . . . . . . . . . . . . . . . . . . . . . . . . . . . . . 170
E.2 Revenue Raising Capacity . . . . . . . . . . . . . . . . . . . . . . . . . . . . . . . . . . . . . . . . . . . . . . . . . . . 172
Figure
1.1 A Schematic of Government Management Capacity. . . . . . . . . . . . . . . . . . . . . . . . . . . . . . . . 8
List of Appendices xi
List of Appendices
A Cities Evaluated by the Government Performance Project . . . . . . . . . . . . . . . . . . . . . . . . . 157
B Counties Evaluated by the Government Performance Project . . . . . . . . . . . . . . . . . . . . . . 158
C Profile of New Jersey Municipalities . . . . . . . . . . . . . . . . . . . . . . . . . . . . . . . . . . . . . . . . . . . 159
D Contracting and Procurement Practices in New Jersey Municipalities . . . . . . . . . . . . . . . . 161
E Revenue Raising Capacity in New Jersey Municipalities . . . . . . . . . . . . . . . . . . . . . . . . . . 169
F New Jersey Department of Community Affairs . . . . . . . . . . . . . . . . . . . . . . . . . . . . . . . . . . 174
G The Maxwell School of Citizenship and Public Affairs at Syracuse University. . . . . . . . . . 175
H Alan K. Campbell Public Affairs Institute at Syracuse University . . . . . . . . . . . . . . . . . . . . 177
I Eagleton Institute of Politics at Rutgers, The State University of New Jersey . . . . . . . . . . . 178
J Biographies . . . . . . . . . . . . . . . . . . . . . . . . . . . . . . . . . . . . . . . . . . . . . . . . . . . . . . . . . . . . . . 179

Foreword xiii
Foreword
The New Jersey Initiative is an unprecedented learning opportunity for all municipalitiesin New Jersey, and especially for the seven municipalities participating directly in the proj-ect. The New Jersey Initiative generates analyses of five important management systemareas: financial management, capital management, human resources management, infor-mation technology management, and managing for results. In doing so, the New JerseyInitiative creates a tremendous opportunity for municipalities to more systematicallyexamine their own management systems and how they are integrated, learn from eachother, and consider how their allocation of resources to the various systems translates intooverall effectiveness and performance potential.
The New Jersey Initiative was conducted by a strong partnership between two highlyreputable academic institutions: the Alan K. Campbell Public Affairs Institute of the MaxwellSchool of Citizenship and Public Affairs at Syracuse University and the Eagleton Institute ofPolitics at Rutgers, The State University of New Jersey. We are proud of how Maxwell andEagleton pooled their resources to unite as a team to produce high quality research that isobjective, valid, constructive, and useful for government leaders, practitioner managers, citi-zens, and scholars. The Maxwell School contributed the research expertise from its nationallyrecognized faculty and the Eagleton Institute contributed its expertise on New Jersey politicsand government. Together, Maxwell and Eagleton formed a dedicated team to help NewJersey municipalities understand and improve their management capacity in order toachieve greater government performance.
During 2001 and 2002, researchers worked closely with seven New Jersey municipalitiesthat participated in the study: Brick Township, Elizabeth City, Franklin Township, IrvingtonTownship, Old Bridge Township, Paterson City, and Trenton City. Our research teamsobtained data from the municipalities through surveys and questionnaires, public docu-ments, and interviews of professional managers. We were impressed with the genuine dedi-cation and commitment from the men and women who are in public service in the munici-palities. On a sadder note, we extend our condolences to Paterson City on the loss of itsdirector of human resources who unfortunately passed away during the project. Committedto serving the citizenry in their communities, the public managers we engaged constantlyseek ways to achieve greater efficiency and effectiveness, be more innovative, and improvemanagement as they face an environment full of challenges.
The New Jersey Initiative follows a distinguished predecessor. Our effort is a logicalextension of the path-breaking work of the Government Performance Project, which untilnow focused on large city and county governments and state governments. We are gratifiedthat we applied the Government Performance Project model to smaller municipal-level gov-ernments. The New Jersey Initiative is new territory and our knowledge about governmentmanagement capacity expanded as a result of our journey through the Garden State.
The results of the New Jersey Initiative are being made widely available in New Jersey tocitizens, elected officials, municipality managers, state government officials, academic insti-
xiv THE NEW JERSEY INITIATIVE: Building Management Capacity in New Jersey Municipalities
tutions, and research centers. We are confident that the New Jersey Initiative can helpadvance the improvement of management systems in all 566 New Jersey municipalities, aswell as in municipalities across the nation. Ultimately, better public sector management sys-tems will lead to stronger government performance.
Dale JonesDirectorSyracuse, New York
Ingrid W. ReedAssociate DirectorNew Brunswick, New Jersey
Acknowledgments xv
Acknowledgments
The New Jersey Initiative is indebted to many people who contributed from its genesis toits completion. All deserve much credit and thanks for making the New Jersey Initiativepossible.
The idea to conduct an assessment of New Jersey municipalities originated with stategovernment leaders. Former New Jersey Governor Christine Todd Whitman and Jane Kenny,former New Jersey Commissioner of Community Affairs, requested the GovernmentPerformance Project at The Maxwell School of Syracuse University consider evaluating NewJersey municipalities. Their aim was to find ways for the state to help its municipalities. Theproject thanks The Pew Charitable Trusts and the state of New Jersey for their generousgrants that funded the project. Marc Pfeiffer, Deputy Director of the Division of LocalGovernment Services for the New Jersey Department of Community Affairs, and LorettaBuckelew, Assistant to the Deputy Director, were invaluable in helping the project get startedand providing important documents while giving researchers the freedom they needed toconduct objective evaluations.
Most importantly, our sincerest thanks go to the seven municipalities that volunteeredto participate in the New Jersey Initiative: Brick Township, Elizabeth City, FranklinTownship, Irvington Township, Old Bridge Township, Paterson City, and Trenton City. Thisresearch project could not have been completed without their cooperation. We greatlyappreciate the mayors for granting the project access to their municipalities. Additionally, wethank the dedicated staff of leaders, administrators, and employees at all levels within themunicipalities for giving their valuable time to work with us. Moreover, we thank them forbeing candid in interviews and imparting their experiences and views to researchers.
A special thank you goes to members of the New Jersey Advisory Committee. Theirextensive practical government experience, policy research experience, familiarity with NewJersey state and local governments, and knowledge of politics in New Jersey were a tremen-dous asset to the project. We extend our gratitude to them for taking time away from theirown important endeavors to provide professional guidance: Loretta Buckelew; HenryColeman, Director of the Center for Government Services, Rutgers University; Jon Erickson,Director of the Master of Public Administration Program, Kean University; Michele Tuck-Ponder, President of Ponder Solutions; Bill Watson, Executive Director of the John S. WatsonInstitute for Public Policy, Thomas Edison State College; and John Weingart, AssociateDirector of the Eagleton Institute of Politics, Rutgers University.
Next, we are extremely appreciative and thankful for assistance from the New JerseyState Library in Trenton, local libraries in the seven municipalities, and historical societiesthroughout the state. The reference staffs of each were always more than helpful and a pleas-ure to work with. Also, we acknowledge the Newark Star-Ledger for supplying the project withdetailed census data for New Jersey.
Central to the New Jersey Initiative were the project’s many scholars, consultants,research associates, and research assistants. Organized into five research teams, they were theheart of the project. Faculty experts were Stu Bretschneider, Yilin Hou, Dale Jones, and SallyColeman Selden. Project consultants were Connie Bawcum, Max Bohnstedt, SuzetteDenslow, Amy Donahue, Carol Ebdon, and Kari Parsons. Research associates were Dana Michael Harsell, Willow Jacobson, Ora-orn Poocharoen, and Yonghong Wu. Senior
xvi THE NEW JERSEY INITIATIVE: Building Management Capacity in New Jersey Municipalities
research assistants were Jessica Crawford, Figen Gungor, and Tiffany Tanner and researchassistants were Paula Acosta, Kingsley Chukwu, Chris Folts, Melissa Mink, Sharif Nankoe,and Genikwa Williams. We extend our heartfelt thanks and appreciation to each for theirextensive contributions. Recognition goes to Figen Gungor for her assistance in the finalstage of the project.
Additionally, we thank the staffs at the Alan K. Campbell Public Affairs Institute of TheMaxwell School at Syracuse University and the Eagleton Institute of Politics at RutgersUniversity for their wonderful assistance to the project. Bethany Walawender and KelleyColeman at the Campbell Institute provided fantastic support. Likewise, Lucy Baruch andJoanne Pfeiffer at the Eagleton Institute gave terrific help. Alyssa Colonna served as the edi-tor for manuscript preparation, and we are thankful for her heroic service, which enableddeadlines to be met. Chris Bronk designed and maintained a high quality web site for theproject and Dana Cooke designed our project logo.
The Syracuse University Publications Office kept us on track to ensure the manuscriptwas properly prepared. We are especially thankful to Susan Hoxie who was a superb publica-tions coordinator and guided us through the process with her meticulous oversight. Also,our thanks go to Amy McVey and Joye Morrisseau for their skillful work as the publicationdesigners.
Finally, we express very special gratitude to our two project managers. Dana MichaelHarsell was the perfect project manager for The Maxwell School. We relied on his strongorganization and planning abilities, diplomatic skills, and good judgment to navigate usthrough the year, especially during the final stages. Jon Erickson was an excellent projectmanager for the Eagleton Institute. We depended on his extensive knowledge of New Jerseygovernment and politics and pivotal role as liaison to the municipalities. We thank them fortheir highly regarded advice and for being there every time we needed them.
Dale JonesDirector
Ingrid W. ReedAssociate Director
Executive Summary xvii
Executive Summary
Governments at all levels in the United States are engaged in long-term efforts to improveperformance and provision of services. Citizens, elected officials, the media, and govern-ment leaders and managers expect excellence from government and support reform effortsto achieve it. Indeed, government reinvention and reengineering activities were common-place in the 1990s for federal, state, and local levels of government. The overarching goalin most government reform efforts then and now is to enhance government performance.
The New Jersey Initiative is an innovative research effort in the state of New Jerseyinvolving seven municipalities invited to participate in a pilot project that examines munici-pal management. The study was conducted by Syracuse University’s Maxwell School ofCitizenship and Public Affairs and Rutgers University’s Eagleton Institute of Politics during2001 and 2002 with funding from The Pew Charitable Trusts and the state of New JerseyDepartment of Community Affairs. The municipalities that participated in the project areBrick Township, Elizabeth City, Franklin Township, Irvington Township, Old BridgeTownship, Paterson City, and Trenton City.
The purpose of the New Jersey Initiative is to increase understanding of the capacity ofmanagement systems that best enable municipal governments to perform well and meet theneeds of citizens. Based on the premise that more extensive management capacity precedesbetter management performance, the New Jersey Initiative assessed management capacity inthe following five areas that are critical to delivering improved services at lower costs andachieving high performance in government:
• Financial management
• Capital management
• Human resources management
• Information technology management
• Managing for results
The 1993 National Commission on the State and Local Public Service stated, “Yet a grow-ing consensus has emerged among both citizens and public officials that state and local gov-ernments need to improve their capacity and performance if we are to meet the challenges ofour rapidly changing economic and social systems.” Thus, the New Jersey Initiative is animportant effort to identify how New Jersey municipalities can improve their managementcapacity to result in better performing government and delivery of services to their citizens.
The five management areas represent elaborate systems for each municipality.Furthermore, the complex environment in which they operate creates management chal-lenges. Today, municipal managers in New Jersey contend with pressures associated withkeeping taxes under control; managing fiscal affairs tightly; maintaining physical infrastruc-tures; hiring, training, and retaining personnel; investing in information technology; andplanning for the future. At the same time, they are complying with rules and regulations;responding to security and safety issues related to the aftermath of 9-11 terrorist attacks; deal-ing with citizen inputs and complaints; working in a political environment; and responding
xviii THE NEW JERSEY INITIATIVE: Building Management Capacity in New Jersey Municipalities
to state policies and requirements. This report shines a light on those complexities. Giventhe nature of the challenges and constraints these municipalities face, researchers notedimpressive strengths in their governance activities.
It is important to clarify that this study is about municipal management, not municipalpolitics. We acknowledge the significance of political factors and recognize they must be con-sidered, but they were not the focus of this study. It is true that municipal management inNew Jersey is often affected by politics, as is the case for all government entities.Nevertheless, the New Jersey Initiative was chartered specifically to evaluate the managementcapacity of municipalities.
Researchers found both strengths and weaknesses in each of the management areas.Comprehensive criteria-based analyses of financial management, capital management,human resources management, information technology management, and managing forresults are contained in separate chapters of the report. Throughout the process of conduct-ing the study, researchers all too often witnessed an on-going tension driven by state finan-cial management and civil service legal requirements. To some extent, an “us versus them”condition exists which does not always give rise to good governance. This may be partly areflection of the state’s higher level of oversight of those municipalities in the DistressedCities Program. Another contributing factor may be that the higher performing municipali-ties feel frustrated by the “one size fits all” oversight approach. Therefore, the report’s chap-ters include recommendations for each of the management areas, for the state as well as themunicipalities, aimed at improving management capacity in municipalities.
Overall, improving management capacity in the seven municipalities in the study, alongwith other New Jersey municipalities with similar characteristics and conditions, requires astronger collaborative approach from municipalities and the state, recognition of vitalreforms, and bold actions. A major conclusion of the study is that success in improving man-agement capacity will depend on mutually reinforcing actions and greater cooperation byboth municipalities and the state.
The New Jersey Initiative concludes that municipalities can increase management capaci-ty in two important ways. First, they can take advantage of any existing leeway, such as thatmade possible by the New Jersey Optional Municipal Charter Law, known as the FaulknerAct, to grant business administrators broad powers and authority to operate and managemunicipal affairs. Second, municipal leaders can create an environment that recognizes thevalue of and rewards management initiative, innovative actions, implementation of bestpractices from other locales, and prudent risk-taking.
For the state level, the project also recommends new approaches to bring improvementto municipal management capacity. First, if the state modifies its oversight relationship withmunicipalities, it may experience positive results. The current approach emphasizes imposingthe state’s view of appropriate performance and regulating to prevent wrongful behavior bymunicipal officials. Although firm state oversight is well intended and does prevent unwant-ed behavior, it comes with the price of frustrating local government managers. For thosemunicipalities where good performance warrants it, shifting to an approach that gives greaterprominence to independent capacity building and trust might lead to higher performinggovernment. Second, the state should work closely with municipalities to find ways to pro-vide regulatory relief where appropriate, generate flexibility for management decision-mak-ing, and furnish management tools to local governments.
Executive Summary ixx
The New Jersey Initiative concludes that vital reforms are necessary in the following four areas:
Vital Reform Area #1: State regulatory and procedural restraints impede local governmentmanagement innovation.
Vital Reform Area #2: In its regulatory management oversight role, the state does not sufficiently differentiate among municipalities in terms of their characteristics and performance.
Vital Reform Area #3: Municipalities lack formalized, centralized, and long-term management planning activities.
Vital Reform Area #4: Municipalities do not sufficiently exercise the management prerogatives that are available to them.
In order to build management capacity in New Jersey municipalities, the following boldactions correspond with and are recommended to address the vital reform areas:
Bold Action #1: The state should reduce burdensome and costly restrictions on municipalmanagement activities where appropriate; allow more flexibility and discretion formunicipal managers; enhance state mechanisms for providing technical, financial, andother kinds of assistance to municipalities; and create incentives for entrepreneurial man-agement behavior by municipal managers.
Bold Action #2: The state should further its efforts to classify municipalities in multiplecategories, apply different strategies to assist the various categories, and customize regula-tory treatment to fit the specific needs and circumstances of different municipalities.
Bold Action #3: Municipal councils and mayors should delegate greater authority to busi-ness administrators so they can bolster strategic planning; strengthen their managementsystems; formalize and centralize management oversight activities; and where it is best todo so, integrate management systems across departments.
Bold Action #4: Municipalities should be more innovative in applying management prac-tices, take reasonable risks when implementing new management practices, and ask forguidance and assistance when needed from the state.
Professional managers for the state of New Jersey and its 566 municipalities are consid-ered to be highly qualified. They have a reputation for managing programs well and success-fully serving the citizenry despite many challenges. The New Jersey Initiative focuses on howmunicipalities and the state can reach a higher level of performance by improving manage-ment capacity in municipalities. The report presents its findings in a constructive manner.The New Jersey Initiative observes that if the state and its municipalities work together andmake the recommended changes, they will build municipal management capacity andstrengthen excellence in governance for New Jersey.

1
ASSESSING MANAGEMENT CAPACITY
IN NEW JERSEY MUNICIPALITIES
The Government Performance Project: Foundation for the New Jersey Initiative
THE NEW JERSEY INITIATIVE PROJECT WAS INSPIRED BY the Government PerformanceProject (GPP). The purpose of the New Jersey Initiative is to provide an in-depth analysis oflocal government management capacity. The project results provide valuable feedback andrecommendations to municipalities in New Jersey as well as the state government. In orderto understand the New Jersey Initiative, one must first understand the GPP.
The Government Performance Project is believed to be the most comprehensive exami-nation of the effectiveness of core government management activities ever conducted. Thecentral purpose of the GPP is to improve understanding of public sector management and,thereby, assist in strengthening government performance. Since 1996, with grants from ThePew Charitable Trusts, the Maxwell School of Citizenship and Public Affairs at SyracuseUniversity, in partnership with Governing magazine, has analyzed the management capacityof state, city, and county governments across the United States. The national level, multiyearproject is administered by the Alan K. Campbell Public Affairs Institute at The MaxwellSchool. Governing is a nationwide publication that concentrates on state and local govern-ments and annually publishes the results of the GPP in a special February issue. The projectassesses the effectiveness of management systems in five key areas. Additionally, the projectexamines how well those management systems are integrated. The GPP does not focus pri-marily on performance; it analyzes management capacity, which is the foundation for highperformance. Management capacity is further discussed later in this chapter in a sectiontitled “Management Capacity.” An important objective of the project is to communicate itsfindings to governments at all levels as well as to the public. Additional details about theGPP are available on the project’s web site at www.maxwell.syr.edu/gpp.
Government Performance Project Goals
The overarching purpose of the Government Performance Project is to improve the under-standing of government management on the state, city, and county levels, first by facilitatinga better intellectual understanding of the dimensions of management in government, andsecond, by holding government entities publicly accountable for the quality of managementin their jurisdictions. The five specific goals of the GPP are as follows:
• To recognize innovations and improvements in government management practices
• To generate a dialogue and facilitate a learning process among governments
2 THE NEW JERSEY INITIATIVE: Building Management Capacity in New Jersey Municipalities
• To create a clearinghouse of information related to government management
• To inform the public about factors which contribute to effective management in thepublic sector
• To enhance citizen understanding of government management issues and practices
Government Performance Project Management Areas and Criteria
The Government Performance Project conducts criteria-based assessments in five centralareas of government management: financial management, capital management, humanresources management, information technology management, and managing for results. Inthe first two years of the project, senior advisory panels consisting of respected public admin-istration scholars and practitioners agreed upon the management areas and developed theircriteria. Each of the five management system areas has a set of criteria on which their assess-ments are based. After the pilot year, the criteria were refined based on direct feedback fromgovernments that were evaluated. Other than fine-tuning some of the wording for the crite-ria, the criteria have remained the same during the four years of evaluations conducted since1998. The criteria are listed and discussed in Chapters 2 through 6, which address the find-ings for each of the management areas, respectively.
Government Performance Project History
Table 1.1 summarizes the history of the Government Performance Project. During the 1996to 1997 pilot year, the GPP conducted studies in two cities, two counties, four states, andfour federal agencies. Pilots were chosen through a process that emphasized diversity in func-tion, size, and location among the federal agencies. During this phase, The Maxwell Schooldeveloped a methodology that was used and improved upon throughout the duration of theproject. The pilot year ended in the fall of 1997. During the late 1997 to early 1998 period,researchers refined their procedures and prepared for subsequent years. In 1998, the projectstudied and graded government management systems in all 50 states and 15 federal agencies.The state results were published in the February 1999 issue of Governing and the federalresults were published in the February 1999 issue of Government Executive magazine, whichtargets the federal government. In 1999, the GPP assessed the management capacity of thetop 35 U.S. cities based on revenues and five federal agencies. Appendix A contains a list ofthe cities. The city findings were published in the February 2000 issue of Governing and thefederal results were published in the March 2000 issue of Government Executive. As of January2000, federal agency evaluations are being conducted by George Washington University. In2000, the GPP reevaluated the 50 states and the results were published in the February 2001issue of Governing. During 2001, the GPP assessed 40 of the largest counties in the U.S. andthe findings appeared in the February 2002 issue of Governing. Appendix B identifies thecounties by regions.
Assessing Management Capacity in New Jersey Municipalities 3
Government Performance Project Process
The Government Performance Project evaluation process occurs during a one-year cycle thatbegins in the spring of each year. The project collects and analyzes data from three sources:comprehensive self-report surveys, public documents and web sites, and journalistic inter-views with managers and stakeholders. Additionally, the GPP’s procedures includecriteria-based assessment, extensive follow-up and validation, statistical checks and compar-isons, joint journalist and academic consensus, and constant fine-tuning. Surveys aredistributed in March, governments return completed surveys and submit documents by July,analysis occurs during August to November, joint grading sessions between The MaxwellSchool and Governing magazine take place in November, and grades and results are releasedthe last week in January.
Letter grades are used by the GPP because they offer a familiar and easily understandableassessment of a government’s management systems. GPP grades reflect how well govern-ments have created sound management systems that support good decision-making andservice delivery. Grades are a summary measure of the capacity or potential to perform. Theyassess the extent to which governments have created long-term system capacity. The GPPoperating assumption is that when overall performance is considered, management systemsand the potential they create will be important predictors of which governments do well andwhy they are able to do so. For the states, cities, and counties examined by the GPP, gradesare a useful method for clearly and succinctly communicating that different levels of man-agement capacity do exist across governments and often within governments. The gradesthus serve as both a diagnostic and learning tool.
Extensive national media coverage occurs when the GPP results are made public. On theday of grades release, national newspapers such as USA Today and the Christian Science Monitorand nearly 300 regional daily newspapers print stories and editorials. Additionally, more than200 radio and television stations air segments covering the project. Well known nationalmedia organizations such as the Associated Press, National Public Radio, ABC Radio, CBSRadio, and CNN Radio generate coverage based on interviews of project leaders.
Subsequently, The Maxwell School uses the data collected to conduct scholarly analysisand communicate results in more traditional scholarly outlets, such as journal articles, bookchapters, and books. Additionally, Maxwell researchers prepare summaries, learning papers,
Table 1.1
HISTORY OF THE GOVERNMENT PERFORMANCE PROJECT
Year Governments Assessed by the GPP
1996-1997 2 cities, 2 counties, 4 states, and 4 federal agencies
1997-1998 None
1998-1999 50 states and 15 federal agencies
1999-2000 Top 35 U.S. cities based on revenues
2000-2001 50 states
2001-2002 40 of the largest U.S. counties
4 THE NEW JERSEY INITIATIVE: Building Management Capacity in New Jersey Municipalities
and innovation papers to report various aspects of GPP findings. Furthermore, the CampbellPublic Affairs Institute at The Maxwell School continues to build an information and docu-ment library.
The New Jersey Initiative
The New Jersey Initiative (NJI) is a pilot project designed to work closely with a select groupof New Jersey municipalities to analyze their management capacities. The purpose of the proj-ect is to increase understanding of the capacity of management systems that best enablemunicipal governments to perform well and meet the needs of citizens. In March 2001, theNJI was established through a new grant from The Pew Charitable Trusts with additional
financial support from the New Jersey Department of CommunityAffairs. The NJI is conducted jointly by The Maxwell School’s(Appendix G) Alan K. Campbell Public Affairs Institute (Appendix H)and the Eagleton Institute of Politics at Rutgers, The State Universityof New Jersey (Appendix I). The goal of the NJI is to apply theGovernment Performance Project model and its methodologies toseven urban and suburban municipalities. The NJI analyzes the man-agement capacity of the same five management system areas as theGPP – financial management, capital management, human resourcesmanagement, information technology management, and managingfor results.
The 1993 National Commission on the State and Local PublicService stated, “Yet a growing consensus has emerged among both citizens and public officialsthat state and local governments need to improve their capacity and performance if we are tomeet the challenges of our rapidly changing economic and social systems.” Thus, the NewJersey Initiative is an important effort to identify how New Jersey municipalities can improvetheir management capacity to result in better performing government and delivery of servicesto their citizens.
Researchers interacted much more closely with the New Jersey municipalities than theydid with governments across the nation in the GPP. In the summer and fall of 2001, researchteams obtained data from municipalities through surveys and questionnaires, public docu-ments, and interviews of professional managers. The original surveys were developed for theGPP and improved upon to make them appropriate for New Jersey municipalities. During thewinter months, the researchers analyzed the data and diagnosed the municipalities. Finally, inthe spring of 2002, they authored the final report. In order to keep the municipalitiesinformed and to respond to their concerns, the project conducted three seminars during theyear. Attendees were usually business administrators, assistant business administrators, orchief financial officers. The first event was an introductory seminar to learn about the project,the second was an interim seminar to engage in discussions about the research process, andthe third was a learning seminar to receive the final report and review its findings and recom-mendations. For the NJI, rather than using grades as for the GPP, the final report identifiesareas demonstrating strengths, as well as those in need of improvements, in order to providea foundation for enhancing the performance of government in the seven municipalities andothers with similar characteristics and conditions.
The comprehensive approach of the NJI reflects the complexity of government and the
The purpose of theproject is to increaseunderstanding of thecapacity of manage-ment systems thatbest enable municipalgovernments to per-form well and meetthe needs of citizens.
Assessing Management Capacity in New Jersey Municipalities 5
political environment in which public management occurs. The NJI collaborative researcheffort is designed to assist both elected and appointed government officials in improving thecapacity of municipalities to serve their communities. More broadly, the NJI provides anopportunity for other municipalities, other levels of government, educational institutions,and non-profit organizations to learn about management systems, how they might beimproved, and how they can better meet the needs of those in leadership positions.
At the start of the project, a strong consensus was established between The MaxwellSchool and the Eagleton Institute that letter grades not be used for the New Jersey Initiative.In doing so, Maxwell School researchers were able to provide a more in-depth diagnosis ofmanagement capacity in the seven NJI municipalities since fewer governments are evaluatedthan in the national-level Government Performance Project. The final report provides con-structive feedback to the municipalities through a deeper explanation of managementcapacity in the management system areas than is possible with the use of grades. Morespecifically, Chapters 2 through 6 contain rich descriptions of the strengths and weaknessesof management systems in the municipalities and recommendations for improving thesemanagement systems.
Municipalities in the New Jersey Initiative
New Jersey is the fifth smallest state in the nation with a size of 7,414 square miles; however, it has the ninth-largest population at approximately 8,414,000 according to 2000census data. Consequently, the state has a disproportionate three percent of the country’stotal population. With 1,134 persons per square mile, New Jersey is the most densely popu-lated state. The entire state is incorporated into 566 municipalities with small areas averaging13 square miles.
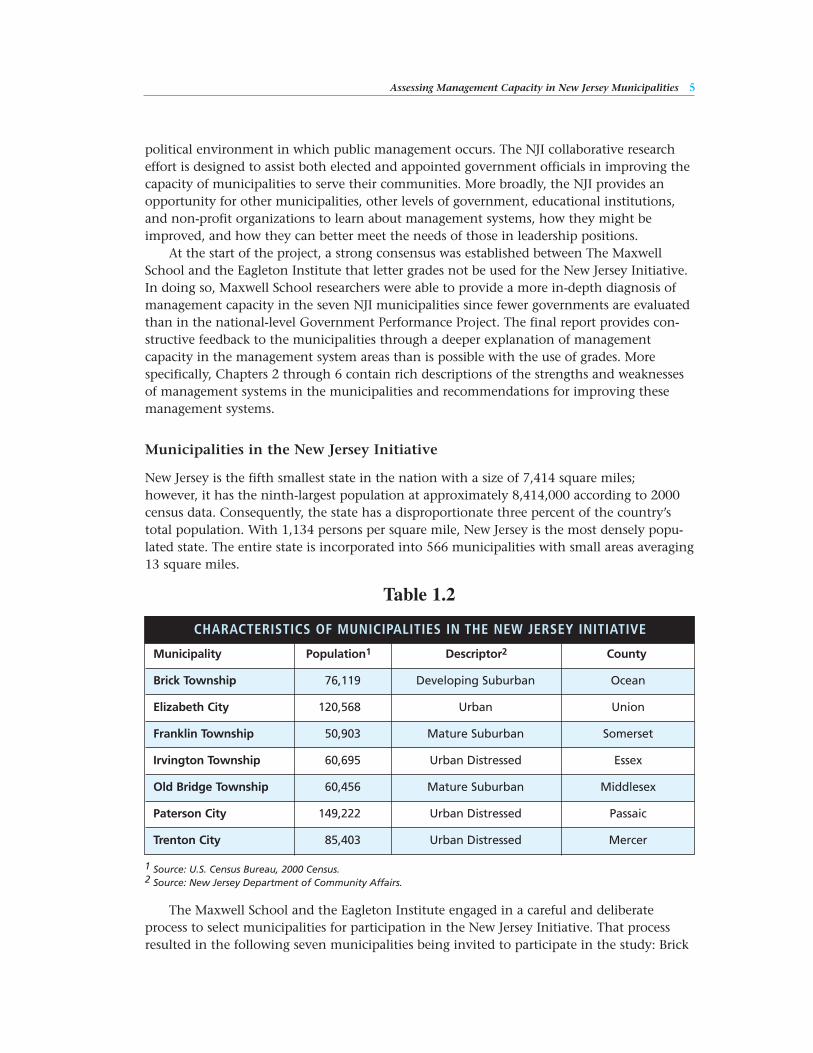
The Maxwell School and the Eagleton Institute engaged in a careful and deliberateprocess to select municipalities for participation in the New Jersey Initiative. That processresulted in the following seven municipalities being invited to participate in the study: Brick
1 Source: U.S. Census Bureau, 2000 Census. 2 Source: New Jersey Department of Community Affairs.
Table 1.2
CHARACTERISTICS OF MUNICIPALITIES IN THE NEW JERSEY INITIATIVE
Municipality Population1 Descriptor2 County
Brick Township 76,119 Developing Suburban Ocean
Elizabeth City 120,568 Urban Union
Franklin Township 50,903 Mature Suburban Somerset
Irvington Township 60,695 Urban Distressed Essex
Old Bridge Township 60,456 Mature Suburban Middlesex
Paterson City 149,222 Urban Distressed Passaic
Trenton City 85,403 Urban Distressed Mercer
6 THE NEW JERSEY INITIATIVE: Building Management Capacity in New Jersey Municipalities
Township, Elizabeth City, Franklin Township, Irvington Township, Old Bridge Township,Paterson City, and Trenton City. Each of the municipalities voluntarily accepted the invita-tion and cooperated with the project during the evaluation process. Table 1.2 containsgeneral characteristics of the municipalities. The municipalities are among the 25 largest inpopulation relative to all municipalities in New Jersey. Their populations range from approxi-mately 50,000 in Franklin Township to 150,000 in Paterson City, according to 2000 censusdata. Moreover, three of the municipalities are suburban and four are urban. Furthermore,three of the four urban municipalities are categorized as fiscally distressed according to theNew Jersey Department of Community Affairs. Thus, the project included a variety of citiesand townships in the study. More details about the municipalities appear in Appendix C.
Criteria for Invitation to Participate
As a starting point, the New Jersey Department of Community Affairs recommended that theNJI focus primarily on urban cities and include several fiscally distressed cities. The MaxwellSchool, the Eagleton Institute, and the New Jersey Initiative Advisory Committee agreed thata broad set of factors should be considered to ensure some variation among the final set ofmunicipalities. Characteristics identified as important variables included urban or suburbanlocation, county, population, racial demographics, and degree of fiscal stress. Approximately25 municipalities were considered in the final pool of possible municipalities. The final sevenmunicipalities were recommended to receive an invitation to participate based on a balanceof factors to ensure some commonalities and variation among them.
Benefits to New Jersey Municipalities
The municipalities that participated in the New Jersey Initiative gained the opportunity tolearn about and improve their own management systems. But much more than that, theirparticipation will enable municipalities all over New Jersey to benefit from the results of theevaluations contained in this report. The Government Performance Project and the NewJersey Initiative are two of the most comprehensive surveys ever conducted of core govern-ment management systems. The NJI is derived from the GPP, which is a successful, widelyknown, highly regarded, and credible national research project. Municipalities that partici-pated in the NJI took advantage of an opportunity to be a part of cutting-edge publicmanagement research.
Governments today find that they are often held to specific performance standards suchas the number of potholes filled per week. Also, governments are often judged by whether ornot expenditures match revenues without regard to need, sources of funds, or the adequacyof resources to support management systems. The GPP and NJI focus on the capacity of gov-ernments to perform. Without systems in place and those systems coordinated, governmentscannot meet the demands placed on them, however worthy they may be. Like the GPP, theNJI seeks to raise the importance of understanding management systems and enhancing thecapacity of governments to perform.
New Jersey municipalities, like all levels of governments across the nation, are expectedto improve their performance. Most of the reform emphasis has been on measures of per-formance and not on capacity to perform. Common sense tells us, however, that unlesscapacity is present, measurement of results can be a futile and dispiriting exercise. The NJIexamines capacity by analyzing the extent to which government has the right resources in
Assessing Management Capacity in New Jersey Municipalities 7
the right place at the right time, whether it has and can use the right information at theright time, and whether the management systems that support both the visions and strate-gies of leaders are present. Government management capacity is the platform forgovernment performance. Without capacity in place, high performance is not likely to occur.With it in place, both performance and its effective measurement become more likely. TheNJI helps participating municipalities learn more about their management system capacities,know where and how to improve management systems, and, hence, increase performance.
Furthermore, the NJI can help all of the state’s municipalities understand what consti-tutes good management systems. One of the NJI’s objectives is to draw out lessons abouteffective management systems and to understand how, and in what contexts, good manage-ment matters to strong performance. Consequently, the NJI facilitates the sharing ofinformation and a learning process among New Jersey municipalities.
Management Capacity
This section presents the conceptual framework that describes the key relationships inherentin government performance and forms the analytical basis for the New Jersey Initiative. Thisframework is presented in two parts. First, we discuss the relationship between managementand performance. Then, we define management capacity and describe three key dimensionsof capacity that affect a government’s ability to be effective: the major management systemscommonly present in governments, the mechanisms by which these systems are integrated,and the role of a focus on results. Much of the discussion presented here is derived fromscholarship associated with the Government Performance Project.
Management and Performance
Discussions of performance and reform are integral to contemporary debates about the con-tinuing role of government in society. Thus, rigorous analysis of and prescriptions toimprove government performance must be cognizant of the complex issue of how to assessand improve government management. As governments movetoward greater emphasis on results, they and their constituents havebegun to pursue this very objective throughout the United States andelsewhere, as evidenced by the focus and nature of many modernreform initiatives. The idea that reforms should target managementis sensible because the systems created within and across governmentorganizations to manage resources, and to translate them into publicservices, are substantially influenced by public managers. At the sametime, many critical environmental influences on performance (suchas politics and elections; legislative mandates; economic, social, andphysical conditions; the media; and citizen views about policy prob-lems) are mostly beyond the control of public organizations andtheir managers. Nonetheless, to understand how to improve publicperformance, the quality of public management must receive primeattention.
The model shown in Figure 1.1 represents the linkage between public resources, govern-ment management performance (the degree to which a public entity’s administration is
Therefore, efforts tounderstand a particu-
lar government’smanagement capacity
logically focus on threetargets for analysis:
the management systems, the extent of
integration, and thedegree to which a
results focus exists.
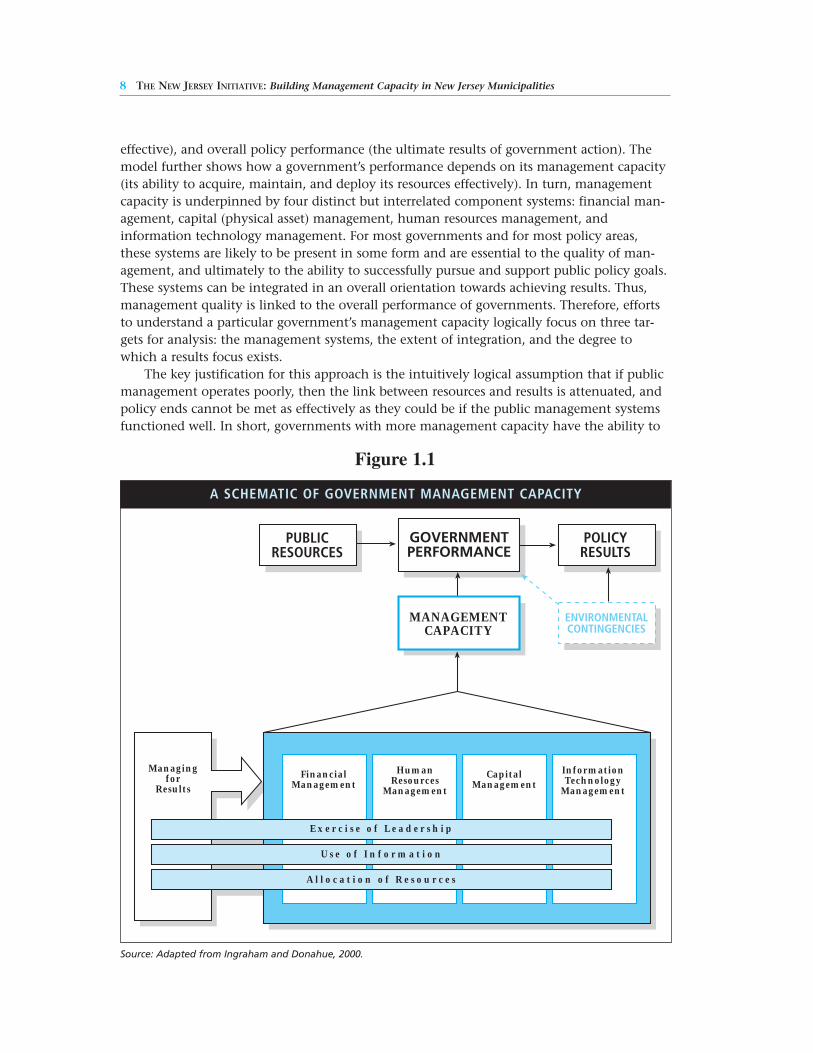
effective), and overall policy performance (the ultimate results of government action). Themodel further shows how a government’s performance depends on its management capacity(its ability to acquire, maintain, and deploy its resources effectively). In turn, managementcapacity is underpinned by four distinct but interrelated component systems: financial man-agement, capital (physical asset) management, human resources management, andinformation technology management. For most governments and for most policy areas,these systems are likely to be present in some form and are essential to the quality of man-agement, and ultimately to the ability to successfully pursue and support public policy goals.These systems can be integrated in an overall orientation towards achieving results. Thus,management quality is linked to the overall performance of governments. Therefore, effortsto understand a particular government’s management capacity logically focus on three tar-gets for analysis: the management systems, the extent of integration, and the degree towhich a results focus exists.
The key justification for this approach is the intuitively logical assumption that if publicmanagement operates poorly, then the link between resources and results is attenuated, andpolicy ends cannot be met as effectively as they could be if the public management systemsfunctioned well. In short, governments with more management capacity have the ability to
Source: Adapted from Ingraham and Donahue, 2000.
Figure 1.1
A SCHEMATIC OF GOVERNMENT MANAGEMENT CAPACITY
8 THE NEW JERSEY INITIATIVE: Building Management Capacity in New Jersey Municipalities
FinancialManagement
HumanResources
Management
CapitalManagement
InformationTechnology
Management
Managingfor
Results
Exerc i se of Leadership
Use of Infor mat ion
Al locat ion of Resources
PUBLICRESOURCES
POLICYRESULTS
GOVERNMENTPERFORMANCE
MANAGEMENTCAPACITY
ENVIRONMENTALCONTINGENCIES
Assessing Management Capacity in New Jersey Municipalities 9
perform better than governments with less management capacity, all else equal. Whether gov-ernments with more capacity actually perform better than governments with less capacity (inother words, whether their ability to perform is translated into the desired results) depends onthe influence of other determinants, such as the political environment or economic condi-tions. Because assessing capacity ultimately allows us to understand the potential to achievepolicy outcomes that is created by the configuration and operation of a government’s man-agement systems, it gets at the heart of government effectiveness; public organizationalstructures and managerial behavior are drivers of policy outcomes that public administratorscontrol to a large extent.
In short, management performance supports policy performance. And capacity supportsperformance – all else equal, if public organizations have good managers and good manage-ment systems, they are more likely to be effective performers. It is important, though, not toconstrue management capacity as demonstrated performance. It is, rather, a platform for per-formance – a measure of positive or negative potential. The capacity to perform is the targetof our analysis.
Management Capacity Defined
By “capacity” we mean government’s intrinsic ability to marshal, develop, direct, and controlits human, physical, and information capital to support the discharge of its policy directions.That is, management capacity concerns the extent to which a government has the rightresources in the right place at the right time. A government’s management capacity residesboth in its people – public managers – and in what we refer to as “management systems”:administrative structures and processes created to address a government’s financial, humanresources, capital, and information technology needs. Capacity is also intertemporal, that is, itdepends on the extent to which a government can maintain a reliable and appropriately con-figured resource base over time, success at which necessitates functions such as strategicplanning, performance measurement, and performance monitoring. In addition, capacityencompasses both a public entity’s intrinsic administrative ability (i.e., its innate potential toperform), and its ability to carry out its administrative functions under existing environmen-tal conditions, such as resource constraints and political imperatives. Finally, capacity is notsimply structural; rather, it depends on the quality of a government’s management systemsand the extent to which they are mutually enabling in support of meeting the government’soverall administrative needs.
Components of management capacity
As we have stated, a government’s management capacity fundamentally depends on threecomponents, each of which we will now describe briefly:
1. The configuration, tasks, procedures, and work processes of a government’s manage-ment systems that embody its intrinsic administrative activities
2. The ways in which these management systems are interrelated and orchestrated to forma coherent and cohesive totality
3. The existence of a formal managing for results system that lends a substantial frame-work to organizational learning processes
10 THE NEW JERSEY INITIATIVE: Building Management Capacity in New Jersey Municipalities
Management systems
For most governments and for most policy areas, four broad core systems are likely to bepresent. The characteristics of the systems that underpin government management are sum-marized next:
Financial management. Government financial management systems distribute and man-age money for public purposes through processes such as procurement, accounting, cashmanagement, and reporting. Financial management includes both budget allocation andbudget execution systems. A financial management system that supports performance mustdetermine the appropriate level of resources, allocate those resources according to strategicpriorities, and spend money effectively and accountably. Key components of the effectivenessof the financial management system include the ability to engage in accurate revenue andexpenditure forecasting, a long-term focus, the practice of planning for contingencies, aware-ness of the linkage between cost and performance, appropriate flexibility, and controls thatguard against waste, fraud, and abuse.
Capital management. Capital management involves planning for, developing, maintain-ing, and disposing of long-lived resources. This area is particularly salient for state and localgovernments, where capital spending and stock management demands are typically morefrequent than in federal agencies, although many federal agencies have large capital responsi-bilities. Key components of the effectiveness of the capital management system includeactive engagement in long-range planning and prioritization of projects, adequate budgetaryresources for infrastructure maintenance and repair, and attention to the relationshipbetween the capital and the operating budgets.
Human resources management. Government activities are typically highly labor-intensiveand, thus, personnel systems, concerned with recruiting, testing, hiring, retaining, motivat-ing, training, and terminating public employees, are a key element of public institutions. Keycomponents of the effectiveness of the human resources management system include the useof coherent rules and procedures, efforts at workforce planning, timely hiring, sufficient pro-fessional development programs, and meaningful reward structures and disciplinary actions.Because increased flexibilities in the human resources management process have been a con-sistent focus of administrative reform, it is also important to consider where in the systemand for whom such flexibility occurs.
Information technology management. The quality and availability of information is crucialto the ability of managers and policymakers to make decisions and carry out the key func-tions of resource acquisition and policy implementation. Managing information technologyincludes the design, acquisition, maintenance, and use of technological systems to collect,analyze, and communicate data. Especially in public institutions responsible for executingcomplicated programs and interfacing with large, diverse constituencies, information tech-nology performs both primary and integrative functions. It not only responds to informationdemands particular to specific programs, but also supports the information needs of theother management systems. Key components of the effectiveness of the information technol-ogy management system include the timeliness, accuracy, reliability, usefulness, andcost-effectiveness of data and the ability of all personnel to use the information systems.
Integration
Good management depends not only on the good performance of each of these systems
Assessing Management Capacity in New Jersey Municipalities 11
independently, but particularly on the extent to which these management systems operateaccording to consistent objectives, are mutually supporting, and are well coordinated.Management systems in combination, not isolation, create effective management capacity.Thus, within the context of government management, the relationships among the manage-ment systems and their contribution to management effectiveness are influenced by thedegree of integration. In our model, integration is the extent to which the management sys-tems are orchestrated as part of a unified, cohesive whole with shared values, common goals,aligned objectives, and mutually-enabling tasks. Integration is primarily accomplishedthrough three key activities: the exercise of leadership, the use of information, and the strate-gic allocation of resources.
Leadership. Leadership essentially refers to the ability of senior executive, appointed, andcareer officials to make decisions; to provide guidance and direction; to develop the institu-tion’s mission, vision, and values and communicate them to all its members; and tocoordinate the behavior of all organizational components and systems to behave in a man-ner consistent with the institutional and broader public values in order to achieve the statedmission and ultimately to realize policymakers’ intent. The extent to which coherence acrossmanagement systems and the capacity to move constructively toward public goals and objec-tives is achieved depends on leadership at both the political and executive levels. Politicalleadership provides a critical set of directions, resources, and supports for system creation,configuration, and maintenance. Political leadership generally does not, however, interactspecifically or consistently with the management systems. Leadership of these systems is theresponsibility of a different set of leaders: those located within the organizations.
Use of information. The freedom, consistency, and speed with which managers causeinformation to flow throughout a government, the attention that managers give data, andthe willingness of managers to share knowledge converge to facilitate or thwart the overallintegration of the management systems. While the information technology management sys-tem, a mechanism concerned with the collection and availability of timely and accurate data,supports the transmission and use of information, it is the interaction of government man-agers with information that can enable the management systems to operate in concert.
Allocation of resources. The decisions managers make about how resources will be garneredand distributed across a government and the activities that facilitate this decision-makingprocess influence the extent to which the management systems are configured to be mutual-ly supporting. The classic example of such activity is the budget process, whereby managersnegotiate over how money will be allocated, which fundamentally communicates the collec-tive perception of the government’s goals and priorities. Another example is the location ofcapable human capital throughout the government. While such processes as recruiting andhiring personnel are the purview of the human resources management system, the place-ment of people at key points of intersection among the management systems affects thedegree of cohesion in the system as a whole.
Results focus
Another factor that affects how the management systems influence management capacity isthe degree to which a formalized system of managing for results is present and in use by thegovernment. This system is itself formally developed as a management system by some gov-ernments and can have an important impact on the quality of the other systems. Managingfor results is the dominant mechanism by which leaders identify, collect, and use the infor-
12 THE NEW JERSEY INITIATIVE: Building Management Capacity in New Jersey Municipalities
mation necessary to evaluate the institution’s performance in pursuit of key objectives tomake decisions and direct institutional actions. Managing for results comprises a set of toolsthrough which organizational learning processes are formalized. It is thus a key tool for lead-ers seeking to improve the ability of the other systems to support the overall institutionalmanagement capacity and ultimately to contribute positively to successful policy outcomes.
By our definition, governments that are managed for results focus continually on discov-ering the most effective ways of achieving their objectives, employing these techniques acrossall management systems, and monitoring agency activity in light of these objectives. Such aresults orientation rests on three vital components. The first is the ability to identify clearobjectives. The second is a means to assess progress toward those objectives according toaccepted criteria or standards, a mechanism often referred to as performance measurement.The third is an established habit of monitoring performance on an ongoing basis. Thus, man-agement capacity is driven not only by the characteristics and degree of integration of themanagement systems, but also by broader mechanisms for tracking activities and perform-ance relative to overall objectives.
Environmental contingencies
It is important to recognize that a variety of environmental factors affect all components inthe government performance system. Local conditions can have a dramatic impact on thecharacter of programs, their outcomes, and policy performance. These factors embody abroad array of influences, including properties of the larger context within which the govern-ment operates and properties of the government’s jurisdiction, such as socioeconomicconditions, demographic characteristics, and the physical environment. It is easy to see thatenvironmental factors might affect public management systems. Human resources manage-ment, for example, will be influenced by demographic factors such as the size andqualifications of the available labor pool. Capital management likely would be affected by theweather.
It is also important to acknowledge that politics and the political environment play animportant part in policy content, management effectiveness, and policy performance. Thepolitical environment plays a crucial role in determining how good performance is defined.The clarity – or lack thereof – of public goals and objectives is directly connected to the poli-tics of organizational mission and support. The capacity of the organization to marshalresources to attain its goals and objectives is directly related to levels of external political sup-port and understanding. In short, management activities and systems do not exist as ends inthemselves, but as one part of the complex performance equation for public organizations. Atthe same time, management matters in ways that are central to public performance.
Value of the Model
Governments are not, in reality, ideal types and thus will not fit neatly into the conceptualframework we have presented. Nonetheless, our framework can help develop ideas about agovernment’s potential for performance, and can help to communicate these ideas to a broadand diverse audience. There are several sets of stakeholders concerned with government effec-tiveness, and therefore sound analyses of government management capacity, such as thatundertaken in the New Jersey Initiative, may simultaneously serve multiple purposes.Citizens seek clear, understandable explanations of what their governments do and how wellthey work.
Assessing Management Capacity in New Jersey Municipalities 13
At the same time, elected officials demand information about how effectively and effi-ciently public resources are employed in providing public goods and services. And policyanalysts would like to be able to incorporate reliable, valid, and accurate measures of publicbureaucracies into models of policy systems in order to account for the role of public man-agement in policy implementation. This diversity of interests suggests the need for a modeland an analytic approach that is at once general and parsimonious. That is, to be able toaccommodate the multitude of purposes to which it is likely to be put, any study of govern-ment management must capture a complex web of relationships, but must also permitvariation to be identified along specific, meaningful dimensions. This is the goal of analysessuch as this one.
New Jersey Laws Governing Municipal Administration
State of New Jersey laws create a distinctive legal and administrative environment for all thestate’s municipal and county governments. It is important to consider these laws when eval-uating the municipalities’ performance. This section highlights some of the most significantlaws that affect financial management, capital management, human resources management,information technology management, and managing for results practices in municipalities.Additionally, a discussion of the important Faulkner Act is included.
Financial Management and Capital Management
Financial and capital management are key components of the analysis of New Jersey munici-pal governments. The following section is not a detailed account of local finance laws oradministrative procedures in this regard (for a more detailed account, see Benecke, 2001;New Jersey Administrative Code, Title 5; and New Jersey Statutes Annotated, Title 40 and40A). However, it provides an overview of financial and capital law. Capital management isan organic part of the long-term planning of financial management.
Unique features of New Jersey and its municipalities
Incorporation of the entire state
The entire state of New Jersey is incorporated into 566 municipalities with historic, fixedboundaries. The relatively small size of the state and the large number of incorporatedmunicipalities result in most New Jersey municipalities being small in area and small in com-parison with municipalities in other states. While New Jersey is mainly a fully developedurbanized state with the highest population density in the United States, even Newark, thelargest municipality with 275,000 residents, is relatively small in comparison to other majorcities in the country. The state includes a number of rural municipalities mainly in the southand the northwest that are reminders of why New Jersey is called the Garden State.
The complete incorporation of the entire state has led to some noteworthy phenomena.These municipalities cannot grow by annexation. When municipalities require more land fordevelopment or an increase in the population in their tax base, they are unable to grow out-ward, a tactic employed by many – especially Western – municipal governments (althoughconsolidation may be an option for New Jersey municipalities). The fixed boundaries limitthe expansion of the municipalities and exacerbate some urban problems that are common
14 THE NEW JERSEY INITIATIVE: Building Management Capacity in New Jersey Municipalities
nationwide. Many such problems are like chain reactions. For instance, rapid rise in landprice usually reduces the attractiveness of urban areas to businesses, which prevents the citiesfrom gaining more commercial property tax payers and more quality jobs that can increasethe tax base. This loss of revenue leads to deterioration of public safety, public education,and the overall quality of life in the urban centers. The migration of the middle- and upper-class from urban centers to the suburban municipalities may further erode the urbanmunicipal tax base and put the cities into a downward spiral. To reverse this situation, stateand urban municipalities have worked out additional measures like tax abatements andurban enterprise zones to attract and retain businesses.
Political state
New Jersey is characterized as a very political state (Salmore and Salmore, 1993). Every leg-islative district delegation represents multiple municipalities and delegations are interested inkeeping their constituent political officials and citizens content. To the extent that politics isa part of local government administration generally, and to a lesser extent to financial man-agement practices, it is especially pronounced in New Jersey. Indeed, during the interviewprocess, some local officials typified local politics and political dynamics as the “life of thestate.”
The level of political influence in day-to-day government varies from municipality tomunicipality, and the extensiveness it plays in New Jersey is not seen as often in other states.Thus, professional financial administrators are often involved in juggling political impera-tives and desired financial management initiatives. While the outcome can often be positive,there are occasions where political imperatives do not mesh well with sound financial man-agement.
Property tax as almost the only own-source revenue
New Jersey municipalities rely on local property taxes to raise their local revenue. Local gov-ernments have few other taxing authorities or options. Even in recent years when fees havebecome an increasingly stable source of local revenue nationwide, the fees collected remain avery small portion due to restrictions from state laws, in comparison with local governmentsin other states. In this sense, their economic base is fixed.
Thus, elected officials are very sensitive to changes in property taxes from year to year.Property taxes are often the primary issue in local government elections and elected officialshistorically take whatever action they can to keep property taxes under control, particularlyin election years.
The ability of New Jersey municipalities to attract new development in order to addvalue to their tax base varies greatly. In addition to economic conditions, the availability ofland is a major factor in economic growth. Many municipalities that are historic villages orolder cities have little flexibility for attracting new development. One option is to redevelopolder districts into ones with higher population density, but this option is often unpopularwith existing communities. Cities seek development of brownfields, which may be costlybecause of the need to clean up sites before reuse. In those municipalities that have openland, there often is resistance to more development because of the potential for increasingschool enrollment and thereby school costs. Therefore, preference is given to office and com-mercial development that can increase the ratable base.

Assessing Management Capacity in New Jersey Municipalities 15
Centralized environment for financial and capital management
Apart from the features mentioned in the above section, New Jersey displays the followingcharacteristics in the environment for municipal financial and capital management.
Paradox of home rule
The entire state has long been totally incorporated into 566 municipalities (two very smallmunicipalities in northwest New Jersey recently consolidated) and it has a strong tradition ofhome rule that permeates policymaking at both the local and state levels. Municipalities arestrictly creatures of the state with authority and power delegated to them by the state.However, the sentiment of home rule is often in conflict with the strong state control ofmunicipal finances and the countless ways that municipalities are constrained by state laws.
Strong state oversight of local financial management
It is not an exaggeration to say that the management of local government finance is highlyregulated in the state of New Jersey. Controlling and checking are a cornerstone of this cen-tralized approach. The Division of Local Government Services(DLGS) in the New Jersey Department of Community Affairs is thecenter of financial controls and checks. The DLGS is akin to the par-ent of a large family. With a small staff relative to the number ofmunicipalities and the help of detailed local finance laws, the DLGSexerts itself to regulate and control the financial management of the566 municipal governments.
The highly centralized controlling and checking started withreason. In the 1930s, local fiscal decisions were at the sole discretionof local officials. Some municipalities went bankrupt, triggering calls for reform and tightcontrols. Today, New Jersey has one of the most elaborate local financial law systems in thecountry. Assurances of solvency lie at the center of the control system. This acts as a reliablemeasure against risk, but may also prove to be too restrictive to the discretionary authority offront-line managers.
Detailed local finance laws and regulations
New Jersey has one of the most elaborate local finance law systems among the 50 states. Themajor source of these laws stem from New Jersey Statutes Annotated (NJSA) Title 40 and Title40A. The most significant ones include:
• Local Budget Law (NJSA 40A:4-1 et seq.)
• Local Fiscal Affairs Law (NJSA 40A:5-1 et seq.)
• Local Bonds Law (NJSA 40A:2-1 et seq.)
• Local Public Contracts Law (NJSA 40A:11-1 et seq.)
• Local Lands and Buildings Law (NJSA 40A:12-1 et seq.)
• New Jersey Administrative Code (NJAC 5:30-1 et seq.)
It is not an exaggera-tion to say that the
management of localgovernment finance ishighly regulated in the
state of New Jersey.

16 THE NEW JERSEY INITIATIVE: Building Management Capacity in New Jersey Municipalities
These laws cover almost every detail of municipal financial and capital management.Some of the most important areas are briefly discussed below.
Obligatory annual budget approval
Among the 50 state governments, only New Jersey requires its municipalities to annuallysubmit their budget to the state government for review and approval. This required proce-dure has been in place since the 1930s. The Division of Local Government Services datesback to 1917. Its mission is to ensure that municipalities are financially solvent. The stateapproval process started around the time of the Great Depression when fiscal decisions werethe exclusive authority of local officials and a number of municipalities went bankrupt. Nowthe state uses the budget approval procedure as a state oversight system to prevent similarproblems from happening again. According to a state official, “solvency is the underlyingcore of the oversight system.”
Temporary budget
At the beginning of the fiscal year, a temporary budget is adopted by each municipality,which is supposed to last three months. During these three months, the unaudited financialstatement of the municipality is developed to give local officials and DLGS a clear picture ofthe revenue and property tax collection rate of the previous fiscal year. Then the budget forthe new fiscal year is adopted, including appropriation for the reserves for uncollected taxes.
Annual audit and reporting
As part of the controlling and checking system, annual audits and financial statements arerequired of each municipality by DLGS. This measure has played a very beneficial role inimproving municipal financial and capital management, and in preventing and identifyingfraud and scandals.
Capital budget
With very high population densities, New Jersey municipalities have a high level of responsi-bility for infrastructure construction and maintenance. Accordingly, a capital budget is arequired item for each municipality annually.
Cash basis of accounting
To prevent over-estimation of revenue by local officials and to prevent insolvency, the statestipulates the cash basis of accounting (which is now called modified cash basis) in munici-pal budgets. That is, in revenue estimation, municipalities are allowed to recognize only cashreceipts. This excludes anything they might collect in the 60 days after the end of the fiscalyear or promises of what may come in. If revenue is estimated from a new source, adequatejustification must be presented to prove that the new source is valid and the expected rev-enue can be guaranteed.
Tax collection and reserve for uncollected taxes
The municipal tax collector functions as the tax collector for county, municipal, and schoolproperty taxes, as well as any special districts. The school districts and county governments
Assessing Management Capacity in New Jersey Municipalities 17
are entitled to and guaranteed 100 percent of their tax levy, no matter what happens at themunicipal level. Thus, if the tax collection rate is low, then the municipal government suf-fers from the shortfall, rather than schools or the county.
To guarantee the levy for school districts and the county (in theory also for the munici-pality), the state has an elaborate system of calculating a tax collection rate for eachmunicipality, which is then used to calculate a “reserve for uncollected taxes” – the amountof money for assumed uncollected taxes. If the anticipated collection rate is 95 percent, butthe collector collects 97 percent, then the municipality keeps the difference. Ultimately, thedifference becomes “a reward” for the municipality based on its tax collection ability. On theother hand, if tax appeals are filed and the court grants tax refunds, the municipality bearsfull liability. Therefore, the tax collection rate may be used as a key indicator of a municipali-ty’s financial condition.
However, this system may have the unintended consequence of triggering politicalgames. For example, elected officials facing an election year may predict a low collectionrate, but actually target a high collection rate. Thus, they can keep the surplus to appropriatein the following year to help keep property taxes down and make an appealing campaignslogan.
Restricted investment and debt limit
Also, out of “safety” considerations, the state does not normally allow municipalities toinvest for periods longer than 13 months. Short-term investment (cash management) isrestricted to only the most reliable instruments like certificates of deposit and U.S. govern-ment-backed securities, although the state cash management program does provide a venuefor relatively high returns at low risks. Net debt level is limited to 3.5 percent of the three-year average equalized valuation.
Cap law
The 1990 Local Government Cap Law (PL 1990, C. 89 and 95) regulates the expenditure sideof municipal finance. The actual annual appropriations cannot increase by over 5 percent (orthe municipal price deflation rate, whichever is lower) over the previous year’s final appro-priations (40A:4-45.3). For municipalities where population growth is very high (common insome suburban municipalities in recent years), this cap may present some problem in meet-ing the service demands of a growing population. The municipal government may have thetax base and revenue, but it is prevented from spending beyond the fixed cap.
No contingency funds
The elaborate New Jersey local finance laws do not allow municipalities to set up rainy dayfunds or other purpose-specific contingency funds. The single most important tool local gov-ernments can employ to attend to emergency expenditures is through emergencyappropriations (40A:4-46 seq.). If a municipal government has adequate resources and soundfinancial management, and has accumulated surpluses, they can handle emergencies moreeasily. Otherwise, emergency appropriations are their only option and the expenditurecomes out of the next year’s budget.
18 THE NEW JERSEY INITIATIVE: Building Management Capacity in New Jersey Municipalities
State aid programs
Due to the heavy reliance on property tax as the primary source of funding for local govern-ments, each year the state budget provides financial assistance to municipalities as budgetrevenue to offset the need for property taxes. Initially based on a series of formulas, the pro-gram has evolved over the years to one that is primarily a hold-harmless program, atapproximately $1.8 billion, and subject to cost-of-living increases, when state revenues areavailable to fund it.
In addition to the fixed amounts, the state provides aid to municipalities facing short- andlong-term financial stress. The “Extraordinary Aid” program is targeted to most non-urbanmunicipalities that have year-to-year fiscal stresses that result in significant property tax hikes.The Distressed Cities program targets the most fiscally stressed municipalities with structuralfiscal difficulties, usually brought on by declining ratable based on increased costs, and oftenexacerbated by inept fiscal management. Unlike the Extraordinary Aid program, the DistressedCities program includes the assignment of state fiscal and management experts to work withthe recipients to improve their operations. The state’s goal is to work with the community tobring them back to fiscal health and to minimize the dependency on this form of discre-tionary aid.
In both programs, the DLGS carefully examines municipal budgets, recent cost pressures,actions municipalities have taken to help themselves, and the impact of budgets of other tax-ing districts (school and county) to determine the amount of aid awarded under the programs.Given that the programs rely on reviews of the proposed budgets and state funding awarddecisions, municipalities in these programs may experience late adoption of their budgets.
State supervision program
Municipalities are prohibited from declaring bankruptcy without approval by the LocalFinance Board of the DLGS. Whenever a municipality is in financial chaos, the state willassume supervisory role to improve operations. Such cases are very rare, averaging only oneevery three or four years. The DLGS has faced a number of significant challenges and has metthem with considerable success in forestalling municipal bankruptcies and insolvencies. Inrecent years, these problems have mainly stemmed from management issues, such as a lack ofattention to details, a vacancy of the tax collector, low tax collection rates, uncontrolledexpenditures, and unattended labor contracts. Thus, the state supervision program is one thatimproves local financial management though it may not eradicate the problem.
Successes and Challenges of Centralization
This centralized, hands-on approach towards municipal financial management has been suc-cessful in many aspects but not so in others. One success includes the DLGS training of localfinancial officials, which aims to improve actual performance through raising the expertise ofmanagers. An example is the Certified Municipal Finance Officers program.
The state realizes that the small size of municipalities is one cause of inefficiency. A newstate aid program has been designed to encourage sharing of services between municipalities.One example is joint insurance funds.
Another innovation is the qualified bond program, through which local entities can enjoythe higher bond rating of the state government. When the municipal bond rating is less desir-able to investors, the municipalities can obtain a double A rating when issuing new bonds by
Assessing Management Capacity in New Jersey Municipalities 19
entering into the qualified bond program upon approval by the Local Finance Board. Themechanism behind the improved bond rating is that the state will guarantee payment tobond holders by taking money from state aid to the issuing municipality.
Perhaps the greatest success story of centralization is that state control and interventionin times of crisis have effectively eliminated municipal bankruptcy. Local officials admittedduring the interview process that municipal assets are not at risk if municipal governmentsobserve state rules.
However, failures also exist. New Jersey’s 566 municipalities can be described in many dif-ferent ways, including (but not limited to) urban versus suburban and rural, mature versusdeveloping, distressed versus wealthy, large versus small, and so on. This diversity may inhibitthe ability of the DLGS to equitably administer uniform local finance laws across these 566municipal governments.
Some municipalities follow these laws superbly, whereas others avoid restrictions and cir-cumvent them from time to time (debt limit and expenditure caps are examples).Additionally, some officials believe that the fiscal year adjustment in the 1990s was “a nega-tive innovation” whose adverse effects are still felt by the municipalities. New Jerseymunicipalities have been operating under such an elaborate system of local financial controls.
Human Resources Management
This section defines the primary laws that govern New Jersey municipal human resourcesfunctions. These laws include statutes concerning the civil service system, the administrativecode, New Jersey labor laws, and federal regulations.
The state exercises the most influence over local human resources functions when amunicipality adopts Title 11A, thereby participating in the state’s civil service and merit sys-tem. The adoption of Title 11A by a municipality entitles non-confidential, permanentemployees to specific tenure provisions. Under Title 11A, employees holding municipal posi-tions and job titles included in the state career or classified service cannot be disciplined ordischarged without due process.
Title 4A of the New Jersey Administrative Code grants New Jersey’s Department ofPersonnel (DOP) the authority to oversee specific human resources functions and has a signif-icant impact on municipal human resources management. Under Title 4A, the state DOP isgranted the authority to oversee most of the recruiting and hiring processes of New Jerseymunicipalities, which includes posting competitive positions, collecting applications, examin-ing applicants, and certifying candidates. Title 4A also authorizes the DOP to act as an auditorof municipal human resource management processes, such as ensuring that payroll recordsare in compliance with Title 4A.
Labor laws also exert influence over municipal human resources management. The stateof New Jersey’s Employer-Employee Relations Act of 1968 allows municipal employees toselect an association to be its exclusive collective bargaining representative. Collective bar-gaining negotiations are permitted for employment conditions that do not significantlyinterfere with the exercise of management prerogatives pertaining to the formulation of gov-ernment policy (78 NJ 54 1978, 67). Mandatory bargaining items required under law include,but are not limited to, pay rates, insurance benefits, drug testing, holidays, vacations, andpensions.
Finally, all human resources management practices and procedures must remain consis-tent with existing federal laws and legal precedents. These laws, which include Title VII of the
20 THE NEW JERSEY INITIATIVE: Building Management Capacity in New Jersey Municipalities
Civil Rights Acts, the Occupational Safety and Health Act, the Age Discrimination Act of1967, Americans with Disabilities Act of 1990, and the Civil Rights Act of 1991, play an inte-gral role in many human resources management functions. Regulatory agencies, such as theEqual Employment Opportunity Commission, also possess the authority to issue guidelinesthat impact New Jersey’s personnel practices.
Information Technology Management and Managing for Results
Unlike state laws that govern municipalities in financial management, capital management,and human resources management, there are no specific laws aimed at information technolo-gy management and managing for results activities in the municipalities. The state has nostatutory requirements for information technology strategic planning, infrastructure, datamanagement, personnel recruitment and training, or systems management and maintenance.However, New Jersey Local Public Contracts Law (NJSA 40A: 11) does pertain to the procure-ment of computer and telecommunication systems and information technology services.Additionally, there is no state legislation covering managing for results strategic planning, per-formance measurement, data use, or communication of results. More information iscontained in Chapter 5 in the section titled “Information Technology ManagementEnvironment for New Jersey Municipalities” and in Chapter 6 in the section called “Managingfor Results Environment for New Jersey Municipalities.”
The Faulkner Act and Management Leadership
All of the municipal governments in the New Jersey Initiative operate under the 1950 NewJersey Optional Municipal Charter Law, more commonly known as the Faulkner Act. TheFaulkner Act was established to “professionalize municipal government by separating execu-tive and legislative functions and giving the executive stronger powers” (Salmore andSalmore, 1993, 206). Today, 127 of New Jersey’s 566 municipalities have adopted a form ofgovernment under one of the Faulkner Act’s four optional plans: mayor-council, council-man-ager, small municipality, and mayor-council-administrator. Table 1.3 summarizes the numberof municipalities operating under various forms of government in New Jersey. For theFaulkner Act plans, municipalities can select different options for “the timing of elections(general elections or regular municipal election), the size of the council (five, seven, or nine),partisan or nonpartisan elections, concurrent or staggered terms for officeholders, and wardsor at-large seats” (Salmore and Salmore, 1993, 206).
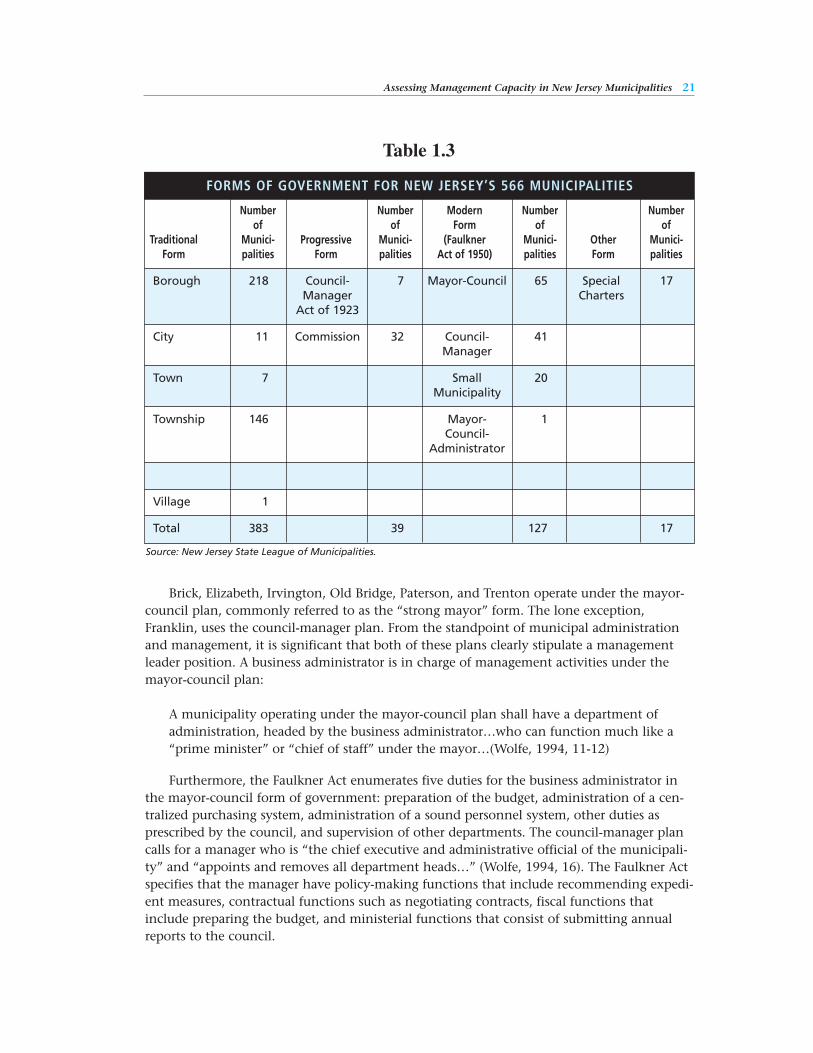
Assessing Management Capacity in New Jersey Municipalities 21
Brick, Elizabeth, Irvington, Old Bridge, Paterson, and Trenton operate under the mayor-council plan, commonly referred to as the “strong mayor” form. The lone exception,Franklin, uses the council-manager plan. From the standpoint of municipal administrationand management, it is significant that both of these plans clearly stipulate a managementleader position. A business administrator is in charge of management activities under themayor-council plan:
A municipality operating under the mayor-council plan shall have a department ofadministration, headed by the business administrator…who can function much like a“prime minister” or “chief of staff” under the mayor…(Wolfe, 1994, 11-12)
Furthermore, the Faulkner Act enumerates five duties for the business administrator inthe mayor-council form of government: preparation of the budget, administration of a cen-tralized purchasing system, administration of a sound personnel system, other duties asprescribed by the council, and supervision of other departments. The council-manager plancalls for a manager who is “the chief executive and administrative official of the municipali-ty” and “appoints and removes all department heads…” (Wolfe, 1994, 16). The Faulkner Actspecifies that the manager have policy-making functions that include recommending expedi-ent measures, contractual functions such as negotiating contracts, fiscal functions thatinclude preparing the budget, and ministerial functions that consist of submitting annualreports to the council.
Source: New Jersey State League of Municipalities.
Table 1.3
FORMS OF GOVERNMENT FOR NEW JERSEY’S 566 MUNICIPALITIES
Number Number Modern Number Numberof of Form of of
Traditional Munici- Progressive Munici- (Faulkner Munici- Other Munici-Form palities Form palities Act of 1950) palities Form palities
Borough 218 Council- 7 Mayor-Council 65 Special 17Manager Charters
Act of 1923
City 11 Commission 32 Council- 41Manager
Town 7 Small 20Municipality
Township 146 Mayor- 1Council-
Administrator
Village 1
Total 383 39 127 17
22 THE NEW JERSEY INITIATIVE: Building Management Capacity in New Jersey Municipalities
Backgrounds of Municipalities
Brick Township
Brick Township is steeped in a history marked by change. Throughout the nineteenth andearly twentieth centuries, Brick Township was a community based on industries such as tim-ber harvesting, iron works, and various types of mills. The importance of industry to thisearly community is exemplified by the fact that the township was named for Joseph P. Brick,a prominent nineteenth century industrialist. In order to sustain Brick, many residents also
engaged in agricultural activities. Overall, this period was one ofonly minor growth, and Brick’s citizens had little interaction withoutsiders. However, this drastically changed in the 1950s with thecreation of the Garden State Parkway, which traverses the length ofthe state.
The Parkway affected every town along its length, and BrickTownship was no different. This new accessibility combined withBrick’s border on the coast made the township an attractive vacationdestination for many wealthy New York and Philadelphia residents.During the past 50 years, Brick underwent extraordinary growth,from slightly over 4,000 residents in 1950 to over 76,000 residentsin 2000. These changes in size drastically altered the nature of thecommunity – not just in its infrastructure and governmental sys-tems, but also in its entire culture. With the influx of new residents,came the realization that prosperity would no longer come from
industry and agriculture, but instead with a service workforce that would cater to vacationersand suburbanites, many of whom commute to other areas.
Due to vacationing visitors, Brick Township’s population increases significantly duringthe summer months, and the relatively small town’s service base must accommodate theneeds of a much larger population. While Brick benefits from the infusion of vacation dollarsinto its economy, the local government must also deal with a large group of people whoplace demands on the community, but who may not necessarily identify with the communi-ty in a traditional way. Reconciling this tension is no simple task and requires direction fromthe local government.
One particularly clear example of these effects on government services is with lawenforcement. The influx of vacationers during the summer months marks a period ofincreased drug use and trafficking problems. Public safety issues require Brick’s governmentto divert much needed resources to law enforcement to address drug related matters.Throughout the 1990s, 60 officers joined the Brick Township Police Department to strength-en its operations.
Like so many other municipalities throughout New Jersey and the United States, Brick isdealing with the difficult issue of balancing growth and the interests of its current residents.While new residents enhance the community and bring new revenue to Brick, they also con-sume land. In order to reduce some of the ill effects of population increases, the municipalgovernment seeks to acquire many of the undeveloped lands in the township. Since 1994,the township has acted to preserve an estimated one thousand acres in various tracts. Thedesire to maintain open lands is supported by the voters of Brick Township. Indeed, one ref-
Due to vacationingvisitors, BrickTownship’s populationincreases significantlyduring the summermonths, and the relatively small town’sservice base mustaccommodate theneeds of a much largerpopulation.
Assessing Management Capacity in New Jersey Municipalities 23
erendum to raise taxes to support land acquisition was passed with 75 percent of voters insupport.
Brick Township is undergoing a major shift in one particular demographic category – theproportion of senior citizens living in the area is increasing. In order to better serve these cit-izens, the municipality develops various new programs such as senior surf fishing, Tai Chi,and ballroom dancing. One initiative, “Project Icebox,” was created to provide more infor-mation to seniors regarding health and prescription drugs (Brick Township, 2001).
Despite the challenges of being a vacation community, Brick Township relies on andappreciates its vacationers as an economic resource. The community’s SummerFest, a freeconcert series, makes Brick a major attraction for residents of Ocean and MonmouthCounties, as well as many vacationers from throughout the state. Brick is a community witha high quality of living that manages challenges from both growth and seasonal tourism.With its growing special events programs, Brick Township is truly one of the premier placesto live or visit in New Jersey.
The Township of Brick has a mayor-council form of government. The seven councilmembers and the mayor are directly elected in a partisan election. The four-year terms arestaggered for the council members. The incumbent mayor was first elected in 1994 and isnow serving his third term. Currently, the council consists of six Democrats and oneRepublican. Elections are competitive and the council has had representatives of both par-ties. The Democratic majority in Brick is unusual in Ocean County and in the TenthLegislative District because both have traditionally voted predominantly for Republicans.
Elizabeth City
Elizabeth City is the fourth largest city in New Jersey, with a population of over 120,000.Like other small cities situated on or near the East Coast, Elizabeth played a role in Colonialhistory, experienced periods of growth during the nineteenth and early twentieth centuries,and then underwent a general decline after the Great Depression. The city, now home toapproximately 2,245 businesses, seems to be on the rise now (Elizabeth City, 2000). This isdue in part to the fact that the municipal government’s priorities are restoration of existingproperty and encouragement of commercial growth.
Elizabeth was destined to become a city of industry. Located ona large transportation hub that includes rail, sea, road, and air con-veyances, Elizabeth occupies prime business real estate. The city’stransportation hub and its proximity to New York City transformedElizabeth into a center of industrial growth throughout the mid-nineteenth century. Specifically, Elizabeth began to expand with theestablishment of the Central Railroad in the 1830s, and the “mostprosperous years, from 1873 to 1929, were enhanced by rail connec-tions to materials and markets” (Elizabeth City, 2000, 15). Today,Elizabeth is still a major stop on the northeast corridor of the New Jersey Transit Linebetween Trenton and New York City.
The decline of the railroads and the general decline of American industrial sectorschanged Elizabeth. The city no longer enjoys the industrial and corporate growth that char-acterized its economy for so many years. In response, Elizabeth City, often working withstate and federal agencies, has taken initiatives to overcome the effects of economic decline.One such project is the establishment of Urban Enterprise Zones. Under this federal pro-
In response, ElizabethCity, often working
with state and federalagencies, has taken
initiatives to overcomethe effects of
economic decline.
24 THE NEW JERSEY INITIATIVE: Building Management Capacity in New Jersey Municipalities
gram, potential retailers in designated areas can qualify for low-cost financing and a 50 per-cent reduction in sales tax for certain items. Other benefits of locating in these areas includeexemption from sales tax on business related goods, employee tax credits, rebates of unem-ployment taxes, and utility rate incentives (Elizabeth City, 2000). These zones areadministered by The Elizabeth Development Company (EDC), a non-profit companycharged with attracting business development. Through these efforts, the EDC “helped putmore than 11,000 people to work” (Elizabeth City, 2000, 7).
Since Elizabeth has a long history as an industrial city, undeveloped areas are quitescarce. Rather than developing the few remaining open areas, the municipal governmentseeks to restore brownfields. These areas are sites that once contained medium or light indus-trial plants that are now abandoned. Furthermore, Elizabeth was selected for a FederalBrownfields Pilot Program (Costello, 2001). One of the largest and most well-known brown-field projects is the Jersey Gardens Mall located near the New Jersey Turnpike. Developed byGlimcher Realty Trust at a cost of about $350 million, the mall is built on a former landfillthat contained a variety of pollutants, including combustible gases. Using practical technicalapplications such as a complex ventilation system, Glimcher Realty created a safe 98-acreshopping complex that is estimated to bring in an additional 5,000 jobs to the area and $5million in revenue for the city through ratable property taxes.
An innovative component of the Jersey Gardens project was the addition of the RetailSkills Center into the mall complex. This job training facility was created out of a public-pri-vate partnership between Glimcher, the city, the Union County government and otheragencies to prepare new employees to work at the mall. This initiative was intended toensure the new mall not only provided jobs to the community, but the citizens of ElizabethCity would be able to fill them.
The federal government is encouraging growth in Elizabeth. Specifically, the City ofElizabeth was awarded a $28.9 million HOPE VI grant to “re-create public housing” accord-ing to the U.S. Department of Housing and Urban Development. Using these funds alongwith private investment, the municipal government started the Family Self-SufficiencyProgram to provide job skill training and other services to local residents.
Elizabeth City has demonstrated it is a resilient community that stands ready for an eco-nomic revival. A visit to Elizabeth City reveals that the community is indeed headed in theright direction.
Elizabeth City has a partisan form of government comprised of a directly elected mayorand nine council members. Six are elected from wards and three are elected at-large. Themayor has led the city since the early 1990s. He and the council members are Democrats,although Elizabeth has experienced competitive races in local government elections. Themayor has a reputation for forging close relationships with Union County, of whichElizabeth is the county seat, and working in collaboration with a Democratic county admin-istration on economic development initiatives.
Franklin Township
Although Franklin Township and its neighborhoods are unique in many ways, they are alsotypical of many small towns throughout the United States. Like so many other communities,Franklin Township has the difficult and often contrary task of encouraging developmentwhile retaining the area’s rich traditions and resources. Indeed, William Brahms, the town-ship’s current historian, writes in Franklin Township, Somerset County, New Jersey: A History
Assessing Management Capacity in New Jersey Municipalities 25
that Franklin’s “governing body has been faced with the responsibility of maintaining a deli-cate balance between preserving the status quo and permitting growth” (1998, vii).
Franklin Township shifted from a largely agrarian economy to a mixed economy, con-sisting of both farming and light industry. Throughout the seventeenth, eighteenth, andnineteenth centuries, Franklin Township consisted of many small and medium sized farmsclustered around small villages and sustained by the markets created by nearby Philadelphiaand New York City. Brahms (1998) outlines three distinct stages of agricultural developmentthroughout Franklin Township’s history: Pre-World War I, Interim Period, and Post-WorldWar II. Each phase brought with it greater technological innovations and increased knowl-edge of farming techniques. However, these times of growth also put strains on small farmerswho could no longer make a living without large amounts of capital investment. Otherencroachments on farmers’ land were residents who sought to escape the cities and find soli-tude in more rural areas. This phenomenon, termed “the biggestdilemma of the century,” created a need for planned developmentin Franklin Township (Brahms, 1998, 187).
Agriculture has not been the only area addressed by FranklinTownship’s municipal government and planning committeesthroughout the years. Business and light industry bring manyimportant benefits to communities – primarily employment and rat-ables (taxable land). One area primed for economic developmentwas the region surrounding the newly built Interstate 287. TheSomerset Valley Industrial Campus (SVIC) was created in 1962 by aPhiladelphia real estate developer (Brahms, 1998). This project setthe stage for industrial growth for the next four decades resulting in more than 1,400 busi-nesses and 34,000 jobs (Franklin Township, 1999). While these new corporations obviouslybring revenue and jobs to Franklin Township, development often has detrimental effects onthe local environment.
Like so many other citizens across the nation, the people of Franklin Township began tohave serious concerns about the effects of businesses and housing on the environment in theearly 1970s. Franklin created a Conservation Commission to “preserve for the present andfuture the relatively undisturbed woodland and wetland areas” of the township (FranklinNews Record, 1970). After 1975, all master plans released by the township designated environ-mentally sensitive areas. The state of New Jersey encourages planned development andprotection of natural areas. Two examples are the Delaware and Raritan (D&R) Canal and theSix Mile Reservoir located in Franklin Township.
The D&R Canal was created in 1832 during a period of industrial growth in Americanhistory. By connecting the Delaware River with the Raritan Canal, commerce increasedbetween the cities of Philadelphia and New York, with New Jersey profiting from the trans-fers. Franklin Township was one community along the D&R Canal that benefited. Althoughthe Canal closed to industrial traffic in 1932, it remained an influence in Franklin Townshipas a water source for industrial procedures. The Canal is a source of leisure activities as it pro-vides “biking, hiking, jogging, camping, fishing, canoeing, nature walks, horseback riding,and picnicking” (Brahms, 1998, 229) since it was declared the Delaware and Raritan CanalState Park.
The preservation of the Six Mile Run Reservoir is a more recent development forFranklin Township. In 1989, the state transferred management of the land from the NewJersey Division of Water Resources to the New Jersey Division of Parks and Forestry.
Franklin Townshipexperienced a
population growth rateof nearly 19 percent
between 1990 and2000 bringing the
population to approximately 50,900.
26 THE NEW JERSEY INITIATIVE: Building Management Capacity in New Jersey Municipalities
Currently, the Six Mile Run Reservoir, like the D&R Canal, is a state park that providespreservation of land and recreational opportunities.
Franklin Township has had its share of political conflict. The majority of these issueshave arisen out of a desire to reap the benefits of industrial and residential growth whileminimizing its detriments. Franklin Township experienced a population growth rate of near-ly 19 percent between 1990 and 2000 bringing the population to approximately 50,900.Thus, the township must deal with both growth issues and preserving its history.
Franklin Township in Somerset County (there are other Franklin Townships in NewJersey) has the council-manager form of government. All nine council members run in parti-san elections in November. Five run from wards and the other four run at-large. The mayorwho presides at council meetings is elected annually among the council members. The town-ship manager who is selected by the council is the chief operating officer. Currently, themayor is a Democrat and the other eight members of the council are evenly divided betweenthe two parties. Somerset County is a traditional Republican stronghold within theSeventeenth Legislative District. However, Middlesex County, where Democrats predominate,is also in that district.
Irvington Township
With a population of almost 60,700 persons, Irvington Township is one of the most denselypopulated communities in the state. Situated near four major highways – the Garden StateParkway, New Jersey Turnpike, and Routes 78 and 280 – it is the gateway to suburban EssexCounty. Since it was settled in 1692, the identity of the town has evolved from West Farms, asmall rural village, to a sizeable middle-class suburb named Irvington.
In 1874, the state of New Jersey officially approved legislationcreating the Village of Irvington, and it was then that Irvingtonbecame an independent municipality with its own mayor and vil-lage trustees (Siegel, n.d.). By 1900, Irvington was no longer acountry village but a flourishing middle-class suburb of Newark.Attempts were made to join Irvington with Newark through lawsapproved in Trenton in 1903 and 1908; however, the local voters ofIrvington repeatedly rejected the idea (Siegel, n.d.).
Irvington’s building boom that replaced farms and fields withurban structures ended in 1930, and the municipality’s populationhas remained static since then (Siegel, n.d.). Following World War II,hard times hit Irvington when the Garden State Parkway was con-
structed (Irvington Township, 2001). The new parkway, replacing Oraton Parkway, passesthrough previously quiet neighborhoods and affected the township’s appeal. The wealthyfamilies of Irvington that had occupied the beautiful Victorian row houses moved to the out-lying areas. African Americans, Jews, and immigrants from Eastern Europe and Italy movedin to work in Irvington.
Poverty in the downtown area, racial unrest, and disinvestment characterized Irvington’sproblems in the 1960s, leading to a heightened crime rate and riots (Irvington Township,2001). Disinvestment continued throughout the 1970s and 1980s, and matters only wors-ened with the closing of factories. The high crime further pushed out residents andbusinesses. In the period from 1989 to 1997, per capita income declined in Irvington (NewJersey Future, 2001b). Irvington’s council projects the town’s recent deficit to be around $5.8
Irvington Townshipseeks to improve localconditions by clearingabandoned buildings,constructing newhousing and schools,and establishing anUrban Enterprise Zoneto attract business.
Assessing Management Capacity in New Jersey Municipalities 27
million (Reda, 2002). Today, the township is lined by vacant homes, and the crime rate con-tinues to be high. Inadequate funding for public improvement projects preventsredevelopment of many areas. The cost of demolishing and clearing the land of structures isoften worth more than the land itself. Several essential redevelopment projects were thereforenot carried out (New Jersey Future, 2001a).
Today, the citizens of Irvington have united and have begun to respond to these prob-lems, despite the challenges of local government politics and some cases of corruption.Although the crime rate remains high, the township decided to hire additional police officersin the hope that safety would improve. In addition, Irvington Township seeks to improvelocal conditions by clearing abandoned buildings, constructing new housing and schools, andestablishing an Urban Enterprise Zone to attract business. By sustaining these efforts, the citi-zens of Irvington can successfully overcome these challenges.
The municipal government in Irvington Township, Essex County, is non-partisan. Four ofthe seven council members are elected at-large and three from wards at an election held inmid-May. The council elects its own president who presides over meetings. The mayor, aschief executive, is responsible for the preparation of the budget and the enforcement of ordi-nances. While not required to attend council meetings, the mayor has the right to speak butcannot vote. During the New Jersey Initiative, the mayor was under federal indictment andannounced that she would not seek re-election. Relations between the mayor and the council,as reported in the newspapers, are contentious with disagreements about how the municipali-ty should be staffed.
Old Bridge Township
Old Bridge Township, situated along the Garden State Parkway, is one of the fastest growingmunicipalities in New Jersey during the past 30 years (Cheslow, 2000). Yet the recent popula-tion increase does not reflect the overall history of this suburban community. Instead, OldBridge, or Madison Township as it was called prior to 1976, was a small, rural community thatwas very static throughout the eighteenth, nineteenth, and early twentieth centuries. In thisway, Old Bridge Township is typical of many of the small towns throughout New Jersey.Similar to these other areas, the township has persevered through a great deal of changethroughout the twentieth century.
The English gained control of New Jersey from the Dutch in 1664. From roughly this peri-od until 1869, Old Bridge was part of South Amboy Township until it separated and formed itsown township called Madison. From this point until the early part of the 1900s, the people ofOld Bridge engaged in agricultural and industrial work. Specifically, large amounts of clay andlumber made Old Bridge an excellent location for pottery and timber industries. After thebuilding of a railroad track through the area in 1833, heavier industries began to prosper inthe area as well. Such businesses included shipbuilding, brick-building, and eventually, muni-tions production. Despite the growth of these industries, Old Bridge remained a largelyagricultural community well into the twentieth century.
This changed during the 1950s through the 1990s. A variety of factors, including thedevelopment of infrastructure like the New Jersey Turnpike and urban flight from cities suchas New York and Philadelphia, caused significant population increases in Old Bridge. Between1880 and 1950, the population grew slowly from 1,662 residents to 7,365 residents. However,the population grew to 22,772 by 1960, to 51,406 by 1980, and to 60,456 by 2000. Clearly,large influxes of people require new infrastructure, sewage systems, schools and other public
28 THE NEW JERSEY INITIATIVE: Building Management Capacity in New Jersey Municipalities
services. The township’s goal is to allow development at a rate that current systems can adaptto. During 1990 to 2000, voters rejected the school budget for the township eight times.While Old Bridge has a strong education system, a community that is distrustful of taxincreases often frustrates school officials’ plans.
This disapproval of tax increases manifested itself in the rejection of a proposal to add apenny to the municipal tax rate to create a trust fund for open space acquisition (Haydon,2000). On the other hand, some initiatives to purchase undeveloped land for recreational useare being implemented throughout suburban communities in New Jersey. Old Bridge isunique in that it was one of the first to begin this effort in 1987.
The government of Old Bridge Township is careful to monitor the growth of certainindustries that could prove harmful to the community. Some municipalities are tempted bythe potentially large revenue sources created by commercial properties, but Old Bridge offi-cials are careful regarding new businesses joining the community. The township population,
largely made up of commuters who work in other areas, holds a cau-tious attitude towards commercial growth.
While the existence of commuters relieves some of the pressureto create jobs in the area, they can also deprive a community of anyparticular identity. The municipal government has also madeattempts to address this issue, with projects like the MunicipalComplex, a building that contains municipal offices and service facili-ties. Old Bridge has many pre-Colonial roots, but since large portionsof the township developed during the past 50 years, Old Bridge is stillseeking its identity.
Old Bridge Township is a municipality that has seen its share ofchallenges. Growth rates are now steady, property values are largelyon the rise, and the township is still two-thirds undeveloped. Themunicipal government could strongly encourage commercial growth
to increase revenues, but it instead chooses to take a slow measured route towards change. The Township of Old Bridge directly elects a mayor and nine members of council, six of
whom are elected from wards and three are elected at-large. The election is partisan and thecurrent council is made up of seven Democrats and two Republicans. The mayor is aRepublican who has served since 1992 and has been re-elected three times. The local electionsare competitive and the council has had a bi-partisan make-up in the recent past. MiddlesexCounty, where Old Bridge is located, is regarded as a Democratic county. However, theThirteenth Legislative District that includes Old Bridge is roughly half Democratic and halfRepublican with Republican candidates recently successful in elections for state offices.
Paterson City
Over 200 years old and located within the heart of New Jersey in Passaic County, PatersonCity is steeped in our nation’s history. Since the late eighteenth century, the Passaic River haspowered the mills and factories of the city, and as industries boomed in Paterson, peoplecame from everywhere in search of opportunities and a better life. As a result, the City ofPaterson is often referred to as “America’s cradle of the Industrial Revolution” (Scarcia, 2001, 1).
Originally, Paterson was part of Acquackanonk Township in Essex County, and in 1831, itwas formally put on the map as a township (Shriner, 1919). In 1851, Paterson Township was
Old Bridge Townshipis typical of many ofthe small townsthroughout NewJersey. Similar to theseother areas, the town-ship has perseveredthrough a great dealof change throughoutthe twentieth century.
Assessing Management Capacity in New Jersey Municipalities 29
officially changed to a city. The change from township to city marked the beginning of thelegacy for which Paterson is known. Paterson became known as “The Silk City” for processingand manufacturing 75 percent of American silk in the first half of the 1900s (Einreinhofer,1999). Additionally, textile and paper industries flourished. Paterson also produced the Coltrevolver, repeating rifles, the first locomotive in America, the submarine, and the radial air-craft engine (Scarcia, 2001).
Today Paterson City is still an industrial city, but the prosperity generated by theIndustrial Revolution came to an end long ago. The major decrease in business took place inthe middle of the twentieth century. The industrial decline that impacted Paterson followedthe pattern of other northern textile cities. The manufacturing sector and other industriesdeclined significantly, leading to the loss of jobs in Paterson (U.S. House of Representatives,1999). While New Jersey today has an unemployment rate of six percent, Paterson’s unem-ployment rate hovers around nine percent. It was estimated in 1999 that Passaic Countywould be the slowest growing county in New Jersey in terms of creating new employmentopportunities for the next five years (U.S. House of Representatives, 1999).
However, much is being done to revitalize the city. One belief is that technology willimprove the future of Paterson. The city recently received an $11 million E-rate grant to helpthe school system conform to federal and state technology mandates (Scarcia, 2001). A high-speed fiber-optic network linking 42 school buildings was installed as part of the grant. Sinceits creation in 1994, Paterson’s Urban Enterprise Zone includes about 351 businesses provid-ing 9,117 full-time jobs. About 2,290 of these full-time jobs are new (Scarcia, 2001).
At present, Paterson is also part of the Historically Under-utilized Business Zone(HUBZone) program. Beginning in 1997, the HUBZone stimulates economic growth by offer-ing federal contracting opportunities to small businesses. The city continues to look for waysto expand and improve its HUBZone program (U.S. House of Representatives, 1999).
Furthermore, the Paterson Economic Development Corporation has been aggressivelypushing to relocate companies to the city. Since 1993, with financing of over $70 million,more than 80 companies have been assisted with expansion or relocation to the city. TheEconomic Development Corporation continues to look for incentives that make Patersonmore attractive to the business community (U.S. House of Representatives, 1999).
While recession and the flight of industry over the past 40 years have hit Paterson hard,the city is striving to turn its economy around and find strength in diversity. The city has agreat transportation network important for manufacturing, warehousing, and distribution.With its new citywide network, Paterson’s future might include high-quality communications(Scarcia, 2001). By building upon these strengths, the community may bring back the pros-perity characterizing the history of Paterson.
The City of Paterson operates under a mayor-council form of gov-ernment. The mayor is directly elected citywide, as are three of thenine members of the council. The other six council members are elect-ed from wards. The elections are non-partisan and take place in May.However, partisanship has been an open issue in municipal politics.Eight council members are Democrats and one is a Republican. Thecurrent mayor, a Republican, does not have strong ties to the PassaicCounty Republican Party. He was first elected to the council in 1974 asa Democrat and changed his allegiance to the Republican Party in1980. The council appointed him mayor in January 1997 when the then-mayor was electedto represent Ninth District of New Jersey in Congress. The current mayor ran unopposed in
Today Paterson Cityis still an industrial
city, but the prosperity generated
by the IndustrialRevolution came to
an end long ago.
30 THE NEW JERSEY INITIATIVE: Building Management Capacity in New Jersey Municipalities
1998 for mayor and when elected, was the first African American to assume that position.During the New Jersey Initiative, he ran for re-election while under indictment by the federalgovernment for alleged illegal practices related to the awarding of contracts and lost the elec-tion in May 2002.
Trenton City
Trenton City, the state capitol of New Jersey, has a rich and important historical legacy datingback to the days of early Colonial settlement, the Revolutionary War, and continuing into thenineteenth century as an industrial powerhouse (Trenton Online, n.d.). Located in centralNew Jersey on the Delaware River, the City of Trenton is located in Mercer County, and is bor-dered by Hamilton, Ewing, and Lawrence Townships.
The city was settled around 1680 when a mill was built at the falls by the Delaware River.From this mill and others that followed, one of the country’s most important manufacturingcenters with diversified industries developed (Sines, 1929). In 1719, the name was officiallychanged from “The Falls” to “Trenton” (Key to the City, n.d.). By 1790, Trenton was designat-ed the state capitol.
By the middle of the nineteenth century, Trenton was one of America’s foremost industri-al cities. The city’s location on the Delaware River and the Raritan Canal, and near theCamden and Amboy railroads, provided important transportation routes. These routes fur-thered Trenton’s iron and steel industries, as well as pottery and ceramics businesses. Later inthe nineteenth century, Trenton became a major manufacturing center for rubber products.
Trenton’s famous slogan “Trenton Makes, the World Takes” was created in 1911 during adecade in which the city did in fact make many products. The city produced everything from
the strong steel cabling used to hold the world’s longest suspensionbridges to the anvils on which the nation’s steel was forged(Blackwell, n.d.). Trenton also produced rubber, pottery, cars, wallplaster, farm tools, mattresses, watches, bricks, linoleum, and cigars.
This legacy ended with industrial decline after World War II.Since then, the city has been struggling to revitalize. As for Trenton’sold slogan, the city does not produce as much as it used to. The wire
plant shut down years ago, as did the car, tool, watch, and cigar factories. A few manufactur-ing plants have stayed, but the bulk of Trenton’s jobs are provided by the state government,and service industries such as health (Blackwell, n.d.).
In the 1990s, the task of revitalizing Trenton has brought together the government, busi-ness, education, and non-profit sectors (Trenton City, 2001). The city collaborated with thecounty to revitalize its Waterfront area. Trenton has also been aggressively pursuing thecleanup of old industrial areas through brownfields projects (Trenton City, 2001).
A directly elected mayor and a seven-member council govern the City of Trenton. Four ofthe members are elected from wards and three are elected at-large. The current mayor hasserved since 1990 and was re-elected again in the non-partisan elections in May 2002. Underthe mayor-council form of government, the mayor serves as chief executive officer and is nota member of the council. The current administration has had cordial working relationshipswith the council. Trenton, as both Mercer County seat and state capitol, has forged collabora-tions with those levels of government to engage in joint economic development efforts. It hasdone so with considerable success even though the mayor, a Democrat who ran as an inde-pendent in May 2002, did not share party allegiances with the Republican county executiveor Republican governor for eight years.
Trenton City, the statecapitol of New Jersey,has a rich and impor-tant historical legacy.

Assessing Management Capacity in New Jersey Municipalities 31

2
FINANCIAL MANAGEMENT
THIS CHAPTER FOCUSES ON THE FINANCIAL MANAGEMENT of the seven municipalitiesin the New Jersey Initiative study (where data are drawn from surveys, the chapter coversonly the five municipalities that responded to the survey). Financial management (FM), akey component of the management system for governments at all levels, enjoys a history aslong as government itself. A government must levy taxes to operate and use tax money tofund public functions with strict management through budgeting and appropriating, check-ing and controlling, and reporting and auditing. These aspects form the basic components ofgovernmental financial management. In recent times, an increasing pool of financial toolshas become more accessible to and widely adopted by governments. Long- and short-terminvestment, debt management, and risk/contingency control are all indispensable parts of amodern FM system. A sea of literature has accumulated on each of these issues. However,this chapter is not a theoretical inquiry; instead, it examines FM at the municipality level.
An assessment of the financial management capacities of participating municipalities isreported in this chapter. The chapter starts by elaborating on the concepts of capacity andperformance. It follows by addressing the financial management environment for New Jerseymunicipalities. Then, the chapter presents the criteria for assessing financial managementfollowed by a description of the study’s research methodology. Next, the core section of thechapter discusses the results of the assessment. This section first examines the professionalqualifications of financial managers, referred to as the “people factor.” The second partreviews the financial management infrastructure. The third part amplifies on results accord-ing to the criteria. Following this, a summary is presented. Finally, the chapter concludeswith a section that identifies the study’s major findings and offers recommendations for NewJersey municipalities and the state of New Jersey. Contracting and procurement, an increas-ingly large and independent part of financial management, is discussed in Appendix D. Forthose interested in more extensive analysis, municipalities’ revenue raising capacity isaddressed in Appendix E.
Financial Management Capacity and Systems
Like the Government Performance Project, the New Jersey Initiative approaches the assess-ment of government management with an emphasis on a government’s capacity, rather thanits current performance. More specifically, the NJI examines the extent to which a govern-ment entity possesses a high, medium, or low capacity to manage its intrinsic functions andresources, rather than how well or poorly the entity is performing at the time of the exami-nation. Although capacity and performance are correlated, they are far from the same.Specifically, a government with high management capacity at the time of assessment shouldbe improving its performance if it had less-than-satisfactory performance in the past.
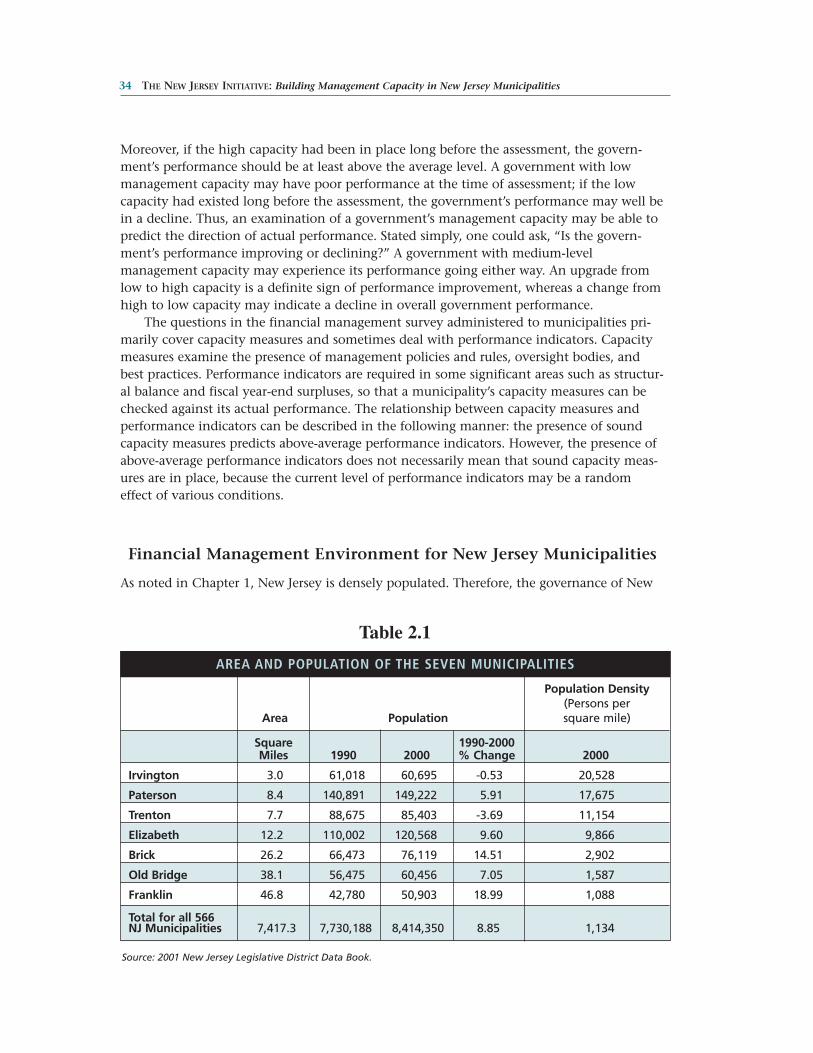
34 THE NEW JERSEY INITIATIVE: Building Management Capacity in New Jersey Municipalities
Moreover, if the high capacity had been in place long before the assessment, the govern-ment’s performance should be at least above the average level. A government with lowmanagement capacity may have poor performance at the time of assessment; if the lowcapacity had existed long before the assessment, the government’s performance may well bein a decline. Thus, an examination of a government’s management capacity may be able topredict the direction of actual performance. Stated simply, one could ask, “Is the govern-ment’s performance improving or declining?” A government with medium-levelmanagement capacity may experience its performance going either way. An upgrade fromlow to high capacity is a definite sign of performance improvement, whereas a change fromhigh to low capacity may indicate a decline in overall government performance.
The questions in the financial management survey administered to municipalities pri-marily cover capacity measures and sometimes deal with performance indicators. Capacitymeasures examine the presence of management policies and rules, oversight bodies, andbest practices. Performance indicators are required in some significant areas such as structur-al balance and fiscal year-end surpluses, so that a municipality’s capacity measures can bechecked against its actual performance. The relationship between capacity measures andperformance indicators can be described in the following manner: the presence of soundcapacity measures predicts above-average performance indicators. However, the presence ofabove-average performance indicators does not necessarily mean that sound capacity meas-ures are in place, because the current level of performance indicators may be a randomeffect of various conditions.
Financial Management Environment for New Jersey Municipalities
As noted in Chapter 1, New Jersey is densely populated. Therefore, the governance of New
Table 2.1
Source: 2001 New Jersey Legislative District Data Book.
AREA AND POPULATION OF THE SEVEN MUNICIPALITIES
Population Density(Persons per
Area Population square mile)
Square 1990-2000Miles 1990 2000 % Change 2000
Irvington 3.0 61,018 60,695 -0.53 20,528
Paterson 8.4 140,891 149,222 5.91 17,675
Trenton 7.7 88,675 85,403 -3.69 11,154
Elizabeth 12.2 110,002 120,568 9.60 9,866
Brick 26.2 66,473 76,119 14.51 2,902
Old Bridge 38.1 56,475 60,456 7.05 1,587
Franklin 46.8 42,780 50,903 18.99 1,088
Total for all 566 NJ Municipalities 7,417.3 7,730,188 8,414,350 8.85 1,134
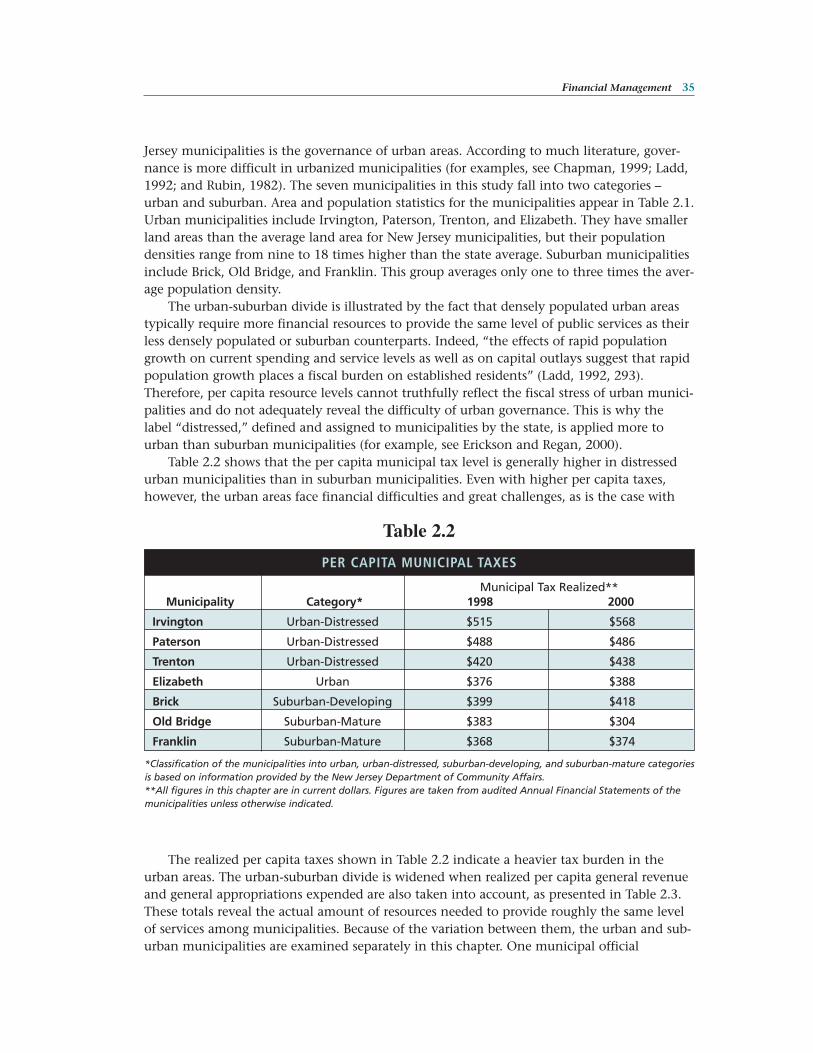
Jersey municipalities is the governance of urban areas. According to much literature, gover-nance is more difficult in urbanized municipalities (for examples, see Chapman, 1999; Ladd,1992; and Rubin, 1982). The seven municipalities in this study fall into two categories –urban and suburban. Area and population statistics for the municipalities appear in Table 2.1.Urban municipalities include Irvington, Paterson, Trenton, and Elizabeth. They have smallerland areas than the average land area for New Jersey municipalities, but their populationdensities range from nine to 18 times higher than the state average. Suburban municipalitiesinclude Brick, Old Bridge, and Franklin. This group averages only one to three times the aver-age population density.
The urban-suburban divide is illustrated by the fact that densely populated urban areastypically require more financial resources to provide the same level of public services as theirless densely populated or suburban counterparts. Indeed, “the effects of rapid populationgrowth on current spending and service levels as well as on capital outlays suggest that rapidpopulation growth places a fiscal burden on established residents” (Ladd, 1992, 293).Therefore, per capita resource levels cannot truthfully reflect the fiscal stress of urban munici-palities and do not adequately reveal the difficulty of urban governance. This is why thelabel “distressed,” defined and assigned to municipalities by the state, is applied more tourban than suburban municipalities (for example, see Erickson and Regan, 2000).
Table 2.2 shows that the per capita municipal tax level is generally higher in distressedurban municipalities than in suburban municipalities. Even with higher per capita taxes,however, the urban areas face financial difficulties and great challenges, as is the case with
Irvington (see Appendix E).
The realized per capita taxes shown in Table 2.2 indicate a heavier tax burden in theurban areas. The urban-suburban divide is widened when realized per capita general revenueand general appropriations expended are also taken into account, as presented in Table 2.3.These totals reveal the actual amount of resources needed to provide roughly the same levelof services among municipalities. Because of the variation between them, the urban and sub-urban municipalities are examined separately in this chapter. One municipal official
Financial Management 35
Table 2.2
*Classification of the municipalities into urban, urban-distressed, suburban-developing, and suburban-mature categoriesis based on information provided by the New Jersey Department of Community Affairs.**All figures in this chapter are in current dollars. Figures are taken from audited Annual Financial Statements of themunicipalities unless otherwise indicated.
PER CAPITA MUNICIPAL TAXES
Municipal Tax Realized**Municipality Category* 1998 2000
Irvington Urban-Distressed $515 $568
Paterson Urban-Distressed $488 $486
Trenton Urban-Distressed $420 $438
Elizabeth Urban $376 $388
Brick Suburban-Developing $399 $418
Old Bridge Suburban-Mature $383 $304
Franklin Suburban-Mature $368 $374
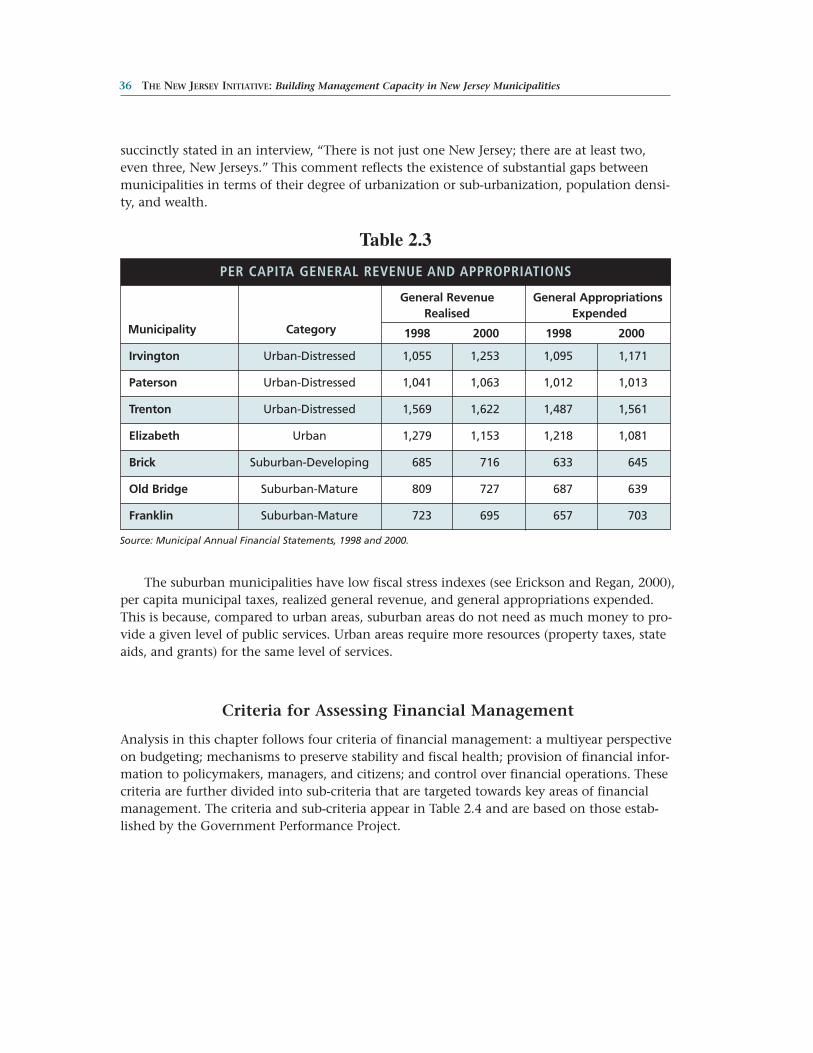
36 THE NEW JERSEY INITIATIVE: Building Management Capacity in New Jersey Municipalities
succinctly stated in an interview, “There is not just one New Jersey; there are at least two,even three, New Jerseys.” This comment reflects the existence of substantial gaps betweenmunicipalities in terms of their degree of urbanization or sub-urbanization, population densi-ty, and wealth.
The suburban municipalities have low fiscal stress indexes (see Erickson and Regan, 2000),per capita municipal taxes, realized general revenue, and general appropriations expended.This is because, compared to urban areas, suburban areas do not need as much money to pro-vide a given level of public services. Urban areas require more resources (property taxes, stateaids, and grants) for the same level of services.
Criteria for Assessing Financial Management
Analysis in this chapter follows four criteria of financial management: a multiyear perspectiveon budgeting; mechanisms to preserve stability and fiscal health; provision of financial infor-mation to policymakers, managers, and citizens; and control over financial operations. Thesecriteria are further divided into sub-criteria that are targeted towards key areas of financialmanagement. The criteria and sub-criteria appear in Table 2.4 and are based on those estab-lished by the Government Performance Project.
Table 2.3
Source: Municipal Annual Financial Statements, 1998 and 2000.
PER CAPITA GENERAL REVENUE AND APPROPRIATIONS
General Revenue General AppropriationsRealised Expended
Municipality Category 1998 2000 1998 2000
Irvington Urban-Distressed 1,055 1,253 1,095 1,171
Paterson Urban-Distressed 1,041 1,063 1,012 1,013
Trenton Urban-Distressed 1,569 1,622 1,487 1,561
Elizabeth Urban 1,279 1,153 1,218 1,081
Brick Suburban-Developing 685 716 633 645
Old Bridge Suburban-Mature 809 727 687 639
Franklin Suburban-Mature 723 695 657 703
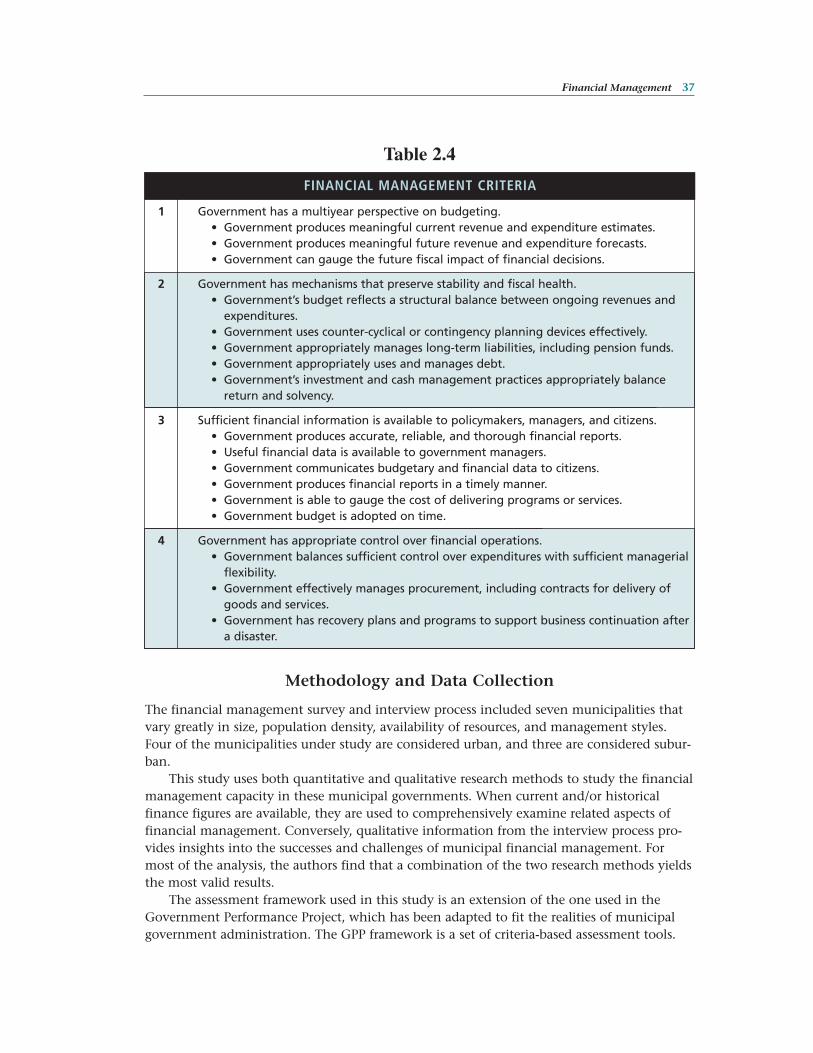
Methodology and Data Collection
The financial management survey and interview process included seven municipalities thatvary greatly in size, population density, availability of resources, and management styles.Four of the municipalities under study are considered urban, and three are considered subur-ban.
This study uses both quantitative and qualitative research methods to study the financialmanagement capacity in these municipal governments. When current and/or historicalfinance figures are available, they are used to comprehensively examine related aspects offinancial management. Conversely, qualitative information from the interview process pro-vides insights into the successes and challenges of municipal financial management. Formost of the analysis, the authors find that a combination of the two research methods yieldsthe most valid results.
The assessment framework used in this study is an extension of the one used in theGovernment Performance Project, which has been adapted to fit the realities of municipalgovernment administration. The GPP framework is a set of criteria-based assessment tools.
Financial Management 37
Table 2.4
FINANCIAL MANAGEMENT CRITERIA
1 Government has a multiyear perspective on budgeting.• Government produces meaningful current revenue and expenditure estimates.• Government produces meaningful future revenue and expenditure forecasts.• Government can gauge the future fiscal impact of financial decisions.
2 Government has mechanisms that preserve stability and fiscal health.• Government’s budget reflects a structural balance between ongoing revenues and
expenditures.• Government uses counter-cyclical or contingency planning devices effectively.• Government appropriately manages long-term liabilities, including pension funds.• Government appropriately uses and manages debt.• Government’s investment and cash management practices appropriately balance
return and solvency.
3 Sufficient financial information is available to policymakers, managers, and citizens.• Government produces accurate, reliable, and thorough financial reports.• Useful financial data is available to government managers.• Government communicates budgetary and financial data to citizens.• Government produces financial reports in a timely manner.• Government is able to gauge the cost of delivering programs or services.• Government budget is adopted on time.
4 Government has appropriate control over financial operations.• Government balances sufficient control over expenditures with sufficient managerial
flexibility.• Government effectively manages procurement, including contracts for delivery of
goods and services.• Government has recovery plans and programs to support business continuation after
a disaster.
38 THE NEW JERSEY INITIATIVE: Building Management Capacity in New Jersey Municipalities
The New Jersey Initiative further serves to test and improve the GPP model with its applica-tion to the municipal level of government.
Data documents used in this study include the audited Annual Financial Statements(AFS), Annual Municipal Budgets (AMB), and Annual Debt Statements (ADS) of the sevenmunicipalities for fiscal years 1996 to 2000. These documents were compared to the munici-palities’ Official Statements (OS) for data verification purposes whenever OS were provided.Five of the seven municipalities provided an entire set of these documents. However, docu-ments from Franklin and Irvington were not complete sets. The Division of LocalGovernment Services (DLGS) of the New Jersey Department of Community Affairs (DCA)provided additional data for the years 1996 to 2000, which enabled the authors to broadentheir view to more New Jersey municipal governments. However, the scope of this study doesnot allow a detailed comparative study. Additionally, since New Jersey has not yet adoptedthe Generally Accepted Accounting Principles (GAAP) for governmental financial reporting,practical standardized comparisons among New Jersey municipal governments and munici-pal governments in other states are not possible.
The analysis of these seven municipalities is based on a 30-page survey that the munici-pal governments received during summer 2001. Five of the seven municipalities completedand returned the surveys. For the two municipalities that did not respond to the surveys,researchers collected information from them through interviews and available documents.
Interviews were conducted with at least one local official in each municipality.Interviewees included, but were not limited to, the chief financial officer, business adminis-trator, purchasing agent, and chief budget officer. The interviews helped clarify some answersprovided in the financial management survey and obtain additional information notaddressed in the survey. Upon completion of the interview process, the authors met with aDLGS official and his aides, who further briefed the researchers on the history, environment,and status quo of New Jersey municipal financial management. The bottom-up interviewmethod (from municipal to state officials) provided the researchers with deeper knowledgethan would have been available otherwise.
Another important source of background/environmental information is the local financelaws stipulated by the state government that establish the parameters of municipal financialmanagement. Relevant laws are addressed in the “New Jersey Laws Governing MunicipalAdministration” section of Chapter 1. All local officials operate within the constraints of thelaws. Therefore, to understand the management of local financial affairs, it is necessary tohave a basic familiarity with this legal structure.
Results: Financial Management in New Jersey Municipalities
The People Factor
In general, the New Jersey municipal governments in this study employ well-qualified, pro-fessional people for their key financial management positions. Among the financialexecutives interviewed, virtually all of the business administrators (BAs), their assistants, chieffinancial officers (CFOs), directors of finance, and controllers are well educated and profes-sionally trained (see Table 2.5). Typically, these public servants hold degrees in accounting,public administration, or business administration and are certified public accountants (CPAs)or certified municipal financial officers (CMFOs), as required by the state’s finance law. Many
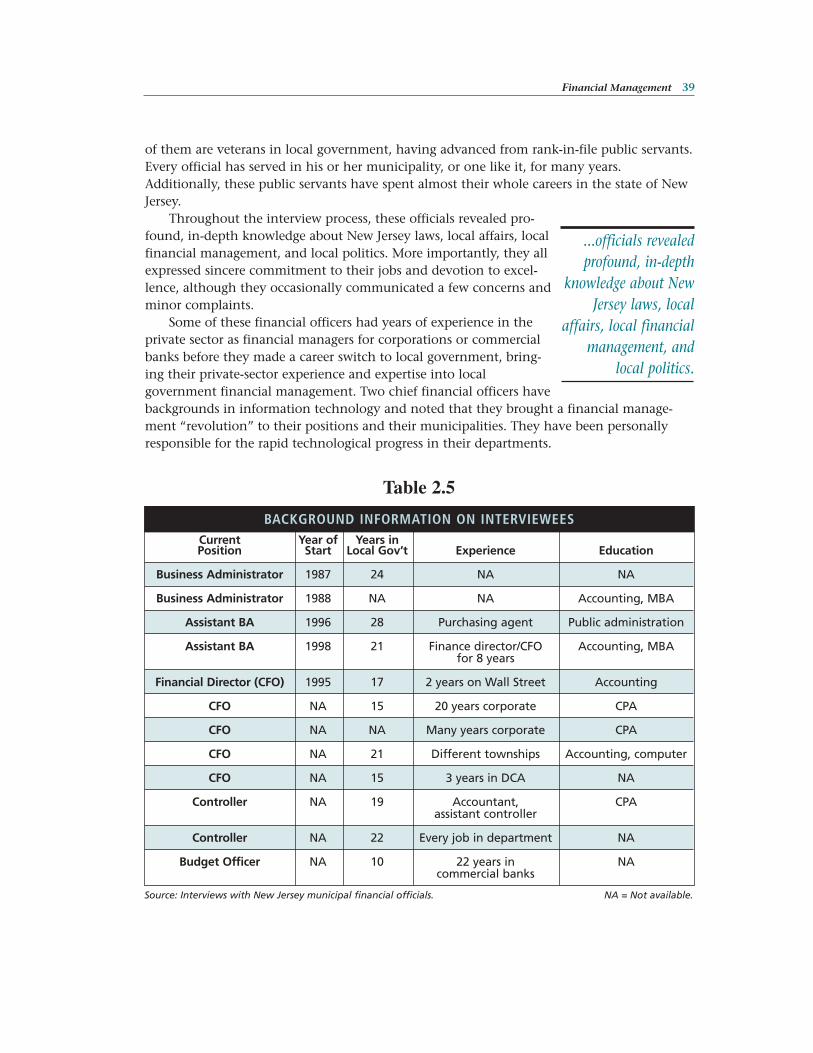
Financial Management 39
of them are veterans in local government, having advanced from rank-in-file public servants.Every official has served in his or her municipality, or one like it, for many years.Additionally, these public servants have spent almost their whole careers in the state of NewJersey.
Throughout the interview process, these officials revealed pro-found, in-depth knowledge about New Jersey laws, local affairs, localfinancial management, and local politics. More importantly, they allexpressed sincere commitment to their jobs and devotion to excel-lence, although they occasionally communicated a few concerns andminor complaints.
Some of these financial officers had years of experience in theprivate sector as financial managers for corporations or commercialbanks before they made a career switch to local government, bring-ing their private-sector experience and expertise into localgovernment financial management. Two chief financial officers havebackgrounds in information technology and noted that they brought a financial manage-ment “revolution” to their positions and their municipalities. They have been personallyresponsible for the rapid technological progress in their departments.
...officials revealed profound, in-depth
knowledge about NewJersey laws, local
affairs, local financialmanagement, and
local politics.
Table 2.5
BACKGROUND INFORMATION ON INTERVIEWEESCurrent Year of Years in Position Start Local Gov’t Experience Education
Business Administrator 1987 24 NA NA
Business Administrator 1988 NA NA Accounting, MBA
Assistant BA 1996 28 Purchasing agent Public administration
Assistant BA 1998 21 Finance director/CFO Accounting, MBAfor 8 years
Financial Director (CFO) 1995 17 2 years on Wall Street Accounting
CFO NA 15 20 years corporate CPA
CFO NA NA Many years corporate CPA
CFO NA 21 Different townships Accounting, computer
CFO NA 15 3 years in DCA NA
Controller NA 19 Accountant, CPAassistant controller
Controller NA 22 Every job in department NA
Budget Officer NA 10 22 years in NAcommercial banks
Source: Interviews with New Jersey municipal financial officials. NA = Not available.
The authors applaud these municipalities for attracting and retaining such an experi-enced and professional staff. Successful local financial management can be partly attributedto the efforts of these qualified and devoted professionals. Although inadequacies and chal-lenges are identified in the following sections, it should be kept in mind that these occurredin the New Jersey municipal management environment – outside the control of any singlemunicipal government. In fact, the high-quality people factor no doubt will help the munic-ipalities solve the challenges they face.
Financial Management Infrastructure
Financial management infrastructure includes institutional arrangements and physical facili-ties. The institutional framework consists of laws and rules, which help restrict the changeand variance the people factor causes. The physical infrastructure refers to the technology inuse. A system that utilizes up-to-date technology will provide state-of-the-art tools for man-agement, whereas inadequate investment in these facilities may actually inhibit soundfinancial management. This infrastructure also comprises the financial reporting and audit-ing systems.
Elaborate local finance laws
The state government of New Jersey maintains a very elaborate system of local finance lawsthat cover almost every detail of municipal financial management. Some of these lawsinclude Local Budget Law (NJSA 40A:4), Local Fiscal Affairs Law (NJSA 40A:5), Local BondsLaw (NJSA 40A:2), and Local Public Contracts Law (NJSA 40A:11). This highly regulatedstate-rule, hands-on system has given rise to some unique characteristics of local financialmanagement. Specifically, the highly regulated nature is clearly manifested in budgetapproval procedures, investment guidelines, and reporting and auditing procedures.
State-controlled municipal budget approval is oriented toward insolvency prevention
The state uses the mechanism of obligatory annual budget approval as an oversight systemto prevent the reoccurrence of insolvency that arose from the Great Depression (see the sec-tion titled “New Jersey Laws Governing Municipal Administration” in Chapter 1).Municipalities receive state aid figures after they finish compiling their budgets. State aidmakes up a fairly large portion of municipal budgets; for example, in fiscal year 2000, accord-ing to the Department of Community Affairs, the average city received 32.95 percent of itstotal general revenue from state and federal aid. However, the exact amount of state discre-tionary aid that municipalities will receive is not announced until long after the fiscal yearbegins. To help offset this delay, municipalities often develop preliminary figures and use atemporary budget in accordance with local finance law. By local budget law, municipal gov-ernments must prepare a budget, submit it to their council for approval/adoption, and seekfinal approval from the state. However, because the figures for state discretionary aid areoften late, most of the municipal financial officers complain that it is senseless to pass abudget only to amend it later. Consequently, the municipal budgeting process has lost muchof its planning function, and revenue and expenditure estimation also becomes much moredifficult.
Local finance laws do not allow the creation of contingency funds at the municipal level;emergency expenditures must be dealt with through emergency appropriations (NJSA 40A:4-
40 THE NEW JERSEY INITIATIVE: Building Management Capacity in New Jersey Municipalities
Financial Management 41
46 seq.). Thus, municipal governments with sound financial management that have accu-mulated surpluses during periods of stability are more adequately prepared to addressunforeseen emergency expenditures, whereas municipalities that are not adequately preparedmust pay for this debt over the course of the next budgetary cycle.
State restrictions on investment, debt, and expenditure increases prevent default
The state does not allow its municipalities to invest for periods exceeding 13 months. Short-term investment (cash management) is restricted to the most reliable instruments, such ascertificates of deposit and federally guaranteed obligations. Net debt level is limited to 3.5percent of three-year average equalized valuation. Some local officials call these “soundguidelines to follow,” but a few others claim they are “too restrictive…binding the hands ofmanagers.”
The 5 percent cap on annual appropriations increases by the 1990 Local GovernmentCap Law restricts local officials’ ability to meet the service demands of new residents in rap-idly expanding communities (usually in more wealthy suburban areas). Although the taxbase and revenue sources are readily available, municipal governments are prevented fromspending beyond the fixed cap.
However, local officials have found ways to circumvent such limits, for example,through the use of lease rental agreements and pooled bonds. State officials are also awarethat such “flexibilities” exist.
State provision for annual reporting and auditing ensures compliance
The Division of Local Government Services requires each municipality to compile annualfinancial statements and conduct annual audits. This measure ensures compliance with statestandards of municipal financial and capital management and enhances a municipality’sability to prevent and identify fraud and scandals.
Technology infrastructure
The use of technology in financial management varies greatly among the municipalities.This imbalance has little correlation with the municipalities’ fiscal conditions, but insteadrelates to the personal background or orientation of their chief financial officers and businessadministrators. A fiscally distressed city may improve its use of information technologybecause its finance director has attended to shortcomings in this area, while a fairly wealthymunicipality may overlook the use of technology in financial management. In comparisonto its detailed finance laws, the state has not done enough to promote computerization inlocal financial management, even though continuing education in information technologyis part of the required Certified Municipal Finance Officers program.
The above examples illustrate the environment in which municipal financial manage-ment operates. The successes, of which financial reporting and auditing are examples, partlydraw from the overall framework stipulated by the state government. Conversely, the munic-ipalities cannot be held entirely accountable for their shortcomings. Indeed, municipalitiesshould have faired much better in some areas, for example, with the application of informa-tion technology. There are also areas where local governments possess little room fordiscretion and innovation. For example, local officials can do little to improve the budgetprocess without revising the state finance law.
42 THE NEW JERSEY INITIATIVE: Building Management Capacity in New Jersey Municipalities
Financial Management Assessment According to Criteria
This section presents an assessment of financial management in the municipalities accordingto the criteria and sub-criteria listed in Table 2.4.
Criterion 1: Multiyear perspective on budgeting
Academic literature and professional organizations have widely advocated that public budg-eting should extend beyond the current fiscal year or the current budget cycle to covermultiple years (for example, see GFOA, 2000; and Forsythe, 1993). The enhanced vision frommultiyear budgeting may bring more stability and smoothness into financial operations, andthus into the provision of local public services. This criterion is now widely accepted at thestate level (see NACSLB, 1998; GFOA, 1999). The Government Finance Officer Association(GFOA) also strongly recommends this as a best practice. For example the statute of the stateof Washington explicitly endorses multiple-year budgeting: “The current budgetary system ofWashington lacks stability. It encourages crisis budgeting and results in cutbacks during leanyears and overspending during surplus years” (Revised Code of Washington, Title 43, Ch.43.135.045). The multiyear perspective works best within a supportive legal and administra-tive environment and in accordance with the local fiscal tradition. New Jersey local financelaws provide specific stipulations on current estimation and future forecasts of revenues andexpenditures. The four most significant are:
• Revenue and expenditure estimations are on a cash basis. (NJLBL 40A-4-2)
• Estimation of miscellaneous revenues is capped at the amount actually realized in cashfrom the same source in the preceding fiscal year. (NJLBL 40A:4-26)
• Such limitations, percentages, and estimates provide that there will be sufficient cash col-lected to meet all debt service requirements and necessary operations of the local unitand to make any mandatory payments during the fiscal year. (NJLBL 40A-4-2)
• Expenditure increases are limited to 5 percent or the index rate, whichever is less, overthe previous year’s final appropriations. (NJLBL 40:68A-43)
Against this background, municipalities conduct estimation and forecasting in varyingmanners.
Current revenue and expenditure estimates
In all five municipalities that responded to the survey, the business administrator, chieffinancial officer, and finance department analysts make revenue and expenditure estima-tions. Only cities, not townships, resort to a consensus process with their council. Theestimation methods they use are fairly simple, as opposed to the complicated models that areoften seen at higher levels of government. One city and one township use the zero-basedbudgeting method. Two other cities rely on rough estimates (based on recent history andpersonal expertise). Revenue estimates serve as a cap to spending in two cities and one town-ship. In these municipalities, the estimates are updated either monthly or quarterly. Onemunicipality updates bi-weekly or as information is available. These updates, however, arenot usually formally adopted.
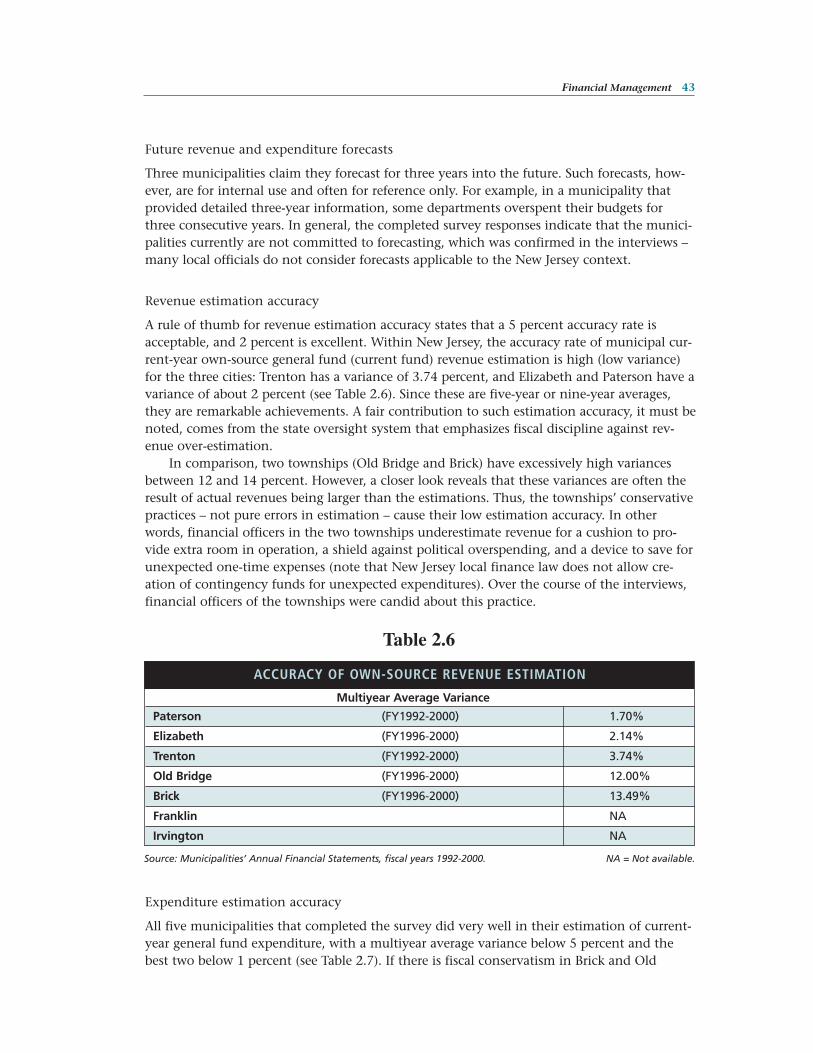
Future revenue and expenditure forecasts
Three municipalities claim they forecast for three years into the future. Such forecasts, how-ever, are for internal use and often for reference only. For example, in a municipality thatprovided detailed three-year information, some departments overspent their budgets forthree consecutive years. In general, the completed survey responses indicate that the munici-palities currently are not committed to forecasting, which was confirmed in the interviews –many local officials do not consider forecasts applicable to the New Jersey context.
Revenue estimation accuracy
A rule of thumb for revenue estimation accuracy states that a 5 percent accuracy rate isacceptable, and 2 percent is excellent. Within New Jersey, the accuracy rate of municipal cur-rent-year own-source general fund (current fund) revenue estimation is high (low variance)for the three cities: Trenton has a variance of 3.74 percent, and Elizabeth and Paterson have avariance of about 2 percent (see Table 2.6). Since these are five-year or nine-year averages,they are remarkable achievements. A fair contribution to such estimation accuracy, it must benoted, comes from the state oversight system that emphasizes fiscal discipline against rev-enue over-estimation.
In comparison, two townships (Old Bridge and Brick) have excessively high variancesbetween 12 and 14 percent. However, a closer look reveals that these variances are often theresult of actual revenues being larger than the estimations. Thus, the townships’ conservativepractices – not pure errors in estimation – cause their low estimation accuracy. In otherwords, financial officers in the two townships underestimate revenue for a cushion to pro-vide extra room in operation, a shield against political overspending, and a device to save forunexpected one-time expenses (note that New Jersey local finance law does not allow cre-ation of contingency funds for unexpected expenditures). Over the course of the interviews,financial officers of the townships were candid about this practice.
Expenditure estimation accuracy
All five municipalities that completed the survey did very well in their estimation of current-year general fund expenditure, with a multiyear average variance below 5 percent and thebest two below 1 percent (see Table 2.7). If there is fiscal conservatism in Brick and Old
ACCURACY OF OWN-SOURCE REVENUE ESTIMATION
Multiyear Average Variance
Paterson (FY1992-2000) 1.70%
Elizabeth (FY1996-2000) 2.14%
Trenton (FY1992-2000) 3.74%
Old Bridge (FY1996-2000) 12.00%
Brick (FY1996-2000) 13.49%
Franklin NA
Irvington NA
Financial Management 43
Source: Municipalities’ Annual Financial Statements, fiscal years 1992-2000. NA = Not available.
Table 2.6
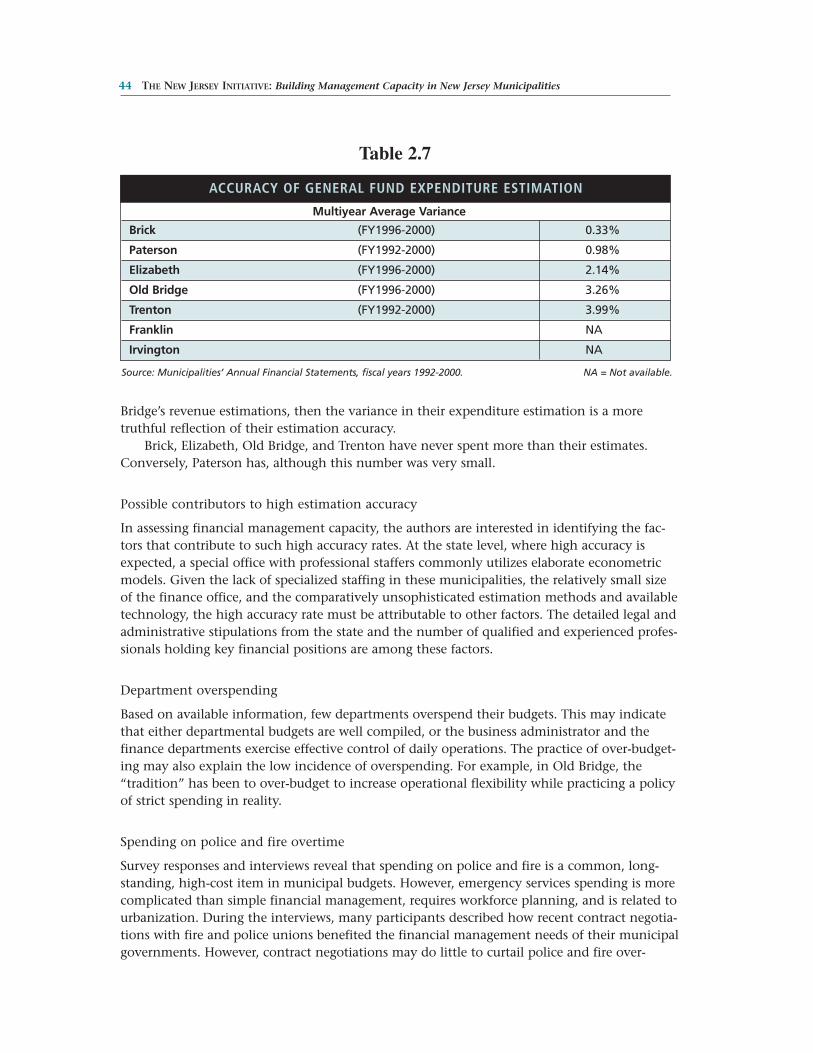
44 THE NEW JERSEY INITIATIVE: Building Management Capacity in New Jersey Municipalities
Bridge’s revenue estimations, then the variance in their expenditure estimation is a moretruthful reflection of their estimation accuracy.
Brick, Elizabeth, Old Bridge, and Trenton have never spent more than their estimates.Conversely, Paterson has, although this number was very small.
Possible contributors to high estimation accuracy
In assessing financial management capacity, the authors are interested in identifying the fac-tors that contribute to such high accuracy rates. At the state level, where high accuracy isexpected, a special office with professional staffers commonly utilizes elaborate econometricmodels. Given the lack of specialized staffing in these municipalities, the relatively small sizeof the finance office, and the comparatively unsophisticated estimation methods and availabletechnology, the high accuracy rate must be attributable to other factors. The detailed legal andadministrative stipulations from the state and the number of qualified and experienced profes-sionals holding key financial positions are among these factors.
Department overspending
Based on available information, few departments overspend their budgets. This may indicatethat either departmental budgets are well compiled, or the business administrator and thefinance departments exercise effective control of daily operations. The practice of over-budget-ing may also explain the low incidence of overspending. For example, in Old Bridge, the“tradition” has been to over-budget to increase operational flexibility while practicing a policyof strict spending in reality.
Spending on police and fire overtime
Survey responses and interviews reveal that spending on police and fire is a common, long-standing, high-cost item in municipal budgets. However, emergency services spending is morecomplicated than simple financial management, requires workforce planning, and is related tourbanization. During the interviews, many participants described how recent contract negotia-tions with fire and police unions benefited the financial management needs of their municipalgovernments. However, contract negotiations may do little to curtail police and fire over-
ACCURACY OF GENERAL FUND EXPENDITURE ESTIMATION
Multiyear Average Variance
Brick (FY1996-2000) 0.33%
Paterson (FY1992-2000) 0.98%
Elizabeth (FY1996-2000) 2.14%
Old Bridge (FY1996-2000) 3.26%
Trenton (FY1992-2000) 3.99%
Franklin NA
Irvington NA
Source: Municipalities’ Annual Financial Statements, fiscal years 1992-2000. NA = Not available.
Table 2.7
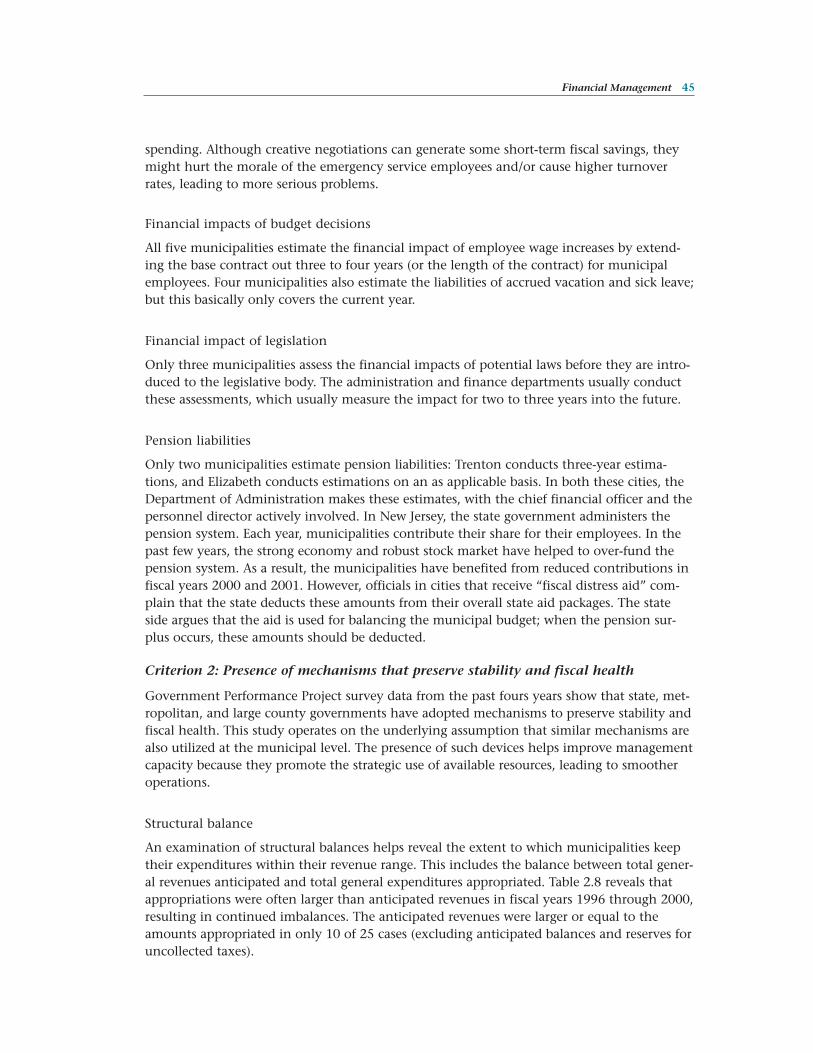
Financial Management 45
spending. Although creative negotiations can generate some short-term fiscal savings, theymight hurt the morale of the emergency service employees and/or cause higher turnoverrates, leading to more serious problems.
Financial impacts of budget decisions
All five municipalities estimate the financial impact of employee wage increases by extend-ing the base contract out three to four years (or the length of the contract) for municipalemployees. Four municipalities also estimate the liabilities of accrued vacation and sick leave;but this basically only covers the current year.
Financial impact of legislation
Only three municipalities assess the financial impacts of potential laws before they are intro-duced to the legislative body. The administration and finance departments usually conductthese assessments, which usually measure the impact for two to three years into the future.
Pension liabilities
Only two municipalities estimate pension liabilities: Trenton conducts three-year estima-tions, and Elizabeth conducts estimations on an as applicable basis. In both these cities, theDepartment of Administration makes these estimates, with the chief financial officer and thepersonnel director actively involved. In New Jersey, the state government administers thepension system. Each year, municipalities contribute their share for their employees. In thepast few years, the strong economy and robust stock market have helped to over-fund thepension system. As a result, the municipalities have benefited from reduced contributions infiscal years 2000 and 2001. However, officials in cities that receive “fiscal distress aid” com-plain that the state deducts these amounts from their overall state aid packages. The stateside argues that the aid is used for balancing the municipal budget; when the pension sur-plus occurs, these amounts should be deducted.
Criterion 2: Presence of mechanisms that preserve stability and fiscal health
Government Performance Project survey data from the past fours years show that state, met-ropolitan, and large county governments have adopted mechanisms to preserve stability andfiscal health. This study operates on the underlying assumption that similar mechanisms arealso utilized at the municipal level. The presence of such devices helps improve managementcapacity because they promote the strategic use of available resources, leading to smootheroperations.
Structural balance
An examination of structural balances helps reveal the extent to which municipalities keeptheir expenditures within their revenue range. This includes the balance between total gener-al revenues anticipated and total general expenditures appropriated. Table 2.8 reveals thatappropriations were often larger than anticipated revenues in fiscal years 1996 through 2000,resulting in continued imbalances. The anticipated revenues were larger or equal to theamounts appropriated in only 10 of 25 cases (excluding anticipated balances and reserves foruncollected taxes).
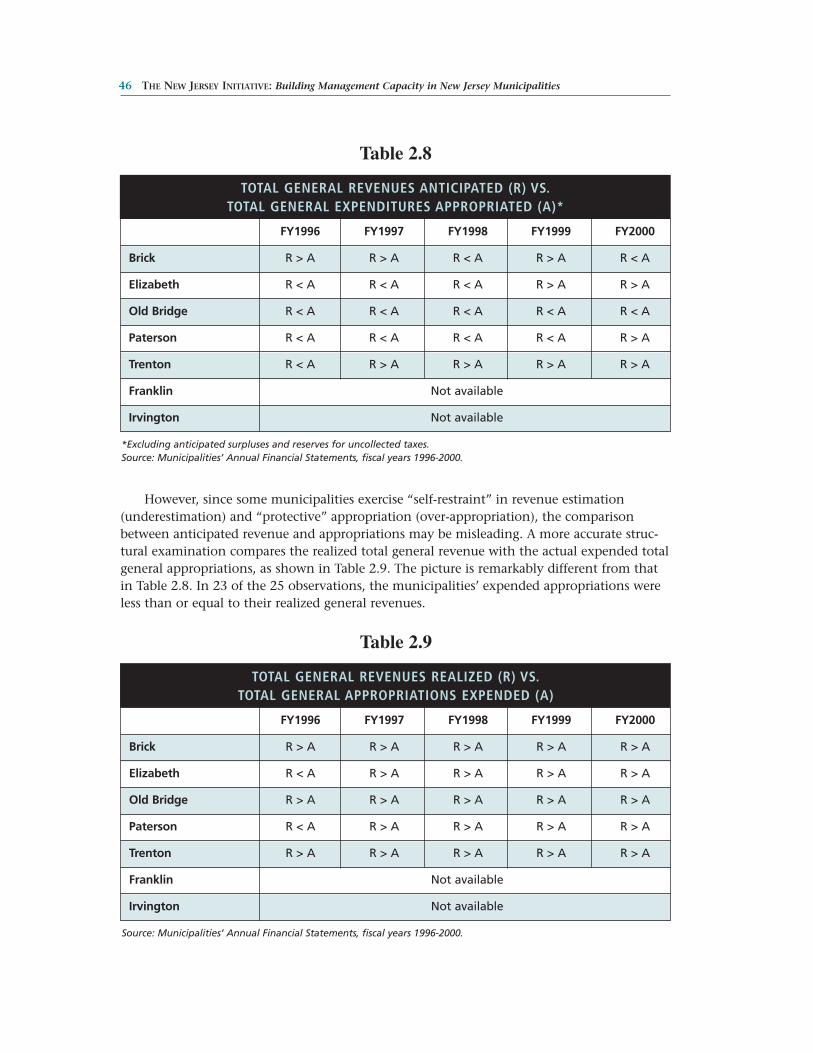
However, since some municipalities exercise “self-restraint” in revenue estimation(underestimation) and “protective” appropriation (over-appropriation), the comparisonbetween anticipated revenue and appropriations may be misleading. A more accurate struc-tural examination compares the realized total general revenue with the actual expended totalgeneral appropriations, as shown in Table 2.9. The picture is remarkably different from thatin Table 2.8. In 23 of the 25 observations, the municipalities’ expended appropriations wereless than or equal to their realized general revenues.
46 THE NEW JERSEY INITIATIVE: Building Management Capacity in New Jersey Municipalities
*Excluding anticipated surpluses and reserves for uncollected taxes.Source: Municipalities’ Annual Financial Statements, fiscal years 1996-2000.
Table 2.8
TOTAL GENERAL REVENUES ANTICIPATED (R) VS.TOTAL GENERAL EXPENDITURES APPROPRIATED (A)*
FY1996 FY1997 FY1998 FY1999 FY2000
Brick R > A R > A R < A R > A R < A
Elizabeth R < A R < A R < A R > A R > A
Old Bridge R < A R < A R < A R < A R < A
Paterson R < A R < A R < A R < A R > A
Trenton R < A R > A R > A R > A R > A
Franklin Not available
Irvington Not available
Source: Municipalities’ Annual Financial Statements, fiscal years 1996-2000.
Table 2.9
TOTAL GENERAL REVENUES REALIZED (R) VS.TOTAL GENERAL APPROPRIATIONS EXPENDED (A)
FY1996 FY1997 FY1998 FY1999 FY2000
Brick R > A R > A R > A R > A R > A
Elizabeth R < A R > A R > A R > A R > A
Old Bridge R > A R > A R > A R > A R > A
Paterson R < A R > A R > A R > A R > A
Trenton R > A R > A R > A R > A R > A
Franklin Not available
Irvington Not available
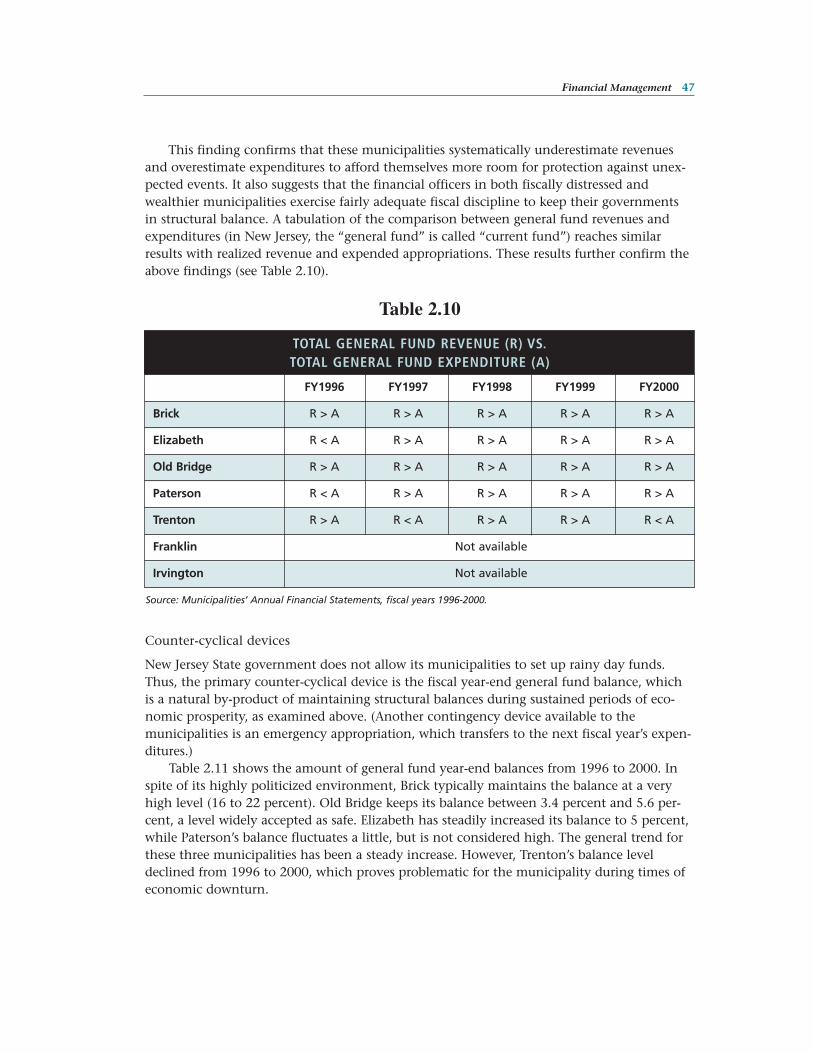
Financial Management 47
This finding confirms that these municipalities systematically underestimate revenuesand overestimate expenditures to afford themselves more room for protection against unex-pected events. It also suggests that the financial officers in both fiscally distressed andwealthier municipalities exercise fairly adequate fiscal discipline to keep their governmentsin structural balance. A tabulation of the comparison between general fund revenues andexpenditures (in New Jersey, the “general fund” is called “current fund”) reaches similarresults with realized revenue and expended appropriations. These results further confirm theabove findings (see Table 2.10).
Counter-cyclical devices
New Jersey State government does not allow its municipalities to set up rainy day funds.Thus, the primary counter-cyclical device is the fiscal year-end general fund balance, whichis a natural by-product of maintaining structural balances during sustained periods of eco-nomic prosperity, as examined above. (Another contingency device available to themunicipalities is an emergency appropriation, which transfers to the next fiscal year’s expen-ditures.)
Table 2.11 shows the amount of general fund year-end balances from 1996 to 2000. Inspite of its highly politicized environment, Brick typically maintains the balance at a veryhigh level (16 to 22 percent). Old Bridge keeps its balance between 3.4 percent and 5.6 per-cent, a level widely accepted as safe. Elizabeth has steadily increased its balance to 5 percent,while Paterson’s balance fluctuates a little, but is not considered high. The general trend forthese three municipalities has been a steady increase. However, Trenton’s balance leveldeclined from 1996 to 2000, which proves problematic for the municipality during times ofeconomic downturn.
Source: Municipalities’ Annual Financial Statements, fiscal years 1996-2000.
Table 2.10
TOTAL GENERAL FUND REVENUE (R) VS.TOTAL GENERAL FUND EXPENDITURE (A)
FY1996 FY1997 FY1998 FY1999 FY2000
Brick R > A R > A R > A R > A R > A
Elizabeth R < A R > A R > A R > A R > A
Old Bridge R > A R > A R > A R > A R > A
Paterson R < A R > A R > A R > A R > A
Trenton R > A R < A R > A R > A R < A
Franklin Not available
Irvington Not available
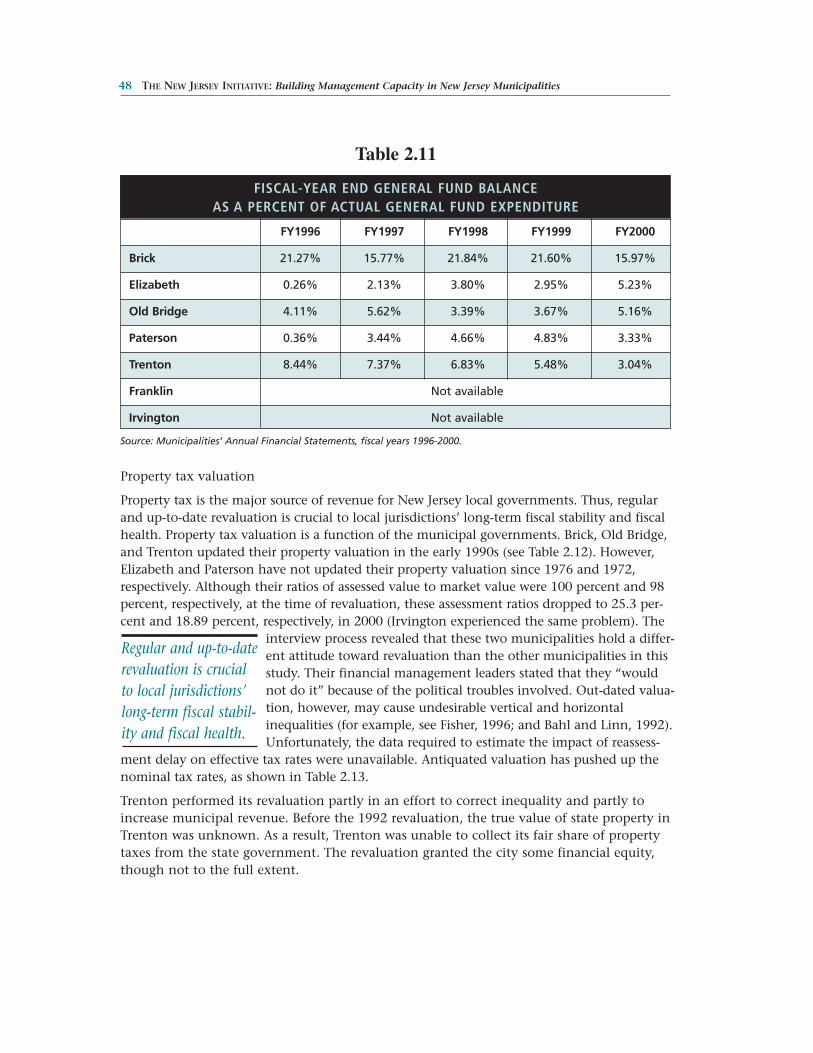
Source: Municipalities’ Annual Financial Statements, fiscal years 1996-2000.
Table 2.11
48 THE NEW JERSEY INITIATIVE: Building Management Capacity in New Jersey Municipalities
Property tax valuation
Property tax is the major source of revenue for New Jersey local governments. Thus, regularand up-to-date revaluation is crucial to local jurisdictions’ long-term fiscal stability and fiscalhealth. Property tax valuation is a function of the municipal governments. Brick, Old Bridge,and Trenton updated their property valuation in the early 1990s (see Table 2.12). However,Elizabeth and Paterson have not updated their property valuation since 1976 and 1972,respectively. Although their ratios of assessed value to market value were 100 percent and 98percent, respectively, at the time of revaluation, these assessment ratios dropped to 25.3 per-cent and 18.89 percent, respectively, in 2000 (Irvington experienced the same problem). The
interview process revealed that these two municipalities hold a differ-ent attitude toward revaluation than the other municipalities in thisstudy. Their financial management leaders stated that they “wouldnot do it” because of the political troubles involved. Out-dated valua-tion, however, may cause undesirable vertical and horizontalinequalities (for example, see Fisher, 1996; and Bahl and Linn, 1992).Unfortunately, the data required to estimate the impact of reassess-
ment delay on effective tax rates were unavailable. Antiquated valuation has pushed up thenominal tax rates, as shown in Table 2.13.
Trenton performed its revaluation partly in an effort to correct inequality and partly toincrease municipal revenue. Before the 1992 revaluation, the true value of state property inTrenton was unknown. As a result, Trenton was unable to collect its fair share of propertytaxes from the state government. The revaluation granted the city some financial equity,though not to the full extent.
Regular and up-to-daterevaluation is crucialto local jurisdictions’long-term fiscal stabil-ity and fiscal health.
FISCAL-YEAR END GENERAL FUND BALANCE AS A PERCENT OF ACTUAL GENERAL FUND EXPENDITURE
FY1996 FY1997 FY1998 FY1999 FY2000
Brick 21.27% 15.77% 21.84% 21.60% 15.97%
Elizabeth 0.26% 2.13% 3.80% 2.95% 5.23%
Old Bridge 4.11% 5.62% 3.39% 3.67% 5.16%
Paterson 0.36% 3.44% 4.66% 4.83% 3.33%
Trenton 8.44% 7.37% 6.83% 5.48% 3.04%
Franklin Not available
Irvington Not available
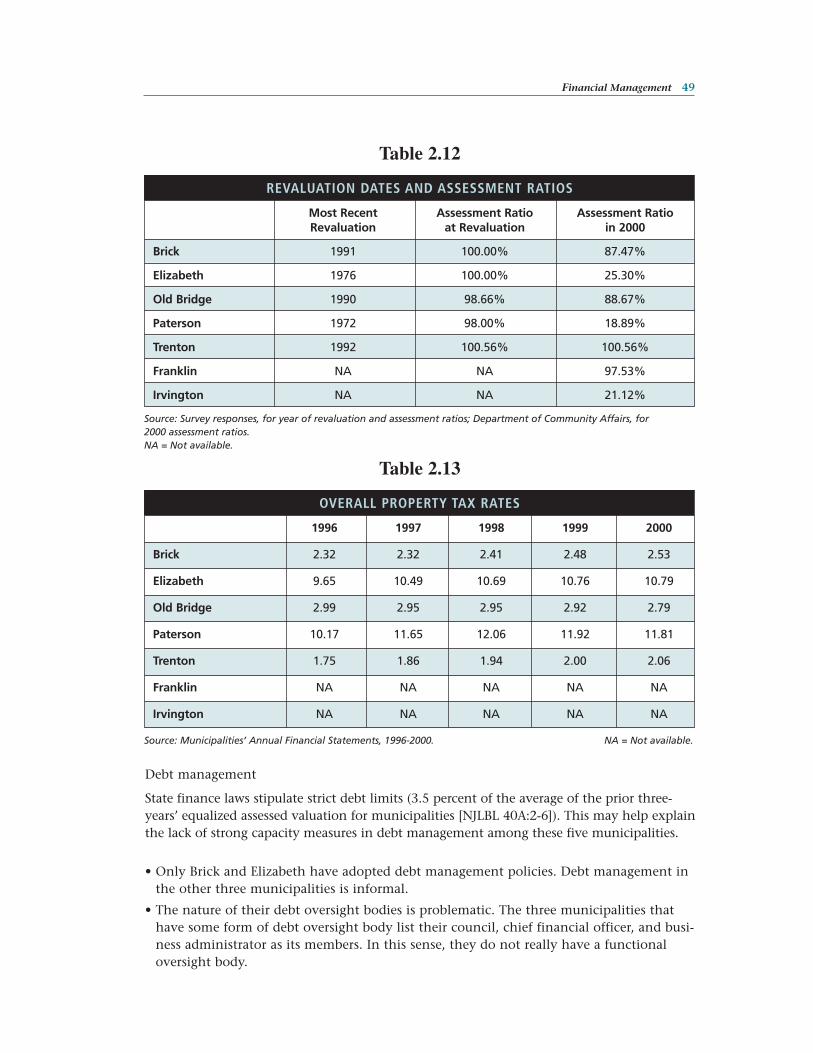
Table 2.12
REVALUATION DATES AND ASSESSMENT RATIOS
Most Recent Assessment Ratio Assessment RatioRevaluation at Revaluation in 2000
Brick 1991 100.00% 87.47%
Elizabeth 1976 100.00% 25.30%
Old Bridge 1990 98.66% 88.67%
Paterson 1972 98.00% 18.89%
Trenton 1992 100.56% 100.56%
Franklin NA NA 97.53%
Irvington NA NA 21.12%
Financial Management 49
Debt management
State finance laws stipulate strict debt limits (3.5 percent of the average of the prior three-years’ equalized assessed valuation for municipalities [NJLBL 40A:2-6]). This may help explainthe lack of strong capacity measures in debt management among these five municipalities.
• Only Brick and Elizabeth have adopted debt management policies. Debt management inthe other three municipalities is informal.
• The nature of their debt oversight bodies is problematic. The three municipalities thathave some form of debt oversight body list their council, chief financial officer, and busi-ness administrator as its members. In this sense, they do not really have a functionaloversight body.
Source: Survey responses, for year of revaluation and assessment ratios; Department of Community Affairs, for2000 assessment ratios.NA = Not available.
Table 2.13
Source: Municipalities’ Annual Financial Statements, 1996-2000. NA = Not available.
OVERALL PROPERTY TAX RATES
1996 1997 1998 1999 2000
Brick 2.32 2.32 2.41 2.48 2.53
Elizabeth 9.65 10.49 10.69 10.76 10.79
Old Bridge 2.99 2.95 2.95 2.92 2.79
Paterson 10.17 11.65 12.06 11.92 11.81
Trenton 1.75 1.86 1.94 2.00 2.06
Franklin NA NA NA NA NA
Irvington NA NA NA NA NA
50 THE NEW JERSEY INITIATIVE: Building Management Capacity in New Jersey Municipalities
• The municipal governments have not adopted a debt capacity model; instead, they rely ona capital investment plan. Only one municipal government mentions a debt affordabilityguideline – 10 percent of its budget as debt service.
On the positive side:
• Sale of debt is competitive whenever necessary and possible.
• All five municipalities hire financial advisors, mostly appointed by the council.
• Municipal governments have minimal exposure to third-party credit providers, besidesinsurers.
Cash management
Local finance laws impose specific stipulations. While some of the provisions are effectively inforce, others are not. For example, the law stipulates that each local unit should adopt a cashmanagement plan and deposit and/or invest its funds pursuant to that plan (NJLFAL 40A:5-14). Municipal governments pool cash for investments with inter-funds or sweep accounts, butnot every municipal government has adopted a cash management plan.
Under New Jersey law, municipal governments may invest only in liquid financial instru-ments that mature in one year or less. These instruments may include, but are not limited to,certificates of deposit, federally guaranteed obligations, and New Jersey cash managementfunds. Some municipal officials who were interviewed said this law’s specificity is a constraint.
The finance law requires municipalities to use competitive pricing or multi-quotes to getthe highest return. However, no formal oversight body exists to monitor short-term invest-ment in any of the five municipalities. Perhaps this results from the context of the New Jerseyfinancial environment, which regards cash management more as part of daily operations thanas a means to short-term investment earnings. The lack of reporting requirements in thesemunicipal governments’ investment policies also suggests this. Only Elizabeth and Old Bridgerequire regular (monthly) reporting of cash management performance.
Criterion 3: Availability of sufficient financial information to policymakers, managers, and citizens
It is critical for government entities to make available sufficient and reliable information in atimely manner. For policymakers, this is the very basis of formulating the right policy on theright issue at the right time. It allows managers to implement policies, handle managerialissues in the proper manner, and control costs within a reasonable range. Although access toadequate and sufficient information does not guarantee appropriate policy design or effectivemanagement, lack of pertinent information can undermine such desirable practices.
The ability to collect and disseminate sufficient and reliable information requires a physi-cal management infrastructure – investment in and employment of information technology.Research suggests that using technology can substantially improve the speed and quality ofmanagement information production (Heintze and Bretschneider, 2000, 801).
The connection between information flow and financial management is particularly cru-cial in three areas: (1) financial reporting, as a proxy for providing information topolicymakers; (2) availability of financial information to managers on an as-needed basis toboost managerial efficiency; and (3) timely budget adoption as a proxy for good financial plan-ning. The remainder of this section discusses these three areas in the five New Jerseymunicipalities.
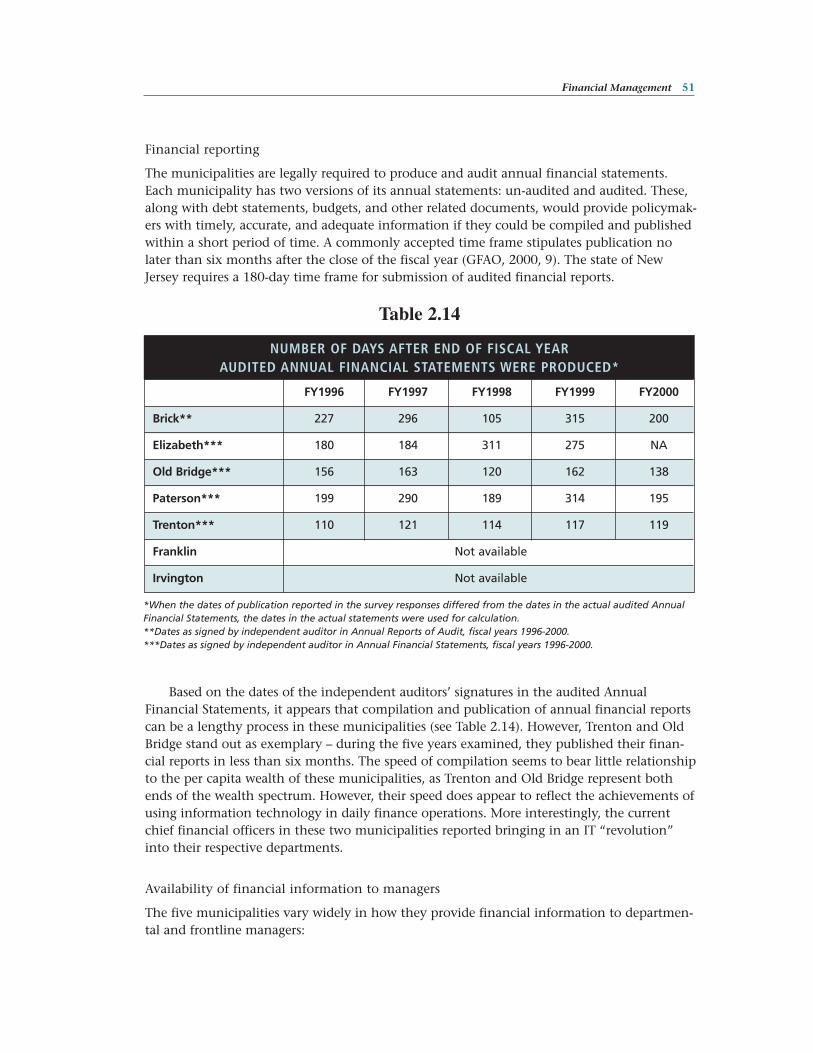
Financial Management 51
Financial reporting
The municipalities are legally required to produce and audit annual financial statements.Each municipality has two versions of its annual statements: un-audited and audited. These,along with debt statements, budgets, and other related documents, would provide policymak-ers with timely, accurate, and adequate information if they could be compiled and publishedwithin a short period of time. A commonly accepted time frame stipulates publication nolater than six months after the close of the fiscal year (GFAO, 2000, 9). The state of NewJersey requires a 180-day time frame for submission of audited financial reports.
Based on the dates of the independent auditors’ signatures in the audited AnnualFinancial Statements, it appears that compilation and publication of annual financial reportscan be a lengthy process in these municipalities (see Table 2.14). However, Trenton and OldBridge stand out as exemplary – during the five years examined, they published their finan-cial reports in less than six months. The speed of compilation seems to bear little relationshipto the per capita wealth of these municipalities, as Trenton and Old Bridge represent bothends of the wealth spectrum. However, their speed does appear to reflect the achievements ofusing information technology in daily finance operations. More interestingly, the currentchief financial officers in these two municipalities reported bringing in an IT “revolution”into their respective departments.
Availability of financial information to managers
The five municipalities vary widely in how they provide financial information to departmen-tal and frontline managers:
*When the dates of publication reported in the survey responses differed from the dates in the actual audited AnnualFinancial Statements, the dates in the actual statements were used for calculation.**Dates as signed by independent auditor in Annual Reports of Audit, fiscal years 1996-2000. ***Dates as signed by independent auditor in Annual Financial Statements, fiscal years 1996-2000.
Table 2.14
NUMBER OF DAYS AFTER END OF FISCAL YEARAUDITED ANNUAL FINANCIAL STATEMENTS WERE PRODUCED*
FY1996 FY1997 FY1998 FY1999 FY2000
Brick** 227 296 105 315 200
Elizabeth*** 180 184 311 275 NA
Old Bridge*** 156 163 120 162 138
Paterson*** 199 290 189 314 195
Trenton*** 110 121 114 117 119
Franklin Not available
Irvington Not available
52 THE NEW JERSEY INITIATIVE: Building Management Capacity in New Jersey Municipalities
• Building technological networks (intranets) requires substantial resources and has beenpossible in the wealthier municipalities. Two municipalities (Brick and Old Bridge) givemanagers access to online financial information. Old Bridge has the capability of provid-ing managers with online financial reports in real time, through its intranet. Theremaining three municipalities have not been able to provide this function.
• Placing financial documents online has been increasingly popular at higher levels of gov-ernment. Currently, none of these five municipalities utilize this capability.
• All five municipalities provide their managers with financial documents upon request.One township sends such documents to each department head.
Providing financial information to managers is not just a technical issue, nor does itdepend on the municipal government’s ability to afford the physical structure. It may also bedeeply rooted in the municipal government’s management philosophy or style. During aninterview, one business administrator bluntly stated that his municipality does not give man-agers such information, and to explain why, used the police department as an example: “Ifwe tell him they have so much money allocated to their department, they will spend itimmediately.”
Cost accounting is a very practical tool for providing managers with efficiency and per-formance measures. However, its implementation is resource intensive and requiresspecialized technical training for the users. Cost accounting has not been used widely orextensively in these five municipalities.
• Activity-based accounting: Three of the five municipal governments do not use it at all;one uses it periodically; another uses it only occasionally.
• Unit costs calculation: Three of the five municipalities do not use it at all.
• Allocation of indirect costs: Brick and Trenton use it to some extent; the other three donot.
• Purpose of cost analysis: Brick is a model, using it for many purposes; Trenton uses it forbudget preparation.
Timely budget adoption
Budgets can serve as a master plan for the coming fiscal year, as guidelines in policy imple-mentation, and as a visible tool for oversight and assessment. These three functions arepossible when the budget is compiled and adopted in a favorable fashion that allows admin-istrators to take full advantage of it. One of the preconditions is timely adoption. However,the interview process and survey results suggest that adopting the budget in a timely fashionmay not be a priority in New Jersey municipal financial management.
Budget delay
New Jersey municipalities can use one of two fiscal years – the calendar fiscal year that runsfrom January 1 to December 31, or the state fiscal year that runs from July 1 to June 30. BrickTownship operates under the calendar fiscal year, while the other four municipal govern-ments operate under the state fiscal year.
The introduction and adoption of municipal budgets follow a timetable that starts after
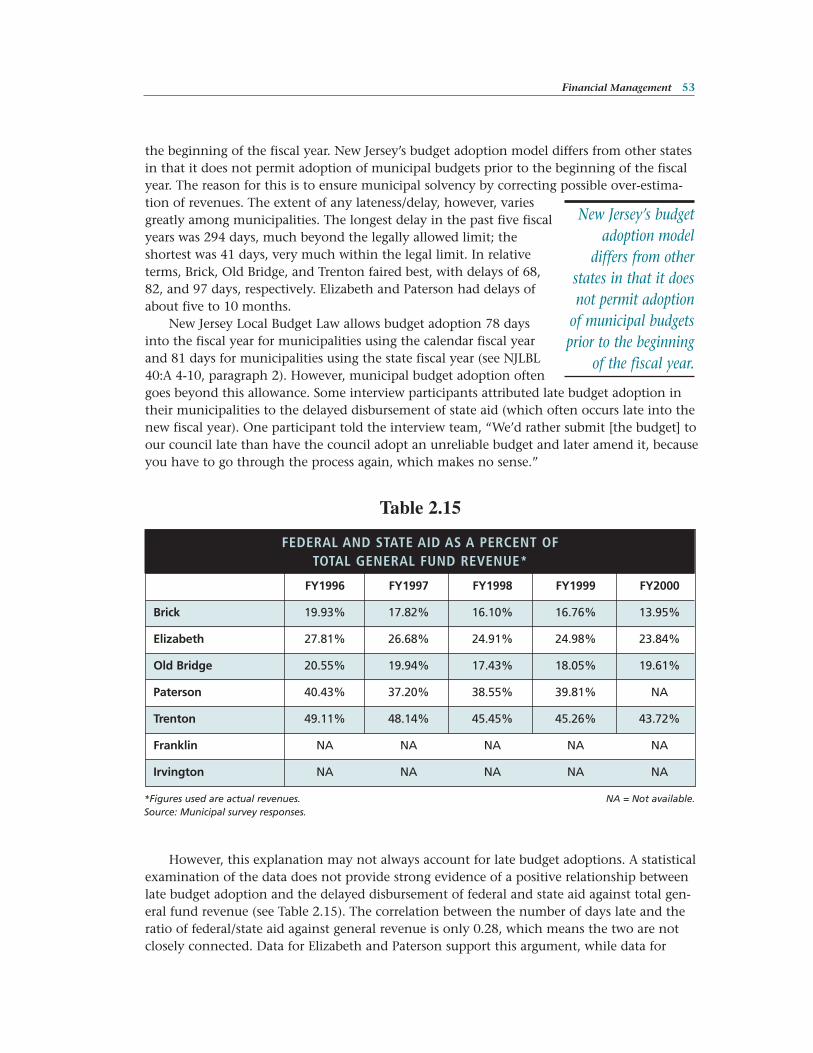
Financial Management 53
the beginning of the fiscal year. New Jersey’s budget adoption model differs from other statesin that it does not permit adoption of municipal budgets prior to the beginning of the fiscalyear. The reason for this is to ensure municipal solvency by correcting possible over-estima-tion of revenues. The extent of any lateness/delay, however, variesgreatly among municipalities. The longest delay in the past five fiscalyears was 294 days, much beyond the legally allowed limit; theshortest was 41 days, very much within the legal limit. In relativeterms, Brick, Old Bridge, and Trenton faired best, with delays of 68,82, and 97 days, respectively. Elizabeth and Paterson had delays ofabout five to 10 months.
New Jersey Local Budget Law allows budget adoption 78 daysinto the fiscal year for municipalities using the calendar fiscal yearand 81 days for municipalities using the state fiscal year (see NJLBL40:A 4-10, paragraph 2). However, municipal budget adoption oftengoes beyond this allowance. Some interview participants attributed late budget adoption intheir municipalities to the delayed disbursement of state aid (which often occurs late into thenew fiscal year). One participant told the interview team, “We’d rather submit [the budget] toour council late than have the council adopt an unreliable budget and later amend it, becauseyou have to go through the process again, which makes no sense.”
However, this explanation may not always account for late budget adoptions. A statisticalexamination of the data does not provide strong evidence of a positive relationship betweenlate budget adoption and the delayed disbursement of federal and state aid against total gen-eral fund revenue (see Table 2.15). The correlation between the number of days late and theratio of federal/state aid against general revenue is only 0.28, which means the two are notclosely connected. Data for Elizabeth and Paterson support this argument, while data for
New Jersey’s budgetadoption model
differs from otherstates in that it doesnot permit adoption
of municipal budgetsprior to the beginning
of the fiscal year.
*Figures used are actual revenues. NA = Not available. Source: Municipal survey responses.
Table 2.15
FEDERAL AND STATE AID AS A PERCENT OF TOTAL GENERAL FUND REVENUE*
FY1996 FY1997 FY1998 FY1999 FY2000
Brick 19.93% 17.82% 16.10% 16.76% 13.95%
Elizabeth 27.81% 26.68% 24.91% 24.98% 23.84%
Old Bridge 20.55% 19.94% 17.43% 18.05% 19.61%
Paterson 40.43% 37.20% 38.55% 39.81% NA
Trenton 49.11% 48.14% 45.45% 45.26% 43.72%
Franklin NA NA NA NA NA
Irvington NA NA NA NA NA
54 THE NEW JERSEY INITIATIVE: Building Management Capacity in New Jersey Municipalities
Trenton do not. Therefore, it is reasonable to assume that some other unknown factors con-tribute to the late adoption of municipal budgets. One factor may be the date discretionarystate aids are announced, for those municipalities that depend on such aids.
Criterion 4: Appropriate control over financial operations and managerial flexibility
Appropriate checks and controls are key components to public financial management. Sincegovernment entities are entrusted with tax dollars, they cannot be too cautious. However,checks and controls are not enough to improve management capacity and operational effi-ciency. Managers must be allowed to exercise an appropriate degree of managerial flexibility.
Survey responses indicate that all five municipalities exercise tight control over financialoperations, as required by New Jersey local finance law. For example, any budgetary line itemtransfer requires a two-thirds vote of the governing body. Surprise cash counts are sometimesconducted (Trenton), encumbrance is commonly used to guard against municipal overspend-ing, and centralized purchasing is common to avoid corruption. However, allowingappropriate managerial flexibility has not received adequate attention. Departments are notallowed to retain any savings they have realized, as is done in some states. If allowed, itwould create an incentive to promote operational efficiency. The balance between controland managerial flexibility remains an issue worthy of further exploration by elected munici-pal and state government officials.
Summary
The study’s examination of financial management in the selected municipalities revealsmany success stories as well as challenges. Some contributors to success include: (1) a wholeset of local finance laws covering all aspects of local financial management, (2) oversight bythe state government and a hands-on approach by the DLGS to assist with local financetroubles (the state of New Jersey has very successfully eliminated municipal bankruptcies inthe past decades), and (3) a qualified financial management force that is innovative in han-dling local management difficulties.
In general, the municipalities have made concerted efforts to improve financial manage-ment through wider use of information technologies. Paterson has shifted from “manual” to“computerized” financial management; other municipalities have implemented online requi-sition and real-time financial reporting. An exemplar is Old Bridge, where the CFO’sbackground in IT played a role in transplanting information technologies into the munici-pality’s daily financial management operations. Additionally, Brick Township and Old BridgeTownship streamlined their tax collection processes through the application of bar codetechnologies.
These municipalities are also seeking alternative revenue sources, including the aggres-sive pursuit of grant programs. Other municipalities are exploring ways to reduce costs andimprove efficiency by sharing services and expanding private-public partnerships.
Meanwhile, challenges cry for solutions. Some inadequacies in management capacityinclude: (1) the absence of management policies in key areas, (2) inadequate investment inmanagement infrastructure, and (3) politicization of local affairs, to name a few.
For urban municipalities, inadequacy of resources remains a problem. Trenton, for exam-ple, has had a long history of under-assessing state-owned property. Due to an inequitableformula, state-owned property has been under-valuated for three decades. In addition, for at
Financial Management 55
least 15 years, the state did not fully fund Trenton’s payment in lieu of tax (PILOT) program.Annual funding dipped to as low as 20 percent of the formula. As a result, Trenton increas-ingly relies on one-time revenues to cover recurring expenditures.
The lack of stabilization devices also worries municipal finance managers. For example,the fairly wealthy Brick Township faces an expanding demand for services, so maintainingfiscal stability and avoiding tax-rate spikes is a great challenge. Brick has built up large gener-al fund surpluses, but its leaders have seen the need for better, more formal stabilizationdevices.
Deciding how to best shift the focus of state supervision in order to facilitate smootherand more efficient operations is difficult at best. The reliance on the centralized and highlyregulated approach to handle the challenges discussed above has proven insufficient andineffective. The state government must figure out how to balance decentralized operation bylocal governments with centralized oversight by the DLGS.
These successes and challenges may not be unique to these five jurisdictions. The study’soverall findings may bear statewide implications. To solve the local problems requires com-bined efforts at both the local and state levels; attempts by either of the two alone would beinadequate – but New Jersey has never lacked the courage and creativity to renew and rein-vent itself to become more successful than ever before. The final section of this chapterfocuses on findings and recommendations in the following six areas: budgeting, propertyvaluation, tax collection, cash management, debt limitations, and expenditure cap law. Therecommendations are targeted toward the municipalities and the state government.
Recommendations for New Jersey Municipalities and the State of New Jersey
Finding 1: Absence of Long-Term Perspective on Budgeting
The authors conclude that these New Jersey municipalities lack a long-term financial per-spective. As discussed below, current institutional arrangements directly affect budgetaryperspectives and planning practices:
Budgets are for current year only
Current local finance laws and practices discourage timely adoption of annual municipalbudgets; in fact, budgets must often be adopted after the fiscal year starts. State aid figuresfor the current year are not announced until long after the fiscal year starts, let alone forfuture years. According to one interviewee, those that follow the best practices, such asadopting their budgets on time, “get penalized.” This penalty occurs because if a municipali-ty adopts its budget early and the state legislature adopts a new state aid program, themunicipality cannot bring the new aid into its budget.
Limited financial planning
Financial planning requires expertise, resources, and political will. The lack of political will inthese New Jersey municipalities represents a formidable barrier to municipal financial plan-ning that is even greater than the lack of sufficient professional staff. Governing bodies tendto focus on what they are doing in the current year. Thus, the state government needs to
56 THE NEW JERSEY INITIATIVE: Building Management Capacity in New Jersey Municipalities
help shift the municipal governments’ emphasis from default prevention to multiyear budget-ing and planning.
Recommendation for New Jersey municipalities
Financial planning is expensive in terms of time and resources, but it is a necessary compo-nent of sound financial management. All municipal governments and their legislative bodiesshould devote adequate expertise and resources to this function.
Recommendations for the state of New Jersey
The state government/legislature may need to revise local finance laws such that:
• Municipal budgets can serve as tools for financial planning and guidance, not just forsupervision.
• The local finance laws allow, encourage, and require multiyear budgeting, or at least multiyear perspectives on budgets, and long-term financial planning.
Finding 2: Outdated Property Valuation
Tax assessment in New Jersey works in a top-down fashion. The State Division of Taxation setsthe rules; county taxation boards hold administrative responsibilities; and certified municipaltax assessors, who are appointed by the mayor or governing body but report to the countytaxation board, conduct assessments. In many counties, taxation boards order municipalitiesto revaluate if the assessment ratio of properties falls below a certain percentage of thetrue/market value, usually at 75 percent (Benecke, 2001, I-20).
Unlike its strict enforcement of budget laws, New Jersey state government has “allowed”municipalities to neglect their revaluation responsibility. Many urban municipalities do notwant to revaluate. During an interview, one municipal official emphasized that the municipal-ity simply “would not do it [due to the political risks involved].”
Antiquated valuation of property causes inequity in taxation. For example, similar housesare subject to different tax amounts, while people who own properties with vastly disparatemarket values may end up paying the same amount of taxes. In addition, belated revaluationshave also inflated nominal property tax rates. Most importantly, because property taxes arethe major own-source revenue for municipal governments, outdated valuation has cost thecities valuable financial resources.
Recommendation for New Jersey municipalities
Regular revaluation should be done in spite of the costs and time it demands. The monetarybenefits that result from timely valuation far outweigh the required financial and manpowerinput. The equity and social justice regular revaluation provides far outweigh the politicalpressures against it. Revaluation can lower the nominal tax rate and bring in needed resources.
Recommendations for the state of New Jersey
The state should enforce its regulations more seriously. Administrative, even legal, actionsshould be taken to force municipalities to revaluate properties, particularly in those munici-palities where revaluations have not occurred for decades, when assessment ratios have fallen
Financial Management 57
below the acceptable level. Alternatively, responsibility for revaluation can be redirected tothe county government. Occasional cases of legal action have occurred in New Jersey toenforce revaluation.
Finding 3: Low Rate of Tax Collection in Some Urban Municipalities
By state law, property tax is the municipalities’ major own-source revenue. Municipal gov-ernments bear the responsibility of collecting taxes for school districts, counties, and specialdistricts and guarantee them 100 percent of their tax shares. To ensure that they will satisfythis guarantee, each year the municipalities must appropriate unspendable reserves foruncollected taxes. Therefore, high property tax collection rates are key to their fiscal condi-tion. However, collection rates in some urban municipalities are only around 85 percent,which is far too low to maintain financial vitality.
Recommendations for New Jersey municipalities
There are many reasons for the municipalities’ low tax collection rates, and a detailed discus-sion is beyond the scope of this report. Nevertheless, continuous improvement ofmanagement systems is the key to achieving better collection rates. Innovative measures arehelpful. Tax sale, as some of the municipalities use, may be a method for other municipali-ties to consider. However, each municipality must consider its own circumstances whendeciding whether to apply methods that have proven successful elsewhere.
Recommendation for the state of New Jersey
It may be extremely difficult for the state to help raise the tax collection rate; nevertheless, itshould investigate feasible ways of doing so.
Finding 4: Inadequate Cash Management
New Jersey is very conservative with municipal investments. Municipalities are prohibitedfrom making long-term investments. In the words of one state official, “municipalities donot have the need for long-term cash management [because they are so small].” Even cashmanagement is restricted. The state does not allow municipalities to make any investmentswith maturities longer than 360 days, limiting not only the length, but also the instrumentsof investment (to go beyond this limit, explicit case-by-case approval from the State Divisionof Investment is required). The rationale behind this restriction is fund safety. A state officialand two local CFOs proudly claim, “If you follow our rules your principal will never, ever beat risk.” This policy has been successful in preventing investment failures, but a strong short-term investment function has already become an indispensable part of financialmanagement. How to switch from cash management to short-term investment and imple-ment it in a proper way remains to be solved by state as well as local officials.
Recommendation for New Jersey municipalitiesShort-term investment is a new task for municipal financial officials. It is strategically wise toendorse the relatively new management concept of short-term investment and practice it asearly as the legal structure allows. It will prove very rewarding, especially when municipali-ties have more resources under their control.
58 THE NEW JERSEY INITIATIVE: Building Management Capacity in New Jersey Municipalities
Recommendation for the state of New Jersey
It may be necessary to revise current restrictions in order to give municipal officials moreroom for managerial flexibility without sacrificing fiscal discipline or loosening protectionagainst high market risks or scandals.
Finding 5: Municipalities Are Circumventing Current Debt Limitations
The municipal debt limit set by the state is 3.5 percent of the average of the equalizedassessed valuation of the past three years; but this limit is no longer effective, because somemunicipalities enter into lease-rental agreements with county authorities.
Such circumvention reveals at least two points. First, the state’s centralized approach isnot entirely effective in its imposition of the debt limit. The limit disregards differencesbetween municipalities such as urban versus suburban and fast developing versus stabilized(in terms of population, as shown in the population change between 1998 and 2000, Table2.1). Thus, the limit has effectively bound many local officials’ managerial flexibility. Second,local officials are savvy enough to create clever ways of coping with the service demands ofrapidly increasing populations. Thus, it is necessary for the state to review this debt limit, orset different limits for different categories of municipalities.
Recommendation for the state of New Jersey
Municipalities are better classified if they are placed into multiple categories for debt limits.For example, rapidly growing municipalities facing increasing service demands and larger taxbases should be allowed to apply a higher debt limit than the 3.5 percent applicable to allmunicipalities.
Finding 6: Expenditure Cap Law Binds Municipalities
The expenditure cap law for municipalities (no more than 5 percent above last year’s expen-diture or the index rate, whichever is lower) has impeded their ability to meet the demandsof the increasing number of residents, especially for fast-growing municipalities. Similar toFinding 5, the universal application of this law cannot adequately address the individualcontexts of New Jersey municipal governments. In this sense, reviewing the cap is already anurgent task for the state legislature.
Recommendation for the state of New Jersey
Similar to Finding 5, the state should categorize municipalities according to their varyingtaxing capacities and service needs. Although they may be troublesome to implement, multi-ple cap treatments are necessary to give municipalities more flexibility in satisfyingtaxpayers’ service demands.

Financial Management 59

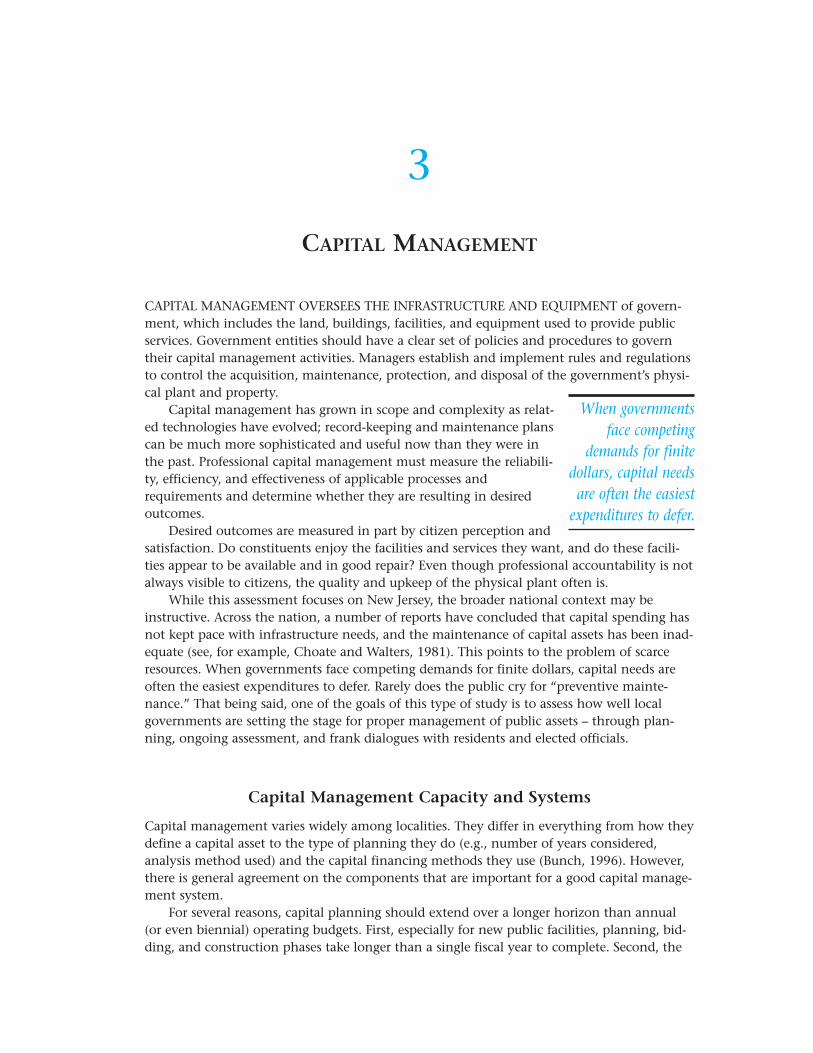
3
CAPITAL MANAGEMENT
CAPITAL MANAGEMENT OVERSEES THE INFRASTRUCTURE AND EQUIPMENT of govern-ment, which includes the land, buildings, facilities, and equipment used to provide publicservices. Government entities should have a clear set of policies and procedures to governtheir capital management activities. Managers establish and implement rules and regulationsto control the acquisition, maintenance, protection, and disposal of the government’s physi-cal plant and property.
Capital management has grown in scope and complexity as relat-ed technologies have evolved; record-keeping and maintenance planscan be much more sophisticated and useful now than they were inthe past. Professional capital management must measure the reliabili-ty, efficiency, and effectiveness of applicable processes andrequirements and determine whether they are resulting in desiredoutcomes.
Desired outcomes are measured in part by citizen perception andsatisfaction. Do constituents enjoy the facilities and services they want, and do these facili-ties appear to be available and in good repair? Even though professional accountability is notalways visible to citizens, the quality and upkeep of the physical plant often is.
While this assessment focuses on New Jersey, the broader national context may beinstructive. Across the nation, a number of reports have concluded that capital spending hasnot kept pace with infrastructure needs, and the maintenance of capital assets has been inad-equate (see, for example, Choate and Walters, 1981). This points to the problem of scarceresources. When governments face competing demands for finite dollars, capital needs areoften the easiest expenditures to defer. Rarely does the public cry for “preventive mainte-nance.” That being said, one of the goals of this type of study is to assess how well localgovernments are setting the stage for proper management of public assets – through plan-ning, ongoing assessment, and frank dialogues with residents and elected officials.
Capital Management Capacity and Systems
Capital management varies widely among localities. They differ in everything from how theydefine a capital asset to the type of planning they do (e.g., number of years considered,analysis method used) and the capital financing methods they use (Bunch, 1996). However,there is general agreement on the components that are important for a good capital manage-ment system.
For several reasons, capital planning should extend over a longer horizon than annual(or even biennial) operating budgets. First, especially for new public facilities, planning, bid-ding, and construction phases take longer than a single fiscal year to complete. Second, the
When governmentsface competing
demands for finitedollars, capital needs
are often the easiestexpenditures to defer.
62 THE NEW JERSEY INITIATIVE: Building Management Capacity in New Jersey Municipalities
magnitude of capital costs requires extensive evaluation to determine the method of pay-ment – outright cash, a sinking fund, or financing. Third, the cost of providing services (orthe benefits accrued from a public facility) should be attributed to the time period duringwhich the services or benefits are enjoyed. Thus, even a one-time cash payment for a publicfacility has a multi-year impact.
Long-term capital planning enables a government to better budget its scarce resourcesover a span of time.
A capital budget provides a mechanism to smooth out peaks and valleys, regularizeconstruction activity in an effort to avoid local bottlenecks that can delay projects andinflate their cost, avoid excessive drains on the tax base when projects must be paidfor, and balance spending with the resources available within political, economic, andlegal tax and debt limits. (Mikesell, 1999, 226)
Capital needs and service demands often exceed available resources, so municipalitiesneed to rank competing capital requests and determine which projects they will include inthe budget. A capital improvements plan (CIP) is a vehicle for ranking capital needs thatallows managers to evaluate and compare projects. According to Roland Calia (2001), thisapproach can force inclusion of additional information into the process, it improves justifica-tion of decisions, and it may increase objectivity. The CIP can also be coordinated with thecommunity’s strategic plan, which establishes a community vision and helps with prioritysetting (Halachmi and Sekwat, 1997).
One study by Millar (1988) suggests the use of 11 evaluation criteria, including: fiscalimpact; health and safety effects; community economic effects; environmental, aesthetic,and social effects; disruption and inconvenience caused; distributional effects; feasibility;implications of deferring the project; amount of uncertainty and risk; effects on interjurisdic-tional relationships; and relationship to other capital projects.
The role of citizens in the governance process has received increasing emphasis. Publicparticipation in budgeting processes not only helps determine service needs, but also edu-cates citizens in the complexities and costs of government services and increases their trustin government (Ebdon, forthcoming). Traditional methods of public involvement typicallyinclude public hearings during meetings of the governing body and voter approval of bondreferenda. Other positive methods of public participation include: decentralizing public hear-ings throughout the community, conducting public opinion surveys, providing greater accessand input to public databases, and including citizen members on capital planning commit-tees (MacManus, 1996).
Capital management does not end with the completion of a capital improvements plan –implementing capital projects is crucial. The goal of the implementation phase is to ensuretimely and efficient performance, within cost. This can be achieved through proper goal set-ting, the establishment of appropriate performance objectives, and adequate oversight of theproject to completion (U.S. General Accounting Office, 1998).
Asset maintenance is also a critical component of capital management. Routine and pre-ventive maintenance saves money in the long run. For example, routine preventivemaintenance has been found to reduce infrastructure’s life-cycle costs by 75 to 90 percent insome cases (See Dornan, 2000).
Some have argued that the under-investment in maintenance has been exacerbated by
current capital budgeting methods that fail to adequately demonstrate maintenance needs(Pagano, 1984). In an attempt to address this issue, in Statement No. 34, the GovernmentalAccounting Standards Board (GASB) approved new financial reporting standards that willrequire state and local governments to report the value of their infrastructure assets in annu-al financial statements. They must also record depreciation expense for all capital assets,unless the government adequately assesses maintenance needs with an asset managementsystem. For many jurisdictions, this will require significant changes in how assets are trackedand managed (See, Kravchuk and Voorhees, 2001).
Decision-making will not be improved merely by the existence of a capital improve-ments plan or good information regarding asset needs. The information must be used as afundamental part of the decision-making process for budgeting decisions. Bond-rating agen-cies consider management practices, in addition to a formal capital improvements plan,when determining credit ratings.
For these reasons, professional organizations and scholars emphasize the importance ofcapital management practices. While a locality’s size, the scope of its capital asset responsibil-ities, its financial capacity, and state and local legal requirements can all affect how itperforms capital management, several aspects are considered crucial in all governments. Inits recent study of “best practices” in capital management, the U.S. General AccountingOffice identified five principles for success:
1. Organizational goals need to be linked to the capital decision-making process.
2. A long-term capital plan should be developed using an analytical approach with proj-ect ranking based on established criteria
3. Total life cycle costs should be considered in the planning and selection process
4. Project management techniques should be used to prevent project delays and costoverruns
5. Performance assessment should be ongoing (U.S. General Accounting Office, 1998)
These principles essentially coincide with the criteria used in the current study to evalu-ate the New Jersey municipalities.
Capital Management Environment for New Jersey Municipalities
Relative to other states, New Jersey has a very high degree of control over capital and finan-cial management in local governments. New Jersey has an elaborate body of local financelaw. Apparently, this level of state control over capital management was developed in aneffort to eliminate and prevent corruption – both perceived and real – in local government.From the local governments’ perspective, this orientation has resulted in a highly regulatedand rigid environment that is focused more on procedural compliance than upon efficientand effective capital management. While the state may not consider itself unduly invasive ordemanding, local governments share a different point of view. While both levels of govern-ment agree on the goals, they disagree on the best way to accomplish them.
The state of New Jersey regulates the following (this list is not intended to be exhaustive,but rather an overview of major regulations):
Capital Management 63
64 THE NEW JERSEY INITIATIVE: Building Management Capacity in New Jersey Municipalities
1. Formats for the budget, capital improvements plan, and financial reporting docu-ments
2. Format for the six-year capital expenditure plan
3. Standard definition of what can be financed with debt, the proportion of a capitalproject that can be financed with debt, and the time period for repayment of debt
4. Approval authority of the budgetary process
5. Licensure of local finance, procurement (optional), financial officers, municipal clerks,tax collectors, and public works managers
During the course of this project, local officials commented negatively about the state’sability to use its professional licensure regulation to enforce these requirements. If a localofficer believed that a minor variance from a state regulation would be proper and beneficialto the community, he would be reluctant to act on that belief, because his individual profes-sional licensure is at stake. This is the double-edged sword of state regulation: if it is weak, itallows for abuse; if it is overly strong, it hinders good, creative management that canrespond to unique needs.
A number of constraints have hindered local governments’ capital management efforts.Some of these are externally imposed, such as regulatory or statutory constraints, but mostseem to be self-imposed. Further, most of the restrictions seem to be based in practice ratherthan in written regulation.
The form of local government home rule in New Jersey is predominately the council-mayor form, which arguably results in a weak central administrative function. This producesdecentralized operating departments with no strong central authority vested in the businessadministrator, whose function is restricted to operating the central administrative functionsof the municipality. In this form, the business administrator, who serves at the pleasure ofthe mayor, runs the central administrative functions, but may have limited authority tomanage departments. Thus, establishment of locality-wide priorities or accountability isoften missing.
It is also important to note that capital management is closely related to general finan-cial management. Thus, some of the issues raised in Chapter 2, “Financial Management,”also affect capital management. For example, New Jersey’s local governments rely heavily onthe property tax, which is widely unpopular. Additionally, the annual rate of expendituregrowth is limited, and net debt cannot exceed 3.5 percent of the value of real estate (a three-year average equalized value). Consequently, these constraints greatly inhibit capitalexpenditure decisions.
Criteria for Assessing Capital Management
Three major criteria were used to evaluate capital management in the seven New Jerseymunicipalities. These criteria were originally developed for use in the GovernmentPerformance Project. They reflect the components that are generally considered crucial for asuccessful capital management system (see Table 3.1).
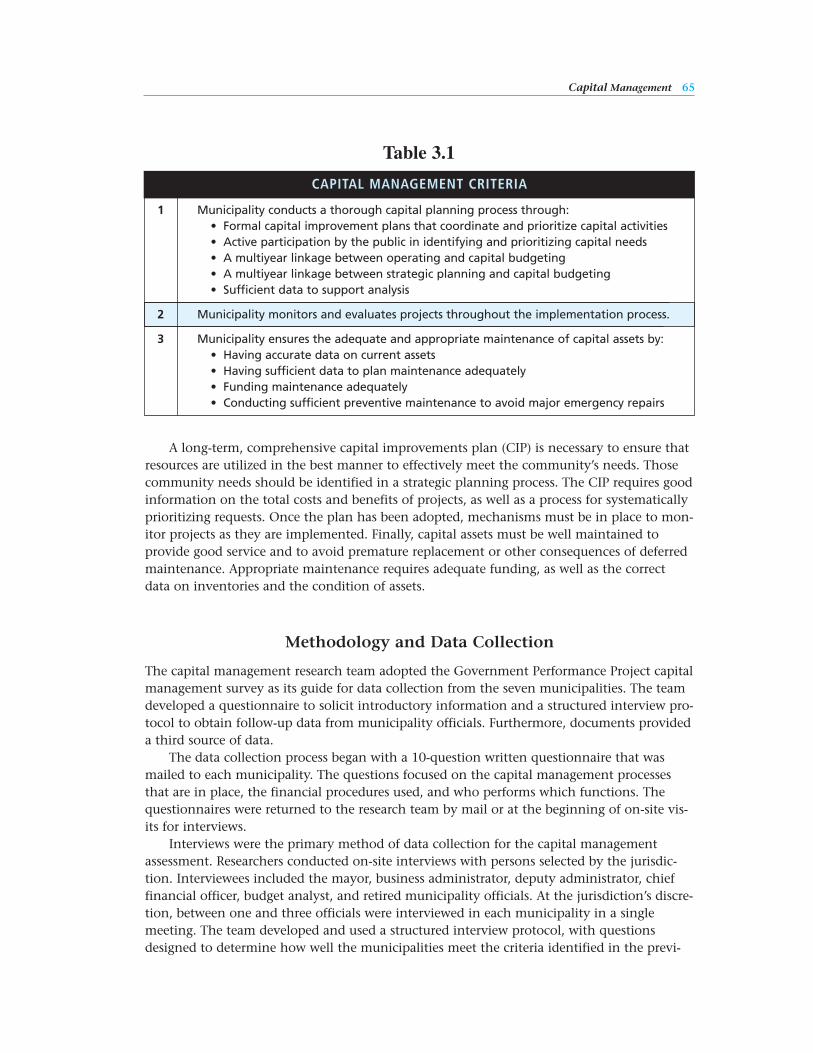
A long-term, comprehensive capital improvements plan (CIP) is necessary to ensure thatresources are utilized in the best manner to effectively meet the community’s needs. Thosecommunity needs should be identified in a strategic planning process. The CIP requires goodinformation on the total costs and benefits of projects, as well as a process for systematicallyprioritizing requests. Once the plan has been adopted, mechanisms must be in place to mon-itor projects as they are implemented. Finally, capital assets must be well maintained toprovide good service and to avoid premature replacement or other consequences of deferredmaintenance. Appropriate maintenance requires adequate funding, as well as the correctdata on inventories and the condition of assets.
Methodology and Data Collection
The capital management research team adopted the Government Performance Project capitalmanagement survey as its guide for data collection from the seven municipalities. The teamdeveloped a questionnaire to solicit introductory information and a structured interview pro-tocol to obtain follow-up data from municipality officials. Furthermore, documents provideda third source of data.
The data collection process began with a 10-question written questionnaire that wasmailed to each municipality. The questions focused on the capital management processesthat are in place, the financial procedures used, and who performs which functions. Thequestionnaires were returned to the research team by mail or at the beginning of on-site vis-its for interviews.
Interviews were the primary method of data collection for the capital managementassessment. Researchers conducted on-site interviews with persons selected by the jurisdic-tion. Interviewees included the mayor, business administrator, deputy administrator, chieffinancial officer, budget analyst, and retired municipality officials. At the jurisdiction’s discre-tion, between one and three officials were interviewed in each municipality in a singlemeeting. The team developed and used a structured interview protocol, with questionsdesigned to determine how well the municipalities meet the criteria identified in the previ-
Capital Management 65
Table 3.1
CAPITAL MANAGEMENT CRITERIA
1 Municipality conducts a thorough capital planning process through:• Formal capital improvement plans that coordinate and prioritize capital activities• Active participation by the public in identifying and prioritizing capital needs• A multiyear linkage between operating and capital budgeting• A multiyear linkage between strategic planning and capital budgeting• Sufficient data to support analysis
2 Municipality monitors and evaluates projects throughout the implementation process.
3 Municipality ensures the adequate and appropriate maintenance of capital assets by:• Having accurate data on current assets• Having sufficient data to plan maintenance adequately• Funding maintenance adequately• Conducting sufficient preventive maintenance to avoid major emergency repairs
66 THE NEW JERSEY INITIATIVE: Building Management Capacity in New Jersey Municipalities
ous section. Interview teams consisted of one or two Maxwell School researchers and some-times one or two members of the project advisory committee. Researchers recorded writtennotes during the interviews, which team members and municipality representatives reviewedat the conclusion of the interviews. In addition, a team member interviewed two representa-tives of the New Jersey Department of Community Affairs. This interview session followedthe interviews of municipality officials and was used to confirm the state’s role relative tolocal capital management practices.
There were no extensive document reviews. However, research team members reviewedcopies of the state-mandated six-year plan, budget, and debt statements when they wereavailable.
Each researcher compared reports and notes with each other. Then, data from the ques-tionnaires, interviews, and document reviews were compiled into a standard format. Thenthe team developed a set of findings and recommendations for improvements for both thelocal governments and the state of New Jersey.
Results: Capital Management in New Jersey Municipalities
There are many similarities in capital management among the seven communities.Therefore, this section is organized around the three criteria used to evaluate capital manage-ment, rather than by jurisdiction. However, the first subsection provides a brief description ofeach municipality’s capital assets and functions.
Capital Assets
The four townships studied (Brick, Franklin, Irvington, and Old Bridge) are responsible for allnormal municipal services and facilities except schools, libraries, water and sewer utilities,and fire, which are fiscally independent. Facilities and equipment generally include parksand recreation, administrative buildings, an auto fleet for police and administrative purposes,construction equipment, and senior citizen buses. These four municipalities are responsiblefor the roads within the townships that the state or county does not maintain. The town-ships also perform some unique activities. For example, Brick is responsible for a dam and aclosed landfill, has an extensive oceanfront that requires specialized maintenance activitiesfor the beaches and bulkheads, and is currently constructing the largest sports complex inNew Jersey.
Three cities were included in the study: Elizabeth, Paterson, and Trenton. In addition toperforming the same activities as the townships, the cities are also responsible for fire, sewerand water services and facilities (except Paterson, which has an independent water system).Elizabeth has a long-term contract for the operation and maintenance of its water distribu-tion system and is currently developing a similar arrangement for the sewer collectionnetwork; water and sewer treatment services are provided through contractual arrangementswith independent entities. Paterson collects and transmits sewage to a regional plant. InPaterson, a parking authority operates the parking structure, while the city maintains andenforces the parking meters. Trenton also has a parking authority for parking structures, andthe city operates the parking meters, surface lots, and on-street parking.
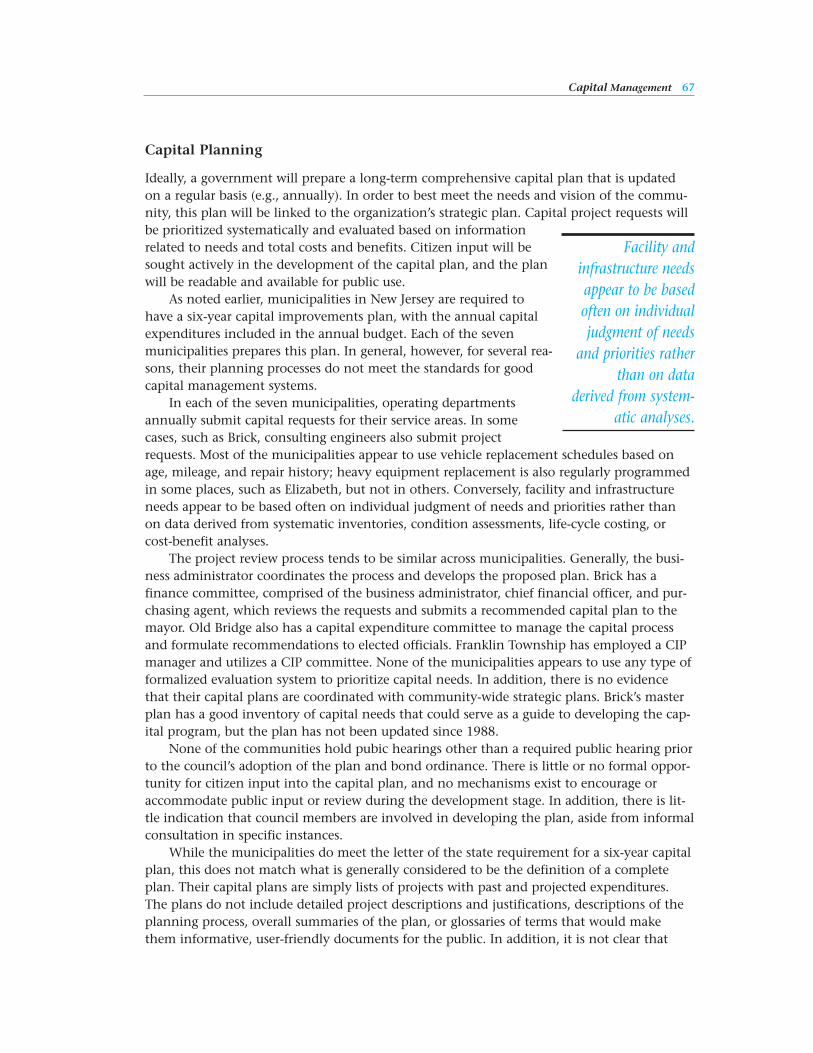
Capital Management 67
Capital Planning
Ideally, a government will prepare a long-term comprehensive capital plan that is updatedon a regular basis (e.g., annually). In order to best meet the needs and vision of the commu-nity, this plan will be linked to the organization’s strategic plan. Capital project requests willbe prioritized systematically and evaluated based on informationrelated to needs and total costs and benefits. Citizen input will besought actively in the development of the capital plan, and the planwill be readable and available for public use.
As noted earlier, municipalities in New Jersey are required tohave a six-year capital improvements plan, with the annual capitalexpenditures included in the annual budget. Each of the sevenmunicipalities prepares this plan. In general, however, for several rea-sons, their planning processes do not meet the standards for goodcapital management systems.
In each of the seven municipalities, operating departmentsannually submit capital requests for their service areas. In somecases, such as Brick, consulting engineers also submit projectrequests. Most of the municipalities appear to use vehicle replacement schedules based onage, mileage, and repair history; heavy equipment replacement is also regularly programmedin some places, such as Elizabeth, but not in others. Conversely, facility and infrastructureneeds appear to be based often on individual judgment of needs and priorities rather thanon data derived from systematic inventories, condition assessments, life-cycle costing, orcost-benefit analyses.
The project review process tends to be similar across municipalities. Generally, the busi-ness administrator coordinates the process and develops the proposed plan. Brick has afinance committee, comprised of the business administrator, chief financial officer, and pur-chasing agent, which reviews the requests and submits a recommended capital plan to themayor. Old Bridge also has a capital expenditure committee to manage the capital processand formulate recommendations to elected officials. Franklin Township has employed a CIPmanager and utilizes a CIP committee. None of the municipalities appears to use any type offormalized evaluation system to prioritize capital needs. In addition, there is no evidencethat their capital plans are coordinated with community-wide strategic plans. Brick’s masterplan has a good inventory of capital needs that could serve as a guide to developing the cap-ital program, but the plan has not been updated since 1988.
None of the communities hold pubic hearings other than a required public hearing priorto the council’s adoption of the plan and bond ordinance. There is little or no formal oppor-tunity for citizen input into the capital plan, and no mechanisms exist to encourage oraccommodate public input or review during the development stage. In addition, there is lit-tle indication that council members are involved in developing the plan, aside from informalconsultation in specific instances.
While the municipalities do meet the letter of the state requirement for a six-year capitalplan, this does not match what is generally considered to be the definition of a completeplan. Their capital plans are simply lists of projects with past and projected expenditures.The plans do not include detailed project descriptions and justifications, descriptions of theplanning process, overall summaries of the plan, or glossaries of terms that would makethem informative, user-friendly documents for the public. In addition, it is not clear that
Facility and infrastructure needsappear to be basedoften on individualjudgment of needs
and priorities ratherthan on data
derived from system-atic analyses.
long-term planning is taken seriously. In one municipality, for example, several major capitalitems that were funded in one year were not mentioned at all in the six-year plan that wasadopted the previous year. This is an indication of poor planning.
There is large variation in the fiscal stress the jurisdictions experience; but, with theexception of Trenton and Irvington, the jurisdictions have the capacity to do what would berequired to adequately meet capital management needs. The team reviewed the jurisdictions’debt burdens and concluded that all but two have debt capacity to raise construction fund-ing for new capital assets. There is not the perceived demand that would justify the taxburden upon the public or the administrative burden upon the local government. Trentonhas a debt capacity problem because much of the property is state owned and, thus, taxexempt. Irvington requires state support just to balance its operating budget. Its real shortageis in maintenance funding, which is more a problem of political will to appropriate than aproblem of capacity. Maintenance is not a priority in local government, and the weak centraladministrative function cannot force departments to do more planning and funding thanthey do now.
Project Management
This criterion requires governments to monitor the implementation of capital projects, withthe ultimate objectives of reducing cost overruns and delays and improving performance.Success in this area necessitates regular reporting by the municipality and use of a well-devel-oped tracking system. Project management practices vary somewhat among the sevenmunicipalities in this study.
Brick Township has opted to contract out its engineering services rather than fund in-house engineering expertise. The firms it contracts, in coordination with the responsiblemunicipal agency, oversee implementation of capital projects. The municipality’s purchasingagent also has a major responsibility for implementing the capital plan; major buildingrepairs and renovations are within his administrative purview. The purchasing agent is alsoresponsible for procuring construction and consulting contracts and monitoring their execu-tion in concert with the responsible line department.
In Elizabeth, the assistant public works director is responsible for tracking capital projectsand managing the consulting architects and engineers. There is no indication of a computer-ized tracking system for project implementation in this municipality.
In Franklin Township, the township manager directs a CIP committee, which is chargedwith tracking township projects. A CIP manager, recently hired by the administration, pro-duces and updates project progress reports, and the finance department produces budgetcompliance reports. Both reports are provided on a monthly basis. No project managementsoftware is used.
Due to its fiscal stress, Irvington Township is unable to fund either routine maintenanceor the acquisition of new capital assets. The municipality implements only emergency capitalprojects, and the responsible departments track these. No project management reports areproduced or used outside the responsible departments. Project management software is notused.
In Old Bridge, a CIP committee tracks capital projects using monthly reports that thedepartments generate and defend. These include project progress reports, produced by theresponsible departments, and budget compliance reports, generated by the finance depart-ment. The business administrator and chief financial officer track budget compliance.
68 THE NEW JERSEY INITIATIVE: Building Management Capacity in New Jersey Municipalities
Capital Management 69
In Paterson, the responsible departments monitor and track projects. No project manage-ment reports are produced or used outside the departments, and project managementsoftware is not used.
Capital projects in Trenton are also monitored and tracked by the responsible depart-ments, but the budget department monitors some strategically important projects. Bothproject progress and budget compliance reports are provided on a monthly basis, but noproject management reports are produced or used outside the responsible departments.
Overall, there are variations in who monitors projects and whether regular trackingreports are prepared and distributed. In several of the jurisdictions, monitoring is entirelyconducted within the departments responsible for projects, with little or no reporting out-side the departments. Franklin and Old Bridge are examples of communities that appear tohave good processes that require monthly reporting of both project status and budget com-pliance to a CIP committee. Using project management software would enhance thisfunction, but it appears to be relatively unused by these seven communities.
Asset Maintenance
To maintain service levels, it is crucial to keep capital assets in good condition. Deferringcapital maintenance can result in excessive long-term costs and require replacement soonerthan would be necessary with adequate preventive maintenance. Appropriate maintenancerequires: (1) keeping inventories up-to-date, so the municipality knows its assets’ age andmaintenance history, and (2) performing condition assessments on a regular basis andincluding data on the cost of maintaining assets in good condition.
For the most part, useful data for asset maintenance are not available in these municipal-ities. Municipalities use fixed asset inventories for accounting purposes, but they do not usethem for maintenance purposes, although Elizabeth does use inventory information to deter-mine public safety vehicle replacement schedules. In addition, they do not do regularcondition assessments, nor do they keep or report ongoing records of asset condition outsidethe responsible departments. Automated systems are not used to track information aboutconditions and maintenance.
Trenton is an exception. The municipality has installed an automated transportation sys-tem to inventory and monitor lane miles and structural conditions and to project streetmaintenance needs. Trenton is in the process of installing a similar system for buildings andother public facilities.
The municipalities fund maintenance needs differently. Irvington’s severe fiscal stress hasaffected its ability to fund capital maintenance. Its equipment is old, outdated, and in poorrepair, but no regular maintenance is scheduled; maintenance is funded only on an emer-gency basis. Despite these problems, the buildings and streets in Irvington appear to be infairly good condition. The facilities and roads in Old Bridge have also had significant mainte-nance needs, but the municipality officials interviewed for this study said they believe theyhave overcome the major problems—Old Bridge is funding the remaining needs systemati-cally from a dedicated level of funding in the annual operating budget.
In Elizabeth, routine facility maintenance appears to be fairly good. The public safetyfleet is replaced routinely; no fire truck is more than 10 years old, and no ambulance is olderthan five years. Interviewees noted, however, that fire stations and recreation centers haveunmet maintenance needs. In Trenton as well, some assets need reconstruction, but facilitiesand streets seem to be structurally sound.
70 THE NEW JERSEY INITIATIVE: Building Management Capacity in New Jersey Municipalities
Paterson appears to have no major unmet maintenance needs at the present time. Brickhas also done an excellent job of maintaining its capital assets. Interviewees note that themunicipality is widely recognized for its beaches and recreation facilities. Brick’s capitalimprovement plan has also funded building improvements systematically, to enhance energyefficiency and replace aging systems such as HVAC and roofs.
Summary
Overall, the research team found no egregious current problems related to capital manage-ment in these communities (with the exception of Irvington, whose fiscal difficulties areimpairing the municipality’s ability to maintain capital assets). For the most part, the juris-dictions appear to have the capital assets they need to provide community services. Theyexert some long-term planning efforts, due to the state’s requirement for a six-year capitalplan. It appears that no major project management issues have resulted in extensive costoverruns or schedule delays. Levels of unfunded maintenance needs vary across the jurisdic-tions, but for the most part appear to be manageable.
However, none of these seven municipalities has what would be considered a good capi-tal management system. They have four major weaknesses:
Data systems. There are few good, centralized, standardized information systems in placethat would allow these municipalities to use data to make rational decisions regarding capitalprojects and maintenance needs. Condition assessments are not conducted regularly, andinventory systems are maintained strictly for accounting purposes, rather than being usefulfor capital planning. These governments are not required by state law to meet generallyaccepted accounting principles. However, the use of these principles is considered importantin areas such as bond ratings. If these municipalities attempt to implement the reportingrequirements of GASB Statement 34 – which mandates enhanced financial reporting relatingto capital assets – they may face difficulties.
Capital project prioritization. For the most part in these municipalities, departments andbusiness administrators make capital planning decisions based on their individual judgmentand experience. There is little comprehensive evaluation of projects based on prioritizationcriteria, analysis, and connection to an overall community strategic plan.
Citizen input and communication. Citizen input is not included in the planning process inany formalized way, other than through the required public hearings on the capital plans. Inaddition, plans are not written in a way that encourages public understanding of the capitalprocess and plan details.
Centralization. In these seven municipalities, capital planning, project management, andasset maintenance occur at a decentralized level, within individual departments. Effectivecapital management requires some degree of centralization to ensure compliance with thecitywide vision, standardization of information, and oversight. Franklin Township is theexception here, as it has hired a capital improvements manager, created a capital manage-ment committee, and is moving towards a more centralized structure.
Capital Management 71
Recommendations for New Jersey Municipalities
Based on the weaknesses identified above, the capital management team offers seven recom-mendations it believes would improve capital management in these communities. Theseideas have been used successfully in other jurisdictions and are considered to be “best prac-tices” in this area.
Data Systems
1. Implement a centralized fixed asset inventory system providing a statement of condi-tion and maintenance history. This will provide a context and place in which to keeprecords on the condition of assets and a basis upon which to define new capital andmaintenance needs.
2. Develop a regular program/schedule for condition assessments of buildings, equip-ment, and infrastructure. Again, fairly current information is required to determinemaintenance priorities.
Capital Project Prioritization
3. Develop or update an organization-wide strategic plan and link it to the capital plan. Itis difficult to make good long-term capital decisions in a vacuum, without understand-ing how projects fit into the vision for the community.
4. Develop a comprehensive set of criteria to evaluate the importance and urgency of allcapital improvement and maintenance requests.
Citizen Input and Communication
5. Establish a formal mechanism to obtain citizen input on the capital needs of the com-munity in advance of preparing the capital plan. The public participation processcould include such strategies as (1) conducting public meetings, (2) distributing a com-munity survey, and/or (3) including citizen representatives on committees to evaluatecapital project requests.
6. Modify the capital budget document to provide more useful information about theprojects, what they entail, how they will impact the community, and why they are apriority. While the current format meets the state requirement, listing projects byname is not adequate for facilitating community input. This basic plan should be sup-plemented with a more informative, citizen-oriented document that explains thecapital planning process, the project evaluation criteria, and summary details for eachproject, including funding over the six-year period.
Centralization
7. Create a central capital improvement management committee composed of key admin-istrative officials. This committee should develop criteria for project evaluation,implement standards for information systems and formats, prioritize requests based onthese criteria, monitor the progress of capital projects, and review summaries of condi-tion assessment reports.
72 THE NEW JERSEY INITIATIVE: Building Management Capacity in New Jersey Municipalities
Recommendations for the State of New Jersey
Capital management researchers make the following three recommendations for the state ofNew Jersey:
1. These municipalities follow state regulations related to capital management. However,they rarely go beyond these requirements, to improve the efficiency and effectivenessof this function. Part of the reluctance to enhance capital management appears to be astrong belief on the part of local administrators that they are highly constrained by thestate. For example:
• The state licenses local finance and public works managers (among others). A num-ber of the interviewees noted that state officials can take away their license. Thisfear of losing a license to work in one’s chosen profession may restrict local officialsin their efforts to move beyond the minimum state requirements for capital man-agement. This fear is acknowledged by the state and is used to require conformancewith procedures that meet the state’s needs.
• These municipalities share a common complaint about the rigidity of procurementstatutes. The state attempted to address this rigidity by amending the New JerseyState Code to give localities more flexibility. However, local officials continue toview the “low bid” process as the only safe way to procure capital projects, eventhough the code now provides for alternative methods.
• Local officials emphasize their strict application of the state code and statutes. Thiscan impede the ability to use innovative methods that are used successfully inother states, and can lead to inappropriate decisions. For example, the statutorydefinition of debt seems to guide discussions of capital financing, rather thanobjective reviews of the best form of financing for the individual situation. Localmanagers form questions such as, “How can we comply with the State Code if wedo this?” rather than “How do we do this and also comply with the State Code?”The response to the first is, “We probably can’t, so we won’t do it.” Conversely, aresponse to the second question would be, “What additional procedural steps willwe need to build into the work program when we do this?”
This perception of the state as a heavy-handed regulator and watchdog that focuses onpreventing corruption seems to discourage local officials from improving management prac-tices. We recommend that the state recognize local government as a valid level of governancedesigned to and capable of acting with considerable degrees of independence and to workmore closely with local administrators to understand their concerns and needs. The statecould then convert its relationship with local government from one of fear and mistrust toone where the state is seen as providing valuable help and guidance to localities.
2. Despite great differences in localities across the country, there are a number of compo-nents that are commonly considered crucial for a good capital management system.These New Jersey municipalities are weak in many of these areas. There are a numberof examples of governments that have adopted “best practices” that can serve as mod-els for New Jersey. The state should abandon the perception that local governments in
Capital Management 73
New Jersey are somehow unique and that practices considered best practices elsewherein the country are not appropriate in New Jersey. The state should encourage themunicipalities to adopt these practices. For example, the current mandatory format forthe capital budget and six-year plan is limited as a public policy or management tool;state acceptance of a more comprehensive document would be useful. In addition, thestate should adopt a role of fostering independent growth and development on thepart of local government officials instead of dictating proce-dures. They might, for example, consider providing technicaland/or financial assistance for the development of strategicplans and data management systems.
3. The relatively low assessed values restrict the amount of taxrevenue available for pay-as-you-go capital funding becauseof the very high tax rates required to pay for current opera-tions and debt obligations. The municipalities are uniformlyunwilling to conduct revaluations. The state would be wellserved to enact a “roll back” statute similar to the statutesenacted in some states in the 1980s to offset the impact of inflation. These statutesrequire the reduction of property tax rates to offset increases in assessments. The statecould enforce the uniform assessment by removing responsible local officials who donot comply or by doing the reassessment itself. Other states offer precedent for thisimprovement, which would ensure more uniform and accurate property assessment.
This perception of thestate as a heavy-handedregulator and watchdogthat focuses on prevent-ing corruption seems to
discourage local offi-cials from improving
management practices.

4HUMAN RESOURCES MANAGEMENT
HUMAN RESOURCES MANAGEMENT (HRM) IS AN ESSENTIAL COMPONENT of any man-agement system, as it guides and influences the behaviors of the most important asset of amunicipality – its employees (Ingraham, Selden, and Moynihan, 2000; Ulrich, 1997a, 1997b).Human resource management refers to the policies, systems, and practices that influenceemployees’ behaviors, attitudes, and performance. HRM practices include determininghuman resource needs (workforce planning), attracting prospective employees (recruiting),choosing employees (selection), teaching employees how to perform in current positions andin future positions (training and development), rewarding employees (recognition and com-pensation), evaluating their performance (performance management), and creating a positivework environment (employee relations).
A growing body of research has focused on assessing the effectiveness of human resourcemanagement systems, and this project is founded on a recent and significant study in thisarea, the Government Performance Project (GPP) (Pfeffer, 1997; Selden, 2001; Yeung, 1997).A broad group of practitioners and scholars considered to be experts in human resource man-agement was convened and asked to identify what they considered to be the most significantelements of HRM, based on the literature of the field, their experience, and their ownresearch. Through an iterative series of meetings and written feedback, the group reached ahigh degree of consensus about what mattered most to successful management of humanresources and converted these findings into evaluation criteria. This set of criteria guides thisstudy of New Jersey municipalities. These criteria are consistent with GAO’s Model forStrategic Human Capital Management (U.S. GAO, 2002) and its human capital checklist (U.S.GAO, 2001).
Human Resources Management Capacity and Systems
This study uses the following GPP criteria to characterize sound human resources manage-ment capacity and systems in municipalities: workforce planning; hiring a skilled workforce;retaining a skilled workforce; motivating the workforce through meaningful reward, evalua-tion structures, and disciplinary procedures; and workforce structure.
Conducting strategic analysis of present and future human resource needs. This criterion hingeson the extent to which a municipality is aware of and addresses its personnel capacity overtime, particularly the sophistication with which the government conducts strategic analysisof present and future human resource needs and availability. It includes the extent andnature of planning tools, such as strategic planning, performance measurement, and infor-mation technology.
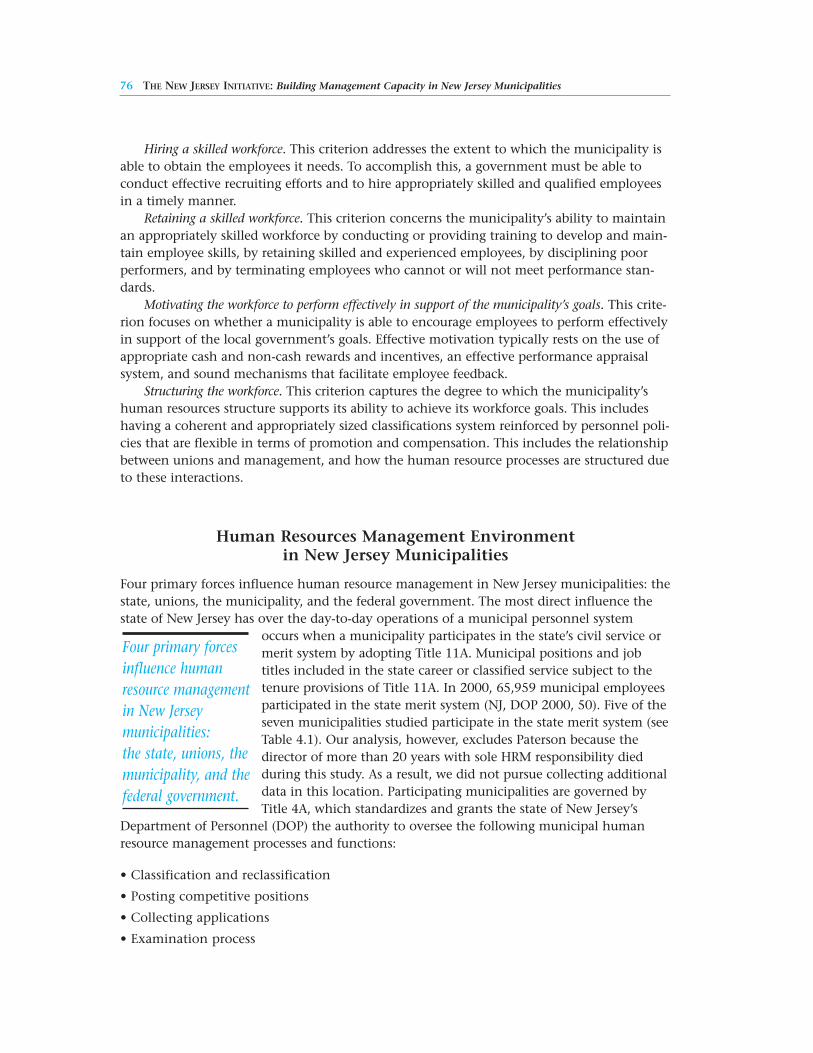
Hiring a skilled workforce. This criterion addresses the extent to which the municipality isable to obtain the employees it needs. To accomplish this, a government must be able toconduct effective recruiting efforts and to hire appropriately skilled and qualified employeesin a timely manner.
Retaining a skilled workforce. This criterion concerns the municipality’s ability to maintainan appropriately skilled workforce by conducting or providing training to develop and main-tain employee skills, by retaining skilled and experienced employees, by disciplining poorperformers, and by terminating employees who cannot or will not meet performance stan-dards.
Motivating the workforce to perform effectively in support of the municipality’s goals. This crite-rion focuses on whether a municipality is able to encourage employees to perform effectivelyin support of the local government’s goals. Effective motivation typically rests on the use ofappropriate cash and non-cash rewards and incentives, an effective performance appraisalsystem, and sound mechanisms that facilitate employee feedback.
Structuring the workforce. This criterion captures the degree to which the municipality’shuman resources structure supports its ability to achieve its workforce goals. This includeshaving a coherent and appropriately sized classifications system reinforced by personnel poli-cies that are flexible in terms of promotion and compensation. This includes the relationshipbetween unions and management, and how the human resource processes are structured dueto these interactions.
Human Resources Management Environment in New Jersey Municipalities
Four primary forces influence human resource management in New Jersey municipalities: thestate, unions, the municipality, and the federal government. The most direct influence thestate of New Jersey has over the day-to-day operations of a municipal personnel system
occurs when a municipality participates in the state’s civil service ormerit system by adopting Title 11A. Municipal positions and jobtitles included in the state career or classified service subject to thetenure provisions of Title 11A. In 2000, 65,959 municipal employeesparticipated in the state merit system (NJ, DOP 2000, 50). Five of theseven municipalities studied participate in the state merit system (seeTable 4.1). Our analysis, however, excludes Paterson because thedirector of more than 20 years with sole HRM responsibility diedduring this study. As a result, we did not pursue collecting additionaldata in this location. Participating municipalities are governed byTitle 4A, which standardizes and grants the state of New Jersey’s
Department of Personnel (DOP) the authority to oversee the following municipal humanresource management processes and functions:
• Classification and reclassification
• Posting competitive positions
• Collecting applications
• Examination process
76 THE NEW JERSEY INITIATIVE: Building Management Capacity in New Jersey Municipalities
Four primary forcesinfluence humanresource managementin New Jersey municipalities:the state, unions, themunicipality, and thefederal government.
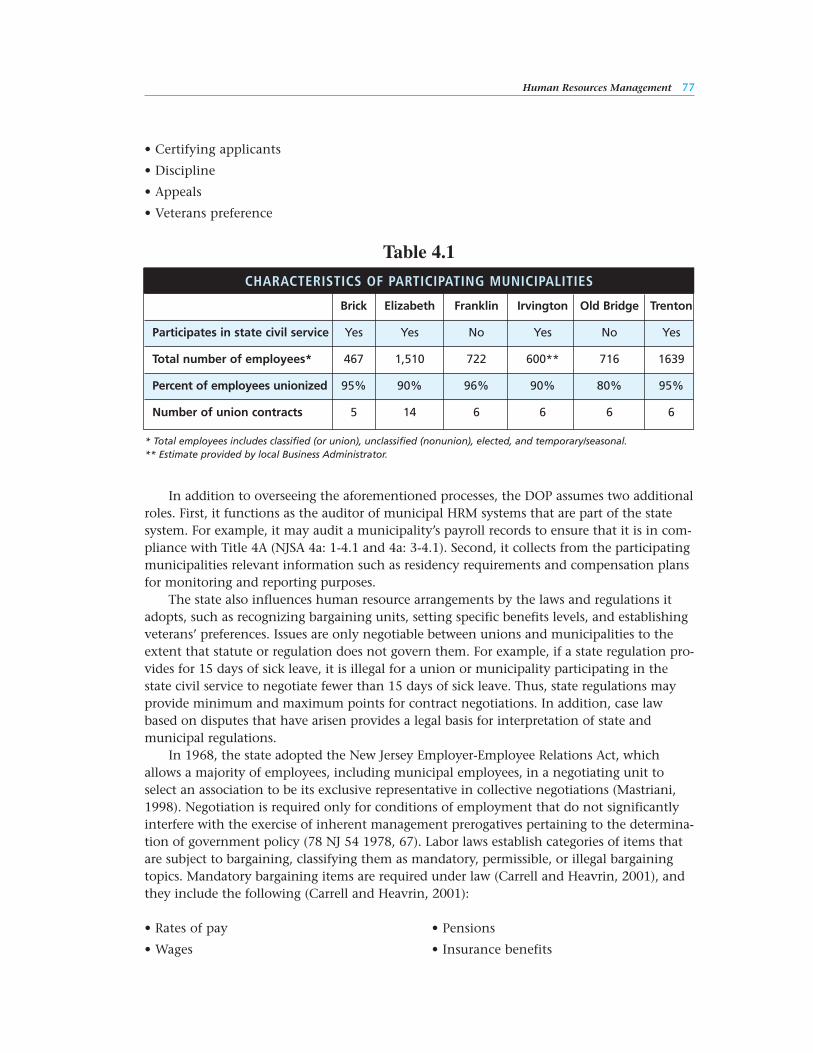
• Certifying applicants
• Discipline
• Appeals
• Veterans preference
In addition to overseeing the aforementioned processes, the DOP assumes two additionalroles. First, it functions as the auditor of municipal HRM systems that are part of the statesystem. For example, it may audit a municipality’s payroll records to ensure that it is in com-pliance with Title 4A (NJSA 4a: 1-4.1 and 4a: 3-4.1). Second, it collects from the participatingmunicipalities relevant information such as residency requirements and compensation plansfor monitoring and reporting purposes.
The state also influences human resource arrangements by the laws and regulations itadopts, such as recognizing bargaining units, setting specific benefits levels, and establishingveterans’ preferences. Issues are only negotiable between unions and municipalities to theextent that statute or regulation does not govern them. For example, if a state regulation pro-vides for 15 days of sick leave, it is illegal for a union or municipality participating in thestate civil service to negotiate fewer than 15 days of sick leave. Thus, state regulations mayprovide minimum and maximum points for contract negotiations. In addition, case lawbased on disputes that have arisen provides a legal basis for interpretation of state andmunicipal regulations.
In 1968, the state adopted the New Jersey Employer-Employee Relations Act, whichallows a majority of employees, including municipal employees, in a negotiating unit toselect an association to be its exclusive representative in collective negotiations (Mastriani,1998). Negotiation is required only for conditions of employment that do not significantlyinterfere with the exercise of inherent management prerogatives pertaining to the determina-tion of government policy (78 NJ 54 1978, 67). Labor laws establish categories of items thatare subject to bargaining, classifying them as mandatory, permissible, or illegal bargainingtopics. Mandatory bargaining items are required under law (Carrell and Heavrin, 2001), andthey include the following (Carrell and Heavrin, 2001):
• Rates of pay • Pensions
• Wages • Insurance benefits
Human Resources Management 77
* Total employees includes classified (or union), unclassified (nonunion), elected, and temporary/seasonal.** Estimate provided by local Business Administrator.
Table 4.1
CHARACTERISTICS OF PARTICIPATING MUNICIPALITIES
Brick Elizabeth Franklin Irvington Old Bridge Trenton
Participates in state civil service Yes Yes No Yes No Yes
Total number of employees* 467 1,510 722 600** 716 1639
Percent of employees unionized 95% 90% 96% 90% 80% 95%
Number of union contracts 5 14 6 6 6 6
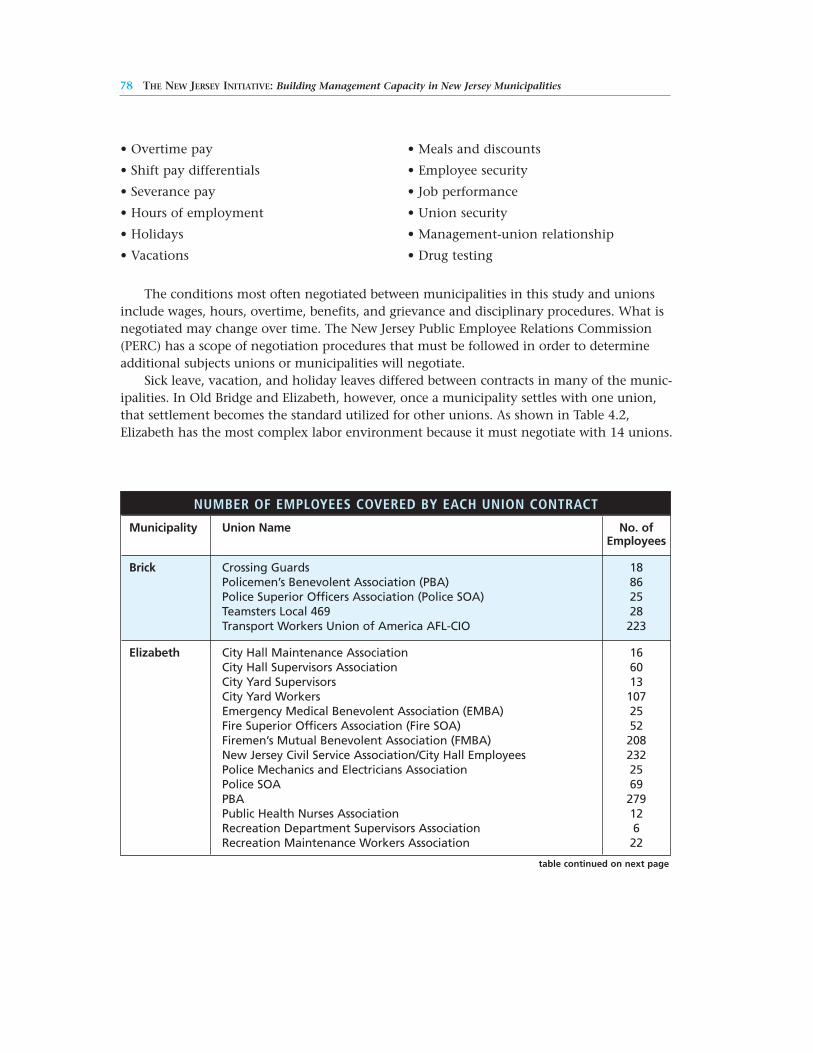
78 THE NEW JERSEY INITIATIVE: Building Management Capacity in New Jersey Municipalities
NUMBER OF EMPLOYEES COVERED BY EACH UNION CONTRACT
Municipality Union Name No. ofEmployees
Brick Crossing Guards 18Policemen’s Benevolent Association (PBA) 86Police Superior Officers Association (Police SOA) 25 Teamsters Local 469 28 Transport Workers Union of America AFL-CIO 223
Elizabeth City Hall Maintenance Association 16 City Hall Supervisors Association 60 City Yard Supervisors 13 City Yard Workers 107 Emergency Medical Benevolent Association (EMBA) 25 Fire Superior Officers Association (Fire SOA) 52 Firemen’s Mutual Benevolent Association (FMBA) 208 New Jersey Civil Service Association/City Hall Employees 232 Police Mechanics and Electricians Association 25 Police SOA 69 PBA 279 Public Health Nurses Association 12 Recreation Department Supervisors Association 6 Recreation Maintenance Workers Association 22
• Overtime pay • Meals and discounts
• Shift pay differentials • Employee security
• Severance pay • Job performance
• Hours of employment • Union security
• Holidays • Management-union relationship
• Vacations • Drug testing
The conditions most often negotiated between municipalities in this study and unionsinclude wages, hours, overtime, benefits, and grievance and disciplinary procedures. What isnegotiated may change over time. The New Jersey Public Employee Relations Commission(PERC) has a scope of negotiation procedures that must be followed in order to determineadditional subjects unions or municipalities will negotiate.
Sick leave, vacation, and holiday leaves differed between contracts in many of the munic-ipalities. In Old Bridge and Elizabeth, however, once a municipality settles with one union,that settlement becomes the standard utilized for other unions. As shown in Table 4.2,Elizabeth has the most complex labor environment because it must negotiate with 14 unions.
table continued on next page
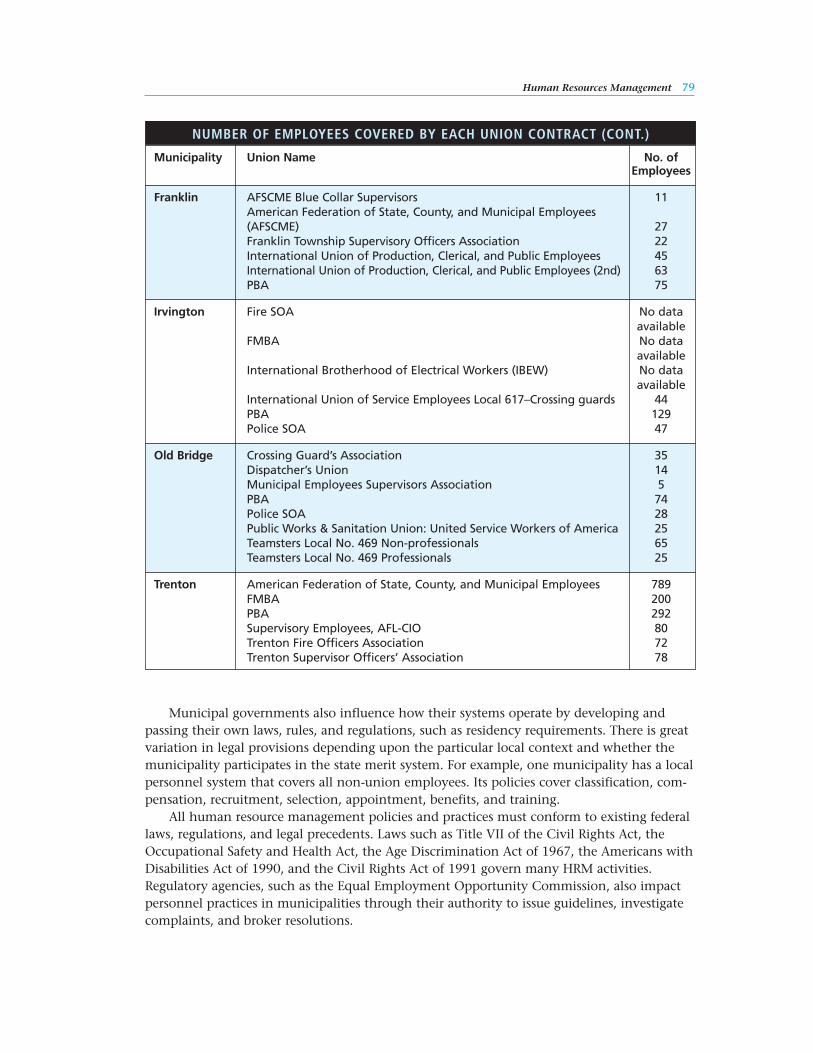
Human Resources Management 79
Municipal governments also influence how their systems operate by developing andpassing their own laws, rules, and regulations, such as residency requirements. There is greatvariation in legal provisions depending upon the particular local context and whether themunicipality participates in the state merit system. For example, one municipality has a localpersonnel system that covers all non-union employees. Its policies cover classification, com-pensation, recruitment, selection, appointment, benefits, and training.
All human resource management policies and practices must conform to existing federallaws, regulations, and legal precedents. Laws such as Title VII of the Civil Rights Act, theOccupational Safety and Health Act, the Age Discrimination Act of 1967, the Americans withDisabilities Act of 1990, and the Civil Rights Act of 1991 govern many HRM activities.Regulatory agencies, such as the Equal Employment Opportunity Commission, also impactpersonnel practices in municipalities through their authority to issue guidelines, investigatecomplaints, and broker resolutions.
NUMBER OF EMPLOYEES COVERED BY EACH UNION CONTRACT (CONT.)
Municipality Union Name No. ofEmployees
Franklin AFSCME Blue Collar Supervisors 11 American Federation of State, County, and Municipal Employees (AFSCME) 27 Franklin Township Supervisory Officers Association 22 International Union of Production, Clerical, and Public Employees 45 International Union of Production, Clerical, and Public Employees (2nd) 63 PBA 75
Irvington Fire SOA No data available
FMBA No data available
International Brotherhood of Electrical Workers (IBEW) No data available
International Union of Service Employees Local 617–Crossing guards 44 PBA 129 Police SOA 47
Old Bridge Crossing Guard’s Association 35 Dispatcher’s Union 14 Municipal Employees Supervisors Association 5 PBA 74 Police SOA 28 Public Works & Sanitation Union: United Service Workers of America 25 Teamsters Local No. 469 Non-professionals 65 Teamsters Local No. 469 Professionals 25
Trenton American Federation of State, County, and Municipal Employees 789 FMBA 200 PBA 292 Supervisory Employees, AFL-CIO 80 Trenton Fire Officers Association 72 Trenton Supervisor Officers’ Association 78
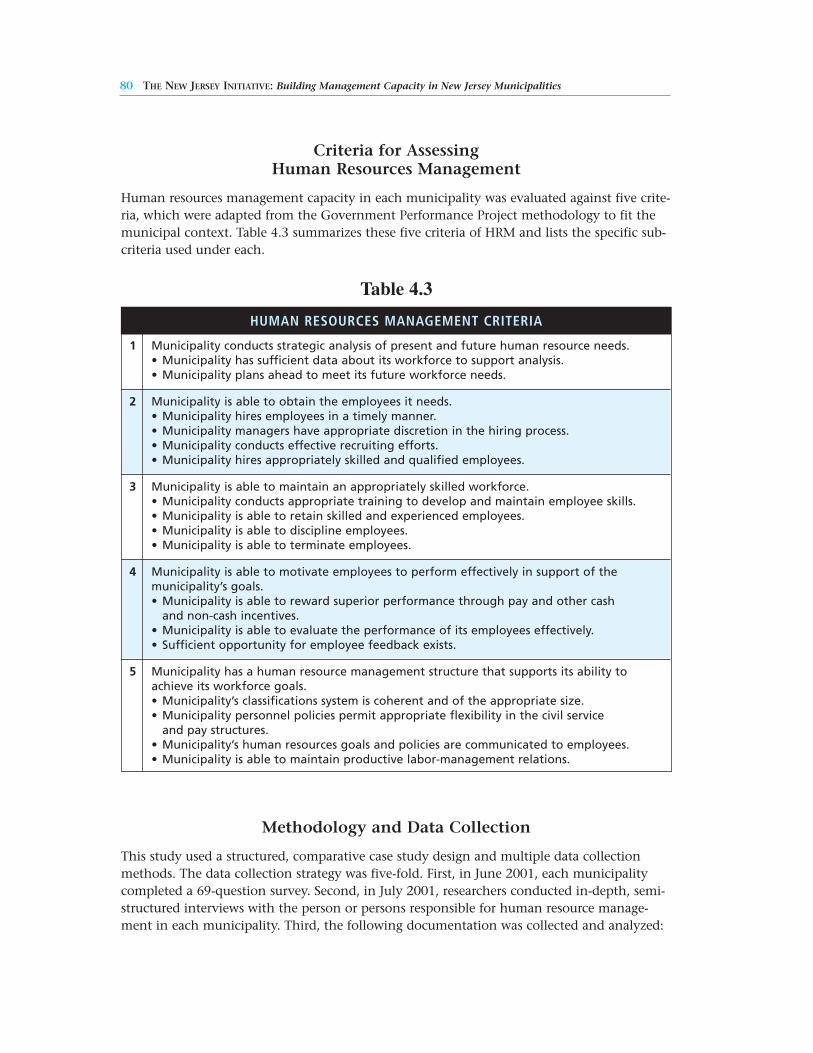
Criteria for Assessing Human Resources Management
Human resources management capacity in each municipality was evaluated against five crite-ria, which were adapted from the Government Performance Project methodology to fit themunicipal context. Table 4.3 summarizes these five criteria of HRM and lists the specific sub-criteria used under each.
Methodology and Data Collection
This study used a structured, comparative case study design and multiple data collectionmethods. The data collection strategy was five-fold. First, in June 2001, each municipalitycompleted a 69-question survey. Second, in July 2001, researchers conducted in-depth, semi-structured interviews with the person or persons responsible for human resource manage-ment in each municipality. Third, the following documentation was collected and analyzed:
HUMAN RESOURCES MANAGEMENT CRITERIA
1 Municipality conducts strategic analysis of present and future human resource needs.• Municipality has sufficient data about its workforce to support analysis.• Municipality plans ahead to meet its future workforce needs.
2 Municipality is able to obtain the employees it needs.• Municipality hires employees in a timely manner.• Municipality managers have appropriate discretion in the hiring process.• Municipality conducts effective recruiting efforts.• Municipality hires appropriately skilled and qualified employees.
3 Municipality is able to maintain an appropriately skilled workforce.• Municipality conducts appropriate training to develop and maintain employee skills.• Municipality is able to retain skilled and experienced employees.• Municipality is able to discipline employees.• Municipality is able to terminate employees.
4 Municipality is able to motivate employees to perform effectively in support of the municipality’s goals.• Municipality is able to reward superior performance through pay and other cash
and non-cash incentives.• Municipality is able to evaluate the performance of its employees effectively.• Sufficient opportunity for employee feedback exists.
5 Municipality has a human resource management structure that supports its ability to achieve its workforce goals.• Municipality’s classifications system is coherent and of the appropriate size.• Municipality personnel policies permit appropriate flexibility in the civil service
and pay structures.• Municipality’s human resources goals and policies are communicated to employees.• Municipality is able to maintain productive labor-management relations.
80 THE NEW JERSEY INITIATIVE: Building Management Capacity in New Jersey Municipalities
Table 4.3
Human Resources Management 81
• Human resource management regulation, policies, procedures, and laws
• HRM strategic and workforce plans
• Training catalogue
• Compensation schedules
• Organization chart
• Annual reports
Fourth, researchers conducted follow-up phone interviews with the same officials in Januaryand February 2002 to clarify any questions in the initial analysis of the interview, survey, anddocuments. Fifth, each municipality’s web page was reviewed.
Initial interviews were conducted with all seven participating municipalities. Surveys anddocuments were collected and web analyses and follow-up interviews were conducted withsix of the seven municipalities.
Results: Human Resources Management in New Jersey Municipalities
This section is divided into two components. The first discusses the role and structure of thehuman resource management offices, and the second identifies key findings with respect tothe five HRM criteria.
Structure and Role of the Human Resources Management Office
The role of the HRM office has been changing in the field from a preoccupation with polic-ing the merit system and municipal rules to a broader human resources focus that empha-sizes collaboration and partnership in helping leaders and managersachieve governmental and agency goals (Selden, Ingraham, Jacobson,2001; U.S. GAO, 2002). In shedding this image, however, HR depart-ments still need to ensure that required routine work, such as main-taining records, is done well. While HRM has been largely an adminis-trative function in public organizations, its role has changed to incor-porate many other facets, including strategic planning, conflict resolu-tion, and change management (Mello, 2000).
This study suggests that these New Jersey municipalities continueto adhere to a more traditional model of personnel management (see Table 4.4). In most ofthe municipalities, human resource management is considered a support function that is sep-arate and subordinate to the municipality’s planning activities. In these municipalities, thepersonnel office is largely process- and compliance-oriented. Many of its responsibilitiesinvolve administration of employee benefits, processing forms with the state Department ofPersonnel, and working with union representatives. Payroll tends to be handled separately bya different division.
...these New Jerseymunicipalities
continue to adhere to a more traditional
model of personnelmanagement.
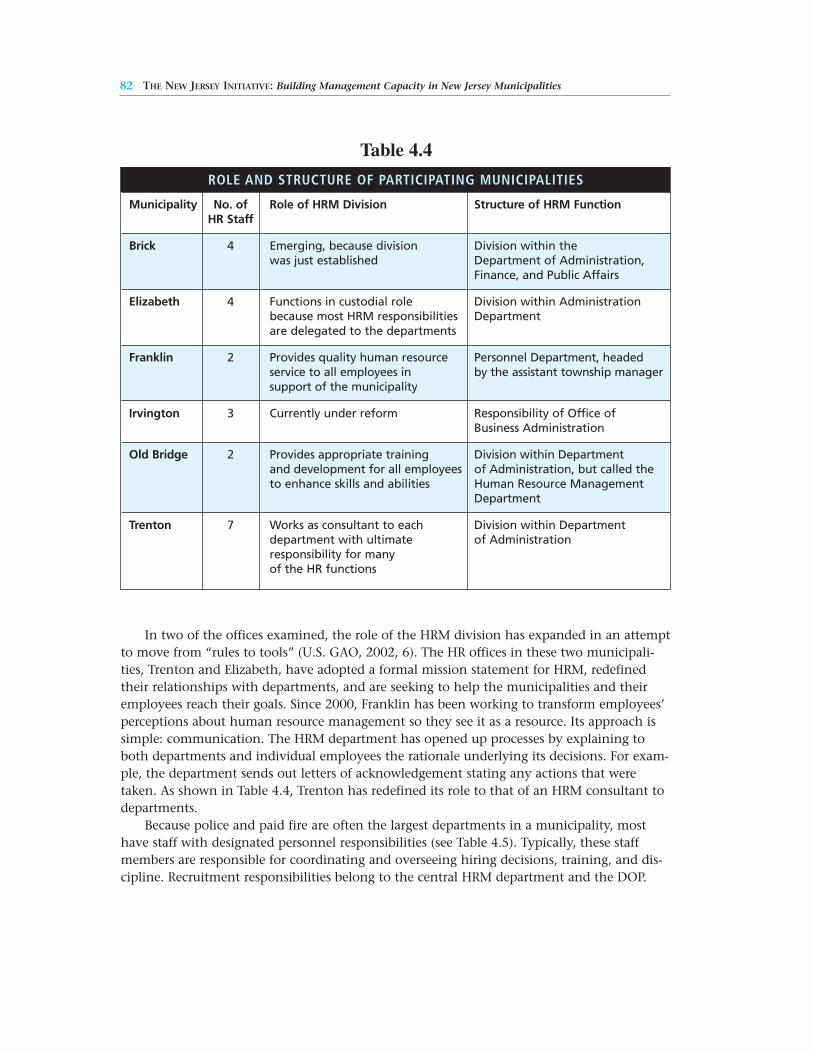
82 THE NEW JERSEY INITIATIVE: Building Management Capacity in New Jersey Municipalities
ROLE AND STRUCTURE OF PARTICIPATING MUNICIPALITIES
Municipality No. of Role of HRM Division Structure of HRM FunctionHR Staff
Brick 4 Emerging, because division Division within the was just established Department of Administration,
Finance, and Public Affairs
Elizabeth 4 Functions in custodial role Division within Administrationbecause most HRM responsibilities Departmentare delegated to the departments
Franklin 2 Provides quality human resource Personnel Department, headed service to all employees in by the assistant township manager support of the municipality
Irvington 3 Currently under reform Responsibility of Office of Business Administration
Old Bridge 2 Provides appropriate training Division within Departmentand development for all employees of Administration, but called theto enhance skills and abilities Human Resource Management
Department
Trenton 7 Works as consultant to each Division within Departmentdepartment with ultimate of Administrationresponsibility for many of the HR functions
Table 4.4
In two of the offices examined, the role of the HRM division has expanded in an attemptto move from “rules to tools” (U.S. GAO, 2002, 6). The HR offices in these two municipali-ties, Trenton and Elizabeth, have adopted a formal mission statement for HRM, redefinedtheir relationships with departments, and are seeking to help the municipalities and theiremployees reach their goals. Since 2000, Franklin has been working to transform employees’perceptions about human resource management so they see it as a resource. Its approach issimple: communication. The HRM department has opened up processes by explaining toboth departments and individual employees the rationale underlying its decisions. For exam-ple, the department sends out letters of acknowledgement stating any actions that weretaken. As shown in Table 4.4, Trenton has redefined its role to that of an HRM consultant todepartments.
Because police and paid fire are often the largest departments in a municipality, mosthave staff with designated personnel responsibilities (see Table 4.5). Typically, these staffmembers are responsible for coordinating and overseeing hiring decisions, training, and dis-cipline. Recruitment responsibilities belong to the central HRM department and the DOP.
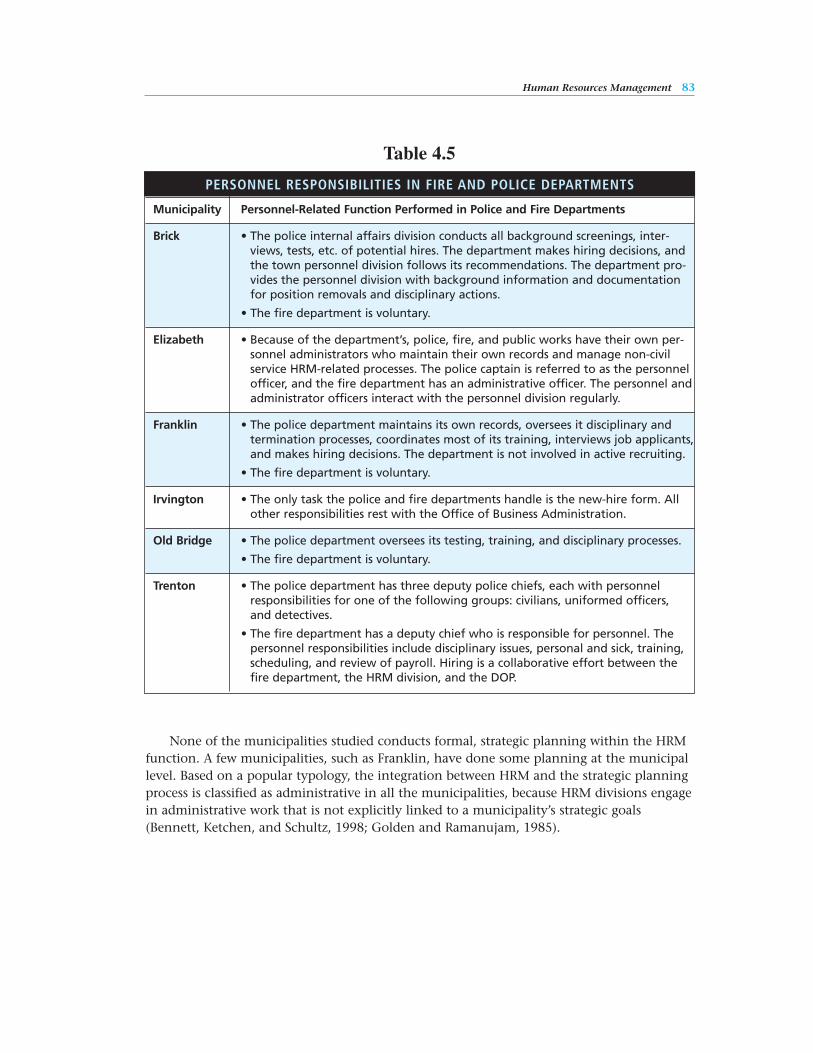
Human Resources Management 83
PERSONNEL RESPONSIBILITIES IN FIRE AND POLICE DEPARTMENTS
Municipality Personnel-Related Function Performed in Police and Fire Departments
Brick • The police internal affairs division conducts all background screenings, inter-views, tests, etc. of potential hires. The department makes hiring decisions, andthe town personnel division follows its recommendations. The department pro-vides the personnel division with background information and documentationfor position removals and disciplinary actions.
• The fire department is voluntary.
Elizabeth • Because of the department’s, police, fire, and public works have their own per-sonnel administrators who maintain their own records and manage non-civilservice HRM-related processes. The police captain is referred to as the personnelofficer, and the fire department has an administrative officer. The personnel andadministrator officers interact with the personnel division regularly.
Franklin • The police department maintains its own records, oversees it disciplinary andtermination processes, coordinates most of its training, interviews job applicants,and makes hiring decisions. The department is not involved in active recruiting.
• The fire department is voluntary.
Irvington • The only task the police and fire departments handle is the new-hire form. Allother responsibilities rest with the Office of Business Administration.
Old Bridge • The police department oversees its testing, training, and disciplinary processes.
• The fire department is voluntary.
Trenton • The police department has three deputy police chiefs, each with personnelresponsibilities for one of the following groups: civilians, uniformed officers, and detectives.
• The fire department has a deputy chief who is responsible for personnel. Thepersonnel responsibilities include disciplinary issues, personal and sick, training,scheduling, and review of payroll. Hiring is a collaborative effort between thefire department, the HRM division, and the DOP.
Table 4.5
None of the municipalities studied conducts formal, strategic planning within the HRMfunction. A few municipalities, such as Franklin, have done some planning at the municipallevel. Based on a popular typology, the integration between HRM and the strategic planningprocess is classified as administrative in all the municipalities, because HRM divisions engagein administrative work that is not explicitly linked to a municipality’s strategic goals(Bennett, Ketchen, and Schultz, 1998; Golden and Ramanujam, 1985).
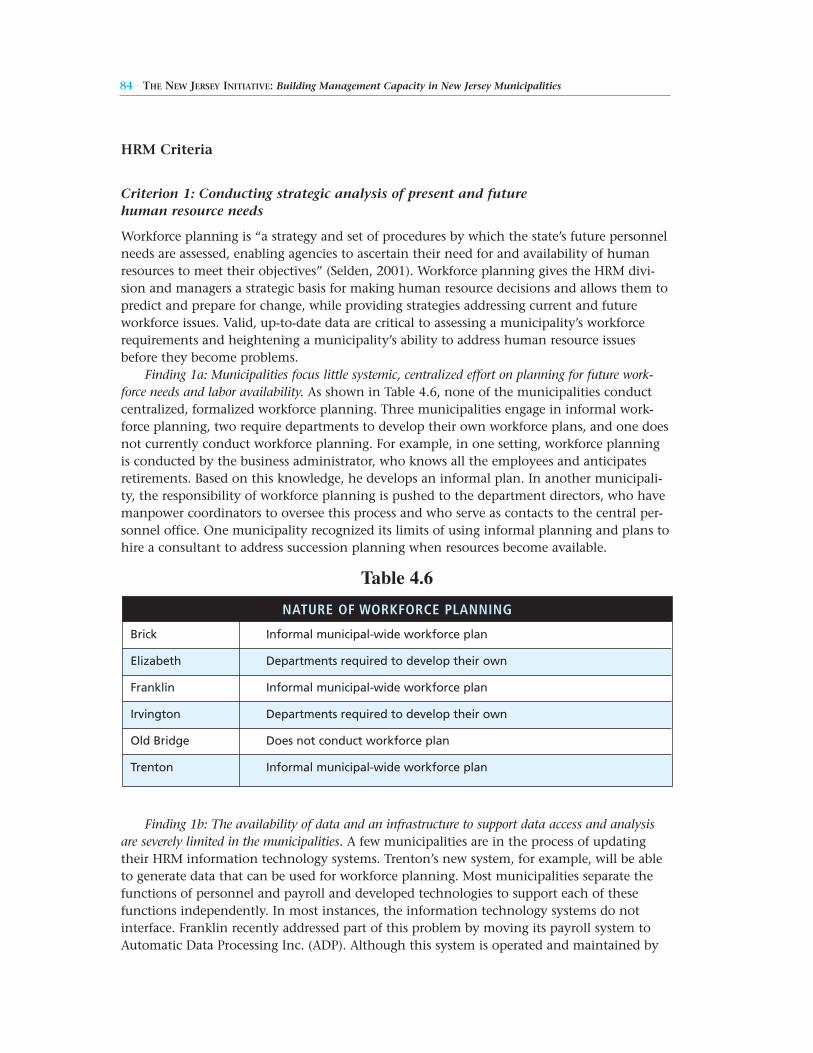
84 THE NEW JERSEY INITIATIVE: Building Management Capacity in New Jersey Municipalities
NATURE OF WORKFORCE PLANNING
Brick Informal municipal-wide workforce plan
Elizabeth Departments required to develop their own
Franklin Informal municipal-wide workforce plan
Irvington Departments required to develop their own
Old Bridge Does not conduct workforce plan
Trenton Informal municipal-wide workforce plan
Table 4.6
HRM Criteria
Criterion 1: Conducting strategic analysis of present and future human resource needs
Workforce planning is “a strategy and set of procedures by which the state’s future personnelneeds are assessed, enabling agencies to ascertain their need for and availability of humanresources to meet their objectives” (Selden, 2001). Workforce planning gives the HRM divi-sion and managers a strategic basis for making human resource decisions and allows them topredict and prepare for change, while providing strategies addressing current and futureworkforce issues. Valid, up-to-date data are critical to assessing a municipality’s workforcerequirements and heightening a municipality’s ability to address human resource issuesbefore they become problems.
Finding 1a: Municipalities focus little systemic, centralized effort on planning for future work-force needs and labor availability. As shown in Table 4.6, none of the municipalities conductcentralized, formalized workforce planning. Three municipalities engage in informal work-force planning, two require departments to develop their own workforce plans, and one doesnot currently conduct workforce planning. For example, in one setting, workforce planningis conducted by the business administrator, who knows all the employees and anticipatesretirements. Based on this knowledge, he develops an informal plan. In another municipali-ty, the responsibility of workforce planning is pushed to the department directors, who havemanpower coordinators to oversee this process and who serve as contacts to the central per-sonnel office. One municipality recognized its limits of using informal planning and plans tohire a consultant to address succession planning when resources become available.
Finding 1b: The availability of data and an infrastructure to support data access and analysisare severely limited in the municipalities. A few municipalities are in the process of updatingtheir HRM information technology systems. Trenton’s new system, for example, will be ableto generate data that can be used for workforce planning. Most municipalities separate thefunctions of personnel and payroll and developed technologies to support each of thesefunctions independently. In most instances, the information technology systems do notinterface. Franklin recently addressed part of this problem by moving its payroll system toAutomatic Data Processing Inc. (ADP). Although this system is operated and maintained by
Human Resources Management 85
the finance department, the HRM department is able to access and utilize payroll data.Currently, many of Franklin’s other HRM records are retained in a separate system. In onemunicipality, the personnel records are maintained in hard copy; that is, they are not auto-mated.
In addition, the web is underutilized as a communications tool by municipalities to dis-seminate HRM-related information to existing or prospective employees. Three municipali-ties have no HRM information posted on their web page. Of the three remaining municipali-ties, one provides the name of the key personnel officer, but does not list an e-mail address.Another lists the job descriptions of open positions, provides and accepts job applicationsonline, and provides HRM contact information. The final municipality, Trenton, provides athorough and comprehensive description of the division’s role and responsibilities, as well asproviding downloadable employment and internship applications.
Criterion 2: Hiring a skilled workforce
The recruiting function represents one of the important elements of hiring a skilled work-force. Effective recruiting practices can have a significant, positive impact on a department’sability to achieve its goals, whereas poorly designed and executed recruiting strategies willhave both short-term and long-term negative effects (Ulrich, 1997a). Recruiting involves allof the various activities aimed at attracting candidates to work in the municipality, such asrecruitment planning, internal and external recruiting efforts, and special programs, such asinternships. The selection process typically involves processing applicants until selectiondecisions are made and the municipality employs the individuals. While an effective recruit-ing process will bring an adequate supply of qualified candidates, an effective selectionprocess will identify the best candidates from a pool of applicants. Selection involves screen-ing methods, tests, interviews, decision-making, and employment processing.
Finding 2a: Clear distinctions in the selection processes emerged between civil service and nonciv-il service municipalities: civil service municipalities appoint employees provisionally and utilize moretesting. For municipalities participating in civil service, the state is granted primary responsi-bility for the function of recruiting and for much of the selection process. The state posts jobannouncements, administers exams when needed, and generates certified lists from whichmunicipalities select their candidates. This process can be completed quickly if an existingand current certified list exists, or it could take considerable time if a test has to be called. Inthese instances, municipalities may elect to advertise the position locally and hire someoneprovisionally for up to one year, while they wait for the DOP to test and certify applicants.Individuals hired provisionally can then compete for the permanent position advertised bythe DOP. According to the municipalities, the goal is that provisional employees will becomepermanent. However, provisional employees can be eliminated from the competition if theydo not have an examination score ranked in the top three. All municipalities participating inthe civil service hire provisional employees for at least some positions (see Table 4.7).
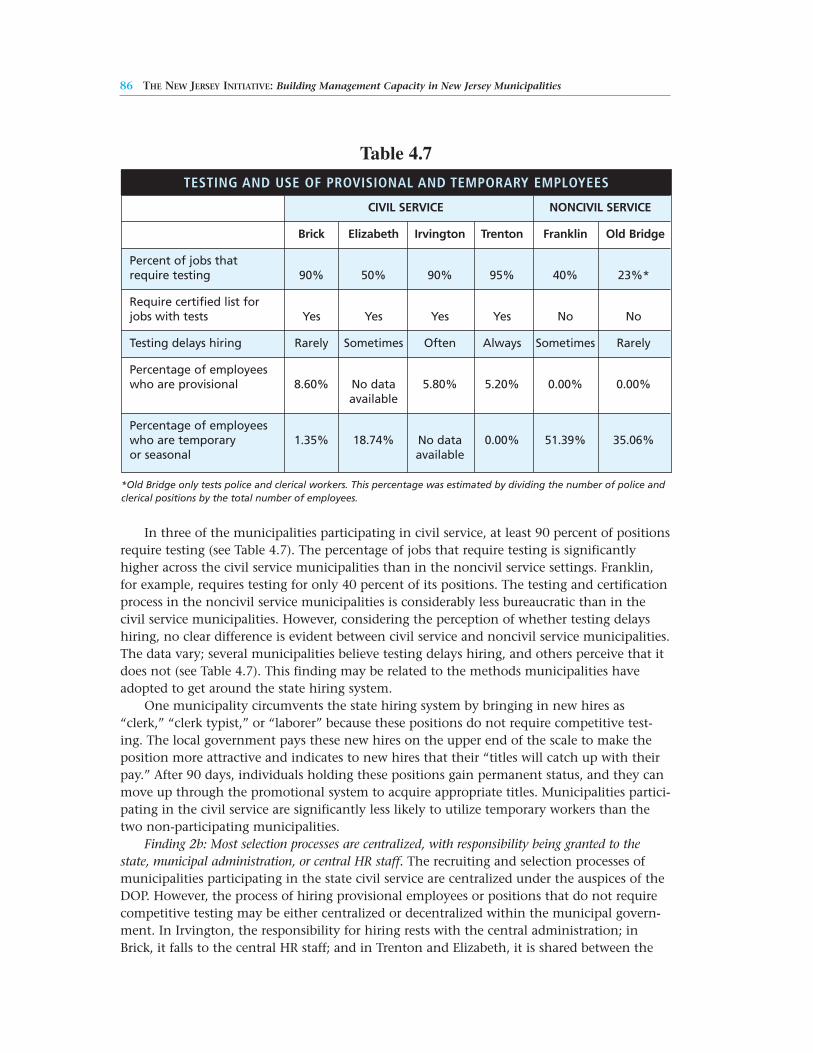
86 THE NEW JERSEY INITIATIVE: Building Management Capacity in New Jersey Municipalities
Table 4.7
*Old Bridge only tests police and clerical workers. This percentage was estimated by dividing the number of police andclerical positions by the total number of employees.
In three of the municipalities participating in civil service, at least 90 percent of positionsrequire testing (see Table 4.7). The percentage of jobs that require testing is significantlyhigher across the civil service municipalities than in the noncivil service settings. Franklin,for example, requires testing for only 40 percent of its positions. The testing and certificationprocess in the noncivil service municipalities is considerably less bureaucratic than in thecivil service municipalities. However, considering the perception of whether testing delayshiring, no clear difference is evident between civil service and noncivil service municipalities.The data vary; several municipalities believe testing delays hiring, and others perceive that itdoes not (see Table 4.7). This finding may be related to the methods municipalities haveadopted to get around the state hiring system.
One municipality circumvents the state hiring system by bringing in new hires as“clerk,” “clerk typist,” or “laborer” because these positions do not require competitive test-ing. The local government pays these new hires on the upper end of the scale to make theposition more attractive and indicates to new hires that their “titles will catch up with theirpay.” After 90 days, individuals holding these positions gain permanent status, and they canmove up through the promotional system to acquire appropriate titles. Municipalities partici-pating in the civil service are significantly less likely to utilize temporary workers than thetwo non-participating municipalities.
Finding 2b: Most selection processes are centralized, with responsibility being granted to thestate, municipal administration, or central HR staff. The recruiting and selection processes ofmunicipalities participating in the state civil service are centralized under the auspices of theDOP. However, the process of hiring provisional employees or positions that do not requirecompetitive testing may be either centralized or decentralized within the municipal govern-ment. In Irvington, the responsibility for hiring rests with the central administration; inBrick, it falls to the central HR staff; and in Trenton and Elizabeth, it is shared between the
TESTING AND USE OF PROVISIONAL AND TEMPORARY EMPLOYEES
CIVIL SERVICE NONCIVIL SERVICE
Brick Elizabeth Irvington Trenton Franklin Old Bridge
Percent of jobs that require testing 90% 50% 90% 95% 40% 23%*
Require certified list for jobs with tests Yes Yes Yes Yes No No
Testing delays hiring Rarely Sometimes Often Always Sometimes Rarely
Percentage of employees who are provisional 8.60% No data 5.80% 5.20% 0.00% 0.00%
available
Percentage of employees who are temporary 1.35% 18.74% No data 0.00% 51.39% 35.06% or seasonal available
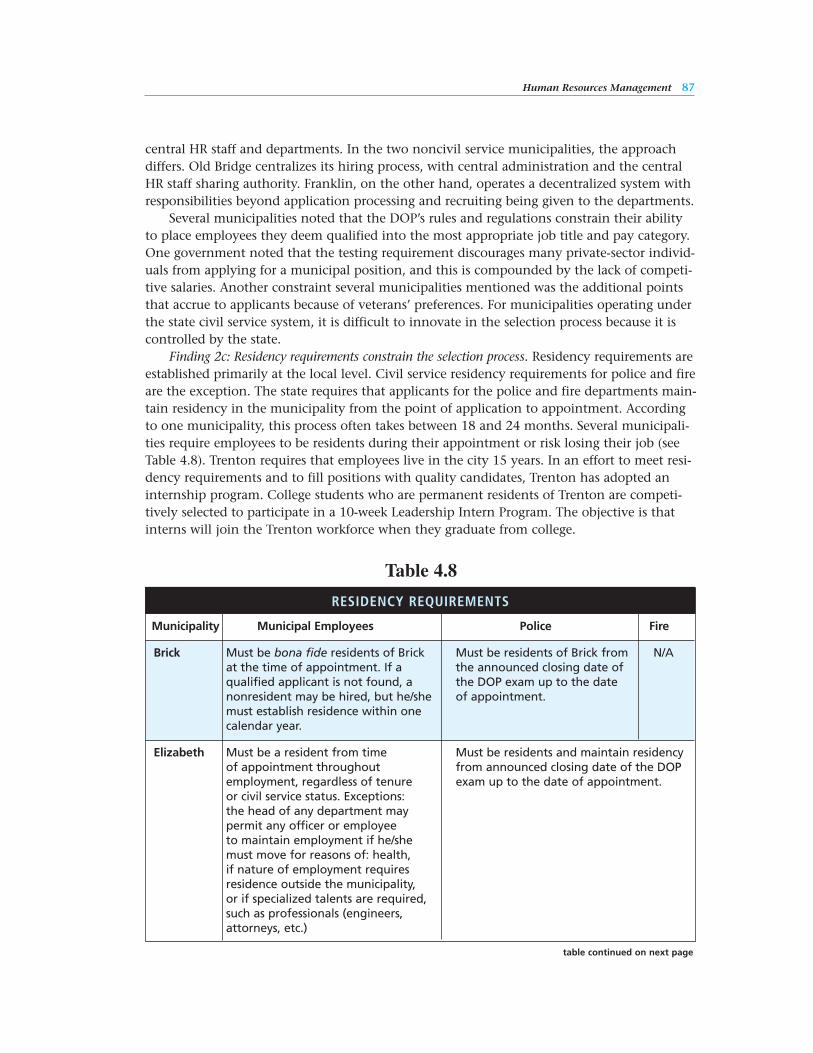
Human Resources Management 87
table continued on next page
central HR staff and departments. In the two noncivil service municipalities, the approachdiffers. Old Bridge centralizes its hiring process, with central administration and the centralHR staff sharing authority. Franklin, on the other hand, operates a decentralized system withresponsibilities beyond application processing and recruiting being given to the departments.
Several municipalities noted that the DOP’s rules and regulations constrain their abilityto place employees they deem qualified into the most appropriate job title and pay category.One government noted that the testing requirement discourages many private-sector individ-uals from applying for a municipal position, and this is compounded by the lack of competi-tive salaries. Another constraint several municipalities mentioned was the additional pointsthat accrue to applicants because of veterans’ preferences. For municipalities operating underthe state civil service system, it is difficult to innovate in the selection process because it iscontrolled by the state.
Finding 2c: Residency requirements constrain the selection process. Residency requirements areestablished primarily at the local level. Civil service residency requirements for police and fireare the exception. The state requires that applicants for the police and fire departments main-tain residency in the municipality from the point of application to appointment. Accordingto one municipality, this process often takes between 18 and 24 months. Several municipali-ties require employees to be residents during their appointment or risk losing their job (seeTable 4.8). Trenton requires that employees live in the city 15 years. In an effort to meet resi-dency requirements and to fill positions with quality candidates, Trenton has adopted aninternship program. College students who are permanent residents of Trenton are competi-tively selected to participate in a 10-week Leadership Intern Program. The objective is thatinterns will join the Trenton workforce when they graduate from college.
RESIDENCY REQUIREMENTS
Municipality Municipal Employees Police Fire
Brick Must be bona fide residents of Brick Must be residents of Brick from N/A at the time of appointment. If a the announced closing date of qualified applicant is not found, a the DOP exam up to the date nonresident may be hired, but he/she of appointment.must establish residence within one calendar year.
Elizabeth Must be a resident from time Must be residents and maintain residencyof appointment throughout from announced closing date of the DOPemployment, regardless of tenure exam up to the date of appointment.or civil service status. Exceptions: the head of any department may permit any officer or employee to maintain employment if he/she must move for reasons of: health, if nature of employment requires residence outside the municipality, or if specialized talents are required, such as professionals (engineers, attorneys, etc.)
Table 4.8
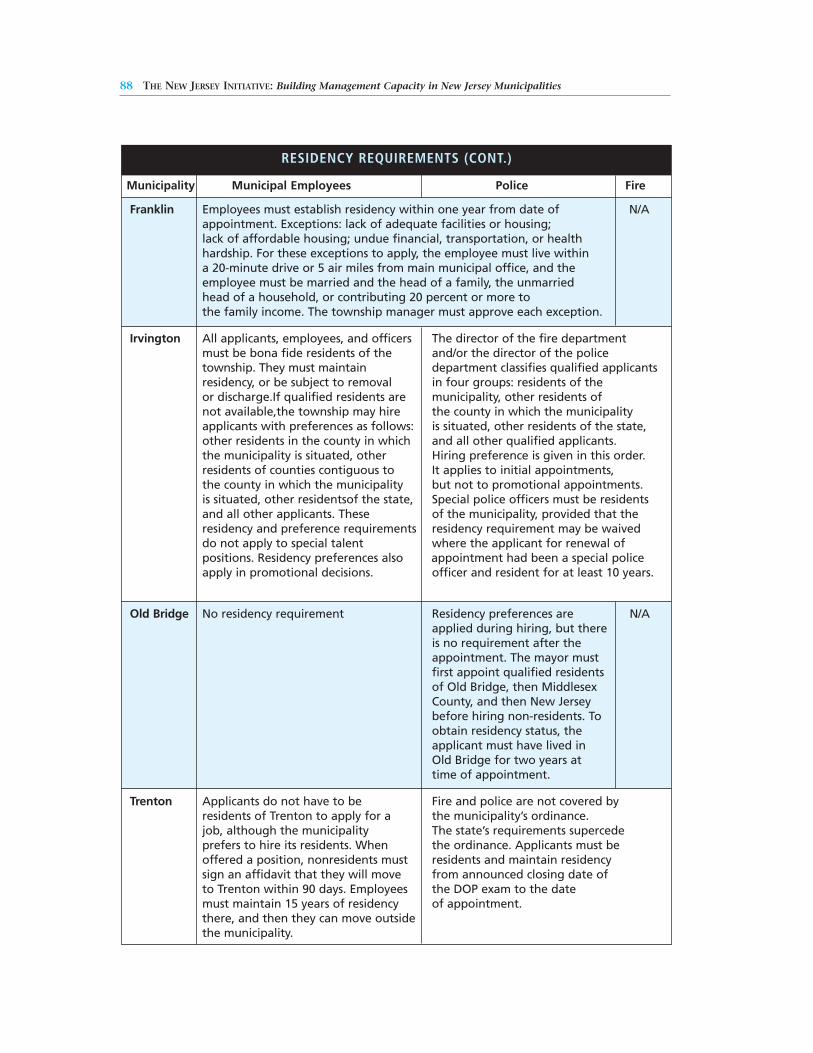
88 THE NEW JERSEY INITIATIVE: Building Management Capacity in New Jersey Municipalities
RESIDENCY REQUIREMENTS (CONT.)
Municipality Municipal Employees Police Fire
Franklin Employees must establish residency within one year from date of N/A appointment. Exceptions: lack of adequate facilities or housing; lack of affordable housing; undue financial, transportation, or health hardship. For these exceptions to apply, the employee must live within a 20-minute drive or 5 air miles from main municipal office, and the employee must be married and the head of a family, the unmarried head of a household, or contributing 20 percent or more to the family income. The township manager must approve each exception.
Irvington All applicants, employees, and officers The director of the fire departmentmust be bona fide residents of the and/or the director of the police township. They must maintain department classifies qualified applicantsresidency, or be subject to removal in four groups: residents of theor discharge.If qualified residents are municipality, other residents ofnot available,the township may hire the county in which the municipalityapplicants with preferences as follows: is situated, other residents of the state,other residents in the county in which and all other qualified applicants.the municipality is situated, other Hiring preference is given in this order.residents of counties contiguous to It applies to initial appointments,the county in which the municipality but not to promotional appointments.is situated, other residentsof the state, Special police officers must be residentsand all other applicants. These of the municipality, provided that theresidency and preference requirements residency requirement may be waiveddo not apply to special talent where the applicant for renewal ofpositions. Residency preferences also appointment had been a special policeapply in promotional decisions. officer and resident for at least 10 years.
Old Bridge No residency requirement Residency preferences are N/Aapplied during hiring, but there is no requirement after the appointment. The mayor must first appoint qualified residents of Old Bridge, then Middlesex County, and then New Jersey before hiring non-residents. To obtain residency status, the applicant must have lived in Old Bridge for two years at time of appointment.
Trenton Applicants do not have to be Fire and police are not covered byresidents of Trenton to apply for a the municipality’s ordinance.job, although the municipality The state’s requirements supercedeprefers to hire its residents. When the ordinance. Applicants must be offered a position, nonresidents must residents and maintain residencysign an affidavit that they will move from announced closing date of to Trenton within 90 days. Employees the DOP exam to the datemust maintain 15 years of residency of appointment.there, and then they can move outside the municipality.
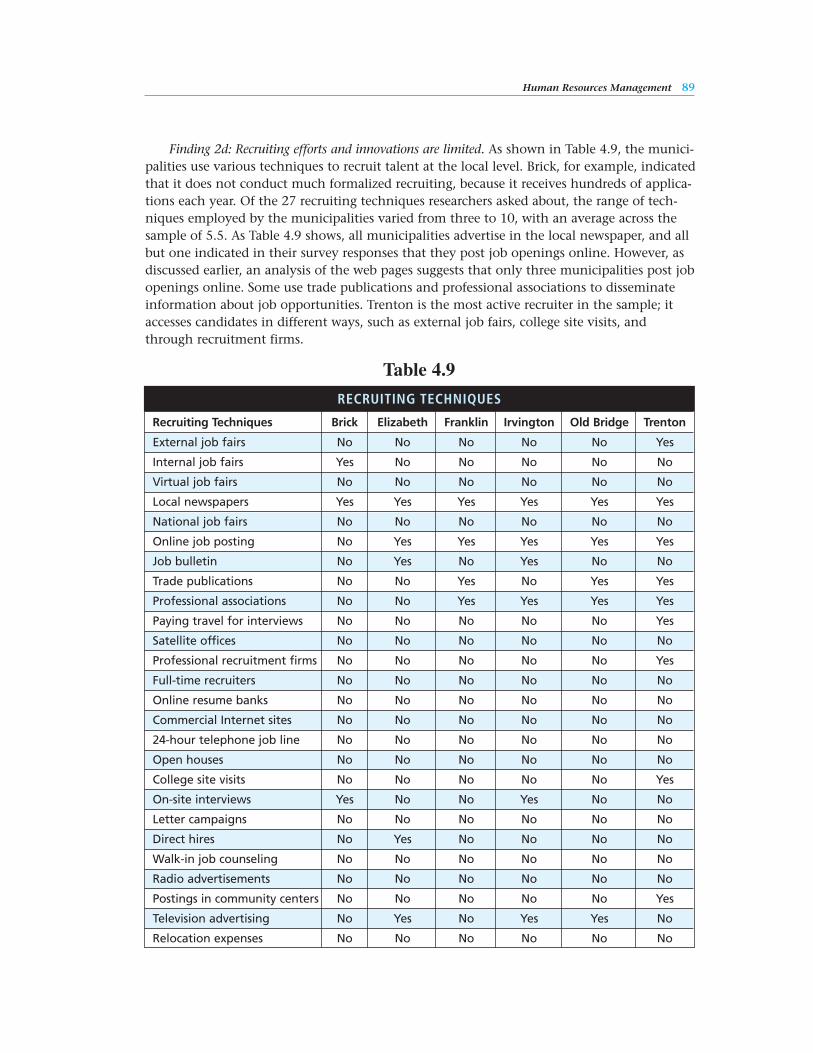
Human Resources Management 89
Finding 2d: Recruiting efforts and innovations are limited. As shown in Table 4.9, the munici-palities use various techniques to recruit talent at the local level. Brick, for example, indicatedthat it does not conduct much formalized recruiting, because it receives hundreds of applica-tions each year. Of the 27 recruiting techniques researchers asked about, the range of tech-niques employed by the municipalities varied from three to 10, with an average across thesample of 5.5. As Table 4.9 shows, all municipalities advertise in the local newspaper, and allbut one indicated in their survey responses that they post job openings online. However, asdiscussed earlier, an analysis of the web pages suggests that only three municipalities post jobopenings online. Some use trade publications and professional associations to disseminateinformation about job opportunities. Trenton is the most active recruiter in the sample; itaccesses candidates in different ways, such as external job fairs, college site visits, andthrough recruitment firms.
Table 4.9
RECRUITING TECHNIQUES
Recruiting Techniques Brick Elizabeth Franklin Irvington Old Bridge Trenton
External job fairs No No No No No Yes
Internal job fairs Yes No No No No No
Virtual job fairs No No No No No No
Local newspapers Yes Yes Yes Yes Yes Yes
National job fairs No No No No No No
Online job posting No Yes Yes Yes Yes Yes
Job bulletin No Yes No Yes No No
Trade publications No No Yes No Yes Yes
Professional associations No No Yes Yes Yes Yes
Paying travel for interviews No No No No No Yes
Satellite offices No No No No No No
Professional recruitment firms No No No No No Yes
Full-time recruiters No No No No No No
Online resume banks No No No No No No
Commercial Internet sites No No No No No No
24-hour telephone job line No No No No No No
Open houses No No No No No No
College site visits No No No No No Yes
On-site interviews Yes No No Yes No No
Letter campaigns No No No No No No
Direct hires No Yes No No No No
Walk-in job counseling No No No No No No
Radio advertisements No No No No No No
Postings in community centers No No No No No Yes
Television advertising No Yes No Yes Yes No
Relocation expenses No No No No No No
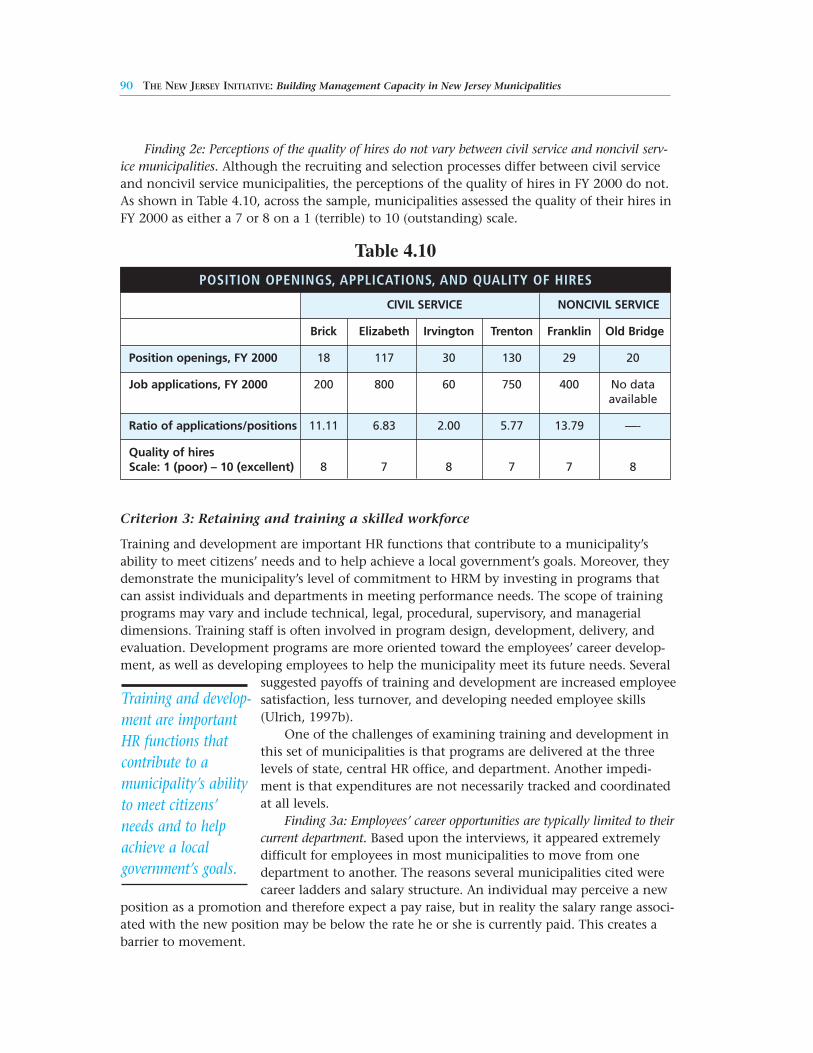
90 THE NEW JERSEY INITIATIVE: Building Management Capacity in New Jersey Municipalities
Finding 2e: Perceptions of the quality of hires do not vary between civil service and noncivil serv-ice municipalities. Although the recruiting and selection processes differ between civil serviceand noncivil service municipalities, the perceptions of the quality of hires in FY 2000 do not.As shown in Table 4.10, across the sample, municipalities assessed the quality of their hires inFY 2000 as either a 7 or 8 on a 1 (terrible) to 10 (outstanding) scale.
Criterion 3: Retaining and training a skilled workforce
Training and development are important HR functions that contribute to a municipality’sability to meet citizens’ needs and to help achieve a local government’s goals. Moreover, theydemonstrate the municipality’s level of commitment to HRM by investing in programs thatcan assist individuals and departments in meeting performance needs. The scope of trainingprograms may vary and include technical, legal, procedural, supervisory, and managerialdimensions. Training staff is often involved in program design, development, delivery, andevaluation. Development programs are more oriented toward the employees’ career develop-ment, as well as developing employees to help the municipality meet its future needs. Several
suggested payoffs of training and development are increased employeesatisfaction, less turnover, and developing needed employee skills(Ulrich, 1997b).
One of the challenges of examining training and development inthis set of municipalities is that programs are delivered at the threelevels of state, central HR office, and department. Another impedi-ment is that expenditures are not necessarily tracked and coordinatedat all levels.
Finding 3a: Employees’ career opportunities are typically limited to theircurrent department. Based upon the interviews, it appeared extremelydifficult for employees in most municipalities to move from onedepartment to another. The reasons several municipalities cited werecareer ladders and salary structure. An individual may perceive a new
position as a promotion and therefore expect a pay raise, but in reality the salary range associ-ated with the new position may be below the rate he or she is currently paid. This creates abarrier to movement.
Training and develop-ment are importantHR functions thatcontribute to amunicipality’s abilityto meet citizens’needs and to helpachieve a local government’s goals.
Table 4.10
POSITION OPENINGS, APPLICATIONS, AND QUALITY OF HIRES
CIVIL SERVICE NONCIVIL SERVICE
Brick Elizabeth Irvington Trenton Franklin Old Bridge
Position openings, FY 2000 18 117 30 130 29 20
Job applications, FY 2000 200 800 60 750 400 No data available
Ratio of applications/positions 11.11 6.83 2.00 5.77 13.79 —-
Quality of hiresScale: 1 (poor) – 10 (excellent) 8 7 8 7 7 8
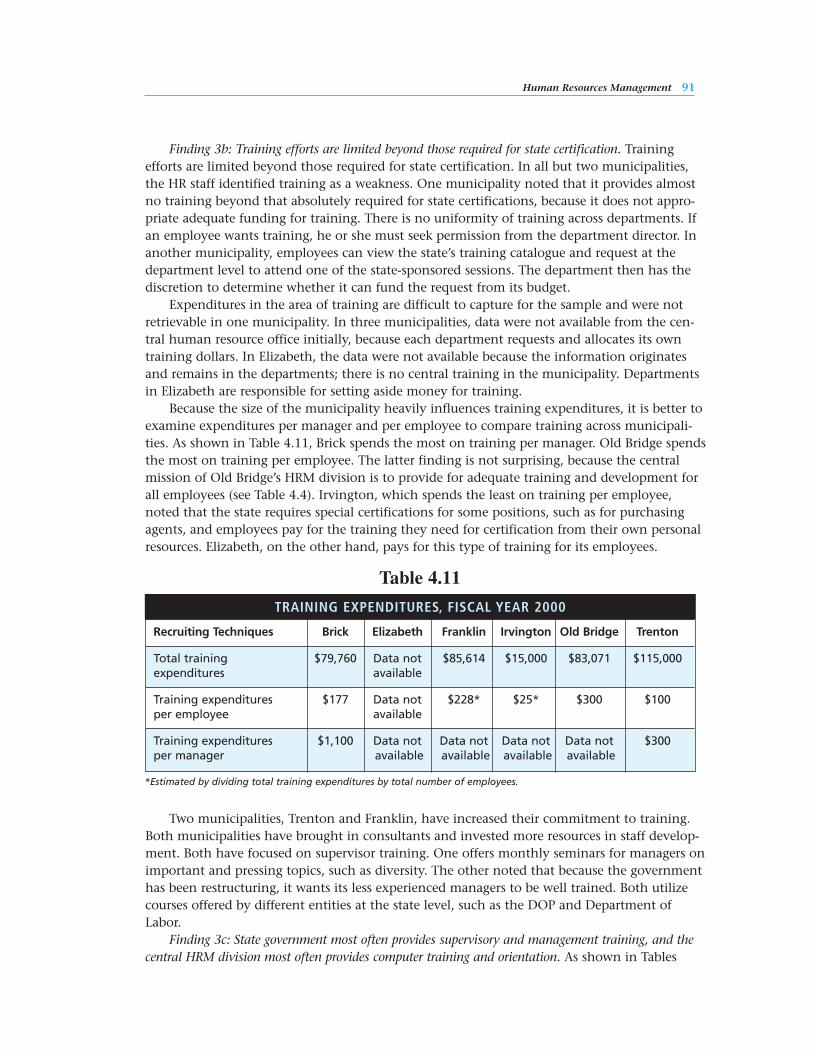
Human Resources Management 91
Finding 3b: Training efforts are limited beyond those required for state certification. Trainingefforts are limited beyond those required for state certification. In all but two municipalities,the HR staff identified training as a weakness. One municipality noted that it provides almostno training beyond that absolutely required for state certifications, because it does not appro-priate adequate funding for training. There is no uniformity of training across departments. Ifan employee wants training, he or she must seek permission from the department director. Inanother municipality, employees can view the state’s training catalogue and request at thedepartment level to attend one of the state-sponsored sessions. The department then has thediscretion to determine whether it can fund the request from its budget.
Expenditures in the area of training are difficult to capture for the sample and were notretrievable in one municipality. In three municipalities, data were not available from the cen-tral human resource office initially, because each department requests and allocates its owntraining dollars. In Elizabeth, the data were not available because the information originatesand remains in the departments; there is no central training in the municipality. Departmentsin Elizabeth are responsible for setting aside money for training.
Because the size of the municipality heavily influences training expenditures, it is better toexamine expenditures per manager and per employee to compare training across municipali-ties. As shown in Table 4.11, Brick spends the most on training per manager. Old Bridge spendsthe most on training per employee. The latter finding is not surprising, because the centralmission of Old Bridge’s HRM division is to provide for adequate training and development forall employees (see Table 4.4). Irvington, which spends the least on training per employee,noted that the state requires special certifications for some positions, such as for purchasingagents, and employees pay for the training they need for certification from their own personalresources. Elizabeth, on the other hand, pays for this type of training for its employees.
Two municipalities, Trenton and Franklin, have increased their commitment to training.Both municipalities have brought in consultants and invested more resources in staff develop-ment. Both have focused on supervisor training. One offers monthly seminars for managers onimportant and pressing topics, such as diversity. The other noted that because the governmenthas been restructuring, it wants its less experienced managers to be well trained. Both utilizecourses offered by different entities at the state level, such as the DOP and Department ofLabor.
Finding 3c: State government most often provides supervisory and management training, and thecentral HRM division most often provides computer training and orientation. As shown in Tables
Table 4.11
*Estimated by dividing total training expenditures by total number of employees.
TRAINING EXPENDITURES, FISCAL YEAR 2000
Recruiting Techniques Brick Elizabeth Franklin Irvington Old Bridge Trenton
Total training $79,760 Data not $85,614 $15,000 $83,071 $115,000expenditures available
Training expenditures $177 Data not $228* $25* $300 $100per employee available
Training expenditures $1,100 Data not Data not Data not Data not $300per manager available available available available
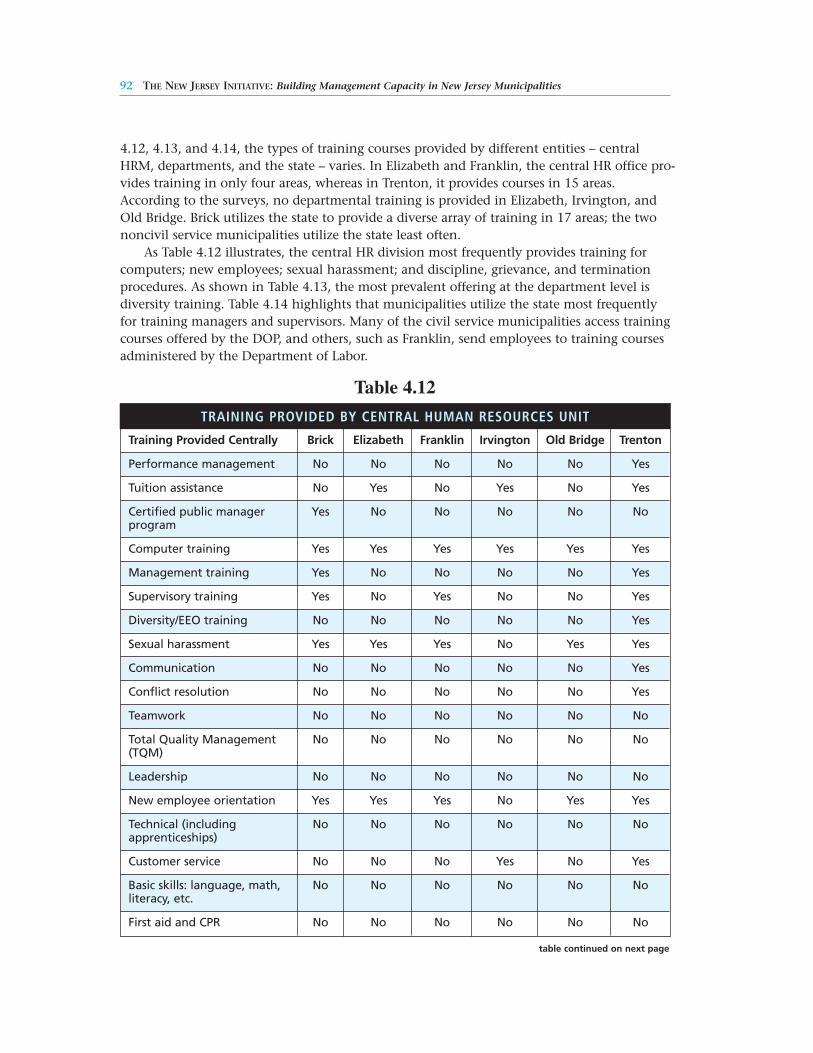
4.12, 4.13, and 4.14, the types of training courses provided by different entities – centralHRM, departments, and the state – varies. In Elizabeth and Franklin, the central HR office pro-vides training in only four areas, whereas in Trenton, it provides courses in 15 areas.According to the surveys, no departmental training is provided in Elizabeth, Irvington, andOld Bridge. Brick utilizes the state to provide a diverse array of training in 17 areas; the twononcivil service municipalities utilize the state least often.
As Table 4.12 illustrates, the central HR division most frequently provides training forcomputers; new employees; sexual harassment; and discipline, grievance, and terminationprocedures. As shown in Table 4.13, the most prevalent offering at the department level isdiversity training. Table 4.14 highlights that municipalities utilize the state most frequentlyfor training managers and supervisors. Many of the civil service municipalities access trainingcourses offered by the DOP, and others, such as Franklin, send employees to training coursesadministered by the Department of Labor.
92 THE NEW JERSEY INITIATIVE: Building Management Capacity in New Jersey Municipalities
Table 4.12
TRAINING PROVIDED BY CENTRAL HUMAN RESOURCES UNIT
Training Provided Centrally Brick Elizabeth Franklin Irvington Old Bridge Trenton
Performance management No No No No No Yes
Tuition assistance No Yes No Yes No Yes
Certified public manager Yes No No No No Noprogram
Computer training Yes Yes Yes Yes Yes Yes
Management training Yes No No No No Yes
Supervisory training Yes No Yes No No Yes
Diversity/EEO training No No No No No Yes
Sexual harassment Yes Yes Yes No Yes Yes
Communication No No No No No Yes
Conflict resolution No No No No No Yes
Teamwork No No No No No No
Total Quality Management No No No No No No(TQM)
Leadership No No No No No No
New employee orientation Yes Yes Yes No Yes Yes
Technical (including No No No No No Noapprenticeships)
Customer service No No No Yes No Yes
Basic skills: language, math, No No No No No Noliteracy, etc.
First aid and CPR No No No No No No
table continued on next page
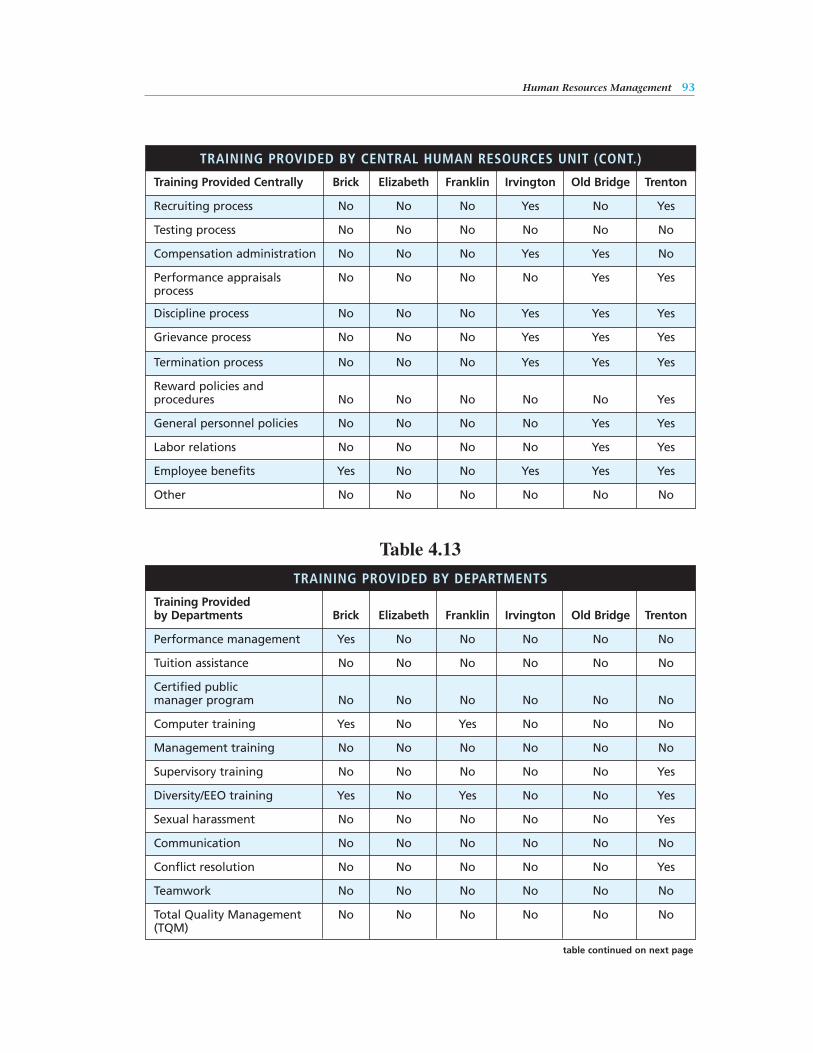
Human Resources Management 93
TRAINING PROVIDED BY CENTRAL HUMAN RESOURCES UNIT (CONT.)
Training Provided Centrally Brick Elizabeth Franklin Irvington Old Bridge Trenton
Recruiting process No No No Yes No Yes
Testing process No No No No No No
Compensation administration No No No Yes Yes No
Performance appraisals No No No No Yes Yesprocess
Discipline process No No No Yes Yes Yes
Grievance process No No No Yes Yes Yes
Termination process No No No Yes Yes Yes
Reward policies and procedures No No No No No Yes
General personnel policies No No No No Yes Yes
Labor relations No No No No Yes Yes
Employee benefits Yes No No Yes Yes Yes
Other No No No No No No
Table 4.13
TRAINING PROVIDED BY DEPARTMENTS
Training Provided by Departments Brick Elizabeth Franklin Irvington Old Bridge Trenton
Performance management Yes No No No No No
Tuition assistance No No No No No No
Certified public manager program No No No No No No
Computer training Yes No Yes No No No
Management training No No No No No No
Supervisory training No No No No No Yes
Diversity/EEO training Yes No Yes No No Yes
Sexual harassment No No No No No Yes
Communication No No No No No No
Conflict resolution No No No No No Yes
Teamwork No No No No No No
Total Quality Management No No No No No No(TQM)
table continued on next page
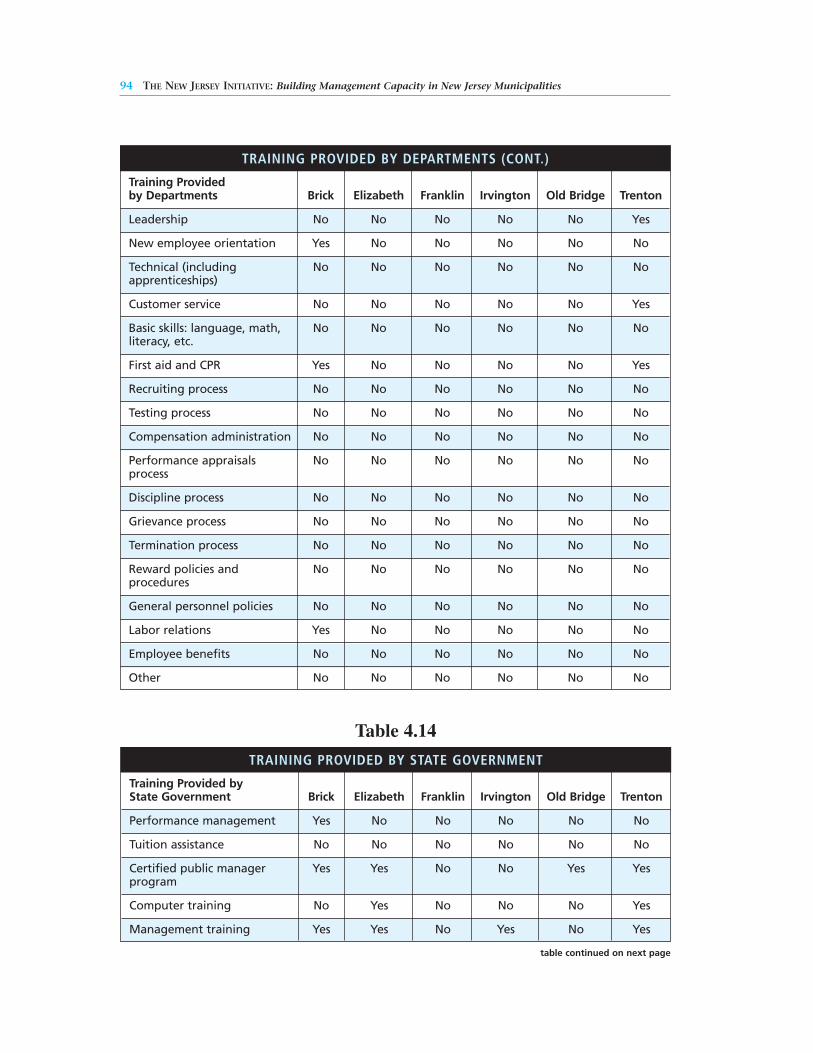
94 THE NEW JERSEY INITIATIVE: Building Management Capacity in New Jersey Municipalities
TRAINING PROVIDED BY DEPARTMENTS (CONT.)
Training Provided by Departments Brick Elizabeth Franklin Irvington Old Bridge Trenton
Leadership No No No No No Yes
New employee orientation Yes No No No No No
Technical (including No No No No No Noapprenticeships)
Customer service No No No No No Yes
Basic skills: language, math, No No No No No Noliteracy, etc.
First aid and CPR Yes No No No No Yes
Recruiting process No No No No No No
Testing process No No No No No No
Compensation administration No No No No No No
Performance appraisals No No No No No Noprocess
Discipline process No No No No No No
Grievance process No No No No No No
Termination process No No No No No No
Reward policies and No No No No No Noprocedures
General personnel policies No No No No No No
Labor relations Yes No No No No No
Employee benefits No No No No No No
Other No No No No No No
Table 4.14
TRAINING PROVIDED BY STATE GOVERNMENT
Training Provided byState Government Brick Elizabeth Franklin Irvington Old Bridge Trenton
Performance management Yes No No No No No
Tuition assistance No No No No No No
Certified public manager Yes Yes No No Yes Yesprogram
Computer training No Yes No No No Yes
Management training Yes Yes No Yes No Yes
table continued on next page
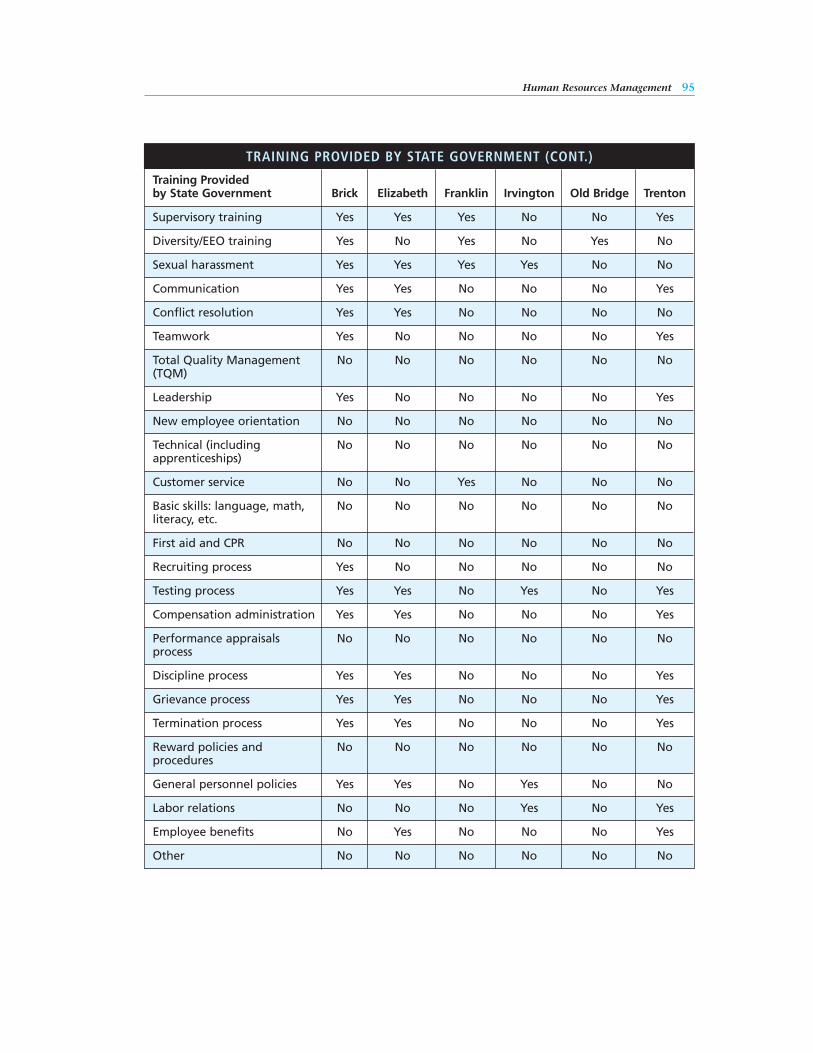
Human Resources Management 95
TRAINING PROVIDED BY STATE GOVERNMENT (CONT.)
Training Provided by State Government Brick Elizabeth Franklin Irvington Old Bridge Trenton
Supervisory training Yes Yes Yes No No Yes
Diversity/EEO training Yes No Yes No Yes No
Sexual harassment Yes Yes Yes Yes No No
Communication Yes Yes No No No Yes
Conflict resolution Yes Yes No No No No
Teamwork Yes No No No No Yes
Total Quality Management No No No No No No(TQM)
Leadership Yes No No No No Yes
New employee orientation No No No No No No
Technical (including No No No No No Noapprenticeships)
Customer service No No Yes No No No
Basic skills: language, math, No No No No No Noliteracy, etc.
First aid and CPR No No No No No No
Recruiting process Yes No No No No No
Testing process Yes Yes No Yes No Yes
Compensation administration Yes Yes No No No Yes
Performance appraisals No No No No No Noprocess
Discipline process Yes Yes No No No Yes
Grievance process Yes Yes No No No Yes
Termination process Yes Yes No No No Yes
Reward policies and No No No No No Noprocedures
General personnel policies Yes Yes No Yes No No
Labor relations No No No Yes No Yes
Employee benefits No Yes No No No Yes
Other No No No No No No
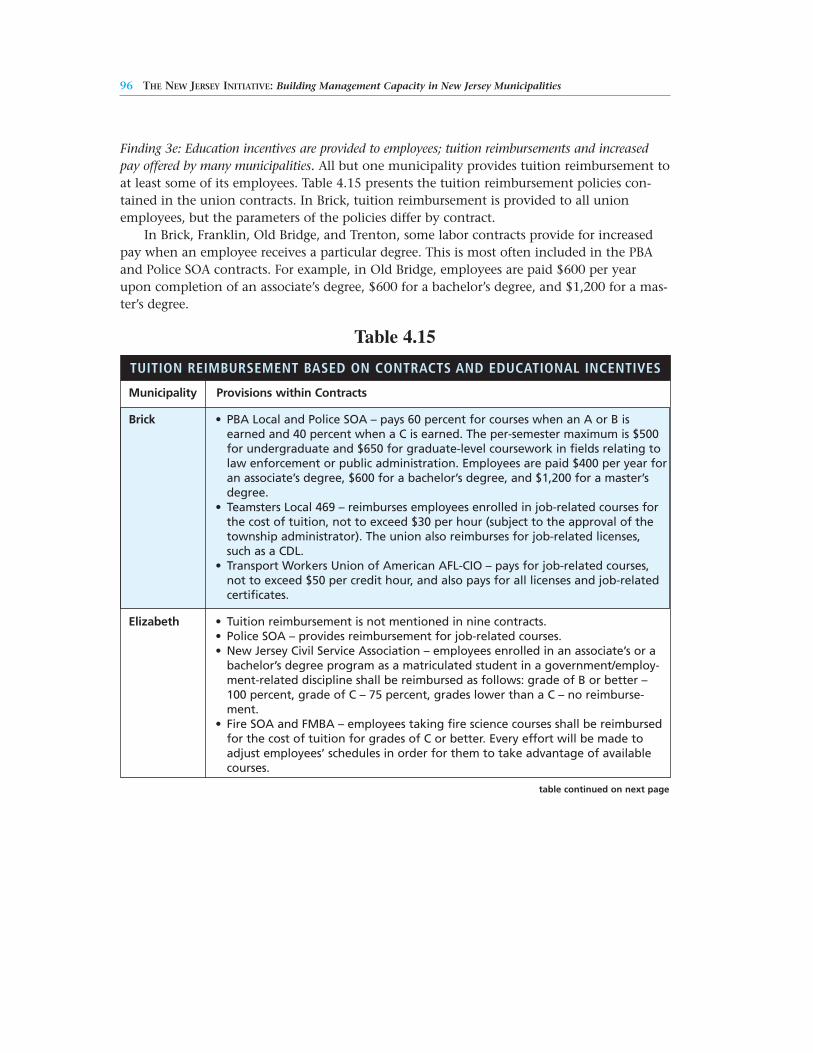
96 THE NEW JERSEY INITIATIVE: Building Management Capacity in New Jersey Municipalities
Finding 3e: Education incentives are provided to employees; tuition reimbursements and increasedpay offered by many municipalities. All but one municipality provides tuition reimbursement toat least some of its employees. Table 4.15 presents the tuition reimbursement policies con-tained in the union contracts. In Brick, tuition reimbursement is provided to all unionemployees, but the parameters of the policies differ by contract.
In Brick, Franklin, Old Bridge, and Trenton, some labor contracts provide for increasedpay when an employee receives a particular degree. This is most often included in the PBAand Police SOA contracts. For example, in Old Bridge, employees are paid $600 per yearupon completion of an associate’s degree, $600 for a bachelor’s degree, and $1,200 for a mas-ter’s degree.
Table 4.15
TUITION REIMBURSEMENT BASED ON CONTRACTS AND EDUCATIONAL INCENTIVES
Municipality Provisions within Contracts
Brick • PBA Local and Police SOA – pays 60 percent for courses when an A or B isearned and 40 percent when a C is earned. The per-semester maximum is $500for undergraduate and $650 for graduate-level coursework in fields relating tolaw enforcement or public administration. Employees are paid $400 per year foran associate’s degree, $600 for a bachelor’s degree, and $1,200 for a master’sdegree.
• Teamsters Local 469 – reimburses employees enrolled in job-related courses forthe cost of tuition, not to exceed $30 per hour (subject to the approval of thetownship administrator). The union also reimburses for job-related licenses,such as a CDL.
• Transport Workers Union of American AFL-CIO – pays for job-related courses,not to exceed $50 per credit hour, and also pays for all licenses and job-relatedcertificates.
Elizabeth • Tuition reimbursement is not mentioned in nine contracts.• Police SOA – provides reimbursement for job-related courses. • New Jersey Civil Service Association – employees enrolled in an associate’s or a
bachelor’s degree program as a matriculated student in a government/employ-ment-related discipline shall be reimbursed as follows: grade of B or better –100 percent, grade of C – 75 percent, grades lower than a C – no reimburse-ment.
• Fire SOA and FMBA – employees taking fire science courses shall be reimbursedfor the cost of tuition for grades of C or better. Every effort will be made toadjust employees’ schedules in order for them to take advantage of availablecourses.
table continued on next page
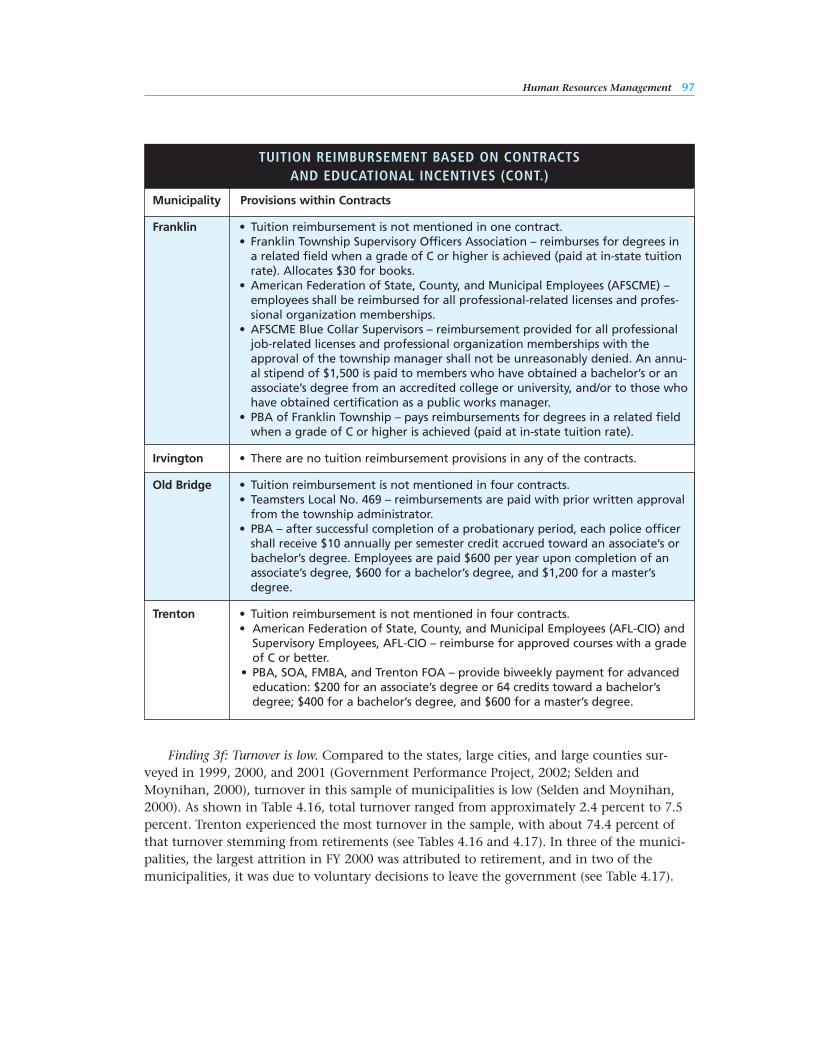
TUITION REIMBURSEMENT BASED ON CONTRACTS AND EDUCATIONAL INCENTIVES (CONT.)
Municipality Provisions within Contracts
Franklin • Tuition reimbursement is not mentioned in one contract.• Franklin Township Supervisory Officers Association – reimburses for degrees in
a related field when a grade of C or higher is achieved (paid at in-state tuitionrate). Allocates $30 for books.
• American Federation of State, County, and Municipal Employees (AFSCME) –employees shall be reimbursed for all professional-related licenses and profes-sional organization memberships.
• AFSCME Blue Collar Supervisors – reimbursement provided for all professionaljob-related licenses and professional organization memberships with theapproval of the township manager shall not be unreasonably denied. An annu-al stipend of $1,500 is paid to members who have obtained a bachelor’s or anassociate’s degree from an accredited college or university, and/or to those whohave obtained certification as a public works manager.
• PBA of Franklin Township – pays reimbursements for degrees in a related fieldwhen a grade of C or higher is achieved (paid at in-state tuition rate).
Irvington • There are no tuition reimbursement provisions in any of the contracts.
Old Bridge • Tuition reimbursement is not mentioned in four contracts. • Teamsters Local No. 469 – reimbursements are paid with prior written approval
from the township administrator.• PBA – after successful completion of a probationary period, each police officer
shall receive $10 annually per semester credit accrued toward an associate’s orbachelor’s degree. Employees are paid $600 per year upon completion of anassociate’s degree, $600 for a bachelor’s degree, and $1,200 for a master’sdegree.
Trenton • Tuition reimbursement is not mentioned in four contracts. • American Federation of State, County, and Municipal Employees (AFL-CIO) and
Supervisory Employees, AFL-CIO – reimburse for approved courses with a gradeof C or better.
• PBA, SOA, FMBA, and Trenton FOA – provide biweekly payment for advancededucation: $200 for an associate’s degree or 64 credits toward a bachelor’sdegree; $400 for a bachelor’s degree, and $600 for a master’s degree.
Human Resources Management 97
Finding 3f: Turnover is low. Compared to the states, large cities, and large counties sur-veyed in 1999, 2000, and 2001 (Government Performance Project, 2002; Selden andMoynihan, 2000), turnover in this sample of municipalities is low (Selden and Moynihan,2000). As shown in Table 4.16, total turnover ranged from approximately 2.4 percent to 7.5percent. Trenton experienced the most turnover in the sample, with about 74.4 percent ofthat turnover stemming from retirements (see Tables 4.16 and 4.17). In three of the munici-palities, the largest attrition in FY 2000 was attributed to retirement, and in two of themunicipalities, it was due to voluntary decisions to leave the government (see Table 4.17).
98 THE NEW JERSEY INITIATIVE: Building Management Capacity in New Jersey Municipalities
Finding 3g: Disciplinary processes are labor-intensive and inflexible. The disciplinary policiesof the civil service municipalities are established according to state law and further definedbased on union contracts. According to the interviews, the discipline and terminationprocesses within the police departments are often more complicated because of the role ofthe internal affairs division. Across the sample, specific policies vary slightly by contract inall but one municipality. Most municipalities in the sample agreed that it is difficult to termi-nate employees, particularly for performance-related issues. The reasons cited include:
• Managers are not consistent in applying the discipline policy
• Managers provide little documentation of performance problems
• Lack of formal or accurate performance evaluation of employees
• Managers are not prepared to work the discipline and termination systems
In Franklin, it takes more than 270 days, on average, to terminate an employee for perform-ance problems (see Table 4.18). This is because when there is a performance problem, themunicipality has to “start from the ground up,” because little documentation exists. TheHRM division in one municipality is training supervisors on how to flag behavioral and per-formance-related problems before they escalate to severe problems.
Table 4.16
PERCENT TURNOVER, MUNICIPALITIES, FISCAL YEAR 2000
Brick Elizabeth Franklin Irvington Old Bridge Trenton Average
Voluntary Turnover 0.87% 1.72% 1.99% Data not 1.50% 0.80% 1.38%available
Involuntary Turnover 0.44% 0.79% 0.57% Data not 0.20% 1.11% 0.62%available
Retirement 1.09% 1.26% 0.57% Data not 2.58% 5.55% 2.21%available
Total Turnover 2.40% 3.77% 3.13% 4.17% 4.28% 7.46% 4.20%
Table 4.17
PERCENT OF TOTAL TURNOVER, FROM EACH CATEGORY, FISCAL YEAR 2000
Brick Elizabeth Franklin Irvington Old Bridge Trenton Average
Voluntary Turnover 36.25% 45.62% 63.58% Data not 35.05% 10.72% 32.86%available
Involuntary Turnover 18.33% 20.95% 18.21% Data not 4.67% 14.88% 14.76%available
Retirement 45.42% 33.42% 18.21% Data not 60.28% 74.40% 52.62%available
Total Turnover 100% 100% 100% 100% 100% 100%
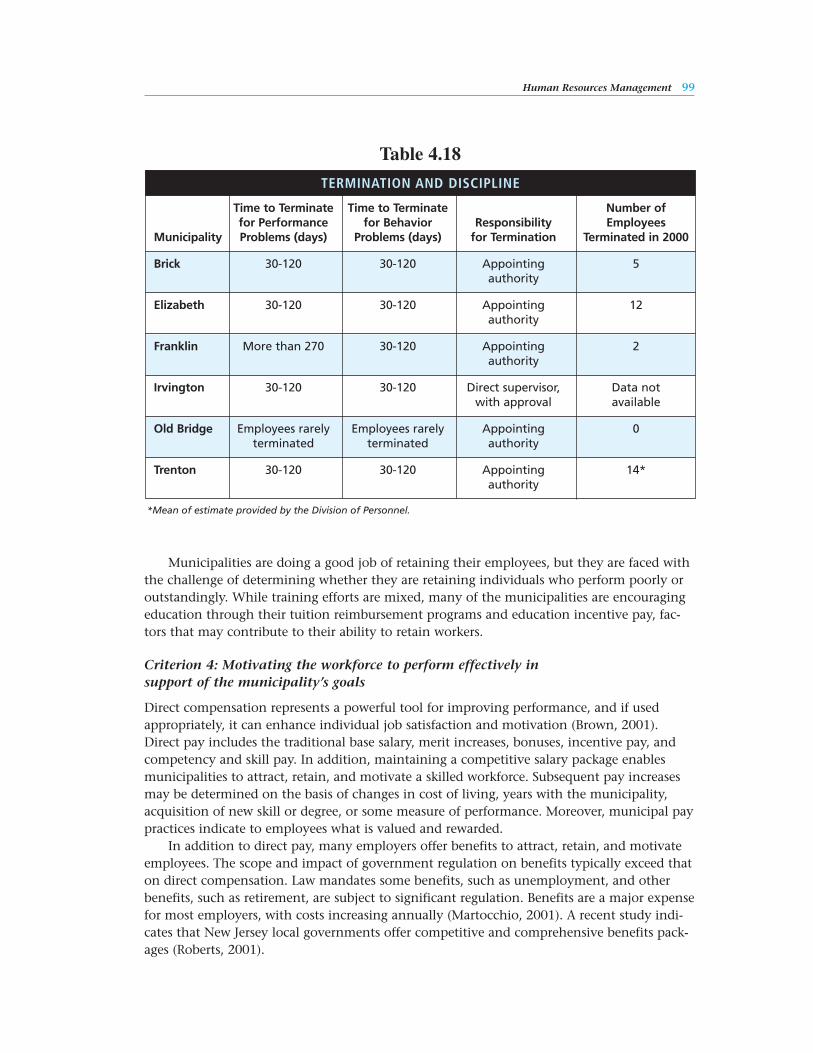
Human Resources Management 99
Municipalities are doing a good job of retaining their employees, but they are faced withthe challenge of determining whether they are retaining individuals who perform poorly oroutstandingly. While training efforts are mixed, many of the municipalities are encouragingeducation through their tuition reimbursement programs and education incentive pay, fac-tors that may contribute to their ability to retain workers.
Criterion 4: Motivating the workforce to perform effectively in support of the municipality’s goals
Direct compensation represents a powerful tool for improving performance, and if usedappropriately, it can enhance individual job satisfaction and motivation (Brown, 2001).Direct pay includes the traditional base salary, merit increases, bonuses, incentive pay, andcompetency and skill pay. In addition, maintaining a competitive salary package enablesmunicipalities to attract, retain, and motivate a skilled workforce. Subsequent pay increasesmay be determined on the basis of changes in cost of living, years with the municipality,acquisition of new skill or degree, or some measure of performance. Moreover, municipal paypractices indicate to employees what is valued and rewarded.
In addition to direct pay, many employers offer benefits to attract, retain, and motivateemployees. The scope and impact of government regulation on benefits typically exceed thaton direct compensation. Law mandates some benefits, such as unemployment, and otherbenefits, such as retirement, are subject to significant regulation. Benefits are a major expensefor most employers, with costs increasing annually (Martocchio, 2001). A recent study indi-cates that New Jersey local governments offer competitive and comprehensive benefits pack-ages (Roberts, 2001).
Table 4.18
*Mean of estimate provided by the Division of Personnel.
TERMINATION AND DISCIPLINE
Time to Terminate Time to Terminate Number offor Performance for Behavior Responsibility Employees
Municipality Problems (days) Problems (days) for Termination Terminated in 2000
Brick 30-120 30-120 Appointing 5authority
Elizabeth 30-120 30-120 Appointing 12authority
Franklin More than 270 30-120 Appointing 2authority
Irvington 30-120 30-120 Direct supervisor, Data not with approval available
Old Bridge Employees rarely Employees rarely Appointing 0terminated terminated authority
Trenton 30-120 30-120 Appointing 14*authority
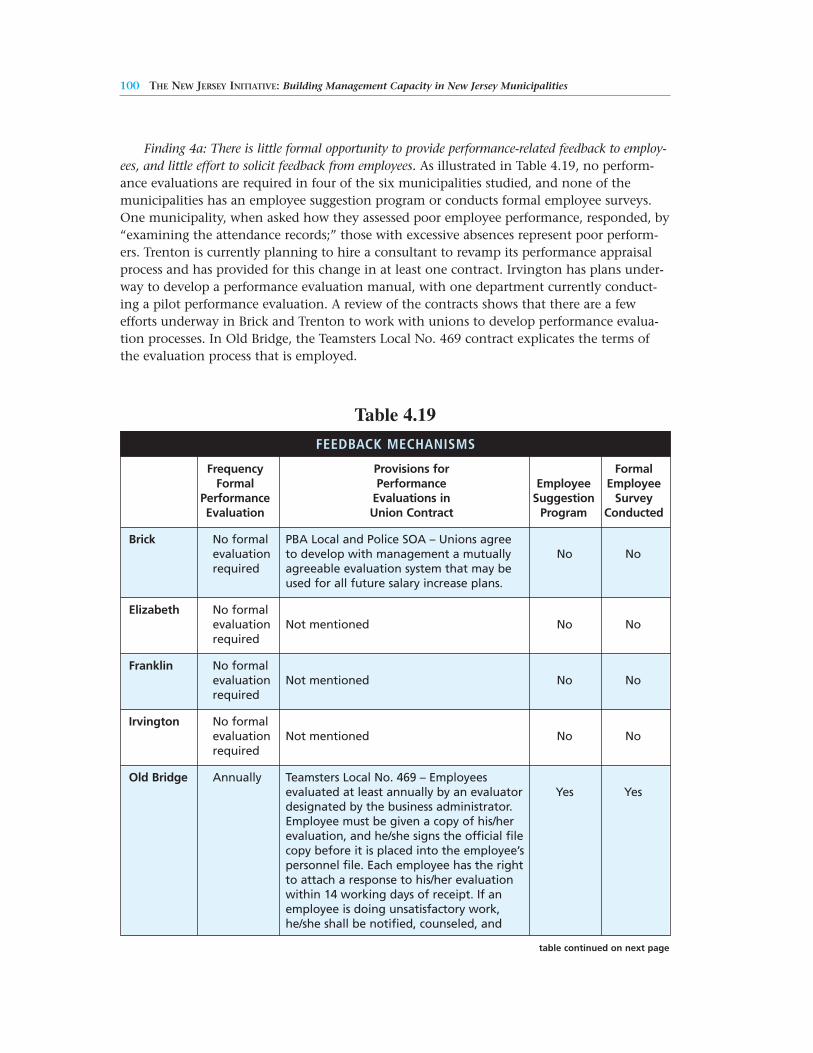
100 THE NEW JERSEY INITIATIVE: Building Management Capacity in New Jersey Municipalities
Finding 4a: There is little formal opportunity to provide performance-related feedback to employ-ees, and little effort to solicit feedback from employees. As illustrated in Table 4.19, no perform-ance evaluations are required in four of the six municipalities studied, and none of themunicipalities has an employee suggestion program or conducts formal employee surveys.One municipality, when asked how they assessed poor employee performance, responded, by“examining the attendance records;” those with excessive absences represent poor perform-ers. Trenton is currently planning to hire a consultant to revamp its performance appraisalprocess and has provided for this change in at least one contract. Irvington has plans under-way to develop a performance evaluation manual, with one department currently conduct-ing a pilot performance evaluation. A review of the contracts shows that there are a fewefforts underway in Brick and Trenton to work with unions to develop performance evalua-tion processes. In Old Bridge, the Teamsters Local No. 469 contract explicates the terms ofthe evaluation process that is employed.
Table 4.19
table continued on next page
FEEDBACK MECHANISMS
Frequency Provisions for FormalFormal Performance Employee Employee
Performance Evaluations in Suggestion Survey Evaluation Union Contract Program Conducted
Brick No formal PBA Local and Police SOA – Unions agree evaluation to develop with management a mutually No Norequired agreeable evaluation system that may be
used for all future salary increase plans.
Elizabeth No formal evaluation Not mentioned No Norequired
Franklin No formal evaluation Not mentioned No Norequired
Irvington No formal evaluation Not mentioned No Norequired
Old Bridge Annually Teamsters Local No. 469 – Employees evaluated at least annually by an evaluator Yes Yesdesignated by the business administrator. Employee must be given a copy of his/her evaluation, and he/she signs the official file copy before it is placed into the employee’s personnel file. Each employee has the right to attach a response to his/her evaluationwithin 14 working days of receipt. If anemployee is doing unsatisfactory work, he/she shall be notified, counseled, and
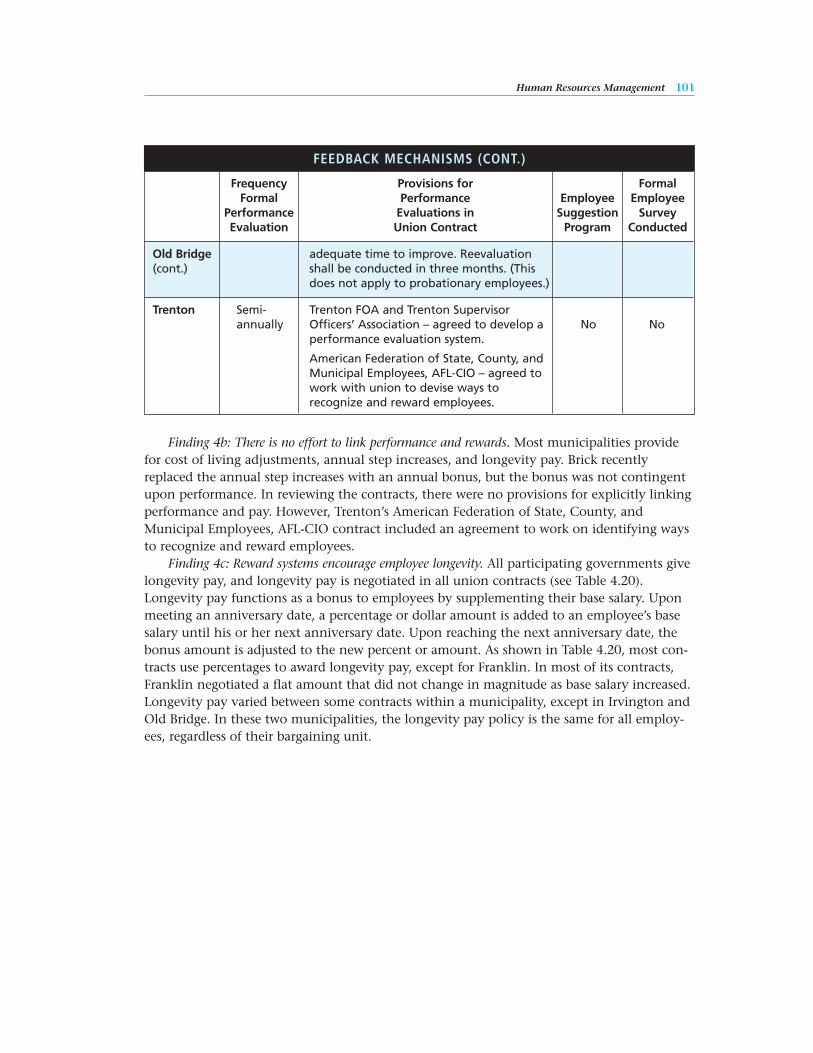
Human Resources Management 101
Finding 4b: There is no effort to link performance and rewards. Most municipalities providefor cost of living adjustments, annual step increases, and longevity pay. Brick recentlyreplaced the annual step increases with an annual bonus, but the bonus was not contingentupon performance. In reviewing the contracts, there were no provisions for explicitly linkingperformance and pay. However, Trenton’s American Federation of State, County, andMunicipal Employees, AFL-CIO contract included an agreement to work on identifying waysto recognize and reward employees.
Finding 4c: Reward systems encourage employee longevity. All participating governments givelongevity pay, and longevity pay is negotiated in all union contracts (see Table 4.20).Longevity pay functions as a bonus to employees by supplementing their base salary. Uponmeeting an anniversary date, a percentage or dollar amount is added to an employee’s basesalary until his or her next anniversary date. Upon reaching the next anniversary date, thebonus amount is adjusted to the new percent or amount. As shown in Table 4.20, most con-tracts use percentages to award longevity pay, except for Franklin. In most of its contracts,Franklin negotiated a flat amount that did not change in magnitude as base salary increased.Longevity pay varied between some contracts within a municipality, except in Irvington andOld Bridge. In these two municipalities, the longevity pay policy is the same for all employ-ees, regardless of their bargaining unit.
FEEDBACK MECHANISMS (CONT.)
Frequency Provisions for FormalFormal Performance Employee Employee
Performance Evaluations in Suggestion Survey Evaluation Union Contract Program Conducted
Old Bridge adequate time to improve. Reevaluation(cont.) shall be conducted in three months. (This
does not apply to probationary employees.)
Trenton Semi- Trenton FOA and Trenton Supervisor annually Officers’ Association – agreed to develop a No No
performance evaluation system.
American Federation of State, County, and Municipal Employees, AFL-CIO – agreed to work with union to devise ways to recognize and reward employees.
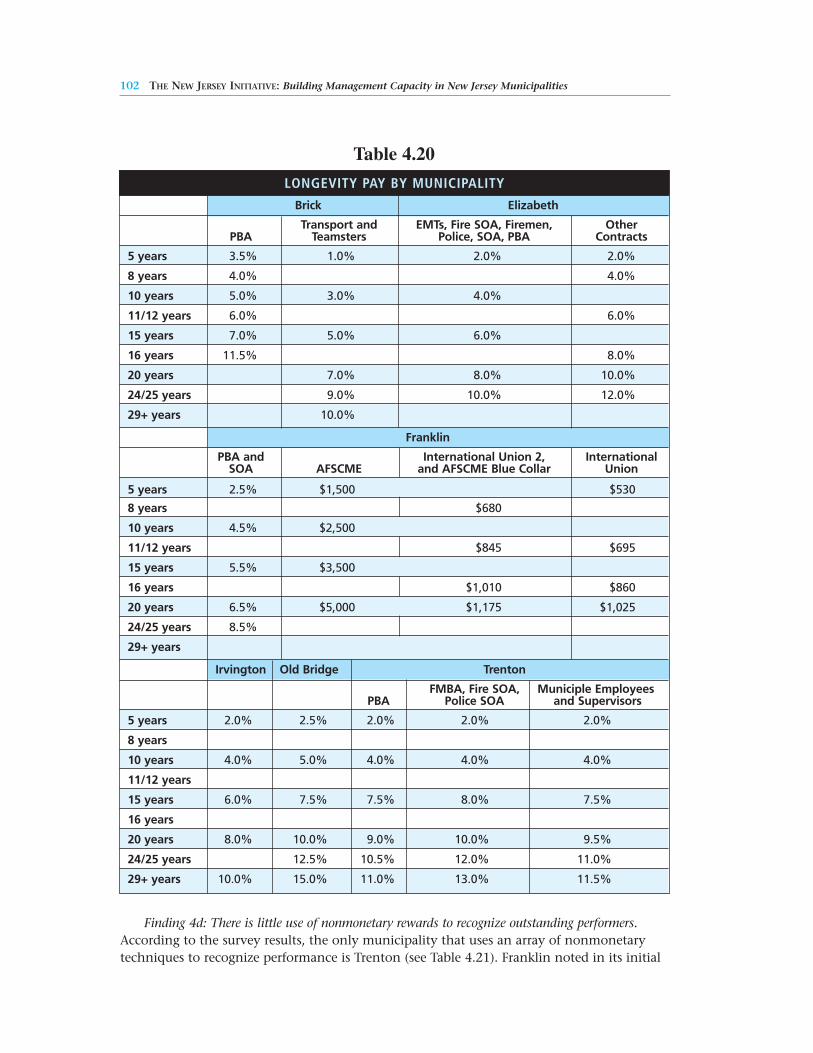
102 THE NEW JERSEY INITIATIVE: Building Management Capacity in New Jersey Municipalities
Finding 4d: There is little use of nonmonetary rewards to recognize outstanding performers.According to the survey results, the only municipality that uses an array of nonmonetarytechniques to recognize performance is Trenton (see Table 4.21). Franklin noted in its initial
Table 4.20
LONGEVITY PAY BY MUNICIPALITY
Brick Elizabeth
Transport and EMTs, Fire SOA, Firemen, OtherPBA Teamsters Police, SOA, PBA Contracts
5 years 3.5% 1.0% 2.0% 2.0%
8 years 4.0% 4.0%
10 years 5.0% 3.0% 4.0%
11/12 years 6.0% 6.0%
15 years 7.0% 5.0% 6.0%
16 years 11.5% 8.0%
20 years 7.0% 8.0% 10.0%
24/25 years 9.0% 10.0% 12.0%
29+ years 10.0%
Franklin
PBA and International Union 2, InternationalSOA AFSCME and AFSCME Blue Collar Union
5 years 2.5% $1,500 $530
8 years $680
10 years 4.5% $2,500
11/12 years $845 $695
15 years 5.5% $3,500
16 years $1,010 $860
20 years 6.5% $5,000 $1,175 $1,025
24/25 years 8.5%
29+ years
Irvington Old Bridge Trenton
FMBA, Fire SOA, Municiple EmployeesPBA Police SOA and Supervisors
5 years 2.0% 2.5% 2.0% 2.0% 2.0%
8 years
10 years 4.0% 5.0% 4.0% 4.0% 4.0%
11/12 years
15 years 6.0% 7.5% 7.5% 8.0% 7.5%
16 years
20 years 8.0% 10.0% 9.0% 10.0% 9.5%
24/25 years 12.5% 10.5% 12.0% 11.0%
29+ years 10.0% 15.0% 11.0% 13.0% 11.5%
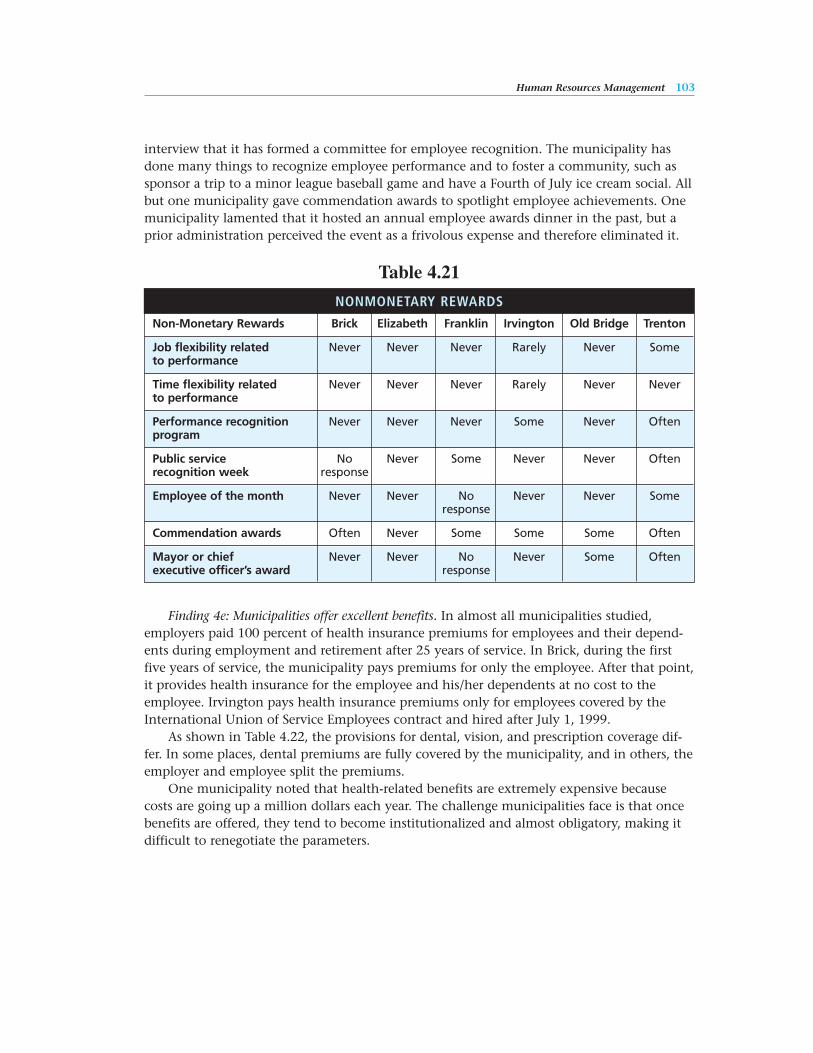
Human Resources Management 103
interview that it has formed a committee for employee recognition. The municipality hasdone many things to recognize employee performance and to foster a community, such assponsor a trip to a minor league baseball game and have a Fourth of July ice cream social. Allbut one municipality gave commendation awards to spotlight employee achievements. Onemunicipality lamented that it hosted an annual employee awards dinner in the past, but aprior administration perceived the event as a frivolous expense and therefore eliminated it.
Finding 4e: Municipalities offer excellent benefits. In almost all municipalities studied,employers paid 100 percent of health insurance premiums for employees and their depend-ents during employment and retirement after 25 years of service. In Brick, during the firstfive years of service, the municipality pays premiums for only the employee. After that point,it provides health insurance for the employee and his/her dependents at no cost to theemployee. Irvington pays health insurance premiums only for employees covered by theInternational Union of Service Employees contract and hired after July 1, 1999.
As shown in Table 4.22, the provisions for dental, vision, and prescription coverage dif-fer. In some places, dental premiums are fully covered by the municipality, and in others, theemployer and employee split the premiums.
One municipality noted that health-related benefits are extremely expensive becausecosts are going up a million dollars each year. The challenge municipalities face is that oncebenefits are offered, they tend to become institutionalized and almost obligatory, making itdifficult to renegotiate the parameters.
Table 4.21
NONMONETARY REWARDS
Non-Monetary Rewards Brick Elizabeth Franklin Irvington Old Bridge Trenton
Job flexibility related Never Never Never Rarely Never Someto performance
Time flexibility related Never Never Never Rarely Never Neverto performance
Performance recognition Never Never Never Some Never Oftenprogram
Public service No Never Some Never Never Oftenrecognition week response
Employee of the month Never Never No Never Never Someresponse
Commendation awards Often Never Some Some Some Often
Mayor or chief Never Never No Never Some Oftenexecutive officer’s award response
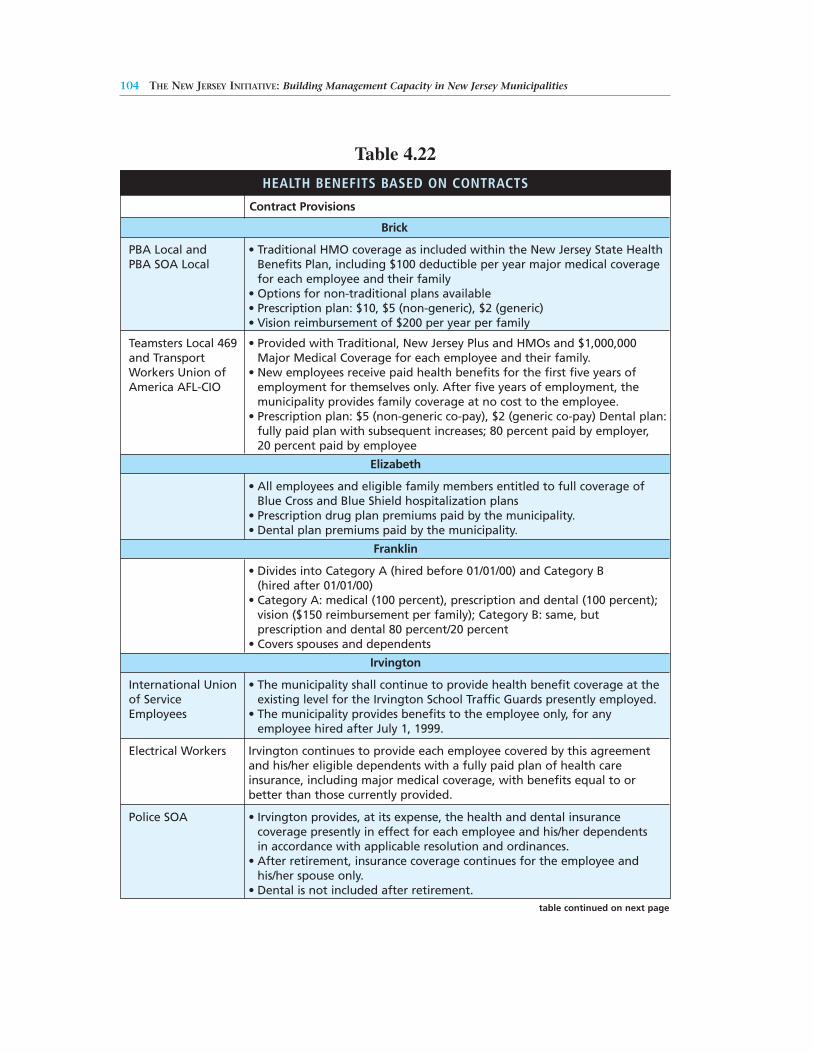
104 THE NEW JERSEY INITIATIVE: Building Management Capacity in New Jersey Municipalities
Table 4.22
HEALTH BENEFITS BASED ON CONTRACTS
Contract Provisions
Brick
PBA Local and • Traditional HMO coverage as included within the New Jersey State Health PBA SOA Local Benefits Plan, including $100 deductible per year major medical coverage
for each employee and their family• Options for non-traditional plans available• Prescription plan: $10, $5 (non-generic), $2 (generic)• Vision reimbursement of $200 per year per family
Teamsters Local 469 • Provided with Traditional, New Jersey Plus and HMOs and $1,000,000 and Transport Major Medical Coverage for each employee and their family. Workers Union of • New employees receive paid health benefits for the first five years of America AFL-CIO employment for themselves only. After five years of employment, the
municipality provides family coverage at no cost to the employee.• Prescription plan: $5 (non-generic co-pay), $2 (generic co-pay) Dental plan:
fully paid plan with subsequent increases; 80 percent paid by employer, 20 percent paid by employee
Elizabeth
• All employees and eligible family members entitled to full coverage of Blue Cross and Blue Shield hospitalization plans
• Prescription drug plan premiums paid by the municipality.• Dental plan premiums paid by the municipality.
Franklin
• Divides into Category A (hired before 01/01/00) and Category B (hired after 01/01/00)
• Category A: medical (100 percent), prescription and dental (100 percent); vision ($150 reimbursement per family); Category B: same, but prescription and dental 80 percent/20 percent
• Covers spouses and dependents
Irvington
International Union • The municipality shall continue to provide health benefit coverage at theof Service existing level for the Irvington School Traffic Guards presently employed.Employees • The municipality provides benefits to the employee only, for any
employee hired after July 1, 1999.
Electrical Workers Irvington continues to provide each employee covered by this agreement and his/her eligible dependents with a fully paid plan of health care insurance, including major medical coverage, with benefits equal to or better than those currently provided.
Police SOA • Irvington provides, at its expense, the health and dental insurance coverage presently in effect for each employee and his/her dependents in accordance with applicable resolution and ordinances.
• After retirement, insurance coverage continues for the employee and his/her spouse only.
• Dental is not included after retirement.table continued on next page
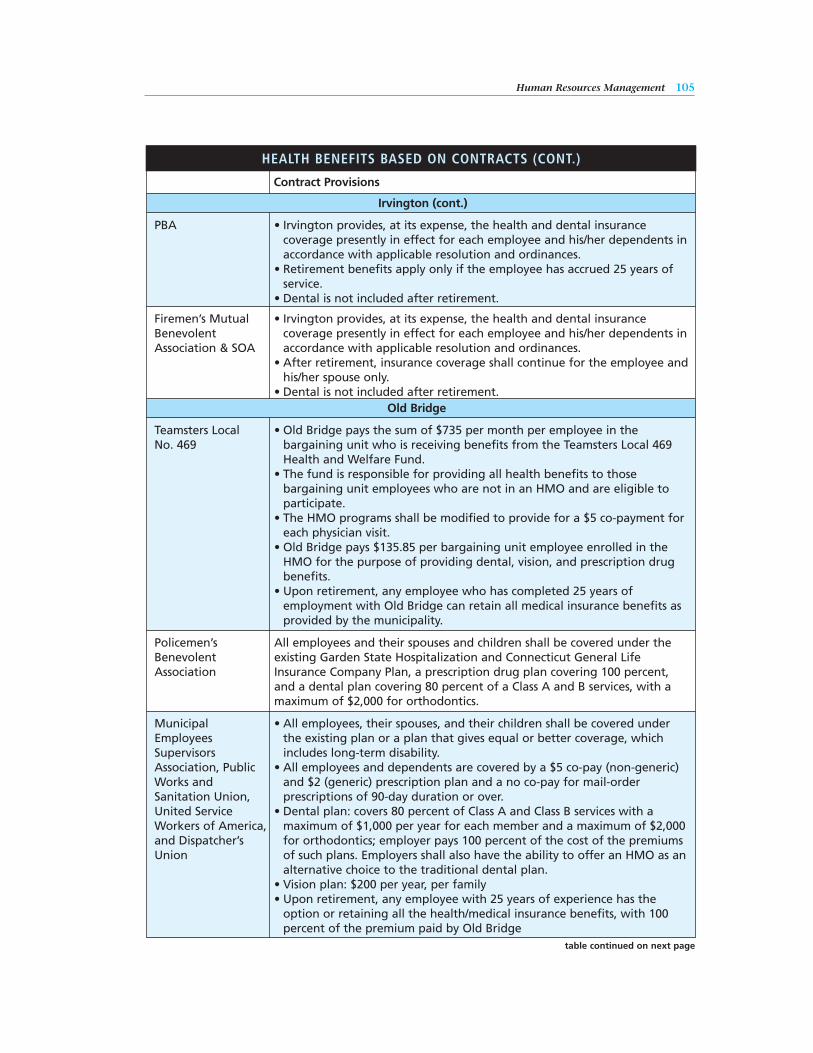
Human Resources Management 105
table continued on next page
HEALTH BENEFITS BASED ON CONTRACTS (CONT.)
Contract Provisions
Irvington (cont.)
PBA • Irvington provides, at its expense, the health and dental insurance coverage presently in effect for each employee and his/her dependents in accordance with applicable resolution and ordinances.
• Retirement benefits apply only if the employee has accrued 25 years of service.
• Dental is not included after retirement.
Firemen’s Mutual • Irvington provides, at its expense, the health and dental insurance Benevolent coverage presently in effect for each employee and his/her dependents inAssociation & SOA accordance with applicable resolution and ordinances.
• After retirement, insurance coverage shall continue for the employee and his/her spouse only.
• Dental is not included after retirement.Old Bridge
Teamsters Local • Old Bridge pays the sum of $735 per month per employee in theNo. 469 bargaining unit who is receiving benefits from the Teamsters Local 469
Health and Welfare Fund.• The fund is responsible for providing all health benefits to those
bargaining unit employees who are not in an HMO and are eligible to participate.
• The HMO programs shall be modified to provide for a $5 co-payment for each physician visit.
• Old Bridge pays $135.85 per bargaining unit employee enrolled in the HMO for the purpose of providing dental, vision, and prescription drug benefits.
• Upon retirement, any employee who has completed 25 years of employment with Old Bridge can retain all medical insurance benefits as provided by the municipality.
Policemen’s All employees and their spouses and children shall be covered under the Benevolent existing Garden State Hospitalization and Connecticut General Life Association Insurance Company Plan, a prescription drug plan covering 100 percent,
and a dental plan covering 80 percent of a Class A and B services, with a maximum of $2,000 for orthodontics.
Municipal • All employees, their spouses, and their children shall be covered under Employees the existing plan or a plan that gives equal or better coverage, which Supervisors includes long-term disability.Association, Public • All employees and dependents are covered by a $5 co-pay (non-generic) Works and and $2 (generic) prescription plan and a no co-pay for mail-orderSanitation Union, prescriptions of 90-day duration or over.United Service • Dental plan: covers 80 percent of Class A and Class B services with aWorkers of America, maximum of $1,000 per year for each member and a maximum of $2,000 and Dispatcher’s for orthodontics; employer pays 100 percent of the cost of the premiums Union of such plans. Employers shall also have the ability to offer an HMO as an
alternative choice to the traditional dental plan.• Vision plan: $200 per year, per family• Upon retirement, any employee with 25 years of experience has the
option or retaining all the health/medical insurance benefits, with 100 percent of the premium paid by Old Bridge
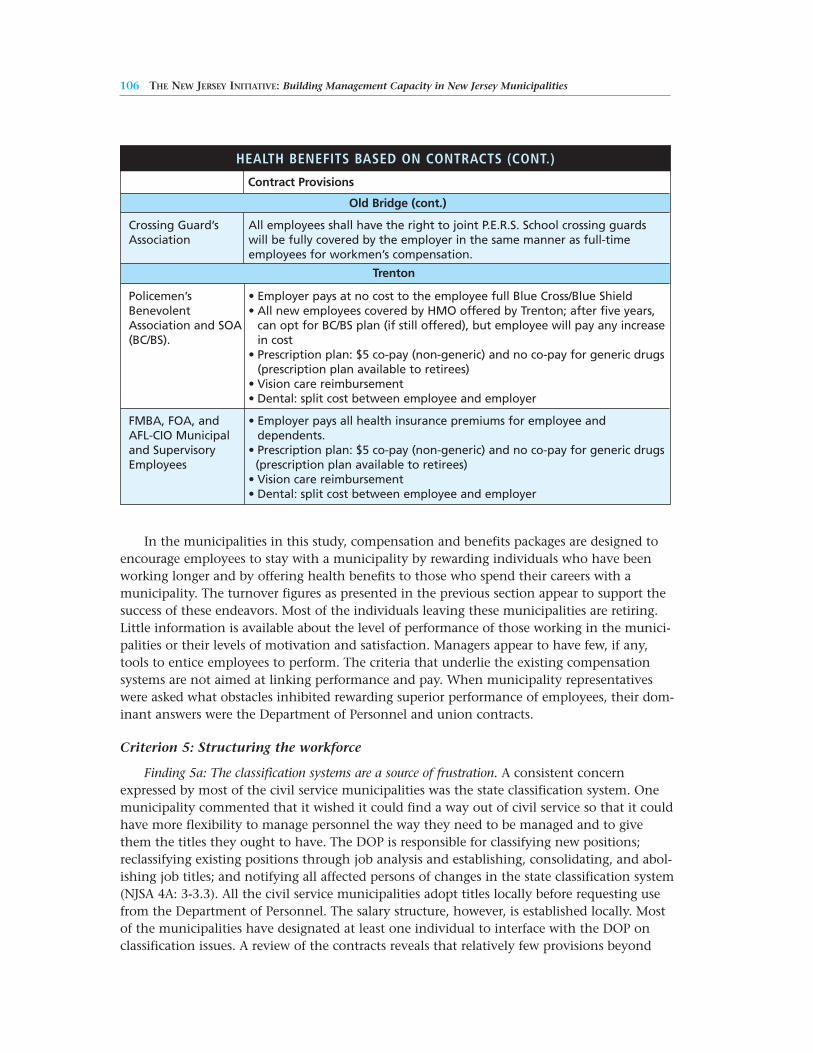
106 THE NEW JERSEY INITIATIVE: Building Management Capacity in New Jersey Municipalities
In the municipalities in this study, compensation and benefits packages are designed toencourage employees to stay with a municipality by rewarding individuals who have beenworking longer and by offering health benefits to those who spend their careers with amunicipality. The turnover figures as presented in the previous section appear to support thesuccess of these endeavors. Most of the individuals leaving these municipalities are retiring.Little information is available about the level of performance of those working in the munici-palities or their levels of motivation and satisfaction. Managers appear to have few, if any,tools to entice employees to perform. The criteria that underlie the existing compensationsystems are not aimed at linking performance and pay. When municipality representativeswere asked what obstacles inhibited rewarding superior performance of employees, their dom-inant answers were the Department of Personnel and union contracts.
Criterion 5: Structuring the workforce
Finding 5a: The classification systems are a source of frustration. A consistent concernexpressed by most of the civil service municipalities was the state classification system. Onemunicipality commented that it wished it could find a way out of civil service so that it couldhave more flexibility to manage personnel the way they need to be managed and to givethem the titles they ought to have. The DOP is responsible for classifying new positions;reclassifying existing positions through job analysis and establishing, consolidating, and abol-ishing job titles; and notifying all affected persons of changes in the state classification system(NJSA 4A: 3-3.3). All the civil service municipalities adopt titles locally before requesting usefrom the Department of Personnel. The salary structure, however, is established locally. Mostof the municipalities have designated at least one individual to interface with the DOP onclassification issues. A review of the contracts reveals that relatively few provisions beyond
HEALTH BENEFITS BASED ON CONTRACTS (CONT.)
Contract Provisions
Old Bridge (cont.)
Crossing Guard’s All employees shall have the right to joint P.E.R.S. School crossing guards Association will be fully covered by the employer in the same manner as full-time
employees for workmen’s compensation.
Trenton
Policemen’s • Employer pays at no cost to the employee full Blue Cross/Blue Shield Benevolent • All new employees covered by HMO offered by Trenton; after five years,Association and SOA can opt for BC/BS plan (if still offered), but employee will pay any increase(BC/BS). in cost
• Prescription plan: $5 co-pay (non-generic) and no co-pay for generic drugs (prescription plan available to retirees)
• Vision care reimbursement• Dental: split cost between employee and employer
FMBA, FOA, and • Employer pays all health insurance premiums for employee andAFL-CIO Municipal dependents.and Supervisory • Prescription plan: $5 co-pay (non-generic) and no co-pay for generic drugsEmployees (prescription plan available to retirees)
• Vision care reimbursement• Dental: split cost between employee and employer
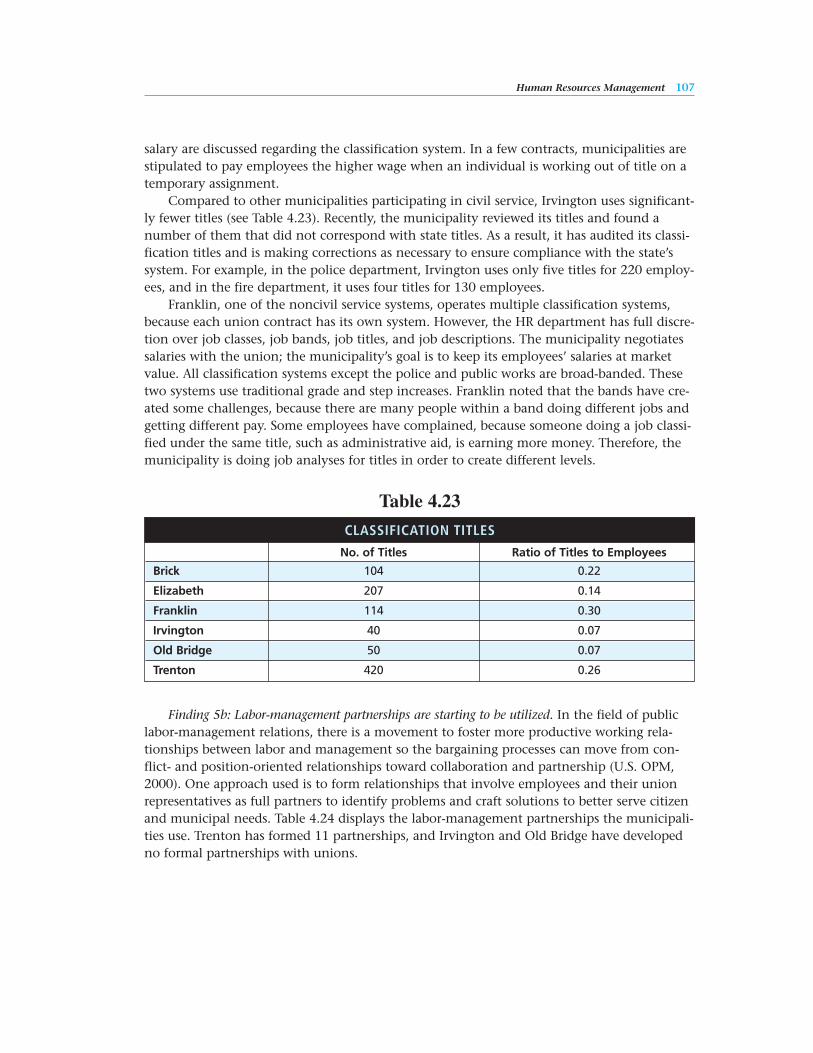
Human Resources Management 107
salary are discussed regarding the classification system. In a few contracts, municipalities arestipulated to pay employees the higher wage when an individual is working out of title on atemporary assignment.
Compared to other municipalities participating in civil service, Irvington uses significant-ly fewer titles (see Table 4.23). Recently, the municipality reviewed its titles and found anumber of them that did not correspond with state titles. As a result, it has audited its classi-fication titles and is making corrections as necessary to ensure compliance with the state’ssystem. For example, in the police department, Irvington uses only five titles for 220 employ-ees, and in the fire department, it uses four titles for 130 employees.
Franklin, one of the noncivil service systems, operates multiple classification systems,because each union contract has its own system. However, the HR department has full discre-tion over job classes, job bands, job titles, and job descriptions. The municipality negotiatessalaries with the union; the municipality’s goal is to keep its employees’ salaries at marketvalue. All classification systems except the police and public works are broad-banded. Thesetwo systems use traditional grade and step increases. Franklin noted that the bands have cre-ated some challenges, because there are many people within a band doing different jobs andgetting different pay. Some employees have complained, because someone doing a job classi-fied under the same title, such as administrative aid, is earning more money. Therefore, themunicipality is doing job analyses for titles in order to create different levels.
Finding 5b: Labor-management partnerships are starting to be utilized. In the field of publiclabor-management relations, there is a movement to foster more productive working rela-tionships between labor and management so the bargaining processes can move from con-flict- and position-oriented relationships toward collaboration and partnership (U.S. OPM,2000). One approach used is to form relationships that involve employees and their unionrepresentatives as full partners to identify problems and craft solutions to better serve citizenand municipal needs. Table 4.24 displays the labor-management partnerships the municipali-ties use. Trenton has formed 11 partnerships, and Irvington and Old Bridge have developedno formal partnerships with unions.
Table 4.23
CLASSIFICATION TITLES
No. of Titles Ratio of Titles to Employees
Brick 104 0.22
Elizabeth 207 0.14
Franklin 114 0.30
Irvington 40 0.07
Old Bridge 50 0.07
Trenton 420 0.26
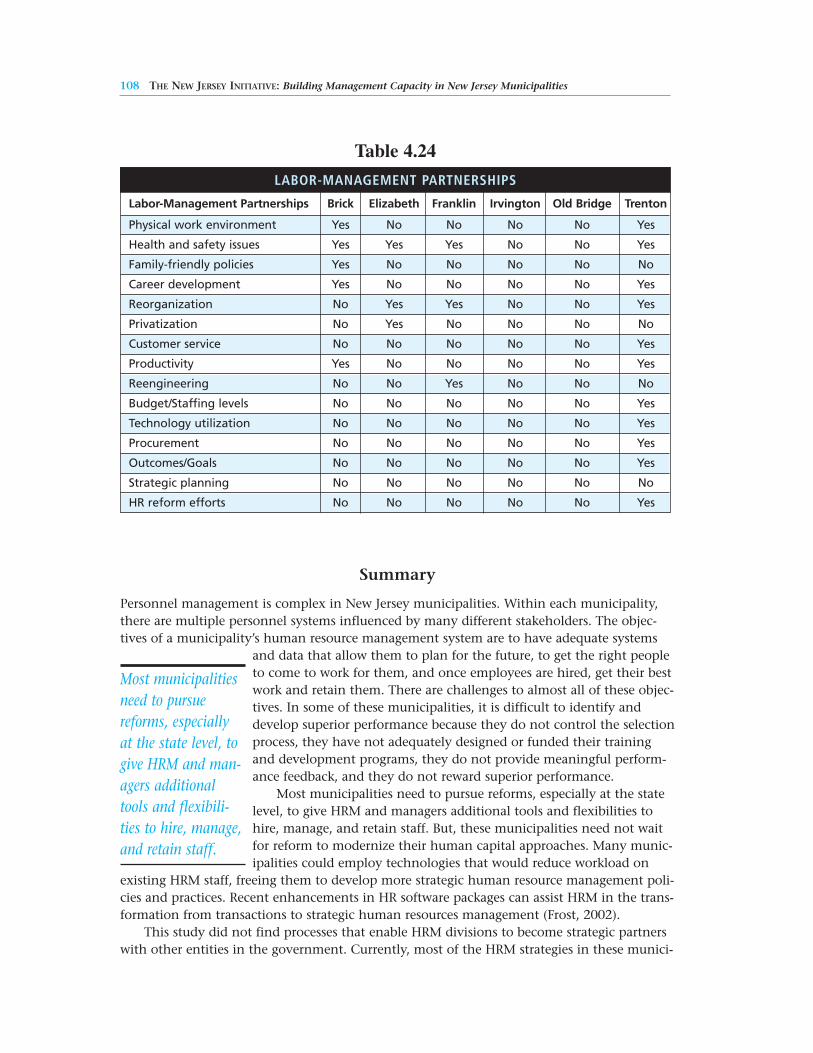
108 THE NEW JERSEY INITIATIVE: Building Management Capacity in New Jersey Municipalities
Summary
Personnel management is complex in New Jersey municipalities. Within each municipality,there are multiple personnel systems influenced by many different stakeholders. The objec-tives of a municipality’s human resource management system are to have adequate systems
and data that allow them to plan for the future, to get the right peopleto come to work for them, and once employees are hired, get their bestwork and retain them. There are challenges to almost all of these objec-tives. In some of these municipalities, it is difficult to identify anddevelop superior performance because they do not control the selectionprocess, they have not adequately designed or funded their trainingand development programs, they do not provide meaningful perform-ance feedback, and they do not reward superior performance.
Most municipalities need to pursue reforms, especially at the statelevel, to give HRM and managers additional tools and flexibilities tohire, manage, and retain staff. But, these municipalities need not waitfor reform to modernize their human capital approaches. Many munic-ipalities could employ technologies that would reduce workload on
existing HRM staff, freeing them to develop more strategic human resource management poli-cies and practices. Recent enhancements in HR software packages can assist HRM in the trans-formation from transactions to strategic human resources management (Frost, 2002).
This study did not find processes that enable HRM divisions to become strategic partnerswith other entities in the government. Currently, most of the HRM strategies in these munici-
Table 4.24
LABOR-MANAGEMENT PARTNERSHIPS
Labor-Management Partnerships Brick Elizabeth Franklin Irvington Old Bridge Trenton
Physical work environment Yes No No No No Yes
Health and safety issues Yes Yes Yes No No Yes
Family-friendly policies Yes No No No No No
Career development Yes No No No No Yes
Reorganization No Yes Yes No No Yes
Privatization No Yes No No No No
Customer service No No No No No Yes
Productivity Yes No No No No Yes
Reengineering No No Yes No No No
Budget/Staffing levels No No No No No Yes
Technology utilization No No No No No Yes
Procurement No No No No No Yes
Outcomes/Goals No No No No No Yes
Strategic planning No No No No No No
HR reform efforts No No No No No Yes
Most municipalitiesneed to pursuereforms, especiallyat the state level, togive HRM and man-agers additionaltools and flexibili-ties to hire, manage,and retain staff.
Human Resources Management 109
palities are realized – those emerging from past practice – as opposed to strategic – thoseplanned for future action (Mintzberg, 1989). In other words, the municipalities engage in rela-tively no long-term planning in the area of HRM. The HRM choices and policies are notdesigned to enable a municipality to achieve its vision or to give it a competitive advantage,but are a result of incremental changes that have occurred during political, legal, and manage-rial processes, such as contract negotiations, legal decisions, and policy adoptions.
As part of an ongoing self-study, HRM departments should ask themselves the followingset of questions:
• Do the HRM policies and procedures support the municipality’s strategic direction?
• Does the organizational structure of the HRM division fit with the HRM policies and pro-cedures?
• Does the performance (including pay) system fit the structure of the municipality?
• Is the municipality developing leaders with skills needed to meet the strategic direction?
• Has our internal communication with employees been developed to support and commu-nicate the strategic vision?
Recommendations for New Jersey Municipalities
Municipal leaders are in a position to advance and update their HRM systems and functions atthe municipal and HRM department levels. To this end, the researchers offer the following 10recommendations for the municipal and HRM department levels, respectively:
Municipal-Level Recommendations
M1: At the municipal level, implement a strategic planning process that includes HRM
M2: At the municipal level, adopt technologies that support HRM and that interface withthe payroll and other municipal information systems
M3: At the municipal level, develop meaningful performance evaluation systems
M4: At the municipal level, develop formal systems that link employee performance andrecognition
M5: At the municipal level, administer an annual employee survey
M6: At the municipal level, update job classification titles and job descriptions
Human Resources Management Department-Level Recommendations
H1: In the HRM department, develop a formal mission statement
H2: In the HRM department, engage in regular self-studies about the roles and responsi-bilities of the HRM staff
H3: In the HRM department, collect HRM-related data – especially HRM outcomes – thatcan be used to assess departmental performance and applied in the planning process
H4: In the HRM department, better utilize the World Wide Web as a communications tool
110 THE NEW JERSEY INITIATIVE: Building Management Capacity in New Jersey Municipalities
Recommendations for the State of New Jersey
The state of New Jersey can take actions to assist leaders in all 566 municipalities in advanc-ing and updating their HRM systems and functions. The authors offer the following threerecommendations:
S1: At the state level, delegate more authority in the hiring process to the municipalities
S2: At the state level, increase the number of candidates that localities can select (eliminate the “Rule of X (3)”)
S3: At the state level, reduce the number of job titles and the number of titles thatrequire testing

Human Resources Management 111

5INFORMATION TECHNOLOGY MANAGEMENT
THIS CHAPTER REPORTS ON INFORMATION TECHNOLOGY MANAGEMENT in local govern-ment. Of all the various management subsystems found in local government today, informa-tion technology management is becoming an increasingly important component. More andmore, modern approaches to financial and human resource management require an underly-ing information system basis. Imagine running an accounting system or personnel processwithout information technology. At the very least, all modern offices, regardless of sector orfunction, require information technology to automate document generation and production.Consequently, information technology (IT) has become central to public management, but atthe same time, has become increasingly difficult to manage.
Currently, the major cutting-edge issues in information technology management focus onthe emerging concept of e-government. E-government, like many earlier information technol-ogy innovations such as decision support systems, is being propelledmostly by advocates for change who believe the new web-based tech-nology will lead to more efficient management processes.Unfortunately, also like its predecessors, claims for the potential bene-fits of e-government far outstrip the reality. Most of the recent empiri-cal work suggests that web-based applications will develop more slow-ly than expected and will more than likely be constrained by existingpolitical and organizational institutions, as opposed to revolutionizingthose institutions (West, 2001).
This chapter begins with a brief description of IT management capacity subsystems. Next,this inquiry considers the state context for information management in New Jersey as con-fronted by the seven local governments studied. Then it defines the criteria associated withmeasuring local governments’ information management capacity, and describes the data col-lection process. The penultimate section of this chapter presents results by summarizing thecondition of IT management capacity in the seven municipalities. The chapter concludes witha summary and a set of recommendations for the municipalities and the state of New Jersey.
Information Technology Management Capacity and Systems
The concept of IT management capacity can be divided into six key subsystems: IT planningcapacity, capital procurement and maintenance capacity, application development or procure-ment capacity, data management capacity, IT human resources management capacity, and sys-tems management and maintenance capacity.
Information Technology planning capacity reflects a jurisdiction’s ability to develop a for-mal IT plan and maintain a regular process of re-evaluation and re-planning. This particular
...the major cutting-edge issues in infor-
mation technologymanagement focus onthe emerging concept
of e-government.
process should have links to all the core support areas (i.e., budgeting, financial management,human resources, and general planning), as well as strong links to the political leadership ofthe jurisdiction, in order to provide agencies guidance on priorities. While departments mayhave their own IT planning processes, this particular capacity requires some centralized direc-tion and control.
Capital procurement and maintenance capacity refers to a jurisdiction’s ability to obtain aswell as maintain and/or replace the IT system’s capital infrastructure. For all the jurisdictionsstudied and for most other local governments, this infrastructure includes some form of cen-tralized computing capacity, sufficient online storage capacity, telecommunications capacities(e.g., network wiring and Ethernet cards, modems, wireless transmission systems, etc.), inputand output devices (e.g., scanners, printers, plotters, and terminals), and office desktop sys-tems. In all the local districts, personal desktop computers were typically evident and clearlyreflect a major capital component of the IT infrastructure.
Application development or procurement capacity refers to the ability to either create orpurchase the necessary software for agency and enterprise-wide IT. All the jurisdictions studiedtypically rely on the market to provide standard office desktop software for e-mail, word pro-cessing, and other applications. Most jurisdictions use both in-house developed and purchasedapplication solutions. For in-house development, systems analysis capacity, programmingcapacity, and maintenance capacity (including documentation and training) are requirementsfor good IT management. Good purchasing and contract management capacity are necessaryfor procurement-based application development.
Data management capacity refers to the ability to enter, retrieve, and manage data. It alsoconsiders the extent to which data is managed as a shared enterprise-wide resource, based ondatabase management or some other integrative approach to organizing, retrieving, and shar-ing data.
Information Technology human resources management capacity refers to the ability to hireand retain the necessary human resources to manage IT, train end-users in its use or applica-tions, and provide sufficient levels of technical support and help functions to end-users.
Systems management and maintenance capacity refers to the ability to manage the overallIT function. It includes the ability to operate and maintain the network systems that supportoffice automation, including dial-in and e-mail capacity. Operation and maintenance of allhardware equipment and management of the production runs of enterprise-wide software,such as payroll, are also important components of this category.
Information Technology Management Environment for New Jersey Municipalities
As is true for all local governments, the New Jersey municipalities sit within a complex web ofrelationships with other levels of government. The most relevant of these are the local specialdistricts, the counties, the state, and the historically separate public safety function within themunicipal government. In each of these cases, the specific relationship observed depends heav-ily on local history. For example, several of the seven municipalities upgraded or enhancedparts of their IT infrastructure along with capital enhancement in the local school districts.This was only possible because of a history of cooperation between the local government andthe schools. In another case, local library system enhancements were viewed as having inap-propriate levels of security, making them incompatible with the local government systems.
114 THE NEW JERSEY INITIATIVE: Building Management Capacity in New Jersey Municipalities
This view was also tied, in part, to a recent history of conflict between the two groups overaccess to financial resources (i.e., tax rates). In a third case, the local government turned overto the county complete control and responsibility for social welfare data maintenance to thecounty. The municipality decided to let the county provide this information-based servicebecause it felt that converting its homegrown system to one that met all the state requirementsfor data exchange would be too costly.
These disparate examples suggest that the relationship between a local government andother governmental units can act as a facilitator or as a constraint. To establish the context inNew Jersey, the next sections focus on the relationships among different levels of government.
State Government
There are three ways in which state action affects local government IT management: mandates,grants, and technical assistance. Clearly, mandates, while they have some limited potential tobenefit local governments, are predominantly constraints, while grants and technical supportare clearly benefits. The effect of the constraints and value of the benefits are partially linkedto the size and level of IT management in New Jersey local government. As governmental unitsget larger and IT management capacity increases, state-level mandates become more restrictiveand the value of technical support declines. Generally, grants always provide some benefits,though many of the granting programs are aimed to support municipalities at the lowest levelsof IT. All seven municipalities in the study face state government mandates that constrain ITcapacity by requiring specific standards. The major benefit they receive from the state comes inthe form of capital grants for upgrading infrastructure and as cost discounts for bulk purchases.
Special Districts and County Governments
Special districts and counties can provide support in the form of services or capital, but theiradditional service demands or mandates can also be constraints. While historical contexts tendto frame each municipality’s situation, good management requires the capacity to adjust andmodify these relationships. One of the major IT capacity issues is that of obtaining and main-taining the capital infrastructure of the IT system. In this area, several of the local governmentshave partnered with other overlapping jurisdictions to piggyback either capital grants or capi-tal financing projects. This clearly seems to be a sign of enhanced IT management capacity.
A second observation relates to operational management of IT systems and the municipali-ties’ relationships with other governments. The nature of these relationships varies, but alwaysfalls between the two extremes of providing services to other units and delegating the provi-sion of services to other units. Municipalities could execute the latter extreme by formally con-tracting out the services or simply handing over entire responsibilities or roles. None of theseven municipalities provides services to other jurisdictions, but it is possible. However, onemunicipality tried to develop a system for tracking welfare payments to municipal residentsand found the state-level constraints and requirements problematic. Ultimately, the municipal-ity decided to let the county handle all data collection and verification of welfare payments.This case illustrates both the constraining effects of state requirements (and federal reportingrequirements) and workload balancing across jurisdictional boarders.
Police Services
Police services are clearly an internal element of all these municipalities with direct political
Information Technology Management 115
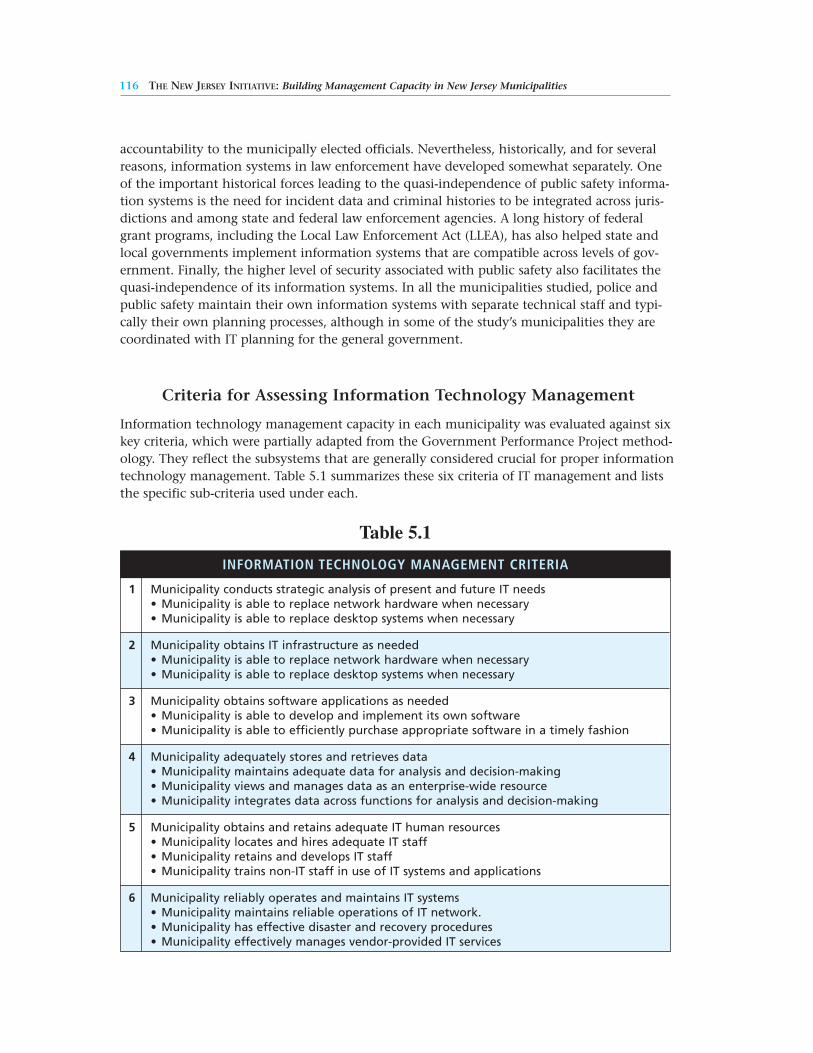
116 THE NEW JERSEY INITIATIVE: Building Management Capacity in New Jersey Municipalities
accountability to the municipally elected officials. Nevertheless, historically, and for severalreasons, information systems in law enforcement have developed somewhat separately. Oneof the important historical forces leading to the quasi-independence of public safety informa-tion systems is the need for incident data and criminal histories to be integrated across juris-dictions and among state and federal law enforcement agencies. A long history of federalgrant programs, including the Local Law Enforcement Act (LLEA), has also helped state andlocal governments implement information systems that are compatible across levels of gov-ernment. Finally, the higher level of security associated with public safety also facilitates thequasi-independence of its information systems. In all the municipalities studied, police andpublic safety maintain their own information systems with separate technical staff and typi-cally their own planning processes, although in some of the study’s municipalities they arecoordinated with IT planning for the general government.
Criteria for Assessing Information Technology Management
Information technology management capacity in each municipality was evaluated against sixkey criteria, which were partially adapted from the Government Performance Project method-ology. They reflect the subsystems that are generally considered crucial for proper informationtechnology management. Table 5.1 summarizes these six criteria of IT management and liststhe specific sub-criteria used under each.
Table 5.1
INFORMATION TECHNOLOGY MANAGEMENT CRITERIA
1 Municipality conducts strategic analysis of present and future IT needs• Municipality is able to replace network hardware when necessary• Municipality is able to replace desktop systems when necessary
2 Municipality obtains IT infrastructure as needed• Municipality is able to replace network hardware when necessary• Municipality is able to replace desktop systems when necessary
3 Municipality obtains software applications as needed• Municipality is able to develop and implement its own software• Municipality is able to efficiently purchase appropriate software in a timely fashion
4 Municipality adequately stores and retrieves data• Municipality maintains adequate data for analysis and decision-making• Municipality views and manages data as an enterprise-wide resource• Municipality integrates data across functions for analysis and decision-making
5 Municipality obtains and retains adequate IT human resources• Municipality locates and hires adequate IT staff• Municipality retains and develops IT staff• Municipality trains non-IT staff in use of IT systems and applications
6 Municipality reliably operates and maintains IT systems• Municipality maintains reliable operations of IT network.• Municipality has effective disaster and recovery procedures• Municipality effectively manages vendor-provided IT services
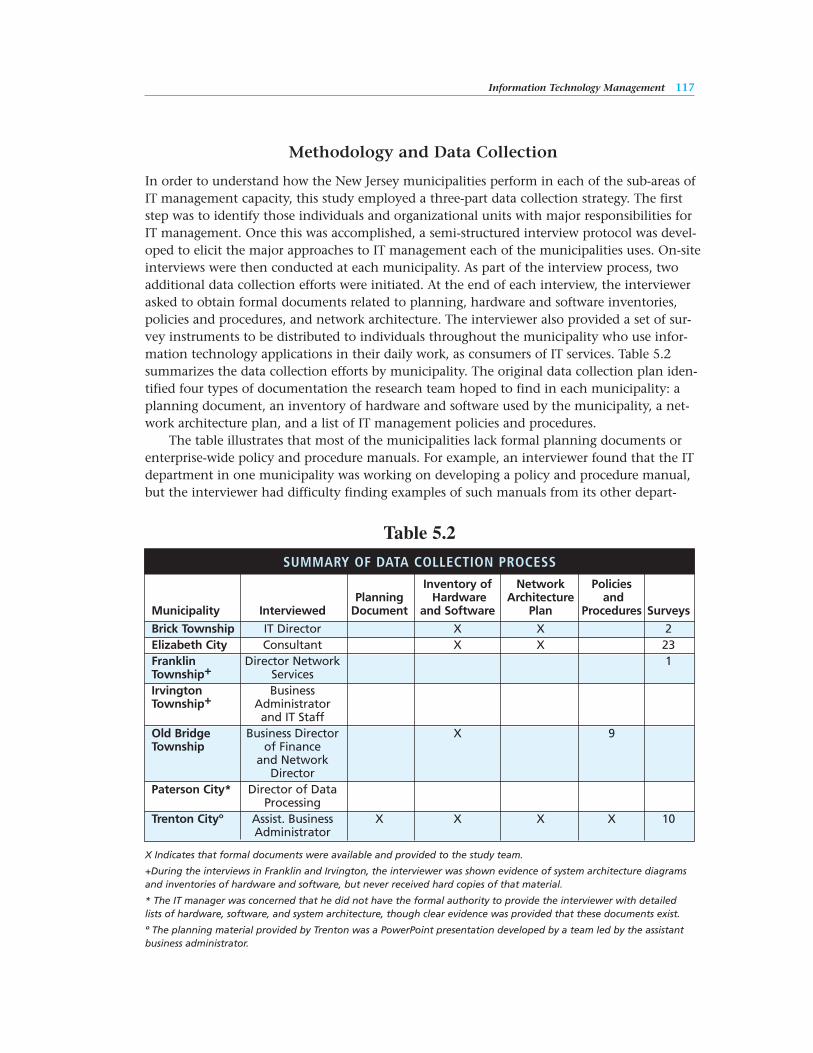
Information Technology Management 117
Methodology and Data Collection
In order to understand how the New Jersey municipalities perform in each of the sub-areas ofIT management capacity, this study employed a three-part data collection strategy. The firststep was to identify those individuals and organizational units with major responsibilities forIT management. Once this was accomplished, a semi-structured interview protocol was devel-oped to elicit the major approaches to IT management each of the municipalities uses. On-siteinterviews were then conducted at each municipality. As part of the interview process, twoadditional data collection efforts were initiated. At the end of each interview, the interviewerasked to obtain formal documents related to planning, hardware and software inventories,policies and procedures, and network architecture. The interviewer also provided a set of sur-vey instruments to be distributed to individuals throughout the municipality who use infor-mation technology applications in their daily work, as consumers of IT services. Table 5.2summarizes the data collection efforts by municipality. The original data collection plan iden-tified four types of documentation the research team hoped to find in each municipality: aplanning document, an inventory of hardware and software used by the municipality, a net-work architecture plan, and a list of IT management policies and procedures.
The table illustrates that most of the municipalities lack formal planning documents orenterprise-wide policy and procedure manuals. For example, an interviewer found that the ITdepartment in one municipality was working on developing a policy and procedure manual,but the interviewer had difficulty finding examples of such manuals from its other depart-
X Indicates that formal documents were available and provided to the study team.
+During the interviews in Franklin and Irvington, the interviewer was shown evidence of system architecture diagramsand inventories of hardware and software, but never received hard copies of that material.
* The IT manager was concerned that he did not have the formal authority to provide the interviewer with detailedlists of hardware, software, and system architecture, though clear evidence was provided that these documents exist.
º The planning material provided by Trenton was a PowerPoint presentation developed by a team led by the assistantbusiness administrator.
Table 5.2
SUMMARY OF DATA COLLECTION PROCESS
Inventory of Network PoliciesPlanning Hardware Architecture and
Municipality Interviewed Document and Software Plan Procedures Surveys
Brick Township IT Director X X 2Elizabeth City Consultant X X 23Franklin Director Network 1Township+ ServicesIrvington BusinessTownship+ Administrator
and IT StaffOld Bridge Business Director X 9Township of Finance
and Network Director
Paterson City* Director of Data Processing
Trenton Cityº Assist. Business X X X X 10Administrator
ments. Few of these departments have complete and systematic manuals; rather they rely ona series of separate documents and memos to provide procedure and policy guidance.
Results: Information Technology Management in New Jersey Municipalities
This section of the chapter summarizes the various approaches the New Jersey municipalitiesuse for planning, capital procurement and maintenance, applications development, datamanagement, human resources management, and system maintenance components of ITmanagement capacity. Under each of these topics, general strategies are identified, alongwith the various strengths and weaknesses of each.
Information Technology Planning Capacity
It is important to recognize that the capital infrastructure for local government IT systemsrequires some formal planning similar to capital planning associated with capital budgets.The planning process for IT is often ad-hoc and episodic, like capital planning in general atthe local government level. One municipality that admitted having no formal planningprocess for IT had, nevertheless, successfully upgraded the hardware infrastructure for its net-work, including a new telephone system. Certainly the successful upgrade required someplanning, but it was not done as part of a routinized, on-going planning process for IT.
Based on their interviews, researchers found that three municipalities have no formal ITplanning process at all; one municipality had used formal planning to prepare and imple-ment a large-scale capital upgrade to its network, but currently ties IT planning to the annualbudget process; one municipality characterizes its planning process as top-down, based ongeneral directions for IT coming from the business and assistant business administrators butdeveloped through a team effort which also made effective use of capital budgeting to planfor IT capital issues; one municipality claims to have a five-year plan that is revised annually,but implementation remains tied to the budget process; one identified the use of a multiyearplan implemented via monthly committee meetings, one municipality indicated it had twoplanning processes – one to manage plans for public safety, and the other to manage IT plansfor the general government. Not surprisingly, at some point, most planning turns to imple-mentation, and even the municipalities that claimed to have no formal planning processhave some minimal IT planning embedded in their budget processes.
There are two salient dimensions that emerge from these data. The first is the extent towhich the process includes multiple units and actors when something other than budgetary-based planning exists. The trade-off here is an old one. Involving more actors requiresincreased coordination and transaction costs, but should lead to a better matching of plansand needs. On the other hand, involving fewer actors reduces the cost of planning, but thiscan result in poorer matching of plans to needs (March and Simon, 1958, 24-29). In govern-ments with new administrative leadership (i.e., newly hired business administrators), the useof a more top-down-directed planning process might be beneficial in the beginning.
The second dimension to the IT planning process is time. The time dimension includesthe plan’s horizon (i.e., five years ahead) and the frequency of updates and coordination.Once again, a trade-off is evident; plans with longer horizons and less frequent updating andcoordination activities are more likely to become outdated. On the other hand, shorter time
118 THE NEW JERSEY INITIATIVE: Building Management Capacity in New Jersey Municipalities
Information Technology Management 119
horizons and/or more frequent updating and coordination activities require commitment ofmore resources to planning and result in higher transaction costs.
In general, those municipalities with any type of planning process are further along inthe development of their information systems and exhibit greater IT capacity. In the munici-pality that used a multiyear plan for its recent network upgrade but currently ties planningto the budget process, some additional IT planning capacity exists, since the budget directoralso provides a long-term vision for IT by following a top-down approach. On the otherhand, the municipality utilizing a five-year plan with monthly updates and implementationsubject to the budget process does not seem to have more capacity than municipalities usingother forms of planning. The critical factor for capacity is either someone at the top provid-ing some longer-term vision or direction or the existence of a more formal multiyear process.
Capital Procurement and Maintenance Capacity
There are two parts to capital procurement and maintenance capacity: the major large-scaleprocurement and the replacement process. All seven municipalities were clear about thesetwo distinctions. They had all gone through some sort of major network update process inthe past five or six years and, as noted earlier, had varying ties to planning while goingthrough that update.
For large-scale capital purchases such as upgrading networks, municipalities used threedistinct strategies. One municipality pooled a capital bond with the local school board tofund a one-time upgrade of the core network system. At least two other municipalities indi-cated they use bonds on occasion to finance network infrastructure upgrades. Two otherstrategies employed by municipal governments are the use of grants from federal and stategovernments (particularly for specific uses such as police or traffic systems), and internalfunding of one-time operating budget expenditures.
The strategies for handling replacement of individual machines, usually used for desktopoffice applications, typically revolve around the budget process, with some form of adminis-trative oversight. Based on the interviews, two municipalities had set up a four- or five-yearcycle in which they planned to replace 25 percent of the desktop systems funded throughthe IT unit each year, and in the fifth year replace the network infrastructure. One of thesemunicipalities was in its second or third year of the cycle when a new incoming mayormade IT a priority by establishing a new independent unit with a large capital budget. Theremaining five municipalities handle the replacement of desktop systems through decentral-ized requests by departments, with implementation through the standard budget process. Inthese situations, some centralized IT management group or unit usually controls the pro-curement process through use of a state vendor list, blanket procurement contracts, hard-ware standards, and direct control of ordering equipment.
Upgrading the core infrastructure remains problematical for all these local governments.However, all but one municipality had successfully upgraded their network hardware sometime in the past five years, and all successfully provide office automation and desktop appli-cation in at least one location, with most municipalities actually running sophisticated localand wide-area networks (LANs and WANs). Even in the municipality that successfully updat-ed its infrastructure two years before this project through a joint bond issue, it is clear thatfew of these municipalities have long-term planning capacity oriented towards the nextmajor cycle of infrastructure updating. In general, the municipalities with effective planningprocesses have some capacity to prepare for the next round of capital purchasing and updat-
120 THE NEW JERSEY INITIATIVE: Building Management Capacity in New Jersey Municipalities
ing (see discussion of IT planning capacity, under the “Information Technology ManagementCapacity and Systems” heading above). The general story here is probably not much differ-ent than that of most local governments’ capital management. Good managers actively scanthe environment for short-term opportunities, usually in the form of grants, while trying toidentify when IT infrastructure upgrades will be needed two or three years ahead. The munic-ipalities’ successful infrastructure upgrades attest to their high-quality leadership in the pres-ent, but they lack the institutionalization and capacity necessary to systematically replicatethose successes in the future.
Municipal government managers’ management of the hardware replacement process isbetter. The general approach – handling replacement through the budget process with ITmanagement oversight – provides adequate institutional capacity. However, functionaldepartmental managers, with the exception of public safety, often do not make IT a priority,which leads to some problems. One municipality has established a central replacement fund;this has some benefits, but also some hidden costs. The principle benefit is that all depart-ments can expect uniform treatment and do not have to trade off IT needs with functionalneeds. The problem with this approach is that the IT department’s budgeting of resources,like all government budgets, is subject to environmental pressures. The central replacementfund was initiated when a new mayor made IT a priority – but what happens when prioritieschange? Early scholarship on public management information systems suggests that politicalcycles cause government planning and implementation for IT to look different than process-es found in business (Bozeman and Bretschneider, 1986). During one interview, a long-timemanager noted that his municipality could not use a fixed replacement cycle internally fund-ed by the IT unit due to the uncertainty of the political process.
Application Development and Procurement Capacity
Applications are IT solutions to problems. Given the current technology, applications areappropriate at a number of different levels. Payroll applications tend to be government-wide,as are human resource systems. Most major applications, though, tend to involve individual
functional departments or subunits of a department. Some applicationsoperate at a micro level, supporting the activity of individuals. Forexample, most desktop applications, such as word processing and e-mail, function at the individual level. At the same time, some of thetools that are readily available for the desktop environment can be andare used to develop broader applications. For example, one municipali-ty uses Microsoft Access, a desktop database tool, to develop numerousapplications at both the enterprise level and the department level.
There are two approaches to obtaining and implementing applica-tions: build them using internal staff or purchase them from vendors.All the municipalities purchased their operating system software fortheir networks and desktop applications, which typically use Microsoft
Office products. While there is some variation across the seven municipalities, all office sys-tems include word processing and e-mail, and most also include a spreadsheet tool andaccess to the Internet. Office systems have dramatically increased IT management capacity byproviding all general managers with the ability to manage data and develop their own appli-cations through the use of IT. This capacity is enhanced or constrained by the extent towhich the IT technical staff provides support through tutorials, online help, and training the
There are twoapproaches toobtaining and implementingapplications: buildthem using internalstaff or purchasethem from vendors.
Information Technology Management 121
end-user community. This aspect of IT management capacity will be discussed in the humanresources section below.
At the department and overall governmental unit levels, the interview process revealedthat only three municipalities maintain significant internal capacity to generate their ownsoftware applications. Most commonly, the municipalities rely on vendors to provide appli-cations. As they do for hardware, they use the budget process to monitor and control thisprocurement process at the department level. The nature of IT control over software purchas-es varies. Typically, the IT department ensures that applications are technically compatiblewith the hardware and operating system software that will run the applications. There is lit-tle evidence that some form of cost-benefit analysis or benchmarking is also required,although the IT managers who were interviewed did seem to be current with the latest arrayof software products. Those municipalities with internal capacity to generate applicationstypically rely on end-use tools such as Access, Excel, and SQL Server. These three municipali-ties have successfully used this capacity to augment their application development, andhence their overall IT management capacity. In general, though, the governments’ dominantapproach was to use vendors rather than develop applications internally.
The make-versus-buy issue for applications involves a very important set of trade-offs.Maintaining the internal capacity to write software, even with end-use tools, results in signif-icant overhead costs. Human resource expenditures are the principle cost components,including but not limited to recruitment, training, salary, and turnover. While these are typi-cal human resource costs for any internally provided activity, they tend to be higher for ITbecause of the high-demand and low-supply characteristics of the IT labor market, even inthe post-dot-com business environment. There are also maintenance and training costsassumed directly by the government when it produces the application (Selden, Ingraham,and Jacobson, 2001). Some of these costs are mitigated by the use of newer application devel-opment tools like Microsoft Access.
The benefits tend to outweigh the costs for these three governments that generate theirown software applications. The principle benefits are a quick turnaround time for develop-ment and enhanced flexibility. Also, applications can be tailored to the municipalities’ specif-ic needs, so they do not have to work with more complex systems designed to handle anytype of situation. Another advantage is the IT unit’s enhanced capacity to provide help andsupport for individual applications and small applications developed in the office environ-ment. In one municipality, this capacity has also enabled the integration of data acrossdepartments and applications into a rudimentary database that could act as a shared, govern-ment-wide resource.
Data Management Capacity
There are two extreme models for managing data. The older and still most common in localgovernment involves organizing data around specific uses or applications. This approachtends to link data to the institutions and organizational units that generate and use it. Forexample, data used to assess property taxes would most likely be maintained by the financeor taxation unit. At the same time, data on parking violations, citizen complaints, or emer-gency dispatch would be maintained separately by the relevant municipal agencies. This situ-ation leads to a great deal of data redundancy – more than one agency collects and main-tains the same data (i.e., a citizen’s name, phone number, and address), which increases pro-cessing and management costs and reduces data sharing.
122 THE NEW JERSEY INITIATIVE: Building Management Capacity in New Jersey Municipalities
The standard solution to this situation is the alternative model for data management,called the “database management system”. Under this approach, all data are integrated intoone set of interconnected files managed by an independent, usually IT-related unit. Thenapplications are developed that simply retrieve the relevant data element appropriate to theirintended use on an as needed basis. This approach minimizes redundancy and reduces barri-ers to data sharing, thus integrating data to create an enterprise-wide resource.
Using geographic information systems (GIS) is another technical IT approach thatattempts to create integration across multiple applications. GIS uses cartographic informationas a unifying mechanism. All other applications tie data about citizens, property, services,etc., to geographic locations. Applications are then thought of in terms of maps. In onemunicipality using GIS technology, several older applications were integrated by coding datasuch as fire alarms, citizen complaints, and fire station locations to map coordinates. Variousmaps that included road network and political district boundaries were then generated.
In all the municipalities, the main orientation to data management is through applica-tions for specific uses and users. Four municipalities have begun thinking about more inte-grative approaches, which could enhance their data management capacity. Three of thesemunicipalities identified GIS as the approach they are pursuing, and one, which is also inter-ested in GIS, has moved toward establishing a partial database approach to data integration.One of the municipalities focusing on GIS has made significant progress and demonstratedseveral GIS applications that integrated data across multiple uses. Yet even in this context –while the municipality was successfully implementing GIS applications – each new use ofGIS required its own data files and requirements and was not directly integrated with previ-ous applications. The municipality that has taken the database approach began with proper-ty tax data based on land parcels, but extended it to individuals living in the district; thus, itfocused on citizens as the unit. The municipality augmented standard assessment data formulti-family units to include citizens, and used this citizen model as the base for several newapplications. For example, when people apply for a dog license, they are identified in the citi-zen database. The dog license data is then integrated with other applications, like propertytaxes, which are also tied to the citizen database.
Clearly, integrative approaches such as database management and GIS have great poten-tial to enhance a municipality’s IT management capacity. Unfortunately, there are majorproblems in implementing these approaches. It is not surprising that GIS is currently viewedas the favored approach in most of the municipalities. This is partly because the New JerseyState government is providing strong incentives for local governments to adopt GIS, primari-ly in the context of property tax management. Tax mapping is viewed as a natural GIS appli-cation, and it is the primary application identified in all four municipalities that mentionedGIS. While GIS software is readily available, it requires a rather high level of sophistication toadminister. It is not a final application like general ledger software, but rather an applicationdevelopment tool that requires some investment in staff and application development by themunicipality itself. As noted earlier, the idea of having some application development capaci-ty is useful, but due to the level of technical sophistication it requires, this capacity is moreexpensive than other forms of application development (i.e., Microsoft Access programming).Both GIS and database systems also require a significant organizational commitment of spe-cialized resources and a commitment to organizational change. For example, using a data-base requires individual units to relinquish some of their control over data.
Information Technology Management 123
Information Technology Human Resources Management Capacity
There are two major components of IT human resources management capacity – hiring andretaining IT staff and training other staff on various applications. All of the municipalitieshave technical staff in place to maintain operation of the IT infrastructure. One municipalityhas contracted out infrastructure operations, but also has some IT staff of its own. Themunicipalities with internal capacity to develop their own applications have more staff thanthose without that capacity. In one of those municipalities, the driving force is a consultantwho also teaches IT at a local college. This relationship helps provide the municipality withprogramming staff. As the consultant noted, “I hire my own students, and then when theymove on to better jobs, I hire some new ones.” In general, though, programming and sys-tems analysis staff are more expensive than operational staff. This helps to explain why onlythree of the seven municipalities have these people. Most of the IT staff that work in all themunicipalities came with the requisite skills and certification. Only one municipality sent ITstaff for additional training at the municipality’s expense.
The use of standardized office automation products reduces the need for training. Duringthe interviews, most of the municipalities indicated that the use of Microsoft Office and/orLotus SmartSuite helped lower the demand for end-user training. Indeed, many existing staffand new hires have experience with these applications, the software has extensive tutorialand help features, and there are many privately available sources for self-training (i.e., profes-sional books and adult education classes). Nevertheless, the almost complete diffusion ofoffice automation tools in these municipalities generates a very large demand for training,and more significantly, for help with specific questions and issues. All of the intervieweesidentified demands for help and training as almost infinite. Several municipalities are plan-ning to develop Internet training modules and documents to help manage this demand, butall continue to recognize it as a major problem. One municipality identified it as the singlemajor constraint.
Training is handled in several different ways. In municipalities where IT applications aredeveloped internally, both the IT departments and the functional departments that use theapplications have training responsibilities. As noted earlier, most of the municipalities relyexclusively on vendor-provided software, and municipalities that develop applications inter-nally also often buy software from vendors. Consequently, vendors are used heavily in theprovision of training. Several municipalities indicated that vendor-provided training is inade-quate and often requires unexpected add-on costs.
Table 5.3 summarizes the results from the IT consumer survey. Although five municipali-ties provided some responses, only one municipality generated enough data for any reliablestatistical analysis, so the summary pools the data from all five municipalities. Analysis ofdifferences across the three municipalities with nine or more survey responses suggests thereare no real differences. The typical IT user works with their computer application an averageof more than four hours per day. The 45 respondents use more than 20 different applica-tions, ranging from office applications to general complaint and service request systems thatdirectly interface with citizens, to internal management systems like general ledger systems.More than 78 percent of the respondents received formal training in the application theyuse, and training averaged about five hours. Twelve of the respondents indicated formaltraining of a full day or more, and half of them had training that took more than five days.As noted earlier, training was provided mainly from three sources: the municipal IT depart-ment, functional agencies, and vendors.
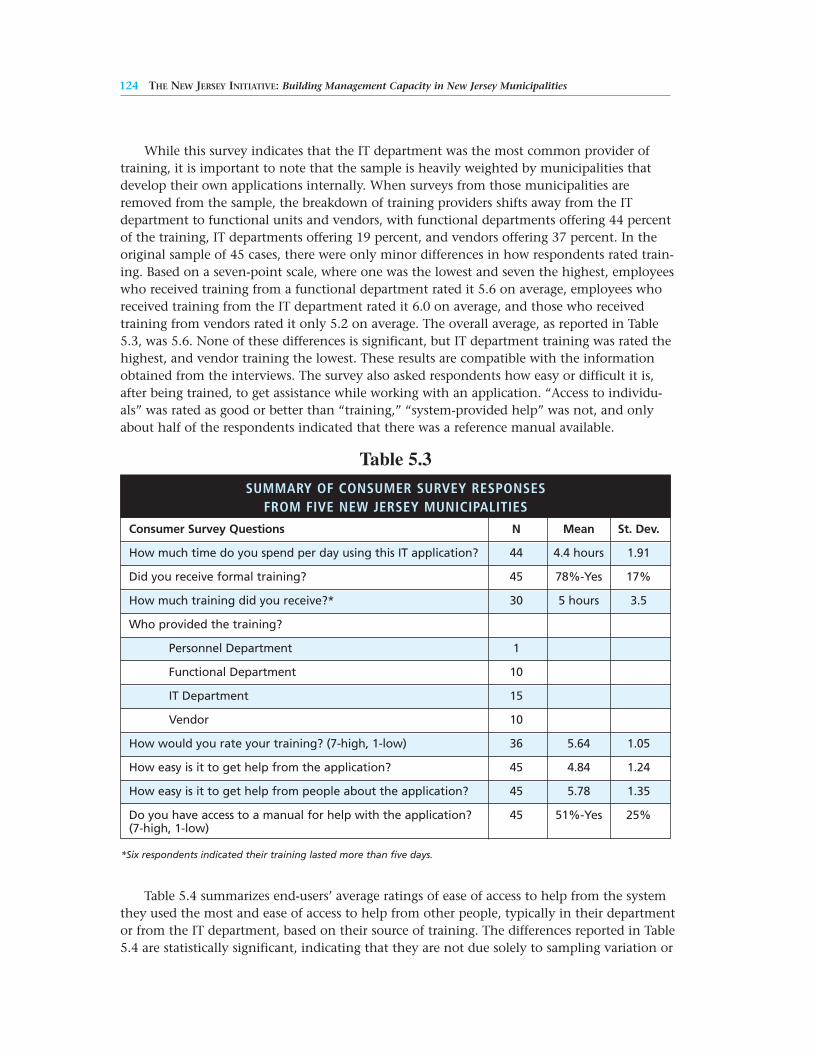
While this survey indicates that the IT department was the most common provider oftraining, it is important to note that the sample is heavily weighted by municipalities thatdevelop their own applications internally. When surveys from those municipalities areremoved from the sample, the breakdown of training providers shifts away from the ITdepartment to functional units and vendors, with functional departments offering 44 percentof the training, IT departments offering 19 percent, and vendors offering 37 percent. In theoriginal sample of 45 cases, there were only minor differences in how respondents rated train-ing. Based on a seven-point scale, where one was the lowest and seven the highest, employeeswho received training from a functional department rated it 5.6 on average, employees whoreceived training from the IT department rated it 6.0 on average, and those who receivedtraining from vendors rated it only 5.2 on average. The overall average, as reported in Table5.3, was 5.6. None of these differences is significant, but IT department training was rated thehighest, and vendor training the lowest. These results are compatible with the informationobtained from the interviews. The survey also asked respondents how easy or difficult it is,after being trained, to get assistance while working with an application. “Access to individu-als” was rated as good or better than “training,” “system-provided help” was not, and onlyabout half of the respondents indicated that there was a reference manual available.
Table 5.4 summarizes end-users’ average ratings of ease of access to help from the systemthey used the most and ease of access to help from other people, typically in their departmentor from the IT department, based on their source of training. The differences reported in Table5.4 are statistically significant, indicating that they are not due solely to sampling variation or
124 THE NEW JERSEY INITIATIVE: Building Management Capacity in New Jersey Municipalities
Table 5.3
*Six respondents indicated their training lasted more than five days.
SUMMARY OF CONSUMER SURVEY RESPONSES FROM FIVE NEW JERSEY MUNICIPALITIES
Consumer Survey Questions N Mean St. Dev.
How much time do you spend per day using this IT application? 44 4.4 hours 1.91
Did you receive formal training? 45 78%-Yes 17%
How much training did you receive?* 30 5 hours 3.5
Who provided the training?
Personnel Department 1
Functional Department 10
IT Department 15
Vendor 10
How would you rate your training? (7-high, 1-low) 36 5.64 1.05
How easy is it to get help from the application? 45 4.84 1.24
How easy is it to get help from people about the application? 45 5.78 1.35
Do you have access to a manual for help with the application? 45 51%-Yes 25%(7-high, 1-low)
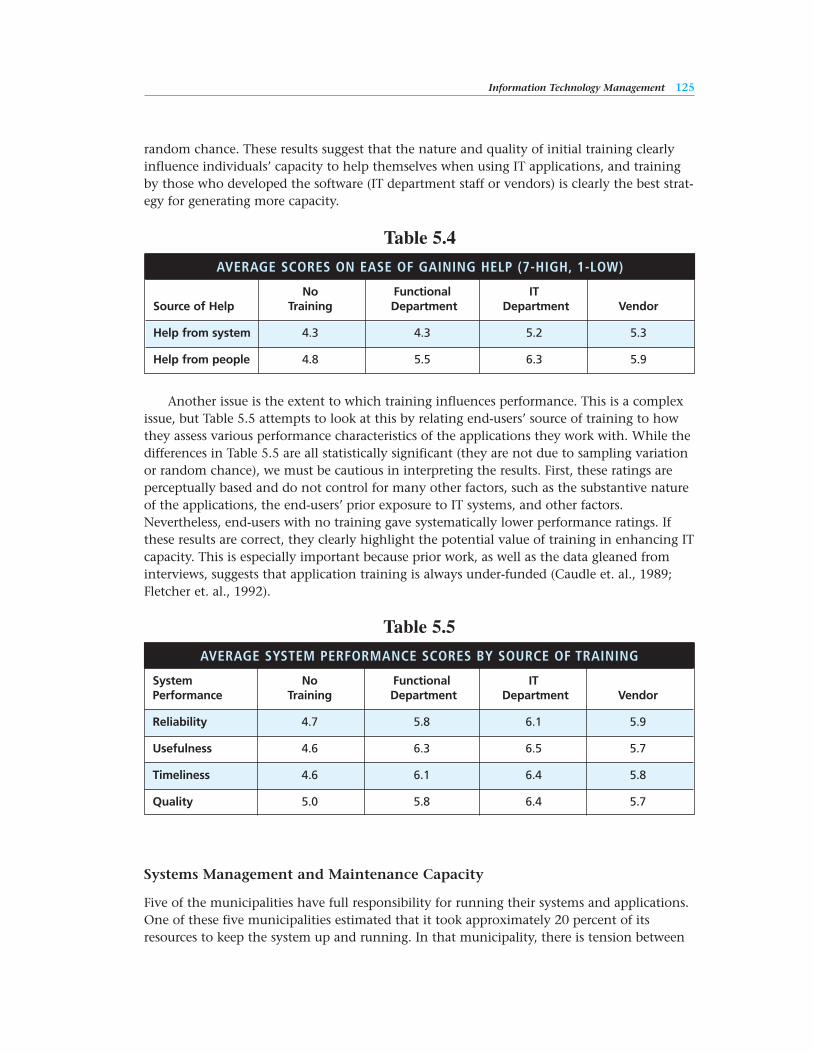
random chance. These results suggest that the nature and quality of initial training clearlyinfluence individuals’ capacity to help themselves when using IT applications, and trainingby those who developed the software (IT department staff or vendors) is clearly the best strat-egy for generating more capacity.
Another issue is the extent to which training influences performance. This is a complexissue, but Table 5.5 attempts to look at this by relating end-users’ source of training to howthey assess various performance characteristics of the applications they work with. While thedifferences in Table 5.5 are all statistically significant (they are not due to sampling variationor random chance), we must be cautious in interpreting the results. First, these ratings areperceptually based and do not control for many other factors, such as the substantive natureof the applications, the end-users’ prior exposure to IT systems, and other factors.Nevertheless, end-users with no training gave systematically lower performance ratings. Ifthese results are correct, they clearly highlight the potential value of training in enhancing ITcapacity. This is especially important because prior work, as well as the data gleaned frominterviews, suggests that application training is always under-funded (Caudle et. al., 1989;Fletcher et. al., 1992).
Systems Management and Maintenance Capacity
Five of the municipalities have full responsibility for running their systems and applications.One of these five municipalities estimated that it took approximately 20 percent of itsresources to keep the system up and running. In that municipality, there is tension between
AVERAGE SYSTEM PERFORMANCE SCORES BY SOURCE OF TRAINING
System No Functional ITPerformance Training Department Department Vendor
Reliability 4.7 5.8 6.1 5.9
Usefulness 4.6 6.3 6.5 5.7
Timeliness 4.6 6.1 6.4 5.8
Quality 5.0 5.8 6.4 5.7
Information Technology Management 125
Table 5.4
AVERAGE SCORES ON EASE OF GAINING HELP (7-HIGH, 1-LOW)
No Functional ITSource of Help Training Department Department Vendor
Help from system 4.3 4.3 5.2 5.3
Help from people 4.8 5.5 6.3 5.9
Table 5.5
126 THE NEW JERSEY INITIATIVE: Building Management Capacity in New Jersey Municipalities
the IT unit and the police department, which has a long history of running an independentIT system. Most of the municipalities noted that police systems typically have their ownapplications, equipment, and IT professional staff and run semi-autonomously from the gen-eral government systems. Despite this, most of the general government IT management pro-vided some level of support to police systems, such as emergency response planning and sys-tem backups. Municipalities with good leadership and adequate IT management capacityinclude some form of coordination between the general government systems and public safe-ty, usually through planning activities.
The three basic models for operations found in the municipalities are client server sys-tems, departmental computing, and contracted services. All the municipalities use both clientserver approaches and departmental systems approaches to some extent. Most municipalitiesuse a client server approach to manage operations of the office automation systems. In thosemunicipalities with significant internal application development capacity, client serverapproaches, where centrally provided software are accessed locally through a network, are
also used to provide application to various agencies. As noted above,the most common application of departmental computing systems is inpublic safety systems, although other departments, such as engineering(e.g., GIS systems) and finance, are also able to maintain their ownmachine and/or applications. Two municipalities contract out for cen-tral data processing and maintenance activities, although they alsohave their own WAN for office automation. One of these two munici-palities has excellent leadership but is still struggling with infrastructureissues. In both of these municipalities, all or part of the payroll dataprocessing application is contracted out.
Another important part of operating IT systems and applications ishandling data entry. The nature of the software application and the uses of the data typicallydetermine who will be responsible for the data entry process. In most cases, individuals andorganizational units that are most likely to use the data perform the data entry. Most dataentry is done in a decentralized manner. Even some enterprise-wide applications such ashuman resource and financial applications tend to rely on data entry by those agencies ratherthan a central IT group.
There is a strong correlation between those municipalities with strong IT leadership andinternal application development capacity, where internal applications development capacityincludes capacity to run and maintain their locally developed IT applications. The most com-mon source of IT leadership in these municipalities typically emanated from business admin-istrators or financial directors. In four municipalities, IT is directly responsible to either busi-ness administration or finance, and two of them were relatively well-off with regard to ITcapacity. In three municipalities, IT is more independent and self-standing, with IT profes-sionals providing leadership. At least two of these municipalities have strong programs, whilethe third is in a more developmental state. This suggests that both of these leadershiparrangements can be successful.
There is a strongcorrelation betweenthose municipalitieswith strong IT leadership and internal applicationdevelopmentcapacity...
Information Technology Management 127
Summary
Information technology management capacity is determined by many factors – some directlyunder management’s control and some not. While political variables have been systematical-ly excluded because they are outside the domain of this study, they clearly have a largeimpact on overall IT management capacity (Bozeman and Bretschneider, 1986; Kraemer andDedrick, 1997). Similarly, a municipality’s economic and historic environment also plays alarge role in determining IT management capacity. Consequently, this study has purposelytried to avoid characterizing a municipality as having either good or bad IT management orIT management capacity. Instead, it has opted to identify the various institutional and mana-gerial approaches used within these municipalities for dealing with the six different sub-com-ponents of IT management. From this analysis, several important lessons may be gleaned.Any lesson’s particular relevance to a specific situation requires careful consideration of manyother factors; and, as noted above, those factors are often not completely under the controlof management. Nevertheless, some points seem to correlate well with situations in whichhigh levels of IT management capacity are present.
Recommendations for New Jersey Municipalities
The following is a list of the recommendations for these seven New Jersey municipalities;additionally, they may have application for other New Jersey municipal governments in simi-lar circumstances.
1. Take advantage of county government as a possible service provider, particularly forspecific data management functions. This type of cooperation can be used to reducecost, as well as build cooperative capacity for other purposes such as planning and cap-ital purchasing (see Recommendation 3).
2. Develop and maintain a formal multiyear IT planning process with specific compo-nents related to capital planning for IT infrastructure.
3. Take advantage of capital pooling with the county or special jurisdictions, especiallyschools and libraries when they purchase IT hardware.
4. Develop some internal capacity to generate applications; but it should not be the onlyvehicle for application development. Sole reliance on vendors for software dramaticallyreduces a municipality’s IT management capacity.
5. Develop and maintain a strong internal IT capacity to evaluate vendor provided soft-ware to ensure compatibility with network hardware, software, and load requirements.
6. Develop an integrative approach to data management, which treats data as an enter-prise-wide resource via database management systems and/or GIS.
7. Offer more IT training and have it provided by IT staff and vendors. Training for theuse of IT applications is even more important than is typically thought.
8. Training can be augmented through use of local adult education programs, communitycolleges, and universities.
128 THE NEW JERSEY INITIATIVE: Building Management Capacity in New Jersey Municipalities
Recommendations for the State of New Jersey
The following set of recommendations is relevant to the role of the state.
1. The state should develop different strategies for local governments with different levelsof IT management capacity. While most of the existing grant and technical assistanceprograms aim to support municipalities with little or no IT management capacity, thestate does not provide much support for municipalities that already have significantcapacity.
2. For municipalities with various state agencies, the state needs to consider dataexchange mechanisms that are less restrictive and permit more flexible responses bymunicipalities.
3. While GIS is the more common approach to data management integration – in partbecause of state-level support – it is a more expensive approach, which requires special-ized hardware and software. Therefore, the state should help support the developmentof database management systems to integrate data, such as those developed by OldBridge in expanding property tax system files to citizen-level data.

Information Technology Management 129

6MANAGING FOR RESULTS
AT ALL LEVELS OF GOVERNMENT, LEADERS AND MANAGERS FACE THE CHALLENGES ofincreasing demand for efficient and effective delivery of services, growing expectations fordata documenting program performance, continuing resource limitations, and escalatingdemand for accountability. Performance-based management, also known as managing forresults (MFR), measures and reports the extent of the achievement of program goals and usesmeasures to improve program performance. The emphasis is on results. Performance meas-urement is a method of assessing the progress of public programs in achieving the results oroutcomes that citizens, clients, customers, or stakeholders expect. Simply put, managing forresults tells people how well public programs are doing, and it is an important aspect ofaccountability in government.
Government performance and accountability are the subjects of a spirited public debate.Given the prominence and ubiquity of performance demands, many government entitieshave turned to performance measurement systems in an effort to improve their efficiencyand effectiveness. Although measurement systems linked to government performance date
back at least 100 years (Moynihan and Ingraham, 2001), today’s sys-tems have grown in sophistication and relevancy. Technologicaladvances have made performance measures easier to collect andinterpret (Kamensky and Abramson, 2001). Managing for results is aprocess rather than a single technique and is characterized by itsemphasis on strategic planning, data collection, performance meas-urement, and public dissemination of results to stakeholders.Indeed, Moynihan and Ingraham (2001) note that these factors helpelevate MFR beyond previous performance-oriented reform effortssuch as management by objective (MBO), performance-based budg-eting (PBB), and zero-based budgeting (ZBB).
A review of the MFR literature reveals a wide variety of defini-tions for MFR systems. For instance, a U.S. General AccountingOffice (GAO) report links high-performing government organiza-
tions to “the dynamic and complementary process of setting a strategic direction, definingannual goals and measures, and reporting on performance” (1999, 7). Broadly defined, MFRis a customer-oriented process that facilitates benefit maximization to customers of govern-ment services while minimizing negative consequences (Hatry, 1999). More specifically,Ingraham and Donahue define MFR as:
The dominant mechanism by which leaders identify, collect, and use the informationnecessary to evaluate the institution’s performance in pursuit of key objectives to makedecisions and direct institutional actions. Managing for results comprises a set of tools
Given the prominenceand ubiquity of performance demands,many governmententities have turned toperformance measure-ment systems in aneffort to improve theirefficiency and effectiveness.
through which organizational learning processes are formalized. It is thus an impor-tant management subsystem and a key tool for leaders seeking to improve the abilityof the other subsystems to support the overall institutional management capacity andto contribute to successful policy outcomes. (2000, 303)
The most visible MFR system in place today is the statutory framework established by theGovernment Performance and Results Act (GPRA) of 1993 (Public Law 103-62), which legallyrequires virtually every federal agency to practice MFR. Statutory requirements also exist atthe state level; 33 states have passed legislation that require their agencies to practice strate-gic planning, performance reporting, performance management, performance budgeting, orany combination of them (Liner et al., 2001). For state and local levels of government thatare not bound by statutory performance measurement requirements, many must adhere toadministrative requirements established by executive orders, or by a central or oversightagency (Melkers and Willoughby, 1998a; Ingraham and Moynihan, 2001).
One widely cited justification for government organizations to practice MFR is simply toinstitutionalize a mechanism to help meet the performance standards citizen-stakeholdersexpect from government. Another is to increase stakeholder trust in government. Indeed,empirical evidence suggests that a relationship exists between stakeholders’ perception ofgovernment performance and their level of trust in that government (Kamensky andAbramson, 2001; Kohut, 1998). Moreover, performance measurement systems are considereda necessary component of effective governance, since performance measures enable citizensand public officials to evaluate the connection between policy options and their outcomes(Moore et. al, 2001).
Additional benefits of MFR systems include program evaluation, contracted and in-houseservice comparisons, and improved public communications (Moore et. al., 2001). Managingfor results systems also help inform realistic performance targets by enabling governmentagencies to evaluate their present performance against the past (Ammons, 1995). Ultimately,the sophistication of a government’s MFR system is important because the government’scapacity to properly manage its administrative infrastructure is linked to the quality of itspolicy outputs.
Managing for results is most prominent at the federal and state levels of government andhas sporadic success at the municipal level. However, a review of the managing for results lit-erature reveals that MFR use and acceptance is expanding on the local level. Lessons and bestpractices from federal and state MFR systems are trickling down to lower levels of govern-ment, and active involvement from professional associations and organizations such as theInternational City/County Management Association (ICMA), The Urban Institute, and theNational Academy of Public Administration (NAPA) is helping to facilitate its implementa-tion (Nathan, 2001; Melkers and Willoughby, 2001). Evidence also suggests that local govern-ments can implement results-based systems more easily now by borrowing and assimilatingMFR programs from any number of existing models (Walters, 1997).
However, robust MFR systems at the municipal level remain the exception, not the rule.Recent research by Poister and Streib (1999) suggests that less than 40 percent of all U.S.municipal governments practice some meaningful variation of performance measurement intheir management and decision-making processes. Furthermore, performance measurementsystems were found more frequently in municipal jurisdictions with populations larger than100,000 and in jurisdictions with council-manager forms of government rather than council-mayor types. While a minority of municipal-level governments operates exceptional, well
132 THE NEW JERSEY INITIATIVE: Building Management Capacity in New Jersey Municipalities
functioning, or improving MFR systems, David Ammons rightly argues, “most have a longway to go” (1995, 26).
Managing for Results Capacity and Systems
Municipal governments that are moving toward any MFR or performance measurement sys-tem need to assess the bounds of their managerial capacity. Management capacity is the“government’s intrinsic ability to marshal, develop, direct, and control its human, physical,and information capital to support the discharge of its policy directions” (Ingraham andDonahue, 2000, 294). This capacity resides in the administrative structures designed to over-see the government’s financial, capital, human resources, and information technology func-tions (Ingraham and Donahue, 2000). Since government functions are dynamic, capacityalso depends on the long-term maintenance of the government’s resource base through per-formance measurement, performance monitoring, and strategic planning efforts.
Moreover, capacity is also affected by government’s ability to function under variousenvironmental conditions, including resource constraints and political contexts. Since a linkexists between the quality of a government’s management capacity and the quality of its pol-icy outputs, an effective MFR system can help government leaders maximize their availableresources (Ingraham and Donahue, 2000). To summarize this argument further, managing forresults systems play an integral part in building managerial capacity, acting somewhat like alynchpin holding together, coordinating, and directing the government’s underlying finan-cial, capital, human resources, and information technology functions. Once the link betweenmanagement capacity, administrative institutions, and policy outputs is better understood,leaders can better marshal government resources in directions consistent with high perform-ance government.
Managing for results systems are made up of a series of essential components. They arestrategic planning, data collection, performance measurement, verification, and continuousfeedback. Furthermore, they can be viewed as stages of the MFR process. The remainder ofthis section will address these key stages.
Strategic Planning
Effective strategic planning is the backbone of a well-tuned MFR system. A recent GAO(1999) report notes that performance plans should link long-term goals to daily operations,and answer three core questions: does the agency have a clear understanding of intendedperformance? Does the agency have the proper balance of strategies and resources? Will theperformance information be credible? Additionally, strategic plans must also contain “a mis-sion and goals statement and a description of the indicators used to measure output and out-come” (Melkers and Willoughby, 1998b, 2). Governments and their departments should craftlong-term strategic plans that are consistent with their missions, objectives, and goals anddevelop yearly strategic plans in support of the long-term plan. Since long-term strategicplans often extend beyond the incumbency of a given administration, planners must resistthe temptation to incorporate broad, ambiguous goals into the framework.
The strategic planning process should also provide clear goals and expectations for publicmanagers and employees. Feedback from performance measurement systems allows publicmanagers and employees to monitor and link their progress to established goals and expecta-
Managing for Results 133
134 THE NEW JERSEY INITIATIVE: Building Management Capacity in New Jersey Municipalities
tions (Aristigueta, 1999) and to compare their present performance against their past perform-ance. Effective strategic planning must establish valid and attainable goals, and leaderscharged with the planning process must not set the bar so low that the government, itsdepartments, or programs can meet performance targets with little or no effort.
Effective planning also requires public managers to link performance goals to their dailyoperations (Kamensky and Abramson, 2001). Although fledgling MFR programs may lack suf-ficient data to adequately inform their initial strategic plans, the process of collecting, verify-ing, and refining performance measurements will inform the planning process in subsequentyears. The effect is also cumulative – analytical capacity increases as government offices con-tinue to amass and properly utilize performance data. However, since the planning process isso closely linked with the measurement process, effective strategic planning must also incor-porate high-quality data into the process.
Data Collection
When developing data collection systems, many government entities must first overcomeunderdeveloped analytical experience and insufficient resources. Budget and personnel con-straints, lack of institutional expertise, and simple day-to-day management tasks often frus-trate sustained data collection efforts. Moreover, well-intentioned data collection efforts maybecome an exercise in futility as enthusiasm for performance measurement systems wanes,degenerating into data collection just for the sake of collecting data.
Data can come from many sources, including “existing records, time logs, citizen/clientsurveys, trained observer ratings, and specially designed data collection processes” (Ammons,1995, 22-23). Some public services lend themselves readily to measurement, while others donot. For instance, many municipalities that do not have institutionalized MFR systemsalready measure trash collection, since the sanitation department’s “mission is unambiguous,resources are clearly identifiable, the output is readily measurable, and criteria can be derivedfor directly indicating quality” (Rosen, 1995, 58).
Deciding which data to collect to inform the planning and measurement process is a for-midable task. Generating valid, relevant, and reliable data is crucial to the overall MFRprocess (Poister, 1995). Care should be taken to collect data for measurement outcomes inaddition to simple workload outputs. It is also worth noting that not every government out-come can be measured readily in quantitative terms, and sometimes pinpointing the data foraccurate measurements may defy reasonable costs. Since data collection and processingexpend the largest portion of an MFR system’s resource base (Poister, 1995), leaders must bal-ance these costs with the expected benefits. When data are cost prohibitive or difficult to pin-point, Osborne and Gaebler (1995) suggest using the best proxies or surrogates available inthe measurement process. Rosen concurs, “not every kind of service can be readily measured,but many, if not most, can be – with a little imagination and confidence. The methodologyexists” (1995, 58).
When acceptable proxies or surrogates cannot be found, the omission of data must beidentified (Hatry, 1999). Constantly evaluating and verifying data can help improve andrefine the measurement process over time. If performance measures are found that do notaccurately represent the content of the government’s, department’s, or program’s outcomes,they can be adjusted accordingly. Another alternative is to collect and process qualitativedata, since managers can receive “valuable insight by spending time observing the program,agency, or provider; talking with workers; and listening to customers” (Osborne and Gaebler,1995, 40).
Managing for Results 135
Performance Measurement
Performance measures are simply “quantitative statements that provide information on someaspect of public services,” and function as quantitative indicators of goal attainment over aspecified period of time (Moynihan, 2001, 13). Like the data collection process, developingmetrics that accurately measure what they are intended to measure is challenging (Poister,1995). Ammons (1995) provides a criteria-based approach to performance measurement andsuggests that well-developed performance measures are valid, reliable, understandable, time-ly, resistant to perverse behavior (such as deliberate attempts to circumvent or “beat” the per-formance measure system), comprehensive, non-redundant, sensitive to data collection costs,and focused on controllable facets of performance. Additionally, performance measures aremost successful when front-line employees and supervisors assist in their development(Ammons, 1995) and stakeholder input is included during the planning process (Rosen,1995; Theurer, 1998).
Performance measurement systems report many forms of information. Within the con-text of public services, there is a strong distinction between outputs and outcomes (Hatry,1999). Output measures reflect program activities or actions that program personnel havecompleted. Examples are the tons of refuse collected, the miles of roads paved, and the num-ber of parking tickets issued. Outcome measures refer to events associated with progresstoward achievement of goals and objectives, for example the percentage of households thatparticipate in recycling programs, the number of road miles not requiring servicing within 24months of repaving, and the percentage of parking violators that are not repeat offenders.Governments that operate performance measurement systems tend to overemphasize thecollection and use of output statistics (Ammons, 1995). This is not surprising, because oftenthey are easy to collect and interpret, and in many instances output measurement collectionpredates any formalized performance measurement or MFR program.
Managers must also strike a balance between resource allocation and developing a suffi-cient number of performance measures. Too few measures may not reflect all of the organiza-tion’s goals adequately, and consequently the organization might favor some goals at theexpense of others (Osborne and Gaebler, 1995). Conversely, too many measures may squan-der organizational resources by confusing organizational priorities, overloading employeesand managers with paperwork and other details, and inhibiting the feedback process(Osborne and Gaebler, 1995).
Ultimately, the measurement process must be closely linked to the strategic planningprocess. This linkage creates a cyclical relationship, with each process informing and con-tributing to the other. As data collection and measurement undergo continuous refinement,knowledge of agency performance increases. As this knowledge informs the planningprocess, performance targets and goals are refined and improved. Ultimately, this process ofcontinuous refinement translates into improved policy and service delivery:
A well designed measurement system enables agency managers to assess the fairness ofa program, and make appropriate adjustments. A good performance measurement sys-tem will help officials demonstrate to the public and to its policymakers that servicesare delivered fairly – and this will build trust. (Hatry, 1999, 4)
Verification
Data and measurement verification is a necessary and underutilized component of the man-
aging for results process. In a recent Governmental Accounting Standards Board (GASB) per-formance measurements survey of state and local levels of government (2001), 69.9 percentof respondents (n= 489) reported that data verification is performed by the same agency ordepartment that develops the measures, 21.5 percent indicated that internal auditors verifythe data, while only 2.2 percent reported that verification is handled by external or non-governmental entities.
Since an MFR system is only as good as its ability to properly measure performance,questions of quality, relevancy, and accuracy are of utmost importance. Thus, public man-agers should take care to incorporate verification mechanisms into the overall MFR process.Hatry (1999) suggests that agency and program managers retain the primary responsibilityfor quality assessment, with only periodic reviews by independent auditors.
Continuous Feedback
Continuous feedback is the process of disseminating complete performance information tocitizen stakeholders and other interested parties, and then applying lessons from the resultsback into the strategic planning and decision-making processes. With feedback, leaders andmanagers are equipped to make better policy decisions, which leads to improved outcomes.A breakdown in the feedback process could hinder the benefits of an MFR system. Indeed,Fountain (1996) rightly argues, “Unless the data are used to inform decision-making andchange operations, they are of little consequence.” In this context, continuous feedbackbecomes a self-correcting mechanism by creating opportunities to refine and improve theMFR process from the planning stage to the decision-making stage.
Perhaps the greatest benefit of continuous feedback is an increase in accountability.However, accountability is dependent on complete, accurate, and timely analysis of perform-ance information. It is well known that incomplete information makes government account-ability very difficult to enforce (Przeworski, 1999). Public managers are confronted often withthe decision to either disseminate or withhold performance failures. When performancegoals are not met, performance reports should explain why and also include planned actionsto achieve goals in subsequent reporting periods (Hatry, 1999). While it may be tempting orpolitically convenient to omit failures from performance reports, this action underminesdecision-makers’ ability to build on their success and learn from their failure. Hatry providesan anecdotal panacea for public managers faced with the undesirable circumstance of report-ing performance that is below expectations: a city police chief in such a situation reportedlystated, “If the data looks good, I will take the credit. If the data looks bad, I will ask for moremoney” (1999, 153).
Another benefit of continuous feedback is increased trust in government. Several scholarshave linked the open and accountable culture created by MFR systems to an increased levelof stakeholder trust (Kamensky and Abramson, 2001; Thomas, 2001). Theurer suggests thatfeedback to and from stakeholders fosters an increased sense of community between govern-ments and their stakeholders:
The involvement of stakeholders in identifying outcomes also raises the awareness thatgovernment cannot achieve most outcomes by acting alone; success requires multipleorganizations collaborating together. By engaging stakeholders outside the govern-ment, organizations can acknowledge and redefine their roles in the community andhelp establish collaborative agreements. (1998, 22)
136 THE NEW JERSEY INITIATIVE: Building Management Capacity in New Jersey Municipalities
Managing for Results 137
Managing for Results Environment for New Jersey Municipalities
During the 1990s, significant progress was made among the states in the movement towardmanaging for results. By the end of 1999, according to the National Conference of StateLegislatures, 33 states had “broad governing for results legislation.” New Jersey is one of the17 states without such legislation for its state government. Consequently, the state has nostatutory requirements for agency strategic planning, performance measurement and report-ing, citizen involvement in MFR, and provisions for employee and agency incentives forachieving desired results.
Despite the lack of legislation requiring managing for results for state agencies, the exec-utive branch is committed to performance management activities. The New Jersey State Planand related planning documents contain overarching goals and performance measures. Forexample, the State Development and Redevelopment Plan prepared by the State PlanningCommission establishes a vision and identifies goals and strategies for guiding all levels ofgovernment toward achieving the goals of the State Planning Act of 1986. Additionally,Executive Order Number 96 signed by Governor Whitman on May 20, 1999, requires statedepartments and agencies to “pursue…policies which comport with the 11 sustainabilitygoals” in the Sustainable State Report. This benchmarking report, subtitled “Living With theFuture in Mind,” was completed by New Jersey Future in partnership with the Office of theGovernor and was adopted as a state plan with the executive order. The report contains indi-cators to measure progress toward the goals. Specifically, the order encourages departmentsand agencies to establish practices, exchange information, and report progress toward reach-ing sustainability goals. Another example of executive branch commitment to MFR is theinclusion in the governor’s budget of considerable performance measures.
Based on its evaluation of state MFR systems, the Government Performance Projectreported in 2001 that New Jersey’s managing for results efforts ranked approximately in themiddle among all 50 states. Thus, the state government deserves some credit; however, thereis considerable opportunity to enhance its performance management orientation. Althoughthe planning documents establish a vision and contain goals, as they should, a significantweakness is that performance measures are primarily output, not outcome, measures. Thebudget has plenty of performance measures; however, many of them are either inputs orcosts per transaction.
Since MFR efforts at the state level are not extensive, it is not surprising that the state hasno requirements for performance management levied upon its municipalities. In fact, the NJIis not aware of any state statutes, policies, regulations, documents, guidance, or trainingmaterials that reflect a requirement or expectation for municipalities to engage in MFR activi-ties. Thus, any MFR efforts by local municipal governments are practiced under the authorityof local administrative requirements. Consequently, the environment in New Jersey is onewhere conditions are ripe for elevating MFR.
Criteria for Assessing Managing for Results
Managing for results systems in each municipality were evaluated against four criteria adapt-ed from the Government Performance Project. The criteria – extent of strategic planning,extent of performance measures, use of performance data, and communication of results –
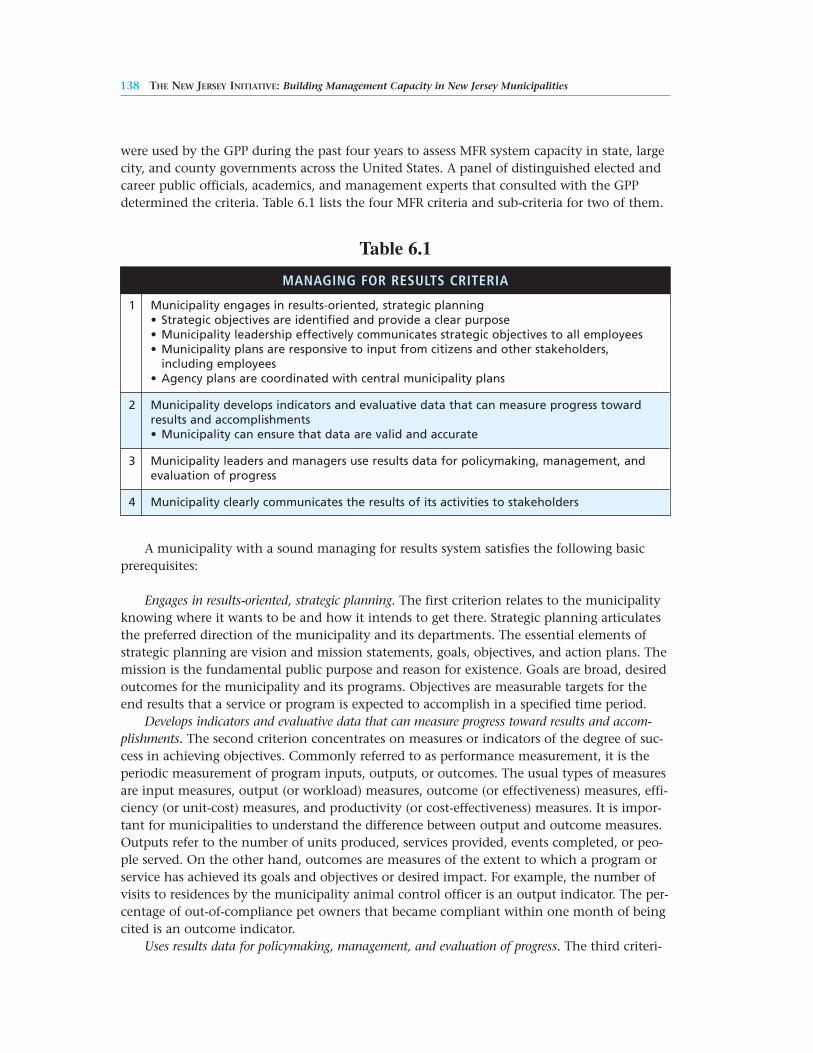
138 THE NEW JERSEY INITIATIVE: Building Management Capacity in New Jersey Municipalities
were used by the GPP during the past four years to assess MFR system capacity in state, largecity, and county governments across the United States. A panel of distinguished elected andcareer public officials, academics, and management experts that consulted with the GPPdetermined the criteria. Table 6.1 lists the four MFR criteria and sub-criteria for two of them.
A municipality with a sound managing for results system satisfies the following basicprerequisites:
Engages in results-oriented, strategic planning. The first criterion relates to the municipalityknowing where it wants to be and how it intends to get there. Strategic planning articulatesthe preferred direction of the municipality and its departments. The essential elements ofstrategic planning are vision and mission statements, goals, objectives, and action plans. Themission is the fundamental public purpose and reason for existence. Goals are broad, desiredoutcomes for the municipality and its programs. Objectives are measurable targets for theend results that a service or program is expected to accomplish in a specified time period.
Develops indicators and evaluative data that can measure progress toward results and accom-plishments. The second criterion concentrates on measures or indicators of the degree of suc-cess in achieving objectives. Commonly referred to as performance measurement, it is theperiodic measurement of program inputs, outputs, or outcomes. The usual types of measuresare input measures, output (or workload) measures, outcome (or effectiveness) measures, effi-ciency (or unit-cost) measures, and productivity (or cost-effectiveness) measures. It is impor-tant for municipalities to understand the difference between output and outcome measures.Outputs refer to the number of units produced, services provided, events completed, or peo-ple served. On the other hand, outcomes are measures of the extent to which a program orservice has achieved its goals and objectives or desired impact. For example, the number ofvisits to residences by the municipality animal control officer is an output indicator. The per-centage of out-of-compliance pet owners that became compliant within one month of beingcited is an outcome indicator.
Uses results data for policymaking, management, and evaluation of progress. The third criteri-
Table 6.1
MANAGING FOR RESULTS CRITERIA
1 Municipality engages in results-oriented, strategic planning• Strategic objectives are identified and provide a clear purpose• Municipality leadership effectively communicates strategic objectives to all employees• Municipality plans are responsive to input from citizens and other stakeholders,
including employees• Agency plans are coordinated with central municipality plans
2 Municipality develops indicators and evaluative data that can measure progress toward results and accomplishments• Municipality can ensure that data are valid and accurate
3 Municipality leaders and managers use results data for policymaking, management, and evaluation of progress
4 Municipality clearly communicates the results of its activities to stakeholders
Managing for Results 139
on centers on the use of performance information (or results data) by municipality man-agers, the mayor, council members, and other key stakeholders affected by or interested inprograms. Performance information should be used to manage programs in ways thatachieve goals and objectives and inform policy decisions.
Communicates the results of its activities to stakeholders. The fourth criterion addresses thereporting of performance data and the extent of progress toward goal accomplishment.Communication of results to stakeholders can occur in a variety of forms.
Methodology and Data Collection
The managing for results research team used a multiple-case design to produce an in-depthunderstanding of MFR systems and associated complexities in the municipalities.Additionally, the research methodology consisted of multiple data collection methods andanalysis to yield consistently and accurately derived findings. Data from each municipalitywere acquired from three sources: a questionnaire, public documents, and interviews.
First, the questionnaire was an open-ended, 10-question instrument that was a modifiedversion of the Government Performance Project MFR survey. Questions centered on the fourcriteria listed in Table 6.1. Questionnaires were administered in August 2001, and fourmunicipalities completed and submitted them. Second, documents from all the municipali-ties were obtained and analyzed during the September to December 2001 period. Documentsconsisted of strategic plans, annual reports, reports to citizens, budgets, memoranda, month-ly activity reports, summary data sheets, and speeches. Third, researchers conducted in-depth, open-ended, semi-structured interviews with business administrators or public infor-mation coordinators in each municipality in September 2001. The interviews allowedresearchers to follow up on answers provided in the questionnaires or to obtain answers fromthe municipalities that did not complete a questionnaire. Two researchers conducted theinterviews, interview protocols were followed for consistency, probing was used to obtainadditional information from respondents, interviews were tape-recorded, and transcriptswere prepared by an experienced transcriber. The interviews lasted approximately two hourseach. Both researchers analyzed the surveys, documents, and interviews using a codingprocess to determine how well the municipalities satisfied the MFR criteria, to conduct cross-case comparisons, and to generate themes and patterns from the data.
Results: Managing for Results in New Jersey Municipalities
Analysis of data from the seven municipalities revealed three majorthemes regarding the state of managing for results in the municipal-ities. First, in general, all of the municipalities lack a formalized,municipality-wide MFR system. Second, two of the municipalities,Franklin and Trenton, have rudimentary MFR systems. The otherfive municipalities – Brick, Elizabeth, Irvington, Old Bridge, andPaterson – show evidence that they are conducting some “MFR-like”elements. Third, all the municipalities experience constraints onMFR implementation. The key findings are addressed in the subsec-tions that follow. Despite the underdeveloped MFR systems existing
Analysis of data fromthe seven municipali-
ties revealed threemajor themes
regarding the state ofmanaging for results in
the municipalities.
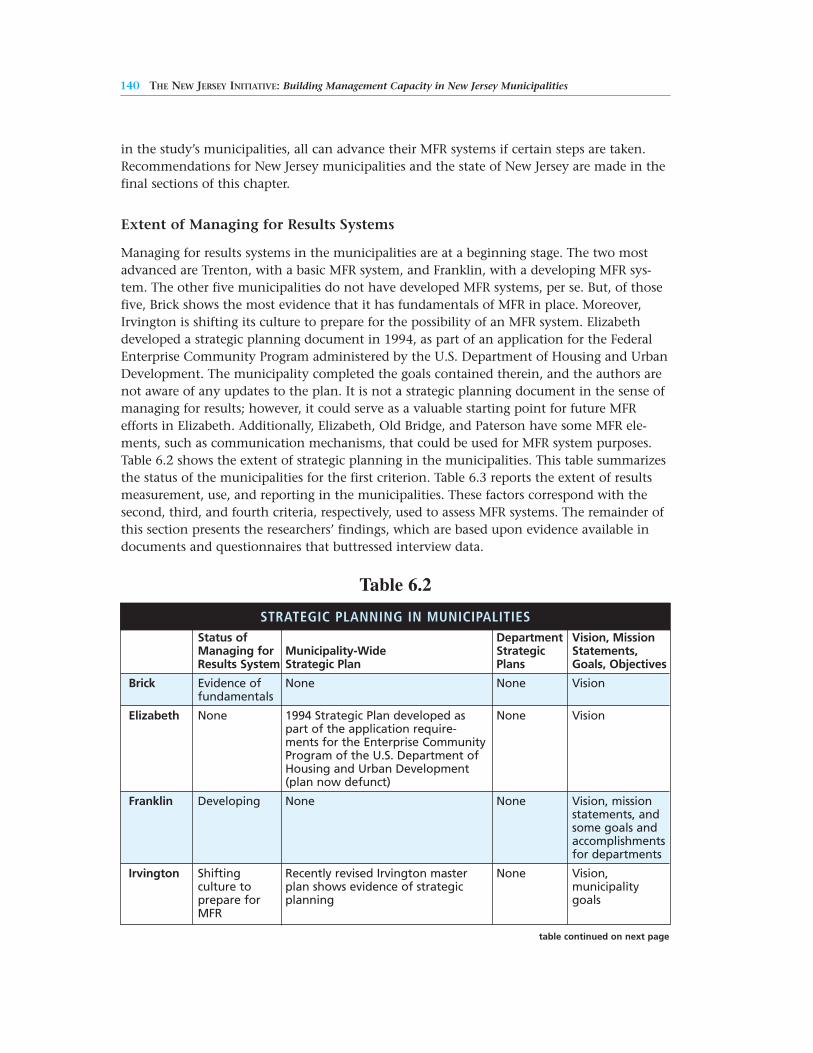
140 THE NEW JERSEY INITIATIVE: Building Management Capacity in New Jersey Municipalities
in the study’s municipalities, all can advance their MFR systems if certain steps are taken.Recommendations for New Jersey municipalities and the state of New Jersey are made in thefinal sections of this chapter.
Extent of Managing for Results Systems
Managing for results systems in the municipalities are at a beginning stage. The two mostadvanced are Trenton, with a basic MFR system, and Franklin, with a developing MFR sys-tem. The other five municipalities do not have developed MFR systems, per se. But, of thosefive, Brick shows the most evidence that it has fundamentals of MFR in place. Moreover,Irvington is shifting its culture to prepare for the possibility of an MFR system. Elizabethdeveloped a strategic planning document in 1994, as part of an application for the FederalEnterprise Community Program administered by the U.S. Department of Housing and UrbanDevelopment. The municipality completed the goals contained therein, and the authors arenot aware of any updates to the plan. It is not a strategic planning document in the sense ofmanaging for results; however, it could serve as a valuable starting point for future MFRefforts in Elizabeth. Additionally, Elizabeth, Old Bridge, and Paterson have some MFR ele-ments, such as communication mechanisms, that could be used for MFR system purposes.Table 6.2 shows the extent of strategic planning in the municipalities. This table summarizesthe status of the municipalities for the first criterion. Table 6.3 reports the extent of resultsmeasurement, use, and reporting in the municipalities. These factors correspond with thesecond, third, and fourth criteria, respectively, used to assess MFR systems. The remainder ofthis section presents the researchers’ findings, which are based upon evidence available indocuments and questionnaires that buttressed interview data.
Table 6.2
STRATEGIC PLANNING IN MUNICIPALITIESStatus of Department Vision, MissionManaging for Municipality-Wide Strategic Statements, Results System Strategic Plan Plans Goals, Objectives
Brick Evidence of None None Visionfundamentals
Elizabeth None 1994 Strategic Plan developed as None Visionpart of the application require-ments for the Enterprise Community Program of the U.S. Department of Housing and Urban Development (plan now defunct)
Franklin Developing None None Vision, mission statements, and some goals and accomplishmentsfor departments
Irvington Shifting Recently revised Irvington master None Vision, culture to plan shows evidence of strategic municipality prepare for planning goalsMFR
table continued on next page
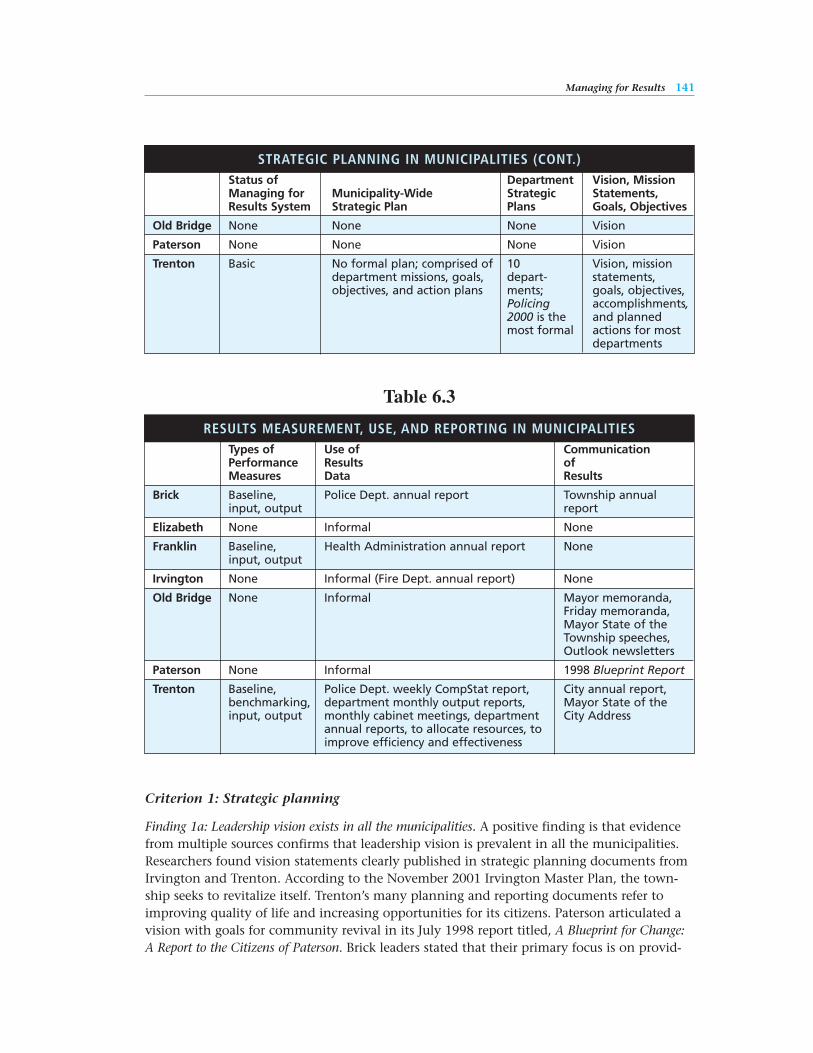
RESULTS MEASUREMENT, USE, AND REPORTING IN MUNICIPALITIESTypes of Use of CommunicationPerformance Results ofMeasures Data Results
Brick Baseline, Police Dept. annual report Township annual input, output report
Elizabeth None Informal None
Franklin Baseline, Health Administration annual report Noneinput, output
Irvington None Informal (Fire Dept. annual report) None
Old Bridge None Informal Mayor memoranda,Friday memoranda, Mayor State of the Township speeches,Outlook newsletters
Paterson None Informal 1998 Blueprint Report
Trenton Baseline, Police Dept. weekly CompStat report, City annual report,benchmarking, department monthly output reports, Mayor State of the input, output monthly cabinet meetings, department City Address
annual reports, to allocate resources, to improve efficiency and effectiveness
Managing for Results 141
Criterion 1: Strategic planning
Finding 1a: Leadership vision exists in all the municipalities. A positive finding is that evidencefrom multiple sources confirms that leadership vision is prevalent in all the municipalities.Researchers found vision statements clearly published in strategic planning documents fromIrvington and Trenton. According to the November 2001 Irvington Master Plan, the town-ship seeks to revitalize itself. Trenton’s many planning and reporting documents refer toimproving quality of life and increasing opportunities for its citizens. Paterson articulated avision with goals for community revival in its July 1998 report titled, A Blueprint for Change:A Report to the Citizens of Paterson. Brick leaders stated that their primary focus is on provid-
STRATEGIC PLANNING IN MUNICIPALITIES (CONT.)Status of Department Vision, MissionManaging for Municipality-Wide Strategic Statements, Results System Strategic Plan Plans Goals, Objectives
Old Bridge None None None Vision
Paterson None None None Vision
Trenton Basic No formal plan; comprised of 10 Vision, missiondepartment missions, goals, depart- statements, objectives, and action plans ments; goals, objectives,
Policing accomplishments,2000 is the and planned most formal actions for most
departments
Table 6.3
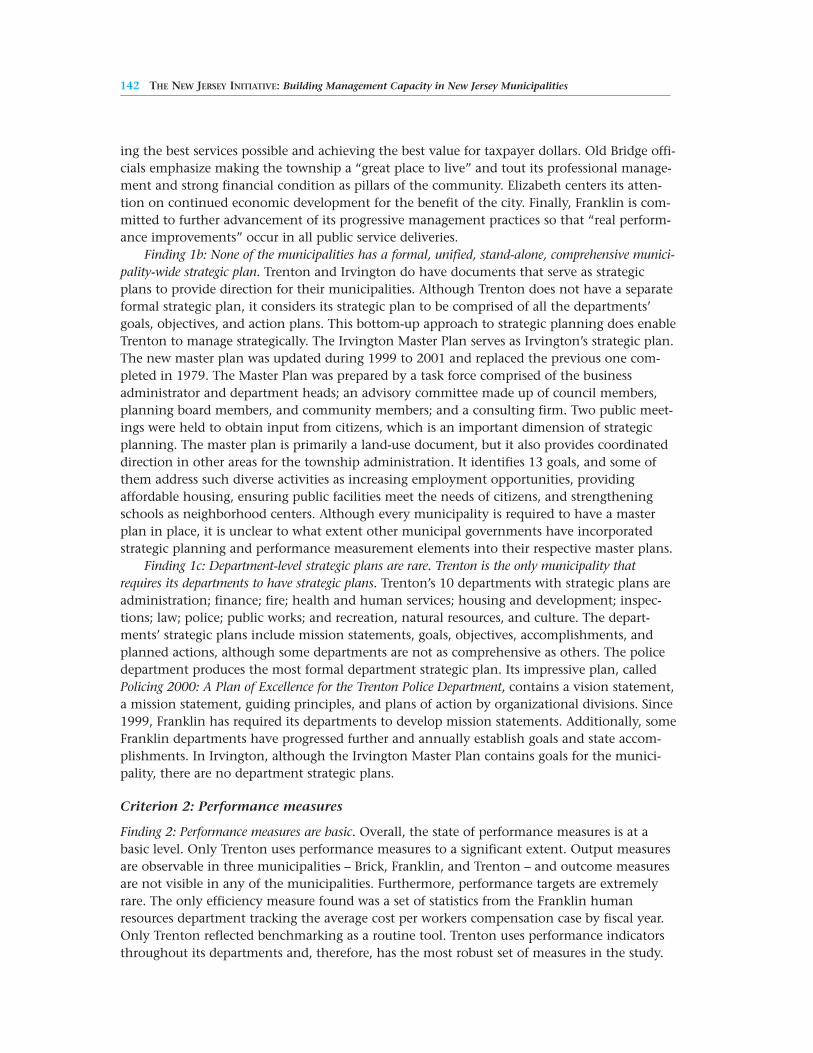
ing the best services possible and achieving the best value for taxpayer dollars. Old Bridge offi-cials emphasize making the township a “great place to live” and tout its professional manage-ment and strong financial condition as pillars of the community. Elizabeth centers its atten-tion on continued economic development for the benefit of the city. Finally, Franklin is com-mitted to further advancement of its progressive management practices so that “real perform-ance improvements” occur in all public service deliveries.
Finding 1b: None of the municipalities has a formal, unified, stand-alone, comprehensive munici-pality-wide strategic plan. Trenton and Irvington do have documents that serve as strategicplans to provide direction for their municipalities. Although Trenton does not have a separateformal strategic plan, it considers its strategic plan to be comprised of all the departments’goals, objectives, and action plans. This bottom-up approach to strategic planning does enableTrenton to manage strategically. The Irvington Master Plan serves as Irvington’s strategic plan.The new master plan was updated during 1999 to 2001 and replaced the previous one com-pleted in 1979. The Master Plan was prepared by a task force comprised of the businessadministrator and department heads; an advisory committee made up of council members,planning board members, and community members; and a consulting firm. Two public meet-ings were held to obtain input from citizens, which is an important dimension of strategicplanning. The master plan is primarily a land-use document, but it also provides coordinateddirection in other areas for the township administration. It identifies 13 goals, and some ofthem address such diverse activities as increasing employment opportunities, providingaffordable housing, ensuring public facilities meet the needs of citizens, and strengtheningschools as neighborhood centers. Although every municipality is required to have a masterplan in place, it is unclear to what extent other municipal governments have incorporatedstrategic planning and performance measurement elements into their respective master plans.
Finding 1c: Department-level strategic plans are rare. Trenton is the only municipality thatrequires its departments to have strategic plans. Trenton’s 10 departments with strategic plans areadministration; finance; fire; health and human services; housing and development; inspec-tions; law; police; public works; and recreation, natural resources, and culture. The depart-ments’ strategic plans include mission statements, goals, objectives, accomplishments, andplanned actions, although some departments are not as comprehensive as others. The policedepartment produces the most formal department strategic plan. Its impressive plan, calledPolicing 2000: A Plan of Excellence for the Trenton Police Department, contains a vision statement,a mission statement, guiding principles, and plans of action by organizational divisions. Since1999, Franklin has required its departments to develop mission statements. Additionally, someFranklin departments have progressed further and annually establish goals and state accom-plishments. In Irvington, although the Irvington Master Plan contains goals for the munici-pality, there are no department strategic plans.
Criterion 2: Performance measures
Finding 2: Performance measures are basic. Overall, the state of performance measures is at abasic level. Only Trenton uses performance measures to a significant extent. Output measuresare observable in three municipalities – Brick, Franklin, and Trenton – and outcome measuresare not visible in any of the municipalities. Furthermore, performance targets are extremelyrare. The only efficiency measure found was a set of statistics from the Franklin humanresources department tracking the average cost per workers compensation case by fiscal year.Only Trenton reflected benchmarking as a routine tool. Trenton uses performance indicatorsthroughout its departments and, therefore, has the most robust set of measures in the study.
142 THE NEW JERSEY INITIATIVE: Building Management Capacity in New Jersey Municipalities
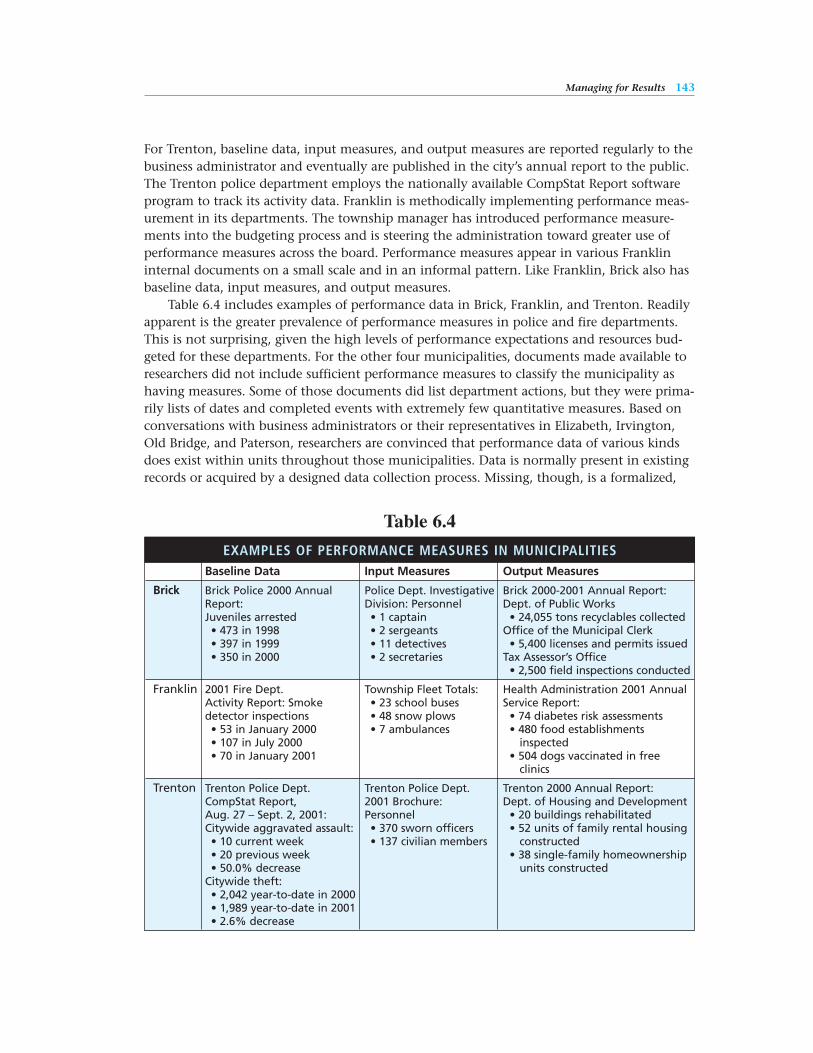
Managing for Results 143
For Trenton, baseline data, input measures, and output measures are reported regularly to thebusiness administrator and eventually are published in the city’s annual report to the public.The Trenton police department employs the nationally available CompStat Report softwareprogram to track its activity data. Franklin is methodically implementing performance meas-urement in its departments. The township manager has introduced performance measure-ments into the budgeting process and is steering the administration toward greater use ofperformance measures across the board. Performance measures appear in various Franklininternal documents on a small scale and in an informal pattern. Like Franklin, Brick also hasbaseline data, input measures, and output measures.
Table 6.4 includes examples of performance data in Brick, Franklin, and Trenton. Readilyapparent is the greater prevalence of performance measures in police and fire departments.This is not surprising, given the high levels of performance expectations and resources bud-geted for these departments. For the other four municipalities, documents made available toresearchers did not include sufficient performance measures to classify the municipality ashaving measures. Some of those documents did list department actions, but they were prima-rily lists of dates and completed events with extremely few quantitative measures. Based onconversations with business administrators or their representatives in Elizabeth, Irvington,Old Bridge, and Paterson, researchers are convinced that performance data of various kindsdoes exist within units throughout those municipalities. Data is normally present in existingrecords or acquired by a designed data collection process. Missing, though, is a formalized,
Table 6.4
EXAMPLES OF PERFORMANCE MEASURES IN MUNICIPALITIES Baseline Data Input Measures Output Measures
Brick Brick Police 2000 Annual Police Dept. Investigative Brick 2000-2001 Annual Report:Report: Division: Personnel Dept. of Public WorksJuveniles arrested • 1 captain • 24,055 tons recyclables collected• 473 in 1998 • 2 sergeants Office of the Municipal Clerk• 397 in 1999 • 11 detectives • 5,400 licenses and permits issued• 350 in 2000 • 2 secretaries Tax Assessor’s Office
• 2,500 field inspections conducted
Franklin 2001 Fire Dept. Township Fleet Totals: Health Administration 2001 AnnualActivity Report: Smoke • 23 school buses Service Report:detector inspections • 48 snow plows • 74 diabetes risk assessments• 53 in January 2000 • 7 ambulances • 480 food establishments • 107 in July 2000 inspected• 70 in January 2001 • 504 dogs vaccinated in free
clinics
Trenton Trenton Police Dept. Trenton Police Dept. Trenton 2000 Annual Report:CompStat Report, 2001 Brochure: Dept. of Housing and DevelopmentAug. 27 – Sept. 2, 2001: Personnel • 20 buildings rehabilitatedCitywide aggravated assault: • 370 sworn officers • 52 units of family rental housing• 10 current week • 137 civilian members constructed• 20 previous week • 38 single-family homeownership• 50.0% decrease units constructed
Citywide theft:• 2,042 year-to-date in 2000• 1,989 year-to-date in 2001• 2.6% decrease
144 THE NEW JERSEY INITIATIVE: Building Management Capacity in New Jersey Municipalities
systematic, and visible way of collecting, tracking, and displaying the data to the highest levelsof the municipality.
Criterion 3: Use of performance data
Finding 3: Use of performance data is minimal. For performance data to be of value, they must beused. Performance data are put to proper use when leaders and managers use the informationto make policy and management decisions that improve program goal accomplishment.Consistent with the second finding for performance measures, Trenton best uses performancedata, Brick and Franklin use data minimally and informally, and the remaining four munici-palities do not use data in any transparent manner. In Trenton’s case, the use of performancemeasures occurs regularly in monthly and annual reports and meetings to make trade-off deci-sions, allocate resources, and improve the efficiency and effectiveness of program delivery. InFranklin, decentralized use happens within departments, and its use is being reported to high-er management levels. For Brick, the police department is leading the way in terms of usingperformance data, while other departments show few signs of using it. Therefore, onlyTrenton uses performance measures systematically municipality-wide. As mentioned inFinding 2, performance data exist, albeit spontaneously at lower levels, in Elizabeth, Irvington,Old Bridge, and Paterson. Furthermore, managers in these places are, in fact, informally usingdata to guide their decision-making. Unfortunately, this non-systematic method deprives themunicipalities of the fullest benefits possible from a functioning managing for results system.
Criterion 4: Communication of results
Finding 4: Communication with stakeholders occurs through a number of means; however, municipali-ties generally do not communicate results information. Comprehensive performance reporting ofsuccesses and failures often faces stiff resistance from government leaders, and the politicalperils of publicized performance reports may be especially heightened at the municipal level.Every municipality in the study has a variety of avenues to communicate with the public andother stakeholders. These include statements, news releases, and reports; speeches, newsletters,and memoranda; meetings and events; and radio, television, and newspapers. Criterion 4 of aproperly executed MFR system is that the information being reported is results information.This means that the reporting should include performance targets, performance measures, andthe extent of progress toward goal accomplishment. Ideally, “good” and “bad” results or “posi-tive” and “negative” results should be reported. Too often, governments avoid fully communi-cating results, because of the potential consequences of bad news. The seven municipalitiesassessed showed very little trace of communicating results information in the sense describedhere.
Not surprisingly, performance reporting in the seven municipalities is typically limited tojust administrative success stories. Brick has a well-tuned public relations operation that dis-tributes daily press releases. Other municipalities send out statistics with the yearly tax bill,and some even utilize public access television and the Internet to disseminate information.Some municipalities submit relatively large amounts of performance data to the council, yet itis unclear if this data are publicly available. Most participants expressed a cautious tone whenasked about complete disclosure of performance information, and stated that performanceinformation simply was not demanded or expected by their stakeholders. One participantremarked, “Certainly we don’t communicate a whole lot if we’re not doing well…We don’tmake announcements like, ‘Mayor’s goals not met.’”
Managing for Results 145
Constraints on Managing for Results Implementation
Noteworthy managing for results writings draw attention to the relatively underdeveloped status of municipal-level MFR systems nationwide (Ammons, 1995; Coe, 1999; Poister andStreib, 1999). Unlike at the federal and state levels of government, few statutory require-ments exist for compulsory MFR at the municipal level. Thus, calls for voluntary or adminis-tratively required MFR systems may encounter strong resistance from local officials. Some ofthis resistance stems from the perception that establishing a viable MFR system may taxavailable resources, threaten the status quo, or increase demands on the development orongoing administration of an organization (Ammons, 1995).
Resistance toward MFR system implementation may be more pronounced on the munic-ipal level where political accountability is less diffuse. Since municipal governments oftenhave fewer discretionary resources to divert toward MFR processes, the establishment of MFRsystems at this level may be politicized much more than at other levels of government. TheNew Jersey Initiative analysis revealed that these seven New Jersey municipalities are fairlyrepresentative of most small municipalities in terms of the lack of sophistication in theirMFR systems implementation. The analysis also identified several internal and external con-straints that inhibit current and perhaps future efforts to implement an MFR system.
Perhaps the most visible constraint within these seven municipalities is the lack of devel-oped institutional systems to gather, process, use, and apply performance data. Although thisis typical of most municipal governments with similar-sized populations, underdevelopedanalytical systems inhibit public managers’ ability to systematically assess and evaluate gov-ernment outcomes. Developing this analytical capacity in New Jersey municipalities facesmany obstacles; foremost are those related to personnel resources. Civil service system con-straints also frustrate some municipal leaders’ ability to recruit and hire highly qualified can-didates; thus, key positions are often filled from within (Brick and Franklin do not have acivil service system in place). Hiring and salary constraints often force municipal govern-ments to contract out for the expertise it needs to run programs – often at great expense. Aninterviewee remarked that employees who have the requisite level of expertise simply cannotdevote time to performance measurement, since they must spend their time on daily opera-tions and “putting out fires.”
The “fiscally distressed” status of three of the seven municipal governments under studyfurther exacerbates their inability to divert resources needed for results-based managementsystems. For these three financially troubled municipalities, the New Jersey State Departmentof Community Affairs must approve all new hires and pay increases. One participantremarked that more than two-thirds of his municipality’s expenditures are allocated foremergency services expenses. Police expenses alone account for between 8 and 28 percent ofthe total general current expenses for these municipalities (Municipal Analysis Services,2001). Another respondent noted that planning ahead is very difficult, because the munici-palities do not know how much money they will receive from the state in any given year.
Lack of resources is a common argument against the implementation of performancemeasurement systems. However, Ammons (1995) suggests that when a sincere commitmentto MFR exists, the resources diverted from existing services are not wasted. Rather, theseresources are used to improve the efficiency and equity of services and to better manage thegovernment entity’s already scarce resource base. Participants acknowledged that their use ofMFR systems was limited and that they believed their municipality was on par with otherNew Jersey municipalities statewide. Most participants said they thought their municipalitieswere doing well, given their budget constraints.
146 THE NEW JERSEY INITIATIVE: Building Management Capacity in New Jersey Municipalities
Simple bureaucratic inertia is another internal factor that inhibits MFR systems implemen-tation. It is widely written that bureaucratic organizations tend to resist organizational change(Tracy, 1995). These seven municipal governments are no exception, which is evidenced byseveral anecdotes gleaned from the interviews. One business administrator claimed successwhen he was able to get most of his department heads to report rudimentary performancemeasures, although he described the accomplishment was “like pulling teeth.” Another partic-ipant shared that some of his staff still use old DOS software applications in their day-to-dayoperations, instead of the readily available modernized software systems that were recentlyinstalled. Another interviewee said he felt that his municipality’s widespread low employeemorale undermined its ability to achieve results in the long term.
Most business administrators or their representatives expressed frustration that they couldnot carry out increased results-based management efforts. One participant identified the statu-tory prohibition of contracts for municipal business administrators as another constraint.Managing for results oversight must reside somewhere, and MFR responsibilities should residein the business administrator’s office. However, absence of a contract effectively places thebusiness administrator’s primary focus on achieving results for the mayor and not necessarilyfor other stakeholders. One respondent remarked that when one serves at the pleasure of anexecutive figure, one cannot necessarily take the good government (MFR) route.
Tracy (1995) writes that union contracts can inhibit results management initiatives. Thismay be especially pronounced in these seven New Jersey municipalities, which negotiate any-where from three (Brick) to 14 (Elizabeth) separate labor contracts on a regular basis (typicallyevery three to five years). One participant remarked that her administration inherited unioncontracts that contain language hostile to simple employee performance appraisals, let alonedepartment performance appraisals. Franklin, which has incorporated several fledgling stepstoward MFR, did so at a time when many union contracts had come up for renewal. Trentonalso began a program of aggressively negotiating union contracts for up to five years at a time.This practice allows managers to plan ahead more easily, since they already know whatexpenses to allocate for personnel.
Finally, the interview process revealed politics as a major constraint on managing forresults in these seven municipalities. Participants tended to characterize New Jersey govern-ments as among the most political in the nation and expressed frustration over the fiercepolitical climate they confront in municipal government.
Summary
Overall, the state of managing for results in the seven municipalitiescan be characterized as the very early development stage. Trenton has abasic MFR system operating across its departments and up its chain ofcommand. Franklin is currently developing an MFR system and is tak-ing the right approach – going slowly and methodically to ensuredepartment buy-in and long-term success. Brick has some fundamentalelements in some departments. Irvington is heading in the right direc-tion, with an updated Master Plan and culture change as high prioritiesfirst, so that MFR might be able to take root later. Elizabeth, Old Bridge,and Paterson have the potential to build upon their management
processes and establish MFR systems. Leadership in each municipality resonates a vision forbetter government and a better community for its citizens.
Overall, the state ofmanaging for results in the sevenmunicipalities canbe characterized asthe very early development stage.
Managing for Results 147
The major shortcomings are the lack of municipality-wide strategic plans, rare depart-ment-level strategic plans, basic performance measures, widespread informal use of perform-ance data, and minimal reporting of performance results. Despite these weaknesses, the evi-dence points to the existence of seeds of MFR in each of the municipalities. All are conduct-ing low-level MFR, although some may not be fully aware of it, procedures are not formal-ized, or they may not call it managing for results. The findings for these municipalities areprobably representative of most other New Jersey municipalities.
Recommendations for New Jersey Municipalities
The seven municipalities assessed by the New Jersey Initiative can advance their managingfor results systems, if actions are taken. These findings apply to municipalities in the statethat are in similar circumstances, and they may be generalized to New Jersey municipalitiesstatewide. To this end, the authors offer the following recommendations.
1. Council members, mayors, business administrators, department heads, and managersshould learn about practices of the most advanced managing for results systems locat-ed in:
a. Trenton City, Franklin Township, and other municipalities in New Jersey
b. Cities recognized as leaders in MFR, such as Charlotte, North Carolina; Portland,Oregon; and Sunnyvale, California (Ammons, 2001)
c. Cities with MFR systems ranked the highest by the Government PerformanceProject in 2000: Phoenix, Arizona; Austin, Texas; Indianapolis, Indiana; Milwaukee,Wisconsin; and San Diego, California (Barrett and Greene, 2000)
2. Councils and mayors should give sufficient discretionary administrative power to busi-ness administrators so they can implement managing for results systems. The FaulknerAct permits business administrators to “have the power…to prescribe standards andrules of all departments, to prescribe standards and rules of administrative practice andprocedure,” and this power is “potentially very broad, if the mayor and council want[it] to be” (Wolfe, 1994, 12).
3. Business administrators, department heads, and managers should implement manag-ing for results systems that are best suited for their municipality.
4. Performance goals should be clearly linked to departments, programs, and personnelin municipal budgets and other public documents.
5. Appropriate municipality officials should encourage the New Jersey State League ofMunicipalities, State of New Jersey Department of Community Affairs, and New JerseyLegislature to increase attention to performance-based management.
Recommendations for the State of New Jersey
The state of New Jersey is in a position to further advance managing for results systems forits 566 municipalities. The authors make the following recommendations.
1. Executive branch leaders should learn about practices of the most advanced managingfor results systems located in:
148 THE NEW JERSEY INITIATIVE: Building Management Capacity in New Jersey Municipalities
a. States recognized for their long-term experience with MFR, such as Florida, NorthCarolina, Minnesota, Oregon, and Texas (Liner et al., 2001)
b. States with MFR systems ranked the highest by the Government PerformanceProject in 2001: Iowa, Missouri, Texas, Virginia, Washington, Florida, Kentucky,Louisiana, Michigan, and Utah (Barrett and Greene, 2001)
2. With the leadership of the governor, the executive branch should increase managingfor results activities in state government agencies and departments.
3. The Department of Community Affairs should encourage and assist the state’s munici-palities with implementing managing for results systems. Assistance should be givenbased on the needs of municipalities according to different categories of municipalities.
4. The New Jersey Legislature should perform the following actions:
a. Consult with the National Conference of State Legislatures (NCSL) about how legis-lation in the states can improve managing for results (or “governing for results”)activities in state government and about the role of the legislature in the managingfor results process.
b. Consult with any of the 33 states that have managing for results legislation andlearn how their legislation calls for strategic planning, performance measurement,performance reporting, and performance budgeting.
c. Pass legislation addressing managing for results that best serves New Jersey and itscitizens.
Recommendations for New Jersey Municipalities and the State of New Jersey
Leaders in municipal and state governments are in the position to cooperate and activelywork toward the application of managing for results initiatives. In this spirit of cooperation,the authors recommend the following.
1. Council members, mayors, business administrators, department heads, managers, andstate officials should learn:
a. The principles and methods of performance-based management
b. The principles and methods of performance measurement
c. The primary lessons from the federal government’s efforts to implement theGovernment Performance and Results Act (GPRA) of 1993
2. Business administrators, department heads, managers, and state officials should seekguidance and assistance from professional associations and organizations such as thefollowing:
a. American Society for Public Administration (ASPA) Center for Accountability andPerformance (CAP)
b. Governmental Accounting Standards Board (GASB)
c. Government Finance Officers Association (GFOA)
Managing for Results 149
d. International City/County Management Association (ICMA) Center forPerformance Measurement
e. National Academy of Public Administration (NAPA) Center for ImprovingGovernment Performance
3. Council members, mayors, business administrators, department heads, managers, andstate officials should consider the incremental approach to managing for results thatthe federal government used to implement the Government Performance and ResultsAct of 1993. Many of the lessons learned from the federal government’s successes andfailures can benefit the municipal level of government.
4. State and municipal governments should hire external auditors for periodic reviews ofperformance results. This makes the feedback process more effective, helps to finetune measurements, and creates a disincentive to simply “go through the motions.”

7CONCLUSION:
IMPROVING MANAGEMENT CAPACITY
IN NEW JERSEY MUNICIPALITIES
THE RESULTS OF THE ASSESSMENT OF MANAGEMENT SYSTEMS in seven New Jerseymunicipalities invited to participate in the New Jersey Initiative – Brick Township, ElizabethCity, Franklin Township, Irvington Township, Old Bridge Township, Paterson City, andTrenton City – indicate that commendable management practices are ongoing. Clearly, pro-fessional managers in these municipalities and their teams of supporting employees aresteadfastly making government work for their citizens. Researchers witnessed first-hand inthese municipalities extremely dedicated and resourceful public servants.
Still, the findings of our evaluation of management systems in these municipalities alsopoint to the need for reforms. Improving management capacity in the areas of financialmanagement, capital management, human resources management, information technologymanagement, and managing for results is necessary and willrequire significant commitment to change. More specifically,improving management capacity in these and other New Jerseymunicipalities calls for a stronger collaborative approach frommunicipalities and the state, recognition of vital reforms, and boldactions. Going beyond mere adjustments and achieving highermanagement performance will require new ways of doing business.There are no quick and easy fixes.
Yet we firmly believe that the state and its municipalities canmake the recommended changes that will lead to more effective governance. Every day thestate of New Jersey and its many local governments affect and shape the lives of all NewJersey citizens. Furthermore, these governments are engaged daily in delivering essential serv-ices to New Jersey residents. Expanding management capacity will result directly in revital-ized, higher-performing, and more responsive government.
Collaborative Approach From Municipalities and the State
An incontrovertible conclusion of this study is that any success in improving managementcapacity depends on synergetic actions by both municipalities and the state. At the statelevel, change must come from both executive and legislative branches. It is time to buildupon a collaborative approach by municipalities and the state. Both levels of government arecurrently cooperating in many ways to govern for the benefit of New Jersey. But a new era
Expanding managementcapacity will result
directly in revitalized,higher-performing, and
more responsive government.
means a renewal of bilateral efforts must be undertaken. Of course, many other interests playroles in the governing process. Although we focus on the state and municipalities, weacknowledge that entities such as labor unions, citizen groups, interest groups, and themedia will have to be considered.
At the municipal level, many communities across the state are endowed with highlyqualified and professional managers. These business administrators, chief financial officers,and department-level directors have impressive credentials and experience. Competent man-agers contribute great effort, work within the laws and boundaries of their authority, and getthe business of government done well. Our findings suggest that municipalities can do theirwork in ways that would increase management capacity. First, municipalities should takeadvantage of the latitude provided under their charter, such as the New Jersey OptionalMunicipal Charter Law, known as the Faulkner Act, that permits councils and mayors togrant business administrators broad powers and authority to operate and manage municipalaffairs. With the appropriate level of authority they need, business administrators are able toexercise their management skills and strengthen management systems. Second, municipalleaders can create an environment that recognizes the value of and rewards management ini-tiative, innovative actions, implementation of best practices from other locales, and prudentrisk-taking.
At the state level, professional policy-makers are extremely knowledgeable, experiencedin the inner workings of local government, and committed to improving government. Thesehighly proficient policy-makers rightfully seek to execute the applicable laws, provide guid-ance to municipalities, and protect the public’s interest. Like municipalities, the state canmake meaningful contributions that will go a long way to improve municipal managementcapacity. First, the state may experience positive results if it modifies its oversight relation-ship with municipalities. The current approach emphasizes imposing the state’s view ofappropriate performance and regulating to prevent wrongful behavior by municipal officials.For those municipalities where good performance warrants it, shifting to an approach thatgives greater prominence to independent capacity building and trust might lead to higherperforming government. Second, the state should work with municipalities to find ways toprovide regulatory relief where appropriate, generate flexibility for management decision-making, and furnish management tools to local governments.
Vital Reforms
Comprehensive explanations, findings, and recommendations for the management areas offinancial management, capital management, human resources management, information
technology management, and managing for results appear inChapters 2 through 6, respectively. For each area, specific recommen-dations are made for the state of New Jersey and the municipalitiesstudied. The recommendations for municipalities are also applicableto other New Jersey municipalities with similar characteristics andconditions. Overall, four major findings – where vital reforms arenecessary – emerge from across all management areas:
Vital Reform Area #1: State regulatory and procedural restraintsimpede local government management innovation.
152 THE NEW JERSEY INITIATIVE: Building Management Capacity in New Jersey Municipalities
The recommendationsfor municipalities arealso applicable toother New Jerseymunicipalities withsimilar characteristicsand conditions.
Vital Reform Area #2: In its regulatory management oversight role, the state does notsufficiently differentiate among municipalities in terms of their characteristics and per-formance.
Vital Reform Area #3: Municipalities lack formalized, centralized, and long-term man-agement planning activities.
Vital Reform Area #4: Municipalities do not sufficiently exercise the management pre-rogatives that are available to them.
Bold Actions
Vital reforms require bold actions. In order to reform management systems in New Jerseymunicipalities, the following expedient measures are recommended for the state of NewJersey, the municipalities assessed, and other New Jersey municipalities with comparable char-acter and conditions. The recommended bold actions correspond with and are aimed ataddressing the vital reform areas. For example, the first bold action is targeted toward resolv-ing the first vital reform area.
Bold Action #1: The state should reduce burdensome and costly restrictions on munici-pal management activities where appropriate; allow more flexibility and discretion formunicipal managers; enhance state mechanisms for providing technical, financial, andother kinds of assistance to municipalities; and create incentives for entrepreneurialmanagement behavior by municipal managers.
Bold Action #2: The state should further its efforts to classify municipalities in multiplecategories, apply different strategies to assist the various categories, and customize regu-latory treatment to fit the specific needs and circumstances of different municipalities.
Bold Action #3: Municipal councils and mayors should delegate greater authority tobusiness administrators so they can bolster strategic planning; strengthen their man-agement systems; formalize and centralize management oversight activities; and whereit is best to do so, integrate management systems across departments.
Bold Action #4: Municipalities should be more innovative in applying managementpractices, take reasonable risks when implementing new management practices, andask for guidance and assistance when needed from the state.
Supporting evidence, examples, and deeper analysis that logically lead to the vital reformareas and recommended bold actions are found in the report’s earlier chapters. Readers areencouraged to read Chapters 2 through 6 for greater specificity and a fuller understanding ofthe management areas.
The state of New Jersey and its 566 municipalities have the same goals – make democracyfunction as it was designed to and deliver public services in the most effective, efficient, con-sistent, and equitable means to citizens. Governments across the nation at all levels are seek-ing ways to strengthen their capacity to achieve better government performance. The sevenNew Jersey municipalities that volunteered for the New Jersey Initiative are commended forhaving the foresight and courage to participate. Our findings and recommended bold actionssharply call attention to the state and local governments taking steps to build managementcapacity together. Building municipal management in New Jersey can be accomplished
Conclusion: Improving Management Capacity in New Jersey Municipalities 153

154 THE NEW JERSEY INITIATIVE: Building Management Capacity in New Jersey Municipalities
through a shared effort. We strongly encourage the state and its municipalities to keep themomentum going toward higher levels of effective government. New Jersey governmentleaders and citizens always have faced challenges with resoluteness. A future of excellence ingovernance awaits New Jersey.

Conclusion: Improving Management Capacity in New Jersey Municipalities 155

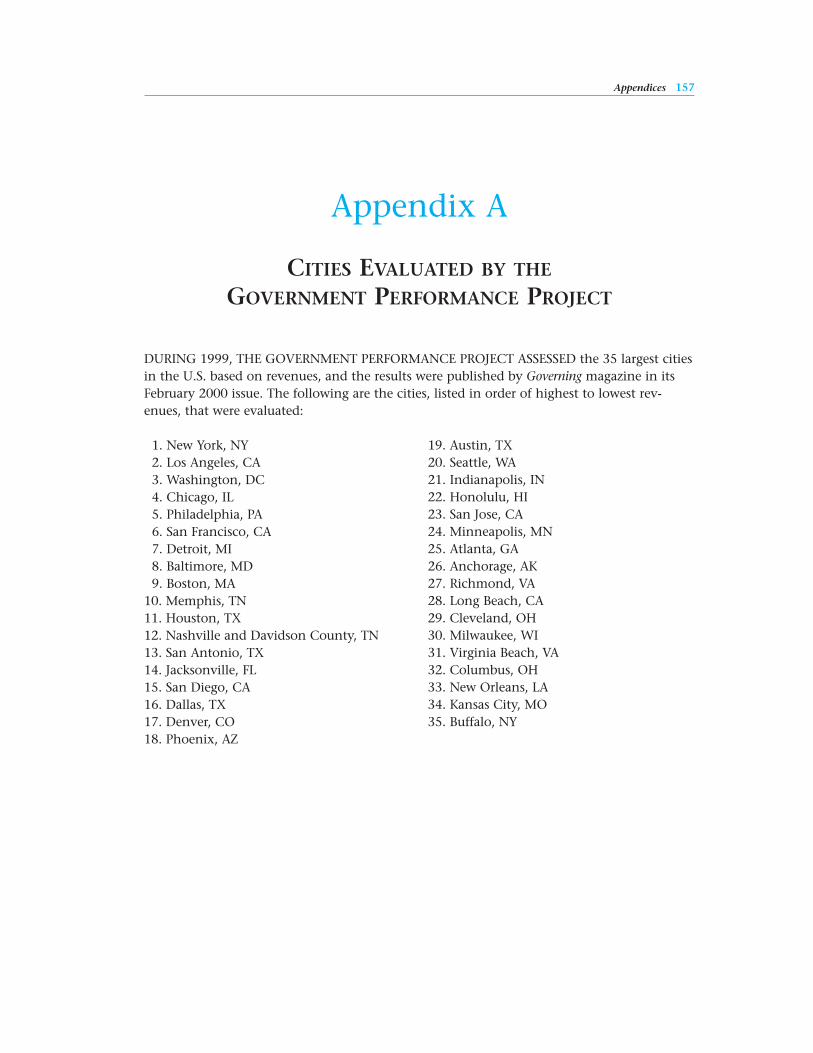
Appendix A
CITIES EVALUATED BY THE
GOVERNMENT PERFORMANCE PROJECT
DURING 1999, THE GOVERNMENT PERFORMANCE PROJECT ASSESSED the 35 largest citiesin the U.S. based on revenues, and the results were published by Governing magazine in itsFebruary 2000 issue. The following are the cities, listed in order of highest to lowest rev-enues, that were evaluated:
1. New York, NY2. Los Angeles, CA3. Washington, DC4. Chicago, IL5. Philadelphia, PA6. San Francisco, CA7. Detroit, MI8. Baltimore, MD9. Boston, MA
10. Memphis, TN11. Houston, TX12. Nashville and Davidson County, TN13. San Antonio, TX14. Jacksonville, FL15. San Diego, CA16. Dallas, TX17. Denver, CO18. Phoenix, AZ
Appendices 157
19. Austin, TX20. Seattle, WA21. Indianapolis, IN22. Honolulu, HI23. San Jose, CA24. Minneapolis, MN25. Atlanta, GA26. Anchorage, AK27. Richmond, VA28. Long Beach, CA29. Cleveland, OH30. Milwaukee, WI31. Virginia Beach, VA32. Columbus, OH33. New Orleans, LA34. Kansas City, MO35. Buffalo, NY
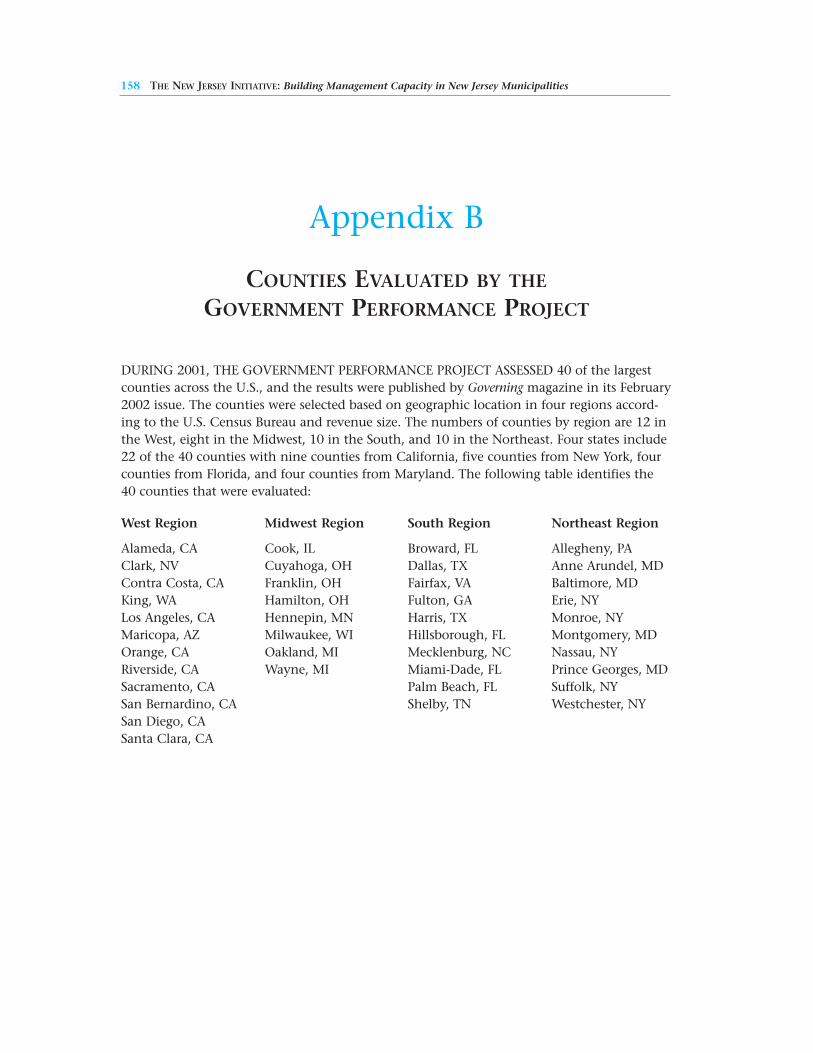
158 THE NEW JERSEY INITIATIVE: Building Management Capacity in New Jersey Municipalities
Appendix B
COUNTIES EVALUATED BY THE
GOVERNMENT PERFORMANCE PROJECT
DURING 2001, THE GOVERNMENT PERFORMANCE PROJECT ASSESSED 40 of the largestcounties across the U.S., and the results were published by Governing magazine in its February2002 issue. The counties were selected based on geographic location in four regions accord-ing to the U.S. Census Bureau and revenue size. The numbers of counties by region are 12 inthe West, eight in the Midwest, 10 in the South, and 10 in the Northeast. Four states include22 of the 40 counties with nine counties from California, five counties from New York, fourcounties from Florida, and four counties from Maryland. The following table identifies the40 counties that were evaluated:
West Region Midwest Region South Region Northeast Region
Alameda, CA Cook, IL Broward, FL Allegheny, PAClark, NV Cuyahoga, OH Dallas, TX Anne Arundel, MDContra Costa, CA Franklin, OH Fairfax, VA Baltimore, MDKing, WA Hamilton, OH Fulton, GA Erie, NYLos Angeles, CA Hennepin, MN Harris, TX Monroe, NYMaricopa, AZ Milwaukee, WI Hillsborough, FL Montgomery, MDOrange, CA Oakland, MI Mecklenburg, NC Nassau, NYRiverside, CA Wayne, MI Miami-Dade, FL Prince Georges, MDSacramento, CA Palm Beach, FL Suffolk, NYSan Bernardino, CA Shelby, TN Westchester, NYSan Diego, CASanta Clara, CA
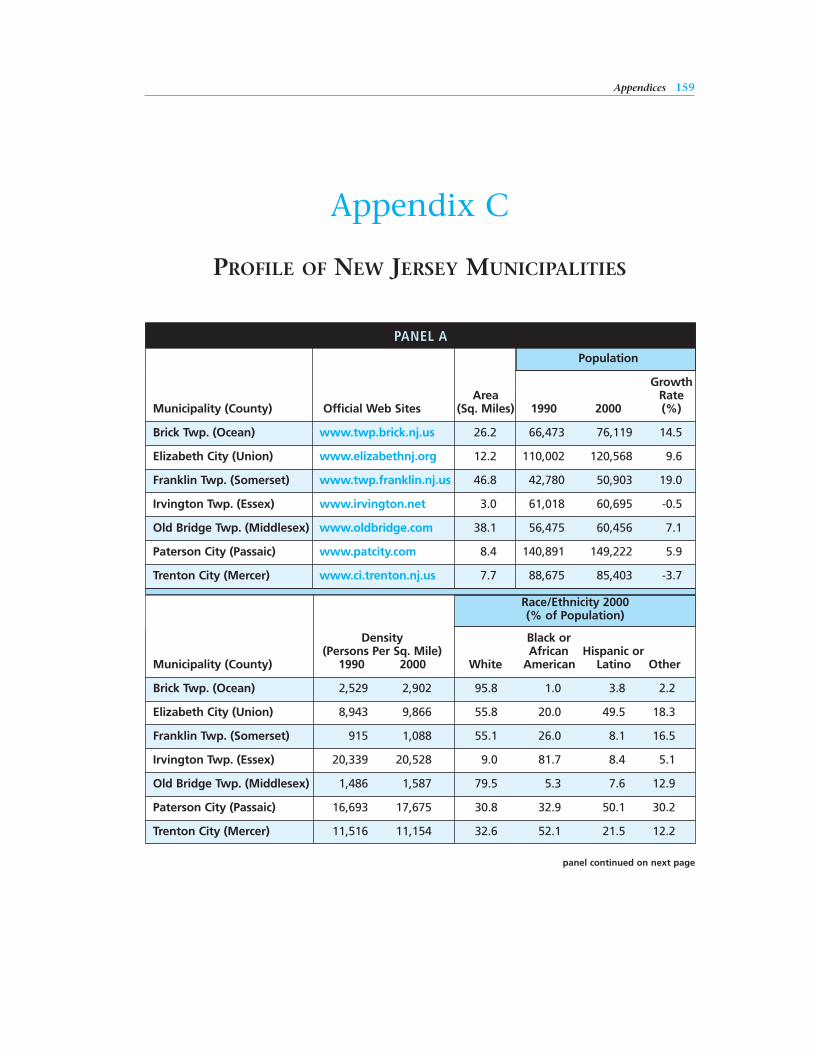
Race/Ethnicity 2000(% of Population)
Density Black or (Persons Per Sq. Mile) African Hispanic or
Municipality (County) 1990 2000 White American Latino Other
Brick Twp. (Ocean) 2,529 2,902 95.8 1.0 3.8 2.2
Elizabeth City (Union) 8,943 9,866 55.8 20.0 49.5 18.3
Franklin Twp. (Somerset) 915 1,088 55.1 26.0 8.1 16.5
Irvington Twp. (Essex) 20,339 20,528 9.0 81.7 8.4 5.1
Old Bridge Twp. (Middlesex) 1,486 1,587 79.5 5.3 7.6 12.9
Paterson City (Passaic) 16,693 17,675 30.8 32.9 50.1 30.2
Trenton City (Mercer) 11,516 11,154 32.6 52.1 21.5 12.2
panel continued on next page
Appendices 159
Appendix C
PROFILE OF NEW JERSEY MUNICIPALITIES
PANEL A
Population
GrowthArea Rate
Municipality (County) Official Web Sites (Sq. Miles) 1990 2000 (%)
Brick Twp. (Ocean) www.twp.brick.nj.us 26.2 66,473 76,119 14.5
Elizabeth City (Union) www.elizabethnj.org 12.2 110,002 120,568 9.6
Franklin Twp. (Somerset) www.twp.franklin.nj.us 46.8 42,780 50,903 19.0
Irvington Twp. (Essex) www.irvington.net 3.0 61,018 60,695 -0.5
Old Bridge Twp. (Middlesex) www.oldbridge.com 38.1 56,475 60,456 7.1
Paterson City (Passaic) www.patcity.com 8.4 140,891 149,222 5.9
Trenton City (Mercer) www.ci.trenton.nj.us 7.7 88,675 85,403 -3.7
Race/Ethnicity 2000(% of Population)
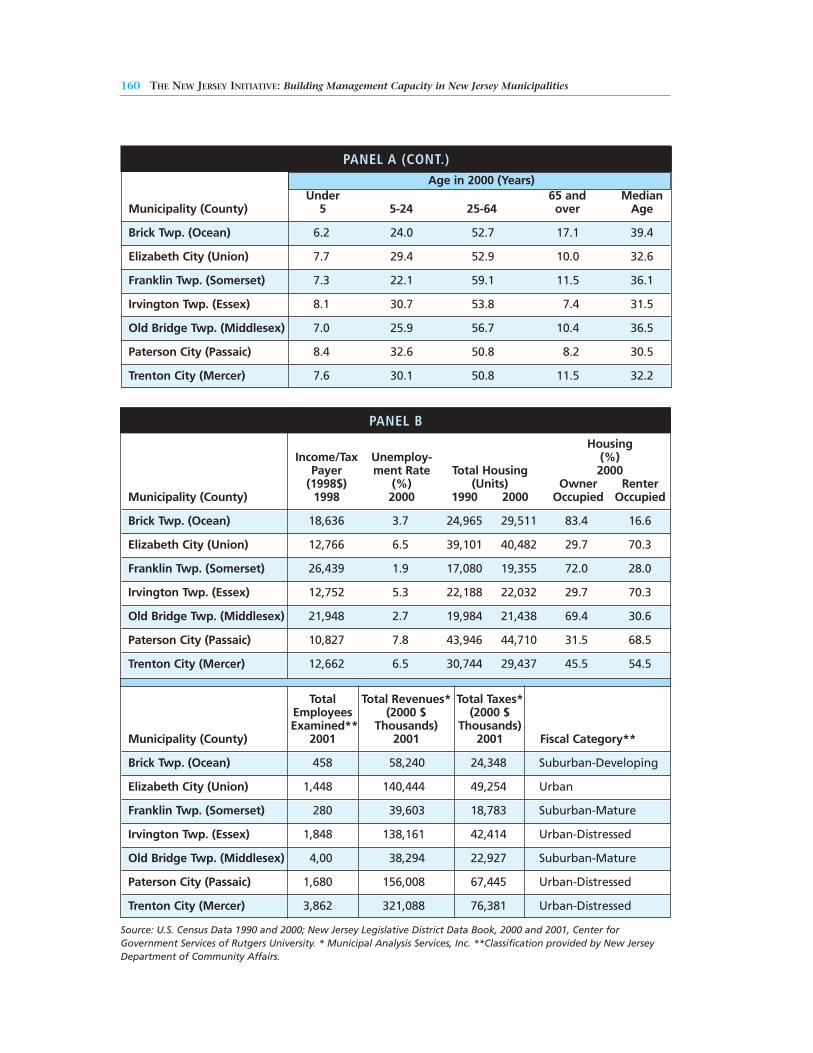
160 THE NEW JERSEY INITIATIVE: Building Management Capacity in New Jersey Municipalities
Age in 2000 (Years)Under 65 and Median
Municipality (County) 5 5-24 25-64 over Age
Brick Twp. (Ocean) 6.2 24.0 52.7 17.1 39.4
Elizabeth City (Union) 7.7 29.4 52.9 10.0 32.6
Franklin Twp. (Somerset) 7.3 22.1 59.1 11.5 36.1
Irvington Twp. (Essex) 8.1 30.7 53.8 7.4 31.5
Old Bridge Twp. (Middlesex) 7.0 25.9 56.7 10.4 36.5
Paterson City (Passaic) 8.4 32.6 50.8 8.2 30.5
Trenton City (Mercer) 7.6 30.1 50.8 11.5 32.2
PANEL A (CONT.)
Source: U.S. Census Data 1990 and 2000; New Jersey Legislative District Data Book, 2000 and 2001, Center forGovernment Services of Rutgers University. * Municipal Analysis Services, Inc. **Classification provided by New JerseyDepartment of Community Affairs.
HousingIncome/Tax Unemploy- (%)
Payer ment Rate Total Housing 2000 (1998$) (%) (Units) Owner Renter
Municipality (County) 1998 2000 1990 2000 Occupied Occupied
Brick Twp. (Ocean) 18,636 3.7 24,965 29,511 83.4 16.6
Elizabeth City (Union) 12,766 6.5 39,101 40,482 29.7 70.3
Franklin Twp. (Somerset) 26,439 1.9 17,080 19,355 72.0 28.0
Irvington Twp. (Essex) 12,752 5.3 22,188 22,032 29.7 70.3
Old Bridge Twp. (Middlesex) 21,948 2.7 19,984 21,438 69.4 30.6
Paterson City (Passaic) 10,827 7.8 43,946 44,710 31.5 68.5
Trenton City (Mercer) 12,662 6.5 30,744 29,437 45.5 54.5
Total Total Revenues* Total Taxes* Employees (2000 $ (2000 $ Examined** Thousands) Thousands)
Municipality (County) 2001 2001 2001 Fiscal Category**
Brick Twp. (Ocean) 458 58,240 24,348 Suburban-Developing
Elizabeth City (Union) 1,448 140,444 49,254 Urban
Franklin Twp. (Somerset) 280 39,603 18,783 Suburban-Mature
Irvington Twp. (Essex) 1,848 138,161 42,414 Urban-Distressed
Old Bridge Twp. (Middlesex) 4,00 38,294 22,927 Suburban-Mature
Paterson City (Passaic) 1,680 156,008 67,445 Urban-Distressed
Trenton City (Mercer) 3,862 321,088 76,381 Urban-Distressed
PANEL B
Appendices 161
Appendix D
CONTRACTING AND PROCUREMENT PRACTICES
IN NEW JERSEY MUNICIPALITIES
SOUND CONTRACTING AND PROCUREMENT PRACTICES ARE AN INTEGRAL PART of ahealthy financial management system, since these practices profoundly affect expendituresand cash flow. Additionally, many policy questions and implications arise with respect tosources of supply and contracting out of services. Well-managed purchasing systems offeropportunities to control, even reduce, expenditures through inventory management andtimely payments (Aronson and Schwartz, 1996).
Using data collected from a survey distributed to seven New Jersey municipalities in June2001 as part of the New Jersey Initiative study, this appendix examines the state of contract-ing and procurement in five of these municipalities (two municipalities did not complete thesurvey) and makes comparisons against best practices in the field. While the municipalitiesstudied vary in size, location, and fiscal health, examining the contracting and procurementpractices in each provides valuable insights into the overall state of financial management inthese municipalities.
Because New Jersey State law dictates many of the contracting and procurement proce-dures the municipalities must follow, an analysis of the municipalities would not be com-plete without considering the legal context in which they operate. Therefore, New Jersey“Local Public Contracts Law” (NJSA 40A:11-1 et seq.) will also be referenced when necessary.
Centralization Versus Decentralization
One of the difficult trade-offs that is regularly identified in examinations of contracting andprocurement is between flexibility and oversight. This tension is frequently revealed whendiscussing centralization versus decentralization in contracting and procurement decision-making.
Centralized purchasing responsibility, which gives little discretion to lower-level man-agers and employees, has several distinct advantages. It allows for more control over expen-ditures, better oversight to ensure that improper actions are not taking place, less duplica-tion, and bulk purchasing to reduce overall costs. While problems can arise when purchasingis decentralized, this type of system can be advantageous in some instances. For example, if adepartment is highly specialized and requires materials or services that are unique to itsactivities, it is often practical to allow that department to make its own procurement deci-sions. It may be necessary, however, to implement standard procedures and policies thatensure the procurement process results in cost-efficient purchases (Reed and Swain, 1997).
162 THE NEW JERSEY INITIATIVE: Building Management Capacity in New Jersey Municipalities
Contracting
Privatization remains a buzzword at all levels of government. The impetus for privatizationefforts stems from various forces, including fiscal constraints, pressure from citizens for amore cost-effective government, and a movement toward smaller government (Bartle andLaCourse Korosec, 2001). Savas argues that privatization is the best tool to address these con-cerns, because it is “the key to both limited and better government” (1987, 288).
While privatization can take various forms, the most common form is contracting –competition among private bidders to perform government activities. One of the benefits ofcontracting is the government’s ability to maintain management and policy control over thetype and quality of services it provides. Another variation of privatization – managed compe-tition – permits government agencies to prepare work proposals and submit bids to competewith private bidders. The government may then award the contract to an agency or to a pri-vate entity. This policy is desirable, because it allows municipalities to find the most cost-effective means of service provision, whether it is public or private (United States GeneralAccounting Office, 1997). Municipalities in New Jersey are permitted to perform some ver-sion of managed competition. New Jersey law states that nothing shall prevent agencyemployees from making recommendations in order to reduce costs in lieu of awarding com-petitive contracts. If these recommendations are agreed to and implemented, all other pro-posals could be rejected.
Contracting is a complex issue, and the following sections discuss specific areas of impor-tance within contracting, including formal bidding requirements, contract approval, con-tracting incidence and reasons for contracting, monitoring, tracking and assessing contracts,and training issues.
Formal Bidding Requirements
New Jersey Local Public Contracts Law establishes the bid threshold for municipalities at$17,500 (or up to $25,000 for those employing qualified purchasing agents). However,municipalities may opt to set a lower threshold for the receipt of formal bids or the solicita-tion of competitive quotes. Currently, Brick, Old Bridge, and Paterson follow the state guide-lines, while Elizabeth and Trenton have set the bid threshold at $17,500, regardless ofwhether purchasers are qualified to approve purchases up to $25,000. Recently, new ruleshave been adopted which permit all municipalities to increase their bid threshold to $25,000if they have a qualified purchasing agent as designated by the state of New JerseyDepartment of Community Affairs. At the time of this report, Trenton had begun the processto do so.
While the state of New Jersey sets the bid threshold, no legal provision dictates a maxi-mum percentage of operating expenditures for services that can be contracted out. Therefore,this percentage varies among the municipalities. Brick has the highest percentage, 38 per-cent. Old Bridge contracts out 25 percent of its services and Trenton’s contracts total 15 per-cent of its operating expenditures for services. Elizabeth could not provide an exact figure,but estimates that its contracted services equal 10 to 20 percent of total operating expendi-tures in this area. Although it appears from Paterson’s response that the municipality does, infact, contract out for services, it did not provide an estimate of the percentage of operatingexpenditures for services it contracts out.
Appendices 163
Contract Approval
The people who are authorized to approve contracts that require public bidding are differentthan those who are authorized to approve contracts that do not require it. New Jersey PublicContracting Law mandates that contracts requiring public bidding may be awarded only byresolution of the governing body, but some municipalities have additional requirements.Brick, Elizabeth, and Paterson simply follow state guidelines, but contracts in Old Bridge andTrenton must pass other approvals as well. According to Trenton’s survey response, in addi-tion to the city legislative body, the mayor and legal department also must approve con-tracts. Old Bridge officials stated that the mayor or chief elected official and chief administra-tive officials must also approve contracts that require formal bidding.
These municipal governments demonstrate varying degrees of control over determiningwhich person or entity is required to approve contracts that do not require bidding.Elizabeth and Paterson demonstrate the most stringent requirements. In Elizabeth, the pur-chasing agent, in conjunction with the city council, approves contracts that do not requirebidding. The purchasing agent in Paterson has a bit more freedom, with the ability toapprove contracts under $2,500. For all contracts between $2,500 and $17,500, the purchas-ing agent simply acts as a liaison on the administration’s behalf, to make recommendationsto the municipal council, which approves the contracts. In Brick, the governing body passesa blanket resolution each year to allow the purchasing agent to act on its behalf to approvecontracts that do not require formal bidding, and in Old Bridge, the business administratorand chief financial officer have this power. Although it was not entirely clear from Trenton’ssurvey responses which entity can approve contracts, they suggest that the purchasing agenthas this ability after two quotes have been solicited.
Contracting Incidence and Reasons for Contracting
The municipalities rely on contracting in varying degrees across many different services. Allof the municipalities that were surveyed cited public works and utility services as functionsthat rely heavily on contracting, but similarities among the municipalities end there. Threemunicipalities report that they rely heavily on contracting for general government services.Two of the three often use contractors for transportation and other services, such as manage-ment information systems, janitorial, and security services. The other municipality uses con-tractors extensively in each of the following areas: health, human services, and social wel-fare; public safety and corrections; and parks and recreation services.
In evaluating whether or not to contract out a service, the municipalities consider severaldifferent factors. Three municipalities base this decision on available skills. For example,Elizabeth and Paterson contract out services that city employees cannot perform, and Brickevaluates manpower, expertise, and equipment needs in its decision to contract out. OldBridge considers a variety of elements, such as cost, service, and type and quality of service.Trenton, however, does not establish any formal criteria for deciding whether or not a serviceshould be contracted out; it is simply a departmental or administrative decision.
Monitoring, Tracking, and Assessing Contracts
All of the municipalities reported a number of factors they consider when assessing bids.However, New Jersey State law mandates awarding contracts to the lowest responsible bidderafter public advertising for bids and bidding is completed. It is likely that the municipalities
164 THE NEW JERSEY INITIATIVE: Building Management Capacity in New Jersey Municipalities
simply confused public bidding with competitive contracting.Competitive contracting in New Jersey is defined as a method of contracting for special-
ized goods and services in which: the municipality solicits formal proposals from vendors; thepurchasing agent, council, or administrator evaluates the proposals; and the governing bodyawards the contract based on these proposals. The law provides that competitive contractscan be used in lieu of public bidding for the procurement of a number of specific specializedgoods and services with prices that exceed the bid threshold. Competitive contracts are to beawarded based on an evaluation and ranking, which includes technical, management, andcost-related criteria and may include weighting the criteria, which cannot unfairly or illegallydiscriminate against or exclude otherwise-capable vendors.
The municipalities consider several aspects when they assess competitive contracts, andreported that they analyze the price, quality or performance standards for the product or serv-ice, and producers’ qualifications when assessing bids. Four municipalities added that assur-ances of timely delivery and producers’ performance records are also factors they consider.One municipality considered bidders’ proximity to the area and whether the businesses aresmall or owned by women or minorities. However, this practice may violate state law, whichstates that no specifications may “require that any bidder be a resident of, or that the bidder’splace of business be located in, the municipality or county in which the contract will beawarded or performed, unless the physical proximity of the bidder is requisite to the efficientand economical performance of the contract” (New Jersey Local Public Contracts Law, 19).The law also states that specifications may not “discriminate on the basis of race, religion,sex, national origin, creed, color, ancestry, age, marital status, affectional or sexual orienta-tion, familial status, [or] liability for service in the armed forces of the United States” (19).
The municipalities indicated that they monitor and track contracts through two differentmechanisms. In four municipalities, the operating department and a central municipalityoffice oversee contracts, which is the preferable method for oversight and efficiency purposes.In one municipality, however, contracts are monitored only at the department level.
Each municipality reported using slightly different methods to ensure that contractorscomply with the terms of a bid. Brick uses a punch list, which various professionals and quali-fied employees review before the municipality makes the final payment and releases bonds.The township also conducts periodic site visits and inspections during the contract period.Elizabeth and Paterson both require performance bonds with contracts, but Paterson also uti-lizes performance complaint forms to ensure performance is consistent with specificationrequirements. Old Bridge uses performance bonds, punch lists, both regular and unan-nounced site visits, and periodic contractor meetings to ensure that contractors are in compli-ance. In addition, the engineering staff and director must sign off on a project prior to therelease of performance bonds, and final bond payment requires the approval of the governingbody. In contrast to this comprehensive system, Trenton does not have any formal measuresin place to ensure compliance.
In a study conducted by Susan MacManus, slow payment emerged as the most frequentlycited complaint among businesses working with the government (Aronson and Schwartz,1996). With this consideration, analysis of the survey responses suggests that there may be anumber of frustrated contractors in the state of New Jersey, since none of the municipalitiessurveyed indicated that they have a formal policy regarding timely payment standards. All ofthese governments should consider adopting a formal policy that provides for paying contrac-tors within 30 to 60 days of a project’s completion, provided that the quality of the work isacceptable.
Appendices 165
Training Issues
The municipalities were asked to detail mandatory and optional sources of training aboutcontract oversight that are available to managers in charge of this function. Only one munic-ipality indicated that it has formal training requirements for managers with purchasingresponsibilities. However, four municipalities offer optional training opportunities with vary-ing availability. Another municipality did not provide any specific information aboutmandatory or optional training for contract management.
Procurement
Reed and Swain suggest that the goal of any public purchasing system is to obtain the mostappropriate and highest quality good or service for the lowest cost. This requires several keyelements; among the most important of these are clearly defined responsibilities of the vari-ous aspects of purchasing within an organization, methods for procuring goods and services,written specifications, requirements for vendors and contractors, ethical standards for behav-ior, internal controls, and inventory management. Reed and Swain further advise that writ-ten policies and procedures, adopted by the organization’s policy-making body, shouldexplain these elements clearly. This section of the appendix examines topics related to thesekey elements, such as bidding policies, approval of purchases, monitoring purchases, mana-gerial flexibility, challenges and problems in purchasing, and improvements and innovationsin this area (Reed and Swain, 1997).
Bidding Policies
A formal procurement policy is a necessary element for a successful purchasing system. In itsModel Procurement code, the American Bar Association has detailed several items thatshould be included in a procurement policy. These include clarity, consistency, provision forpublic confidence, fair and equitable treatment of vendors, increased economy and maximiz-ing of purchase values, fostering of competition, and safeguards to ensure quality andintegrity (Reed and Swain, 1997).
While the survey did not solicit details about the contents of each municipality’s pro-curement policy, it did ask the respondents to indicate whether a formal procurement policyexists in their municipality. Only two municipalities indicated that they have a procurementmanual, and another cited NJSA 40A:5-1 et seq Local Fiscal Affairs Law as its procurementpolicy. Since legal jargon can be difficult to interpret, all municipalities should consider pro-ducing a procurement manual for distribution.
Although the bid threshold established by the state of New Jersey is $17,500, or $25,000for qualified purchasing agents, a municipality’s governing body can elect to set a lowerthreshold if it so chooses. All municipalities indicated that they have a formal process forobtaining bids or quotes for goods and all but one operates using the state-recommended bidthreshold of $17,500. One municipality indicated that quotes up to $1,000 could be madewithout initiating formal bidding. If this is accurate, it is far too restrictive and should berevised.
166 THE NEW JERSEY INITIATIVE: Building Management Capacity in New Jersey Municipalities
Approval of Purchases
As with contracting, the individuals or entities authorized to approve purchases requiringformal bids differ from those that are authorized to approve purchases not requiring formalbids. In purchasing, yet another person or entity may have the authority to approve purchas-es that are defined as “small.” Although New Jersey law requires the governing body of amunicipality to approve purchases that require formal bids, only three municipalities indicat-ed that they follow this guideline.
For purchases that do not require formal bids, each municipality requires different levelsof approval, which suggests varying degrees of control over the purchasing function. Brick’scentralized purchasing office approves purchases that do not require formal bids. InElizabeth, the purchasing agent/business administrator approves such purchases and in OldBridge, they are approved by the department head and chief financial officer. Paterson has anextraordinarily restrictive system, wherein the purchasing agent can approve purchases under$2,500, but must obtain council approval for purchases greater than that amount. InTrenton, a supervisor, division head, and department director must approve purchases thatdo not require formal bids.
One of the four key characteristics of a successful procurement process, as set forth bythe National Commission on the State and Local Public Service, is a single-signature policyfor managers on small purchases (Aronson and Schwartz, 375). However, New Jersey Statelaw prohibits this because the chief financial officer of a municipality must certify the avail-ability of funds before a purchase can be made. As a result, managers must get approval forall purchases, whether for $10 or $10,000.
Monitoring Purchases
Three municipalities give procurement oversight responsibility to one office, but the othertwo distribute this power among three entities. According to Bartle and LaCourse Korosec,“where three or more agencies are involved, it is possible that too many cooks might spoilthe soup” (2001, 14). Therefore, unless responsibilities are clearly delineated among the agen-cies, Elizabeth and Trenton should consider streamlining their oversight processes.
Each municipality employs slightly different methods to ensure that contractors complywith the terms of purchasing contracts. In Brick, prior to payment, the receiving departmentand the department head for the office that received the service or item must sign off on thecontract’s completion. Elizabeth and Paterson each require performance bonds. While bond-ing requirements are important “as both incentive to the supplier and protection to theagency, they can reduce the number of potential bidders” (Reed and Swain, 1997, 191).Public organizations should avoid adopting bonding requirements so strict that they reducecompetition. In Trenton, the department requesting the service or product must verify andapprove these purchases.
Managerial Flexibility
The issue of centralization and decentralization in procurement illustrates the tensionbetween oversight measures and managerial flexibility. Even in a centralized system, somedecision-making power should be diffused to managers to maximize efficiency. However, ananalysis of the survey responses suggested that none of the municipalities actually provide
Appendices 167
managers the sole authority to make small purchases.An important demonstration of managerial flexibility is special authority for purchasing
in the case of emergencies. New Jersey Public Contracting Law provides such authority foremergencies affecting public health, safety, or welfare that require the immediate delivery ofgoods or the performance of services. Based on the survey responses, it appears that all butone of the municipalities is aware of this clause and provide for such measures in their pro-curement practices.
Challenges and Problems in Purchasing
Only three municipalities cited challenges or problems facing their procurement systems. Thefollowing are the individual challenges cited by each of those municipalities:
• “Departments are not familiar with existing and updated laws.”
• “Purchasing agents’ purchasing authority should be increased from $17,500 to $25,000 toreduce cost and improve efficiency.”
• “Divisions should prepare more blanket orders, thus reducing the number of purchaseorders printed.”
Improvements and Innovations
Brick cited two important innovations: cooperative purchasing and the preparation of pur-chasing policies for contractors and vendors. Cooperative purchasing is an arrangementbetween cities, counties, and school districts to pool their bids for goods and services. Indeed,Aronson and Schwartz extol the benefits of cooperative purchasing: “although it may be timeconsuming and sometimes costly to get started, cooperative purchasing has compellingadvantages for smaller local governments, including more buying power, more accurate andcomprehensive specifications, and better vendor service” (1996, 370).
To attract more vendors—especially small businesses, which are often owned by womenand minorities—Aronson and Schwartz (1996) suggest that local governments need to providethem with more information about the procurement process. Governments should includeinformation about the opportunities, the requirements, vendor mailing lists, doing businesswith government, obtaining help from the purchasing agency, and simplifying or speeding uppaperwork. Brick’s new manual, entitled Doing Business with Brick, is a positive step towardinforming vendors and thereby broadening the vendor pool.
Other municipalities also cited improvements and innovations. Elizabeth implemented“ED1 ordering” and Trenton began the Local Business Enterprise program. Paterson notedthat an audit conducted by the New Jersey Division of Local Government Services did notreveal any need for improvement beyond increasing the purchasing agent’s purchasing power.
Conclusions and Recommendations
Although the tension between centralization and decentralization is clearly evident in themunicipalities, there is little they can do to affect this since New Jersey State law mandatesmany of the constraints that promote a high degree of centralization. However, in some cases,the municipalities have imposed additional restrictions, such as requiring entities other than
168 THE NEW JERSEY INITIATIVE: Building Management Capacity in New Jersey Municipalities
the governing body to approve contracts that exceed the bid threshold, or by requiring enti-ties other than the purchasing office (or another centralized office) to approve contractsunder the bid threshold.
In other instances, oversight measures did not appear to be stringent enough. For exam-ple, none of the municipalities has a formalized policy dictating when contractors should bepaid. The municipalities should strive to balance oversight measures with managerial flexibil-ity by providing managers with reasonable limits on purchases requiring higher-levelapproval, a single-signature policy on small purchases, and the ability to use master con-tracts.
Another concern that should be addressed is the lack of formal training requirementsregarding contracting and procurement procedures in the municipalities. Agencies need toincrease their awareness and understanding of the laws that guide the contracting and pro-curement processes, so they can navigate these rules more effectively. With this, the overallsystem would see gains in efficiency.
The fact that the municipal governments indicated that they are moving away fromprice as the sole measure of a proposal’s merits in competitive contracting illustrates a posi-tive trend in this area. Much of the literature on contracting and procurement notes thatvalue analysis (VA) is becoming an increasingly important tool for local governments. Thisenables governments to evaluate goods and services in terms of their full cost and require-ments for performance, quality, and durability, rather than simply choosing the lowest price.Proper utilization of VA can promote better decision-making by managers and save substan-tial resources. The state of New Jersey should consider modifying the law that mandatesawarding competitive bids to the “lowest responsible bidder.” This would enable municipali-ties to utilize VA on all contracts and purchases, which could ultimately result in significantsavings (see Aronson and Schwartz, 1996).
Appendices 169
Appendix E
REVENUE RAISING CAPACITY
IN NEW JERSEY MUNICIPALITIES
INADEQUACY OF RESOURCES IS A CONTINUOUS PROBLEM for New Jersey municipalities,especially in urban areas, as was mentioned in Chapter 2, “Financial Management.” The inad-equacy of resources results from insufficient revenues, excessive expenditures, or both. Thisappendix focuses on the revenue side of the equation by estimating the potential to raise newrevenues, or revenue raising capacity (RRC), for five New Jersey municipalities. This estimationfollows the Representative Tax System Methodology developed by the U.S. AdvisoryCommission on Intergovernmental Relations (ACIR).
Municipal governments’ RRC is determined by a combination of residents’ capacity ofpayment and municipalities’ capacity to pass the tax burden to non-residents. Revenue raisingcapacity is an important determinant of municipal fiscal health, which is defined as a munici-pal government’s ability to deliver public services to its residents at a reasonable tax rate. Inother words, fiscal health is the balance between a municipal government’s ability to raise rev-enue and the amount it must spend to obtain the level of services requested by its con-stituents. Notice that a municipality’s fiscal health can diverge from its residents’ economichealth for economic reasons, such as extensive service responsibilities, or institutional reasonssuch as an inability to tax commuters’ income (Ladd and Yinger, 1989). Although a furtheranalysis of New Jersey municipalities’ fiscal health is pertinent and desirable,1 this appendixfocuses only on their potential to raise new revenues.
Based on the assumption that there is substantial heterogeneity between the economicand fiscal structures of urban and suburban areas, this analysis applies the following classifica-tions (provided by the New Jersey Department of Community Affairs) for five municipalitiesfor which data were available. Elizabeth City, Paterson City, and Trenton City are classified asurban municipalities, while Brick Township and Old Bridge Township are considered suburban(this differentiation is consistent with the one proposed by Díaz and Green for the Wisconsincase, 2001). This appendix discusses the revenue raising capacity in these jurisdictions.
Revenue Raising Capacity
Revenue raising capacity is the measure of how much revenue a municipality has the potentialto raise with a given tax rate, usually defined as the average rate of a set of municipalities.Revenue collected is an incomplete measure of municipalities’ capacity to raise revenue,because it does not account for their potential to collect additional revenues. Consequently,RRC is a combination of residents’ capacity of payment and municipalities’ capacity to shiftthe tax burden to non-residents.2 The RRC is not related to the revenue that municipalitiesactually collect; instead RRC is dependent upon the municipality’s decisions regarding tax baseand rates.
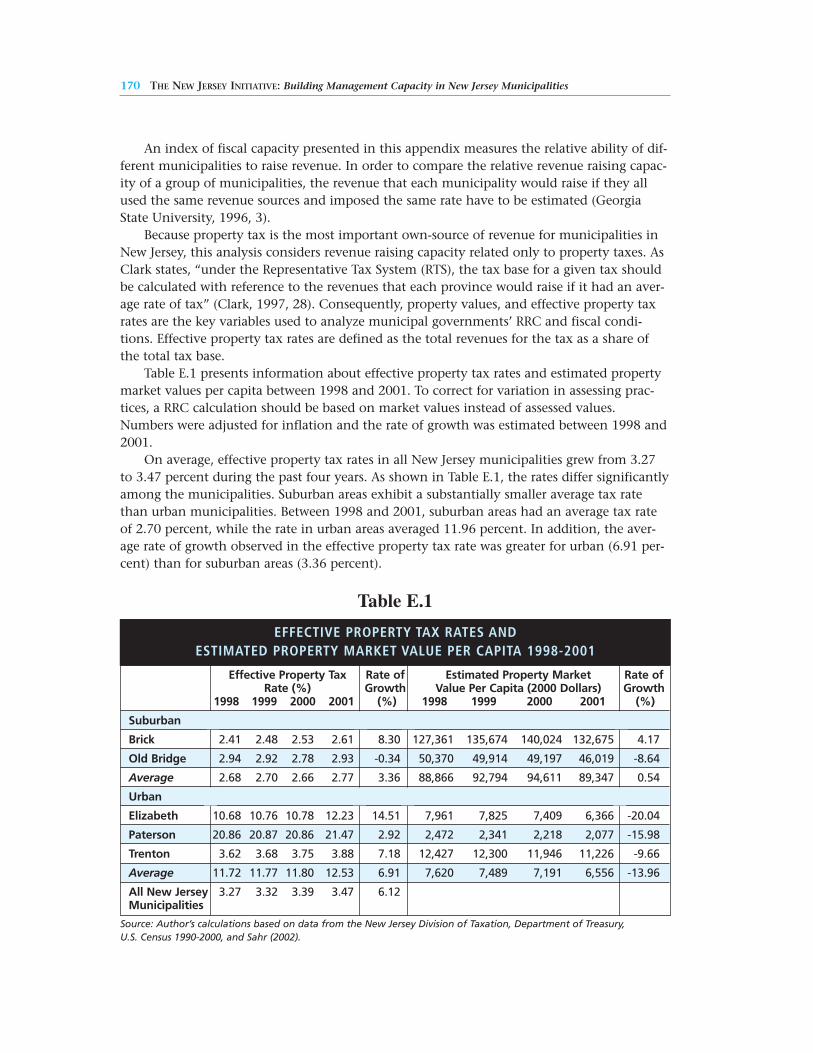
170 THE NEW JERSEY INITIATIVE: Building Management Capacity in New Jersey Municipalities
EFFECTIVE PROPERTY TAX RATES AND ESTIMATED PROPERTY MARKET VALUE PER CAPITA 1998-2001
Effective Property Tax Rate of Estimated Property Market Rate ofRate (%) Growth Value Per Capita (2000 Dollars) Growth
1998 1999 2000 2001 (%) 1998 1999 2000 2001 (%)
Suburban
Brick 2.41 2.48 2.53 2.61 8.30 127,361 135,674 140,024 132,675 4.17
Old Bridge 2.94 2.92 2.78 2.93 -0.34 50,370 49,914 49,197 46,019 -8.64
Average 2.68 2.70 2.66 2.77 3.36 88,866 92,794 94,611 89,347 0.54
Urban
Elizabeth 10.68 10.76 10.78 12.23 14.51 7,961 7,825 7,409 6,366 -20.04
Paterson 20.86 20.87 20.86 21.47 2.92 2,472 2,341 2,218 2,077 -15.98
Trenton 3.62 3.68 3.75 3.88 7.18 12,427 12,300 11,946 11,226 -9.66
Average 11.72 11.77 11.80 12.53 6.91 7,620 7,489 7,191 6,556 -13.96
All New Jersey 3.27 3.32 3.39 3.47 6.12Municipalities
An index of fiscal capacity presented in this appendix measures the relative ability of dif-ferent municipalities to raise revenue. In order to compare the relative revenue raising capac-ity of a group of municipalities, the revenue that each municipality would raise if they allused the same revenue sources and imposed the same rate have to be estimated (GeorgiaState University, 1996, 3).
Because property tax is the most important own-source of revenue for municipalities inNew Jersey, this analysis considers revenue raising capacity related only to property taxes. AsClark states, “under the Representative Tax System (RTS), the tax base for a given tax shouldbe calculated with reference to the revenues that each province would raise if it had an aver-age rate of tax” (Clark, 1997, 28). Consequently, property values, and effective property taxrates are the key variables used to analyze municipal governments’ RRC and fiscal condi-tions. Effective property tax rates are defined as the total revenues for the tax as a share ofthe total tax base.
Table E.1 presents information about effective property tax rates and estimated propertymarket values per capita between 1998 and 2001. To correct for variation in assessing prac-tices, a RRC calculation should be based on market values instead of assessed values.Numbers were adjusted for inflation and the rate of growth was estimated between 1998 and2001.
On average, effective property tax rates in all New Jersey municipalities grew from 3.27to 3.47 percent during the past four years. As shown in Table E.1, the rates differ significantlyamong the municipalities. Suburban areas exhibit a substantially smaller average tax ratethan urban municipalities. Between 1998 and 2001, suburban areas had an average tax rateof 2.70 percent, while the rate in urban areas averaged 11.96 percent. In addition, the aver-age rate of growth observed in the effective property tax rate was greater for urban (6.91 per-cent) than for suburban areas (3.36 percent).
Table E.1
Source: Author’s calculations based on data from the New Jersey Division of Taxation, Department of Treasury, U.S. Census 1990-2000, and Sahr (2002).
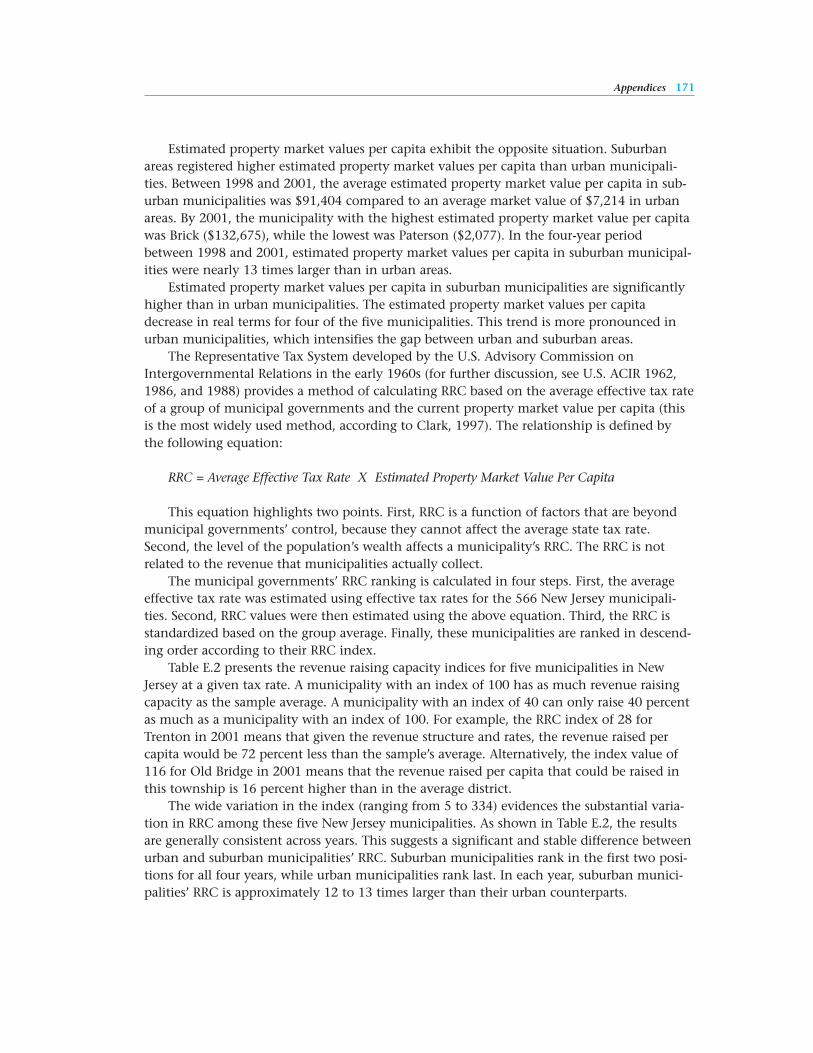
Appendices 171
Estimated property market values per capita exhibit the opposite situation. Suburbanareas registered higher estimated property market values per capita than urban municipali-ties. Between 1998 and 2001, the average estimated property market value per capita in sub-urban municipalities was $91,404 compared to an average market value of $7,214 in urbanareas. By 2001, the municipality with the highest estimated property market value per capitawas Brick ($132,675), while the lowest was Paterson ($2,077). In the four-year periodbetween 1998 and 2001, estimated property market values per capita in suburban municipal-ities were nearly 13 times larger than in urban areas.
Estimated property market values per capita in suburban municipalities are significantlyhigher than in urban municipalities. The estimated property market values per capitadecrease in real terms for four of the five municipalities. This trend is more pronounced inurban municipalities, which intensifies the gap between urban and suburban areas.
The Representative Tax System developed by the U.S. Advisory Commission onIntergovernmental Relations in the early 1960s (for further discussion, see U.S. ACIR 1962,1986, and 1988) provides a method of calculating RRC based on the average effective tax rateof a group of municipal governments and the current property market value per capita (thisis the most widely used method, according to Clark, 1997). The relationship is defined bythe following equation:
RRC = Average Effective Tax Rate X Estimated Property Market Value Per Capita
This equation highlights two points. First, RRC is a function of factors that are beyondmunicipal governments’ control, because they cannot affect the average state tax rate.Second, the level of the population’s wealth affects a municipality’s RRC. The RRC is notrelated to the revenue that municipalities actually collect.
The municipal governments’ RRC ranking is calculated in four steps. First, the averageeffective tax rate was estimated using effective tax rates for the 566 New Jersey municipali-ties. Second, RRC values were then estimated using the above equation. Third, the RRC isstandardized based on the group average. Finally, these municipalities are ranked in descend-ing order according to their RRC index.
Table E.2 presents the revenue raising capacity indices for five municipalities in NewJersey at a given tax rate. A municipality with an index of 100 has as much revenue raisingcapacity as the sample average. A municipality with an index of 40 can only raise 40 percentas much as a municipality with an index of 100. For example, the RRC index of 28 forTrenton in 2001 means that given the revenue structure and rates, the revenue raised percapita would be 72 percent less than the sample’s average. Alternatively, the index value of116 for Old Bridge in 2001 means that the revenue raised per capita that could be raised inthis township is 16 percent higher than in the average district.
The wide variation in the index (ranging from 5 to 334) evidences the substantial varia-tion in RRC among these five New Jersey municipalities. As shown in Table E.2, the resultsare generally consistent across years. This suggests a significant and stable difference betweenurban and suburban municipalities’ RRC. Suburban municipalities rank in the first two posi-tions for all four years, while urban municipalities rank last. In each year, suburban munici-palities’ RRC is approximately 12 to 13 times larger than their urban counterparts.
172 THE NEW JERSEY INITIATIVE: Building Management Capacity in New Jersey Municipalities
Conclusions
The analysis of these five New Jersey municipalities suggests the existence of significant dif-ferences between urban and suburban municipalities, mainly regarding their economic rev-enue raising capacity. Based on their estimated property market values per capita, suburbanareas tend to be wealthier. They also exhibit lower effective property tax rates than urbanareas.
According to the estimates presented, the RRC is larger and has been growing faster insuburban municipalities than in urban municipalities. This difference can be explained bythe growth rate of assessed values per capita, property market values (as measures of wealthdistributions between urban and suburban municipalities), and the higher tax rates imposedby urban municipal governments.
Although RRC is an incomplete measure of municipal governments’ fiscal health, it is animportant indicator of their capacity to raise revenues. Municipal governments in New Jerseydeal frequently with problems related to inadequate resources. Thus, understanding thepotential amount of revenues that municipalities can collect is important when local officialsare designing and evaluating mechanisms to raise new revenues.
Table E.2
Source: Author’s calculations based on data from the New Jersey Division of Taxation, Department of Treasury,U.S. Census 1990-2000, and Sahr (2002).
REVENUE RAISING CAPACITY
RRC 1998 RRC 1999 RRC 2000 RRC 2001RRC Index Rank RRC Index Rank RRC Index Rank RRC Index Rank
Suburban
Brick Township 317 1 326 1 332 1 334 1
Old Bridge Township 126 2 120 2 117 2 116 2
Average 221.50 223.00 224.50 225.00
Urban
Elizabeth City 20 4 19 4 18 4 16 4
Paterson City 6 5 6 5 5 5 5 5
Trenton City 31 3 30 3 28 3 28 3
Average 19.00 18.33 17.00 16.33
Appendices 173
Notes
1 Fiscal stress is not a new concern for New Jersey municipalities and state authorities. As amatter of fact, state financial laws have mechanisms in place to deal with this reality. NewJersey financial officials have utilized estimates of fiscal stress for many years. In the NewJersey context, previous works in this area include the Municipal Distress Index (MDI) andthe Erickson and Regan (2000) fiscal stress index. The MDI “ranks New Jersey municipali-ties according to eight separate indicators that measure diverse aspects of social, economic,physical, and fiscal conditions of each locality” (New Jersey Office of State Planning, 1997,1). The Erickson and Regan index measures fiscal stress, defined as a “condition in which amunicipality must levy a higher than average property tax rate in order to provide theaverage level of public services” (2000, 1). These two approaches, however, fail to considerthat New Jersey municipalities are quite diverse; analyses and measures of fiscal stressshould account for that diversity.
2 An alternative measure of RRC developed by Ladd and Yinger (1989) takes into considera-tion the percentage of taxes that can be shifted to non-residents according to property dis-tribution and use. Although this measure is more accurate than the one used in this appen-dix, the data required were not available.
174 THE NEW JERSEY INITIATIVE: Building Management Capacity in New Jersey Municipalities
Appendix F
NEW JERSEY
DEPARTMENT OF COMMUNITY AFFAIRS
THE NEW JERSEY DEPARTMENT OF COMMUNITY AFFAIRS is a broad-based agency thatprovides technical, advisory, and financial assistance to communities and individuals. TheDepartment administers a wide range of functions and programs such as housing assistance,building safety standards, safety in the workplace, local government financial assistance andoversight, and services to the disadvantaged and other groups with unique needs.
The Department of Community Affairs also houses the Division of Local GovernmentServices (DLGS), which serves as an advocate for local government interests and providesthem with technical and financial assistance in budgeting, financial reporting, joint services,purchasing, and management issues. Additional functions of the Division include the reviewand approval of all municipal, county, and fire district budgets, and the review of many localgovernment financial actions. The Division of Local Government Services is also responsiblefor the financial integrity of all local government units and guides the conduct of local gov-ernment officials.
Appendices 175
Appendix G
THE MAXWELL SCHOOL OF CITIZENSHIP AND
PUBLIC AFFAIRS AT SYRACUSE UNIVERSITY
THE MAXWELL SCHOOL OF SYRACUSE UNIVERSITY IS DEDICATED TO EDUCATION for cit-izenship, professional training in public and international affairs, and teaching and scholar-ship across the full range of social sciences at both the undergraduate and graduate levels.Founded in 1924, The Maxwell School was the first university-based school of public affairs inthe United States. It has remained a leader in the field throughout its history and has consis-tently been ranked first in the nation among some 250 graduate programs in public affairs byU.S. News and World Report.
Maxwell has more than 140 full-time faculty members teaching and conducting researchin the following ten departments: anthropology, economics, geography, history, internationalrelations, political science, public administration, public affairs, social science, and sociology. Italso houses numerous multidisciplinary research and graduate training centers, including theCenter for Policy Research, the Global Affairs Institute, the Alan K. Campbell Public AffairsInstitute, the Center for Environmental Policy and Administration, and the Program on theAnalysis and Resolution of Conflicts.
The Maxwell School enrolls over 700 students each year at the graduate level, and func-tions as the social science division of Syracuse University’s College of Arts and Sciences at theundergraduate level. Maxwell’s focus on interdisciplinary research is unmatched in academia.Additionally, the Maxwell curriculum and its emphasis on theory and practice offer its stu-dents a solid foundation to pursue first-tier positions in academia, government and the privatesector.
More than 7,000 Maxwell graduate alumni hold positions of responsibility with nationaland subnational governments, in international organizations, on college and university facul-ties, and in nonprofit and private organizations in the United States and abroad. Currently,seven Maxwell Ph.D.’s are president of a U.S. college or university. Some 500 of these alumnihave held high-level positions in Washington, D.C., or abroad during the past decade, includ-ing secretary of the Department of Health and Human Services, deputy secretary of theDepartment of Defense, member of the Federal Trade Commission, secretary of theDepartment of the Navy, foreign minister of Jordan, director general of the International

176 THE NEW JERSEY INITIATIVE: Building Management Capacity in New Jersey Municipalities
Organization for Migration, U.S. ambassador to Argentina, and executive director of theAfrican Development Bank. In December 2001, Sean O’Keefe (1978 M.P.A.) was confirmed bythe U.S. Senate to serve as Administrator of NASA.
Appendices 177
Appendix H
ALAN K. CAMPBELL PUBLIC AFFAIRS INSTITUTE
AT SYRACUSE UNIVERSITY
THE AIM OF THE ALAN K. CAMPBELL PUBLIC AFFAIRS INSTITUTE is to promote betterunderstanding of contemporary challenges in democratic governance.
The Campbell Institute examines how public organizations can be designed to achievetheir purposes more effectively. The Institute explores the relationship between governmentsand citizens, to understand how governing institutions can be made more responsive to theneeds of citizens and respectful of their rights. The Institute studies the ideal of citizenship,its evolution, and the conditions under which it thrives.
These questions have always been central to the mission of The Maxwell School atSyracuse University. Today, these questions are made more complicated – and more pressing– by the realities of profound social, economic, and technological change.
The Campbell Institute pursues its objective in four ways. Faculty and doctoral studentsaffiliated with the Institute are engaged in research on a wide range of topics relating todemocratic governance.
The Institute’s faculty also undertake projects that connect research to practice. From1996 to 2002, the Institute was home to the Government Performance Project, an effort toassess the managerial capabilities of state, county, and city governments. The New JerseyInitiative, undertaken during 2001 to 2002, made a similar review of New Jersey municipalities.
The Institute also builds broader networks with scholars and policymakers interested inproblems of democratic governance. It hosts symposia and talks on current issues. A recentconference examined the performance of public organizations in response to the September11, 2001 terror attacks. The Institute is a co-sponsor of the prestigious State of DemocracyLecture Series and Environmental Speakers Series.
The work of the Institute is made widely available through print and web-based publica-tions. The Institute’s associates present results from their research in working papers that arepublished on its web site (http://www.campbellinstitute.org). The Institute sometimes pro-duces larger works, such as its 2002 book, Governance and Public Security.
The Institute is named in honor of Alan K. Campbell, Dean of the Maxwell School from1969 to 1976. “Scotty” Campbell had a distinguished career in academia, state and federalgovernment, and the private sector. Through its work, the Institute honors his lifelong com-mitment to effective government, full and equal citizen participation, and incisive, policy-relevant research.
178 THE NEW JERSEY INITIATIVE: Building Management Capacity in New Jersey Municipalities
Appendix I
EAGLETON INSTITUTE OF POLITICS AT RUTGERS,THE STATE UNIVERSITY OF NEW JERSEY
THE EAGLETON INSTITUTE OF POLITICS AT RUTGERS, The State University of New Jersey,explores state and national politics through research, education, and public service, linkingthe study of politics with its day-to-day practice.
The Institute focuses attention on how contemporary political systems work, how theychange, and how they might work better. Eagleton’s faculty, centers, and programs specializein the study of state legislatures; public opinion polling and survey research; women’s partici-pation in politics; race and politics; campaigns, elections, and political parties; civic educa-tion and engagement; and New Jersey politics. The Institute includes the Center forAmerican Women and Politics (CAWP) and the Center for Public Interest Polling (CPIP),both established in the early 1970s.
The Eagleton New Jersey Project coordinates, strengthens, and expands Eagleton’s variedefforts to assist individual governments and organizations in shaping New Jersey’s politicaland policy agenda. Launched in the fall of 1995, the project provides a focus for Eagleton’spresence in the state and its efforts to increase awareness and understanding of New Jerseypolitics.
For Rutgers University graduate and undergraduate students, Eagleton offers a range ofeducation programs, including an undergraduate certificate, graduate fellowships, researchassistantships and internships, and opportunities to interact with political practitioners. TheInstitute also convenes conferences and other forums for the general public. In addition,Eagleton undertakes projects to enhance political understanding and involvement, often incollaboration with politicians, government agencies, the media, non-profit groups, and otheracademic institutions.
The Eagleton Institute was established in 1956 with a bequest from Florence PeshineEagleton, a founder of New Jersey’s League of Women Voters.
Appendices 179
Appendix J
BIOGRAPHIES
Paula Acosta – Financial Management Research Assistant, is an M.P.A. candidate at SyracuseUniversity. Prior to her studies at The Maxwell School, Ms. Acosta worked at the Center forStudies of Economic Development at Universidad de los Andes in Colombia. She completedan M.A. in political science from Universidad de los Andes, a specialized degree in negotia-tion and international affairs, and a B.S. in industrial engineering from the same institution.
Connie Bawcum – Capital Management Project Consultant, is a local government practitionerwith over 25 years experience. From 1991 to 2001, Ms. Bawcum served as deputy city man-ager for Richmond, Virginia. Richmond is a full-service city government with a population of200,000, 4500 employees, and an annual budget of over $800 million. From 1980 to 1990,she worked for Prince William County, a rapidly growing suburb of Washington D.C. Sheserved as deputy county executive, finance director, and budget director during her tenurethere. Prior experience includes positions with the City of Knoxville, Tennessee and theKnoxville-Knox County Metropolitan Planning Commission. Ms. Bawcum has served as thepresident of the Virginia Local Government Managers Association, on the advisory commit-tee for the Virginia Institute of Government, Richmond Ambulance Authority, LocalInitiatives Support Corporation, and the Carpenter Center for the Performing Arts. She is cur-rently engaging in public management consulting as a principal with B & W Partners. Ms.Bawcum received both Master’s and Bachelor’s degrees in public administration from theUniversity of Tennessee.
Max Bohnstedt – Capital Management Project Consultant, is principal of a consulting practiceproviding financial advisory services. Mr. Bohnstedt also serves as an external resource incapital planning and budgeting, project management for structuring and issuing appropriatefinancing instruments, and debt management practices. He began his professional careerwith the Quaker Oats Company, rising through positions in production, operating staff, andfinancial control departments. Assignments varied from packaging foreman to corporatemanager of cost accounting and included management responsibilities for production, ware-house operation, planning and operations analysis, and cost control at both the plant andcorporate levels. Mr. Bohnstedt became a fellow in the National Program for EducationalLeadership, a self-directed study of school administration culminating in an internship asdirector of Multiyear Planning with the Oak Ridge, Tennessee schools. He exited the fellow-ship as an associate superintendent and chief financial officer of the school district ofGreenville County, South Carolina with responsibility for budgeting, accounting, treasury,data processing, purchasing, warehousing, food service, and federal projects. Mr. Bohnstedtserved as finance director and chief financial officer of Broward County, Florida;Montgomery County, Maryland; and the City of Richmond, Virginia. He was responsible for
180 THE NEW JERSEY INITIATIVE: Building Management Capacity in New Jersey Municipalities
the administration of treasury, accounting and reporting, capital financing, revenue collec-tion, procurement, debt management, and risk and insurance management, self-insurance,and official records functions. Mr. Bohnstedt retired in 1999 as the deputy manager foradministration for Richmond, Virginia. He received a B.S. in industrial education from PurdueUniversity in 1959 and an M.B.A. from Northwestern University in 1971.
Stuart Bretschneider – Information Technology Management Faculty Expert, is a professor ofpublic administration with The Maxwell School at Syracuse University. Upon arriving to TheMaxwell School in 1982, and with the aid of a grant from the Andrew Mellon Foundation,Dr. Bretschneider integrated computer and information management into the school’s publicadministration curriculum. He also served on the National Association of Schools of PublicAffairs and Administration’s ad-hoc committee for computer education in public administra-tion. The final committee report, which he helped author, includes many of Dr.Bretschneider’s curriculum innovations. He is director of the Center for Technology andInformation Policy at The Maxwell School that has functioned in the past with the L.C.Smith School of Engineering’s Institute for Energy Research, in which Dr. Bretschneider alsoserves as a senior research associate. His current research interests include public managementinformation systems, technology assessment and forecasting, public sector financial forecast-ing, decision-making in public organizations, and applied statistics. The National ScienceFoundation, the states of Kentucky and New Jersey, and the Mellon Foundation have support-ed Dr. Bretschneider’s research. He has published over twenty-five articles in journals such asManagement Science, Information Systems Review, Decision Sciences, Public Administration Review,International Journal of Forecasting, and Evaluation Review. A director and past president of theInternational Institute of Forecasting, Dr. Bretschneider also serves as an associate editor forthe International Journal of Forecasting. Dr. Bretschneider is currently the managing editor forthe Journal of Public Administration Research and Theory. He is a member of the Institutes ofManagement, American Society for Public Administration, and the International Institute ofForecasting. He has also consulted for the U.S. General Accounting Office, the states of NewYork, Ohio, and Kentucky, and several Fortune 500 companies including AT&T. Dr.Bretschneider received his Ph.D. in public administration from the College of AdministrativeSciences at The Ohio State University in 1980.
Loretta Buckelew – Advisory Committee Member, has been with the New Jersey Department ofCommunity Affairs, Division of Local Government Services, since 2000 as the assistant to thedeputy director of the division. Ms. Buckelew has assisted the deputy director in legislativematters, the application and administration of the Local Public Contracts Law, and variousother laws and programs. Prior to working with the Department of Community Affairs, Ms.Buckelew worked as a municipal clerk/registrar for the Township of Long Hill and deputymunicipal clerk for the Township of Maplewood. She received an M.P.A. from Kean Universityand a B.A. in political science/criminal justice. Ms. Buckelew is also a registered municipalclerk as designated by the New Jersey Department of Community Affairs and a certifiedmunicipal registrar as designated by Rutgers, The State University of New Jersey.
Jessica Crawford – Public Relations Coordinator and Human Resources Management SeniorResearch Assistant, is currently the project manager for the Government Performance Projectat The Maxwell School at Syracuse University. Prior to serving as project manager, Ms.Crawford also served as the project coordinator and as a research assistant for the Project. She
Appendices 181
completed her M.P.A. at The Maxwell School and B.A. at Syracuse University, majoring ineconomics and policy studies.
Henry A. Coleman – Advisory Committee Member, has served as an instructor and assistantprofessor in the economics department at Tufts University in addition to serving adjunct fac-ulty appointments at American University, the University of Maryland, and George MasonUniversity. Mr. Coleman was in the Office of Policy Development and Research in the U.S.Department of Housing and Urban Development as a Brookings Institution economic policyfellow and visiting scholar. He was also employed as a senior economist in the Office of theChief Economist at the U.S. General Accounting Office. Mr. Coleman served as the executivedirector of the New Jersey State and Local Expenditure and Revenue Policy Commission. Hewas also employed as the assistant director for operations and research in the Office of StatePlanning, a component of the New Jersey Department of Treasury. Mr. Coleman also servedas a policy adviser on fiscal, budget, and housing issues in Governor Florio’s Office ofManagement and Planning. Immediately prior to assuming his current responsibilities, heserved as the director of government finance research at the U.S. Advisory Commission onIntergovernmental Relations. Since the fall of 1992, Mr. Coleman has served as the directorof the Center for Government Services, a component of the Edward J. Bloustein School ofPlanning and Public Policy at Rutgers, The State University of New Jersey. Currently, he alsoserves as a faculty member in the Bloustein School’s department of public policy. Mr.Coleman completed his Ph.D. in economics at Princeton University and B.A. in economics atMorehouse College.
Alyssa Colonna – Editor, has edited forthcoming books on environmental conflict resolutionand governance and public security, and reviews learning papers, survey instruments, website postings, and official correspondence for the Government Performance Project and otherinitiatives for the Alan K. Campbell Public Affairs Institute at The Maxwell School. Ms.Colonna, from Nazareth, Pennsylvania is dually enrolled in the S.I. Newhouse School ofPublic Communications and the School of Management at Syracuse University, pursuing aBachelor’s degree in broadcast journalism and finance. She was inducted in April 2002 to theBeta Gamma Sigma honor society for the Association to Advance Collegiate Schools ofBusiness, International (AACSB). Ms. Colonna has also worked as a reporter for The Express-Times newspaper in Easton, Pennsylvania, and as a news intern for WFMZ-TV Channel 69 inAllentown, Pennsylvania.
Suzette Denslow – Capital Management Project Consultant, is the legislative director forGovernor Mark Warner of Virginia. Prior to this post, Ms. Denslow was legislative liaison forthe Virginia Community College System; Arlington County, Virginia; and the VirginiaAssociation of Counties during the Virginia General Assembly sessions. She also served as asenior consultant to the National Academy of Public Administration. In 1993, Ms. Denslowwas appointed deputy director of the Virginia Municipal League, and then became the execu-tive director of the Tennessee Municipal League in 1998. She was deputy secretary of educa-tion in the cabinet of Virginia Governor L. Douglas Wilder from 1990 to 1993. She spent thefirst decade of her career in budget and research positions for the Virginia cities ofCharlottesville and Richmond, and also for the Joint Legislative Audit and ReviewCommission.
182 THE NEW JERSEY INITIATIVE: Building Management Capacity in New Jersey Municipalities
Amy Donahue – Public Management Consultant, is assistant professor of public administrationand political science at the University of Connecticut. Dr. Donahue teaches graduate coursesin policy analysis, statistics, and public organizations and management. Her research inter-ests focus on analysis of productive efficiency in the provision of public services, particularlythe influence of managerial decision processes on public production technologies, organiza-tional outputs, policy outcomes, and cost efficiency in the emergency services. She is authorof work related to the relationship of management and performance in government, and haspublished articles in the Journal of Public Administration Research and Theory and PublicAdministration Review. Dr. Donahue has been a senior research associate with the Alan K.Campbell Public Affairs Institute, where she still serves as a consultant for the GovernmentPerformance Project. She also has 18 years of training and experience in a variety of emer-gency service fields. Before embarking on her career in academia, she worked as a 911 com-munications center manager in Fairbanks, Alaska. She also served as a fire-training officer fora combination fire department in Alaska and taught in the Fire Science Program at theUniversity of Alaska. Dr. Donahue served as a captain in the United States Army MedicalService Corps, where she was assigned to the 6th Infantry Division. Dr. Donahue holds herPh.D. and M.A. in public administration from Syracuse University. She earned her B.A. ingeological and geophysical sciences from Princeton University.
Carol Ebdon – Capital Management Project Consultant, is assistant professor of public adminis-tration with the University of Nebraska at Omaha. Her research is primarily in the area ofstate and local budgeting and finance. Dr. Ebdon is currently studying capital managementpractices in state and local governments, local governments, local government revenue diver-sification, and the use of citizen participation in the city budget process. She has publishedin the following journals: Public Budgeting and Finance, Public Budgeting, Accounting andFinancial Management, Public Productivity and Management Review, International Journal of PublicAdministration, and the Journal of Public Affairs Education. Dr. Ebdon formerly worked infinancial management positions for the City of Rochester, New York, including deputy citytreasurer and director of accounting. She completed her Ph.D. at the University at Albany,State University of New York, her M.P.A. at the University of Toledo, and her B.A. at JohnCarroll University.
Jon Erickson – Advisory Committee Member, is an associate professor and director of theMaster of Public Administration Program at Kean University. In addition to teaching andconducting research in the areas of public finance and environmental policy, Dr. Erickson isa member of the Highland Park Borough Council. He graduated with a Ph.D. in urban plan-ning and policy development from Rutgers University and holds a B.A. (Honors) and aMaster of Urban Planning from the University of Oregon.
Chris Folts – Project Management Research Assistant, has interned at the Department of Justiceand a trade association in Washington D.C. Mr. Folts’ research interests include the effects oftechnology on local and federal levels of government. He is a candidate for an M.P.A. at TheMaxwell School at Syracuse University. Mr. Folts received a B.A. in government and politicswith a minor in history from the University of Maryland.
Figen Gungor – Project Senior Research Assistant, is currently working as an adjunct professorof political science at Hofstra University and as a business consultant with NationalDocument Management. While a graduate student at The Maxwell School, she worked as a
Appendices 183
research assistant with the Government Performance Project, focusing on an evaluation ofstate government web sites. She will be starting the Professional Development Program at theU.S. General Accounting Office in the summer of 2002. Ms. Gungor received her M.P.A. fromThe Maxwell School and completed her B.A. in political science and sociology at HofstraUniversity.
Dana Michael Harsell – Project Manager and Managing for Results Research Associate, is a doc-toral candidate in political science at The Maxwell School at Syracuse University. His sub-fields are American government and public administration, and his research interests includeadministrative state reform, public management, and political psychology. Mr. Harsell teach-es courses in political psychology and American government. His Master’s thesis was a com-parative analysis of organizational cultures and their role in fostering total quality manage-ment initiatives in a private sector company and the United States Postal Service. Currently,his research activities include work with the Government Performance Project and the NewJersey Initiative. His dissertation research examines how tensions between career civil servicemanagers and political appointees influence the implementation of the GovernmentPerformance and Results Act of 1993. Mr. Harsell earned his B.A. in political science and psy-chology in 1995 and his M.A. in political science in 1997, both from the University ofMontana.
Yilin Hou – Financial Management Faculty Expert, is a long-term contributor to theGovernment Performance Project, particularly in the area of financial management. Heserved as a research associate, then as a coordinator, and most recently as a faculty expert inthe area of financial management. Dr. Hou conducted research and analysis for both stateevaluation projects with the Government Performance Project. His areas of research includepublic management and public finance and budgeting. Dr. Hou earned his Ph.D. and M.A. inpublic administration from The Maxwell School.
Willow Jacobson - Human Resources Management Research Associate, is a doctoral candidate atThe Maxwell School, pursuing a degree in public administration. She currently works on theGovernment Performance Project and the New Jersey Initiative at the Alan K. CampbellPublic Affairs Institute at The Maxwell School in the area of human resources management.Previously, she has worked with community collaboratives and state government. Ms.Jacobson’s academic focus is on organizational theory and human resources management.She has several publications in the area of human resources management and performance.Ms. Jacobson’s publications appear in Public Administration Review, Review of Public PersonnelAdministration, and Public Personnel Management. She has presented work at numerous aca-demic conferences and professional organizations. Her dissertation focuses on work motiva-tion and receptivity to organizational change in the federal government. Ms. Jacobsonearned a B.S. from the University of Oregon in planning, public policy and management andan M.A. from the University of Oregon in public policy and management.
Dale Jones – Director and Managing for Results Faculty Expert, is an associate professor of publicadministration with The Maxwell School at Syracuse University. Dr. Jones is director of theGovernment Performance Project and teaches courses in public sector leadership and man-agement and organizational theory. In addition to his book, Downsizing the FederalGovernment: The Management of Public Sector Workforce Reductions, publications include articles
184 THE NEW JERSEY INITIATIVE: Building Management Capacity in New Jersey Municipalities
in The American Review of Public Administration, Public Integrity Annual, and other journals.Prior to joining The Maxwell School, Dr. Jones held a faculty position at the U.S. Air ForceAcademy and was an adjunct faculty member with the University of Colorado GraduateSchool of Public Affairs. He completed a military career as an officer in the U.S. Air Force.During his career, Dr. Jones served at the Organization of the Joint Chiefs of Staff at thePentagon and was a certified acquisition program manager. He is a principal with the Councilfor Excellence in Government and has lectured at the Federal Executive Institute. Previously,he was president of the Southern Colorado Chapter of the American Society for PublicAdministration. He completed his Ph.D. in public administration from Syracuse University, anM.A. in public policy from George Washington University, an M.B.A. in management fromWright State University, and a B.S. in aeronautical engineering from the U.S. Air ForceAcademy and is a graduate of the Defense Systems Management College.
Melissa Mink – Human Resources Management Research Assistant, is bound for Boston,Massachusetts, where she is beginning a career as an analyst in the ProfessionalDevelopment Program at the U.S. General Accounting Office. She also served as a humanresources management research assistant for the Government Performance Project. Ms.Mink is currently a candidate for an M.P.A. at The Maxwell School. She earned a B.A. incommunication studies from The College of New Jersey.
Sharif R. Nankoe – Project Management Research Assistant, is a native of the Netherlands, andthe son of Surinamese immigrants. He has worked as a teacher in Kyoto, Japan, and traveledthroughout Southeast Asia. Currently, Mr. Nankoe is a graduate student in public administra-tion and international relations at The Maxwell School, with a focus on policy analysis andinternational law and organization. He earned his B.A. from Ithaca College, New York, with adouble major in history and political science.
Kari Parsons – Project Consultant, is a principal of Parsons Consulting, a private consultingpractice specializing in urban policy and planning, economic and community development,and public administration. Ms. Parsons’ clients include the Government Performance Projectand the Orange County Community Indicator Project (California), which tracks economic,environmental, and social trends as a basis for developing policy strategies for maintaininglong-term regional sustainability. Ms. Parsons is also working in strategic and neighborhoodplanning for a local non-profit community development organization. She began her careerworking in the non-profit environmental field as an administrator for the National AudubonSociety. She later transitioned to regional policy planning and public administration as a man-ager in the Strategic and Intergovernmental Affairs Division of the Orange County ExecutiveOffice. Her Master’s thesis addressed the role and influence of regional governance nation-wide, with particular emphasis on actors on Orange County, California. Ms. Parsons is cur-rently pursuing professional certification in economic development from the Council forUrban Economic Development. She received her B.A. in philosophy from Whitman Collegein 1993 and her M.A. in urban and regional planning from the University of California atIrvine in 1999.
Michele Tuck-Ponder – Advisory Committee Member, has an extensive background in politics,government, media relations, and public policy. A former mayor of Princeton Township, New
Appendices 185
Jersey, she has also served as assistant counsel to Governor Jim Florio, assistant director ofthe New Jersey Division on Women and New Jersey Division on Civil Rights, director ofdevelopment and public affairs at Robert Wood Johnson Medical School, and congressionalaide to former U.S. Representative Louis Stokes and Senator Frank Lautenberg. She recentlycompleted a community builder fellowship with the U.S. Department of Housing and UrbanDevelopment in Camden, New Jersey. Ms. Tuck-Ponder’s public affairs practice is focused onpromoting new ideas, new partnerships, and new energy amongst government, non-profits,and private sector entities. Utilizing her diverse experience, she has a proven capacity tobring people together to address important issues that impact communities, states, and thenation. Her prospective clients are municipalities, organizations, boards and commissions,corporations, and other entities seeking guidance in solving problems or responding to statu-tory or societal needs. Ms. Tuck-Ponder has a special interest in addressing issues involvingaffirmative action, civil rights, women’s issues, local government affairs, community and eco-nomic development, and citizen outreach and communication. Her expertise includes draft-ing legislation, regulations, policy papers, procedural guidelines, proposals, and articles suit-able for publication. She serves as President of the Delaware-Raritan Girl Scout Council andon the boards of directors of the National Conference on Community and Justice, the NewJersey Association on Corrections, the Regional Planning Partnership, the Sharing Network,and the Center for Non-Profits. She is a Leadership New Jersey fellow (class of 1995), and hasco-authored two books published by Random House. She is a graduate of the Medill Schoolof Journalism at Northwestern University and the University of Pennsylvania Law School.
Ora-orn Poocharoen – Managing for Results Research Associate, is a doctoral student at TheMaxwell School pursuing a degree in public administration. Her research interests includegovernment reforms, comparative public administration, and public administration in devel-oping countries. Her Bachelor’s thesis examined the role of international non-governmentalorganizations in international regime formations, with an emphasis on women’s issues. Ms.Poocharoen’s Master’s thesis was a case study of the development of civil society in Thailand.She is currently working as a research associate for the Government Performance Project andthe New Jersey Initiative at the Alan K. Campbell Public Affairs Institute in the area of man-aging for results. A native Thai, Ms. Poocharoen resided in Japan for seven years, where sheearned a Bachelor of Law from Hitotsubashi University in international relations and aMaster of Law from University of Tokyo in political science.
Ingrid W. Reed – Associate Director and New Jersey Government Advisor, is currently director ofthe Eagleton New Jersey Project, an initiative designed to reinforce and expand the contribu-tions of Rutgers’ Eagleton Institute of Politics to the governance and politics of its homestate. Among its initiatives are programs on better campaign activity, welfare reform, govern-ment and information technology, and state planning and governance. Ms. Reed’s work hasincreasingly focused on improving New Jersey election campaigns. She is the co-author ofthe report, Not Bad But Not Enough, with Professor Gerald Pomper, with recommendationsfrom the 1998 New Jersey congressional campaigns. Ms. Reed and Mr. Pomper are currentlycompleting a study of the 2000 congressional campaigns. Before joining the EagletonInstitute, Ms. Reed served as assistant dean of Princeton University’s Woodrow Wilson Schoolof Public and International Affairs where she also directed the Rockefeller Public ServiceAwards Program, and as vice president for public affairs and corporate secretary of theRockefeller University in New York City. In her public service activities, Ms. Reed has a wide
186 THE NEW JERSEY INITIATIVE: Building Management Capacity in New Jersey Municipalities
range of experiences in state politics and planning, governance, and community affairs. Shehas chaired the Capital City (Trenton) Redevelopment Corporation, a state agency, since itbegan in 1988. She is a founder and board member of New Jersey Future, the organizationadvocating the implementation of the State Development and Redevelopment Act, and sheserves on the board of the New Jersey Conservation Foundation and on the Regional PlanAssociation, New Jersey Committee. During the 1980s, Ms. Reed chaired the Mercer CountyPlanning Board. She was elected to the board of the Community Foundation of New Jerseyin April 2000. She also serves as vice-chair of the Sandra Starr Foundation, a Princeton foun-dation that encourages local elected and appointed officials to communicate across munici-pal boundaries. Ms. Reed is a member of the board of the Institute of Public Administration.In 1993, she was elected a fellow of the National Academy of Public Administration and in1998-1999 served on its special panel on Civic Trust and Citizen Responsibility. She is a grad-uate of the University of Pennsylvania.
Sally Coleman Selden – Human Resources Management Faculty Expert, is associate professor ofmanagement at Lynchburg College, Virginia. Previously, she was an assistant professor ofpublic administration with The Maxwell School at Syracuse University, an assistant professorof political science at the University of Oklahoma, and a research associate and instructor atthe University of Georgia. Dr. Selden also worked as program evaluator for the U.S. GeneralAccounting Office. She was given the Leonard D. White Award for the most outstanding dis-sertation in the field of public administration from the American Political ScienceAssociation in 1996. Her fields of interest encompass public management and humanresources management. She served as the human resources management faculty expert forthe Government Performance Project. Together with Dr. Patricia Ingraham, Dr. Selden recent-ly convened a meeting of top-level federal decision makers to establish an agenda for civilservice reform in the federal government. She is author of The Promise of RepresentativeBureaucracy: Diversity and Responsiveness in a Government Agency. Her articles have appeared inAmerican Journal of Political Science, American Review of Public Administration, Review of PublicPersonnel Administration, Journal of Public Administration Education, Public AdministrationReview, and Journal of Public Administration Research and Theory. Dr. Selden received her M.P.A.and B.A. from the University of Virginia and her D.P.A. from the University of Georgia.
Tiffany Tanner – Publication Coordinator and Financial Management Senior Research Assistant, isbeginning a career as an analyst in the Strategic Issues Division of the U.S. GeneralAccounting Office. While completing her graduate studies at The Maxwell School, she servedas a research assistant in the area of capital management for the Government PerformanceProject. Ms. Tanner earned her M.P.A. from The Maxwell School and a B.A. in communica-tion studies from The College of New Jersey.
William Watson – Advisory Committee Member, is executive director of the John S. WatsonInstitute for Public Policy at Thomas Edison State College in Trenton, New Jersey. TheWatson Institute is designed to provide practical and useful policy assistance for decision-makers and partner organizations on a wide range of issues. Its current list of partnershipsand activities include the New Jersey Urban Mayors Association, City of Trenton, Children’sFutures, Center for the Urban Environment, Newark Environmental Coalition, HealthcareInformation Networks and Technologies, Leadership Trenton, and the Trenton EducationInitiative. Mr. Watson continues to devote his efforts to the development and implementa-
Appendices 187
tion of public policy with a focus on urban issues. He also organizes, plans, and directsresearch projects on public policy topics for the Institute. In 1987, Mr. Watson becamedeputy director for the State of New Jersey, Department of the Public Advocate, Division ofCitizen Complaints and Dispute Resolution. At this post he distinguished himself as a leaderin the development of policy and legislative initiatives. In 1990, Mr. Watson successfullymanaged the campaign of Trenton, New Jersey Mayor Douglas Palmer and continued hisservice to the public as deputy mayor/chief of staff for the City of Trenton, New Jersey untilMay 1995. Mr. Watson serves as chairman of the board of trustees of St. Francis MedicalCenter, secretary/treasurer of the Lafayette Yard Community Development Corporation,member of the Trenton branch of the NAACP, commissioner of the Trenton ParkingAuthority, member of the Mercer County Council on Alcoholism and Drug Addiction, mem-ber of the Trenton YMCA Foundation Board, member of the Cadwalader Park Master PlanAdvisory Board, member of the New Jersey Council of Academic Advisors, and member ofthe New Jersey African American Political Alliance.
John Weingart – Advisory Committee Member, is the associate director of the EagletonInstitute since February 2000. Previously, he served in New Jersey state government for 24years during the administrations of two democratic and two republican governors (GovernorByrne through Governor Whitman). His posts included assistant commissioner of the NewJersey Department of Environmental Protection, director of the Department ofEnvironmental Protection’s Division of Coastal Resources, and executive director of thestate’s Low-Level Radioactive Waste Disposal Facility Siting Board. Mr. Weingart’s book basedon the latter experience, Waste is a Terrible Thing to Mind: Risk, Radiation, and Distrust ofGovernment, was published in March 2001 by the Center for Analysis of Public Issues.
Genikwa Williams – Project Research Assistant, is a former print journalist and lifelong NewJersey resident. Since coming to Rutgers University, Ms. Williams has participated in graduatefellowship programs at both the Eagleton Institute of Politics (September 2000 to May 2001)and Johnson & Johnson, where she is one of three fellows in the corporate communicationsdepartment. Additionally, she received the prestigious Ralph Bunche Fellowship award tostudy at the university and was one of a dozen students chosen to represent the university ata regional student-leadership conference held in February 2002 in Delaware. She received herB.A. in English from the University of Delaware and is currently pursuing an M.A. in com-munications at Rutgers, The State University of New Jersey.
Yonghong Wu – Financial Management Research Associate, is a doctoral student in publicadministration with The Maxwell School at Syracuse University. He worked as an administra-tor at Tsinghua University before pursuing doctoral studies in public administration in theUnited States. Mr. Wu’s current research interests include budgeting and finance issues indeveloping countries, international diffusion of health policy, and technology spillover issueswithin the context of globalization. He received a B.A. in physics and an M.A. in educationfrom Tsinghua University in the People’s Republic of China.
188 THE NEW JERSEY INITIATIVE: Building Management Capacity in New Jersey Municipalities
Bibliography
Ammons, David N. 1995. Performance measurement in local government. In Accountability forPerformance: Measurement and Monitoring in Local Government, edited by David N. Ammons.Washington D.C.: International City/County Management Association.
Ammons, David N. 2001. Municipal benchmarks: Assessing local performance and establishing commu-nity standards. 2nd ed. Thousand Oaks, CA: Sage Publications, Inc.
Aristigueta, Maria Pilar. 1999. Managing for results in state government. Westport, CT: Quorum Books.
Aronson, J. Richard, and Eli Schwartz, ed . 1996. Management policies in local government finance.Washington, D.C.: International City/County Management Association, 1996.
Bahl, Roy, and Johannes Linn. 1992. Urban public finance in developing countries. World Bank andOxford University Press: Washington, D.C.
Barrett, Katherine, and Richard Greene. 2000. Grading the cities: An urban report card. Governing13(5) February, 22-91.
Barrett, Katherine, and Richard Greene. 2001. Grading the states 2001: A report card on govern-ment performance. Governing 14(5) February, 20-108.
Barrett, Katherine, Richard Greene, and Michele Mariani. 2002. Grading the counties: A manage-ment report card. Governing 15(5) February, 21-89.
Bartle, John R., and Ronnie LaCourse Korosec. 2001. Procurement and contracting in state govern-ment, 2000. Working paper, Alan K. Campbell Public Affairs Institute, The Maxwell School atSyracuse University, Syracuse, NY.
Benecke, Robert. 2001. Municipal finance administration in New Jersey. Center for GovernmentServices: Rutgers, the State University of New Jersey.
Bennett, Nathan, David J. Ketchen, Jr., and Elyssa Blanton Schultz. 1998. An examination of factorsassociated with the integration of human resource management and strategic decision-making.Human Resource Management 37(1): 3-16.
Blackwell, John. n.d. 1911: Trenton Makes History. Available at: http://capitalcentury.com/1911.htmlAccessed April 2002.
Bozeman, B., and S.I. Bretschneider. 1986. Public management information systems: theory andprescription. Public Administration Review 46: 475-487.
Brahms, William. 1998. Franklin Township, Somerset County, NJ: A history. Somerset, NJ: FranklinTownship Public Library.
Brick Township. 2001. Brick Township: 2000-2001 Annual Report.
Brick Township. n.d. Doing Business with Brick. Brochure.
Brown, Michelle. 2001. Merit pay preferences among public sector employees. Human ResourceManagement Journal 11(4): 38-54.
Bibliography 189
Bunch, Beverly S. 1996. Current practices and issues in capital budgeting and reporting. PublicBudgeting and Finance 16(2): 7-25.
Calia, Roland. 2001. Are all public spending programs equal? Priority setting approaches for gov-ernmental budgeting. Government Finance Review 17(4): 18-23.
Carrell, Michael B., and Christina Heavrin. 2001. Labor relations and collective bargaining. UpperSaddle River, NJ: Prentice Hall.
Caudle, Sharon, Donald Marchand, S.I. Bretschneider, P. Fletcher, and K. Thurmaier. 1989.Managing information resources: New directions in state government: A national study of state govern-ment information resources. Syracuse, NY: School of Information Studies, Syracuse University.
Center for Government Services of Rutgers University. 2000. New Jersey legislative district data book2000. Municipal Analysis Services, Inc.
Center for Government Services of Rutgers University. 2001. New Jersey legislative district data book2001. Municipal Analysis Services, Inc.
Chapman, Jeffrey. 1999. Local government, fiscal autonomy and fiscal stress: The case ofCalifornia. Working Paper, Lincoln Institute and Land Policy.
Cheslow, Jerry. 2000. Fast growing, but with a rural ambience. The New York Times, 20 February.
Choate, Pat, and Susan Walters. 1981. America in ruins: Beyond the public works porkbarrel.Washington, D.C.: Council of State Planning Agencies.
Civil Service State of Washington. Revised code of Washington. Available at:www.leg.wa.gov/wsladm/rcw.cfm Accessed March 2002.
Clark, Douglas. 1997. Assessing provincial revenues-raising capacity for transfer. In AhmadEhtisham, Financing decentralized expenditures. An international comparison grant. Studies in FiscalFederalism and State-Local Finance.
Coe, Charles. 1999. Local government benchmarking: Lessons from two major multigovernmentefforts. Public Administration Review 59(1): 110-130.
Costello, Bethany. 2001. Brownfields program champion urges national policy. Providence JournalCompany.
Díaz, Daniel, and Gary Paul Green. 2001. Fiscal stress and growth management effort inWisconsin cities, villages and towns. State and Local Government Review 33(2): 7-22.
Dornan, Daniel L. 2000. GASB 34’s impacts on infrastructure management, financing and report-ing. Monograph. Infrastructure Management Group, Inc.
Ebdon, Carol. Forthcoming. Citizen participation in the budget process: Exit, voice, and loyalty. InThe Encyclopedia of Public Administration and Public Policy. New York, New York: Marcel Dekker, Inc.
Einreinhofer, Nancy. 1999. Forward. In Eclective selections: Art in Paterson at the end of the TwentiethCentury. Booklet published by the Paterson Museum.
Elizabeth City. 2000. Elizabeth, New Jersey: An economic profile. Report
Erickson, Jon, and Thomas Regan. 2000. Fiscal stress in New Jersey municipalities. Paper presentedto the New Jersey Public Policy Institute Conference on The Role of City-Suburban Coalitions andRace in Urban Revitalization and Long-Run Economic Growth in New Jersey, 2 June at the EdwardJ. Bloustein School of Planning and Public Policy, New Brunswick, New Jersey.
190 THE NEW JERSEY INITIATIVE: Building Management Capacity in New Jersey Municipalities
Fisher, Ronald. 1996. State and local public finance. 2nd. Ed. Irwin: Chicago.
Fletcher, Patricia, S.I. Bretschneider, Donald Marchand, A. Rosenbaum, and John Bertot. 1992.Managing information technology: Transforming county government in the 1990s. Syracuse, NY: Schoolof Information Studies, Syracuse University.
Forsythe, Dall. 1993. State and local budget and the business cycle. Paper presented at theAssociation of Budgeting and Financial Management, 15 Oct.
Fountain, James. 1996. Presentation to the Government Finance Officers Association of theUnited States and Canada Conference. Published in Joni L. Leithe, 1996. Managing for results:Advancing the art of performance measurement. Government Finance Review 12(3): 40-43.
Franklin News Record. 1970. Conservation commission created. 19 March.
Franklin Township. 1999. Master Plan: Franklin Township.
Frost, Mike. 2002. “Big three” converge as technology evolves. HR Magazine 47: 73-76.
Georgia State University. College of Business Administration. Policy Research Center. 1996. Localgovernment fiscal viability. Available at: http://www.dca.state.ga.us/commind/effort.pdf AccessedMarch 2002.
Golden, K., and V. Ramanuham. 1985. Between a dream and a nightmare: On the integration ofthe human resource management function and the strategic business planning process. HumanResource Management 24: 429-451.
Government Finance Officer Association. 2000. Recommended Practices for State and LocalGovernments.
Government Performance Project. 2002. The Government Performance Project. Available at:http://www.maxwell.syr.edu/gpp/ Accessed March 2002.
Governmental Accounting Standards Board (GASB). 2001. Performance measurement at the stateand local levels: A summary of survey results. Available at:http://accounting.rutgers.edu/raw/seagov/pmg/seasurveypg.html Accessed December 2001.
Halachmi, Arie, and Alex Sekwat. 1997. Strategic capital budgeting and planning: prospects at thecounty level. Public Budgeting and Financial Management 8(4): 578-596.
Hatry, Harry P. 1999. Performance measurement: getting results. Washington D.C.: The UrbanInstitute Press.
Haydon, Tom. 2000. Township tries anew to guard its land. Star Ledger, 2 April.
Heintze, Theresa, and Stuart Bretschnider. 2000. Information technology and restructuring inpublic organizations: does adoption of information technology affect organizational structures,communications, and decision making? Journal of Public Administration Research and Theory10(4): 801-830.
Ingraham, Patricia W., and Amy Kneedler Donahue. 2000. Dissecting the black box revisited:Characterizing government management capacity. In Government and Performance: NewPerspectives, edited by Carolyn J. Heinrich and Laurence E. Lynn, Jr. Washington D.C.:Georgetown University Press.
Ingraham, Patricia W., Sally C. Selden, and Donald P. Moynihan. 2000. People and performance:Challenges for the future public service – the report from the Wye River conference. PublicAdministration Review 60:1:54-60.
Bibliography 191
Ingraham, Patricia W., and Donald P. Moynihan. 2001. Beyond measurement: Managing forresults in state government. In Quicker, Better, Cheaper?: Managing Performance in AmericanGovernment, edited by Dall W. Forsythe. Albany: The Rockefeller Institute Press.
Irvington Township. 2001. Irvington Master Plan.
Kamensky, John M., and Mark A. Abramson. 2001. Managing for results: Cutting-edge challengesfacing government leaders in 2002. In Managing for Results 2002, edited by Mark A. Abramson andJohn M. Kamensky. Lanham, MD: Rowman & Littlefield Publishers, Inc.
Key to the City. n.d. Welcome to Key to the City’s page for Trenton. Available at:http://www.pe.net/~rksnow/njcountytrenton.htm Accessed April 2002.
Kohut, Andrew. 1998. Deconstructing distrust: How Americans view government. Washington D.C.:Pew Research Center for the People and the Press.
Kraemer, Kenneth, and Jason Dedrick. 1997. Computing in organizations. The Journal of PublicAdministration Research and Theory 7(1): 89-112.
Kravchuk, Robert S., and William R. Voorhees, eds. 2001. Governmental Accounting StandardsBoard (GASB) Statement No. 34 Symposium. Public Budgeting and Finance 21(3): 1-87.
Ladd, Helen F. 1992. Population growth, density and the costs of providing public services. UrbanStudies 29(2): 273-295.
Ladd, Helen, and John Yinger. 1989. America’s ailing cities: Fiscal health and the design of urban policy. Baltimore: Johns Hopkins University Press.
Liner, Blaine, Harry P. Hatry, Elisa Vinson, Ryan Allen, Pat Dusenbury, Scott Bryant, and Ron Snell.2001. Making results-based state government work. Washington, D.C.: The Urban Institute.
MacManus, Susan A. 1996. Democratizing the capital budget planning and project selectionprocess at the local level: assets and liabilities. Public Budgeting and Financial Management 8(3):406-427.
March, James G., and Herbert Simon. 1958. Organizations. New York: John Wiley and Son.
Martocchio, Joseph. 2001. Strategic compensation. Upper Saddle River, NJ: Prentice Hall.
Mastriani, James W. 1998. PERC after 30 years. State of New Jersey: Public Employment RelationsCommission.
Melkers, Julia E., and Katherine G. Willoughby. 1998a. The state of the states: Performance-basedbudgeting requirements in 47 out of 50. Public Administration Review 61(1): 66-73.
Melkers, Julia E., and Katherine G. Willoughby. 1998b. Performance based budgeting requirements instate governments. Available at: http://frp.aysps.gsu.edu/frp/ frpreports/brief_reports/brief5.pdfAccessed January 2002.
Melkers, Julia E., and Katherine G. Willoughby. 2001. Performance budgeting in the states. InQuicker, Better, Cheaper?: Managing Performance in American Government, edited by Dall W. Forsythe.Albany: The Rockefeller Institute Press.
Mello, Jeffrey A. 2000. The dual loyalty dilemma for HR managers under Title VII compliance.SAM Advanced Management Journal Winter 2000: 10-15.
Mikesell, John. 1999. Fiscal administration, analysis and applications for the public sector. 5th ed. FortWorth, Texas: Harcourt Brace.
192 THE NEW JERSEY INITIATIVE: Building Management Capacity in New Jersey Municipalities
Millar, Annie. 1988. Selecting capital investment projects for local governments. Public Budgetingand Finance 8 (3): 63-77.
Mintzberg, Harold. 1989. Mintzberg on management: Inside our strange world of organizations. NewYork: The Free Press.
Moore, Adrian T., James Nolan, Geoffrey F. Segal, and Matthew Taylor. 2001. Competitive cities: Areport card on efficiency in service delivery in America’s largest cities. Report for the Reason PublicPolicy Institute.
Moynihan, Donald P., 2001. The state of the states in MFR. Working paper, Alan K. CampbellPublic Affairs Institute, The Maxwell School at Syracuse University, Syracuse, NY.
Moynihan, Donald P. and Patricia W. Ingraham. 2001. When does performance information contribute to performance information use?: Putting the factors into place. Working paper, AlanK. Campbell Public Affairs Institute, The Maxwell School at Syracuse University, Syracuse, NY.
Municipal Analysis Services, Inc. 2001. Governments of New Jersey. Austin, TX: Municipal AnalysisServices, Inc.
National Advisory Council on State and Local Budgeting (NACSLB). 1998. Recommended practices.Available at: www.gfoa.org Accessed February 2002.
Nathan, Richard P. 2001. Introduction. In Quicker, Better, Cheaper?: Managing Performance inAmerican Government, edited by Dall W. Forsythe. Albany: The Rockefeller Institute Press.
New Jersey Division of Taxation. Annual reports (2001-1996). Available at:http://www.state.nj.us/treasury/taxation Accessed April 2002.
New Jersey Future. 2001a. Redevelopment. Available at: http://njfuture.org/HTMLSrc/
FactsAndIssues_20010430.html Accessed April 2002.
New Jersey Future. 2001b. Where we are. Available at: http://www.njfuture.org/HTMLSrc/prosperi-ty_whereweare.html Accessed April 2002.
New Jersey Office of State Planning. 1997. The 1996 New Jersey municipal distress index. DocumentNo. 122.
Osborne, David, and Ted Gaebler. 1995. The art of performance measurement. In Accountability forPerformance: Measurement and Monitoring in Local Government, edited by David N. Ammons.Washington D.C.: International City/County Management Association.
Pagano, Michael A. 1984. Notes on capital budgeting. Public Budgeting and Finance 4(3): 31-40.
Paterson City. 1998. A blueprint for change: A report to the citizens of Paterson. Report.
Pfeffer, Jeffrey. 1997. Pitfalls on the road to measurement: The dangerous liaison of humanresources with the ideas of accounting and finance. Human Resource Management 36(3): 357-365.
Poister, Theodore H. 1995. Productivity monitoring: Systems, indicators, and analysis. InAccountability for Performance: Measurement and Monitoring in Local Government, edited by David N.Ammons. Washington D.C.: International City/County Management Association. First publishedin Public Productivity Handbook, edited by Marc Holzer (New York: Marcel Dekker, 1992).
Poister, Theodore H., and Gregory Streib. 1999. Performance measurement in municipal govern-ment: Assessing the state of the practice. Public Administration Review 59(4): 325-335.
Bibliography 193
Przeworski, Adam. 1999. On the design of the state: A principal-agent perspective. In Reformingthe State, edited by Luiz Carlos Bresser Pereira and Peter Spink. Boulder: Lynne Rienner Publishers.
Reda, Domenick S. 2002. Township tries to close hole in budget. The Irvington Herald, 7 March.
Reed, B.J., and John W. Swain. 1997. Public finance administration. Thousand Oaks, CA: SagePublications, Inc.
Roberts, Gary. 2001. New Jersey local government benefits survey. Review of Public PersonnelAdministration 21(4): 284-307.
Rosen, Ellen Doree. 1995. Measuring productivity. In Accountability for Performance: Measurementand Monitoring in Local Government, edited by David N. Ammons. Washington D.C.: InternationalCity/County Management Association. First published in Ellen Doree Rosen, Improving PublicSector Productivity (Thousand Oaks, CA: Sage Publications, Inc., 1993).
Rubin, Irene S. 1982. Running in the red. The political dynamics of urban fiscal stress. Albany: StateUniversity of New York Press.
Sahr, Robert. 2002. Inflation conversion factors for years 1700 to estimated 2012. Available athttp://www.cjr.org/resources/inflater.pdf Accessed April 2002.
Salmore, Barbara G., and Stephen A. Salmore. 1993. New Jersey politics and government. Lincoln:University of Nebraska Press.
Savas, E. S. 1987. Privatization: The key to better government. Chatham: Chatham House Publishers, Inc.
Scarcia, Cos. 2001. Paterson. New Jersey Business 47(3): 26.
Selden, Sally Coleman. 2001. Trends in human resource management: Lesson from the states,2001. Working paper, Alan K. Campbell Public Affairs Institute, The Maxwell School at SyracuseUniversity, Syracuse, NY.
Selden, Sally Coleman, and Donald P. Moynihan. 2000. A model of voluntary turnover in stategovernment. Review of Public Personnel Administration 20(2): 63-74.
Selden, Sally Coleman, Patricia Wallace Ingraham, and Willow Jacobson. 2001. Human resourcepractices in state governments: Findings from a national survey. Public Administration Review61(5): 598-607.
Shriner, Charles A. 1919. Four chapters of Paterson history. Paterson, NJ: Lont & Overkamp Pub. Co.
Siegel, Alan A. n.d. A brief history of Irvington, New Jersey. Available at:http://www.irvington.net/historymain.html Accessed April 2002.
Sines, John H.1929. Industries and trades. Chapter 10 of A history of Trenton 1679 – 1929: Twohundred fifty years of a notable town with links in four centuries. 2 vols, edited by The TrentonHistorical Society. Princeton: Princeton University Press.
State of New Jersey Department of Personnel (NJDOP). 2000. State workforce profile 2001. State ofNew Jersey: NJDOP.
State of New Jersey, New Jersey Administrative Code, Title 4A. Department of Personnel, Supp. 1-3-00.
Theurer, Jim. 1998. Seven pitfalls to avoid when establishing performance measures. PublicManagement 80(7): 21-25.
194 THE NEW JERSEY INITIATIVE: Building Management Capacity in New Jersey Municipalities
Thomas, Virginia. 2001. Restoring government integrity through performance, results, andaccountability. In Quicker, Better, Cheaper?: Managing Performance in American Government, edited byDall W. Forsythe. Albany: The Rockefeller Institute Press.
Tracy, Richard C. 1995. Performance auditing: Catalyst for change. In Accountability forPerformance: Measurement and Monitoring in Local Government, edited by David N. Ammons.Washington D.C.: International City/County Management Association.
Trenton Online. n.d. History. Available at: http://www.trentonnj.com/history/index.html AccessedApril 2002.
Trenton City. 2001. Business & economic profile. Report.
Trenton City. n.d. Policing 2000: A plan of excellence for the Trenton police department. Report.
Ulrich, Dave. 1997a. Human resource champions. Cambridge, MA: Harvard Business School Press.
Ulrich, Dave. 1997b. Measuring human resources: An overview of practice and a prescription forresults. Human Resource Management 36(3): 303-320.
U.S. Advisory Commission on Intergovernmental Relations (ACIR). 1962. Measures of state andlocal fiscal capacity and tax effort. Staff Report M-16, Washington D.C.: ACIR.
U.S. Advisory Commission on Intergovernmental Relations (ACIR). 1986. State fiscal capacity andeffort. Information Report M-165, Washington D.C.: ACIR.
U.S. Advisory Commission on Intergovernmental Relations (ACIR). 1988. State fiscal capacity andeffort. Information Report M-170, Washington D.C.: ACIR.
U.S. Bureau of Census. n.d. 1990. Census database. Available at www.census.gov Accessed April 2002.
U.S. Bureau of Census. 2000. Census database. Available at www.census.gov Accessed April 2002.
U.S. Bureau of Census. State and county quick facts: New Jersey. Available at http://quickfacts.cen-sus.gov/qfd/states/34000.html Accessed April 2002.
U.S. General Accounting Office. 1997. Privatization: Lessons learned by state and local governments.GAO/GDD-97-48.
U.S. General Accounting Office. 1998. Executive guide: Leading practices in capital decision-making.GAO/AIMD-99-32.
U.S. General Accounting Office. 1999. Managing for results: Opportunities for continued improvementsin agencies’ performance plans. GAO/GGD/AIMD-99-215.
U.S. General Accounting Office. 2001. Human capital: Taking steps to meet current and emerginghuman capital challenges. GAO-01-965T.
U.S. General Accounting Office. 2002. Strategic human capital maturity model. GAO-020373SP.Washington, DC: March 15, 2002.
U.S. House of Representatives. 1999. Subcommittee on Regulatory Reform and PaperworkReduction of the Committee on Small Business. Examining barriers and solutions to economic develop-ment. Hearing before the House of Representatives, 106th Congress, First Session, Washington,D.C., 22 November, Serial No. 106-72, U.S. Government Printing Office.
U.S. Office of Personnel Management. 2000. Labor management partnership: A report to the President.

Bibliography 195
Walters, Jonathan. 1997. Pain and Performance. Governing 10(9) June, 26-31.
West, Darrel. 2001. Urban e-government: an assessment of city government websites. Available at:http://www.insidepolitics.org/egovt01city.html Accessed September 2001.
The Winter Commission. 1993. The National Commission on the State and Local Public Service.Hard truths/tough choices: An agenda for state and local reform. Albany, New York: The Nelson A.Rockefeller Institute of Government.
Wolfe, Albert J. 1994. The Faulkner Act: New Jersey’s Optional Municipal Charter Law. Workingpaper, Bureau of Municipal Information, New Jersey League of Municipalities, Trenton, New Jersey.
Yeung, Arthur. 1997. Introduction: Measuring human resource effectiveness and impact. HumanResource Management 36(3): 299-301.

196 THE NEW JERSEY INITIATIVE: Building Management Capacity in New Jersey Municipalities