Embed Size (px)
Citation preview
t
r li
OPTIMIZA TION STUDIES ON CHITIN EXTRACTION FROM
CRUSTACEAN SOUD WASTES
by
Antonia Yarbeh Tetteh
A thesis submitted to the Faculty of Graduate studies and Research in partial
fulfilment of the requirements for the degree of Master of Science
Department of Food Science and Agricultural Chemistry,
McGilI Univer~ity, MontriaI, Québec
August, 1991
(
(
(
" ... Mathematical facts worthy of being studied are those which reveal unsuspected
relations between other facts, long since known, but wrongly believed to be
unrelated to each other."
· .~
ABSTRACT
Chitin, a polymer of N-acetyl-D-glucosamine b now heing llsed in the
food industry as inexpensive polysacchél ride. The research pursued relates to the
establishment of interrelationship between various factor~ affccting chitin
extraction, and combination of optimum leveb of factors reqllired 10 maximize
the yield of chitin extraction. Optimization of chitin extraction was carried out
using crab, lobster, and shrimp solid waste~. The study wa~ dlvloed into two
stages: (a) optimization of chitin extractability with respect to partidc ~ize (h)
optimization of demineralization and deproteinization stage~ in lob~ter chitin
extraction using Response Surface Methodology. Particle ~ize had a ~ignificant
effeet on cr ab and lobster chitin extractability; a partide size of 2.0mm gave the
highest yield in chitin extraction. The mean yield of chi tin trom crah and loh~ter
at particle size of 2.0mm were 28.8% and 23.2%, respectively. Shrirnp chitin
extractability was not affecterl by particle size with the mean yicld heing 25.2%.
Response Surface Methodology was used to determine simuItanenus effects of
(a) concentration of extractant (b) shell:extractant ratio (c) tempe rature of
extraction and (d) time of extraction on deproteinization and demineralization
stages of chitin extraction and hence yield of chitin. A central composite
rotatable design was applied to the four variables. Ali variable~ had an effeet on
demineralization and deproteinization yields. A model eomprising a
combination of concentration of NaOH, shell:extractant ratio, temperature and
time of extraction at levels of 1.75%, 1:6 - 1:7(wjv), 550 C, and 5 1/2 h
respectively, produced a maximum yicld of deproteinization. Maximum
demineralization was also predictable by a muIti-factor model con~isting of a
combination of concentration of HCI, shell:extractant ratio, temperature and
time of extraction at levels of 2.25N, 1:5 • 1:6 (wjv), 29°C, and 5 1/2 h
respectively. The physicochemical parameters, viscosity, mo)ecu)ar weight, and
i
Il'
I~
-------------------------------------------
water holding eapacity of the nltimate chitin and ehitosan products were
measured as a means of determining their applicability in foods. Viscosity,
moleeular size and water holding capacity were respectively, 17.1ep, 1.31 x 10⁶
daltons, and 404 - 415% (wjw) for chitin; 1.54ep, 4.17 x 10⁴ daltons, and 501.6-
504.9% (w jw) for chitosan.
ii
, I\'-
RESUME
La chitine, un polyrr1he de N-ac~thyl-D-glucose amine, e~t actuellement
utilisé'e dans l'industrie alimentaire comme polysacc!mrid t ' peu on~reuse. L~I /
recherche menee relate les interconcetions entre les different~ factuer~ affectant
l'extractions de la chitine et la comhinai~on de l'optimisation~ de~ factl\cr~ re4ui~ ~ 1
pour maximiser l'extraction d" la chitllle. L'extraction~ de la chitine a elc
optimis~e avec des d'echets solides de crahes, h()mard~, ct crcvcttc~ . Cette
ltude est divise'e en deux parties: (a) optimisation du rendemeIlî d'cxtracti()n~ de
la chitine en fonction de la taille des particule!l. (h) optimisation~ dc~ ftat~ de
d!min~ralisatiolJ et de deprotlinisation de la chitine extracte du homard grSce a
l'~tude de R~ponses de Surface. La taille des particule~ a lin effet ~ignificatif Mir
extractabilid' de la chitine de crahe et de homard. une taille de particule de
2.0mm donnant le plus haut rendement d'extraction de la chitine. Le plu~ haml
rendement d'extraction de chitine de crahe et de homard. avec des particlllc~ de
cette taille, respectivement de 2K8% et 23.2%. L'extractahilit/ de la chitinc de
crevette n'est pas affectle par la taille de!l particules, son rendement maximum 1 1
est de 25.2%. La methode des Reponses de Surface permet une etude
simultanle des effets de (a) la concentration en extractant, (h) du rapport
coquille: extractant (c) des templratures d'extraction ct (d) du tcmp~
d'extraction, sur les etats de deprotiinisations et de dé'min~rali!lati()n!l de la
chitine ainsi que sur l'augmentation du rendement de chitine. Un plan central a
composentes rotatives fut applique' aux quatre paramètre~. Tou~ le~ paramètre~ ont un effet sur le rendement de la d:mine'ralisation et la deprot~ini~ati{)ns. Le
maximum de rendement de deprot~inbati{)n est obtenu avec un modèle tel que
les " parametres concentrations en NaOH, rapport coquille:extractant,
tempe'rature et temps d'extraction ont respectivement le!l valeur!l de 1.75%, 1:6 -
1:7 (plv). 55°C, et 5 h 1/2. Le maximUITl de de'min(rali~ation~ fait tgalcment
iii
(
(
. ,
.,f ., ~
dltermine par un mod~le multifacteur comprenant les parametr~s concentration
en HCI, rapport coquille:extractant, temperature et temps d'extraction avec des , 1
valeurs respectives de: 2.25N, 1:5 - 1:6 (plv), 290 C et 5 h 1/2. Les proprietes
physico-chimiques telles que la viscosit/, le poids mole~ulaire, et la capacite' a la
retention d'eau des ultimes chitine et chitosane ont ~t~ détérmin: dans le but de
l'application de ees produits dans le domaine alimentaire. Les valeurs obtenues
pour la chitine sont: viscosite' 17.1cp, poids molfculaire 1.03 x 10⁶ daltons, et
capacite a la retentions d'eau de 404 - 415% (p/p), pour le chitosane les valeurs
respectives de ees difftrents param~tres sont: 1.5cp, 4.17 x 10⁴ daltons et 501.6 -
504.9% (p/p).
iv
...
----------------------.............. ACKNOWLEDGEMENTS
1 would like to thank the Almighty God. for the guidance. protection and
numerous bll~ssings he gave me throughout the course of thi!o. work. With Him.
this work bf~came a possibility.
1 \\,')uld like 10 thank my supervisors, Dr. B.K. Simpson and Dr. J.P. Smith
for all the help they gave me 10 make this work possihle. Their support wa~ very
mu ch appreciated.
My sincere thanks go to the Head of Department (Ag.). Dr. Intcal Alli
for providing facilities during the course of thb work. Hb constant ~upport and
encouragement V/as appreciated.
1 would like to thank the Canadian International Development Agcncy
(CIDA) for providing financial support.
1 thank the University of Science and Technology. Kumasi. Ghana. the
Head of Biochemistry Department. Dr. J.H. Oldham. and other Maff memher~
for their participati0n in the program. Special mention i~ made of Dr. E.K.
Marfo for the moral support and constant encouragement he offercd me during
the course of tbis work.
To Mr Eby Noroozi and Mr Abdelnaby Khalyfa. 1 say thank you for the
technical help you offered.
1 wou Id like to thank Dr Thaddeus Varney for having the patience to
proof read this work.
1 would Iike to thank Mr Melvin Munsaka of Mathematic~ and Statistic~
Department, McGill University, for his invaluable a!l!listance towards my
research work.
My thanks also go to my colleagues of the Department of Food Science
and Agricultural Chemistry, who helped in various way!ol. Special mention i!ol
v
(
, ,f
,(
, t
(
-- ------------------------------.,
extended 10 Mr Alexis Hughes-Despointe!! for his assistance, and Veronique
Barthet for translating the ab~tp.lct into Fre.lch.
1 would like to thank MI William Ellis and Mr Emmanuel Akochi-Koble
who helped in various ways.
1 would like to thank my family very much for their support and
encouragement.
Above ail, my sincere thanks go ta my dear husband, Paa Kow Tetteh,
and my son, Kweku Bedu Tetteh, who were very support ive and helped in ail
ways to make this work possible. Their inestimable encouragement will always
be remembered.
vi
'-,f-
Abstract
Resume
Acknowledgements
Table of contents
List of Tables.
List of figure~ .
APPENDIX
CHAPTER 1
INTRODUcnON .
CHAPTER2
LITERA TURE REVIEW.
2.0 Introduction.
Tahle of contents
2.1 Production of chitin and chitosan
2.2 Properties of chitin and chitosan
2.3 Applications of chitinous polymers in the food industry
2.4 Preparation of chitin and chitosan .
2.5 Response Surface Methodology
2.6 Safety of chitinous polymers in food
2.7 Limitations
CHAPTER3
MATERIA.LS AND METHODS.
3.1 Source and handling of wastes
3.2 Isolation of chitin
3.3 Chitin extractability with respect to particle size
vii
Page
llJ
v
vii
IX
Xl
4
4
7
13
IH
23
34
41
42
43
43
43
44
~ 3.4 Hydroehloric acid demineralization of lobster shells 44 ;,.
3.5 Sodium hydroxide deproteinization of lobster shells 45
3.6 Decoloration of crude chitin 45
3.7 Central eomp0!:lite rotatable design for optimization studies 46
3.8 Nitrogen determination 46
3.9 A'ih determination 49
3.lO Viscos;ty and molecular weight determination :9
3.11 Water holding capacity determination 50
3.12 Statistical Analysis 51
CHAPTER FOUR .~
RESULTS AND DISCUSSION
4.1 Extractability of ehitin with respect to particle size 52
( 4.2 Opti mization of deproteinization 55
4.3 Optimization of demin(ralization 63
4.4 Effeet of demineralization with HCl on ehitin 84
4.5 Effeet of deproteinization with NaOH on ehitin 85
4.6 Characterization of chitin and chitosan 85
CHAPTER5
CONCLUSION 97
REFERENCES 102
If
viii
List of Tables
Table
1. Chitin content of sorne selected fungi
2. Examples of chitosan application in biomass recovery from food process
Page
10
wastes. 20
3. Effect of demineralization conditions on the visco~ity of
chitosan solutions. 27
4. Demineralization conditions used by various authors . 28
5. Deproteinization conditions used by various authors . 30
6. Coded level combmation for a four variahle Central compo~ite rotatahle
design to optimize the yield of demineralization and deprotdnization 3R
7. Factors and values of the coded levels used in the Centra;
composite rotatable design to optimize demineralization step in
chitin extraction 47
8. Factors and values of the coded levels used in the Central
composite rotatable design to optlmize demineralization ~tep in
chitin extraction . 48
9. Uncoded level combination for a four vari?ble Central
Composite Rotatable Design to optimize deproteinization in chitin
extraction . 55
10. Coded level combination for a four variable Central
Composite Rotatable Design to optimize deproteinization in chitin
extraction . 56
11. Analysis of least squares estimates of second order polynomial model
parameters for deproteinization 57
12. Estimated ridge of maximum response for the various factors used in
ix
• I~
deproteinization . 64
13. U ncoded level combination for a four variable Central Composite
Rotatable Design to optimize demineralization in chi tin
extraction
14. Coded level combinat ion for a four variable Central Composite
Rotatable Design to optimize demineralization in chitin
extraction
15. Analysis of least squares estimates of second order polynomial model
69
70
parameters for demineralization 72
16. Estimated ridge of maximum response for the various factors used in
demineralization 83
17. Viscosity and molecular weight of chitin and chitosan 92
x
List of figures
, li' Fig. Page
1. A generalized scheme of chi tin recovery 25
2. Response surface graph showing a cradle point 39
::\. Re~ponse surface graph showing a cradle point 40
II' 4 Effect of particle size of shell on yield of chitin extraction 53
5. Three dimensional Response Surface graph showing the effect
of concentration of NaOH and shell:extractant ratio with
temperature and time he Id constant at 650 C ane; for 6 h
respectively, on the yield of deproteinization 59
6. Three dimensional Response Surface graph showing the effect < - n"
of concentration of NaOH and temperature with shell:extractant
, ~ ratio and time held constant at 1:15(wjv) and 6 h
respectively, on the yield of deproteinization 60
7. Three dimension al Response Surface graph showing the effect
of tempe rature and time with concentration of NaOH and
J jF shell:extractant ratio he Id constant at 5% and 1:15(w/v)
respectively, on the yield of deproteinization 61
8. Three dimension al Response Surface graph showing the effect
of concentration of NaOH and time, with shell:extractant and
temperature held constant at 1:15~w/v) and for 650 C
respectively, on the yield of deproteinization 62 '). ~ lof"
9. Two dimensional contour plot showing the levels of concentration
< ,\" of NaOH and shell:extractant ratl, , with temperature and time he Id
' ..... constant at 6SoC and 6 h respectively, required to produce a
degree of deproteinization of 6.74% residual total nitrogen
, .1' xi
( constant at 6SoC and 6 h r,~spectively, required to produce a
degree of deproteinization of 6.74% residual total nitrogen
in chitin 65
10. Two dimensional contour plot showing the levels of concentration
of NaOH and temperature with shell:extractant ratio and time held 1 If
constant at 1:15(wjv) and 6 h respectively, required to produce a
degree of deproteinization of 6.74% residual total nitrogen
in chitin 66 ..
11. Two dimensional contour plot showing the levels of temperature
and time with concentration of NaD" and shell:extractant ratio he Id
constant at 5% and 1:15(wjv) respectively. required to produce a
degree of deproteinization of 6.74% re:.idual total nitrogen
( in ('hitin 67
12. Two dimensional contour plot showing the levels of concentration
of NaOH and time with shell:extractant ratio and temperature held
constant at 1:15(wjv) and 65°C respectively, required to produce
• 11' a degree of deproteinization of 6.74% residual total nitrogen
in chitin 68
13. A three dimensional Response Surface graph showing the effect ,\
of concentratiOlI of HCI and shell:extractant ratio with temperature
and time of extraction held constant at 25°C and 4 h
respectively, on yield of demineralization 74
14. A three dimensional Response Surface graph showing the effect
of concentration of HCI and tempe rature with shell:extractant
ratio and time held constant at 1:20(w Iv) and 4 h respectively,
( on yield of demineralization 75
15. A three dimensional Response Surface graph showing the effeet
, 1\'"
xii
< '"
""'"
of tempe rature and time with concentration of Hel and shell:extractant
ratio he Id constant at 2N and l :20( w Iv) respectively,
on yield of demineralization 76
16. A three dimensional Response Surface graph showing the effect
of shell:extractant ratio and time with concentration of HCI
and temperature held constant at 2N and 2SoC ref,pectively,
on yield of demineralization
17. A two dimensional contour plot showing the levels of concentration
of HCI and shell:extractant ratio with temperature and time held
constant at 2SoC and 4 h respectively, required to produce a degree
of demineralization of 0.07% residllal ash content
18. A two dimensional contour plot showing the levels of concentration
of HCI and temperature with shell:extractant ratio and time held
constant at 1:20(w Iv) and 4 h respectively, required to produce a degree
of demineralization of 0.07% residual ash content
19. A two dimensional contour plot showing the levels of temperature
and time with concentration of HCI and shell:extractant ratio held
constant at 2N and 1:20(w Iv) respectively, required to produce a degree
of demineralization of 0.07% residual ash content
20. A two dimensional contour plot showing the levels of sheIl:extractant
ratio and time with concentration of HCI and tempe rature held
constant at 2N and 2SoC respectively, required to produce a degree
of demineralization of 0.07% residual ash content
21. Water binding capacity of chitin and chitosan .
22. Viscosity of lobster chitin against concentration
23. Viscosity ,)f crab chitin against concentration .
24. Viscosity of lobster ~~hitosan against concentration
xiii
77
79
80
81
82
88
90
91
94
(
. ,~
(
, 1\'
• l'
( ...
25. Viscosity of crab chitosan against concentration
26. Molecular weight distribution of chi tin and chitosan .
xiv
95
96
.,.,..
1
CHAPTERI
Introduction
Chitin, a polymer of N~acetyl-D~glucosamine residues, ('urrently obtained
from crustace ans, anG with a moisture content of 5 - 10%, total nitrogen content
of 6.9%, and average molecular weight 1.036 x 10⁶ daltons, has traditionally
been marketed in the form of flakes, powders, beads, gels, etc. It is widely
distributed in nature and its quantitative importance in living being~ is now weil
known (Jeuniaux, et al. 1988). It is found in marine invertehrate!-., insect!-., fungi,
etc. in association with proteins, calcium deposits and pigmenb, where il
performs a protective and supporting role (Muzzarelli, 1977). Considerable
amounts of chitin are present in shellfish like crab, lob!\ter, ~hrimp, prawn,
crawfish and crayfish (from 14 - 35% on a dry weight basis) and constitute a
worldwide growing waste disposai problem of the shellfish industry. The annllal
production of chitin has been estimated at about a hundred billion tons,
however, only 150 thousand tons of it is accessible (Allan et al. 1978). Chitosan,
the N-deacetylated form of chitin forms the body wall of most fungi, mold!-. and
yeasts (Ruiz-Herera, 1978).
Several studies have been carried out to investigate chitin chemi~try,
structure, modification and application and these have shown that, chitinou~
polymers have unusual combination of properties such as high water binding
capacity (Knorr, 1982) and good film-forming properties (Lang and Clau!len,
1988) which make them usefui in the food, cosme tics, pharmaceutical, paint and
textile industries.
Both chitin and chitosan are now being produced in commercial
quantities from crustacean wastes in Japan and to ~~ relatively lesser extent in the
United States (Hirano, 1988; Sanford, 1988). Chitosan is also being produced on
a laboratory scale by fermentation of fungal cells (White et al. 1979; McGahren
2
et al. 1984). Current chi tin and chitosan processing conditions and chemical
deacetylation procedures, cause sorne modifications such as depolyrnerization
and deacetylation of native chitin. For the purpose of preparing chitin of less
modified structure, mild treatments are preferable. Sorne investigators have
attempted to remove protein by enzymatic digestion (Hackman, 1960; Takeda
and Abe, 1962; Takeda and Katsuura, 1964), however, complete removal of
pro teins was not attained. Other investigators have also tried to produce
chitosan by fungal fermentation, involving the enzyme chitin deacetylase (Araki
and Ito, 1975; McGahren et al. 1984), but these have shown inconsistent trends
in degree of deacetylation, with low yields (Knorr and Klein, 1986) as weil as
variations in molecular weight (Arcidiacono et al. 1988), making chemical
methods of extraction of chitin and chitosan more popular among producers
than enzymatic and microbiological methods.
Chemical methods of preparation of chitin used by various authors have
been found to be inconsistent in that, diverse concentration of reagents,
shell:extractant ratio, temperature and time combinations have been employed.
These have given rise ta inconsistent and low yields as weIl as inconsistent trends
in physicochemical properties of the chi tin product so that no two chitin products
have constant yields as weIl as physicochemical properties. In an attempt to
optimize the yield of chi tin during extraction, this investigation was carried out
to assess the effects of concentration of demineralizing and deproteinizing
agents, ratio of shell:extractant volume (w Iv), temperature of extraction. and
time of extraction on chi tin extractability. The influence of concentration of
demineralizing agent, ratio of shell:extractant, and temperature of extraction
have previously been investigated by evaluating the factors either îndividually or
in pairs (MuzzareHi, 1977; No et al. 1989). Unfortunately, examination of several
variables one at a time is time consuming and results in a large number of
, f
3
experiments to be performed as weIl as large number of data to he analyzed. and
it also fails to rneasure interactions amor~g variahles. Response Surface
Methodology (RSM), which is a statistical approach mvolving factorial
experimental designs and multiple regression analysis, was used in this study to
overcorne the limitations of one variable at a time approach and to adequately
de scribe the effeet of severallimiting factors, as weil as their interactions. RSM
permits several factors of interest to be studied simultaneom ly in a single
experimental run. RSM has been applied to studies of canola sauce production
(Ma and Ooraikul, 1986), protein extraction from brewer's spent grain (Diptee l't
al. 1989), bacterial growth (Shroder and Busta, 1973), ca~ein extrusion (van de
Voort and Stanley, 1984), and shelf life extension of English type crumpets
(Smith et al. 1988). Thus in summary, this work was carried out to investigate the
use of RSM in optimization of yield of chitin extraction and the
interrelationships among the various factors affecting chilin during extraction
from crustace an solid wastes. as weil as the a(~vantages of the technique as a
research tool in extraction procedures in food analysis.
f ,
4
CHAPTERl
Literature review
2.0 Introduction
The Shellfish Industry
The rapid perishability of fish and shellfish compared with meat has at aIl
times and places made preservation against putrefaction an urgent necessity. At
a very early age in history, man learned the survival value of storing day-to-day
and seasonal surpluses. In historieal times, various preservation techniques were
evolved, which included drying, salting and smoking of fish and shellfish, in large
quantities in barrels. In ail these methods, the intestines, he ad and shells were
removed and thrown away or disposed of. As a result of the lack of sophisticat~d
equipment to enable handling of large catches of fish an6 shellfish, disposaI of
wastes did not pose any problem. Fresh fish was, however, a luxury (Cutting,
1962). Most people, if they tasted fish at ail, did so only when it was dried, salted
or pickled. The development of nice-houses" and freezers were a step forward in
retaining sorne of the freshness of fish and shellfish but the market for these
products was not satisfactory. Canning was the result of an attempt to preserve
fish satisfactorily without adversely affecting the freshness and palatability by
undue dessication, toughening, and salting. In 1810, when Nicholas Appert
introduced the concept of preservation by canning, fish and lobsters were among
the preserved foods he presented to the French government. Although canning
proved to solve many of the above mentioned problerns, and allowed large scale
fishing to be done conveniently to support a growing world population, it came
along with production of large quantities of processing wast es to be disposed of.
.\-
-
5
2.0.1 Worldwide shellfish catch per capita
The utilization pattern of shellfish is naturally determined by the size of
the catch in relation to the size of the population of each fishing nation. King
crab and shrimp are the major crustace an catche~. The United State~ ha~ the
largest catch of crustace ans in the world (Cutting, 1(62). Shrimp canning planb
in the USA generally process from 9,000 to 18,000 kg of raw shrimp per day. The
largest plants are capable of processing up to 55,000 kg a day. Raw ~hrimp
production in Louisiana al one has increased from approximately 5,000 ton~ at
the turn of the century to over 500,000 tons annually in recent year~ (CRESA.
1971). King crab and Dungeness crab are also harvested to a large extent in the
United States, but the Soviet Union now appears to be the large~t catcher of
King crab. Japan holds the second place in crustacean catching and King (;rah
dominates the canned pack. Polish deep sea fishery ha~ engaged in halve~ting
marine living resources su ch as, the Antartic krill and squid cor.laining chitin
since 1975. Presently there is a production of about 5 tons per day of peeled krill
meat, leaving behind a great deal of shell wastes, from which practical bnlation
of about 150 kg of chi tin is possible (Brzeski, 1(88). Poland abo harvest~
large quantities of squid from a dozen to 100,000 tons per year, and this can be a
source of raw material for production of chitin and chitman. Squid pen contain~
about 40% chi tin, but the feasibility of chi tin and chitosan production from it
depends strictly on the market situation, since the market is more familiar with
crustace an chitin.
Other important shellfisheries are present in India, Malaya, Australia,
South Africa, South America, and Iceland (Cutting, 1962).
Ali the above mentioned countries produce large quantities of wastes per
day and per year. Since the wastes are not biodegradable, disposai becomes a
worldwide problem.
. \
(
6
2.0.2 Waste disposai problem of the shellfish industry
As a result of processing shellfish, large quantities of shells and other
waste mate rials are left over which do not find any use presently. Approximately,
about 75% of the total weight of shellfish is discarded as waste, and in sorne
cases, as in crustacean rneat industries, the waste mate rial can represent an
amount greater than 80% of the landing (Simpson, 1978), from 20 - 30% of the
dry weight of the waste is chitin, depending upon the processing method.
Disposai of shellfish wastes which contains chi tin as a major constituent
represents a significant problem to proceswrs who are limited in their
alternatives by environmental and economic restrictions (Revah-Moiseev and
Carroad, 1981). Current methods of handling shellfish wastes include ocean
dumping, incineration and landfilling (Kreag and Smith, 1975). Simpson (1978)
stated that, disposai operations in the near future will have to meet increasingly
more stringent ecological standards. Problems and regulations governing current
shellfish wastes handling rnethods are briefly discussed below
1. Ocean dumping: this i5 regulated by the Environmental Protection
Agency (EPA). ft is r"ohibited in the United States to throw wastes back inlo
the sea. It is also costly in energy and dollars for the hauling and storage ùf the
wastes.
2. Incineration: it requires a government permit and yields only lime as
by-product (CRESA, 1971).
3. Landfilling: it requires expenditure in land and transportation and it is
prohibited in the United States to store up in collecting plants. The EPA has
recently issued a new penalty policy that it hopes will incrcase cornpliance with
the Resource Conservation and Recovery Act. The report says that, '1andfil/ing
violations may go up as Itiglt as $25,000 per day" (Hanson, 1990)
-
7
Shellfish processors are therdore faced with the choice of disposing of
their wastes at high costs in order to conform to the evnironmental regulation!>
and standards, or else convert the wastes into valuahle produet!>.
2.0.3 Classical ways of alleviating the wa~'ite disposai
problem of the shelltish industry
Shellfish waste j, disposed of by:
1. Production of fishmeal: this is done by drying and rnilling the !lolid wa!lte!l and
using them to prepare feed~ for cattle. swint' and poultry (Klcag and Smith,
1975; Mendelhall 1971);
2. Production of chitin and chitosan from crustacean wa!ltes (Muzzarelli. 1977);
3. Bioeonversion of chitin wastes into single cell protein for animal feed amI
aquaculture feed (Revah-Moiseev and Carroad, 1981).
2.1 Production of chitin and chitosan from cruslacean
wastes
2.1.1 Occqrence of chitin and chitosan
Chitinous structures ar..:: widely distributed in nature. They are produeed
by invertebrate!l in freshwater environrnent (arthropod~, bryozoan!l and
zooplanktons in eutrophie stagnant waters) and by zooplankton!\ of the marine
environment, which are mainly the holoplanktonic eru!ltacean!l (copepo<,b,
cladocera, mysidaeeae and euphausiaceae). Another group of chitin producer!l
are certain marine benthic and pelagie species. In this group m()~t of the chitin
biomass is due mainly 10 crustacean~, while the hydrozoan~ and the bryozoan!l
contribute to a lesser extent. Sorne terrestrial animais abo pO~!les!\ chitinous
(
8
integuments (insects and crustaceans). Fungi, molds and yeasts also possess
chitinous cell walls (Ruiz-Herrera, 1978). Chi tin and chitosan are also present in
sediments of these water bodies.
In the freshwater environment, sorne unicellular organiSl"lS such as
diatoms, chrysoflagellates, and protozoa, especially ciliates possess chitin. In the
invertebrates it is present in the anthozoans and scyphozoans belonging to the
coelentrates and echinoderms (Jeuniaux, 1971; 1982). In this freshwater
environment, arthropods are the main chi tin producers, with a chitin production
of 51 g.m -2.yr-1, and this fluctuates with seasonal changes (Yamamoto and Seki,
1979).
In the marine environment, the c1adocerans have been reported to have a
chitin content of 12.22% on dry weight basis. A group of cladocerans, namely
daphnia has been reported to have annual chitin production of 3.2g.m-2.year-1
which would represent a total of 55,360 kg of chitin for the whole water body of
17.3 km2 (Peterson, 1983). Another rich source of chi tin in the marine
environment is the surface zooplankton of the Mediterranean sea. Dauby (1985)
has reported that, chi tin values of copepods on dry weight basis ranges from
3.10% in clausocalanus species 10 8.58% in Acartia clausi, with higher values of
12.22% occurring in the cladoceran species. The rnean annual chitin production
was calculated as 1.0014g.m-2.year-1, for a water depth of 100m.
Chi tin is also produced to a lesser extent by marine benthic cornmunities,
the dominant producers be;ng crustace ans, bryozoans and hydrozoans (Jeunial'x
et al. 1988). In this group of animaIs the crustaceans show the highest chitin
production. Extensive work has been carried out on Euphausiids (krill) of the
North Atlantic Ocean and North sea (Lindley 1978; 1982a). With a chitin
content of 7.08% determined for Euphasia superba (Antartic kri1l, Yanase, 1975)
the chitin production was estimated ta be 0.0045g.m-2.year-1 for krill of the
9
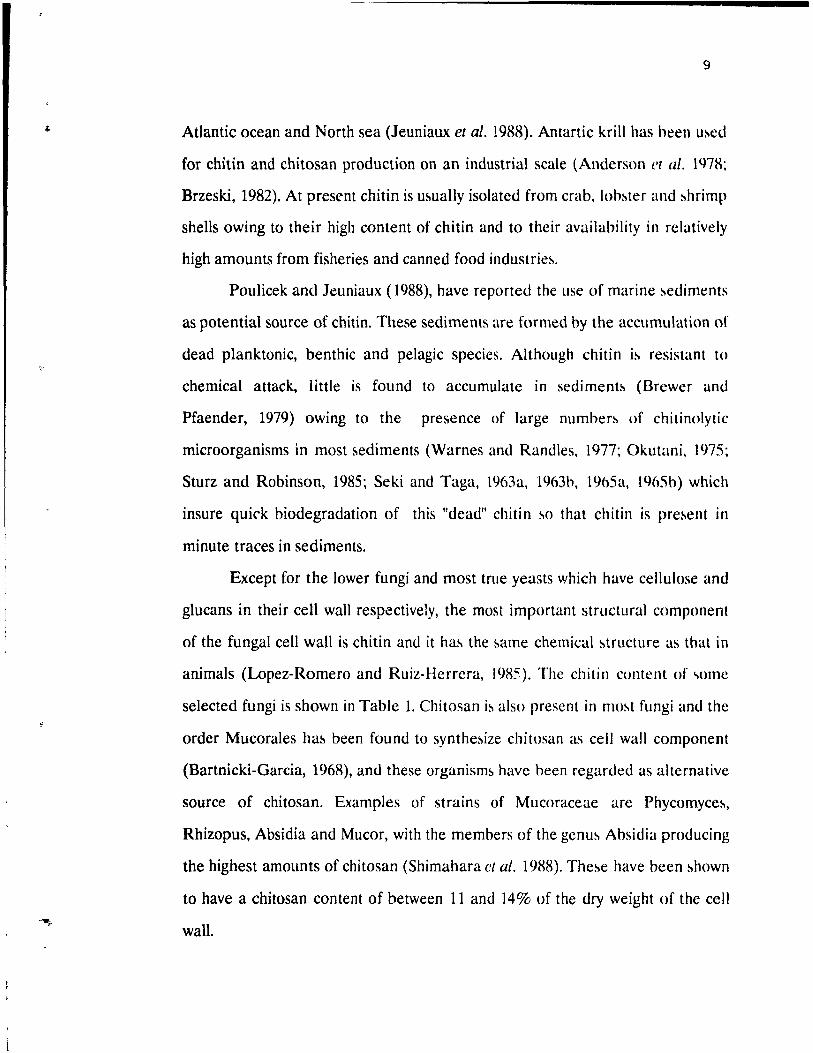
Atlantic ocean and North sea (Jeuniaux et al. 1988). Antartic krill has been u~ed
for chitin and chitosan production on an industrial scale (Anderson ct al. }<)78:
Brzeski, 1982). At present chitin is u5tually isolated from crab. loh~ter and ~hrimp
shells owing to their high content of chi tin and ta their availability in relatively
high amounts from fisheries and canned food industrie~.
Poulicek and Jeuniaux (1988), have reported the use of marine ~ediments
as potential source of chitin. These sediments are formed by the accumulation of
de ad planktonic, benthic and pelagie species. Although chitin b resistant to
chemical attack, little is fOlmd to accumulate in sediment~ (Brcwer and
Pfaender, 1979) owing to the presence of large number~ of chitinolytic
microorganisms in most 5tediments (Warnes and Randles. 1977; Okutani. 1975;
Sturz and Robinson, 1985; Seki and Taga. 1963a, 1963b. 19h5a, 1965b) which
insure quick biodegradation of this "dead" chitin ~o that chitin is pre~ent in
minute traces in sediments.
Except for the lower fungi and most truc yeasts which have cellulose and
glucans in their cell wall respectively, the most important structural component
of the fungal cell wall is chitin and it ha~ the ~ame chemical ~tructure as that in
animais (Lapez-Romero and Ruiz-Herrera, 19R5). The chitin content of ~omc
selected fungi is shown in Table 1. Chitosan b also present in mo~t fungi and the
order Mucorales ha~ been found ta synthe~ize chitosan as ccli wall component
(Bartnicki-Garcia, 1968), and the se organism~ have been regarded as alternative
source of chitosan. Examples of strains of Mucoraceae are Phycomycc~,
Rhizopus, Absidia and Mucor, with the members of the genu~ Ahsidia producing
the highest amounts of chitosan (Shimahara ct al. 1988). The~e have heen ~hown
to have a chitosan content of between Il and 14% of the dry weight of the cell
wall.
(
(
10
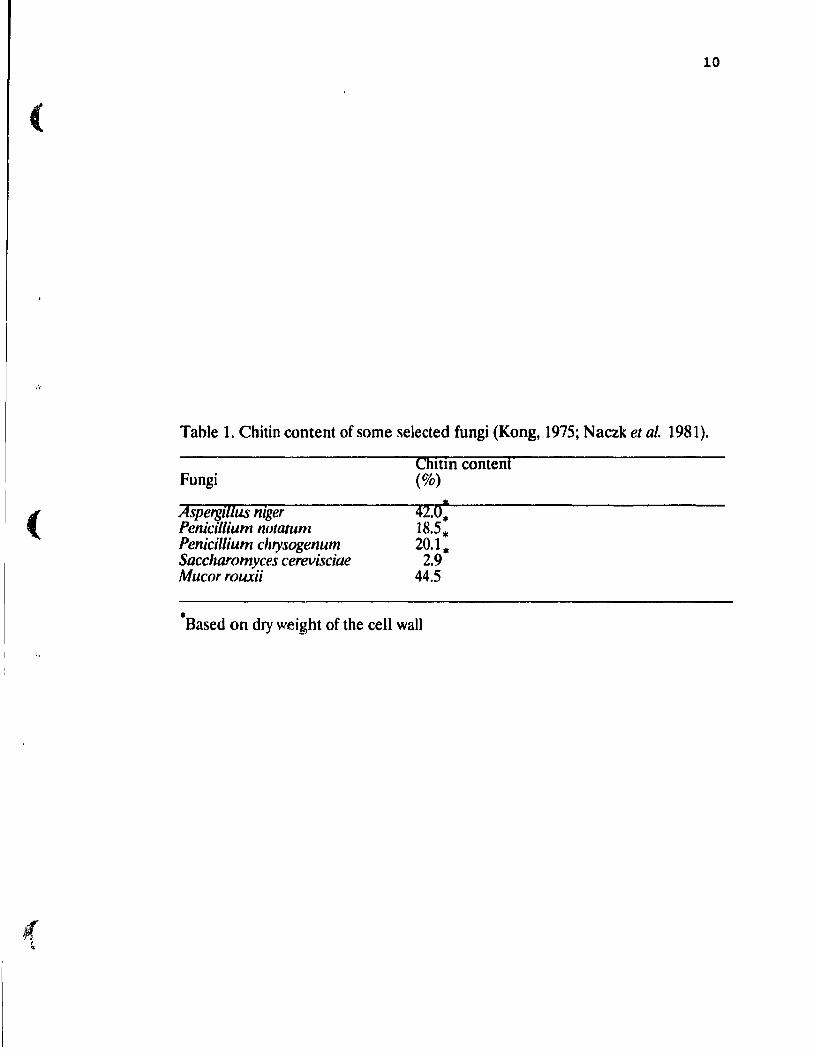
Table 1. Chi tin content of sorne selected fungi (Kong, 1975; Naczk et al. 1981).
Fungi
Aspergz1lus niger Penicillium notatum Penicillium clzrysogenum Saccharomyces cerevisciae Mucorrouxii
Chltm content (%)
* 42.0. 18.5. 20.1*
2.9 44.5
• • Based on dry welght of the cell wall
'.
, ,F
11
2.1.2 Chitin(,us associations
Chitin has the same chemical structure in fungi and animaIs (Lopez
Romero and Ruiz-Herrera, 1985). It is associated with other polysaccharides
such as mannans, glucans and galactan~ in the fungal cell walls white in animais,
it is associated with proteins (Mu2..~arelli, 1977). For example. in the Mollu!\can
shell, proteins are the main components and account for 50 - 80% of the matrix
dry weight, while chi tin occurs at low and variable percentages of hetween 0.10 -
40% of the matrix d~' weight (Poulicek, 1982; Jeuniaux, 1963; Goffinet and
Jeuniaux, 1979).
The proteins pre~ent in these animais are cross-linked by a sclerotization
process which is initiated in the cuticle by a phenoloxidase catalyzed oxidation of
diphenolic substrates yielding the corresponding o-quinoncmethide as a reactive
intermediate (Peter et al. 1985), Conclusions drawn from ehemical model
reactions suggest that crosslinking of the cuticular proteins results from Michael
type conjugate addition and Sehiffs base reaction with free peptidic amino
groups (Anderson, 1979; Brunet, 1980; Lipke et al. 1983). It has been propmed
that chitin may be involved in the o-quinone or quinonemethide intermediate
formation of crosslinks in cuticles either via unaeetylated ami no groups or
hydroxy oxygen (Peter et al. 1985). Chitin may also contribute to the Mability of
the sclerotized inseet cuticIe (Hackman and Goldberg, 1977; Vincent and
Hillerlon, 1978; Peter, 1980).
Sc1erotization may be accompanied by the de position of calcium ions in
the form of calcium carbonate and to a lesser extent as calcium pho~phate . This
occurs as a result of high affinity of a soluble proteic complex and an insoluble
chitinoproteic complex for calcium ions (Poulicek et al. 1985). Squid pens are
non-calcified and contain about 60% protein and 40% chitin (Hunt and Nixon,
1981).
(
, ,~
( '\
(
12
Crustace an shells appear red, orange or pink, and this is due to
carotenoids, since the colours of most carotenoids are red, orange or yellow
(Muzzarelli, 1977). According to Muzzarelli (1977), crabs, like many other
animais, convert ingested yellow plant carotenoids into oxygenated and thus
more polar orange or red keto derivatives and in sorne cases conjugate these to
give chromoproteins or calcerous esters, like in the hydrochoral skeletons. The
brown seaweed eaten by crabs is a rich source of cawtene, but the funct'fm of
the carotene in their metabolism is unknown (Muzzarelli, 1977). Treatrnent of
crustace an shells with the usual demineralization reagellts, namely, disodiurn salt
of ethylenediaminetetraacetic acid, aqueous sclutions of hydrochloric acid or
citric acid, dissolves the calcium carbonate but leave aIl pigments firmly bound
to the dernineralized shells, indic :tting that, the carotenoids are not bound to the
calcerous part. Depmteinization with solutions of sodium hydroxide does not
release the carotenoids either and hence suggest that, they are not bound to the
scleroproteins, but to chitin itself. Fox (1973) reported that the carotenoids are
combined with amino groups of chitin by carbonylamino or Schiffs base
linkages as shown below:
R2C =O + RCH2NH2 ---> R2CNHCH2R ---> R2C=NCH2R + H20 1 OH
However, the ease with which carotenoid pigments are removed from the se
matreials would suggest that, non-covalent type bonds are more important in the
complex formation
1.3 The advent orthe chitin industry
Another alternative for solving the sheIlfish waste disposaI problem is to
convert the waste into valu able rnaterials and to develop pc;>tential applications
for it to increase its marketability. In Japan, chitosan was produced industrially
, .1-
13
for the fifst time in the world in 1971 by Katakurachikkarin Inc. (Hokkaido) and
Kyowa Rei:o Inc. (Tottori), (Hiram), 1988) from chitin. Since the n, chitin and
chitosan have been produced by a number of companies and, in 1986, there were
a total of 15 chitin producing companies in Japan (Hirano, 1988). In the United
States, Protan Laboratories and Kypro Company form the main chitin/chito!lan
industries (Sanford, 1988). In Poland chitin and chitosan are being produced on
a laboratory scale from krill and squid pens (Brzeski, 1988). Commercial chilin
and chitosan vary in quality with each of these companies and they supply these
products in the form of powders, flakes. fibers, films, beads and sheet!l.
According to Hirano (1988) the total capacity of an estimated an nuai
production of chitin by the Japanese companies is about 2,000 tons. In 1986,
these companies produced 1,270 ton~ of chitin. Out of this, 1,170 ton!l were u!led
in the production of chitosan, 60 tons for D-glucosamine and oligossacharide
production, and 40 tons remained as excess. The yield of chitosan was 700 tom,
and out of this amount 500 tons was used as flocculants, and 100 tons for
cosmetics, foods, and feeds production, with an excess of 100 tons (Hiram),
1988). Presently, however, there is a fairly good balance of production with
utilization because of increased applications in the fields of biotechnoJogy,
medicine, foods and feeds.
2.2 Properties of chitin and chitosan
2.2.1 Solubility and viscosity
The dissolution of chi tin presents an important problem. This is mainly
due to the existence of both intermolecular and intramolecular hydrogen
bonding in its solid state. Chitin is crystalline and insoluble in water and
ordinary solvents (Muzzarelli, 1977: Austin et al, 1981; Tracey, 1957). It is
, \
14
soluble in strong mineraI acids and in anhydrous formie acid but insoluble in
alkali. By repeatedly freezing and thawing it in al kali solutions it can be wholly
disso!ved (Danilov and Plisko, 1954). The ease of dissolution depends on the
degree of crystallinity. Only beta-chitin dissolves in anhydrous formie acid.
The choice of a solve nt for chilin is always a compromise among aspects
such as rate of dissolution, rate of chi tin degradation, viscosity of the solvent, and
viscosity of the resulting chitin solution. Austin (1975) reported that,
chloroalcohols in conjunction with aqueous solutions of minerai acids are
effective systems for dissolving chitin in any form. The chloroalcohols which may
be employed include 2-chloroethanol and 1-chloropropanol. These solvents
dissolve chitin rapidly at room or middle elevated temperatures to give relatively
low viscosity chitin solutions and hydrolytic degradation proceeds relatively slow
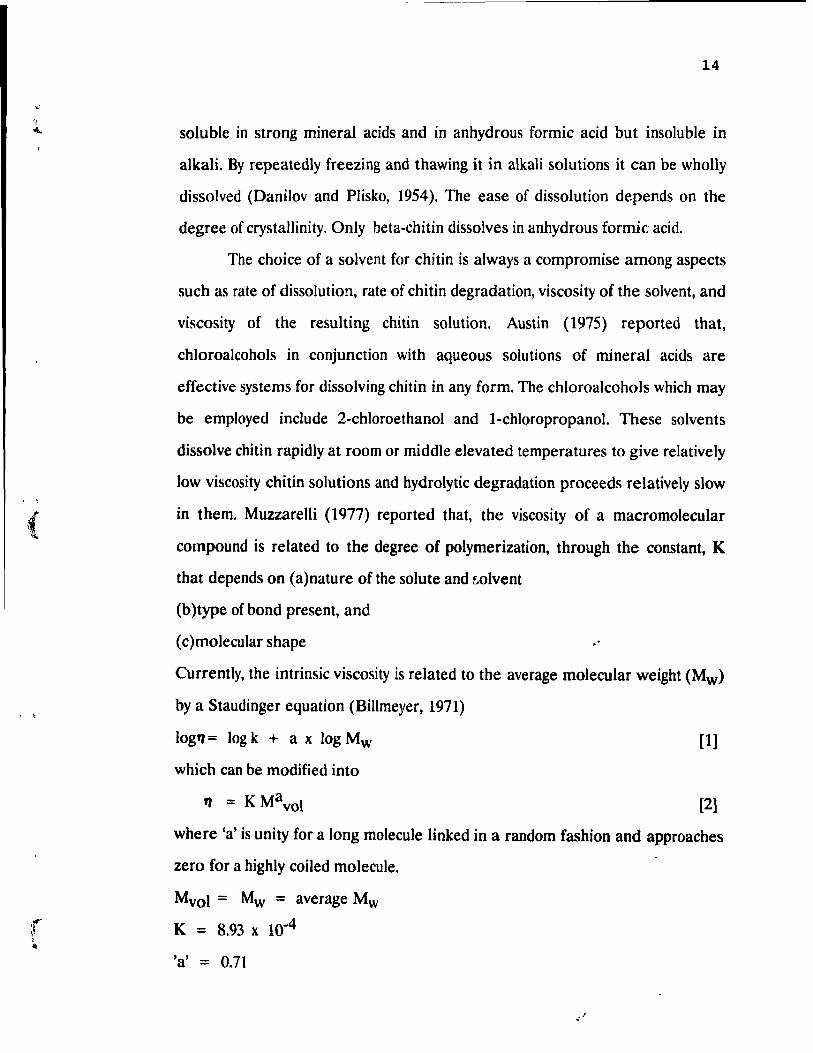
in them. Muzzarelli (1977) reported that, the viscosity of a macromolecular
compound is related to the degree of polymerization, through the constant, K
that depends on (a)nature of the solute and wlvent
(b )type of bond present, and
(c )molecular shape
Currently, the intrinsic viscosity is related to the average molecular weight (Mw)
bya Staudinger equation (Billmeyer, 1971)
log'l= log k + a x log Mw
which can be modified into
tl = K Mavol
[1]
[2]
where 'a' is unit y for a long molecule linked in a random fashion and approaches
zero for a highly coiled molecule.
Mvol = Mw = average Mw
K = 8.93 x 10.4
'a' = 0.71
, ,1'
-, 'l'
, l'
15
Austin et al. (1988) reported that squid chitin, which is beta-chitin is found to be
soluble or strongly swollen in LiCljtert amide solvents, and like .tlpha-chitin, is
soluble in certain minerai acids and dichloroacetic acid system~. An effective
solve nt system, N,N-dimethylacetamide Of N-methylpyrolidone containing 5%
dissolved LiCI has been discovered hy Rutherford and Austin (lQ78a). Austin
(1984; 1988); Barton (1983) and Burell (1955) develaped the concept of
Hildebrand solubility parameters (6). The application of this parameter proved
fruitful in developing solvents for beta-chitin (Austin et al 1988; Barton, 1(83).
The Hildebrand solubility parameters of solvents and their mixtures is a measure
of their cohesive energy densities. Solvent mixtures having a solubiIit~ parameter
approximating that of the polymer have the best chance of compatibility. formic
acid, a popular solvent for chitin was found ta have a 6 of 24.8 - 25:7 for
alpha-chitin and 23.2 - 26.0 for beta-chitin. Very often the solubility JJarameter
has to be adjusted ta be close ta that of the polymer, and the chlorinated
solvents, ego 1,2-dichloroethane have been found to be very useful (Austin et al.
1988). Dichloroacetic acid (6 = 24.5) dissolves portions of beta-chitin readily but
gel partides often rernain suspended in the solution. When formic acid (96%,6
= 26.6) is used to adjust the solubility parameter, a homogenous solution of
beta-chitin is obtained. The LiCI/tert amide systems are ail strong swelling
agents and partial solvents for alpha-chitin. Of these, LiCi/N-methylpyrolidone
or N,N-dimethylacetarnide solution has the highest solubility parameter and
appears the best solvent for beta-chitin, giving a very viscous solution (Austin,
1988). The solvents power is derived from the addition of LiCI, as the two liquids
alone are only swelling agents for chitin. The Liel apparently reduces or breaks
the crystalline forces, su ch as hydrogen bonding by association with the polymer
and solvent (PanaT and Beste, 1976).
2.2.2 Film-forming properties
(
«
16
2.2.2 l'~ilm-forming properties
Chitin has a high degree of crystallinity which allows it to be cast into
films or membranes. By dissolving it in a suitable solve nt, the resulting solution
can be coated on a suiutble surface to produce a film (Muzzarelli, 1977). The
film-forming ability of chitosan has been the object of many studies sorne of
which have led to indus trial uses in various fields such as photographie films
(Ryan and Yankowski, 1969), as reverse osmosis membranes (Yang and ZaB,
198~) and cosmetics containing significant amounts of chitosan (Gross et al.
1983; Lang and Clause n, 1988).
2.2.3 Sensory properties
Pyrolysis of chi tin at 9000 C produces a number of flavor compounds
(Knorr, 1984). The pyrolyzate fraction can be divided inta four groups: (i) the
acidic fraction which is made up of short chain fatty acids, ego is butyric acid,
which gives the characteristic flavor of butter; (ii) the phenolic fraction
comprising phenol, xylenol, and cresol; (iii) the neutral fraction, is made up of
naphthalene and xylene; and (iv) the basic fraction which is made up of picoline,
nicotine and pyrazines. Pyrazines are a grou;:> of heterocyclic nitrogenous
compounds which contribute significantly to the desired characteristic flavor of
toasted and roasted foods.
2.2.4 Water binding properties
Muzzarelli (1977) reported that, the hygroscopicity of chitin is close ta
that of mercerized cellulose fibers and considerably greater th an that of ramie
fibers. but the chitin surface is less active and permeable to water than cellulose
, ,.
17
fibers. Chitin and chitosan are known to bind 2 to 5 times their weight of water
with chitosan having the greatest water binding capacity (Knorr, 1(82).
Generally, water uptake of chitinous polymers depend on factor!l like
crystallinity, amount of salt fo.ming groups and amount of protein in the
product. Austin et al.(1981) reported that, aIl chitinou!; polymer!'l are a!lsoCÎaled
with protein residues which remain with it even after the most dra~tic alkali
treatment.
2.2.5 Viscosity and molecular weight
Rutherford and Austin (1978a) reported that, the best solvent for chitin i!'l
5% N,N-dimethylacetamide-LiCI and since then thi!l solve nt hu!>. been used for
viscosity measurements (Shimahara and Takiguchi, 1988; Rutherford and
Austin, 1978b) since it both swells and dissolves chitin without any hydrolytic
degradation or bleaching. The solve nt of choice for viscosity measurement of
chitosan is O.2M acetic acid containing O.1M sodium acetate (Muzzarelli, 1(77).
Since chitosan in solution exhibits polyelectrolytic effect, in the absence of salt,
there is an abnormal increase in vicosity of the more dilute solutions bccause of
an enlarged effective volume due to charge repulsior and stretching out of the
molecule (Muzzarelli, 1977). Upon addition of suffic;c!1t salt to neutralize this
charge effeet, the viscosity behaviour is normal. Generally, the viscosity of a
macromolecular compound is related to the degree of polymerization of the
compound through the constant Km. Km depends on the nature of the solute
and solvent, the type of bond and molecular shape.
limc-->O (nsp/c) = Km x pn [3]
where nsp = specifie viscosity
c = concentration
(
(
(
P = degree of polymerization
nsp is between 0 and 2.
18
Since the degree of polymerization is directly related to viscosity, the viscosity of
the macromolecular compound is an indication if the molecule has undergone
hydrolytic degradation during extraction. Intrinsic viscosity is related to
molecular weight by a modified Staudinger equation as shown in equation [2].
The average molecular weight of alpha-chitin is 1.036 x 10⁶ (Muzzarelli,
1977). Lee (1974) obtained average molecular weight of beta-chitin from Loligo
pen as 2.5 x 10⁶. Chitosan prepared from this by deacetylating with 45% NaOH
under nitrogen for 4, 6 and 8 hours at 1400 C gave average molecular weights of
7.25 x loS, 4.92 x loS, and 2.35 x loS daltons respectively. Molecular weights of
chi tin and chitosan are different and a severe degradation of the chain takes
place during the production process. This happens during the de calcification step
when the shells are submitted to the action of acid solutions at high
concentrations and at both room and elevated temperatures, or during the
deacetylation step which involves harsh treatment with alkali at high
concentrations and temperatures.
2.3 Applications of chitinous polymers in the food industry
ln the food, pharmaceutical and cosmetic industries, there have always
been the need for inexpensive suspensions of polymers for use as thickeners,
suspending, stabilizing, gelling and viscofying agents. Water soluble
polysaccharides such as alginic acid, cellulose, guar gum, xanthan gum, starch
and their derivatives have been used for these purposes. Physically modified
chitinous polymers are obtained via physical methods which are based on high
shearing forces, centrifugation and lyophilization which results in drastic changes
, ~ ... l
, i
19
in the physical properties of the material. Sorne of the changes in properties are
improved dispersibility, and unusual viscosity stability at prolonged and elevated
temperatures. These properties are exploited in food applications in which
viscosity control agents are required to be cûmpatible with sterilization or other
forms of heat treatment.
2.3.1 Chitin as dietary fiber
It has been found that additions of up to 100/0 of chitin in the diet of
chickens results in normal growth and vigor of the animais and also increased
growth of Bifidobacteria in the gut (Austin et al. 1981). These bacteria block the
growth of other types of microorganisms in the gut and generate lactase,
required for digestion of milk lactose. This may be significant for both humans
and animais with lactose intolerance. Above 10% additions chitin de presses iTOn
absorption (Knorr, 1984).
It has also been found that, when chi tin is added to bread whose gluten
has been partly replaced by other protein sources, there is prevention of
depression of loaf volume (Knorr and Betschart, 1978; 1981). When used a!l
dietary fiber chitin exhibit a potential for reduction in cholesterol lever in
hurnans(~orr, 1984)
2.3.2 Chitin and chitosan as non-absorbable carrier of
food additives
The rationale underlying the development of non~absorbable food
additives stems from the concept that functional ingredients which are absorbed
intact or metabolized may interact with target tissues or organs and constitute a
, l
,-
~
li
20
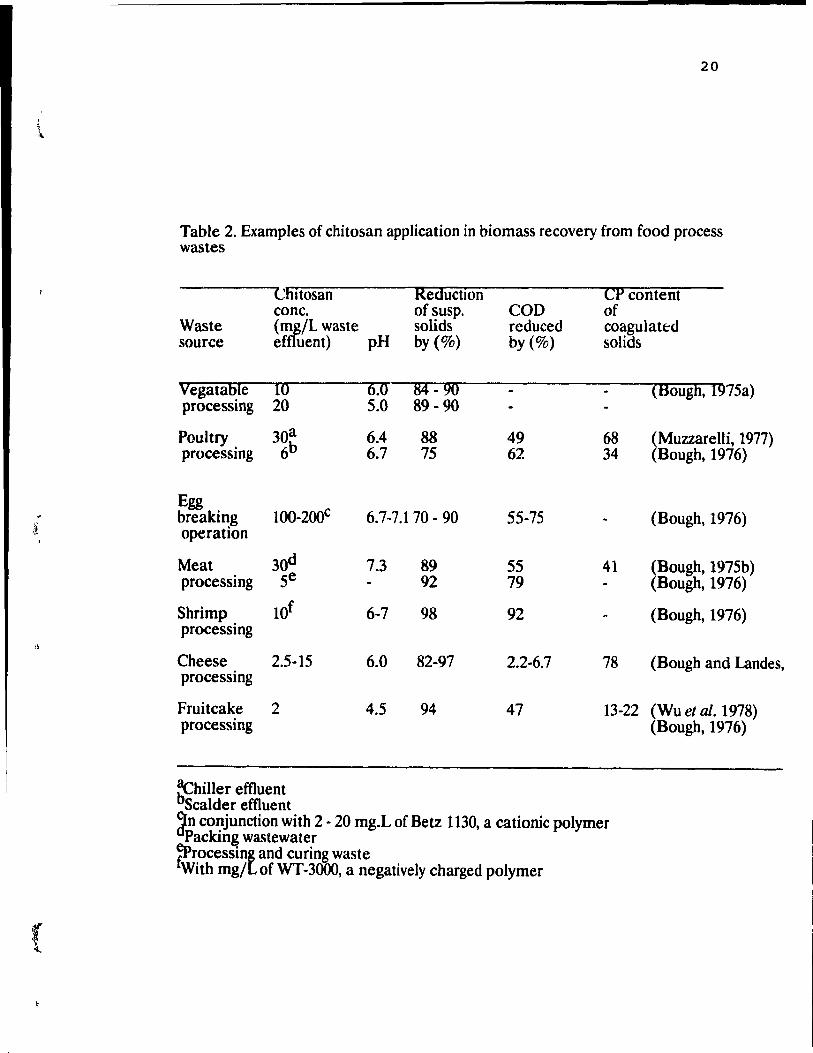
Table 2. Examples of chitosan application in biomass recovery from food process wastes
Chuosan Reduction conc. ofsusp.
Waste (mg/L waste solids source effluent) pH by(%)
Vegata~le JO processmg 20
Poultry . 30a processmg 6b
Egg breaking operation
100-200e
Meat 30d processing Se
Shrimp lOf processing
Chee se 2.5-15 processing
Fruitcake 2 processing
~hiller effluent Scalder effluent
6.0 84 - 90 5.0 89 - 90
6.4 88 6.7 75
6.74 7.1 70 - 90
7.3 89 92
6-7 98
6.0 82-97
4.S 94
CP content COD of redueed eoagulat~d by(%) solids
(Bough, 1975a)
49 68 (Muzzarelli, 1977) 62 34 (Bough, 1976)
55-75 (Bough,1976)
55 41 (Bough, 1975b) 79 (Bough, 1976)
92 (Bough, 1976)
2.2-6.7 78 (Bough and Landes,
47 13-22 (Wu et al. 1978) (Bough, 1976)
~n conjunction with 2 • 20 mg.L of Betz 1130, a cationie polymer Packing wastewater
~rocessing and curing waste fWith mg/L of WT-3000, a negatively charged polymer
'l-
.f'"
21
potential risk. (Takeda and Abe. 19(2). The use of chitin/chitosan ,L, non
absorbable food carrier for highly concentrated food ingredients was
investigated in animal feeding trials with the food dye. FD&C Red No. 40. This
showed that when the dye is attached to the chitinous polymer. absorption of the
dye by the animal was reduced (Watkins and Knorr, 1(83).
2.3.3 Use of chitosan for biomass recovery
Over the past two decades increasing attention has been given to the use
of polyelectrolytic coagulants of naturai origin in aiding the coagulation of
colloidal and suspended solids from food processing waste~. Chitosan. a
polycationic carbohydrate polymer has been found to be particularly effective in
aiding the coagulation of protein from food process wastes (80ugh, 1976; Fujiti.
1972). Table 2 indicates that, chitosan can reduce suspended solids by 70-98%.
The traditional coagulants used are multivalent inorganic salts such as AI and Fe
sulfates.
2.3.4 Use of chitosan for clarification of friut juices
Processing of clarified fruit juices commonly involves the use of clarifying
agents, including gelatin, bentonite, silica sol, tannins, polyvinylpyrolidone, or
combination of these compounds. Chitosan salts, which carry a strong positive
charge have proved to be equally effective in reducing juice turbidity. Soto
Peralta et al. (1989) found that both acid-soluble and water-soluble chitosan salts
are effective as fining agents. Comparison of the effectiveness of an acid soluble
chitosan salt or water soluble chitosan salt and the conventional silica
soljgelatinjbentonite treatment for the clarification of fruit juices revealed that,
22
there is little effect of temperature on the removal of colloidal and dispersed
particles in apple juice by chitosan and the effectiveness of a single dose chitosan
application at a concentration of 0.6 - 0.7 kg/m3 (Soto-Peralta et al. 1989). As
compared to the conventional method, treatment of the juice with chitosan
resulted in a Iighter coloured juice. This can be viewed as a disadvantage.
2.3.5 Other uses of chitin and chitosan
The film-forming properties of chi tin have led to recommendation of
chitin films as oyen and other food wraps. The use of N,O-carboxymethylchitin
films to preserve friuts over long periods has been approved in Callada and
United States (Davies et al. 1988).
2.3.6 Miscellaneous
The unique properties of chi tin and chitosan make them attractive
sources of dietary fiber, functional ingredient, a carrier for food additives with a
potential for cholesterol reduction in humans. The humectant properties of
chitin/ chitosan and their derivatives allow them to be used in food processing to
improve moisture uptake.
The chelating properties of chitosans prove advantageous in the removal
of heavy rnetals, dyes, pigments, acids or organic solids such as proteins. This has
resulted in utilization of approximately, 50% of the currently produced chitosans
in clarification, coagulation or flocculation processes in processing wastes and
waste water treatment.
The gelling properties of chitosan ami its water soluble derivatives allow
a wide range of application in food biotechnology, the most attractive being
, r
, \~
..... '
23
coating of foods and pharmaceuticals, and gel entl apment of biochemicals, plant
embryos and whole celIs, mieroorganisms and algae. Sueh entrapment offer!\
diverse uses including microeneapsulation and controlled release of flavors,
nutrients and drugs.
Again in the field of biotechnology, chitosan has a role in plant cell
permeabilization and elicitation of plant metabolites. For example, increase in
product yields of existing or new phytochemicals could be made p()s~ible wh en
chitosans are used as inducers of biosynthesi!\ of primary metaholite!. (example,
enzymes) or secondary metabolites, example alkaloids, fi avors, pigments,
antioxidants, et cetera.
The film-forming properties of chi tin and its water-soluble derivative!\
have led to recommending chi tin films as oyen and other food wraps.
2.4. Preparation of chitin ,\md chitosan
While the occurence of chitin is widespread in nature" the only practical
source of consideration in the near future is the shell of commercially harvc!.ted
crustace an species su ch as crab, shrimp, lobster, prawn and crayfish. The shells
of these animais are presently available in quantitie~ sufficient to support a
chitin/chitosan industry. They a!"e a rich source of chitin, containing in general
20 - 30% on a dry basis. Crab shell forms the main source of industrial
production of chi tin in Japan, because they are relatively rich in chitin and less in
calcium carbonate, and easy 10 obtain in large quantities from the crab meat
processing plants. Antartic krill (Euphasia superba), becau~e of its huge
abundance is said to be the most concentrated future !IOurce of chitin in the
world. Its edible tail is commerciallv u~ed and the waste mate rial is suitablc for .'
L.
24
chitin isolation and chitosan preparation on an industrial scale. Homarus lobster,
obtained from South AfTica is also used in the preparation of chitin.
As mentioned above, chitin in crustacean wastes is tightly associated with
proteins, lipids, pigments, and calcium deposits. Therefore, in order to isolate
chitin from crustacean shells, the following steps are required:
1. Demineralization
2. Deproteinization
3. Decoloration
Sorne classical methods for preparation of chitin include the method of
Hackman (1954), Whistler and Be Miller (1962), Horowitz et al. (1957), Foster
and Hackman (1957), Takeda and Abe (1962), Takeda and Katsuura (1964) and
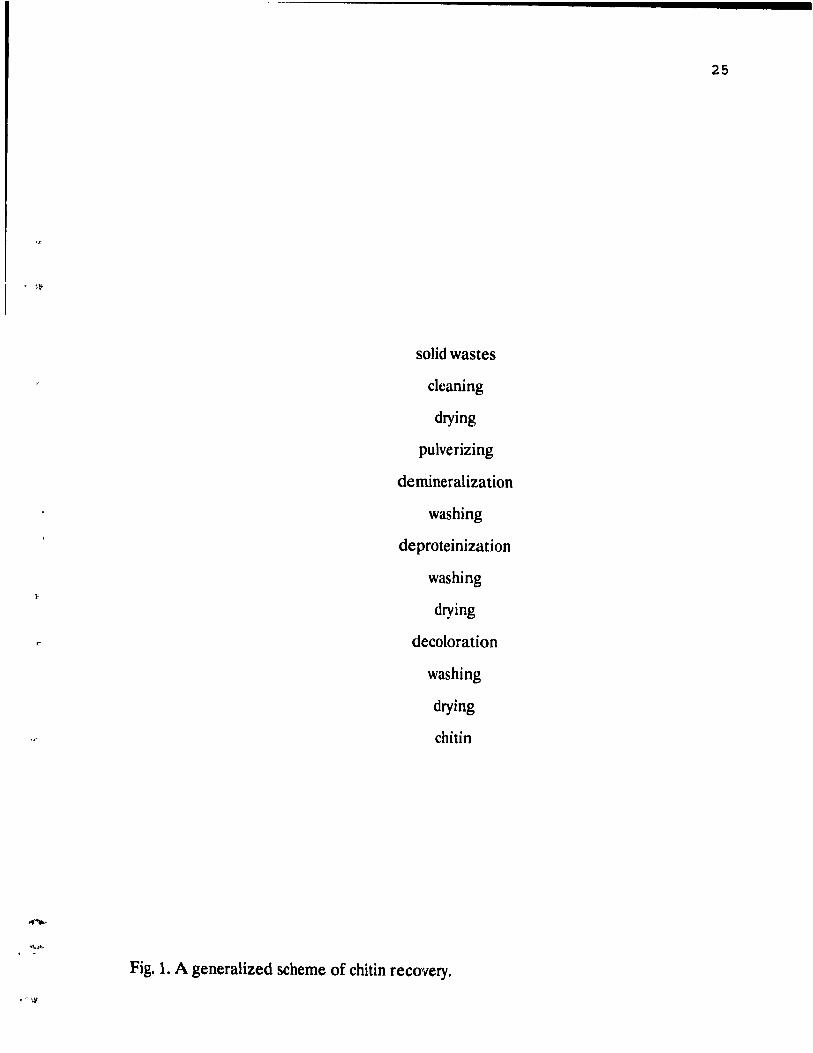
Broussignae (1968). The key steps in the extraction of chitin from crustacean
wastes are outlined in Fig. 1.
2.4.1. Demineralization
This is achieved by treating the shells with dilute aqueous solution of
hydrochloric acid or ethylenediaminetetraacetic acid (pH7.7) or formie acid.
Hackman (1954), Whistler and BeMiller (1962), and Broussignac (1968) aIl used
hydrochloric acid in demineralization of the shells. In this reaction, calcium
carbonate is eonvert~d into soluble calcium ehloride and carbon dioxide gas is
evolved. With progressive increase in the concentration of the acid, the degree of
demineralization is in('reased. Disadvantages of acid demineralization are that,
the use of acid concentration above 1.25N adversely affects the ~Jscosity of the
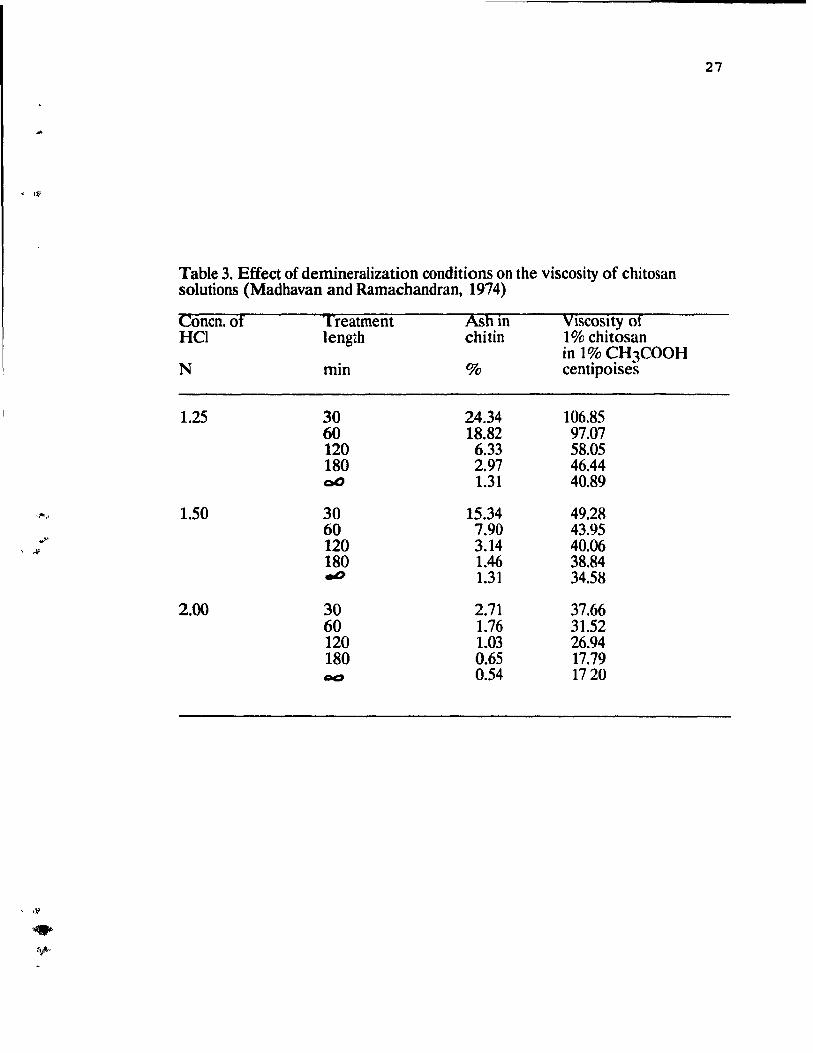
final produet chitosan (Muzzarelli, 1977). Madhavan and Ramaehandran (1974)
gave a comparative account of the effeet of demineralization conditions on the
viseosity of chitosan solutions, the ultimate product of ehitin, as shown in Table
-
solid wastes
ckaning
drying
pulverizing
dernineralization
washing
deproteinization
washing
drying
decoloration
washing
drying
chitin
Fig. 1. A generalized scheme of chitin recovery.
25
, ,~
, "
26
3. Demineralization of crustace an shells using HCl at high concentrations
and temperatures is not a good practice, as the viscosity of chitosan solutions
would be reduced (Muzzarelli, 1977). When conditions of the acidic treament
are not properly controlled, partial or extended depolymerization and
deacetylation can take place, and may lead to Jow quality chitin and chitosan
products. Thl.!S, satisfaetory chitosan production depends largely on the acidic
treatment to which the raw material has been submitted to, prior to the
deacetyl(ltion step. An overview of the various demineralization conditions
used by various authors are given in Table 4. To control the deacetylation and
depolymerization, Lusena and Rose (1953) have suggested the use of HCI at pH
not lower than 3. Moreover, instead of the use of HCI, formie acid (Horowitz et
al. 1957) ûr EDTA (Foster and Hackman,1957; Takeda and Abe, 1962; and
Takeda and Katsuura, 1964) have also been used for demineralization.
2.4.2. Deproteinization
Deproteinization of the demineralized shells may be accomplished by
dilute aqueous NaOH solution. Hackman (1954), Whistler and Be Miller (1962),
Horowitz et al. (1957), aIl used dHute aqueous solution of NaOH in removal of
prote in, with constant stirring and for prolonged hours in an inert atmosphere.
The disadvantages of this method are that, it requires large amounts of alkali,
and causes removal of acetyl groups though it removes proteins and peptides as
desired (Muzzarelli, 1977), and therefore in ail cases, a partially deacetylated
produc\ is obtained. The effect of alkali treatment on the macromolecular length
and viscosity of the uItimate chitosan is less pronouneed than that of the Hel
treatment. Muzzarelli (1977) also reported that, between 20 - 80 mesh particle
size, alkali treatment had no effeet on the extent of deaeetylation and viscosity of
27
, Hf
Table 3. Effect of demineralization conditions on the viscosity of chitosan solutions (Madhavan and Ramachandran, 1974)
Conen.of 'l'reatment AShin Vlseosity of Hel length chi tin 1% ehitosan
in 1% CH3COOH N min % centipoises
1.25 30 24.34 106.85 60 18.82 97.07 120 6.33 58.05 180 2.97 46.44 00 1.31 40.89
-f", 1.50 30 15.34 49.28 60 7.90 43.95 .... 120 3.14 40.06 , ,1'
180 1.46 38.84 oD 1.31 34.58
2.00 30 2.71 37.66 60 1.76 31.52 120 1.03 26.94 180 0.65 17.79 OQ 0.54 1720
, _Ii'
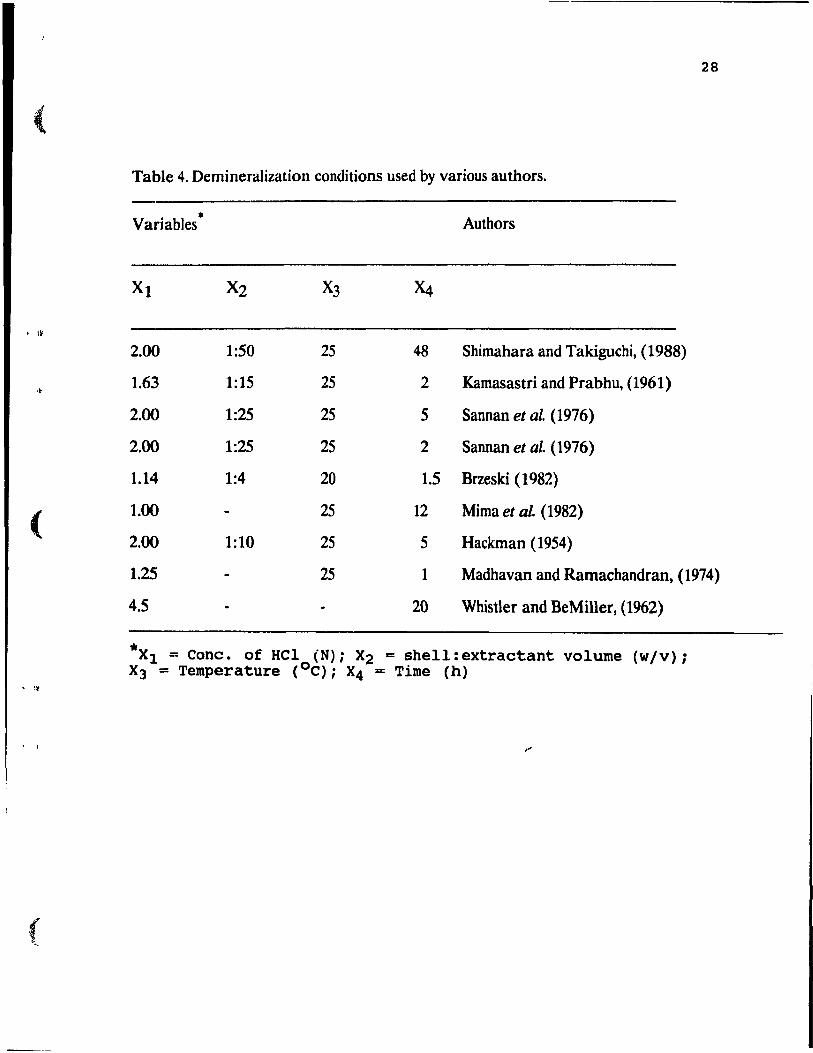
28
(
Table 4. Demineralization conditions used by various authors.
Variables * Authors
Xl X2 X3
• I~
2.00 1:50 25 48 Shimahara and Takiguchi, (1988)
,~ 1.63 1:15 25 2 Kamasastri and Prabhu, (1961)
2.00 1:25 25 5 Sannan et al. (1976)
2.00 1:25 25 2 Sannan et al. (1976)
1.14 1:4 20 1.5 Brzeski (1982)
( 1.00 25 12 Mima et al. (1982)
2.00 1:10 25 5 Hackman (1954)
1.25 25 1 Madhavan and Ramachandran, (1974)
4.5 20 Whistler and Be Miller, (1962)
* of Hel (N); X2 = shell:extraetant volume (w/v) ; X1 = Cane. X3 = Temperature (oC); X4 = Time (h)
, \~
, \
(
r ,f
, II-
, '\-
T ,F
I~
29
the chitosan solutions. Prolonged trcatment and/or higher tempentture~
increases the degree of deacetylation and decreases the molecular size. An
overview of the various deproteinization procedures used by variolls authors is
given in Table 5. To prevent such modifications therefore, milder treatments are
preferable. In view of this, sorne investigators have attempted to deproteinize
crustacean shells by use of proteolytic enzymes. Takeda and Ahe (1962), Takeda
and Katsuura (1964), and Broussignac (1968) deproteinized crustace an shell~
with papain, pepsin, or trypsin. These enzymes are specifie for proteins and
therefore do not deacetylate the chitin, however, complete removal of protein i~
not attained. Shimahara et al. (1982) developed a method of deproteinization of
crustacean carapace by the use of growing cells of proteolytic bacteria
(Pseudomonas maltoplzilia Le 102). They found out that hacterial
deproteinization was preferable for the purpose of preventing deacetylation.
2.4.3. Decoloration
Carotenoid pigments as weil as other lipids occur in the crustacean
carapace. Demineralization and deproteinization procedures leave ail pigments,
firmly associated with the tough and pliable chitinous pie ces, indicating that, the
carotenoids are bound to chitin itself. These may be removed by organic solvents
such as ethanol or acetone. Other ways of removing these pigments are by the
use of cold formie acid on the carapace, and mixtures of ammonium sulfate and
sulfuric acid on chitosan. Whistler and BeMilIer (1962) used a combination of
95% ethanol, acetone and ether to decolorize chitin hut these cOlild not remove
ail the pigments. Since the se solvents cannot remove ail pigment~ 10 give a
commercially acceptable product, a combination with bleaching reagents is
required. These may include sodium hypochlorite, (Blumberg et al. 1951), 3%
,. 30
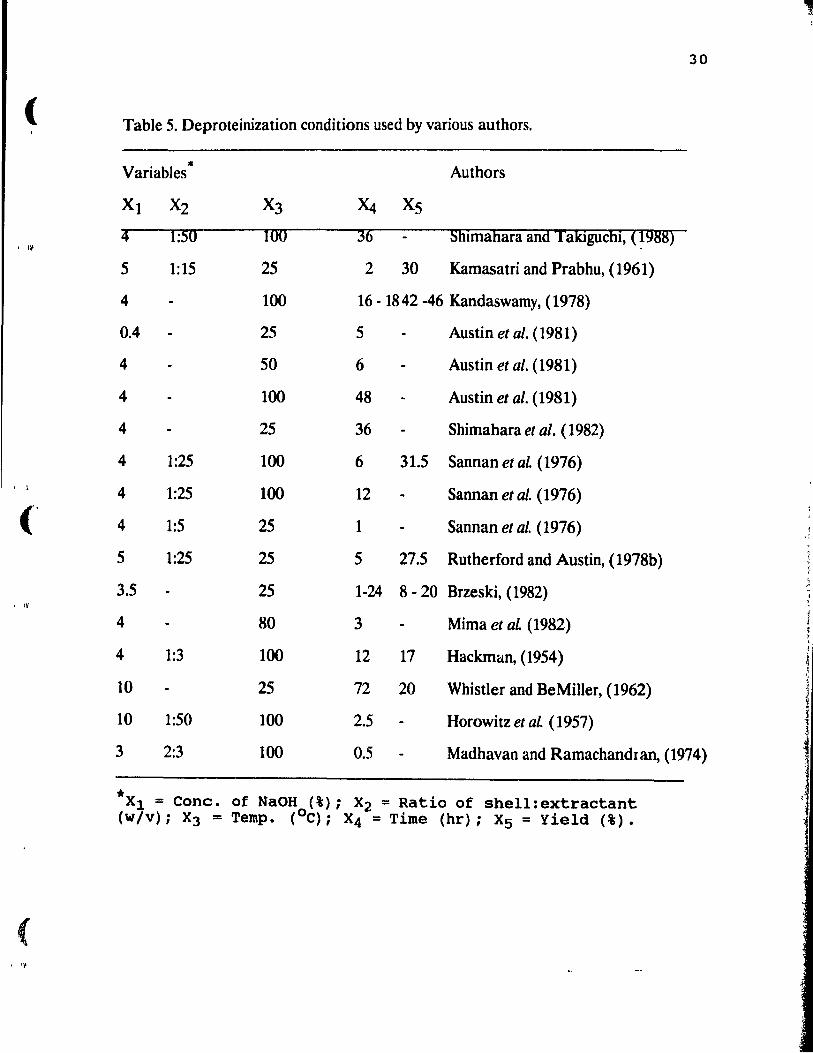
( Table 5. Deproteinization conditions used by various authors.
Variables * Authors
Xl X2 X3 '4 Xs
4 1:50 100 36 Shlmahara and 'l'akiguchl, (1988) , 1. 5 1:15 25 2 30 Kamasatri and Prabhu, (1961)
4 100 16 - 1842 -46 Kandaswamy, (1978)
0.4 25 5 Austin et al. (1981)
4 50 6 Austin et al. (1981)
4 100 48 Austin et al. (1981)
4 25 36 Shimahara et al. (1982)
4 1:25 100 6 31.5 Sannan et al. (1976) , 1 4 1:25 100 12 Sannan et al. (1976)
(' 4 1:5 25 1 Sannan et al. (1976) ~
"
5 1:25 25 5 27.5 Rutherford and Austin, (1978b) l 1 , \
3.5 25 1-24 8 - 20 Brzeski, (1982) -, , , IV
4 80 3 Mima et al (1982)
4 1:3 100 12 17 Hackman, (1954) i 1, 1 " ,
10 25 72 20 Whistler and Be Miller, (1962) ! 10 1:50 100 2.5 Horowitz et al. (1957) J
i 3 2:3 100 0.5 Madhavan and Ramachandran, (1974)
* of NaOH (%)i X2 = Ratio of shell:extractant Xl = Cone. (w/v); X3 = Temp. (OC); X4 = Time (hr); X5 = Yield (%).
( .. ~
... ~
, f
31
hydrogen peroxide (Brine and Austin, 1981), and ethyl acetate (Brzeski, 1982).
Bu: No et al. (1989) reported that, the treatment which gives the most acceptable
commercial product is extraction of carotenoids with acetone by the method of
Kamasastri and Prabhu (1961), which involves refluxing of the product with
absolute acetone for 45 minutes, followed by treatment with 70% acetone, and
then bleaching with 0.315% sodium hypochlorite in the cold (Blumberg et al,
1951).
• 2.4.4 Preparation of chitosan
Chitosan is prepared by deacetylation of chilin. Chitin possesses 2,3-trans
arrangement of substituents !n its monosaccharide units, and is remarkably
stable to most reagents, including aqueous alkali (Muzzarelli, 1977). Studies by
Von~Furth and Russo (1906) indicated that, three out of four acetyl groups can
be removed from chitin during deacetylation. Lowy (1909) considered that,
chitosan similarly prepared has one acetyl group per disaccharide unit.
According to Wu and Bough (1978), deacetylation proceed~ to about 70%
within the first hour of alkali treatment in 50% NaOI-l solution at 100oC, but it
progresses only gradually after this, reaching 80% in five hoUTs. Deacetylation
can rarely extend beyond 80% (Muzzarelli, 1977), unless the alkali fusion
procedure is applied (Horton and Lineback, 1965) along with fractionation.
Extended treatment of chitin with hot and concentrated NaOH solution results
in an aimost completely N-deao:etylated product (about 90%, deacetylation),
however, the treatment results in degradation of the molecular chain. Viscosity
studies by Wester (1909) and Meyer and Wehrli (1937) in concentrated
hydrochloric acid and nitric acid have revealed that, acidic treatment leads to
extensive degradation of the polymer chain even at O°e. Any acidic treatment
i
c , l'
, I~
12
carried out on chitin or on chitinous raw material leads to a partial or extended
depolymerization. Even though this polymerization occurs during alkali
treatment of the material the extent of degradation induced by NaOH treatment
during the production of chitosan is less pronounced.
To alleviate these problems, deacetylation may be carried out in an inert
atmosphere, exclusive of air and Muzzarelli ( 1977) has reported that
deacetylation under such conditions yields chitosan of higher viseosity than
deacetylation in air. Mima et al. (1982) established a method of preparing
chitosan having a desired deacetylation of up to 100% by al kali treatment of
chi tin, with repeated washing of the intermediate products with water. The total
time for preparing this chitosan was reduced to less than five hours, at a reaction
tempe rature of 1100C. white the conventional continuous procedure required a
prolonged time at that same temperature. The shortened reaction time in this
method avoids degradation of the molecular chains of the obtained chitosan
produet, as revealed by moleeular weight measurements by gel permeation
chromatography.
Another method of preparing chitosan is by microbial fermentation.
Recent advances in fermentation technology suggest that, large scale culturing of
an organism that synthesizes chitosan might be an attractive route to the
production of chitosan. Bartnicki-Garcia (1988) stated that, chitosan is made by
deacetylation of chitin by the enzyme, chitin deacetylase, provided that, the
deacetylation process occurs in tandem with chitin synthesis. The fungal order
Mucorales is Known to contain chitosan as a cell wall compone nt (Bartnicki
Garcia and Nickerson, 1962; Shimahara et al. 1988). Organisms of this class can
be readily cultured on cheap nutrients and the celI wall mate rial can be
recovered by simple chemical procedures. McGahren et al. (1984) carried Ql1t
the production of chitosan by fermentation of Absidia coerulea by growing the
,. Ir-:
< 'f-
, .11'
-• IF
33
cells in a medium containing a carbon source, such 3!\ glucose or molasses, a high
concentration of ammonium salt, trace quantities of minerai salts. yeast extract.
and a pH of 4.5. Harvesting of the cells was done before the end of the active
growth phase to prevent strong adherement of chitosan to the cell wall.
Some problems associated with the production of chitosan hy
fermentation are as follows: the percentage yield is very low and varies with the
age of the culture, the size of the culture vessel used (oxygen availability). and
the type and strength of acid. White et al. (1979) determined that 1 N
hydrochloric acid was the acid of choice. But Arcidiacono et al. (1988) observed
that hydrochloric acid degrades the cell wall mate rial during extraction and th us
lead to low yields. They evaluated acetic acid and found out that 2% W:lS most
acceptable because it did not cause cell wall degradation.
Maximum yield was obtained after 72 hours of fermentation, after which
it declined (Arcidiacono et al. 1988; White et al. 1979). Yields, as low as 5% to
10% of total dry weight of the biomass, and 30% to 35% of the cell wall was
reported by Arcidiacono et al. (1988). White et al. (1979) also produced chitosan
by fermentation of Mucor rouxii. The chitosan products obtained from
fermentation show inconsistent trends in the degree of deacetylation (Knorr and
Klein, 1986). lbis method also produces wide variations in the average
molecular weight of the chitosan products obtained. Gel permeation
chromatography revealed molecular weights ranging from around 200,000 to
over 1 million (Arcidiacono et al. 1988).
On the other hand, chitosan production by fermentation has certain
advantages in that the chitosan produced have very low degree of acetylation
(5% to 10%; White et al. 1979), while that of shellfish chitin ranges from near
0% to 50% (Foster and Webber, 1960). By more efficient processing procedures
and controls over biosynthesis, problems with yield, degree of acetylation and
• f
(
. .~
, \
(
34
wide variations in molecular weight may be alleviated. An added advantage with
the use of microorganisms in chitosan production is that the potential exists for
genetic manipulation of the fungus.
Araki and Ito, (1975) have reported that chitin deacetylase is ineffective
against preformed chi tin, but readily attacks nascent chitin. They also observed
that the deacetylase was capable of deacetylating chi tin provided that one
condition was met: that the deacetylase was allowed to act on chitin chains as
they were being formed. ie, simultaneous preserlce and operation of chi tin
synthetase and chi tin deacetylase was required. The use of fungal source of
chitosan has potential to prO\ ide a more consistent and weIl defined polyrner for
research and commercié-!l applications through fermentation and processing
con trois.
2.5. Response Surface Methodology
2.5.1. Classical experimentation procedures versus response surface
mcthodology.
Response surface methodology (RSM) is widely used in process
optimization studies (Henika, 1982; Giovanni, 1983; Yusof et al. 1988). RSM can
be defined as a statistical method which uses quantitative data from appropriate
experimental designs to de termine and simultaneously solve multivariate
equations (Giovanni, 1983). RSM serves three primary purposes (Giovanni,
1983), these are: (1) to determine the combination of factors which yield the
optimum response; (2) to determine how the response is affected by a given set
of factor levels; (3) to de scribe the interrelationship among the test variables.
With the classical experimentation procedure only one variable can be tested at
a time and this requires a large number of experiments which could be expensive
35
and time consuming. The change in one obtained optimum level will modify the
next optimum level, and so the optimum concentration level must be re
determined at that factor level and so on. The optimum product might not be
determined by these approaches because the experimenter must use educated
guesses to specify the levels of the various factors to be tested. Ma and Ooraikul
(1986) stated that the results of one factor at a time. experiments do not reflect
actual changes in the environment as they ignore interactions between factors
which are present simultaneously. RSM can cor.!!ider several factors at many
different levels in a product and the corresponding interactions among theses
factors and levels (Giovanni, 1983). Thus RSM enables more accu rate
optimization of factors (Ma and Ooraikul, (1986). These classical
experimentation procedures do not establish an equation which describes the
relationship between the variables and the responses to these variables.
2.5.2 Response surface designs
RSM was described by Giovanni (1983) as a four-step process:
1. Two or three factors that are most important to the product under
study are identified. If the factors are not known, preHminary expeTiments must
be conducted to determine them.
2. The range of factor levels which will determine the number of sampi es
to be tested are defined. If the range is too broad, the optimum will not be
clearly defined by RSM. In most food products, the factor levels are restricted by
physical (e.g., tempe rature ) and cost limitations and government regulations.
Because of these limitations, the optimum may lie outside the JeveJ~ tested and
therefore cannot be determined. Once the factor levels are set, preliminary Tuns

;
'"
, If
36
with samples representing the mid-points of these levels should be performed to
establish that the levels are appropriate.
3. The specifie test samples are selected and tested using the appropriate
experimental design. These designs sele(..! a subset of sampI es to be tested from
the set of aIl possible samples which could be tested. While covering the range of
factor levels specified by the experiment, the design emphasizes those tests
close st to the mid-points of these ranges, and thereby decreasing the total
number of sampI es to be tested. Mter specification of the samples, experiments
are conducted to test the samples and obtain qllantl~ative data to use in a
statistical analysis.
4. The data from these experiments are analyzed with an appropriate computer
program and interpreted with the help of a statistician.
Response surface experiments are carried out when a specifie statistical
model for the response is known. Most response surface experimental designs
focus on polynomial models with emphasis on first and second order designs
(Thompson, 1982). First order designs are used for screening experiments. The
purpose for screening experiments is to identify the most significant v'lriables.
The designs most commonly used to fit first order models are 2k factorial
designs where k is levels of each factor (Gacula and Singh, 1984). Thompson
(1982) reported that, fractional repli cations of factorial experiments are
recornmended for first order designs with four or more explanatory variables.
Gacula and Sin~h, (1984) stated that first order models are often inadequate and
provide a poor description of the geometric shape of the response surface.
Thompson (1982) reported that, most second order response surface
experiments utilize central composite designs which were first proposed by Box
and Wilson (1951). The total number of treatment combinations in a composite
design is 2k + 2k + 1. By using coded levels for each variable, the designs are
-,f'
,- ,1"
'" "'"
37
dependent only on the number of variables and the selected response equation.
The center point for each explanatory variable level is given a code of zero while
the highest and lowest levels of interest for each independent variahle are coded
plus or minus one respectively for three level designs. The highest and lowest
levels are given maximum and minimum codes respeetively (Thompson, 1(82).
A coded level combination for a four-variable central composite design to
optimize the yield of chitin extraction in these studies is given in Tahle 6.
2.5.3 Response surfaces
The term response surfaces has been associated with experiments
intended to identify or evaluate one or more responst variahles as a function of
the independent variables (Thompson, 1982). When the fitted response function
is graphed as a function of independent variables lhe re~ulting graph is called a
response surface plot or contour map (Gacula and Singh, 1984), Respon!!e
surfaces occur in a wide variety of shapes (Giovanni, 1983). The mast commonly
generated are eradIe or bowl, (Fig.2) and the sadd le point (Fig.3). For the cradle
or bowl point the optimum lies along the !0!J {'dges, while the saddle point has
the optimum respone along the sides or in each of the four corners.
2.5.1 Application of Response Surface Methodology
Ma and Ooraikul (1986) used RSM with central composite design to
optimize pH, temperature and enzyme/substrate ratio (E/S) on protein
hydrolysis in canola meal. The three variables were asse~sed at five levels around
the optima. The authors observed a closeness in value of the experimental and
calculated yields of total soluble nitrogen. The experimental re!lult under
optimum conditions was 0.4882% which agreed with the calculated yield of
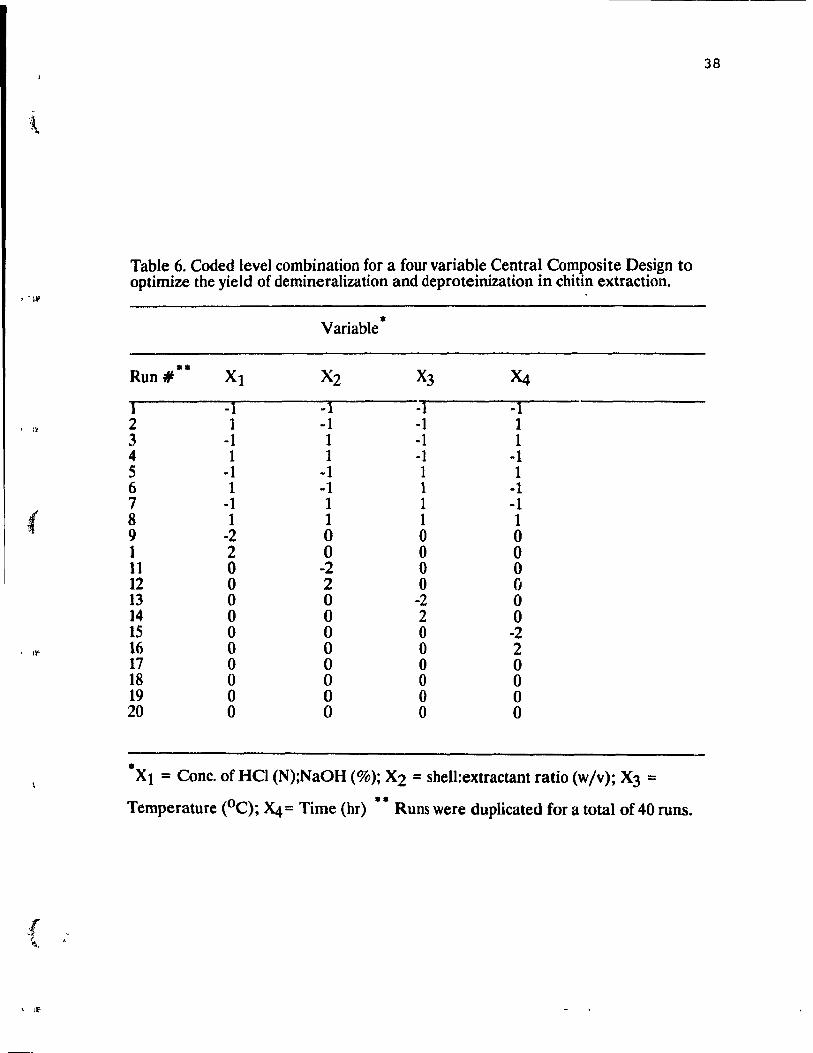
38
Table 6. Coded level eombination for a four variable Central Com~osite Design to optimize the yield of demineralization and deproteinization in cbitm extraction.
, ·1'
• • VarIable
Run# *. Xl X2 X3 '4
1 -} -1 -} -1 . ,~ 2 1 -1 -1 1
3 -1 1 -1 1 4 1 } -1 -}
5 -1 -1 1 1 6 1 -1 1 -1 7 -1 1 1 -1 « 8 1 1 1 1 9 -2 0 0 0 1 2 0 0 0 11 0 -2 0 0 12 0 2 0 0 13 0 0 -2 0 14 0 0 2 0 15 0 0 0 -2
, 1\0 16 0 0 0 2 17 0 0 0 0 18 0 0 0 0 19 0 0 0 0 20 0 0 0 0
• Xl = Cone. of Hel (N);NaOH (%); X2 = shell:extractant ratio (w/v); X3 = Temperature (oC); '4 = Time (br) •• Runs were duplicated for a total of 40 runs.
, ,li'
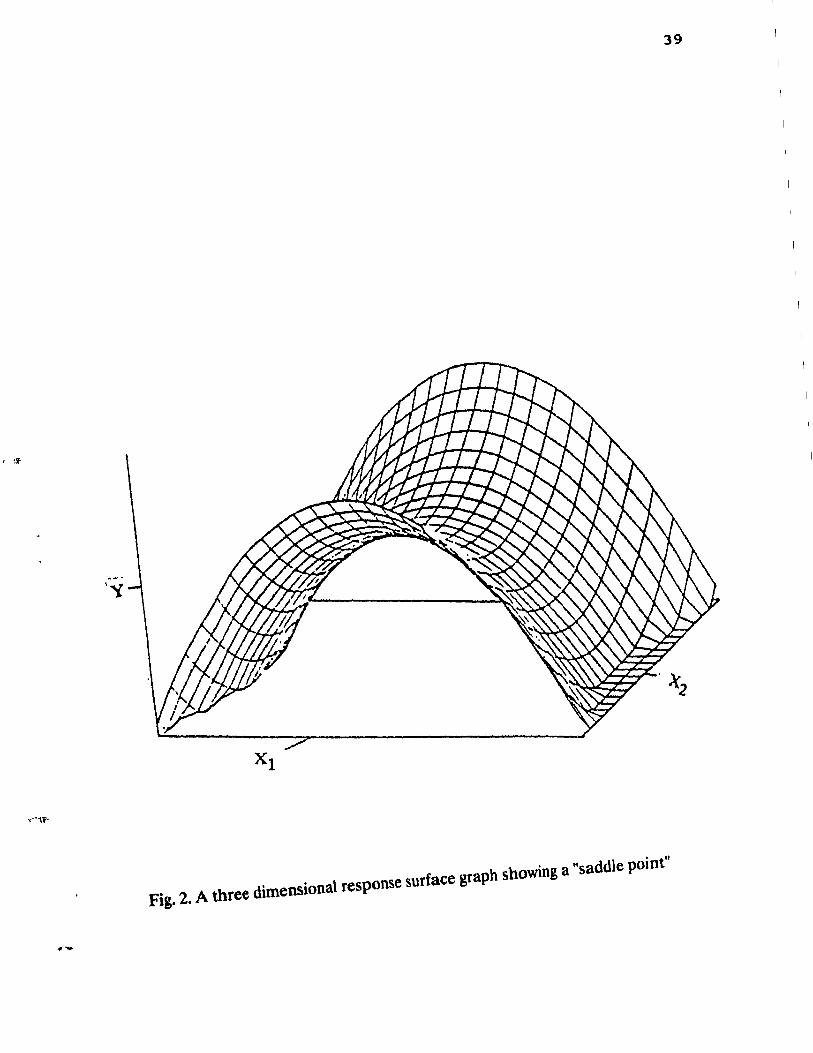
\ 39
Fig. 2. A tbree dimensional response surface graph showing a 'saddle point"
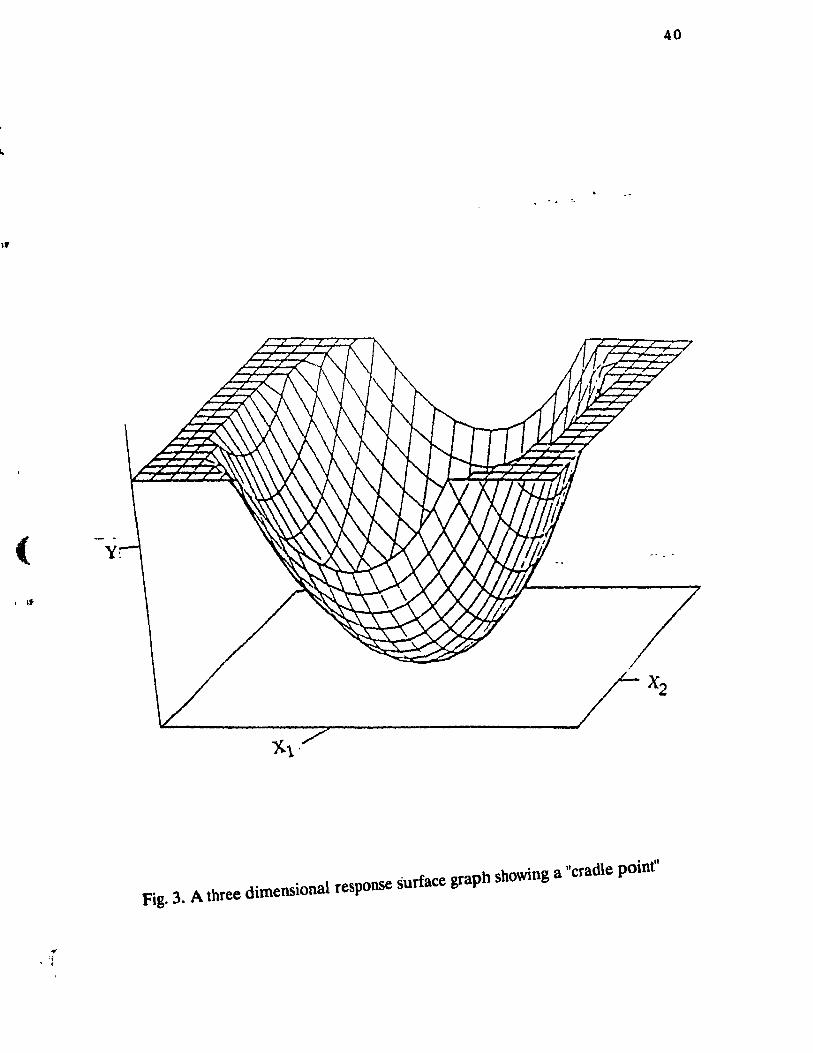
(
(
, If
• '1 , ,
40
Y:
Fig. 3. A tbree dimensional re.ponse surface graph .bowing a "cradle point"
41
0.4813%. They concluded that RSM was an efficient experimental design when
several variable~ are to be evaluated simultaneously. Diptee et al. (1989)
evaluated the application of RSM in protein extraction studies from brewer's
spent grain with central composite rotatable design to optimize temperature,
time, BSG:extractant ratio and concentration of disodium hydrogen phosphate
in the extractant solution, with particle size held constant at 1.5mn,. A yield of
approximately 60% protein could be obtained from the dried brewer\ spent
grains. Smith et al. (1988) also used response surface methodology in shelf Iife
extension studies of a bakery product. The four variables were evaluated at twu
levels around the optima. They concluded that RSM is an elegant tonl to
determine and simultaneously solve multivariate equation~ which specify the
optimum shelf life for a specified set of factors through mathematical model5t.
2.6 Sarety of chitinous polymers in food
Food and Drug Administration approval for the use of chitosan in food
requires evidence that chitosan is non-toxic to humans. Arai et al. (1968) have
reported experimental evidence regarding the toxicity of chito~an, indicating
that, only 18g of chitosanjkg body weight/day were harmful to mice. Hiram>
(1988) has also reported that, chitin and chitosan are almo~t non-toxic with an
LDSO of 16gjkg body weight of mice. It is estimated that, only 0.05 to 0.1 %
chitosan will be present in animal diets when used as a protein coagulating aÎd
to recover proteins from food processing wastes (Knorr, 1(84). Chitosan-protein
complexes containing up to 5% of chitosan and fed to rat~ for 6 weeks re~ulted
in insignificant differences in growth rate, blood and liver composition from the
control group (Landes and Bough, 1976). Since chitosan i!l a natural chelating
polymel, it is expected that it would deprive the animal of Na + and K +
.. , ,t
, II:-
\1'
, i
42
required for homoeostasis, but Muzzarelli (1977) has reported that when chitin
and chitosan powders are brought into contact with alkali metals (eg, Na + , K + )
and alkali earth metals (e.g., Mg2 +, Ca2 +), these metals are not collected to
any extent and do not prevent collection of transition metal ions when
simultaneously present.
Evaluation tests with chitin and chitosan powder in order to find possible
irritating or allergizing effects have been carried out and the results were
negative (Bowszyc and Raszeja-Kotelba, 1987).
2.7. Limitations
Though chi tin and chitosan have very promising applications, sorne
limitations for their use have been encountered (Knorr, 1984). The main
limitation is that the properties of chi tin and chitosan vary with source as well as
method of preparation. So far aIl the methods of extraction of chi tin by various
authors and industries are different from each other. This has given rise to
inconsistent yields and variation in properties. ft is therefore suggested that,
maxirnization of yield of chitin extraction from crustacean wastes with constant
and reproducible properties through optimization studies be carried out.
Moreover, there is very Iittle information available on the metabolism of
chitin/chitosan in humans. Increased knowledge in how humans metabolize
chitinous polyrners will open a wider door to increased applications in foods and
feeds.
•
- - II'-
. ,\-
3.1
CHAPTER3
MATERIALS AND METHODS
Source and handling of crustacean wastes
43
Industriallobster, crab and shrimp solid \Vastes were used throughout this
study and were obtained from WestmorIand Fisheries, Cap Pele, New
Brunswick. The waste products were transported in frozen form and upon
receipt were transferred to a freezer (u20oC) and stored at this temperature umil
required for use as source material for chitin recovery. The solid waMe~ were
thawed at room temperature, cleaned by scraping under running tap water, and
pre-dried in a hot air oven overnight at 6S°C. The shells were then dried
thoroughly in a vacuum oven (Precision Scientific Inc., Model No. 19) at 65()C
and 30mmHg for 4 hours. The dried shells were then pulverized with a waring
blender and sieved manually through a sieve of 2.0, 1.7, 1,41, and 1.0mm mesh
sizes to give uniform shell sizes. The pulverized ~ample~ \Vere then stored in
opaque polythene bags at -200 C until used.
3.2. Isolation of chitin
Isolation of chi tin from the above named crustacean shells involved the
successive steps of demineralization, deproteinization and decoloration. The
process required the use of various combinations of factor levels in order 10
achieve maximal recovery efficiency .
, f
, f
(
, IF
(
, II'
44
3.3 Chitin extractability with respect to particle size
A preliminary experiment was carried out to investigate the effeet of
particle size lm the extractability of chitin from lobster, crab and shrimp solid
wastes. A completely randomized design consisting of four levels of particle size
were used while the following factors were kept constant: (i) temperature of
extractant solution (ii) time of extraction (iii) ratio of shell:extractant, and (iv)
concentration of extractant. The four levels of particle shell sizes used were:
2.0mm,1.7mm, 1.41mm, 1.0mm. Samples (20g) of lobster, crab and shrimp were
subjected to demineralization by mixing the shells with the demineralizing agent
(2N HCI) in a ratio of 1:15 (w/v) at room temperature (23°C) for 6h with
constant stirring. This was followed by washing under running tap water, rinsing
with deionized water and filtration through 120 mesh sieve. The extract was
then deproteinized with 3.5% NaOH at 6SoC in a sheIl:extractant ratio of 1:15
(w/v) for 2 h with constant stirring. The extract was then washed, rinsed with
deionized water and dried at 650C for 4 h in a vacuum oven. This was followed
by decoloration and drying and the residual weight measured.
3.4 Hydrochloric acid demineralization of lobster shells
Samples (20g) of dried and pulverized lobster shell waste (2.00mm) were
mixed with various concentrations of HCI (0.5, 1.0, 1.5, 2.0, "and 2.5N) in 500ml
beakers using shell:extractant ratios of 1:5, 1:10, 1:15, 1:20, and 1:25 (w/v). The
mixtures were heated at temperatures of 20, 25, 30, 35 and 400C for 2, 4, 6, 8,
and 10 h respectively with constant stirring. lbe residues were removed by
filtration (through 160pm mesh sieve), washed, rinsed with deionized water and
dried al 6SoC for 4 h in a vacuum oyen. The residues were analyzed for ash and
..
.r
, l'
45
total nitrogen content as described in 3.9 and 3.8 respectively. The residues were
also weighed to estimate the weight loss upon demineralization.
3.5 Sodium hydroxide deproteinization of lobster shells
Residual demineralized shells were mixed with various concentrations of
NaOH (1,2,3,4, and 5%) in 500ml beakers at various shell:extractant ratios of
(1:5, 1:10, 1:15, 1:20, anf1 1:25 w/v). The mixtures were heated at temperature!\
of 45, 55, 65, 75, and 850 C for 2, 4, 6, 8) and 10 h respectively, and then filtered
through 160um mesh sieve. The residues were recovered by filtration and
washed with water, rinsed with deionized water and dried at 65°C for 4 h in a
vacuum oyen. The residual weight was rneasured to estimate lh~ los~ in weight
upon deproteinization and the cru de protein content was abo rncasured as
described in 3.8
3.6 Decoloration of crude chitin
erude chitin was decolorized using the method of Karnasastri and Prabhu
(1961) and Blumberg et al, (1951). Crude chilin samples were refllJxed with
ahsolute acetone (1S0rnl) for 45 min and dried at room temperature fûr 2 h and
then treated with 70% acetone. Samples were then washed, rinsed with
deionized water and then mixed with 0.315% sodium hypochlorite solution
(containing 7% available chlorine) for 5 min. The residues were then removed
by filtration (through a 160Jlrn mesh sieve) and then washed, rinsed with
deionized water and dried at 65°C for 4 h in a vacuum oyen. The re~idual
weights were measured in order to estimate the yield of crude chitin.
. \.
, 11f
f
46
3.7 Central composite rotatable design for optimization of demineralization
and deproteinization steps in chitin extraction
A four-factor 5-level central composite rotatable design (CCRD) by Box
et al, (1978) was employed for optimizing each factor in the CCRD. Factors and
levels of each factor in the design (Tables 7 and 8) were selected on the basis of
work done by previous authors (Horowitz et al. 1957) and also those required to
prevent depolymerization and deacetylation of the native chitin chain. In the
CCRD, particle size was kept constant at 2.00mm and the shell:extractant ratio
varied from 1:5 to 1:25 (wjv). For demineralization, temperature varied from
200 C to 40°C, concentration ranged from 0.5N to 2.5N, and extraction time from
2 to 10 h. For deproteinization, temperatures varied from 4SoC to 8SoC,
concentration NaOH from 1 % to 5%, and extraction time from 2 to 10 h. The
coded levels of -2, -1. 0, + 1, and + 2 used in the four factor CCRD (Table 6)
were obtained from Box et al, (1978) and values of coded levels of variables used
in the experimental design are shown in Tables 7 and 8 for demineralization and
deproteinization respectively. The total number of experimental runs
determined from this design was 20. Duplicate measurements were taken for
each experimental fun. On completion of the extraction processes, ash and erude
protein contents were determined as outlined in 3.9 and 3.8, respectively.
3.8 Nitrogen determination
Nitrogen contents of the shells were determined by the Kjeldahl method
(A.O.A.C., 1980). AlI analysis were done in duplieate. Crude protein was
determined by multiplying total nitrogen by a factor of 6.25.
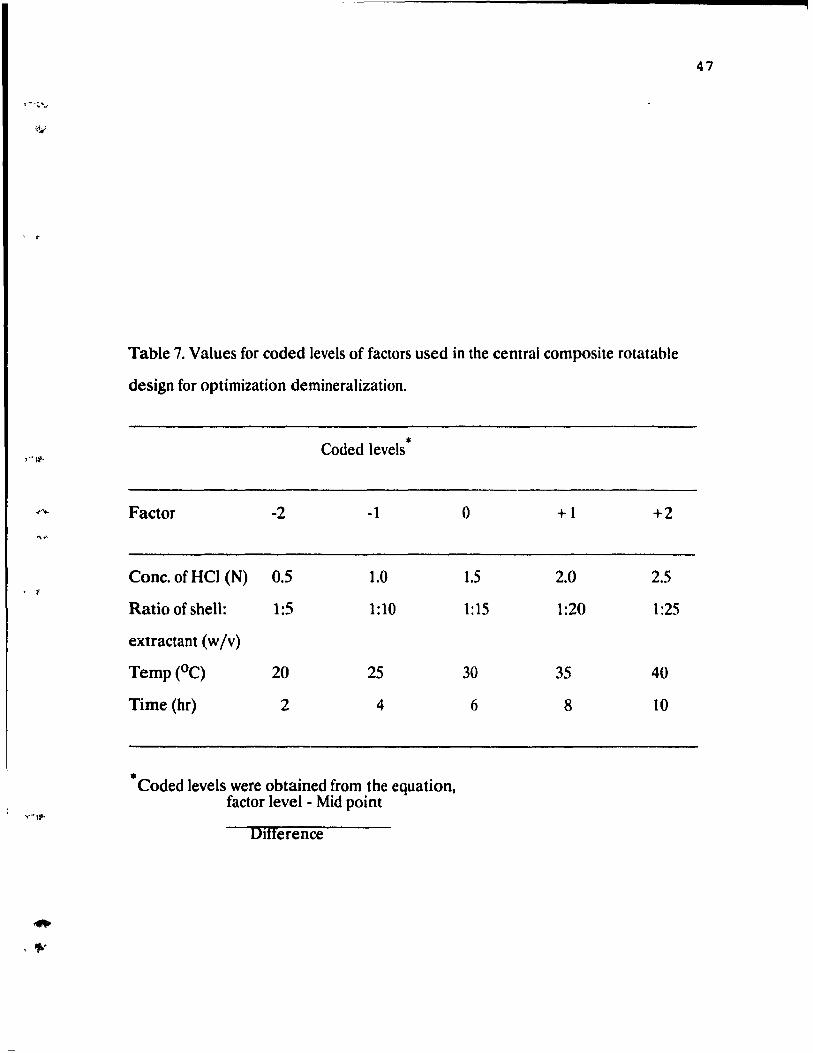
'-';'''\ ..
, t
-<,'''-
"'"
< v
, ,..
Table 7. Values for coded levels of factors used in the central composite rotatable
design for optimization demineralization.
Coded levels *
Factor -2 -1 0 +1 +2
Cone. of HCl (N) 0.5 1.0 1.5 2.0 2.5
Ratio of shen: 1:5 1:10 1:15 1:20 1:25
extractant (w Iv)
Temp(OC) 20 25 30 35 40
Time (hr) 2 4 6 8 10
* . Coded levels were obtamed from the equation, factor level - Mid point
Difference
47
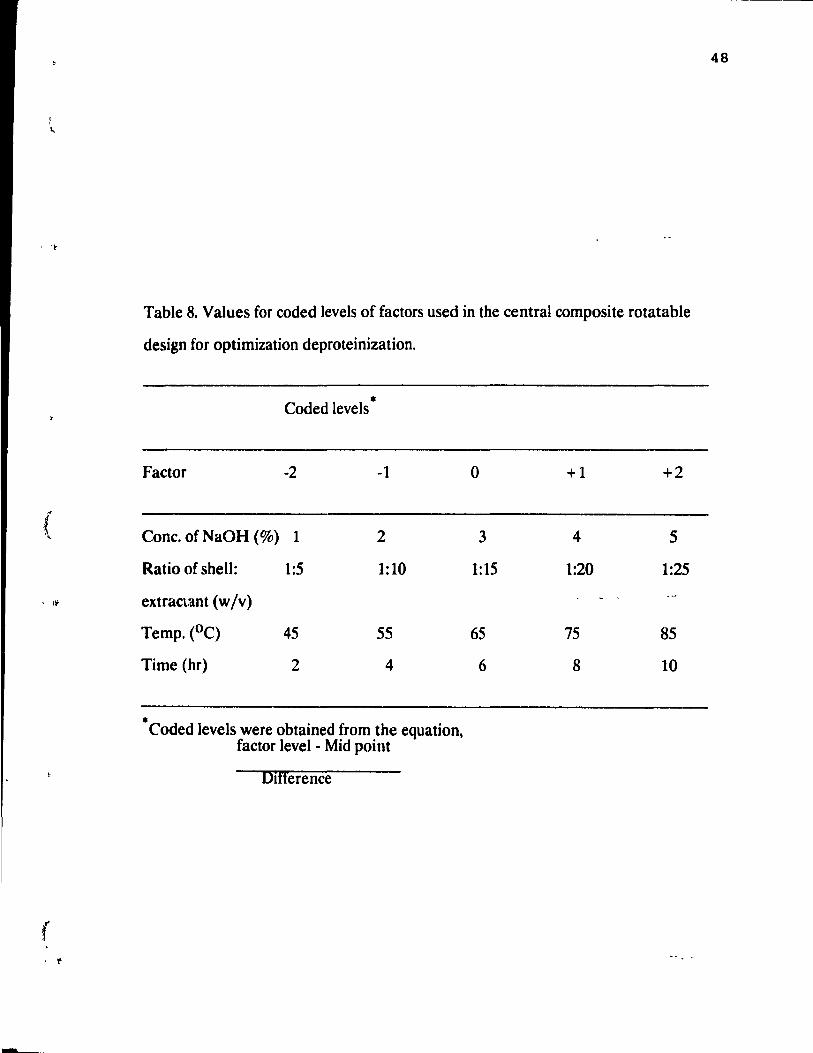
, I~
{ "
, If
f • f
Table 8. Values for coded levels of factors used in the central composite rotatable
design for optimization deproteinization.
Coded levels *
Factor -2 -1 0 +1 +2
Conc. of NaOH (%) 1 2 3 4 5
Ratio of shell: 1:5 1:10 1:15 1:20 1:25
extracumt (w/v)
Temp. (oC) 45 55 65 75 85
Time (hr) 2 4 6 8 10
* Coded levels were obtained from the equation, factor level - Mid point
Difference
48
49
3.9 Ash determination
Ash content was determined using standard methods (A.a.A.c., 1980). A
crucible was weighed and ignited for 30 min at 600°C. ft was then cooled and
transferred into a dessicator with the aid of tongs for 15 - 20 min and reweighed
accurately. Approximately 2g of the vacuum dried sample were transferred into
the crucible and the sam pie was pre-ashed in a fume hood. When the !lumple
ceased giving off smoke, it was placed in a preheated 6000C muffle furnace for 6
h. When ashing was complete the crucible was transferred directly into a
dessicator, cooled and weighed.
0/0 Ash was calculated from equation 4:
0/0 ash = wt of ash x 100% [4]
wt of sample
3.10 Viscosity and molecular wei~ht determination
Viscosityand molecular weight of laboratory prepared chitin and chitosan
were compared to that of commercial chi tin and chitosan obtained from Sigma
(Sigma Chemical Company Ltd, St Louis, MO, USA). The viscosity of various
concentrations of the sample in 5% LiCI-dimethylacetamide solutions were
measured with a Brookfield viscometer (L VF model, Brookfield Engineering
Laboratory, Mass., USA) at room temperature using a dise spindle (No. 3). Each
sample solution was transferred to the sample cham ber of the ~mall !lample
adapter (SC-4) and the torque required to rotate the spindle at a constant ~peed
(30 rpm) was recorded.
(
, .~
(
• III'
.( .\
50
Molecular weight determination was done according to the method of
Shimahara and Takiguchi (1988) and is based on viscometry. LiC) was dissolved
in N,N-dimethylacetamide to a concentration of 5%. About 0.2 - 1.0g of dried
chitin powder (100 - 200 mesh) were weighed and dissolved in the
dimethylacetamide solution to prepare chitin solutions of vanous
concentrations. Viscosity of each solution was measured at 300 C with a
Brookfield viscometer (L VF model). Intrinsic viscosity was determined
graphically by plotting the viscosity data against concentration and extrapolation
to the intercept at zero concentration. The molecular weight of chi tin was
calculated from equation 5:
(fi) = 8.93 x 1O-4M 0.71 [5]
where ~ is the intrinsic viscosity.
3.11 Determination of water holding capacity
Water holding capacity of laboratory prepared chitin and chitosan were
compared to those of commercial chitin and chitosan (Sigma Chemical
company). The water absorption characteristics of chitin and chitosan were
determined by the method of Sosulski (1962). Excess water (20 - 30ml) was
added to the sample (1.5g) in weighed centrifuge tubes (radius, 1.2cm). The
suspension wa~ thoroughly mixed by shaking vigorously for 4 times with 10 min
rest period between each mixing. The suspension was then centrifuged at 730g
(JA-20, 220 C) for 25 mins after which the supernatant was decanted and the
tube air-dried for 10 min until no residual liquid could be seen. Water
absorption was expressed in percentage as the amount of water absorbed by
lOOg sample.
,-""
51
3.12 Statistical analysis
The data were subjected to analysis of variance. Mean separation wu!.
accomplished by the use of Duncan's New Multiple Range test (Steel ami
Torrie, 1980). Regression coefficients and correlation coefficients werc a1so
computed using the Statistical Analysis System (SAS, 1982), on a McGiII
University mainframe. The 3 dimensionai response surface graph!. and 2
dimensional contour plots were done using an Splus package on an Sparc Sun
Station Unix machine.
, l'
L
4.1
size
CHAPTER FOUR
RESULTS AND DISCUSSION
52
Extractability of chitin from crustacean shells with respect to particle
The extraetability of chitin from crustacean solid wastt.s was investigated
by using a completely randornized design. In this experiment, lobster, crab and
shrimp solid wastes were used. Fig. 4 shows the effect of partic1e size and type of
crustacean solid waste on the yield of chi tin extraction. The results show that,
the extractibility of chi tin with respect to particle size varies with the type of
crustaeea. Among the three crustaceans used, analysis of variance revealed that
partic1e size had a significant effeet on chi tin extractibility in lobskr and erab
chitin yield (Appendix A and B). There were significant differences between the
means of the ehitin yields. Analysis with the Duncan's new multiple range test
revealed signifieant differenees between the me ans of chitin yields of lobster
between particle sizes 2.0mm and 1.0mm, and also between 1. 7mm and 1.0mm
with yield of ehitin at particJe size 2.0mm being the highest. With the yield of
crab chitin with respect to particle size, analysis of variance (Appendix B) also
showed significant differences between the Mean yields of chitin extraciion from
the various particle sizes al 0.01 level. Duncan's new multiple range lest located
differences between the means of the yields at particle sizes of 2.0mm and
1.7mm, 2.0mm and 1.0mm 1.41mm and 1.7mm, and 1.41mm and l.Omm. with
Mean yield at particle size of 2.0mm being the highest. On the other hand, a
different pattern was observed with extractability of chitin from shrimp waste at
the various particle sizes. Analysis of variance (Appendix C) showed that there
were no significant differenees between the me ans of the yields of chi tin at aIl
the various particle sizes. This observation has also been observed with crawfish
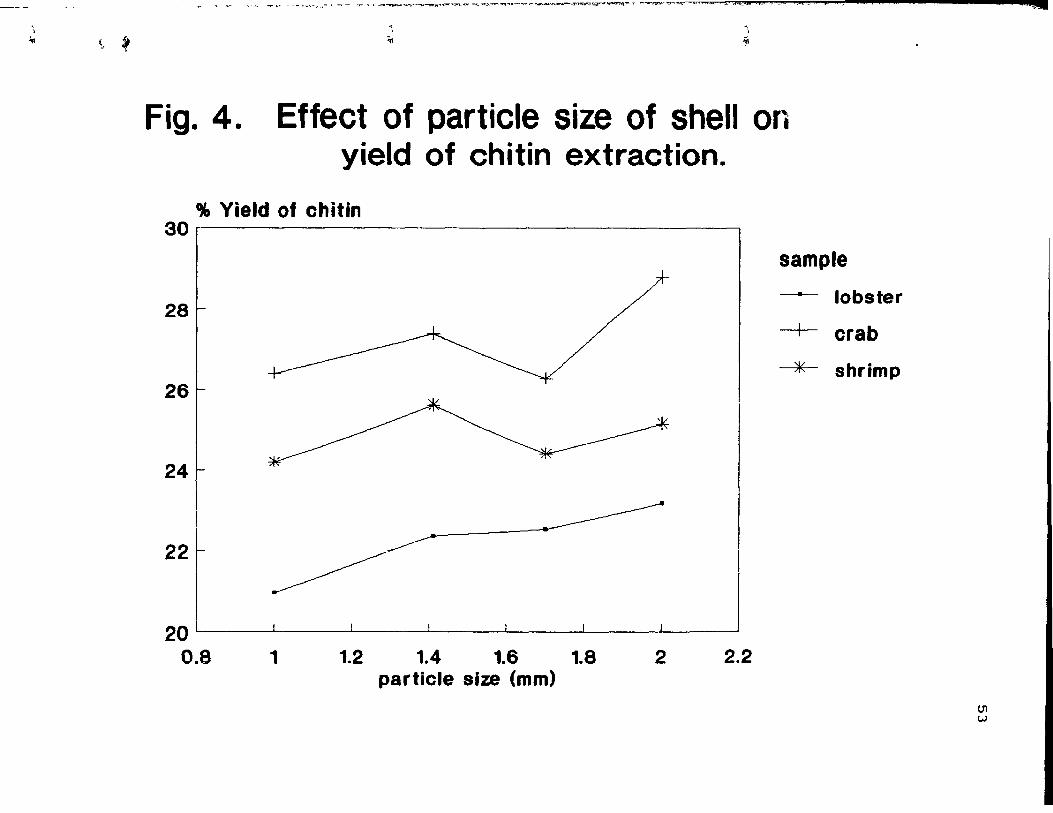
~ \ ... "_ ....... ;.~-- .... " .. ~,-<-. ..... ~ _J"",~_"",_~""_--;~~_""""~,,,,,,,,,,,,-~,,,,,,,,",,,,,,,,,,,,,--,,,~,,,,,_,,,,,,,,_-""'l'~""~~-tt-"t" ""'''''~'4l! AYJiN
'" ,
1
'ÎI
Fig. 4. Effect of particle size of shell Of. yield of chitin extraction.
% Yield of chitin 30~, --------------------------------------~
sample
28 -------- lobster
-+- crab
---*- shrimp 26
24
22 ~~
20 L-I --~--~--~----'------'
0.8 1 1.2 1.4 1.6 1.8 2 2.2 particle size (mm)
111 w
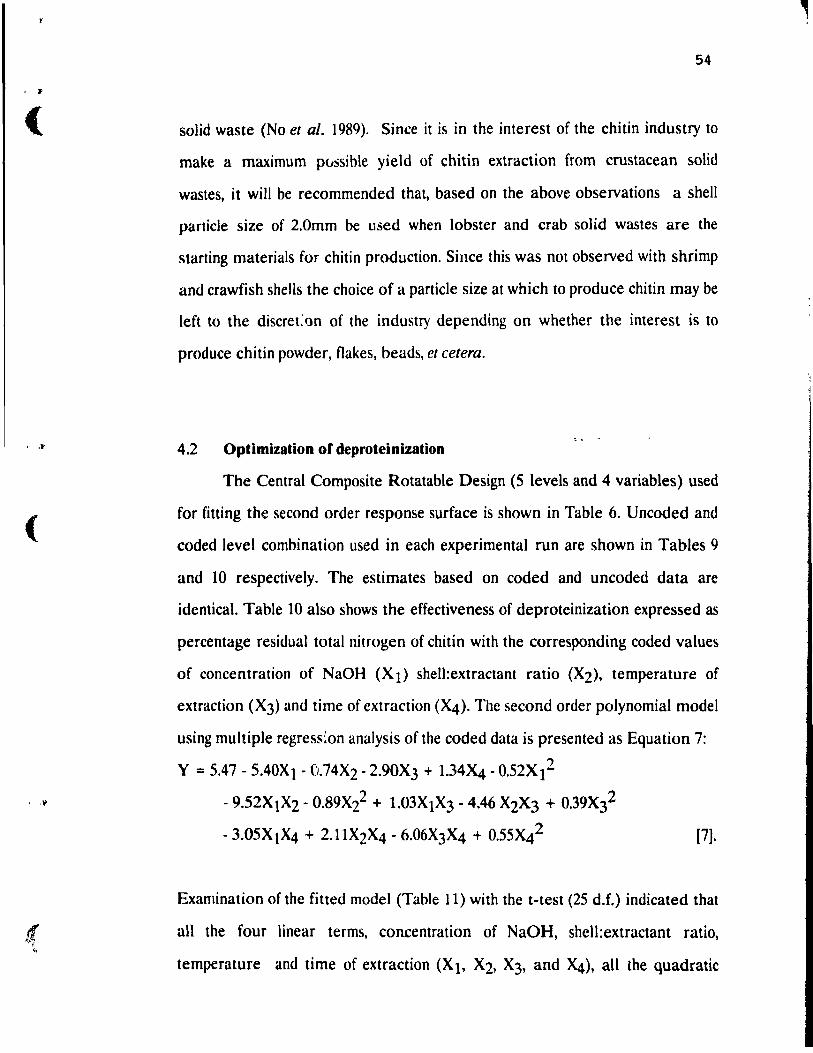
, If
(
•• f'
(
•• V'
54
solid waste (No et al. 1989). Since it is in the interest of the chitin industry to
make a maximum pvssible yield of chitin extraction from crustace an solid
wastes, it will be recommended that, based on the above observations a shell
partide size of 2.0mm be used when lobster and crab solid wastes are the
starting materials for chitin production. Since this was not observed with shrimp
and crawfish shells the choice of a particle size at which to produce chitin may be
left to the discret:()n of the industry depending on whether the interest is to
produce chi tin powder, flakes, beads, et cetera.
4.2 Optimization of deproteinization
The Central Composite Rotatable Design (5 levels and 4 variables) used
for fitting the second order response surface is shown in Table 6. Uncoded and
coded level combination used in each experimental run are shown in Tables 9
and 10 respectively. The estimates based on coded and uncoded data are
identical. Table 10 also shows the effectiveness of deproteinization expressed as
percentage residual total nitrogen of chitin with the corresponding coded values
of concentration of NaOH (X 1) shell:extractant ratio (X2), temperature of
extraction (X3) and time of extraction (~). The second order polynomial model
using multiple regress~on analysis of the coded data is presented as Equation 7:
y = 5.47 - 5.40X 1 - Ü.74X2 - 2.90X3 + 1.34'4 - O.52X 12
- 9.52XIX2 - 0.89Xl + 1.03X1X3 - 4.46 X2X3 + 0.39X32
[7J.
Examination of the fitted model (Table Il) with the t-test (25 d.f.) indicated that
aU the four linear terms. concentration of NaOH, shell:extractant ratio,
temperature and time of extraction (X h X2, X3, and ~), aU the quadratic
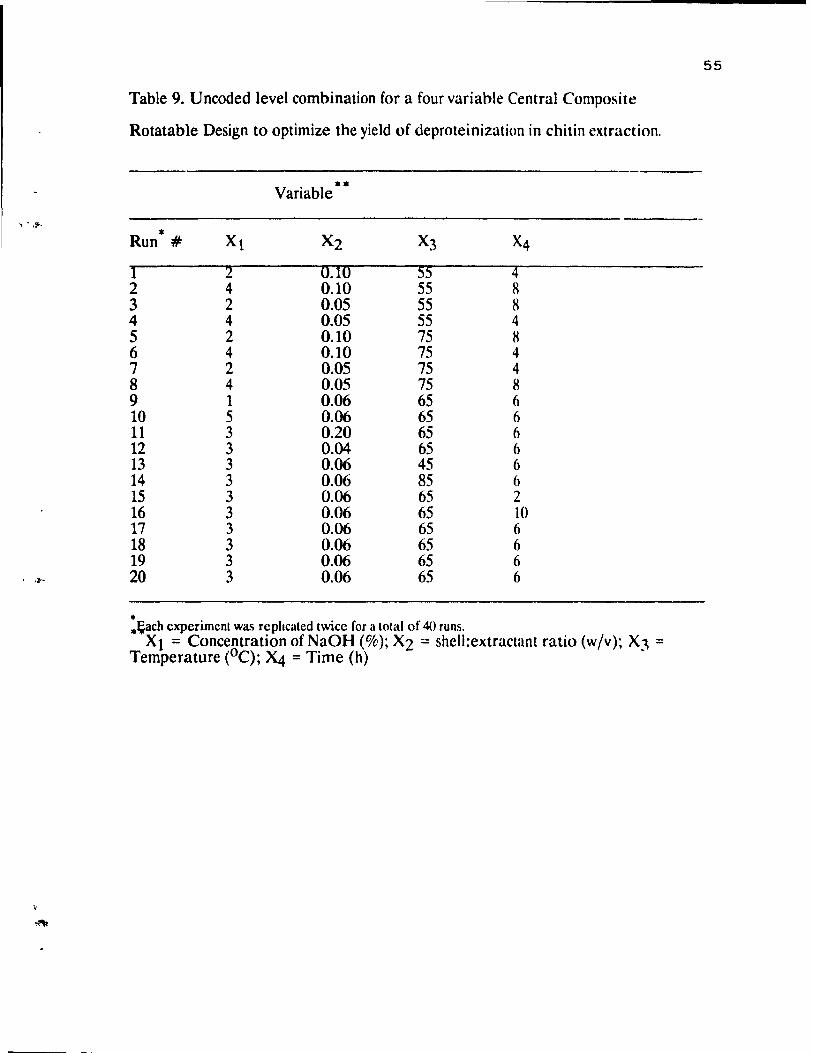
y ~ ,,,....
, .lI'-
Table 9. Uncoded level combination for a four variable Central Composite
Rotatable Design to optimize the yield of deproteinization in chitin extraction .
•• Variable
Run • # Xl X2 X3 X4
1 2 0.10 55 4 2 4 0.10 55 8 3 2 0.05 55 8 4 4 0.05 55 4 5 2 0.10 75 8 6 4 0.10 75 4 7 2 0.05 75 4 8 4 0.05 75 8 9 l 0.06 65 6 10 5 0.06 65 6 11 3 0.20 65 6 12 3 0.04 65 6 13 3 0.06 45 6 14 3 0.06 85 6 15 3 0.06 65 2 16 3 0.06 65 10 17 3 0.06 65 6 18 3 0.06 65 6 19 3 0.06 65 6 20 3 0.06 65 6
• • I;ach experiment was rephcated twicc for a total of 40 runs. Xl = Concentration of NaOH (%); X2 == shell:extractant ratio (wjv); X~ =
Temperature (oC); '4 = Time (h) .
55
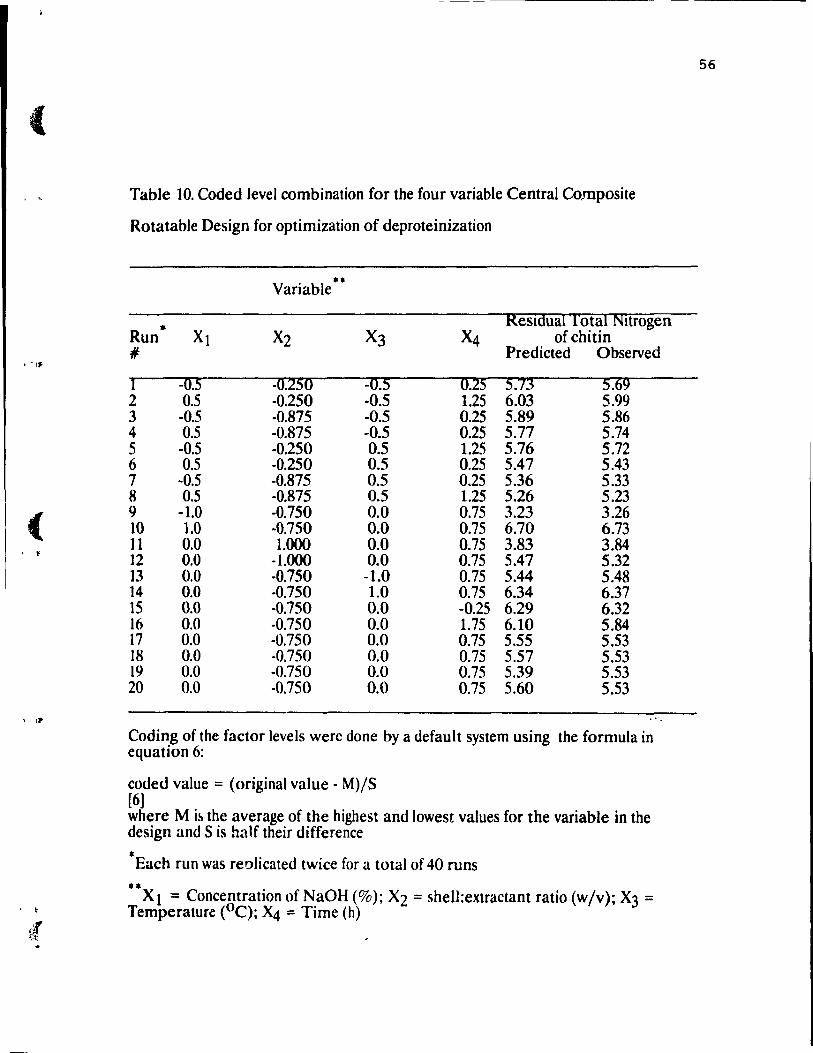
(
• "1'
( ,
, II'
t
;( ','
Table JO. Coded level combination for the four variable Central Composite
Rotatable Design for optimization of deproteinization
Variable --• Resldual Total Nltrogen
Run Xl X2 X3 J4 of chitin Il Predicted Observed
1 -0.5 -0.250 -0.5 0.25 5.73 5.69 2 0.5 -0.250 -0.5 1.25 6.03 5.99 3 -0.5 -0.875 -0.5 0.25 5.89 5.86 4 0.5 -0.875 -0.5 0.25 5.77 5.74 5 -0.5 -0.250 0.5 1.25 5.76 5.72 6 0.5 -0.250 0.5 0.25 5.47 5.43 7 -0.5 -0.875 0.5 0.25 5.36 5.33 8 0.5 -0.875 0.5 1.25 5.26 5.23 9 -1.0 -0.750 0.0 0.75 3.23 3.26 10 1.0 -0.750 0.0 0.75 6.70 6.73 11 0.0 1.000 0.0 0.75 3.83 3.84 12 0.0 -1.000 0.0 0.75 5.47 5.32 13 0.0 -0.750 -1.0 0.75 5.44 5.48 14 0.0 -0.750 1.0 0.75 6.34 6.37 15 0.0 -0.750 0.0 -0.25 6.29 6.32 16 0.0 -0.750 0.0 1.75 6.10 5.84 17 0.0 -0.750 0.0 0.75 5.55 5.53 18 0.0 -0.750 0.0 0.75 5.57 5.53 19 0.0 -0.750 0.0 0.75 5.39 5.53 20 0.0 -0.750 0.0 0.75 5.60 5.53
Coding of the factor levels were done by a default system using the formula in equation 6:
coded value = (original value - M)jS [6] where M i!l the average of the highest and lowest values for the variable in the design and S is half their difference
-Each run was reolicated twice for a total of 40 runs
.. X 1 = Concentration of NaOH (%); X2 = shell:extractant ratio (w/v); X3 = Temperature (oC); X4 = Time (h)
56
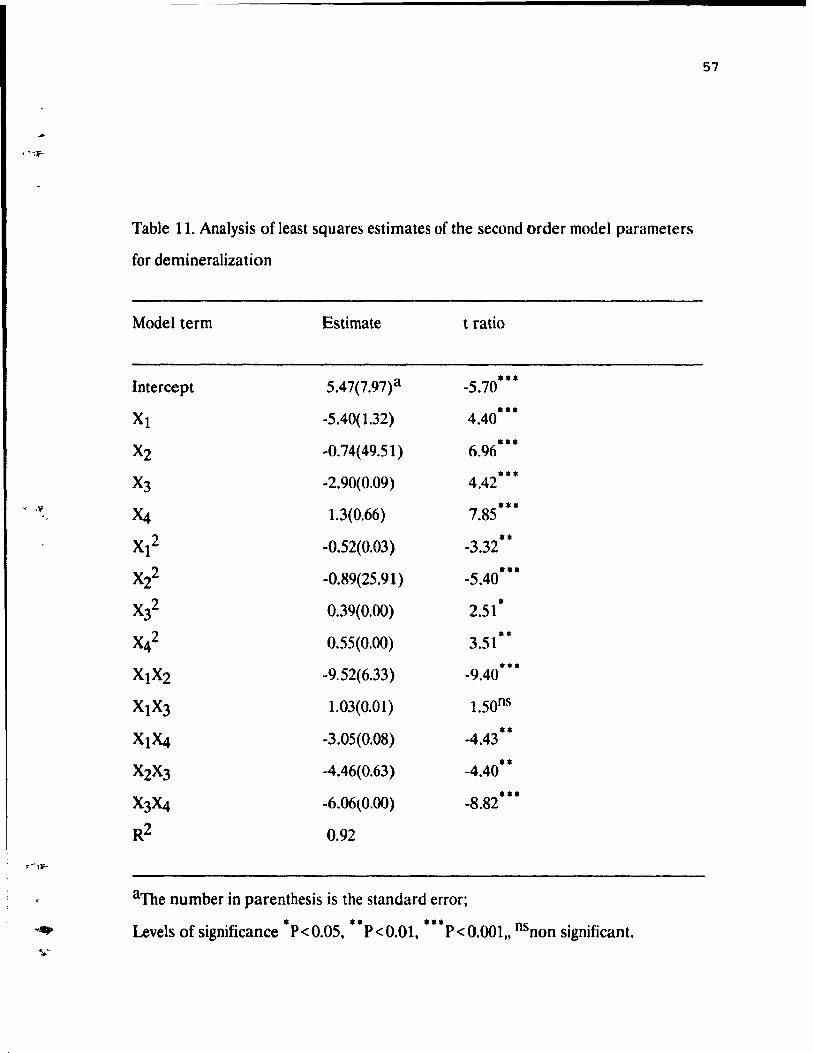
< .i' .
,- li-
....,. .. ' ,.
Table 11. Analysis of least squares estimates of the second order model parameters
for demineralization
Model term Estimate t ratio
Intercept 5.47(7.97)a -5.70"*
Xl -5.40( 1.32) 4.40 ***
X2 -O. 74( 49.51) *** 6.96
X3 -2.90(0.09) 4.42 .**
~ 1.3(0.66) 7.85 ***
X12 -0.52(0.03) -3.32 *.
X22 -0.89(25.91) -5.40 ***
X32 0.39(0.00) 2.51 *
~2 0.55(0.00) .*
3.51
XIX2 ~9.52(6.33) .** -9.40
XIX3 1.03(0.01) 1.50ns
X1~ -3.05(0.08) -4.43 **
X2X3 -4.46(0.63) -4.40 **
X3X4 -6.06(0,00) -8.82 .*.
R2 0.92
aThe number in parenthesis is the standard error;
1 f'T * .... * ns . Leve S 0 slgm lcance P<0.05, P<O.Ol, P<O.OOl" non sigmficant.
57
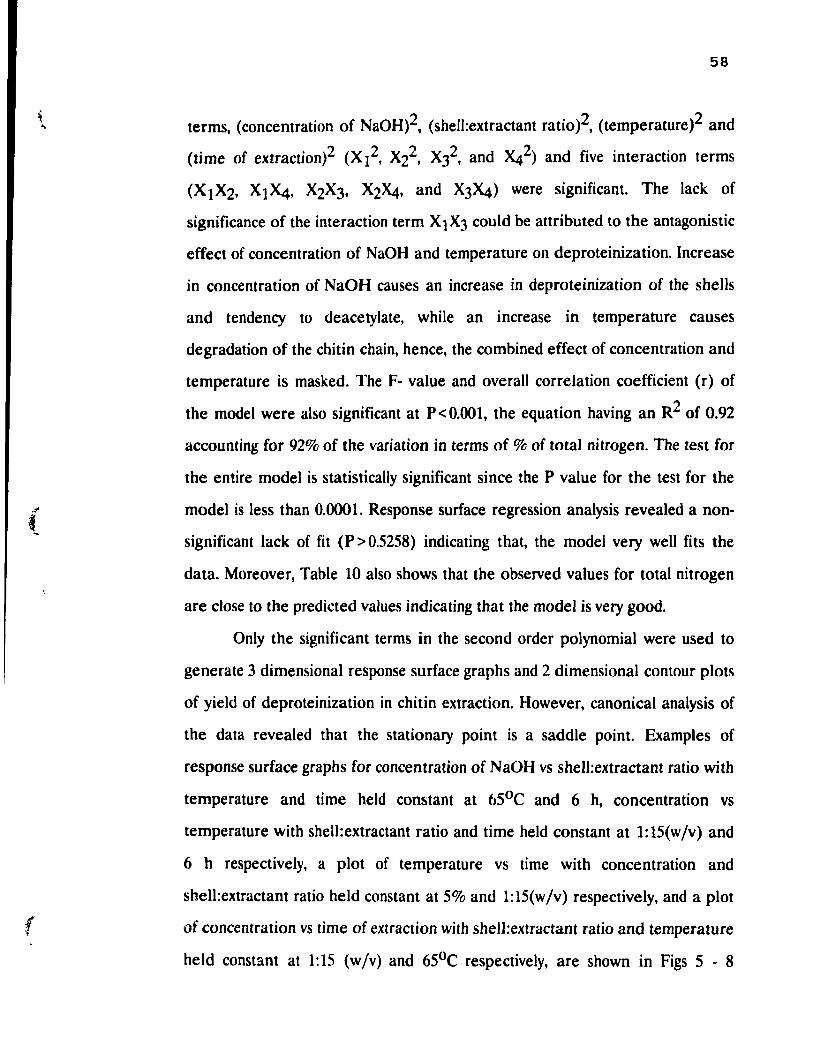
(
f
58
terms, (concentration of NaOH)2, (shell:extractant ratio)2, (temperature)2 and
(time of extraction)2 (X 12, X22, X32, and X42) and five interaction terms
(X1X2, X1'4, X2X3, X2X4, and X3'4) were significant. The lack of
significance of the interaction term X 1 X 3 could be attributed to the antagonistic
effect of concentration of NaOH and tempe rature on deproteinization. Increase
in concentration of NaOH causes an increase in deproteinization of the shells
and tendency to deacetylate. while an increase in temperature causes
degradation of the chitin chain, hence, the combined effect of concentration and
temperature is masked. The F- value and ove raIl correlation coefficient (r) of
the model were also significant at P<O.OOl, the equation having an R2 of 0.92
accounting for 92% of the variation in terms of % of total nitrogen. The test for
the entire model is statisticaIly significant since the P value for the test for the
model is less than 0.0001. Response surface regression analysis revealed a non
significant lack of fit (P> 0.5258) indicating that, the model very weIl fits the
data. Moreover, Table 10 also shows that the observed values for total nitrogen
are close to the predicted values indicating that the model is very good.
Only the significant terms in the second order polynomial were used to
generate 3 dimensional response surface graphs and 2 dimensional contour plots
of yield of deproteinization in chi tin extraction. However, canonical analysis of
the data revealed that the stationary point is a saddle point. Examples of
response surface graphs for concentration of NaOH vs shell:extractant ratio with
tempe rature and time held constant at 6SoC and 6 h, concentration vs
temperature with shell:extractant ratio and time held constant at 1:15(w/v) and
6 h respectively, a plot of tempe rature vs time with concentration and
shell:extractant ratio he Id constant at 5% and 1:15(wjv) respectively, and a plot
of concentration vs time of extraction with shell:extractant ratio and ternperature
he Id constant at 1:15 (wjv) and 6SoC respectively, are shown in Figs S - 8
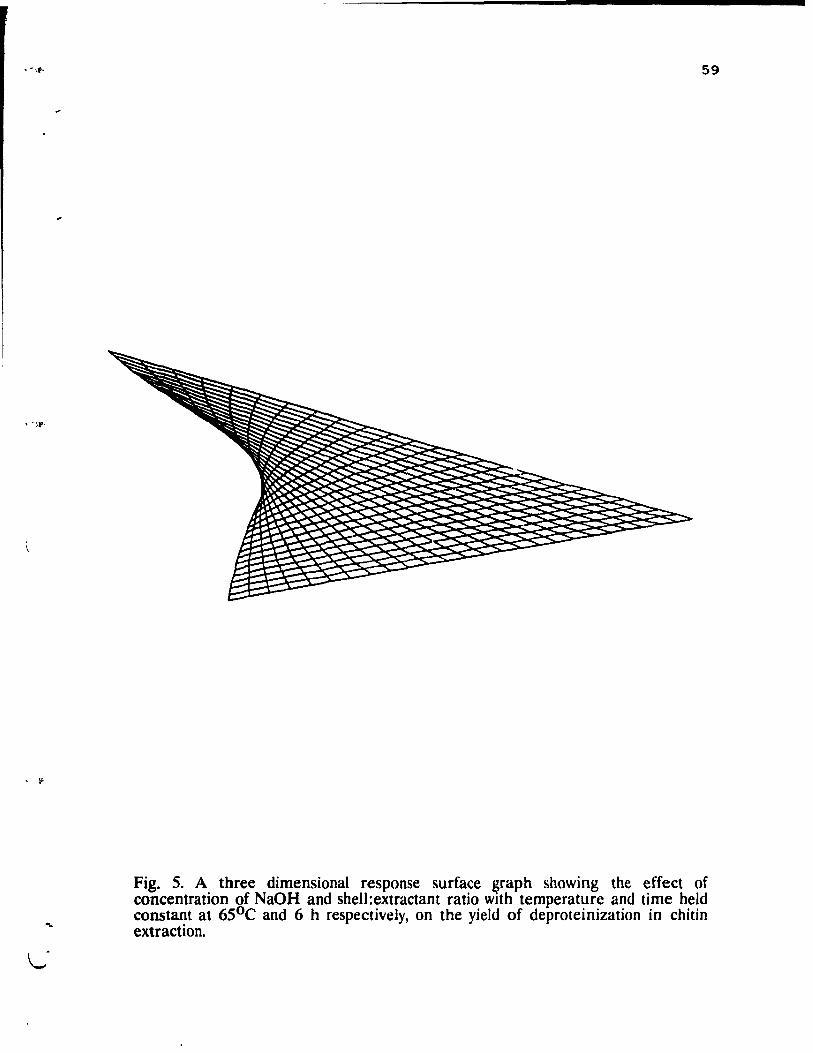
, IF
59
Fig. 5. A three dimensional response surface ~raph showing the effect of concentration of NaOH and shell:extractant ratio wlth temperature and time held constant at 65°C and 6 h respectively, on the yield of deproteinization in chi tin extraction.
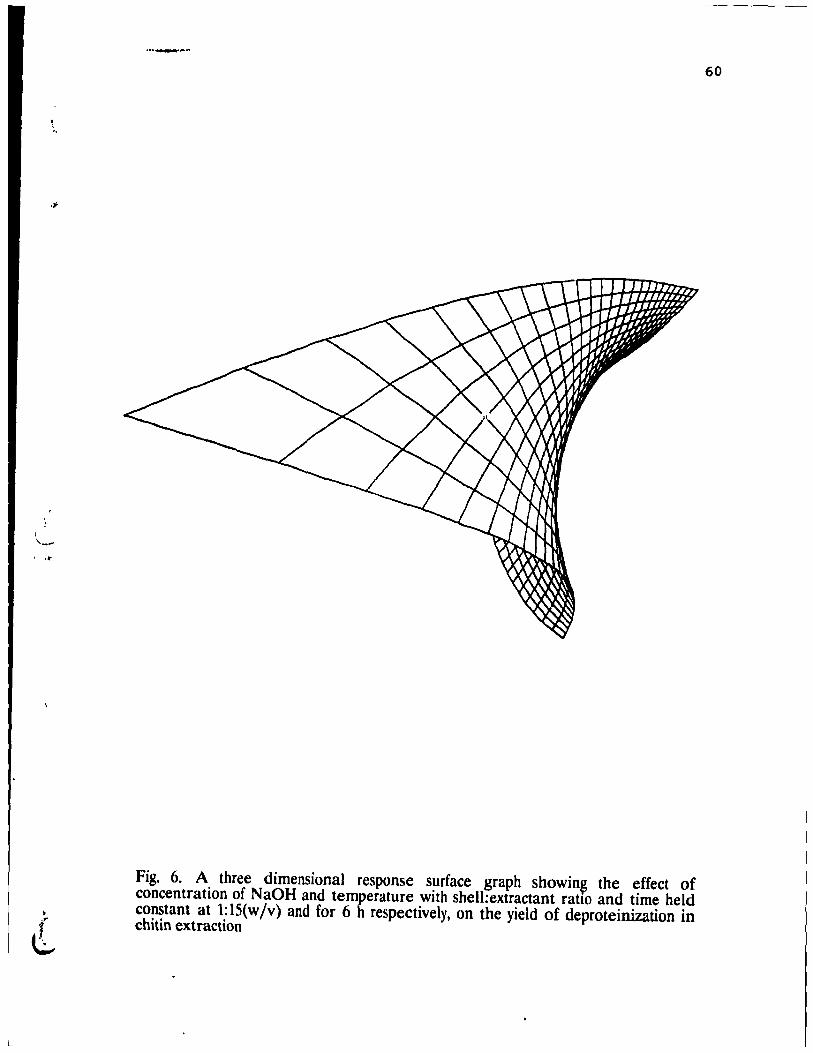
L
. \
"
.li
, .Ir-
· ..................
Fig. 6. A three dimensional response surface graph showin~ the effect of concentration of NaOH and temperature with shell:extractant ratIO and time held constant at 1:15(w/v) and for 6 h respectively, on the yield of deproteinization in chitin extraction
60
· ,;.
, .1
61
Fig. 7. A three dimensional response surface graph showing the effect of temperature and time with concentration of NaOH and shell:extractant ratio held constant al 5% and 1: 15(wjv) respectively, on the yield of deproteinization in chitin extraction
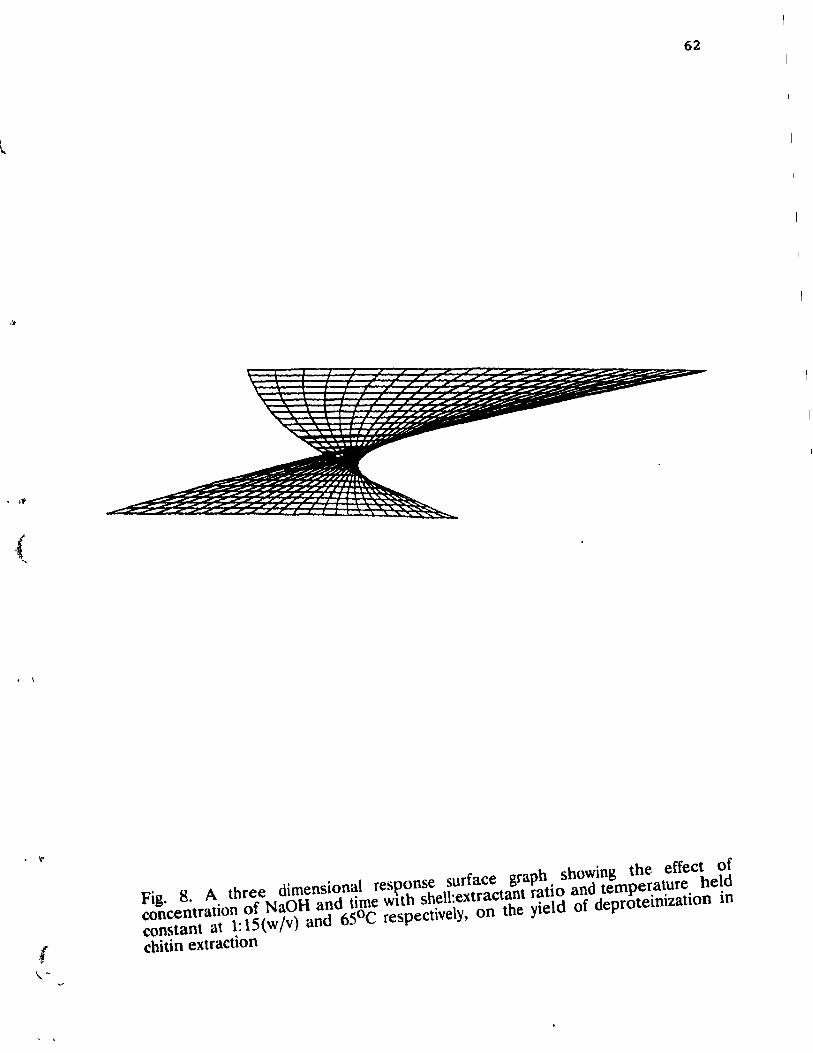
. ,~
, ,),0
(
. \
62
Fig. 8. A three dimensional resl'0nse surface grapb sbowing tbe effect of concentration of NaOH and time wltb sbell:extractant ratio and temperature beld constant at 1:15(w/v) and 6SoC respectively, on the yield of deproteinization in
chitin extraction
, li'
'--If-
, .
, .~
63
respectively. As these figures illustrate, an increase in concentration with an
increase in time and temperature with a relatively low shell:extractant ratio
resulted in improved degree of deproteinization of crustaeean shells. While
these graphs can assist the researcher to determine the direction to takc to
increase a desired response, it i~ difficult to specify leveb of variahle!\ to give a
specifie yield from such graphs. This ean more readily he achieved from contour
plots of the same variables which are shown in Figs 9 - 12 respectively. By
referring to such plots, levels of factors can he ~elected to maximize the
effectiveness of deprote, .. ization and assist the chitin producer in producing a
chitin product with the desired %total nitrogen. With these example!l in which
the estimated surface does not have a unique optimum. a ridge analysi~ was also
performed to determine the region in wUch the optimum Iie~. and to indicate
the direction in which further experimentation should he performed. Table 12
shows the estimated ridge of maximum response for the variolls factor~. Ridge
analysis indicates that maximum yields will result from rehttively low
concentrations of approximately 1.75%, a relatively low shell:extractant ratio of
hetween 1:6 and 1:7(w Iv), a relatively moderate tempe rature of ahout 5SoC. and
reaction limes of about 5 1/2 hours. It b noted from the analY!lis of variance for
the model that aH the factors are highly significant. If further experimentatioin i~
undertaken, it :night he best to fix ail factor~ at their critical values and to
concentrate on the effect of eaeh factor.
4.3 Optimization of demineralization
The Central Composite Rotatable Design (5 levels and 4 variables) used
for fitting the second order response surface is shown in Table 6. U ncoded and
coded level combination used in each experimental run are shown in Tables 13
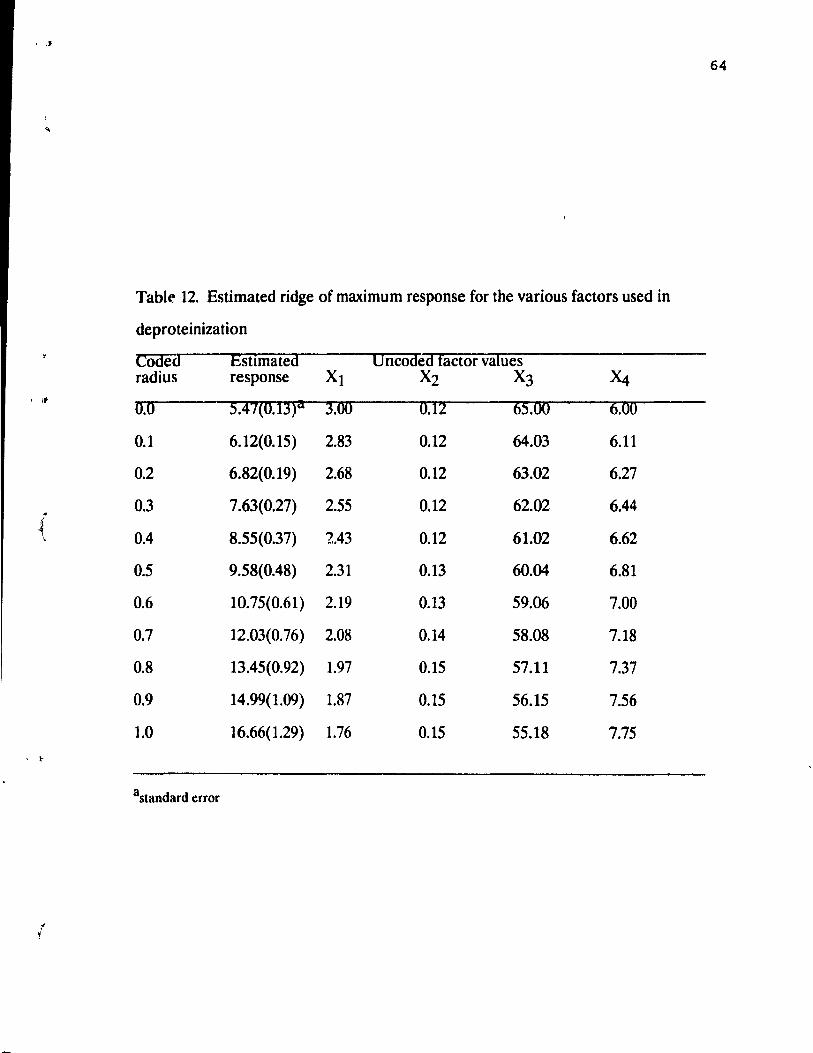
, ,f
64
Table 12. Estimated ridge of maximum response for the various factors used in
deproteinization
COOëd Estlmated Oncoded factor values radius response Xl X2 X3 J4
, 1. 0.0 5.47(0.13)21 3.00 0.12 65.00 6.00
0.1 6.12(0.15) 2.83 0.12 64.03 6.11
0.2 6.82(0.19) 2.68 0.12 63.02 6.27
0.3 7.63(0.27) 2.55 0.12 62.02 6.44 i l,. 0.4 8.55(0.37) 1..43 0.12 61.02 6.62
0.5 9.58(0.48) 2.31 0.13 60.04 6.81
0.6 10.75(0.61) 2.19 0.13 59.06 7.00
0.7 12.03(0.76) 2.08 0.14 58.08 7.18
0.8 13.45(0.92) 1.97 0.15 57.11 7.37
0.9 14.99(1.09) 1.87 0.15 56.15 7.56
1.0 16.66(1.29) 1.76 0.15 55.18 7.75 , ~
astandard error

Fig. 9. A two dimensional contour plot showing the levels of concentration of NaOH and shell:extractant ratio with temperature and time held constant at 6SoC and 6 h respectively, required to produce a deproteinization of 6.74% residual total nitrogen in chitin.
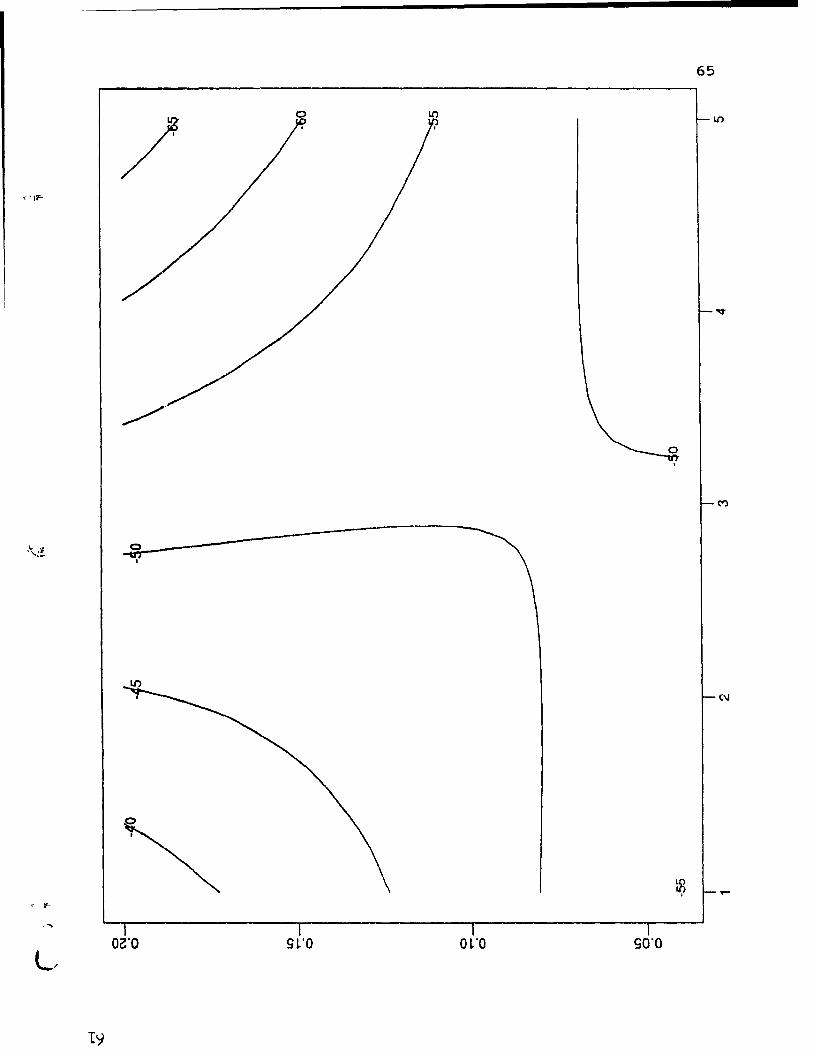
< lF-
OZ'O S~'O O~'O SO'O
Fig. 10. A two dimensional contour plot showing the levels of concentration of NaOH and temperature with shell:extractant ratio and time held constant at 1:15(w/v) and 6 h respectively, required to produce a deproteinization of 6.74% residual total nitrogen ID chitin.
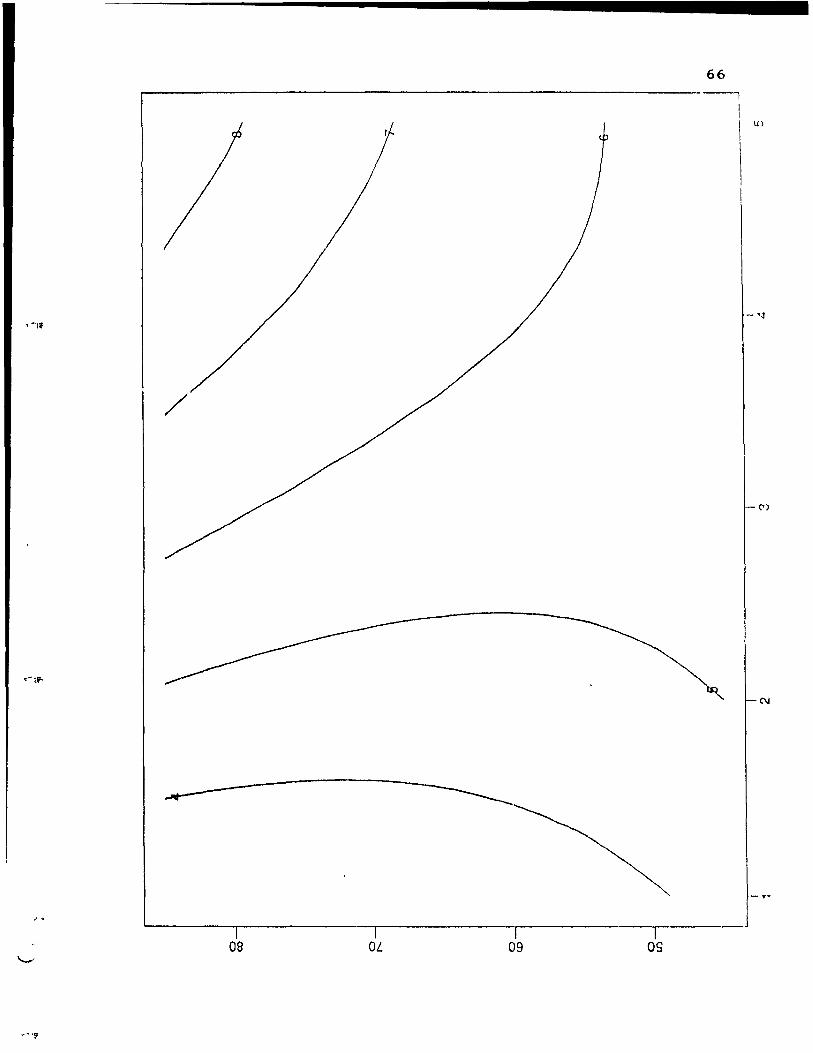
/
OB OL 1
09 1
OS
N
Fig. 11. A two dimensional contour plot showing the levels of tempe rature and time with concentration of NaOH and shell:extractant ratio he Id constant at 5% and ' , 1:15(w/v) respectively, required to produce a deproteinization of 6.74% residual , ) total mtrogen in chilin.
~)
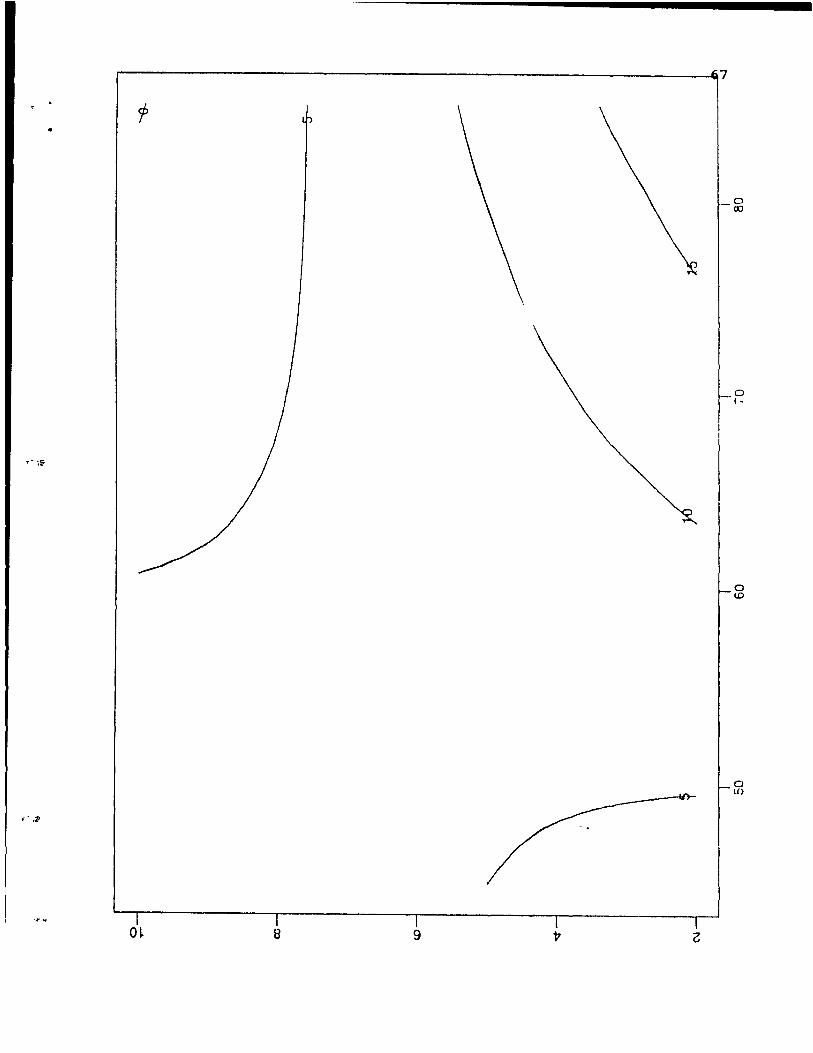
~----------------------------------------------------------------~7
•
O~ B 9
o CO
o r -
o ID
c) li)
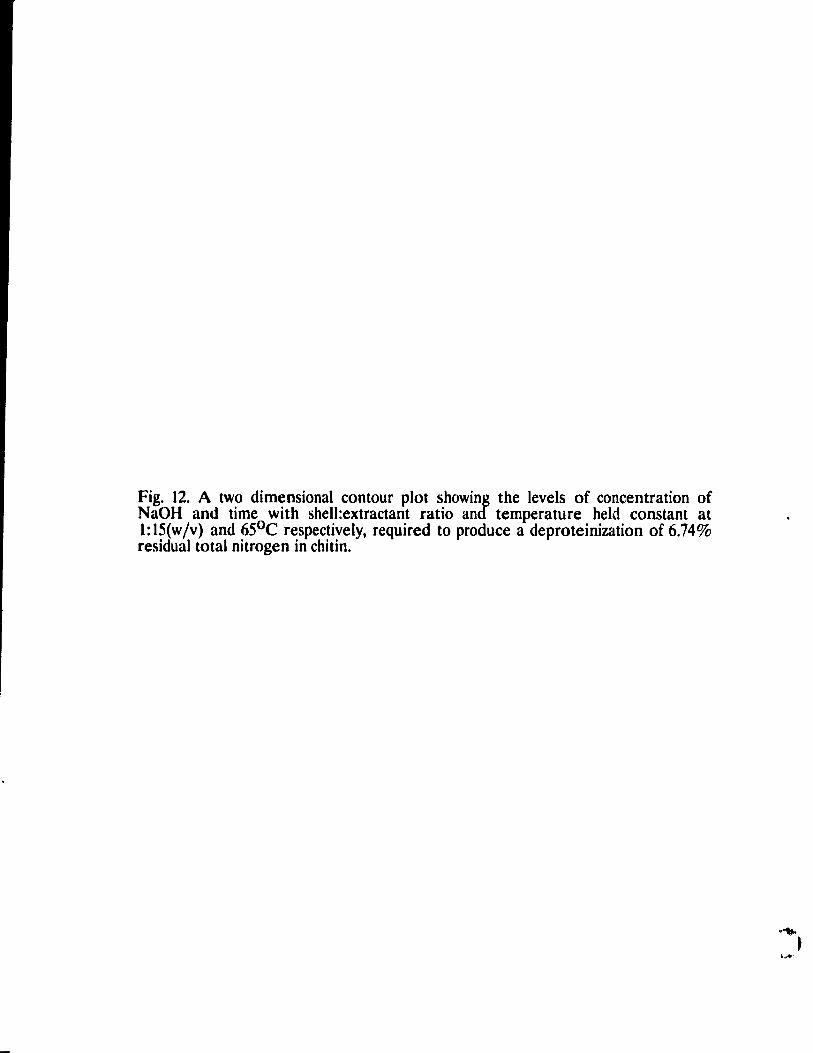
Fig. 12. A two dimensional contour plot showing the levels of concentration of NaOH and time with shell:extractant ratio and tempe rature he Id constant at 1:15(w/v) and 6SoC respectively, required to produce a deproteinization of 6.74% residual total nitrogen in chi tin.
1 .....
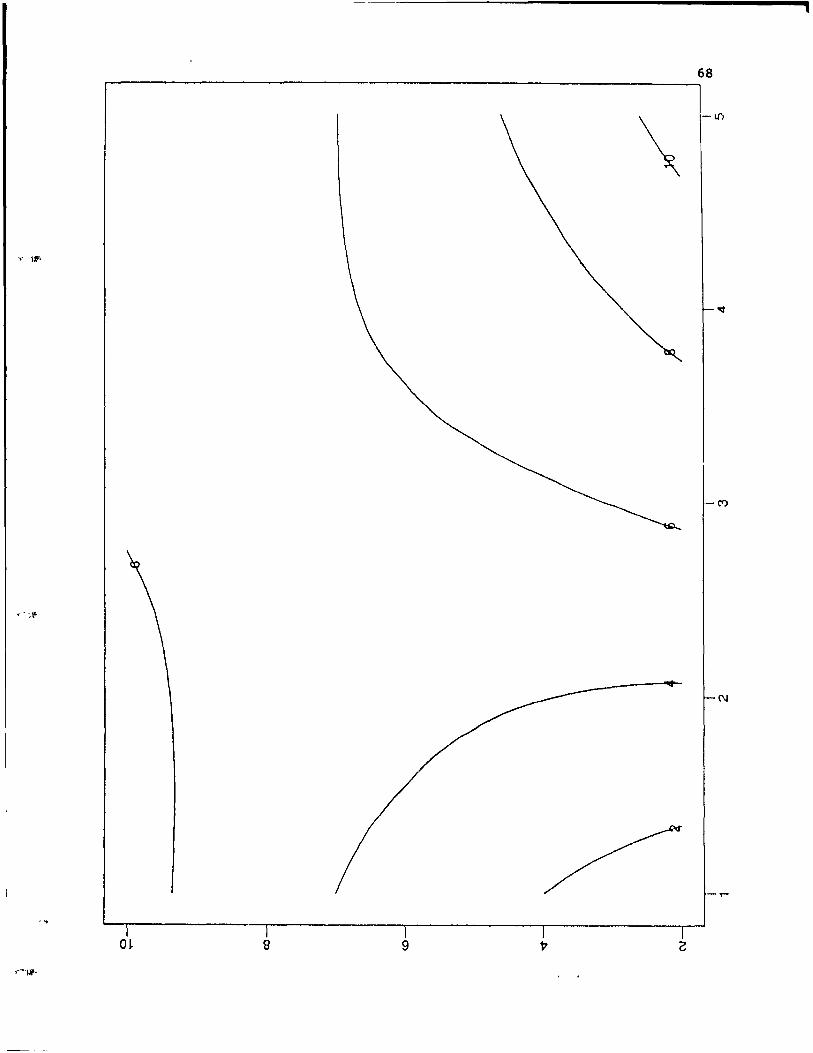
i
68
\ -ln
T IF
N
O~ 9 9
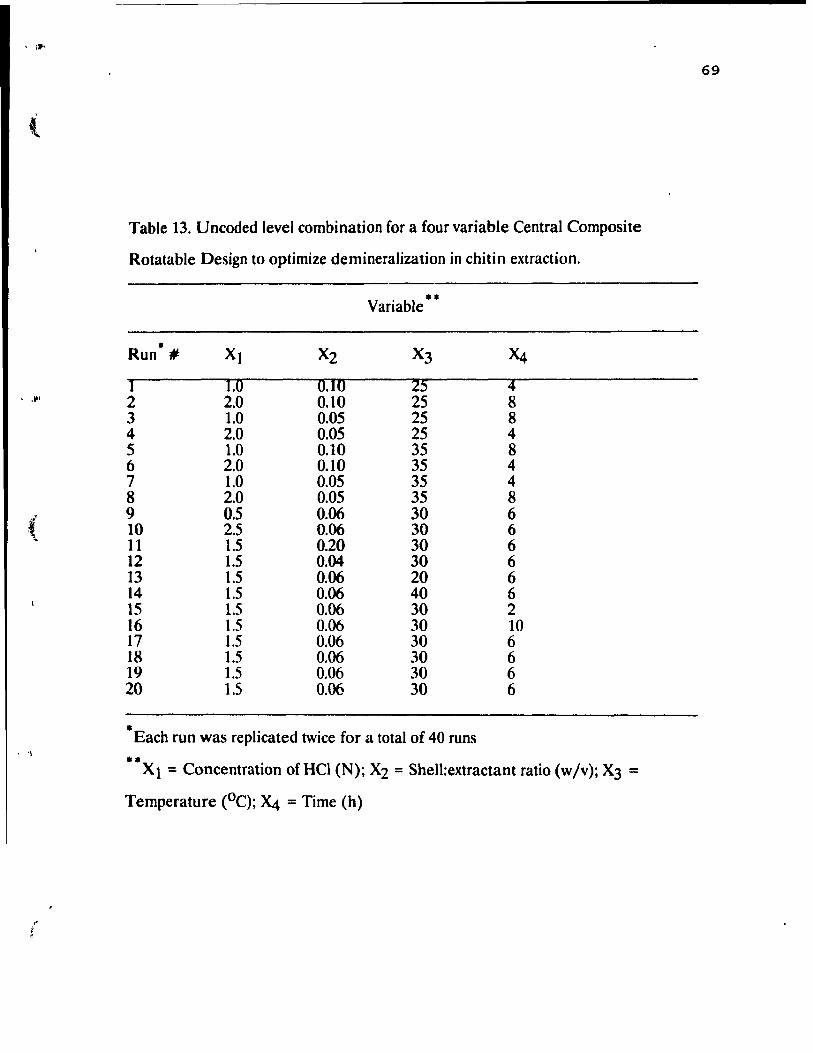
69
Table 13. Uncoded level combination for a four variable Central Composite
Rotatable Design to optimize demineralization in chitin extraction.
• •• Vanable
• Run Il Xl X2 X3 X4 l 1.0 0.10 25 4
1 .'1 2 2.0 0.10 25 8 3 1.0 0.05 25 8 4 2.0 0.05 25 4 5 1.0 0.10 35 8 6 2.0 0.10 35 4 7 1.0 0.05 35 4 8 2.0 0.05 35 8
( 9 0.5 0.06 30 6 10 2.5 0.06 30 6 11 1.5 0.20 30 6 12 1.5 0.04 30 6 13 1.5 0.06 20 6 14 1.5 0.06 40 6 15 1.5 0.06 30 2 16 1.5 0.06 30 10 17 1.5 0.06 30 6 18 1.5 0.06 30 6 19 1.5 0.06 30 6 20 1.5 0.06 30 6
• Each run was replicated twice for a total of 40 runs , 't
•• Xl = Concentration of HCI (N); X2 = Shell:extractant ratio (w Iv); X3 =
Temperature (oC); ~ = Time (h)
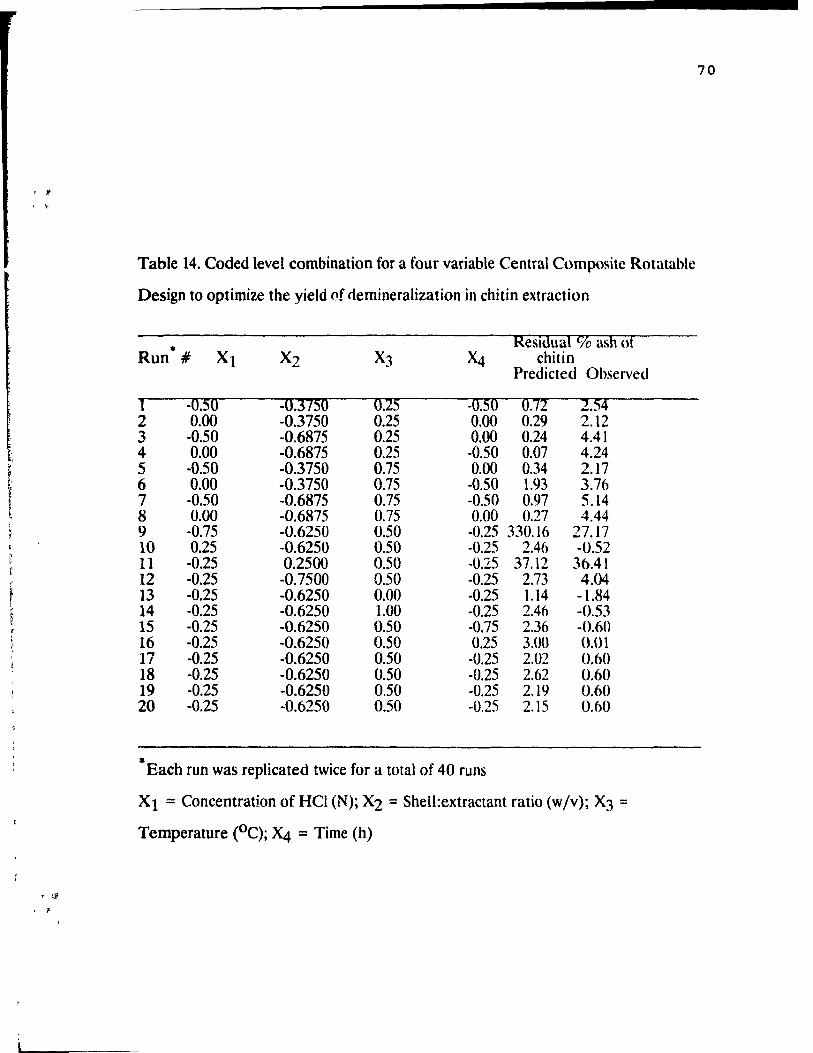
, If
, ~
~ t t t
, ,1"
Table 14. Coded level combination for a four variable Central Composite Rotatahle
Design to optimize the yield of ciemineralization in chi tin extraction
* Resldual % ash of
Run # Xl X2 X3 ~ chitin Predicted Observed
.- -0.50 -0.3750 0.25 -0.50 0.72 2.54 2 0.00 -0.3750 0.25 0.00 0.29 2.12 3 -0.50 -0.6875 0.25 0.00 0.24 4.41 4 0.00 -0.6875 0.25 -0.50 0.07 4.24 5 -0.50 -0.3750 0.75 0.00 0.34 2.17 6 0.00 -0.3750 0.75 -0.50 1.93 3.76 7 -0.50 -0.6875 0.75 -0.50 0.97 5.14 8 0.00 -0.6875 0.75 0.00 0.27 4.44 9 -0.75 -0.6250 0.50 -0.25 330.16 27.17 10 0.25 -0.6250 0.50 -0.25 2.46 -0.52 11 -0.25 0.2500 0.50 -0.15 37.12 36.41 12 -0.25 -0.7500 0.50 -0.25 2.73 4,(>4 13 -0.25 -0.6250 0.00 -0.25 1.14 -1.84 14 -0.25 -0.6250 1.00 -0.25 2.46 -0.53 15 -0.25 -0.6250 0.50 -0.75 2.36 -0.60 16 -0.25 -0.6250 0.50 0.25 3.00 0.01 17 -0.25 -0.6250 0.50 -0.25 2.02 0.60 18 -0.25 -0.6250 0.50 -0.25 2.62 0.60 19 -0.25 -0.6250 0.50 -0.25 2.19 0.60 20 -0.25 -0.6250 0.50 -0.25 2.15 0.60
*Each run was replicated twice for a total of 40 runs
XI = Concentration of HCI (N); X2 = Shell:extractant ratio (w/v); X3 =
Temperature (oC); '4 = Time (h)
70
, .f
, l'
, , t'
71
and 14 respectively. The second order polynomial model usmg multiple
regression analysis of the coded data is represented as equation [8].
y = 314.93 - 99.69Xl - 1715X2 - 5.26X3 - 32.14~ - 12.71X12 - 928.15XIX2 +
2672.99X22 - 0.23XIX2 + 0.73X2X3 - 0.01X32 - 0.13Xl~
- 15.69X2~ + 1.13X3~ - 0.05~2 [8]
Examination of the fitted model (Table 15) with the t-test (25 dJ.)
indicated that ail the four Iinear terms, concentration of Hel, shell:extractant
ratio, temperature of extraction, and time of extraction (XI, X2, X3, and ~),
two quadratic terms, (concentration of HCI)2, (shell:extractant ratio)2, and
(XI2, and Xi,) and two interaction terms (XIX2 and X3~) were significant.
The lack ofsignificance of the interaction terms XIX3, Xl~, X2X3 and X2~
could be attributed to the antagonistic effects produced by these variables on
demineralization. Challges in concentration have significant effects on
demineralization, with an increase in shell:extractant ratio giving products with
lower ash content. On the other hand, combinations of high temperature and
time of extraction with high concentrations of extractant causes degradation of
the chi tin chain, and apparent high ash content of chitin and hence a lowered
effectiveness of demineralization. The F- value and .overall correlation
coefficient (r) of the model were also significant at P<O.OOl, the equation having
an R2 of 0.92 accounting for 92% for the variation in terms of % ash of chi tin.
The test for lack-of-fit for the model is highly significant (p> 0.000), indicating
that, the quadratic model dues not fit the data very weil, so firm statements
about the underlying process cannot be based only on the above analysis.
Moreover, Table 14 shows that the observed values for residual % total nitrogen
are far from the predicted values indicating an inadequacy in the model. A third
order regression analysis may be carried out to improve the lack-of-fit but the
resultant regression equation becomes cumbersome and difficult to visualize.
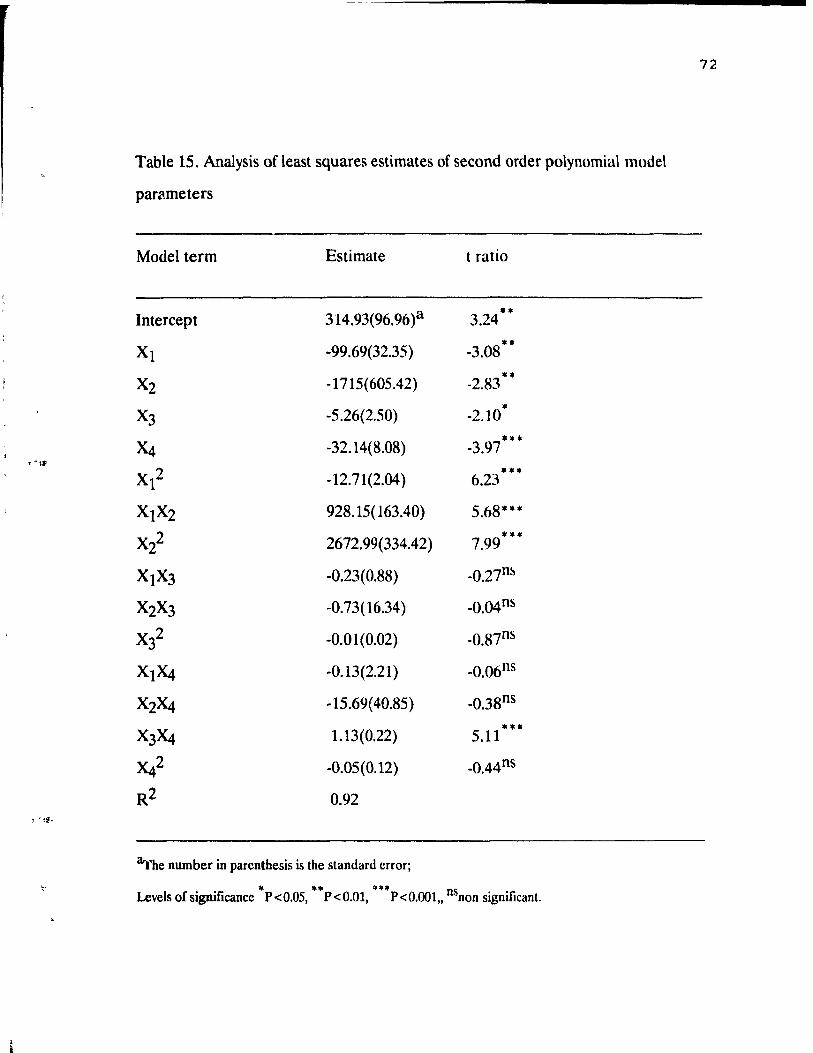
72
Table 15. Analysis of least squares estirnates of second order polynomial model
parameters
Model term Estimate t ratio
Intercept 314.93(96.96)a 3.24 **
Xl -99.69(32.35) -3.08 **
X2 -1715(605.42) -2.83 **
X3 -5.26(2.50) -2.10 *
X4 -32.14(8.08) -3.97 *** ""'1r
X12 -12.71(2.04) *** 6.23
XIX2 928.15( 163.40) 5.68***
X22 2672.99(334.42) 7.99 ***
XIX3 -0.23(0.88) -0.27n~
X2X3 -0.73(16.34) _O.04oS
X32 -0.01(0.02) -0.87°S
Xl~ -0.13(2.21 ) _0.06ns
X2~ -15.69(40.85) -0.38ns
X3~ 1.13(0.22) *** 5.11
)42 -0.05(0.12) _O.44ns
R2 0.92 , ~ ~f·
~'he number in parenthesis is the standard error;
~ * ** *** P<O.OOl" nSnon significant. Levels of significance P<O.05, P<O.01,
, ,\>-
73
Only the significant terms in the second order polynomial were used to
generate 3 dimensional response surface graphs and 2 dimensional contour plots
of yield of demineralization in chi tin extraction. However, canonical analysis of
the data revealed that the stationary point is a sadd le point. Examples of
response surface graphs for concentration of HCl vs shell:extractant ratio with
temperature and time held constant at 250 C and 4 h respectively, concentration
vs temperature with shell:extractant ratio and time held constant at 1 :20(w Iv)
and 4 h respectively, a plot of temperature vs time with concentration and
shell:extractant ratio held constant at 2N and 1:20(w Iv) respectively, and a plot
of shell:extractant ratic. vs time of extraction with concentration and temperature
held constant at 2N and 2SoC respectively are shawn in Figs 13 - 16, respectively.
As these figures illustrate, an increase in concentration with an increase in time
and tempe rature with a relatively low shell:extractant ratio resulted in improved
degree of demineralization of crustace an shells. The contour plots of the
variables are shown in Figs. 17 - 20. Table 16 shows the estimated ridge of
maximum response for the various factors. Ridge analysis indicates that
maximum yields will result from a relatively high concentration of HCI of
approximately 2.25N, a relatively high shell:extractant ratio of between 1:5 and
1:6 (w Iv), a relatively moderate tempe rature of about 290C, and reaction times
of about 5 1/2 hours. ft is noted from the analysis of variance for the model that
aH the factors are highly significant . If further experimentatioin is undertaken, 1t
might be best to fix ail factors at their critical values and ta concentrate on the
effect of each factor.
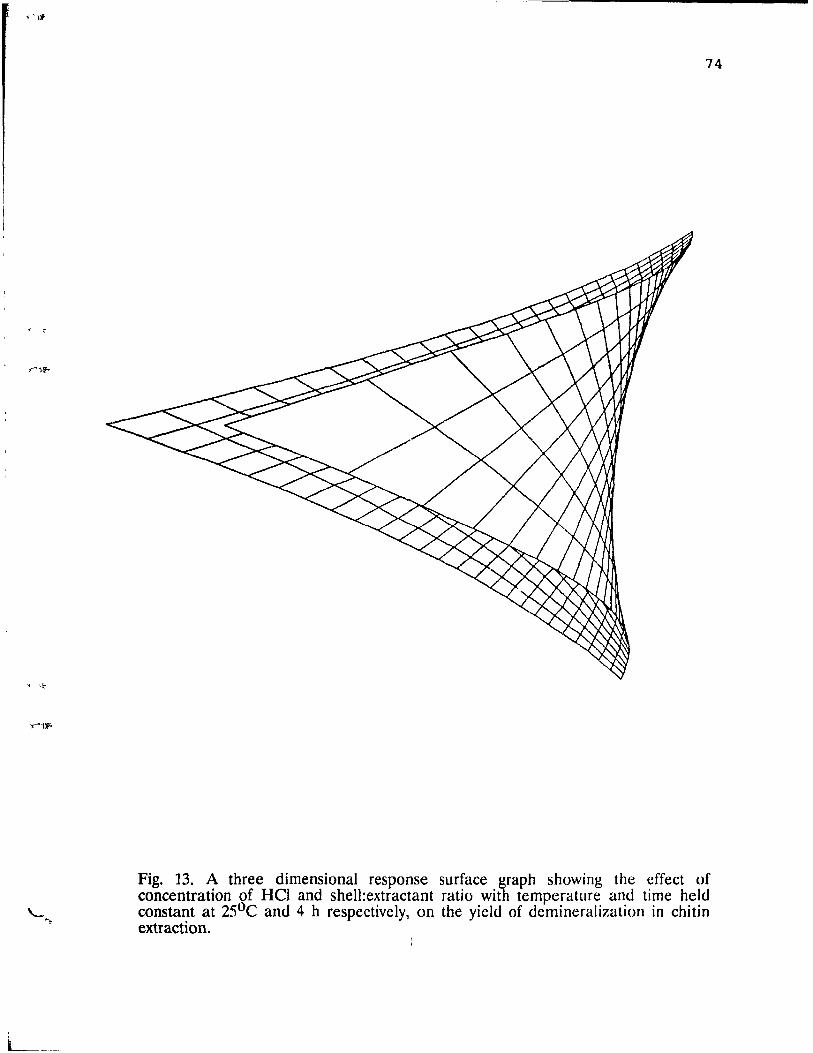
, Ll:-
'-'.
74
Fig. 13. A three dimensional response surface graph showing the effeet of concentration of Hel and shell:extractant ratio with temperature and time held constant at 25°C and 4 h respectively, on the yield of demineralization in chitin extraction.
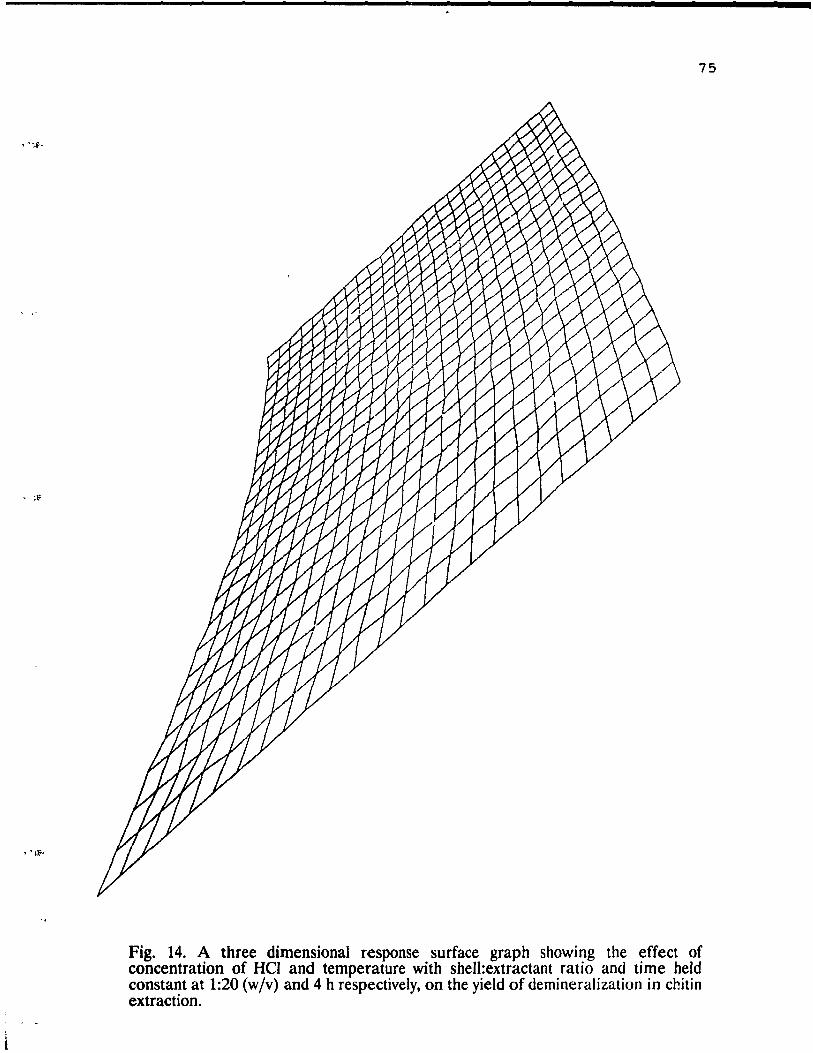
, II'
75
Fig. 14. A three dimensional response surface graph showing the effect of concentration of Hel and tempe rature with shell:extractant ratio and time held constant at 1:20 (w Iv) and 4 h respectively, on the yield of demineralization in chitin extraction.
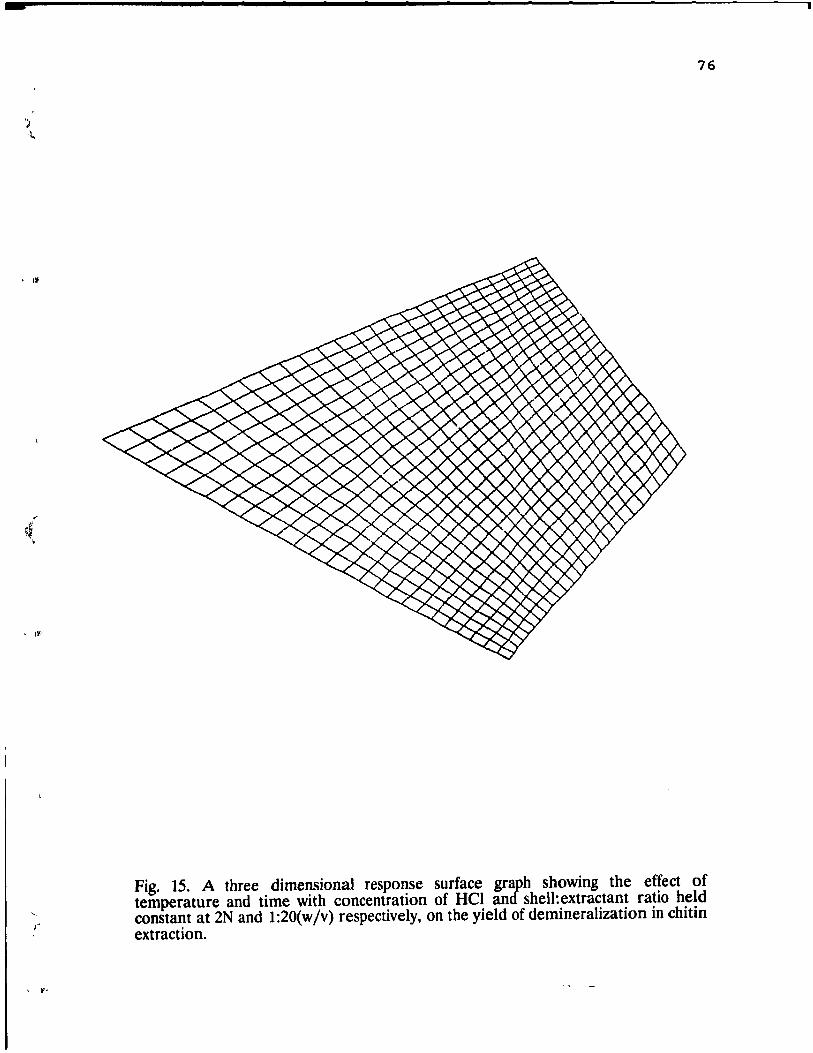
-
• Ilf
• II'
76
Fig. 15. A three dimensional response surface graph showing the effect of tempe rature and time with concentration of Hel and shell:extractant ratio held constant at 2N and 1:20(w/v) respectively, on the yield of demineralization in chitin extraction.
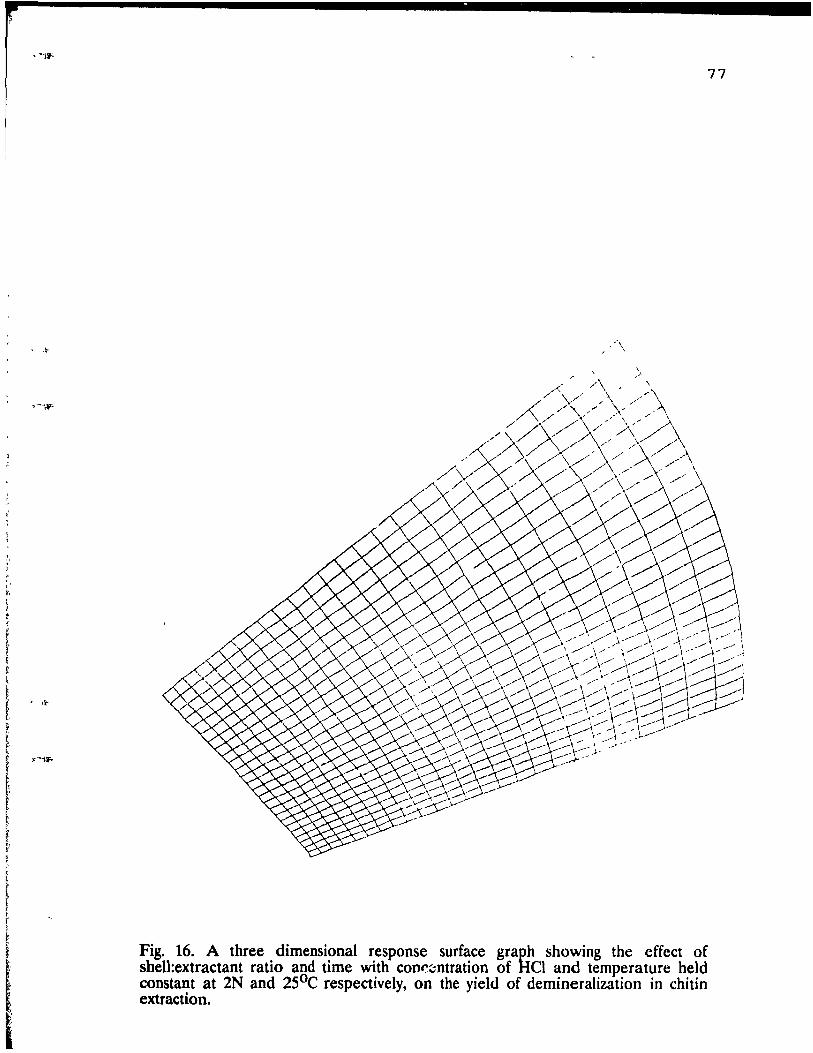
)
>
" t, l (
, ~
l' t ~ ~
t,
~ ~
r' ~ ~ ~, ~,
f
f 1
1 1
, ,\-
< I\-
'I""i)l-
77
Fig. 16. A three dimensional response surface graph showing the effect of shell:extractant ratio and time with con~~ntration of HCI and temperature held constant at 2N and 2SoC respectively, on the yield of demineralization in chitin extraction.
p
, If
• I\'
78
The contour plots revealed that, a combination of increases in the
magnitude of ail the factors will lead to a higher power of extraction, as it is also
indicated by the elevating behavior of the graph~ over the response surface. At
critical levels of 1.75% NaOH, 1:6 - 1:7(v';v), 550 C anù 5 1/2 h,
deproteinization !'eemed to be highest. Though an extraction time of 5 1/2 h
seem to be long compared 10 the relatively short period of extraction used by
other researchers, a comb:natlon of the levels of factors indicated above with a
time period of 5 1/2 h will produce the highest degree of deproteinization. On
the otheï hana in demineralization, the behavior of contour plots especially
those of Figs. 18 and 20 reveal that degree of demineralization does not follow
any particular pattern with changes in combination of shell:extractant ratio with
time. The critical factors in determining the degree of demineralization appear
to be concentration and temperature. Since the model for demineralization was
not adequate, ridge analysis was carried out on the data, and it revealed the
direction in which the optimum levels of factors lie and the direction in which
further experimentation should be performed. A combination of concentration
of HCI, shell:extractant ratio, temperature and time at levels of 2.25N, 1:6 -
1:7(w/v), 290 C, and 5 1/2 h which is obtained from the ridge analysis seem to be
one which will cause destruction of the molecular structure of the chi tin chain
because of the high level of concentration of HCI (Madhavan and
Ramachandran, 1974). A lower degree of demineralization which may be
obtained at less destructive conditions may be preferable .
Fig. 17. A two dimensional contour plot showing the levels of concentration of Hel shell:extractam ratio with temperature and time held constant at 25°C and 4 h respectively, required to produce a degree of demineralization of 0.07% residual ash content.
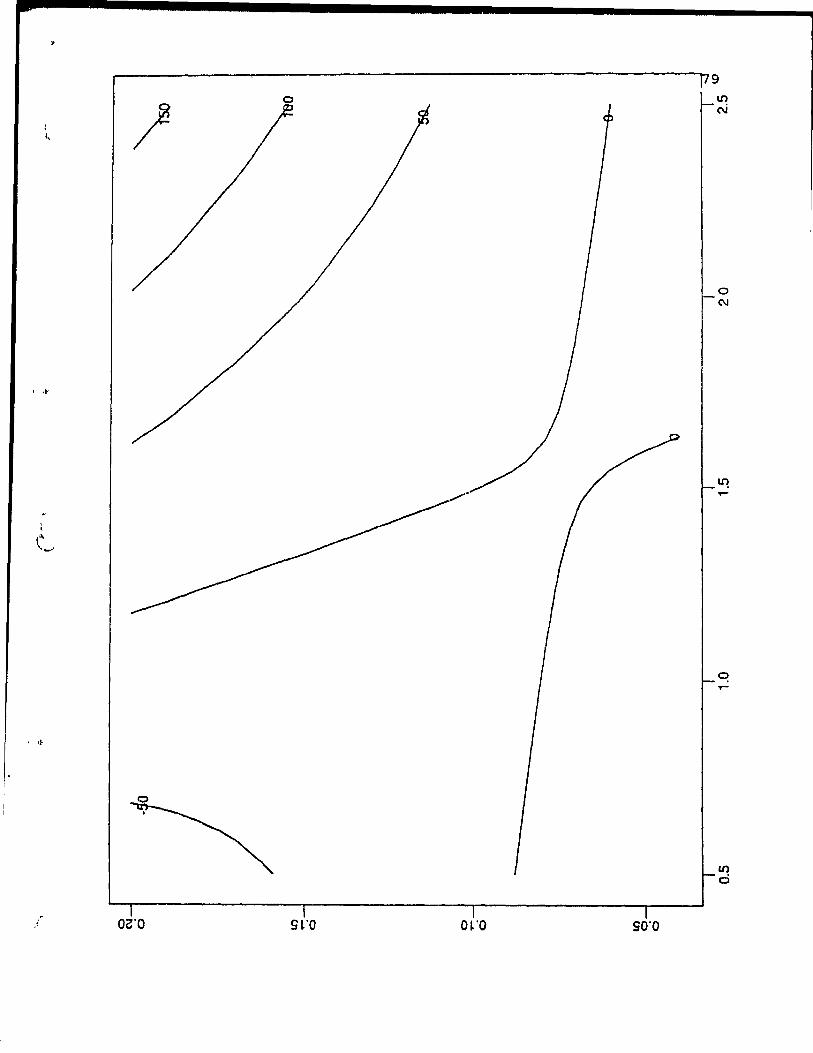
, ,~
~----------~--------------------------------------~9
) o
OZ'O sro O~'O SO'O
o C\I
o
li)
cl
Fig. 18. A two dimensional contour plot showing the levels of concentration of Hel temperature with shell:extractant ratio and time held constant at 1:20(w Iv) and 4 h respectively, required to produce a degree of demineralization of 0.07% residual ash content.
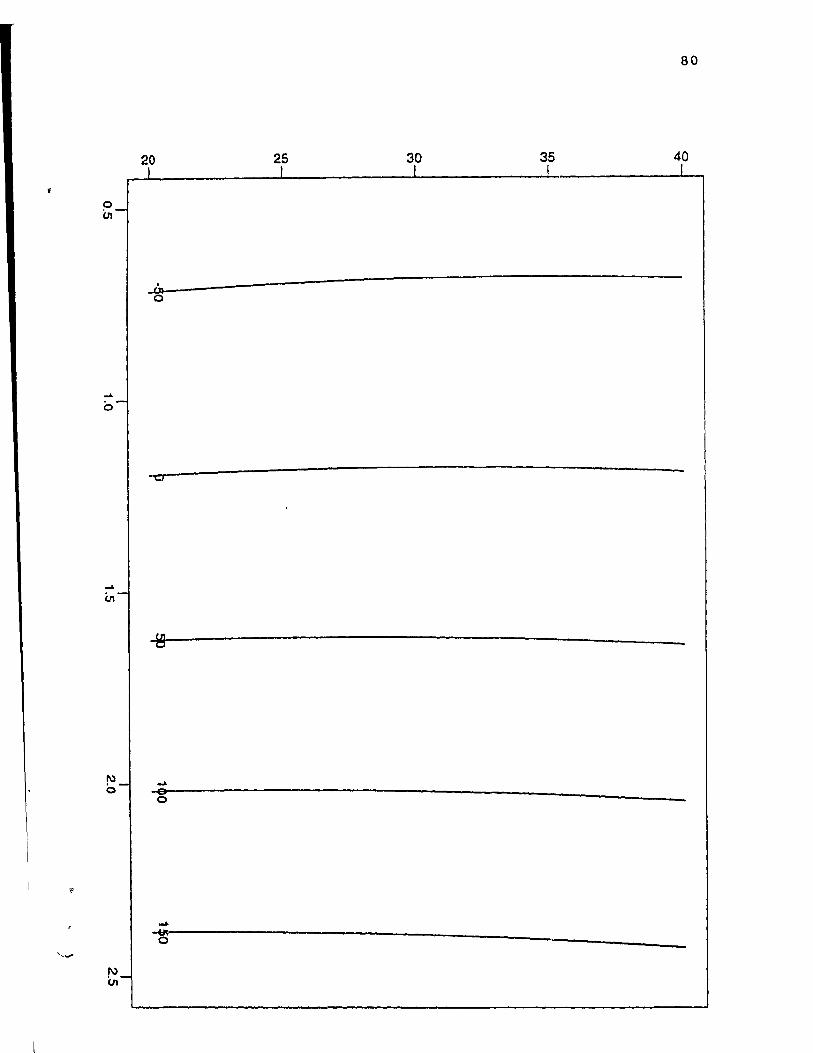
'--",
N o
20
"CI
..... e o
25
80
30 35 40
..... ~:-----------------------------------------
Fig. 19. A two dimensional Contour plot showing the levels of temperature and lime with concentration of Hel and shell:extractant ratio held constant at 2N and 1:20(w Iv) respectively, required ta produce a degree of demineralization of 0.07% residual ash content.
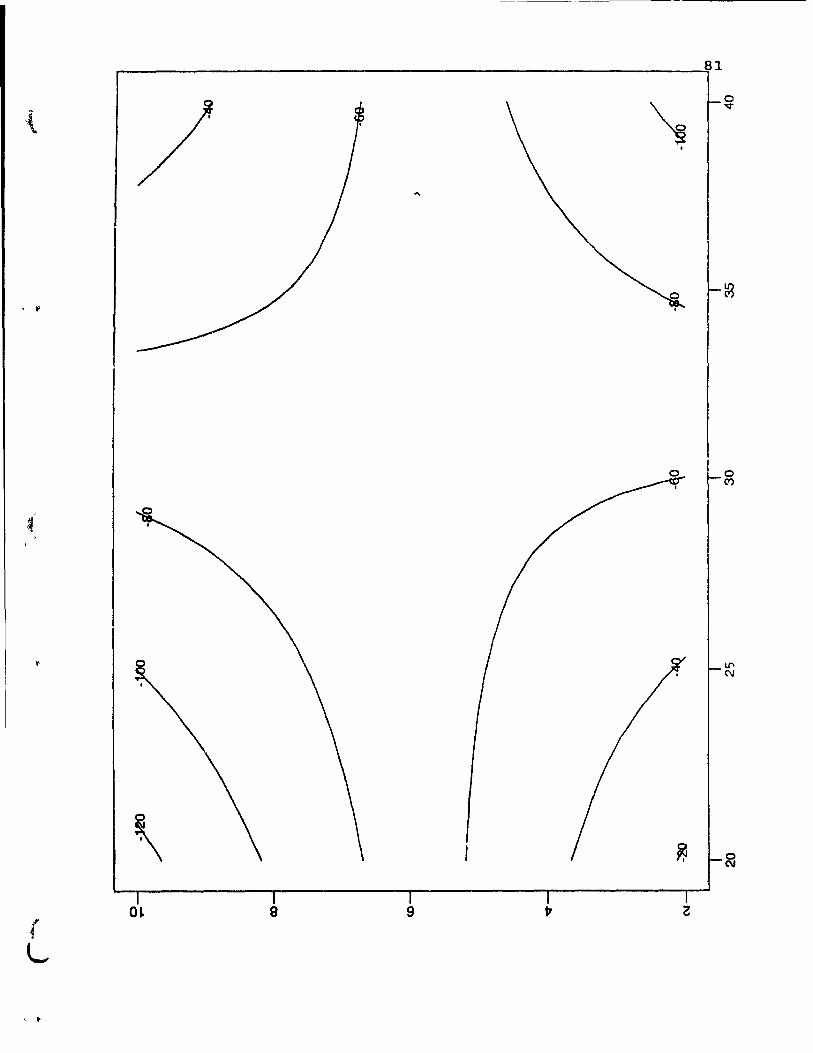
· ..
( L,
, ..
~ ______________________________________________________ ~81
...
o
\ O~ a 9
o 'It
o (1')
Fig. 20. A two dimensional contour plot showing the levels of ~hell:extractant ratio and time with concentration of Hel and temperature held constant at 2N and 25°(' respectively, required to produce a degree of demineralization of 0.07% re~idlJal a~h content.
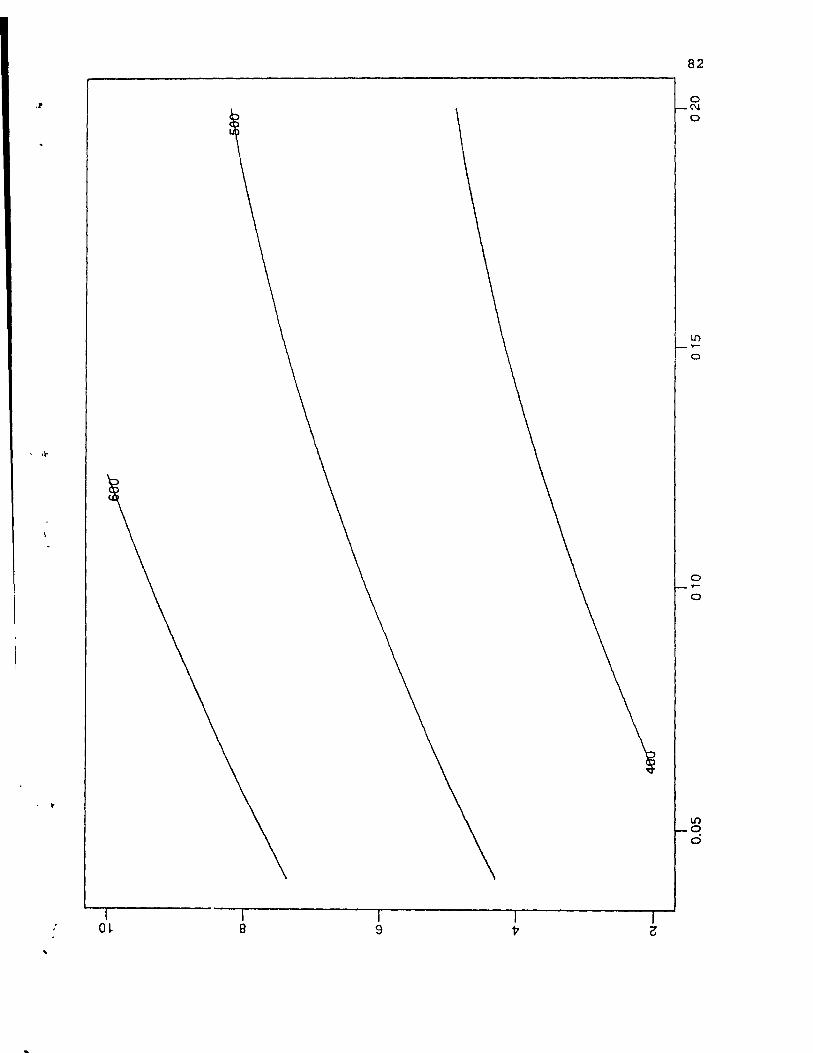
·P
•• 10
, 10
: O~ B 9
82
o (\J
o
li) T"'"
o
o ..-o
LI) o ci
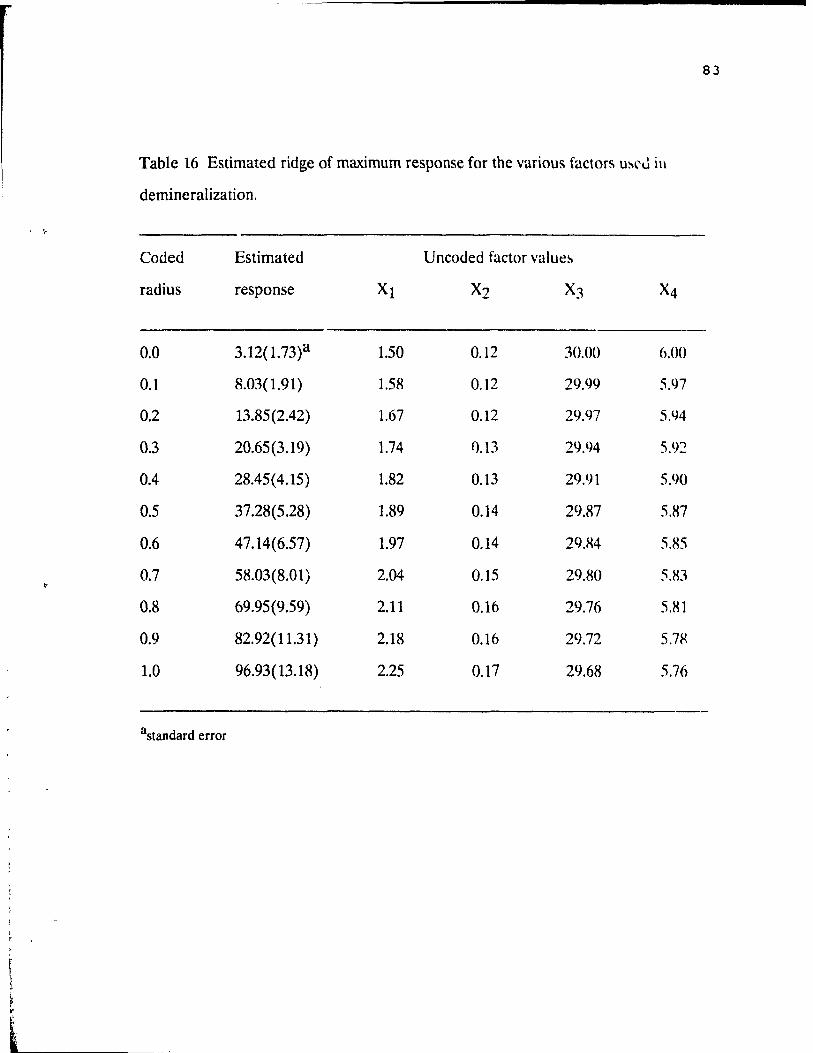
. \-
Table 16 Estimated ridge of maximum response for the various factors u~\'Ù ill
demineralization .
Coded Estimated Uncoded factor value~
radius response
0.0 3.12(1.73)a 1.50 0.12 30.00 6.00
0.1 8.03(1.91) 1.58 0.12 29.99 5,97
0.2 13.85(2.42) 1.67 0.12 29.97 5.94
0.3 20.65(3.l9) 1.74 n.n 29.94 5.92
0.4 28.45( 4.15) 1.82 0.13 29.91 5.90
0.5 37.28(5.28) 1.89 0.14 29.87 5.87
0.6 47.14(6.57) 1.97 0.14 29.84 5.85
0.7 58.03(8.01) 2.04 0.15 29.80 S.R3
0.8 69.95(9.59) 2.11 0.16 29.76 5.81
0.9 82.92(11.31 ) 2.18 0.16 29.72 5,7~
1.0 96.93(13.18) 2.25 0.17 29.68 5.76
astandard error
83
, ...
, II'
(
, If
84
4.4 Effect of demineralization with hydrochloric acid on chitin
Hydrochloric acid (HCI) has been more popularly used by most chitin
researchers (Hackman, 1954; Whistler and BeMiller, 1962; Broussignac, 1968)
compared to ethylenediaminetetraacetic acid(EDT A) and probably because it is
cheaper than EDT A and can accomp!ish complete elimination of inorganic salts
(Shimahara and Takiguchi, 1988). Most authors have chosen the best
demineralization procedure as the one which gives chi tin with a miniumum ash
content (No et al, 1989), and that giving the highest viscosity of chitosan
(Muzzarelli, 1977). M~lzzarelli (1977) also reported that, with a progressive
increase in the concentration of HCI the degree of demineralization is increased.
However the use of acid concentration above 1.25N and at high temperatures
adversely affects the chitosan product since partial or extended demineralization
take place. With an increase in tempe rature and prolonged treatment times the
effect is greater. In the experimental design the combination of demineralization
conditions which gave the highest reduction in original ash content was a 2N
HCI at a ratio of shell:extractant of 1:20 (w jv) at room tempe rature for 4 h. This
resulted in a 99.8% decrease in the original ash content ie. from 37.98% to
0.07%. The combination(s) which gave the least reduction in original ash
content of shells were Run #s. 9 (0.5N HCI, 1:15(wjv) at 30°C and for 6 h) and
11 (1.5N HCI, 1:5 (wjv), at 30°C and for 6 h) (Table 14). Run No. 9 resulted in
a 21% decrease in original ash content (38.22% to 30.17%) while treatment
using the conditions specified by Run No. Il gave a 5.8% reduction in original
ash content. This observation demonstrates that a concentration of HCI as low
as 0.5N HCI in combination with a shell:extractant ratio of 1:5(w jv) was not
effective for demineralization, although both conditions may be economical and
may prevent depolymerization of the native chitin chain. Work done by No et al.
(1989) ",hows that, at IN HCI and at ambient temperature, a shel1:extractant
85
ratio of 1: 15(w Iv) is more effective in reducing the ash content than n
shell:extractant ratio of l:lO(w/v) for a decalcification time of 30 min.
4.5 Effect of deproteinization with sodium hydroxide on chitin
Sodium hydroxide (NaOH) as a deproteinizing agent has heen used hy
most researchers (Hackman, 1954; Whistler and BeMiller, 1962~ Shimahara nnd
Takiguchi, 1988). NaOH removes proteins and peptides a~ desired but it al~o
removes :\cetyl groups and may weIl lead to fragmentation of the chitin chain
(Foster and Hackman, 1957). Optimal conditions for deproteinization has heen
designated as those giving a residual nitrogen content clo~est to the theoretical
value of 6.9% for pure chitin. Treatment No. 10 with conditions: 5% NnOH,
1: 15(w Iv) shell:extractant ratio at 650 C for 6 h, gave a residual nitrogen content
of 6.71 % which is close to the theoretical value of 6.9% for pure chitin (Table
10). AlI the other combinations gave a residual % total nitragen content lower
than 6.71 % (Table 10). No et al. (1989) reported that. at a fixed temperature of
65°C, effects of alkali concentration and extraction times on residual nitrogen
content showed that total nitrogen levels of the decalcified ~hells gradually
decreased with an increase in al kali concentration and extraction time. The
residual % total nitrogen content of Run No.s 9 and Il were very low, about half
the theoretical value of that of pure chitin (Table 10). This observation could be
attributed ta the fact that there was extreme hydrolytic deamination on the
decalcified shells (Rutherford and Austin, 1978b).
4.6 Characterization of chitin and chitosan
The choice of a representative chi tin for property determination always
presents a problem since chitin is not a chemical entity but a product defined by
1
. (
(
, l'
. . \
(
, l'
(
, II'
86
its source and method of isolation. It is readily susceptible to degradation by
hydrolysis of its glycoside linkages or ac.:~yl groups or by denaturing from over
heating or other harsh treatment. Thf refore, there is no weIl established
standard chitin. In this study, a range of chemical and physical properties were
selected on which to base critical comparisons. These include ash content, total
nitrogen, molecular weight and viscosity, and water holding capacity of the
isolated chitins. The results were then compared to those of commercial crab
chitin and chitosan .
4.6.1 Nitrogen content
Ali the chitins from the twenty different mns gave a total nltrogen
content lower than the theoretical value of 6.9% for pure chitin, which is an
indication of hydrolytic deamination or contamination in the product
(Rutherford and Austin, 1978b). Since ail the values obtained were lower, it is
established that, ail the various combinations accomplished total removal of
proteins, though No et al. (1989) have stated that it is highly improbable that
chi tin samples can be prepared without sorne residual pwtein remaining since
prote in is bound by covalent bonds to chitin (Austin et al. 1981; Brine and
Austin, 1981; Hackman, 1960).
4.6.2 Water binding capacity
Water binding capacity of lobster chitin and chitosan obtained from the
optimization studies was compared to that of commercially available crab chi tin
and chitosan (Sigma). Water binding capacity of lobster chitin and chitosan
ranged between 400 ~ 510% (w/w) with chitosan having the greater water
1 , ·1
t 'l 1
~-IY
87
binding capacity (Fig 21). Generally, it was found that, the water binding
capacity of lobster chitin and chitosan was relatively lower than that of crab
chitin and chitosa'1. Knorr (1983) stated that water uptake of chitin and chitosan
was between 400 - 550% (w /w) with chitosan having the greatest value. The
differences could be attrihuted to the differente5. in the crystallilllty of the
products as weIl as differences in the amount of salt forming group~ boum] to the
products and proportion of covalently bound proteins (Austin et al. 1l.>81). Since
protein residues remain with chitin even after drastic alkali treatment,
differences in residual protein content might alsu contribute to differences in
water holding capacity of the products (Knorr, 1982). The high water binding
capacity of lobster chitin and chitosan may be exploited in food application for
use as humectants (Sanford, 1988). Knorr, (1982) observed that, the ~pecific Joaf
volume of white breads and protein fortified hreads wa!l increased by
incorporating chi tin, because of its high water and fat binding capacitie!l.
4.6.3 Viscosity and molecular weight
4.6.3.1 chitin
Muzzarelli (1977) reported that generally, the viscosity of a
macromolecular compound is related to the degree of polymerization through
the constant, Km. Km depends on the nature of the solve nt, the type of bond and
molecular shape as suggested by equation 3. The solvent system, 5% N,N
dimethylacetamide-LiCI has been found to be the best solvent for chitin
(Rutherford and Austin, 1978b), ~ince it both swells and dÎ!l~olve!l chitin without
any hydrolytic degradation or hleaching, to give very high viscous ~olution!l of
chitin. Since viscosity is directly related to degree of polymerization, the viscosity
of a molecule is an indication if the molecule has undergone hydrolytic
------,
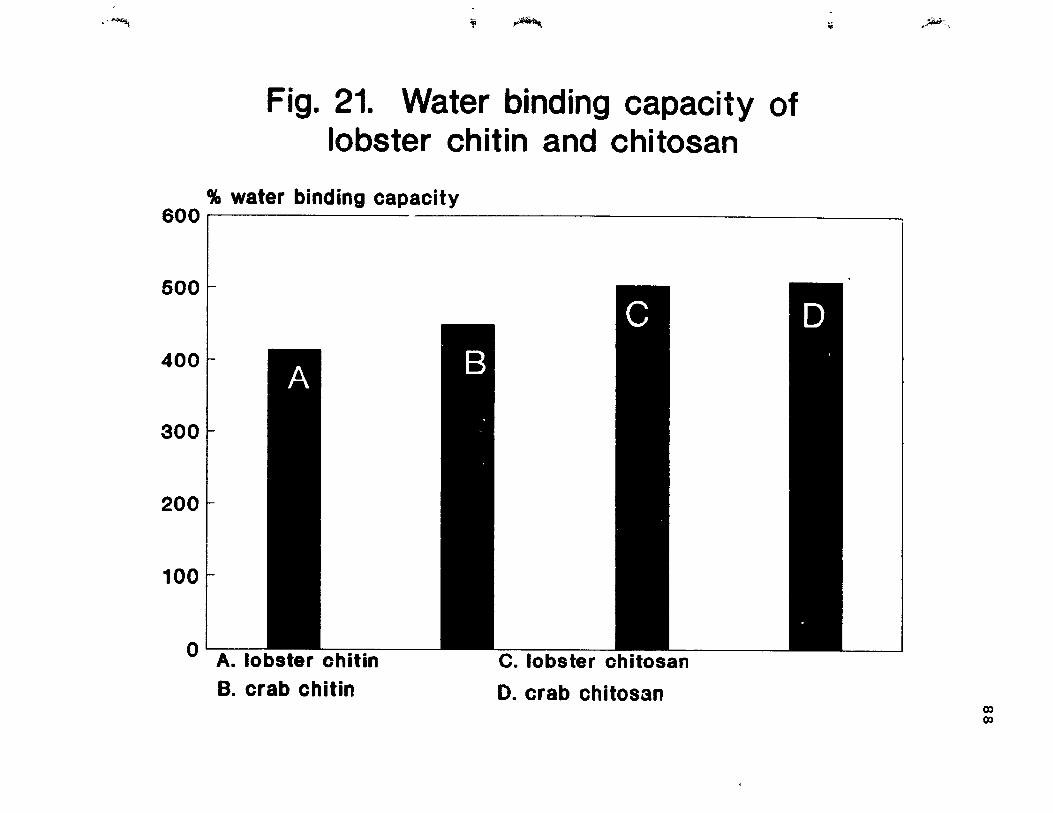
"~ ïi ~
Fig. 21. Water binding capacity of lobster chitin and chitosan
% water binding capacity
..
6001 ------------------------------------~
500
400
300
200
100
o A. lobster chitin
B. crab chitin c. lobs ter chitosan
D. crab chitosan
.«.:. . ..-."'., ,
Q) Q)
, ,~
89
degradation during extraction. Table 17 and Figs 22 - 25 show the results
obtained for viscosities and molecular weight of lohster and crah chi tin and
chitosan in the stated solvents. The viscosity of lobster chi tin was comp~uahle tn
those of commercial crab chi tin, with very !iule differences in hoth values. Thi~
observation suggests that, the degree of polymerization of lob~ler chitin wa~ abo
comparable to the crab chitin, indicating that, the method of extraction did not
hydrolyze the macromolecule any further than that of commercial crab chitin.
The conditions of extraction of lobster chitin wa~ therefore good. The intrinsic
viscosities of both chitins were obtained from Figs. 22 and 23 hy extrapolation 10
zero concentration. The intrinsic viscosity of crab chitin was fl)und to be 22.22cp
and that for lobster chitin was 17.77cp, which sugge~ts a slightly lower degree of
polymerization of the lobster chitin.
The corresponding molecular weights of these chitins, calculated from the
Staudinger equation are 1.79 x10⁶ and 1.31 x 10⁶ dalton~ respectively. The!ote
results are close to those reported by Knorr (1984). Since the viscosity is directly
proportion al to the molecular weight, a higher viscosity implicates a higher
molecular weight whilst a lower viscosity implicates a lower molecular weight
and hence hydrolytic degradation of the macromolecule. Fig. 26 sh()w~ the
molecular weight distribution of chitin and chitosan. The molecular weight of
lobster chitin was 27% lower than that of'commercial crab chitin indicating that,
at Ieast, about 27% hydrolytic depolymerization of the lobster chitin had taken
place.
4.6.3.2 Chitosan
The soivent system, O.2M acetic acid + O.IM sodium acetate was
reported by Muzzarelli (1977) to be the solvent of choice for viscosity
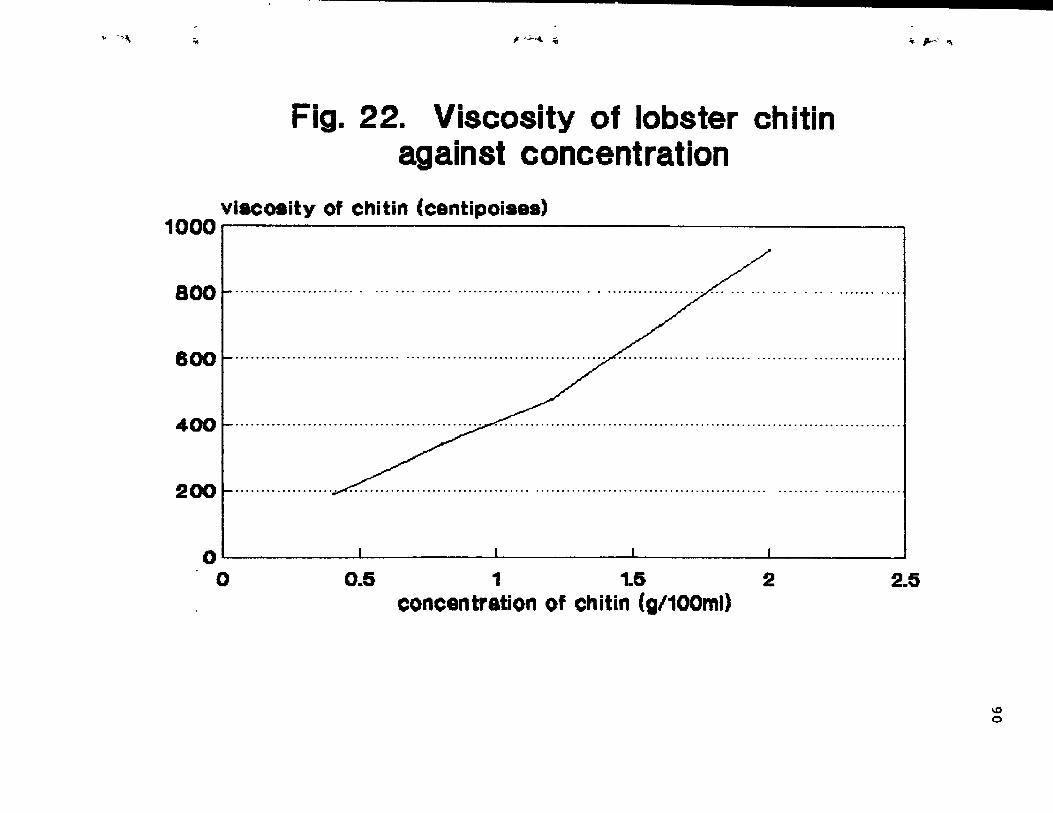
" .~\
'" ,. '-"-<4. 'i
Fig. 22. Viscosity of lobster chitin against concentration
vi8Coaity of Chi tin (cantipoi8as) 1000~i ----------------------------------------------~
800 ...................................... ,........ .. .............................................................................................................. • .F ..... ............................................... ..
800
400
200
O~i --------~--------~--------~--------~------~
.. I-~' '1
o ~ 1 ~ 2 ~
concan tration of ch itin (g/100ml)
\0 o
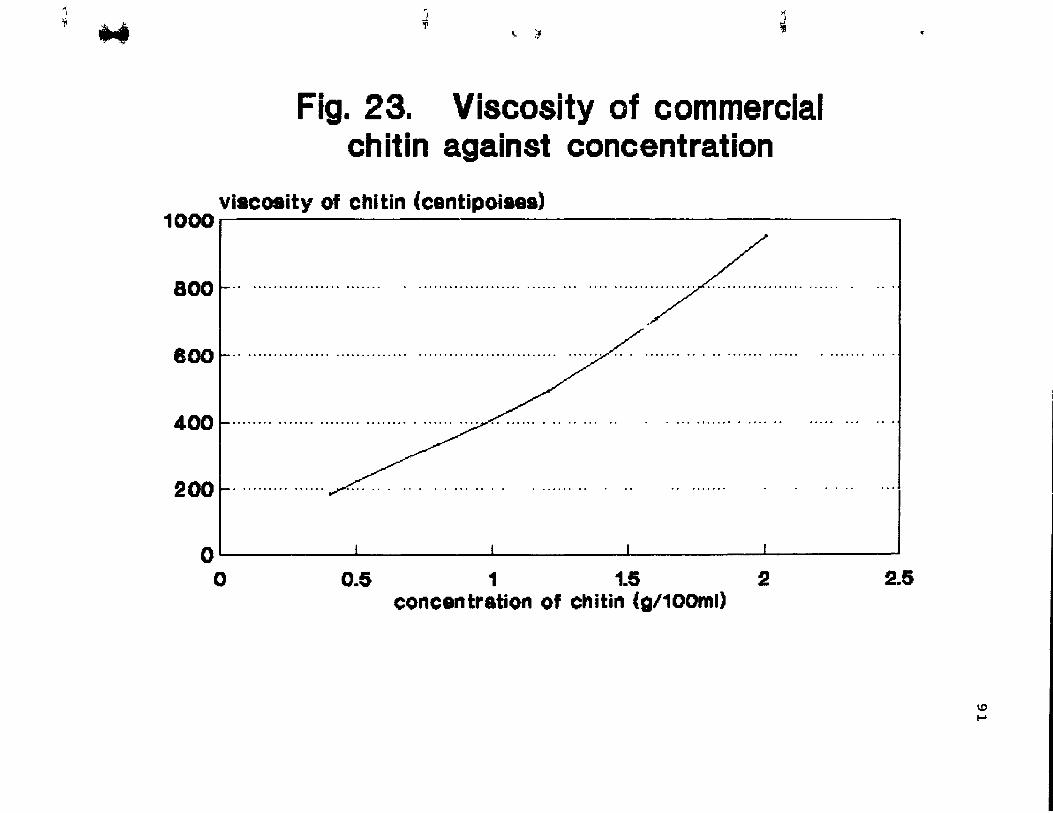
'\
~ ... ~ " '.Ji
'-~
Fig. 23. Viscosity of commercial chitin against concentration
viacoaity of chi tin (centipoiae8) 1000~1 ------------------------------------------------~
800
800 ...................................................................... .,... ............ ....... ...... . .......... .
400
200 .... · ............... .-....... ... .. ... .. .. . ........ ... .. ....... . . .... ,..
O~I ----------~--------~--------~----------~--------~
o 0.5 1 1.5 2 2.5 concentration of chitin (g/100ml)
ID ....
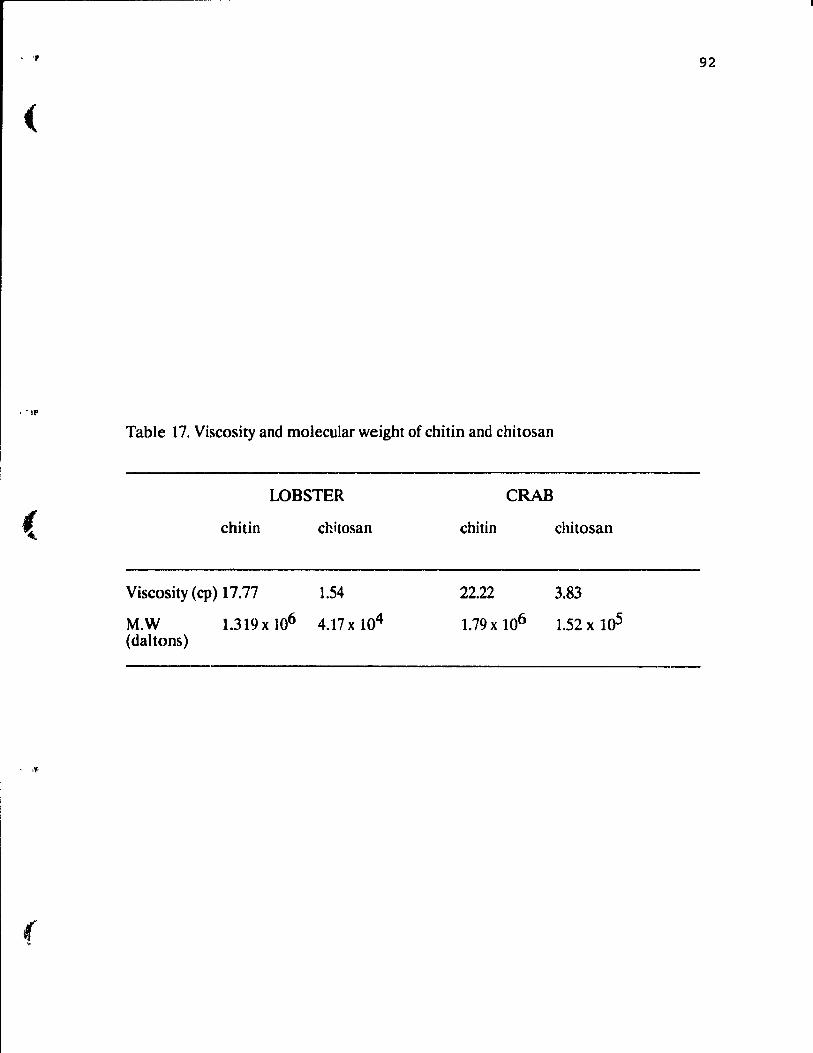
, 'f 92
(
, "'f
Table 17. Viscosity and molecular weight of chitin and chitosan
LOBSTER CRAB
( chitin chitosan chilin chitosan
Viscosity (cp) 17.77 1.54 22.22 3.83
M.W 1.319 x 10⁶ 4.17 x 10⁴ 1.79 x 10⁶ 1.52 x 10⁵ (daltons)
, of
( ,.
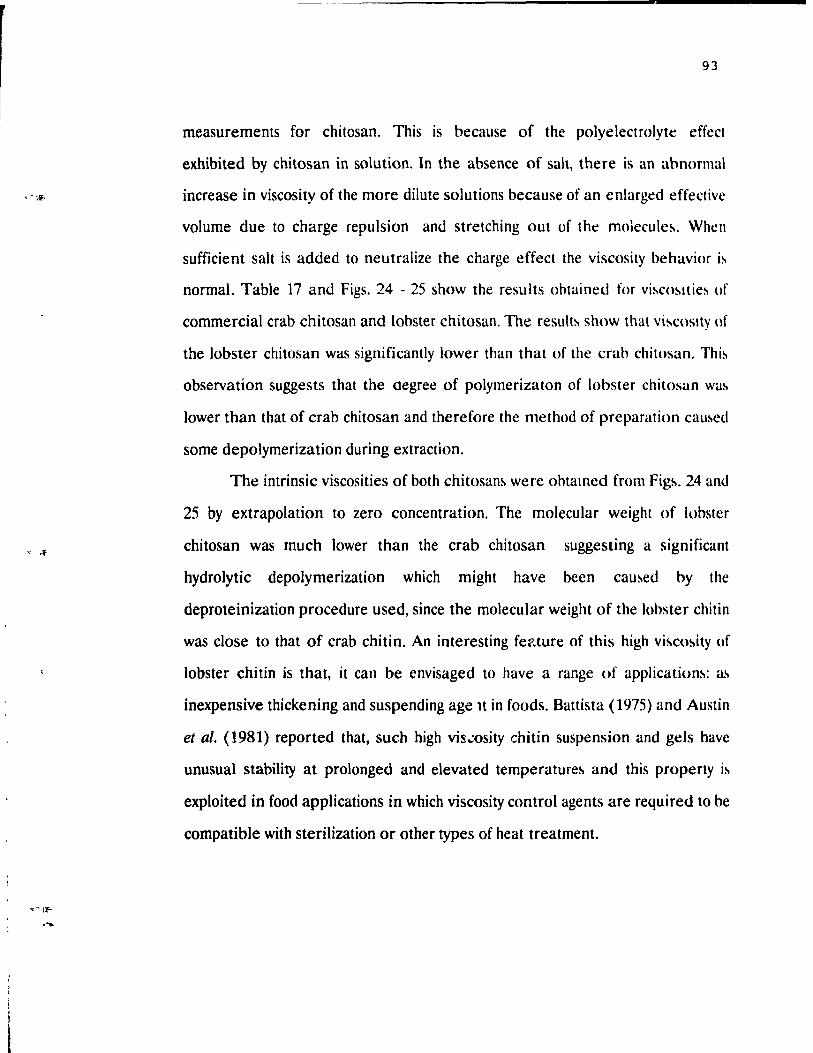
93
measurements for chitosan. This is because of the polyelectrolyte effcet
exhibited by chitosan in solution. In the absence of salt. there is an ah normal
increase in viscosity of the more dilute solutions because of an enlarged effective
volume due to charge repulsion and stretching out of the moiecule~. When
sufficient salt is added to neutralize the charge effeet the viseosity behavior i!oo
normal. Table 17 and Figs. 24 - 25 show the results ohtained for vi!ooco~Jtie~ of
commercial crab chitosan and lobster chitosan. The result!\ show that vi~coslty of
the lobster ehitosan was significantly lower than that of the crah chitosan. Thi!oo
observation suggests that the degree of polymerizaton of lobster chitosan wa!oo
lower than that of crab chitosan and therefore the method of preparation eamed
sorne depolymerization during extraction.
The intrinsic viscosities of both chitosan!l were ohtamed from Fig~. 24 and
25 by extrapolation to zero concentration. The molecular weight of lohster
chitosan was much lower than the crab chitosan suggesting a significant
hydrolytic depolymerization which might have been cau~ed hy the
deproteinization procedure used, since the molecular weight of the lohster ehitin
was close to that of crab chitin. An interesting fef.ture of this high vi~co~ity of
lobster chi tin is that, it can be envisaged to have a range of applicationll: a!oo
inexpensive thickening and suspending age 11 in foods. Battista (1975) and Austin
et al. (1981) reported that, such high vis~osity chitin suspension and gels have
unusual stability at prolonged and elevated temperature~ and this property i!oo
exploited in food applications in which viscosity control agents are required to be
compatible with sterilization or other types of heat treatment.
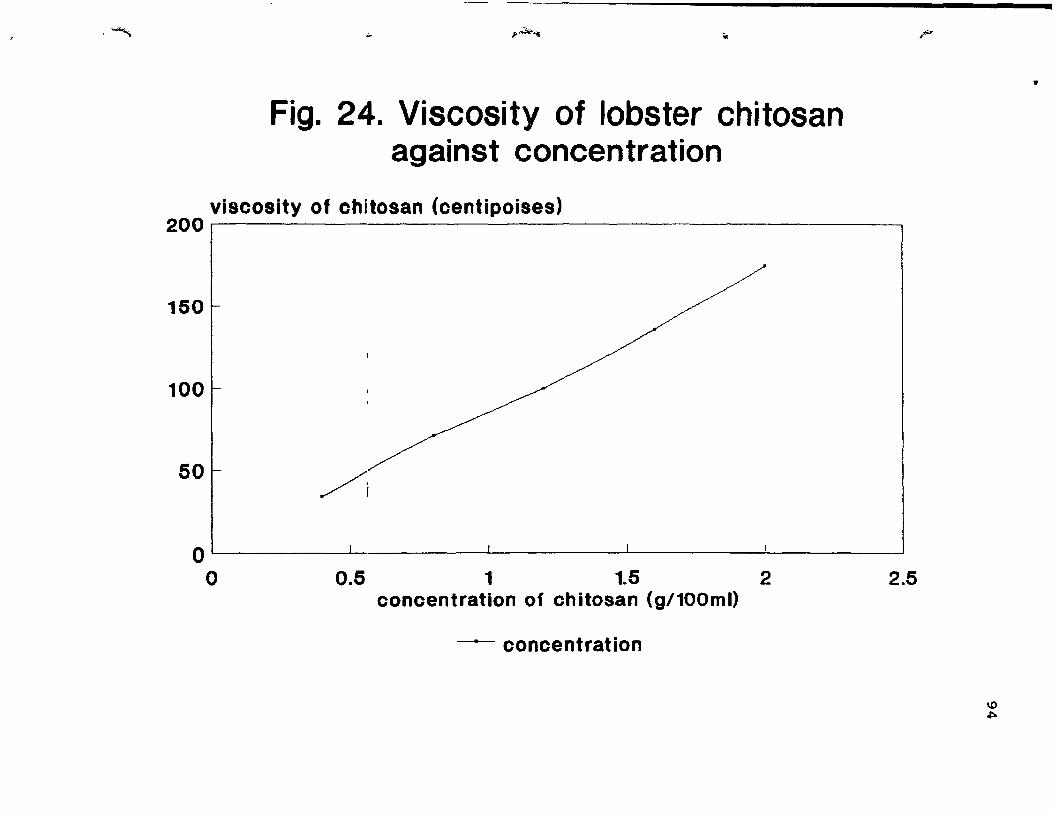
, '""" ;;. ,..":;;"-. ..
Fig. 24. Viscosity of lobster chitosan against concentration
viscosity of chitosan (centipoises) 200,~--------------------------------------------------~
/
150
100
50 1 /i
o IL----1
o 0.5 1 1.5 2 2.5 concentration of chitosan (g/100ml)
-- concentration
#s ,
\0 ~
•
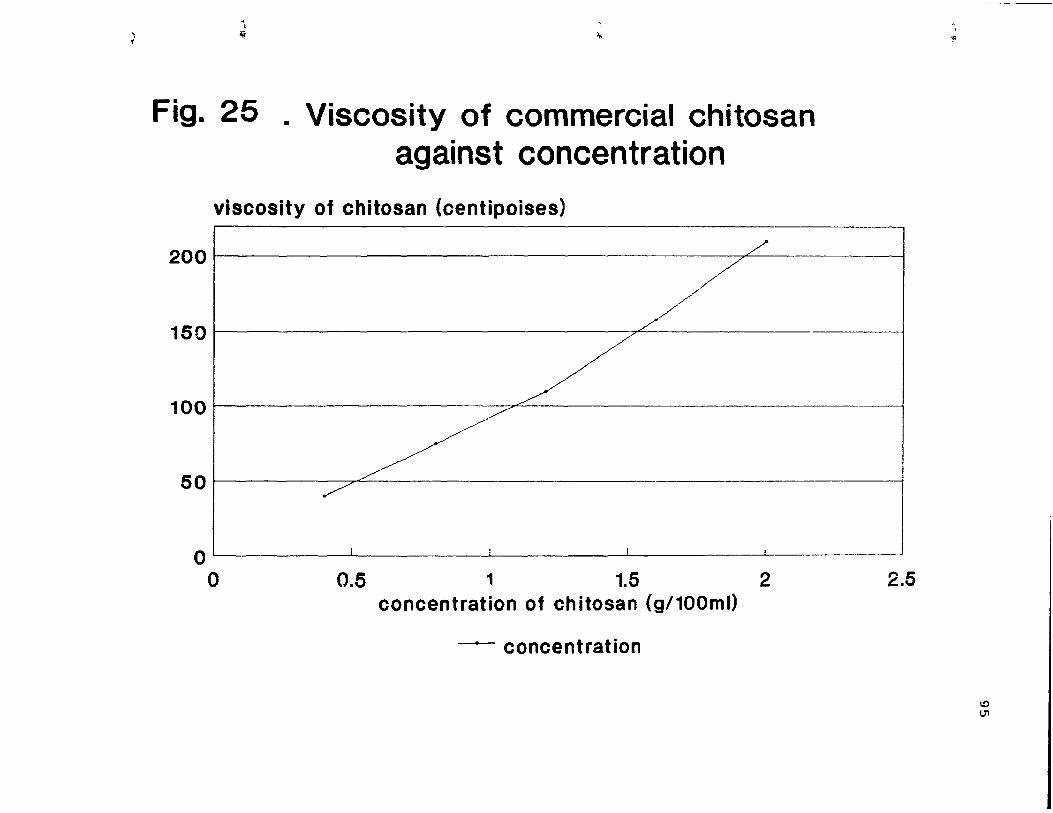
, ~
" 1
>;j '"
Fig. 25 . Viscosity of commercial chitosan against concentration
viscosity of chitosan (centipoises)
200
150
100
50
o o
./
-- ---~ _ .... _-_. --~
0.5 1 1.5 2 concentration of chitosan (g/100mll
-- concentration
'l'
2.5
10 \Jl
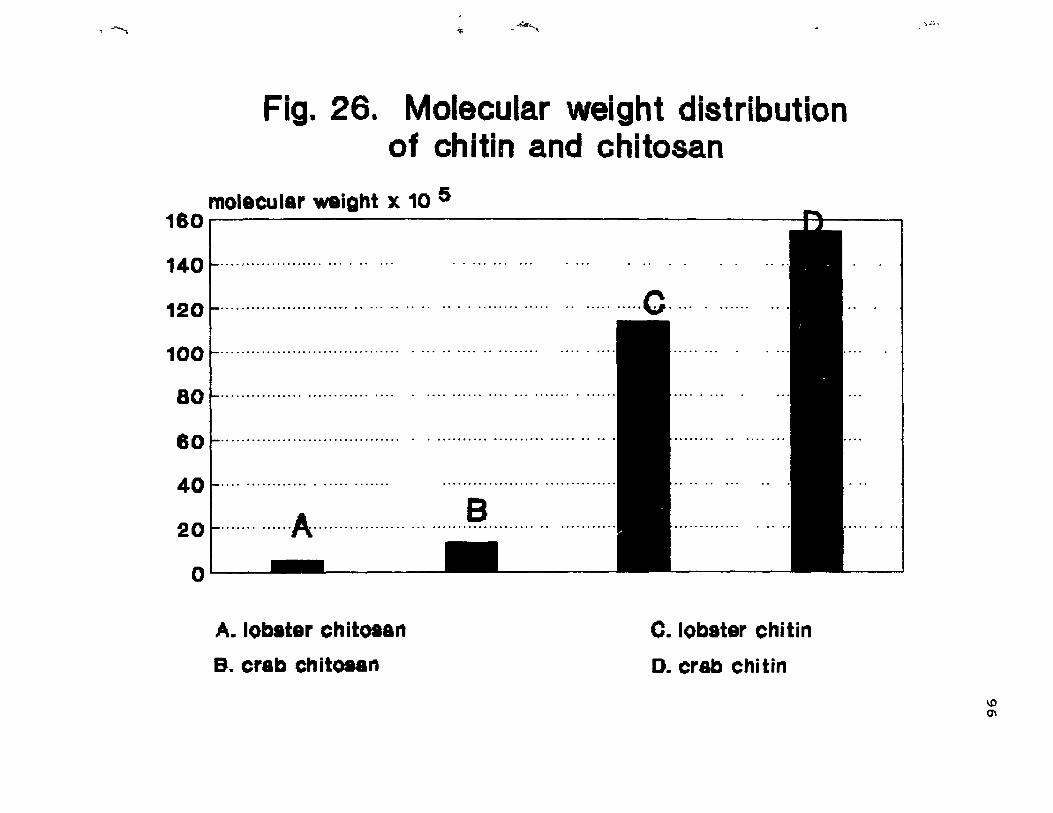
, '"""" '" . ~~,
Fig. 26. Molecular weight distribution of chitin and chitosan
molecu lar waight x 10 5 180 1 Fl
140-···················· ........ ,
120 ············c··········· ..
100
80 .... ···························· ................................... .
80 .... ··································· ............................... .
40-···· ........................ .
201-······· ...... A .... ··· .... ······· ... B ........................... ~ .. .. ... .... .. .......
OLI-------
A. lob.ter ch itosan
B" crab ch itoean
c. lob.ter chi tin
D. crab chi tin
-'\,~t ...
\0 0\
f· tf
.,
CHAPTER FIVE
CONCLUSION
97
Optimization studies of chitin extraction as a me ans of ohtaining
optimum levels of factors for chi tin extraction, and hence to estahli!\h a single
procedure for extraction of chitin with constant and reproducihle
physicochemical pmperties appear.;; 10 he feasihle wlth Response Surface
Methodology. This stati~tical tool was found to he capable of !\uhstituting for one
step at a time approach with !:luhstantial saving~ in time and lahour.
Results obtained from regression analysi!-J revealed that, the model for
deproteinization was v~ry good and hence result~ ohtained could he relied on
and used to a great extent in chitin research and production. On the other hand,
inadequacy of the model for demineralization suggesb that, firm staternent!:
about the underlying process cannot and !lhould not he b<4sed on the abovc
demineraIization analysis. Physicochemical propertie~ of the ultimate chitin
product obtained from the optimization studies which were well within the range
of those of crab chitin suggest that, lobster chitin could be u!-Jed in food
applications. It also confirme'! that, the choice of factor~ and leveb of factors in
the experimental design, which were based on literature value~ and practical
experience, were adequate and in providing optimum levels of factors for chitin
extraction.
The contour plots revealed that, a combination of increa!-Je~ in the
magnitude of aH the faccors under study will lead ta a higher power of extraction,
as it is also indicated by the elevating behavior of the graphs over the respon!-Je
surface. At critical levels of 1.75% NaOH, 1:6 - 1:7(w/v), 55°C and 5 1/2 h,
deproteinization seemed to be highest. Though an extraction time of 5 1/2 h
seem to be long compared to the relatively short period of extraction u!led by
other researchers, a combination of the leveis of factors indicated ahove with a
,
( , .,
(
, ,\,
98
time period of 5 1/2 h will produce the highest degree of deproteinization. On
the other hand in demineralization, the behavior of contour plots especially
those of Figs. 18 and 20 reveal that degree of demineralization does not follow
any particular pattern with changes in combination of shell:extractant ratio with
time. The critical factors in determining the degree of demineralization appear
to be concentration and temperature. Since the model for demineralization was
not adequate, ridge analysis was carried out on the data, and it revealed the
direction in which the optimum levels of factors lie and the direction in which
further experimentation should be performed. A combination of concentration
of HCI, shell:extractant ratio, temperature and time at levels of 2.25N, 1:6 -
1:7(wjv), 290 C, and 5 1/2 h which is obtained from the ridge analysis seem to be
one which will cause destruction of the molecular structure of the chitin chain
because of the high level of concentration of HCL A lower degree of
demineralization which may be obtained at less destructive conditions may be
preferable.
Although the results presented here are mostly preliminary in nature,
they do provide an indication of the factors and levels required to optimize
demineralization and deproteinization steps in chitin extraction and also the
direction in which further experimentation should be performed. They also
provide an indication of the potential utility of lobster chitin and chitosan in food
application.
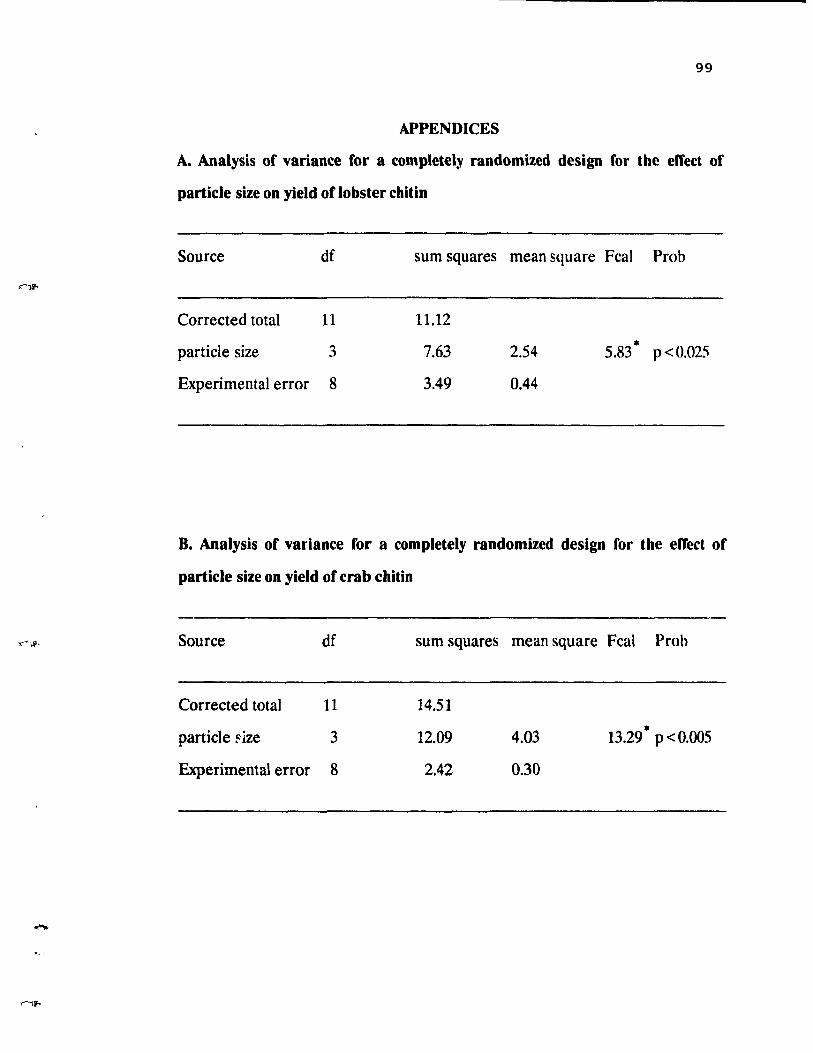
r'".
.......
99
APPENDICES
A. Analysis of variance for a completely randomized design for the etTect of
particle size on yield of lobs ter chitin
Source df sum squares mean square Feal Prob
Correeted total 11 Il.12
partic1e size 3 7.63 2.54 5.83 * p<O.025
Experimental error 8 3.49 0.44
B. Analysis of variance for a completely randomized design for the etTect of
particle size on yield of crab chitin
Source
Correeted total
partic1e flze
df
11
3
Experimental error 8
sum squares mean square Feal Prob
14.51
12.09
2.42
4.03
0.30
* 13.29 P < 0.005
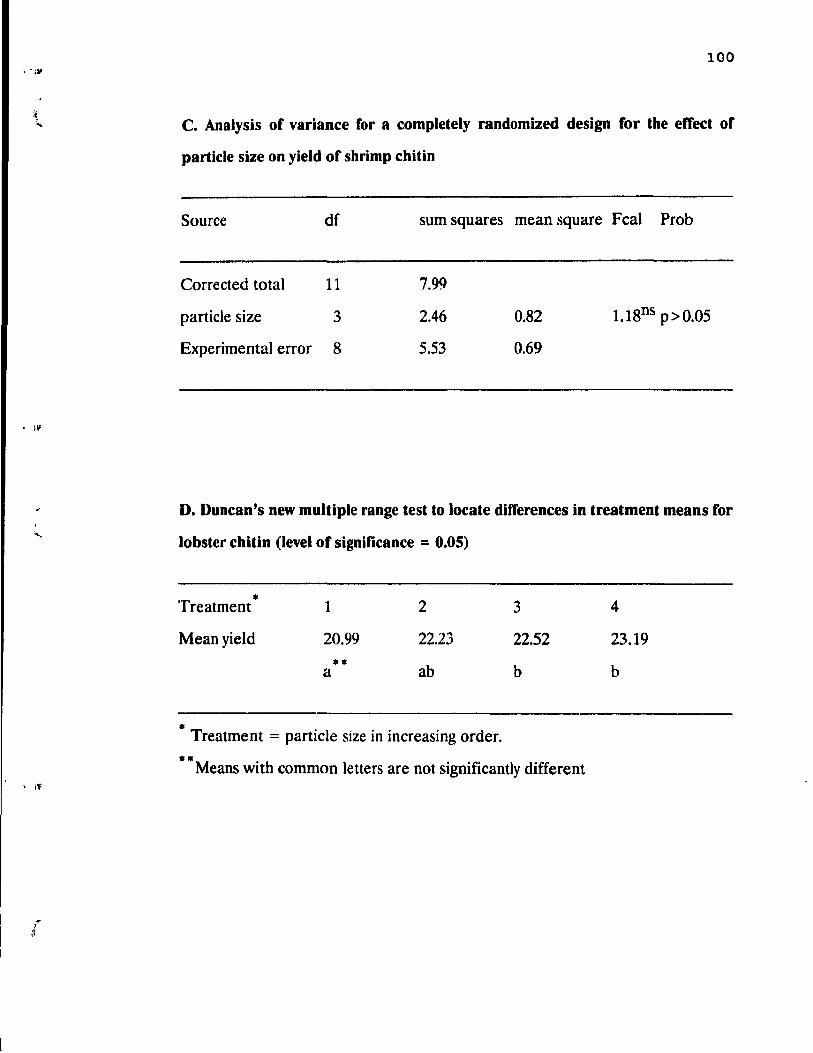
• II'
, If
100
c. Analysis of variance for a completely randomized design for the elTect of
particle size on yield of shrimp chitin
Source df sum squares me an square Fcal Prob
Corrected total
partic1e size
11
3
Experimental error 8
7.99
2.46
5.53
0.82
0.69
1.18ns p> 0.05
D. Duncan's new multiple range test to locate ditTerences in treatment means for
lobster chitin (level of significance = 0.05)
Treatment *
Mean yield
1
20.99
** a
2
22.23
ab
* Treatment = particle size in increasing order.
3
22.52
b
** Means with common letters are not significantly different
4
23.19
b
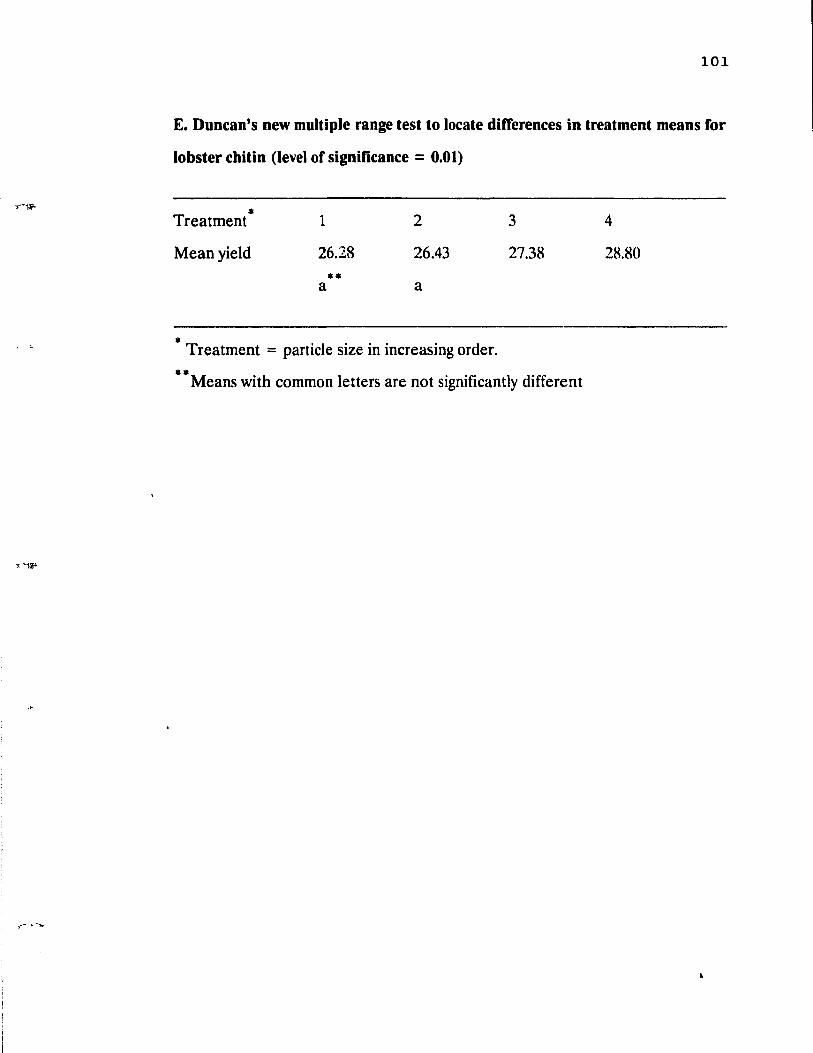
,c
101
E. Duncan's new multiple range test to locate difTerences in treatment means for
lobster chitin (level of significance = 0.01)
Treatment *
Meanyield
1
26.28
**
2
26.43
a a
* Treatment = particle size in increasing order.
3
27.38
* * Means with common letters are not significantly different
4
28.80
• II'
, If
102
REFERENCES
Allant G.G.t Fox, J.R., and Kong, N. 1978. A critieal evaluation of the potential
sources of chitin and chitosan. In: Proc. I st Inter. Conf. Chitin/Chitosan.
R.A.A. Muzzarelli and E.R. Pariser, Eds.), MIT Sea Grant Report
MITSG-78-7. Cambridge, MA. p82
Anderson, S.O. 1979. Biochemistry of the Insect cuticle. Ann. Rev. Entomo!., 24:
29
Anderson, C. G., DePablo, N. and Romo, D. R. 1978. Antartic krill (Euphasia
superba) as a source of chitin and chitosan. In Proc. ,st Inter. Conf.
Chitin/Chitosan. (Muzzarelli and Pariser Eds.), MIT Sea Grant Report.
78-7, MIT. Cambridge, MA, p54
A.O.A.C. 1980. Official Methods of Analysjs, 13th ed. Association of Official
Analytical Chemists. Washington D.C.
Arai, K., Kunimari, T. and Fugita, T. 1968. On the toxicity of chitosan. Bull.
Tokai Regional Fisheries Laboratory. No. 56: 889
Araki, Y. and Ito, E. 1975. A pathway of chitosan formation in Mucor roux;;.
Enzymatic deacetylation of chitin. Eur. J. Biochem., 55: 71
Arcidiacono, S., Lombardi, S4., and Kaplan, D.L. 1988 Fermentation,
processing and enzyme characterization for chitosan biosynthesis by
Mucor rowdi. In Chitin and Chitosan. (Skjak-Braek, G., Anthonsen, T.,
and Sanford, P. Eds.), Elsevier Applied Science Pub. New York. p319
Austin, P.R. 1975. Solvents for and purification of chitin. U.S. Patent 3, 892,
731
Austin, P.R. 1984. Chitin solvents and solubility parameters. In Chitin, Chitosan
and Related Enzymes. (J.P. Zikakis, Ed.), Academie Press, New York.
p227
'(-,,v:'
103
Austin, P.R. 1988. Chitin solutions and purification of chitin. In: Methods in
Enzymology; Bioma~s, (W.A. Wood and S.T. Kellogg. Eds.). Academie
Press, New York. 161B: 403
Austin, P.R., Brine, c.J., Castle, J.E., and Zikakis, J.P. 1981. Chitin: New Facets
of Research. Seiencc, 212: 749
Austin, P.R., Castle, J.E., and Albisetti~ CJ. 1988. Beta-chitin from ~qllid: New
solvents and plasticizers. In: Chitin and Chitosan. (Skjak-Braek, G ..
Anthonsen, T., and Sanford, P., Eds.), Elsevier Applied Science Pub.
London and New York. p749
Bartnicki-Garcia, S. 1968. CelI wall chemistry, morphogenesis, and taxol1omy in
fungi. Ann. Rev. Microbiol., 22: 87
Bartnicki-Garcia, S. 1988. The biochemical cytology of chitin and chitŒan
synthesis in fungi. In: Chitin and Chitosan. (Skjak-Braek, G., Anthonsen,
T., and Sanford, P., Eds.), Elsevier Applied Science Pub. London and
New York. p23
Bartnicki-Garcia, S. and Nickersoll, W.J. 1962. Isolation, composition and
structure of cell walls of filamentous and yeast-like forms of Mucor rouxii.
Biochem. Biophys. Acta. 58: 102
Barton, A.F.M. 1983. Handbook of Solubility Parameters and other Cohesion
Parameters. CRC Press Inc., Boca Raton, FL, p608
Battista,O.A 1975. "Microcrystal Polymer Science" McGraw Hill, N. Y
BiIlmeyer, F.W. 1971. Textbook of Polymer Science. Wiley-Interscience Pub.
New York. p87
Blumberg, R. Southall, C., Van Rensberg, NJ., and Volkman, 0.8. 1951. South
African fish products. XXXII. The rock lobster: A study of chilin
production from processing wastes. J. Sc. Food Agric., 2: 571
--~ ...... -----------------
•
• • I~
(
104
Bough, W.A. 1975a. Coagulation with chitosan: an aid to recovery of by-products
from egg-breaking wastes. Poultry Sei., 54: 1904
Bough, W.A. 1975b. Reduction of suspended solids in vegetable canning waste
effluents by coagulation with chiwsan. J. Food ScL, 40: 297
Bough, W.A. 1976. Chitosan - a polymer from seafood wastes, for use in
trealment of food process wastes and activated sludge. Process Biochem.,
11(1): 13
Bough, 'N.A. and Landes, D.R. ] 976. Recovery and nutritional evaluation of
proteinaceous solids separated from whey by coagulation with chitosan. J.
Dairy Sci. 59: 1874
Bowszyc, J. 2.nd Raszeja-Kotelba, B. 1987. Investigation of allergizing effects of
chitin and chitosan. Med. Academ. Poznan. (unpublished).
Box, G.E.P. and Wilson, K.O. 1951. On the experimental attainment of optimum
conditions. 1. Roy. Stat. Soc. B. 13: 1
Box, G.E.P., Hunter, J.S •. and Hunter, J.W. 1978. Statistics for experimenters.
An introduction ta design data analysis and model building. N.Y. Wiley
and Sons.
Brewer, W.S. and Pfaender, P.K. 1979. '"l'he distribution of selected organic
molecules in freshwater sediments. Water Research, 13(3): 287
Brine, CJ. and Austin) P.R. 1981. Chitin isolates: Species variation in residual
amillo acids. Camp. Bioch. Physiol., 70B: 173
Broussignac, P. 1968. Chitosan, a natural polymer not well known by the
industry. Chim. Ind. Genie Chim., 99: 1241
Brunet, P.C..). 1980. The Metabolism of Aromatic Amino Acids concerned in the
Crosslinking of Insect Cuticle. Inseet Biochem., 10: 467
Bneski, M.M. 1982. Concepts of chitin and chitosan isolation fron Antartic krill
(EuplJasia superba dana) shells on a technical scale. In: Proc. of the 2nd
-
,
., ..
105
Int. Conf. of The Japan Society of Chitin and Chitosan. Sapporro. Japan.
(Hirano, S. and Tokura, Eds.), pIS
Bneski, M.M. 1988. Production and application of chitin and chitosan in Poland.
ln: Chitin and Chitosan. (Skjak-Braek, G., Anthonsen, T. and Sanford, P.,
Eds.), Elsevier Applied Science Pub. London and New York. plol
Burell, H. 1955. Solubility parameters. Interchem. Rev., 14: 3
CRESA. 1971. "Pollution abatement and by-product recovcry in shellfish and
fisheries processing:' Environmental Protection Agency, Water Pollution
Control Research Series, Project No. 12130FJQ .
Cutting, C.L. 1962. Historical aspects of fish. In: Fish as Food. (Borgstom, G.,
Ed.) Acad. Press. N.Y. Vol 2: 1
Danilov, S.N. and Plisko, E.A. 1954. Chi tin. Zhur. Obs. Khim., 24: 2071
Dauby, P. 1985. Plankton Productivity in the gulf of Calvi (Corsica). Progr.
Belgian Oceanogr. Res., Brussels, p442
Davies, D.H., Eison, C.M., and Hayes, E.R. 1988. N,O-carboxymethylchitosan, A
new water soluble chitin derivative. In: Chitin and Chitosan. (Skjak
Braek, G., Anthonsen, T., and Sanford, P. Eds.), Elsevier Applied Science
Pub. New York. p467
Diptee, R., Smith, J.P., Alli, 1., and Khanizadeh, S. 1989. Application of response
surface methodology in protein extraction studies from brewer's spent
grain. J. of Food. Proc. and Preserv. 13: 457
Foster, A.B. and Haekman, R.H. 1957. Application of
ethylenediaminctetraacetic acid in the isolation of crustace an chitin.
Nature, 180: 40
Foster, A.B. and Webber, J.M. 1960. Chitin. In: Advances in Carbohydrate
Chemistry, Vol. 15, (M.L. Wolfrom and Tipson, R.S.,Eds.), Academie
Press, New York. p371
.It
{ • f'
, '" (
106
Fox, D. 1973. Chitin-bound keto carotenoids in crustace an carapace. Comp.
Bioch. Physiol., 44B: 953
Fujiti, T. 1972. Recovery of proteins. lapan. Patent No. 01, 633
Gacula, M.C. and Singh, J. Jnr. 1984. Statistical Methods in Food and
Consumer Research. Montreal Acad. Press.
Giovanni, M. 1983. Response surface methodology and product optimization.
Food Technol. 37: 41
Goffinet, G. and Jeuniaux, C. 1979. Distribution et importance quantitative de la
chitine dans les coquilles de Mollusques, Cah. Biol. Mar., 20: 341
Gross, P., Konrad, E., and Mager, H. 1983. Investigations on chitosan as a
natural film-forming ingredient in hair cosmetic products under the
consideration of ecological aspects. Parfuem Kosmetique, 64 (7): 71
Hackman, R.H. 1954. Chitin. 1. Enzymic degradation of chitin and chitin esters.
Austr. J. Biol. SeL, 7: 168
Hackman, R.H. 1960. The occurrence of complexes in which chi tin and protein
are covalently linked. Austr. J. Biol. SeL, 13: 568
Hackman, R.H. and Goldberg, M. 1977. Molecular crosslinks in cuticles. Inseet
Biochem., 7: 175
Hanson, D. 1990. EPA boosts fines for landfilling violations. In: Chemieal and
Engineering News. Nov. 5 ed. Washington.
Henika, R.G. 1982. Use of response surface methodology in sens ory evaluation.
Food Technol. 36: 96
Hirano, S. 1988. Production and Application of chitin and ehitosan in Japan. In:
Chi tin and Chitosan. (Skjak-Braek, G., Anthonsen, T., and Sanford, P.
Eds.), Elsevier Applied Science Pub. New York. p37
Horowitz, S.T., Roseman, S. and Blumenthal, H.J. 1957. Preparation of
glucosamine oligosaccharides. 1. Separation. J. Am. Chem. Soc., 79: 5046
, li-
, I~
107
Horton, D. and Lineback, D.R. 1965. N-deacetylation: chitosan from chitin.
Meth. Carbohydr. Chem., 5: 403
Hunt, S. and Nixon, M. 1981. Comparative study of protein composition in the
chitin-protein complexes of cephalopods. Comp. Biochem. Physiol.. 68B:
535
Jeuniaux, C. 1963. Chitine et Chitinolyse, un chapitre de la biologie molculairc,
Masson, (Paris), pl81
Jeuniaux, C. 1971. Chitinous structures. In Comprehensive Bio.;:hem. (Florkin
and Stotz, Eds.), Elsevier (Amsterdam), 2bC: 595
Jeuniaux, C. 1982. La chitine dans la rgne animal. Bull. Soc. Zool. France,
107:363
Jeuniaux, C., Voss-Foucart, M.F., Poulicek, M., and Bussers, J.C. 1988. Sources
of chitin estimated from new data on chitin biomass and production. In:
Chitin and Chitosan (Skjak-Braek, G., Anthonsen, T., and Sanford, P.,
Eds.), Elsevier Applied Science Pub. New York. p3
Kamasastri, P.V. and Prabhu, P.V. 1961. Preparat!\Jn of d.itin and glucosamine
from prawn shell waste. J. Sci. Ind. Res., 200: 466
Kandaswamy, C.K. 1978. Chemical differences in alpha- and beta-chitins and
their significance in the quality of the by-products of chitin. In: Proc. Ist
Inter. Conf. on Chitin/Chitosan. MIT Sea Grant Report. MITSG 78-7.
p517
Knorr, D. 1982. Functional properties of ehitin and chitosan. J. Food SeL, 47:
593
Knorr, D. 1983. Dye-binding properties of chitin and chitosan. J.Food Sci., 48: 36
Knorr, D. 1984. Use of chitinous polymers in food. Food Technol., 38(1): 85
-
, Il'
, l'
(
108
Knorr, D. and Betschart, A.A. 1978. The relative effect of an inert substance and
protein concentrates on loaf volume of breads. Food Sei & Technol., 11:
198
Knorr, D. and Betschart, A.A. 1981. Water absorption and loaf volume of
prote in fortified breads. Food Sci. & Technol.; 14: 306
Knorr, D. and Klein, J. 1986. Production and conversion of chitosan with
cultures of Mucor rouxii and Phycomyces blakesleeanus. Biotech. Letters,
Vol. 8. No. 10.691
Kong, N. 1975. A feasibility study of new routes to marine polymers chitin and
chitosan. M.S. Thesis, U. of Washington.
Kreag, R. and Smith, F., 1975 "Seafood solid waste in Oregon: disposai or
recovery?" Oregon State Univ. Extension Marine Advisory Program
Report 395. Oregon State Univ, Cornallis, OR.
Lang, G. and Clausen, T. 1988. The use of chitosan in cosmetics. In: Chitin and
Chitosan. (Skjak-Braek, G., Anthonsen, T., and Sanford, P., Eds.),
Elsevier Applied Science Pub. New York. p 139
Lœ, V.F.P. 1974. Solution and shear propertïes of chi tin and chitosan. Michigan,
Xerox Univ. Microfilms. Ann Arbor, MI, 48106.
Lindley, J.A. 1978. Population dynamics and production of Euphausiids. 1
Thylanoessa longicaudata in the North Atlantic Ocean. Mar. Biol., 46: 121
Lindley, J.A. 1982a. Population dynamics and production of Euphausiids.III:
Meganyctiplzanes norvegica and Nyctiplzanes couelli in the North Atlantic
Ocean and the North Sea. Mar. Biol., 66: 37
Lindley, J. A. 1982b. Continuous Plankton Records: Geographical variations in
numerical Abundance, Biomass and Production of Euphausiids in the
North Atlantic Ocean and the North Sea. Mar. Biol., 71: 7
t '·-I)fo
109
Lipke, H., Sugumaran, M., and Henzel, W. 1983. Mechanism of ~clerotization in
Diptera. Advan. Insect PhysÎol., 17: 1-
Lopez-Romero, E. and Ruiz-Herrera, J. 1985. The role of chilin in fungal growth
and morphogenesis. ln: Chi tin in Nature and Technology. (Muzzarelh,
R.A.A., Jeuniaux, c.. and Gooday, G.W. Ed~.), Plenum Pre~~, New York.
p55
Lowy, E. 1909. Veber Krytallinisches Chitosanfal. BlOchem. Zeibchr., 23: 47
Lusena, C.V. and Rose, R.C. 1953. Preparation and vbcosity of chito~an. J. Fi~h.
Res. Board Can., 10: 521
Ma, A.Y.M. and Ooraikul, B. 1986. Optimization of cnzym.ltic hydrolysi~ of
canola meal with response surface methodology. J. Food Proc. Pre~erv.
10: 155
Madhavan, P. and Ramachandran, N.K.G. 1974. Utilization of Prawn Wa~te:
Isolation of chitin and its conversion to chitosan. Fish Technology, Il: 50
McGahren, W.J., Perkinson, G.A., Growich, J.A., Leese, R.A. and Ellestad, G.A.
1984. Chitosap by Fermentation. Process Biochem., 19: 88
Mendenhall, V. 1971. "Utilization and dispo~al of crab and shlÏmp wa~te~". Univ.
of Alaska Sea Grant, Marine Advisory Bull. No. 2. Univ. of Ala~ka,
Fairbanks, AK.
Meyer, K.H. and Wehrli, H. 1937. Chemical comparison or chitin and cellulose.
Helv. Chim. Acta. 20: 353
Mima, S., Miya, M., Iwamoto, Rand Yoshikawa, S. 1982. Highly deacetylated
chitin and its properties. Proc. 2nd Int. Conf. on Chitin/Chito~an.
Sapporro, Japan. (Hirano, S. and Tokura, S. Ed~.), p21
Muzzarelli, R.A.A. 1977. Chitin. Pergamon Press. Oxford N.Y.
MuzzareUi, R.A-A. 1983. Chitin and its derivatives: New Trends of Applied
Research. Carbohydrate Polymers, 3: 53-
,f
. If
L
110
Naczk, M., Synowiecki, J., and Sikorski. Z. E. 1981. The gross chemical
composition of Antartic Krill shell wastes. Food Chem., 7: 175
No, H.K., Meyers, S.P. and Lee, K.S. 1989. Isolation and Chara(;terization of
Chitin from Crawfish Shell Waste. J. of Agric. and Food Chem., 37(3):
575
Okutani, K. 1975. Microorganisms related to the mineralization of chitin in
aquatic environments. In: Nitrogen fixation and nitrogen cycle. (H.
Takahashi Eds.), p147
Panar, M. and Beste, L.F. 1976. Structure of poly( 1,4-benzamide) solutions .
Polymer Preprints. Am. Chem. Soc., 17: 65
Peter, M.G. 1980. Products of in vitrio oxidation of N~acetyldopamine as possible
components in the sclerotization of insect cuticle. Insect Biochem., 10:
221
Peter, M.G., Kegel, G., and Keller, R. 1985. Structural studies on sclerotized
Insect Cuticle. In: Chitin in Nature and Technology. (Muzzarelli, R.A.A.,
Jeuniaux, c., and Gooday, G.W. Eds.), Plenum Press, New York. p21
Peterson, F. 1983. Population dynamics and production of Daphnia galeata
(Crustacea, Cladocera) in Lake Esrom. Holarct. Ecol., 6: 285
Poulicek, M. 1982. "Coquilles et autres structures squelettiques des Mollusques.
Composition chimique, biomass et biodegradation en milieu marin." Ph.D
Thesis, Univ. of Liege. p180
Poulicek, M. and Jeuniaux, C. 1988. Chitin biomass in marine sediments. In:
Chitin and Chitosan. (Skjak-Braek, G., Anthonsen, T., and Sanford, P.
Eds.), Elsevier Applied Science Pub. New York. p151
Poulicek, M., Voss-Foucart, M.F., and Jeuniaux, C. 1985. Chitinoproteic
complexes and mineralization in Mollusk skeletal structures. In: Chi tin in
y li'
111
Nature and Technolog,f. (Muzzarelli, R.A.A., Jeuniaux, C, and Gooday.
G.W. Eds.), Plenum Press. New York. p7
Revah-Moiseev, S. and Carroad, A. 1981. Conversi0n of enzymatic hydrolysate
of shellfish waste chitin to single-cell protem. Biotech. Bioeng .• 23: 1067
Ruiz-Herera, J. 1978. The dl~tribution and qualitative importance of chitin in
fungi. In: Proc. 1st Int. Conf. ChitinjChitosan. (Muzzarelli. R.A.A. and
E.R. Pariser Eds.), MIT Sea Grant Report 78-7. pil
Rutherford, F.A. and Austin, P.R. 1978a. Chitin ~olvents, complexes and
properties. Univ. of Delaware Sea Grant Publ. No DEL-SG-13-78
Rutherford, F.A. and Austin, P.R. 1978b. Marine chitin propertlc!o. and !o.olvent!o..
In: Proc. 1st Inter. Conf. ChitinjChitosan. MIT Sea Grant Report.
MITSG 78-7 P 182
Ryan, 'V.H. and Yankowski, E.L. 1969. Photographie image-receiving mate rial.
Ger. 1, 116: 969
Sanford, P. 1988. Chitosan: commercial uses and potential applications. In:
Chitin and Chitosan. (Skjak-Braek, G., Anthonsen, T., and Sanford, P.
Eds.), Elsevier Applied Science Pub. New York. p53
Sannan, T., Kurita, K., Iwakura, Y. 1976. Studies on chitin, 2. Makromol. Chem.
177:3589
Seki, H. and l'aga, N. 1963a. Microbiologkal Studies on the decomposition of
chitin in marine environment. 1 and II. J. Oceanog. Soc. Japan, 19(2): 27
Seki, H. and Taga, N. 1963b. Microbiological Studies on the decomposition of
chitin in marine env~iOnment. J. Oceanog. Soc. J apan, 19(3): 23
Seki, H. and Taga, N. 1965a. Microbiological Studies on the decompm,ition of
chitin in marine environment. VI. 1. Oceanog. Soc. Japan, 20(6): 18
• III'
.(
, II/'>
112
Seki, H. and Taga, N. 1965b. Microbiological Studies on the de composition of
chitin in marine environment. IX and X. J. Oceanog. Soc. Japan, 21(6):
17
Shimahara, W.A. and Tagikuchia Y. 1988. Preparation of crustacean chitin.
Methods in Enzymology, 161: 416
Shimahara, K., Ohkouchi, K., and Ikeda, M. 1982. A new isolation method of
crustacean chitin using a proteolytic bacterium, Pseudomonas maltoplzilia.
ln: Proc. 2nd Int. Conf. of The Japanese Society of Chitin and Chitosan.
Sapporro, Japan. (Hirano, S. and Tokura, S. Eds.), plO
Shimahara, K., Tagikuchi, V., Kobayachi, J., Uda, K., and Sanoan, T. 1988.
Screening of Mucoraceae strains suitable for chitosan production. In:
Chitin and Chitosan. (Skjak-Braek, G., Anthonsen, T., and Sanford, P.
Eds.), EJ~evier Applied Science Pub. New York. p171
Shroder, DJ. and Busta, F.F. 1973. Effects of synthetic meat components on
growth of Clostridium perfringens. J. Milk Food Technol., 36: 189
Simpson, K.L. 1978. The recovery of protein and pigments from shrimp and crab
meals and their use in salmonid pigmentation. In: Proc. Ist Inter. Conf.
Chitin/Chitosan. MIT Sea Grant Report MITSG 78-7. p354
Smith, J.P., Khanizadeh, S., van de Voort, F.R., Hardin, R., Ooraikul, Bo, and
Jackson, EoD. 1988. Use of response surface methodology in shelf life
extension studies of a bakery product. Food Microbiol. 5: 163
Sosulski, F.Wo 1962. The centrifuge method for determining flour absorption in
hard red spring wheats. Cereal Chem. 39: 344
Soto-Peralta, N.V., Miller, H., and Knorr, D. 1989. EtTects of chitosan treament
on the clarity and colour of Apple Juice. J. of Food Sc.,54 (2): 495
Statistical Analysis System. 1982. SAS User's Guide: Basics, Version 5. SAS
Institute, Cary, North Carolina.
, II'
, ,1'
113
Steel R.G.D. and Torrie, J.H. 1980. Principles and Procedures of Statistics.
McGraw Hill. New York. p 168
Stun, H. and Robinson, J. 1985. Anaerobie decomposition of chi lin in
freshwater sediments. In: Chitin in Nature and Technology. (Muzzarelli,
R.A.A., Jeuniaux, c., and Gooday. G.W. Eds.), Plenum Pres~. New York.
p531
Takeda, M. and Abe, E. 1962. Isolation of ,;:rustacean chitin. Decalcification hy
disodium ethylenediaminetetraaœtate and enzymic hydrolysis of
incidental proteins. Norisho Suisan Koshusho Kenkyu Hokoku, Il: 339
Takeda, M. and Katsuura, H. 1964. Purification of king crab chitin. Suisan
Daigaku Kenkyu Hokoku, 13: 109
Thompson, D. 1982. Response surface experimentation. J.Food Proc. Preserv. 6:
189
van de Voort, F.R. and Stanley, D.W. 1984. Improved utilization of dairy
proteins: coextrusion of casein and wheat flour. J. Dairy Sei., 67: 747
Vincent, J.F.V. and Hillerton, J.E. 1978. The tanning of insect cuticle: A Critical
Review and Revised Mechanism. J. Insect Physiol., 25: 653
Von-Furth, O. and Russo, M. 1906. Veber Kristallinische
Chitosanverbendungen aus Sepienshulpen. Bin Beitrag zur Kenntnis des
Chitins. Beitr. Chem. Physiol., Path. 8: 163
Wames, C.E. and Randles, CJ. 1977. Preliminary studies on chitin
decomposition in Lake Erie sediments. Ohio J. SeL, 77(5): 224
Watkins, T.R. and Knorr, D. 1983. In vivo dye binding of chitin and its effects on
gerbil growth and gut function. Nutrition Reports Inter., 27: 189
Wester, D.H. 1909. Chitin. Arch. Pharm., 247: 282
Whistler, R.L. and BeMiller, J.N. 1962. Chitin. J. Orge Chem., 27: 1161
(
(
, • If-
, II'
(
114
White, S.A., Farina, P.R. and Fulton, 1. 1979. Production and Isolation of
Chitosan from Mucor rouxii. Applied and EnvironJ:1ental Microbiology,
38 (2): 323
Wu, AoC.M. and 8ough, W.A. 1978. Proe. Ist Int. Conf. Chitin/Chitosan, MIT
Sea Grant Report, 78-7. USA. p88
Wu, A.C.M., Bough, W.A., lIolmes, M.R., and Perkins, B.E. 1978. Influence of
manufacturing variables on the charaeteristics and effectiveness of
ehitosan products. III. Coagulation of Cheese Whey Solids. Biotechno1.
Bioeng., 20: 1957
Yamamoto, H. and Seki, H. 1979. Impact of nutrient enrichment in a water
chestnut eeosystem at Takahama-Iri bay of Lake Kasimugaura. Japan. IV.
Population dynamics of secondary producers as indicated by chitin. Water
Air Soil Pollution. 12: 519
Yanase, M. 1975. Chemical composition of the Exoskeleton of Antartie krill.
Bull. Tokai Reg. Fish Res. Lab., 83: 1
Yang, T. and Zall, R.R. 1984. Chitosan membranes for reverse osmosis
application. J. Food Sei., 49: 91
Yusof, S., Talib, Z. Mohamed, S., and Abu Baker, A. 1988. Use of response
surface methodology in the development of guava concentrate. J. Sci.
Food Agric. 43: 173
![Chitin, Chitinases and Chitin Derivatives in ... · Properties of chitin. Chitin is not soluble in water due to the strong intermolecular hydrogen bonding [28]. But there are certain](https://img.pdfslide.net/doc/110x75/606102637fe188054a2eb573/chitin-chitinases-and-chitin-derivatives-in-properties-of-chitin-chitin-is.jpg)