Embed Size (px)
Citation preview
R
E P
O
R
T
2001
Alberta Reproductive Health:Pregnancy Outcomes

ISSN 1480-1876For additional copies, please contact:
CommunicationsAlberta Health and Wellness
(780) 427-7164
Alberta Reproductive Health: Pregnancy Outcomes (2001)
___________________________________________________________________
i
Reproductive Health Report Working Group:
Dr. Xinjie Cui (Project Lead) Health Surveillance, Alberta Health and WellnessDr. Leslie Twilley Health Surveillance, Alberta Health and WellnessBetty Jennissen Alberta Medical AssociationGary Gilham Standards and Measures, Alberta Health and WellnessDr. Fu-Lin Wang Health Surveillance, Alberta Health and Wellness
Reproductive Health Report Review Committee:
Dr. Xinjie Cui (Chair) Health Surveillance, Alberta Health and WellnessMargaret King Health Surveillance, Alberta Health and WellnessGrace Guyon Alberta Medical AssociationLarry Svenson Health Surveillance, Alberta Health and WellnessLynn Damberger Population Health Strategies, Alberta Health and WellnessNancy Bott Northern and Central Alberta Perinatal Outreach ProgramJeannie Yee Southern Alberta Perinatal Outreach ProgramCelia Posyniak Kensington Clinic, CalgaryKelly Deis Aspen Regional Health AuthorityPatricia Pelton Northern Lights Regional Health AuthorityKathy Ahearn David Thompson Regional Health AuthorityKaren Martin Regional Health Authority 5Cheryl Ferguson Regional Health Authority 5Noreen Walker Alberta Association of Midwives
Alberta Medical Association Committee on Reproductive Care:
Member RepresentingDr. Carolyn A. Lane (Chair) CalgaryDr. Stuart J. Iglesias Rural Physicians, HintonDr. Duncan J. McCubbin Level II Obstetrics, Medicine HatDr. Douglas D. McMillan Level III Neonatology, CalgaryDr. Reginald S. Sauve Neonatal Follow-up, CalgaryDr. Rebecca L. Simrose Level III Obstetrics, CalgaryDr. Cynthia L. Trevenen Pathology, CalgaryDr. S. Nan Schuurmans Alberta Society of Obstetrics & Gynecology, EdmontonDr. Benjamin Wong Professional Association of Residents of Alberta, EdmontonMs. Zahra M. Kassam Medical Student Body, EdmontonDr. Leonard Evenson Office Consultant, EdmontonDr. Albert Aikerman Southern Alberta Perinatal Advisory Committee, CalgaryDr. John Waters Alberta Health & Wellness, EdmontonDr. M. Robin Smith Community Health Services, EdmontonMs. Ann Hense Perinatal Outreach Education, EdmontonDr. Beverley O'Brien Alberta Association of Midwives, Edmonton
Alberta Reproductive Health: Pregnancy Outcomes (2001)
___________________________________________________________________
ii
Table of Contents
LIST OF TABLES ............................................................................................................................................. IV
LIST OF FIGURES AND MAPS..................................................................................................................... VII
EXECUTIVE SUMMARY .................................................................................................................................. 1
OVERVIEW ......................................................................................................................................................... 1FERTILITY .......................................................................................................................................................... 2BIRTH OUTCOMES .............................................................................................................................................. 2MATERNAL BEHAVIOURS ................................................................................................................................... 2REPRODUCTIVE CARE SERVICES ......................................................................................................................... 3MORTALITY ....................................................................................................................................................... 3
INTRODUCTION................................................................................................................................................ 4
DATA SOURCES .................................................................................................................................................. 4METHODOLOGY AND LIMITATIONS ..................................................................................................................... 4
TIME TRENDS FOR MAJOR INDICATORS OF REPRODUCTIVE HEALTH............................................ 7
NATIONAL COMPARISONS ............................................................................................................................ 8
FERTILITY ......................................................................................................................................................... 9
FERTILITY RATES................................................................................................................................................ 9ESTIMATED PREGNANCIES ................................................................................................................................ 12CONCEPTION/BIRTH MONTH .............................................................................................................................. 14MATERNAL AGE............................................................................................................................................... 15
BIRTH OUTCOMES......................................................................................................................................... 17
SPONTANEOUS ABORTIONS............................................................................................................................... 17LIVE BIRTHS .................................................................................................................................................... 18STILLBIRTHS .................................................................................................................................................... 18PERINATAL MORBIDITY.................................................................................................................................... 20CONGENITAL ANOMALIES ................................................................................................................................ 20BIRTH WEIGHT................................................................................................................................................. 23
Low birth weight ......................................................................................................................................... 23High birth weight ........................................................................................................................................ 28
PRE-TERM BIRTHS ........................................................................................................................................... 31MULTIPLE BIRTHS ............................................................................................................................................ 35
MATERNAL BEHAVIOURS............................................................................................................................ 39
RISK FACTORS ................................................................................................................................................. 39Smoking...................................................................................................................................................... 39Alcohol consumption................................................................................................................................... 39Use of street drugs ...................................................................................................................................... 39
PRENATAL CLASSES ......................................................................................................................................... 40BREASTFEEDING INITIATION ............................................................................................................................. 40
REPRODUCTIVE CARE SERVICES.............................................................................................................. 42
INDUCED ABORTIONS ....................................................................................................................................... 42DELIVERIES...................................................................................................................................................... 43
Type of Labour............................................................................................................................................ 43Epidural Analgesia ..................................................................................................................................... 45Method of Delivery ..................................................................................................................................... 47
Alberta Reproductive Health: Pregnancy Outcomes (2001)
___________________________________________________________________
iii
Breech Deliveries........................................................................................................................................ 50
MORTALITY .................................................................................................................................................... 52
PERINATAL MORTALITY ................................................................................................................................... 52NEONATAL MORTALITY .................................................................................................................................... 54POST-NEONATAL MORTALITY ........................................................................................................................... 55CAUSES OF PERINATAL, NEONATAL, AND POST-NEONATAL DEATHS ................................................................... 56RISK FACTORS ASSOCIATED WITH PERINATAL AND NEONATAL MORTALITY......................................................... 58WIGGELSWORTH CLASSIFICATION OF PERINATAL AND NEONATAL DEATHS ......................................................... 59INFANT MORTALITY ......................................................................................................................................... 60MATERNAL MORTALITY ................................................................................................................................... 63
REFERENCES................................................................................................................................................... 64
APPENDIX 1: DEFINITION OF STILLBIRTH AND INFANT DEATH....................................................... 66
APPENDIX 2: GLOSSARY............................................................................................................................... 67
APPENDIX 3: CODES USED FOR DATA EXTRACTION ............................................................................ 69
APPENDIX 4: EPIDEMIOLOGIC MEASURES FOR MAPS......................................................................... 71
APPENDIX 5: PERINATAL MORBIDITY REPORT BY DR. CHARLENE ROBERTSON........................ 74
APPENDIX 6: TABLES .................................................................................................................................... 77
Alberta Reproductive Health: Pregnancy Outcomes (2001)
___________________________________________________________________
iv
List of Tables
Note: Titles for tables that appear in the text of the report are in italics below; titles for tables appearing inAppendix 6 are in plain text.
Time Trends for Major Indicators of Reproductive Health, Alberta, 1985 – 1999 ....................................7National/Provincial Comparisons of Major Indicators of Reproductive Health, 1997 ...............................8Table A1 Selected Indicators of Pregnancy Outcomes, Alberta, 1985 - 1999
Fertility
Table A2 Live Births and General Fertility Rates by Residence RHA, Alberta, 1985 - 1999Table A3 Live Births by Age Group of Mother, and Age-Specific Fertility Rates, Alberta, 1985 - 1999Table A4 Age-Specific Fertility Rates and Total Fertility Rate by Residence RHA, Alberta, 1997 - 1999Table A5 Estimated Pregnancy (Live Births, Stillbirths, Spontaneous Abortions, and Induced Abortions)
Rates by Age Group, Alberta, 1985 - 1999Table A6 Estimated Pregnancy (Live Births, Stillbirths, Spontaneous Abortions, and Induced Abortions)
Rates by Residence RHA, Alberta, 1985 - 1999Table A7 Mean Number of Live Births and Conceptions of Live Births per Day, by Month, Alberta, 1985 -
1999 CombinedTable A8 Mean Maternal Age at First Live Birth, Stillbirth and Total Live Birth, Alberta and Canada, 1985 -
1999Selected Pregnancy Outcomes by Maternal Age Group, Alberta, 1997 - 1999 Combined......................15Mean Maternal Age by Residence RHA, Alberta, 1997 - 1999 Combined ..............................................16
Birth Outcomes
Spontaneous AbortionsTable A9 Spontaneous Abortions, Rate per 1,000 Women and Rate per 100 Estimated Pregnancies, by
Maternal Age Group, Alberta, 1986 - 1999Table A10 Spontaneous Abortion Rates (per 100 Estimated Pregnancies, and per 1,000 Women aged
15-49) by Residence RHA, Alberta, 1986 - 1999.Live BirthsTable A11 Total Births by Level of Hospital, Alberta, 1986 - 1998StillbirthsTable A12 Stillbirths and Stillbirth Rates by Maternal Age Group, Alberta, 1985 - 1999Table A13 Stillbirths by Birth Weight Categories, Alberta, 1985 - 1999Table A14 Stillbirths by Birth Weight Distribution and Time of Death, Alberta, 1998Congenital AnomaliesTable A15 Number and Rate (per 1,000 Total Births) of Selected Congenital Anomalies, Alberta, 1985 -
1999Table A16 Selected Congenital Anomalies and Rates (per 1,000 Live Births) by Maternal Age, Alberta,
1985 – 1999 CombinedBirth WeightTable A17 Live Births by Birth Weight Categories, Alberta, 1985 - 1999Low Birth WeightTable A18 Low Birth Weight Rate for Singleton Term Births, Alberta, 1985 - 1999Table A19 Low Birth Weight (<2500 grams) Births by Term/Pre-term and Singleton/Multiple, Alberta, 1985
- 1999Table A20 Low Birth Weight (<2500 grams) Births by Residence and Facility RHA, Alberta, 1985 - 1999Table A21 Low Birth Weight, Pre-term, and High Birth Weight Births by Residence and Facility RHA,
Alberta, 1997 - 1999 combinedTable A22 Low Birth Weight (<2500 grams) Live Births and Low Birth Weight Live Birth Rate by Age
Group of Mother, Alberta, 1985 - 1999Table A23 Singleton Birth Small or Large for Gestational Age, High Birth Weight, and Mean Birth Weight,
Alberta, 1985 - 1999
Alberta Reproductive Health: Pregnancy Outcomes (2001)
___________________________________________________________________
v
Table A24 Small for Gestational Age (SGA) and Large for Gestational Age (LGA) Rates by ResidenceRHA, Alberta, 1997 - 1999 combined
High Birth WeightTable A25 High Birth Weight (≥4,000 grams) Rate by Residence and Facility RHA, Alberta, 1985 - 1999Table A26 High Birth Weight (≥4,000 grams) Rate by Maternal Age Group, Alberta, 1985 - 1999Pre-term BirthsTable A27 Pre-term (<37 weeks gestation) Births by LBW/not LBW and Singleton/Multiple, Alberta, 1985 -
1999Table A28 Live Singleton and Multiple Pre-term Birth Rates, Alberta, 1985 - 1999Table A29 Pre-term (<37 weeks gestation) Live Births by Residence and Facility RHA, Alberta, 1985 -
1999Table A30 Pre-term (<37 weeks gestation) Live Births and Pre-term Live Birth Rate by Age Group of
Mother, Alberta, 1985 - 1999Pre-term Birth Rate (per 100 live births) by Maternal Age Group, Alberta and Canada, 1997.................32Multiple BirthsTable A31 Multiple Pregnancies, Multiple Births and Perinatal Deaths of Multiple Births by Facility RHA
and Hospitals, Alberta, 1998Table A32 Multiple Pregnancies, Multiple Births and Perinatal Deaths of Multiple Births, Alberta, 1982 -
1998Table A33 Twin, Triplet and Quadruplet Live Births and Percent of Multiple Births, Alberta, 1985 - 1999Table A34 Multiple Live Births by Residence and Facility RHA, Alberta, 1985 - 1999Table A35 Multiple Birth Rate (per 100 Live Births) by Residence and Facility RHA, Alberta, 1997 - 1999
CombinedTable A36 Live Multiple Births and Live Multiple Birth Rate by Age Group of Mother, Alberta, 1985 - 1999Table A37 Stillbirth Rate, Low Birth Weight Rate and Pre-term Birth Weight of Multiple Births, Alberta,
1985 - 1999
Maternal Behaviours
Risk FactorsTable A38 Prevalence of Smoking, Alcohol Consumption and Street Drug Use During Pregnancy,
Alberta, 1997 - 1999Table A39 Selected Indicators for Live Births, by Risk Factors, Alberta, 1997 - 1999 CombinedPrenatal ClassesTable A40 Selected Indicators for Live Births, by Prenatal Class Attendance, Alberta, 1997 - 1999
CombinedBreastfeeding InitiationTable A41 Breastfeeding Upon Discharge Rates by Facility RHA, Alberta, 1996 - 1998
Reproductive Services
Induced AbortionTable A42 Induced Abortions by Age, and Age-Specific Induced Abortion Rates, Alberta, 1985 - 1999Table A43 Induced Abortions by Facility Type, Alberta, 1985 - 1999Table A44 Induced Abortions by Facility Regions, Alberta, 1985 - 1999Table A45 Induced Abortions and Induced Abortion Rate by Residence RHA, Alberta, 1986 - 1999Table A46 Induced Abortions by Week of Gestation and Age Group, Alberta, 1997 - 1999Table A47 Induced Abortions by Week of Gestation and Facility Type, Alberta, 1985 - 1999Type of LabourTable A48 Induction Rates, Alberta, 1985 - 1999Table A49 Induction Rates by Residence RHA, Alberta, 1997 - 1999Epidural AnalgesiaTable A50 Epidural Rate by Facility RHA, Alberta, 1998, Compared to Rates in 1994Table A51 Epidural Rate by Level of Facility, Alberta, 1998Method of DeliveryTable A52 Operative and Vaginal Breech Deliveries, Alberta, 1985 - 1999Table A53 Methods of Delivery by Residence RHA, Alberta, 1997 - 1999Table A54 Cesarean Sections (All Weights), Primary and Repeat Rates by Facility RHA, Alberta, 1998
Alberta Reproductive Health: Pregnancy Outcomes (2001)
___________________________________________________________________
vi
Table A55 Cesarean Section and Vaginal Birth After Cesarean (VBAC) Rates, Alberta, 1992 - 1998Breech DeliveriesTable A56 Breech Deliveries by Level of Hospital, Alberta, 1998Table A57 Breech Presentation Mortality Rates by Level of Hospital, Alberta, 1998Table A58 Breech Presentation Mortality Rates, Alberta, 1994 - 1998
Mortality
Perinatal, Neonatal and Post-Neonatal MortalityTable A59 Weight Specific Perinatal and Neonatal Mortality, Alberta, 1998Table A60 Weight Specific Perinatal and Neonatal Mortality, Alberta, 1994 - 1998 CombinedTable A61 Perinatal and Neonatal Mortality Rates by Length of Gestation, Alberta, 1998Table A62 Perinatal and Neonatal Mortality Rates by Length of Gestation, Alberta, 1994 - 1998 CombinedTable A63 Perinatal and Neonatal Mortality Rates By Maternal Age, Alberta, 1998Table A64 Perinatal and Neonatal Mortality Rates by Facility RHA, Alberta, 1998Table A65 Perinatal and Neonatal Mortality Rates by Level of Hospital, Alberta, 1998Table A66 Perinatal and Corrected (for Major Anomalies) Perinatal Mortality Rates by Facility RHA,
Alberta, 1998Table A67 Neonatal, Post-neonatal and Infant Mortality Rates, Alberta, 1985 - 1999Table A68 Perinatal and Corrected (for Major Anomalies) Perinatal Mortality Rates by Facility RHA,
Alberta, 1998Table A69 Neonatal, Post-neonatal and Infant Mortality Rates By Residence and Facility RHA, Alberta,
1997 - 1999 combinedCauses of Perinatal, Neonatal, and Post-Neonatal DeathsTable A70 Perinatal and Late Neonatal Mortality by Cause of Death (Birth Weight ≥500g), Alberta, 1998Table A71 Summary of Antepartum Deaths ≥2500 grams, Alberta, 1998Table A72 Causes of Death for Intrapartum and Neonatal Deaths ≥2500 grams (Excluding Congenital
Anomalies), Alberta, 1998Table A73 Major Anomalies as Cause of Death, Alberta, 1998Table A74 Major Anomalies as Cause of Death, Alberta, 1994 – 1998Wiggelsworth Classification of Perinatal and Neonatal DeathsTable A75 Wiggelsworth Classification of Perinatal and Neonatal Deaths, Alberta, 1998Table A76 Wiggelsworth Classification of Perinatal and Neonatal Deaths, Alberta, 1994 - 1998Table A77 Neonatal Deaths >37 weeks Gestation, Stillbirths, and Neonatal Deaths with Defined Specific
Conditions, Alberta, 1994 - 1998Infant MortalityTable A78 Infant Deaths by Residence RHA and Facility RHA, Alberta, 1985 - 1999Table A79 Infant Mortality Rates by Gender, Alberta, 1985 - 1999Infant Mortality Rate (per 1,000 live births) by Gender, Alberta and Canada, 1997 ................................60Maternal MortalityTable A80 Maternal Mortality Totals and Rates, Alberta, 1961 - 1998
Alberta Reproductive Health: Pregnancy Outcomes (2001)
___________________________________________________________________
vii
List of Figures and Maps
Fertility
Figure 1 General Fertility Rate (per 1,000 Women Aged 15-49), Alberta, 1985 to 1999 .................... 9Figure 2 Age-Specific Fertility Rate (per 1,000 Women Aged 15-49), Canada and Alberta, 1997.... 10Map 1 General Fertility Rate (per 1,000 Women Aged 15-49), Alberta, 1999............................... 11Figure 3 Estimated Pregnancies, Alberta, 1986 to 1999................................................................. 12Figure 4 Estimated Pregnancy Rate (per 1,000 Women Aged 15-49) by Maternal Age Group, Alberta,
1997 to 1999 Combined.............................................................................................. 13Figure 5 Mean Number of Live Births and Live Birth Conceptions per Day, by Month, Alberta, 1985 to
1999 Combined .......................................................................................................... 14Figure 6 Mean Maternal Age (Years), Alberta, 1985 to 1999.......................................................... 16
Birth Outcomes
Spontaneous AbortionsFigure 7 Spontaneous Abortion Rate (per 100 Estimated Pregnancies), by Maternal Age Group,
Alberta, 1997 to 1999 Combined...................................................................................... 17StillbirthsFigure 8 Stillbirth Rate (per 1,000 Total Births), Alberta, 1985 to 1999............................................ 19Figure 9 Stillbirth Rate (per 1,000 Total Births) by Maternal Age Group, Alberta, 1985 to 1999....... 19
Congenital AnomaliesFigure 10 All Congenital Anomalies Combined Rate (per 1,000 Total Births), Alberta, 1985 to 1999 20Figure 11 Neural Tube Defect Rate (per 1,000 Total Births), Alberta, 1985 to 1999.......................... 21Figure 12 All Congenital Anomalies Combined Rate (per 1,000 Live Births) by Maternal Age Group,
Alberta, 1985 to 1999....................................................................................................... 21Figure 13 All Down Syndrome Rate (per 1,000 Live Births) by Maternal Age Group, Alberta, 1985 to
1999 ......................................................................................................................... 22
Low Birth WeightFigure 14 Low Birth Weight Rate (per 100 Live Births), Alberta, 1985 to 1999.................................. 24Figure 15 Low Birth Weight Rate (per 100 Live Births) by Maternal Age Group, Alberta, 1997 to 1999
Combined........................................................................................................................ 25Map 2 Low Birth Weight Rate (per 100 Live Births) by Residence RHA, Alberta, 1997 to 1999
Combined........................................................................................................................ 26Map 3 Small for Gestational Age Singleton Birth Rate (per 100 Live Singleton Births) by Residence
RHA, Alberta, 1997 to 1999 Combined............................................................................. 27
High Birth WeightFigure 16 High Birth Weight Rate (per 100 Live Births), Alberta, 1985 to 1999 ................................. 28Map 4 High Birth Weight Rate (per 100 Live Births) by Residence RHA, Alberta, 1997 to 1999
Combined........................................................................................................................ 29Map 5 Large for Gestational Age Singleton Birth Rate (per 100 Live Singleton Births) by Residence
RHA, Alberta, 1997 to 1999 Combined............................................................................. 30
Pre-term BirthsFigure 17 Pre-term Birth Rate (per 100 Live Births), Alberta, 1985 to 1999....................................... 32Figure 18 Pre-term Birth Rate (per 100 Live Births) by Maternal Age Group, Alberta, 1997 to 1999
Combined........................................................................................................................ 33Map 6 Pre-term Birth Rate (per 100 Live Births) by Residence RHA, Alberta, 1997 to 1999
Combined........................................................................................................................ 34
Multiple BirthsFigure 19 Multiple Birth Rate (per 100 Live Births), Alberta, 1985 to 1999 ........................................ 36
Alberta Reproductive Health: Pregnancy Outcomes (2001)
___________________________________________________________________
viii
Figure 20 Multiple Birth Rate (per 100 Live Births) by Maternal Age Group, Alberta, 1997 to 1999Combined........................................................................................................................ 37
Map 7 Multiple Birth Rate (per 100 Live Births) by Residence RHA, Alberta, 1997 to 1999Combined........................................................................................................................ 38
Maternal Behaviours
Breastfeeding InitiationMap 8 Breastfeeding Initiation Rate (per 100 Women Delivering) by Facility RHA, Alberta, 1996 to
1998 Combined ............................................................................................................... 41
Reproductive Services
Induced AbortionFigure 21 Induced Abortion Rate (per 1,000 Women Aged 15-49), Alberta, 1985 to 1999 ................ 42
Type of LabourFigure 22 Total Induction Rate (per 100 Hospital Deliveries), Alberta, 1985 to 1999......................... 43Map 9 Total Induction Rate (per 100 Hospital Deliveries) by Residence RHA, Alberta, 1997 to 1999
Combined........................................................................................................................ 44
Epidural AnalgesiaFigure 23 Epidural Analgesia in Labour and Delivery Rate (per 100 Deliveries), Alberta, 1994 and 1998
......................................................................................................................... 45Map 10 Epidural Analgesia Rate (per 100 Hospital Deliveries) by Facility RHA, Alberta, 1998 ...... 46
Method of DeliveryFigure 24 Operative Deliveries (per 100 Hospital Births), Alberta, 1985 to 1999............................... 48Map 11 Cesarean Section Rate (per 100 Hospital Deliveries) by Residence RHA, Alberta, 1997 to
1999 Combined ............................................................................................................... 49
Mortality
Perinatal, Neonatal and Post-Neonatal MortalityFigure 25 Perinatal Mortality Rate (per 1,000 Total Births), Alberta, 1985 to 1999 ............................ 52Figure 26 Perinatal Mortality Rate (per 1,000 Total Births) and Neonatal Mortality Rate (per 1,000 Live
Births) by Birth Weight, Alberta, 1994 to 1998 Combined ................................................. 53Figure 27 Perinatal Mortality Rate (per 1,000 Total Births) and Neonatal Mortality Rate (per 1,000 Live
Births) by Gestational Age, Alberta, 1994 to 1998 Combined............................................ 53Figure 28 Neonatal Mortality Rate (per 1,000 Live Births), Alberta, 1985 to 1999 ............................. 54Figure 29 Post-neonatal Mortality Rate (per 1,000 Live Births), Alberta, 1985 to 1999...................... 55
Causes of Perinatal, Neonatal, and Post-Neonatal DeathsFigure 30 Percent of Post-neonatal Deaths due to Sudden Infant Death Syndrome, Alberta, 1985 to
1999 ......................................................................................................................... 57Figure 31 Sudden Infant Death Syndrome Rate (per 1,000 Live Births), Alberta, 1985 to 1999......... 57
Infant MortalityFigure 32 Infant Mortality Rate (per 1,000 Live Births), Alberta, 1985 to 1999 .................................. 61Map 12 Infant Mortality Rate (per 1,000 Live Births) by Residence RHA, Alberta, 1997 to 1999
Combined........................................................................................................................ 62
Maternal MortalityFigure 33 Direct Maternal Mortality Rate (per 10,000 Live Births), Alberta, 1961 to 1995.................. 63
Alberta Reproductive Health: Pregnancy Outcomes (2001)
___________________________________________________________________
1
Executive Summary
This report follows the December 1999 Alberta Reproductive Health: Pregnancy Outcomesreport. The December 1999 report was based on data for 1985 to 1998. The current report is based onthe most recent available Alberta data, which includes data up to the end of 1998 or 1999, depending onthe source. New to the report are congenital anomalies data, expanded information on high birth weightrates, maternal risk factors data, prenatal class attendance rates, breastfeeding initiation rates, epiduralanalgesia rates, and causes of death information. Spontaneous abortion data appear in this report after ayear’s absence.
Data sources for this report include: Vital Statistics, Alberta Health and WellnessAdministrative databases, Statistics Canada publications, Health Canada publications, hospital statisticsreported to the Alberta Medical Association (AMA) Committee on Reproductive Care, case information,and the offices of the medical examiners. Information on live births, stillbirths, spontaneous abortions,induced abortions, procedures related to delivery, breastfeeding initiation, congenital anomalies, andperinatal, neonatal, infant, and maternal mortality is provided. Wherever possible and appropriate, dataare broken down for regional health authority, age groups, time trends, and risk factors. “Residence RHA”refers to the regional health authority in which the mother resided at the time of the relevant event, and“Facility RHA” refers to the regional health authority where the relevant event occurred.
OOvveerrvviieewwThis report is produced with the goal of providing quality information of a timely nature to all
parties for whom knowledge of trends in the reproductive health of Albertans is valuable. There are nowfifteen years of data included in the report, and the reproductive health of Albertans has undergoneprofound changes during that period. Fertility rates have decreased strikingly. Average maternal age hasincreased. Low birth weight and pre-term births have become more common. High birth weight births andmultiple births have also increased in frequency. Induced abortion rates have increased. Induction oflabour has become much more widespread, and epidural analgesia in labour rates have increased inmost regions. Infant death rates have decreased noticeably.
Fertility rates are declining for women under 30 years, and increasing for women aged 30-44 years. From 1996 to 1999, women aged 30-34 had higher fertility rates than women aged 20-24. Theimplications of delayed childbearing are widespread, with the health of both mothers and children ofconcern. Older mothers tend to have a higher risk of complications during pregnancy and delivery. Birthsto older mothers are also associated with poorer outcomes, including congenital anomalies, pre-termbirths, and low birth weight births.
The rate of all congenital anomalies combined was at a fifteen-year low in 1999, thoughtrends vary with different anomalies. Congenital anomalies are more common in mothers over 35.
Low birth weight rates increased from 1995 to 1998, and fell to a five-year low in 1999.Alberta’s pre-term birth rate has increased over the last several years, reaching the fifteen-year high in1999. Because prematurity and low birth weight are associated with increased perinatal and neonatalmortality and childhood morbidity, pre-term and low birth weight rates are of critical concern to the healthsystem. Part of the increase in pre-term and low birth weight births can be attributed to increasingmaternal age, and also to the use of in-vitro fertilization (IVF) techniques. IVF contributes to highermultiple birth rates as well. The multiple birth rate in Alberta has risen since 1996 and was at a fifteen-year high in 1999. High birth weight rates continue to increase, reaching the fifteen-year high in 1999.
Maternal smoking occurred in 26.4% of pregnancies resulting in live births between 1997 and1999. One-third of mothers attended prenatal classes between 1997 and 1999. Approximately 83% ofmothers initiated breastfeeding in 1998.
Induced abortions rates declined somewhat in 1999, after peaking in 1997 and 1998.Labour was induced in approximately one-quarter of deliveries in 1999; labour induction is an
increasing trend. Epidural analgesia use has risen noticeably; epidural analgesia was used in 27.5% ofdeliveries in 1998, though the rate varied widely with region and hospital. Cesarean section rates haveincreased slightly in recent years.
Alberta Reproductive Health: Pregnancy Outcomes (2001)
___________________________________________________________________
2
The infant mortality rate remains low, though it was higher in 1999 than the fifteen-year lowreached in 1997. Neonatal and post-neonatal mortality rates also remain low. Perinatal mortality rates donot show systematic time trends.
FFeerrttiilliittyy• General fertility rate (number of live births per 1,000 women aged 15-49) continued a
fifteen-year decline, with a 27.8% drop between 1985 and 1999, from 66.1 to 47.7.• The estimated pregnancy rate (per 1,000 women aged 15-49, including live births,
stillbirths, spontaneous abortions, and induced abortions) has dropped correspondingly. The1999 rate was 66.7, the fifteen-year low. The fifteen-year high of 79.8 occurred in 1986.
• Average maternal age at delivery has changed minimally over the last few years after adecade of steady increase. The average age of mothers at delivery was 28.2 years in 1999,which is 1.7 years higher than the fifteen-year low of 26.5 years, occurring in 1985.
BBiirrtthh OOuuttccoommeess• The spontaneous abortion rate (per 100 estimated pregnancies) has declined since 1995,
after peaking from 1991 to 1994. The 1999 rate was 8.7.• The number of live births has consistently decreased, from 43,327 in 1985 to 37,797 in
1999.• The number of stillbirths has remained relatively constant for the last fifteen years, usually
within the range of 250 to 300 per year. In 1998, there were only 191 stillbirths (as registeredby Vital Statistics), which was the fifteen-year low. There were 267 stillbirths in 1999.
• The rate of congenital anomalies shows a decreasing trend over the last 15 years. Therate for all congenital anomalies combined (per 1,000 total births) was 31.1 in 1999, thefifteen-year low. The fifteen-year high was 48.5, in 1990.
• The low birth weight rate (live births less than 2,500 grams, per 100 live births) is at a fiveyear low, with a 1999 rate of 5.9. This compares with the fifteen-year low of 5.4 in 1985.• The low birth weight rate varies with residence RHA. For 1997 to 1999 combined, the low
birth weight rate in RHA 4 exceeded the provincial average, while RHAs 1, 5, 11, 12 and13 had low birth weight rates which were lower than the provincial average.
• The small for gestational age (birth weight below the 10th percentile of appropriate forgestational age infants) rate for singleton live births dropped to 8.1 per 100 singleton livebirths in 1999, compared to the fifteen-year high of 11.1 in 1985.
• The large for gestational age (birth weight above the 90th percentile of appropriate forgestational age infants) rate for singleton live births increased to 11.9 per 100 singleton livebirths in 1999, from the low of 9.7 (occurring in 1985 and 1989).
• The high birth weight rate (live births ≥ 4000 grams, per 100 live births) has risen. The1999 rate was 12.6, which is the fifteen-year high. The rate was at its lowest in the late1980’s, with a low of 10.7 in 1988.
• The rate of pre-term births (live births with gestation periods of 37 weeks or less, per 100live births) has continued to increase. The rate ranged between 6.3 and 6.9 from 1985 to1994, and has been over 7.0 since 1995. The 1999 rate was 7.8, which is a fifteen-year high.
• The multiple birth rate (per 100 live births) of 2.7 for 1999 is a fifteen-year high. The lowestrate during the fifteen-year study period was 1.9 in 1986.
MMaatteerrnnaall BBeehhaavviioouurrss• Maternal smoking occurred during pregnancy for 26.4% of live births for 1997 to 1999
combined. The alcohol consumption rate during pregnancy was 4.6%, and the streetdrug use during pregnancy rate was 1.5%. These risk factors were associated with higherlow birth weight and pre-term birth rates.
• Prenatal classes were attended by 33.2% of mothers giving birth to a live infant from 1997to 1999. Attendance at prenatal classes was associated with lower low birth weight and pre-term birth rates.
Alberta Reproductive Health: Pregnancy Outcomes (2001)
___________________________________________________________________
3
• In 1998, the provincial breastfeeding initiation rate was 85.3 (per 100 women delivering).• Breastfeeding initiation rates vary considerably across facility RHAs.
RReepprroodduuccttiivvee CCaarree SSeerrvviicceess• The induced abortion rate (per 1,000 women aged 15-49) has fluctuated over the last
fifteen years, but has increased overall. The 1999 rate was 12.8.• The total labour induction rate (per 100 hospital deliveries) has increased over the period
studied. In 1985, 12.6% of deliveries were induced; by 1999, the rate had doubled to 25.3%.• Epidural analgesia use in labour and delivery has increased from 1994 to 1998 in most
RHAs. The overall rate (per 100 deliveries) increased from 14.0 in 1994 to 27.5 in 1998.• After peaking in 1987 and 1988, the cesarean section rate declined into the mid-1990’s.
Since 1996, the rate has been increasing and was 19.1 (per 100 hospital deliveries) in 1999.• The use of forceps has declined from 14.6 (per 100 hospital deliveries) in 1985, to 6.5 in
1999; the use of vacuum extraction has concurrently shown an increase, from 0.3 in 1985to 11.0 in 1999.
• In 1998, breech deliveries occurred by cesarean section 62.1% of the time; 37.9% werevaginal deliveries. Breech delivery occurred in 25.5% of stillbirths and 25.8% of neonataldeaths.
MMoorrttaalliittyy• See Appendix 1 for mortality definitions used in this report.• The perinatal mortality rate in 1998 was 8.1 (per 1,000 total births). This rate shows no
systematic time trend over the fifteen-year study period.• The stillbirth rate for births 500 grams and higher was 3.2 in 1998.• The perinatal mortality rate for births 500 grams and higher was 5.2 in 1998.
• Both neonatal and post-neonatal mortality rates have declined over the last fifteen years.• The 1998 neonatal mortality rate was 3.5.• The 1998 post-neonatal mortality rate was 2.0.
• The infant death rate (per 1,000 live births) has declined substantially in the last four years.It reached a fifteen-year low in 1997, with a rate of 4.9. The rate was 5.4 in 1998, and the1999 rate was 5.8.• Infant mortality rates for residence RHAs for 1997 to 1999 combined show that RHA 4
had a lower rate than the provincial average.• In 1998, there were 3 maternal deaths, one directly related to pregnancy.• The leading causes of death in 1998 for stillbirths weighing 500 grams or more were
unexplained (21.3%), and congenital anomalies (20.5%).• The leading causes of death in 1998 for neonatal deaths were congenital malformation
(48.0%) and prematurity (20.6%).• Wiggelsworth classification of perinatal and neonatal deaths is provided for 1998. 29% of
deaths occurred before the start of labour, 32% involved lethal or potentially lethalmalformations, 22% were associated with prematurity, 4% fell into the group “IntrapartumDeaths, Neonatal deaths <4 hours old, Neonatal deaths >1000 grams and >4 hours old withevidence of cerebral birth trauma/asphyxia”, and 14% of deaths had a defined specificcondition.
For further information on any aspect of the report, please contact the Health Surveillance Branch ofAlberta Health and Wellness, or the Alberta Medical Association Committee on Reproductive Care.

Alberta Reproductive Health: Pregnancy Outcomes (2001)
___________________________________________________________________
4
Introduction
This document represents continued collaboration between Alberta Health and Wellness andthe Alberta Medical Association in reporting on the reproductive health of Albertans.
Data consist of pregnancy outcomes for the calendar years 1985 to 1998 or 1999, including:• spontaneous abortions• live births and stillbirths• congenital anomalies• low birth weight and high birth weight• birth weight in relation to gestational age• pre-term births• multiple pregnancies and births• maternal smoking, alcohol consumption, and street drug use• prenatal class attendance• breastfeeding initiation• induced abortions• operative deliveries and induction of labour• epidurals in labour• perinatal, neonatal, and infant mortality• maternal mortality• causes of death
Data are for Alberta residents unless otherwise stated. Regional data (by regional health authorities) areprovided where appropriate. Some data are broken down by relevant factors such as maternal age orbirth weight groupings. National comparisons are made where possible. At the time of preparation of thisdocument, national data were available for most measures only to the end of 1997.
DDaattaa ssoouurrcceess• Vital Statistics Birth Registration files, Department of Government Services• Vital Statistics Death Registration files, Department of Government Services• Clinic Files, Alberta Health and Wellness• Canadian Institute of Health Information Inpatient Files, Alberta Health and Wellness• Fee-for-Service Claims Files, Alberta Health and Wellness• Alberta Health Care Insurance Plan Stakeholder Registration File, Alberta Health and
Wellness• Medical records departments of hospitals in Alberta• Perinatal, infant, and maternal death cases from hospitals in Alberta as well as the offices of
the medical examiners• Reports from follow-up clinics for neonates and infants• Statistics Canada and Health Canada publications
MMeetthhooddoollooggyy aanndd LLiimmiittaattiioonnss• Statistical analyses are mainly descriptive, including frequencies, rates, percentages, means
and medians. Regional differences are interpreted in terms of standard errors andconfidence intervals.• With rare events (e.g., stillbirths) or detailed break-downs (e.g., live births by age group of
mother, RHA, and year), rates may be based on small numbers, which reduces theirstatistical reliability. Caution should always be exercised in interpreting these rates.
• Data are sometimes combined across three-year periods (e.g, 1997 to 1999) in order toincrease reliability of rates.
Alberta Reproductive Health: Pregnancy Outcomes (2001)
___________________________________________________________________
5
• In some cases, linear, quadratic, and cubic effects are described. Linear effects refer to astraight-line relationship between two variables (either an increasing or a decreasingtrend). Quadratic and cubic effects are non-linear: The relationship between twovariables in this case is captured by a second-order (quadratic) or third-order (cubic)polynomial. A quadratic function results in a curve with one change of direction, forexample a decrease followed by an increase (a U-shaped curve). A cubic functionresults in a curve with two changes of direction, for example an increase, followed by adecrease, followed by a leveling-off.
• Because of differences in definitions and dates of extracting data for analyses, thestatistics in this report may not be exactly the same as those previously published byAlberta Health and Wellness.
• Birth statistics are derived from Vital Statistics Birth Registration Files. Registration of birthsin Alberta is a legal requirement, and the files are believed to be virtually complete. Births tonon-Alberta residents occurring in Alberta have been excluded.
• Spontaneous abortion data come from Fee-For-Service Claims Files. Clinical spontaneousabortions that are treated by physicians are included in these data. Spontaneous abortionsthat are sub-clinical are not included in these data, nor are spontaneous abortions wherepatients did not contact a physician. For repeat spontaneous abortions, a two-month time lagbetween physician visits was used as the cutoff point for separate pregnancy events.
• Congenital anomalies data are from the Alberta Congenital Anomalies Surveillance System(ACASS). ICD-9CM (International Classification of Disease-9th Revision-ClinicalModification) codes used are detailed in Appendix 3. Note that maternal age data forcongenital anomalies are derived by linkage with Vital Statistics databases. Stillbirths are notavailable for 1998 and 1999 in these databases, so maternal age rates are calculatedrelative to live births only. Time trends do not require data linkage, and thus are calculatedrelative to total births (live births + stillbirths). A detailed report for congenital anomalies inAlberta from 1980 to 1998 is forthcoming.
• Data on maternal smoking, alcohol consumption, street drug use, and prenatal classattendance for live births are derived from Notice of Live Birth and Stillbirth that are enteredinto the Vital Statistics Birth Registration Files. This information is not complete for all births;analyses include only those births for which the relevant information is available. Note thatmaternal behaviour data are self-reported, and thus likely underestimate of the trueincidence of the behaviours.
• Breastfeeding initiation data come from the Medical Records departments of the hospitalsand are available for 1996 to 1998.
• The Clinic Files contain information on induced abortions. Regional comparisons areprovided from both facility and residence perspectives. However, because region ofresidence information is not available in the Clinic Files, it is extracted from Fee-for-ServiceClaims files and data may not correspond exactly due to data source differences. Abortionsfor non-Alberta residents have been excluded.
• Method of delivery and induction data are derived from the Hospital Morbidity Files. Ratesare calculated based on hospital deliveries only; home deliveries are not included in totaldeliveries in this section. Because only primary, secondary, and tertiary ICD9-CM diagnosticand procedure codes were available from 1985 to 1992, the diagnostic and procedurecriteria for all years were based on the first three codes only. Thus, the number ofprocedures (especially minor procedures) may be under-counted. Detailed criteria for dataextraction are provided under relevant tables and in Appendix 3.
• Epidural use in labour and delivery data for 1998 come from Medical Records departmentsof the hospitals. In 1994, an Ad Hoc Committee of the AMA Health Issues Council, incollaboration with the Committee on Reproductive Care, produced a report on the use ofepidural analgesia in labour and delivery in Alberta, and the data from that report are used tofor comparison purposes.
• The AMA, through the Committee on Reproductive Care, reviews cases of perinatal,neonatal and maternal mortality. Case information is received from the medical recordsdepartments of Alberta Hospitals, hospital perinatal review committees, offices of medical
Alberta Reproductive Health: Pregnancy Outcomes (2001)
___________________________________________________________________
6
examiners, vital statistics, and physicians. The Committee is designated by Ministerial Orderto provide this service. Collaboration and cooperation from medical records staff, hospitalperinatal review committees and office of medical examiners help to ensure that caseinformation is complete. Variables from case reviews are entered into a mortality databaseand form the basis for the mortality analysis part of this report. A validation process with vitalstatistics, Alberta Health and Wellness and medical records departments ensures that allcases are received for review. The mortality data include non-resident mothers whodelivered in Alberta, but do not include babies born out-of-province who died in Albertahospitals.
• Information on post-neonatal and infant deaths is derived from Vital Statistics DeathRegistration Files. Registration of deaths in Alberta is a legal requirement, and the files arebelieved to be virtually complete. Deaths to non-Alberta residents occurring in Alberta havebeen excluded.
• National comparison data are extracted from Statistics Canada and Health Canadapublications on births, therapeutic abortions, deaths, and population.
• Populations used for the calculations of rates are derived from the Alberta Health CareInsurance Plan Registration Files. They are estimated at June 30, as viewed at December31 of each year. Provincial rate calculations include those with an “unknown” RHA code.
Alberta Reproductive Health: Pregnancy Outcomes (2001)
___________________________________________________________________
7
Time Trends for Major Indicators of Reproductive Health
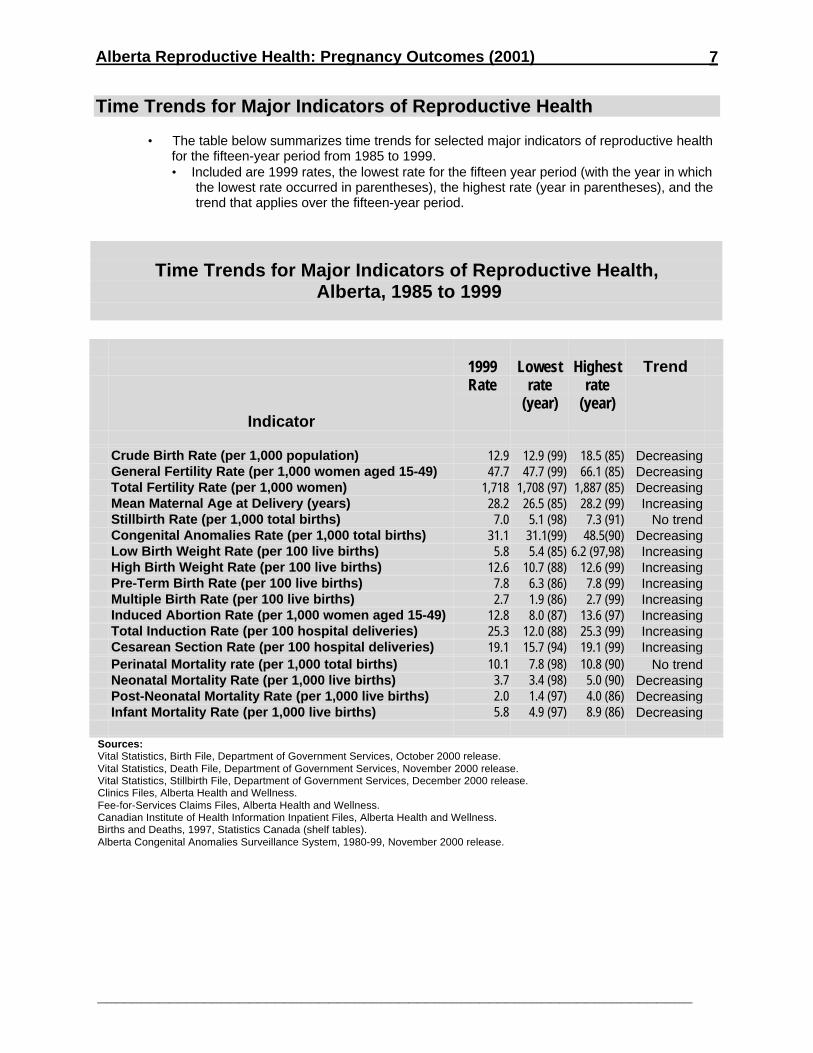
• The table below summarizes time trends for selected major indicators of reproductive healthfor the fifteen-year period from 1985 to 1999.• Included are 1999 rates, the lowest rate for the fifteen year period (with the year in which
the lowest rate occurred in parentheses), the highest rate (year in parentheses), and thetrend that applies over the fifteen-year period.
Time Trends for Major Indicators of Reproductive Health, Alberta, 1985 to 1999
1999Rate
Lowestrate
(year)
Highestrate
(year)
Trend
Indicator
Crude Birth Rate (per 1,000 population) 12.9 12.9 (99) 18.5 (85) DecreasingGeneral Fertility Rate (per 1,000 women aged 15-49) 47.7 47.7 (99) 66.1 (85) DecreasingTotal Fertility Rate (per 1,000 women) 1,718 1,708 (97) 1,887 (85) DecreasingMean Maternal Age at Delivery (years) 28.2 26.5 (85) 28.2 (99) IncreasingStillbirth Rate (per 1,000 total births) 7.0 5.1 (98) 7.3 (91) No trendCongenital Anomalies Rate (per 1,000 total births) 31.1 31.1(99) 48.5(90) DecreasingLow Birth Weight Rate (per 100 live births) 5.8 5.4 (85) 6.2 (97,98) IncreasingHigh Birth Weight Rate (per 100 live births) 12.6 10.7 (88) 12.6 (99) IncreasingPre-Term Birth Rate (per 100 live births) 7.8 6.3 (86) 7.8 (99) IncreasingMultiple Birth Rate (per 100 live births) 2.7 1.9 (86) 2.7 (99) IncreasingInduced Abortion Rate (per 1,000 women aged 15-49) 12.8 8.0 (87) 13.6 (97) IncreasingTotal Induction Rate (per 100 hospital deliveries) 25.3 12.0 (88) 25.3 (99) IncreasingCesarean Section Rate (per 100 hospital deliveries) 19.1 15.7 (94) 19.1 (99) IncreasingPerinatal Mortality rate (per 1,000 total births) 10.1 7.8 (98) 10.8 (90) No trendNeonatal Mortality Rate (per 1,000 live births) 3.7 3.4 (98) 5.0 (90) DecreasingPost-Neonatal Mortality Rate (per 1,000 live births) 2.0 1.4 (97) 4.0 (86) DecreasingInfant Mortality Rate (per 1,000 live births) 5.8 4.9 (97) 8.9 (86) Decreasing
Sources:Vital Statistics, Birth File, Department of Government Services, October 2000 release.Vital Statistics, Death File, Department of Government Services, November 2000 release.Vital Statistics, Stillbirth File, Department of Government Services, December 2000 release.Clinics Files, Alberta Health and Wellness.Fee-for-Services Claims Files, Alberta Health and Wellness.Canadian Institute of Health Information Inpatient Files, Alberta Health and Wellness.Births and Deaths, 1997, Statistics Canada (shelf tables).Alberta Congenital Anomalies Surveillance System, 1980-99, November 2000 release.
Alberta Reproductive Health: Pregnancy Outcomes (2001)
___________________________________________________________________
8
National Comparisons
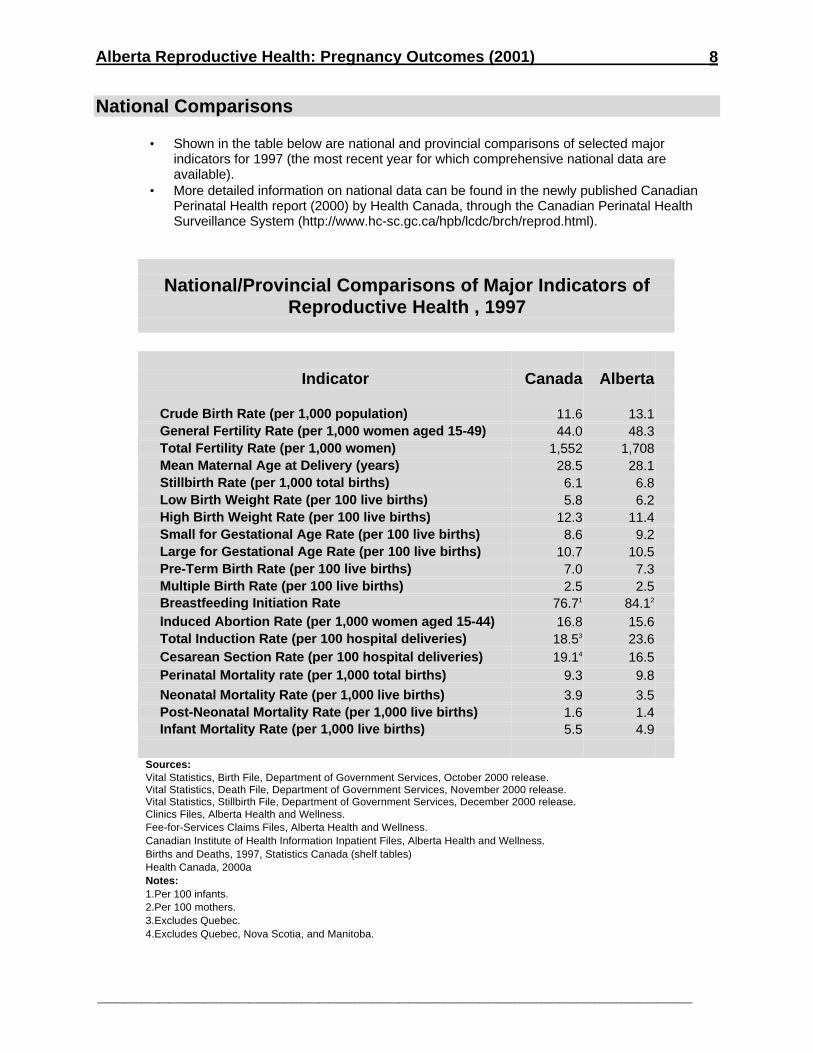
• Shown in the table below are national and provincial comparisons of selected majorindicators for 1997 (the most recent year for which comprehensive national data areavailable).
• More detailed information on national data can be found in the newly published CanadianPerinatal Health report (2000) by Health Canada, through the Canadian Perinatal HealthSurveillance System (http://www.hc-sc.gc.ca/hpb/lcdc/brch/reprod.html).
National/Provincial Comparisons of Major Indicators ofReproductive Health , 1997
Indicator Canada Alberta
Crude Birth Rate (per 1,000 population) 11.6 13.1General Fertility Rate (per 1,000 women aged 15-49) 44.0 48.3Total Fertility Rate (per 1,000 women) 1,552 1,708Mean Maternal Age at Delivery (years) 28.5 28.1Stillbirth Rate (per 1,000 total births) 6.1 6.8Low Birth Weight Rate (per 100 live births) 5.8 6.2High Birth Weight Rate (per 100 live births) 12.3 11.4Small for Gestational Age Rate (per 100 live births) 8.6 9.2Large for Gestational Age Rate (per 100 live births) 10.7 10.5Pre-Term Birth Rate (per 100 live births) 7.0 7.3Multiple Birth Rate (per 100 live births) 2.5 2.5Breastfeeding Initiation Rate 76.71 84.12
Induced Abortion Rate (per 1,000 women aged 15-44) 16.8 15.6Total Induction Rate (per 100 hospital deliveries) 18.53 23.6Cesarean Section Rate (per 100 hospital deliveries) 19.14 16.5Perinatal Mortality rate (per 1,000 total births) 9.3 9.8
Neonatal Mortality Rate (per 1,000 live births) 3.9 3.5Post-Neonatal Mortality Rate (per 1,000 live births) 1.6 1.4Infant Mortality Rate (per 1,000 live births) 5.5 4.9
Sources:Vital Statistics, Birth File, Department of Government Services, October 2000 release.Vital Statistics, Death File, Department of Government Services, November 2000 release.Vital Statistics, Stillbirth File, Department of Government Services, December 2000 release.Clinics Files, Alberta Health and Wellness.Fee-for-Services Claims Files, Alberta Health and Wellness.Canadian Institute of Health Information Inpatient Files, Alberta Health and Wellness.Births and Deaths, 1997, Statistics Canada (shelf tables)Health Canada, 2000aNotes:1.Per 100 infants.2.Per 100 mothers.3.Excludes Quebec.4.Excludes Quebec, Nova Scotia, and Manitoba.
Alberta Reproductive Health: Pregnancy Outcomes (2001)
___________________________________________________________________
9
Fertility
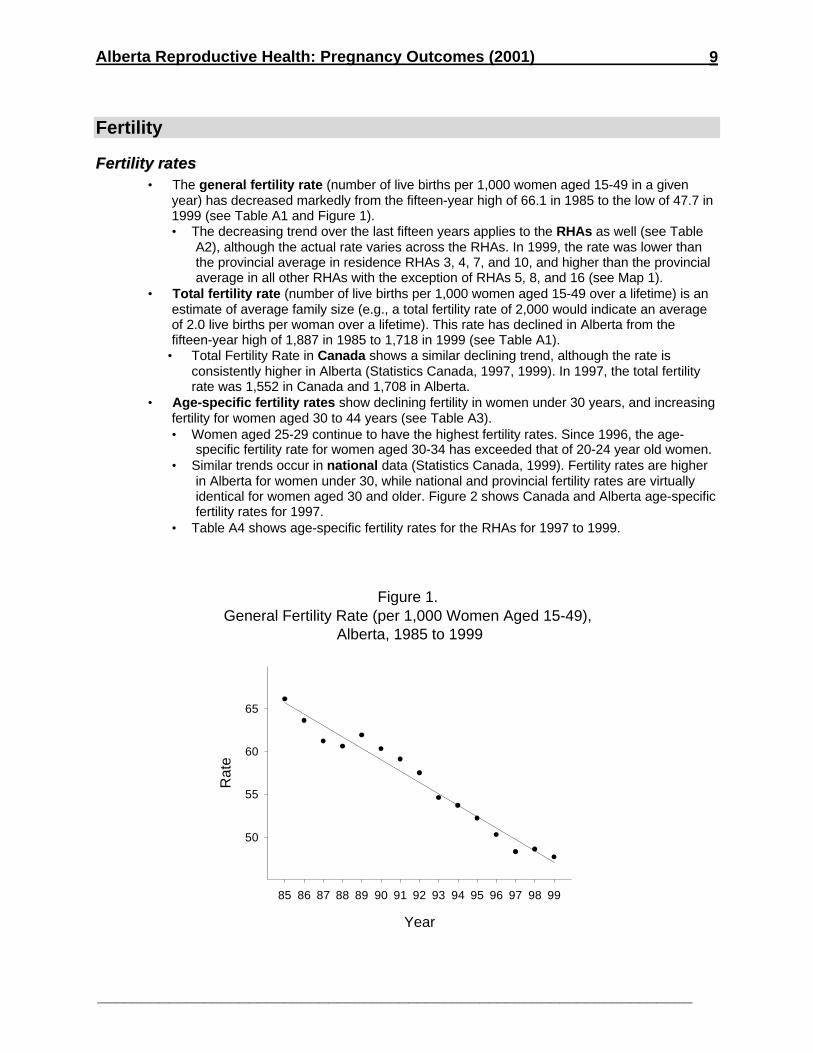
FFeerrttiilliittyy rraatteess• The general fertility rate (number of live births per 1,000 women aged 15-49 in a given
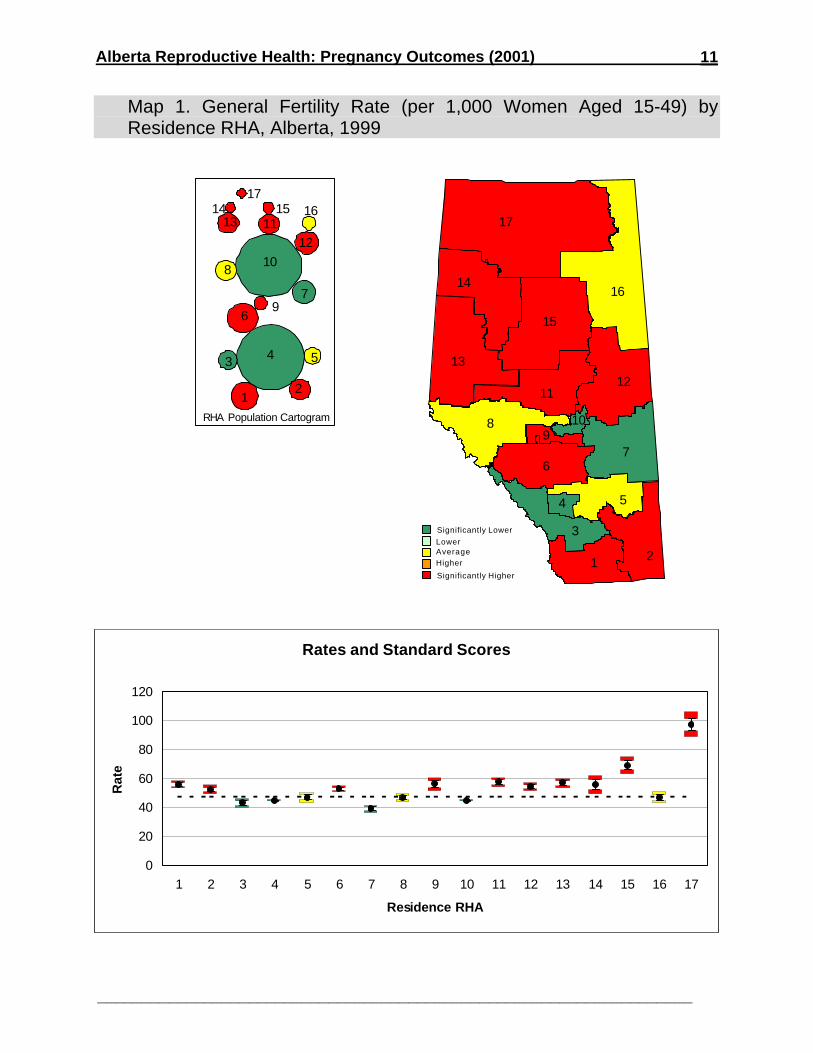
year) has decreased markedly from the fifteen-year high of 66.1 in 1985 to the low of 47.7 in1999 (see Table A1 and Figure 1).• The decreasing trend over the last fifteen years applies to the RHAs as well (see Table
A2), although the actual rate varies across the RHAs. In 1999, the rate was lower thanthe provincial average in residence RHAs 3, 4, 7, and 10, and higher than the provincialaverage in all other RHAs with the exception of RHAs 5, 8, and 16 (see Map 1).
• Total fertility rate (number of live births per 1,000 women aged 15-49 over a lifetime) is anestimate of average family size (e.g., a total fertility rate of 2,000 would indicate an averageof 2.0 live births per woman over a lifetime). This rate has declined in Alberta from thefifteen-year high of 1,887 in 1985 to 1,718 in 1999 (see Table A1).
• Total Fertility Rate in Canada shows a similar declining trend, although the rate isconsistently higher in Alberta (Statistics Canada, 1997, 1999). In 1997, the total fertilityrate was 1,552 in Canada and 1,708 in Alberta.
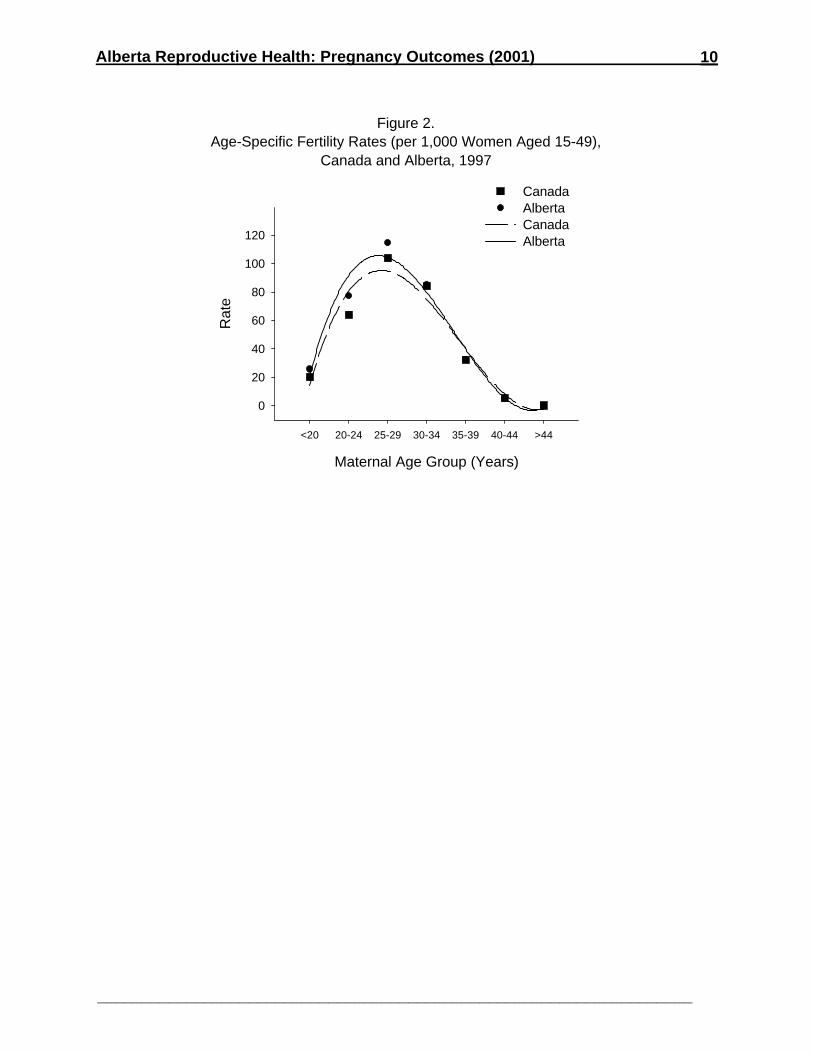
• Age-specific fertility rates show declining fertility in women under 30 years, and increasingfertility for women aged 30 to 44 years (see Table A3).• Women aged 25-29 continue to have the highest fertility rates. Since 1996, the age-
specific fertility rate for women aged 30-34 has exceeded that of 20-24 year old women.• Similar trends occur in national data (Statistics Canada, 1999). Fertility rates are higher
in Alberta for women under 30, while national and provincial fertility rates are virtuallyidentical for women aged 30 and older. Figure 2 shows Canada and Alberta age-specificfertility rates for 1997.
• Table A4 shows age-specific fertility rates for the RHAs for 1997 to 1999.
Figure 1. General Fertility Rate (per 1,000 Women Aged 15-49),
Alberta, 1985 to 1999
Year
85 86 87 88 89 90 91 92 93 94 95 96 97 98 99
Rat
e
50
55
60
65
Alberta Reproductive Health: Pregnancy Outcomes (2001)
___________________________________________________________________
10
Figure 2.Age-Specific Fertility Rates (per 1,000 Women Aged 15-49),
Canada and Alberta, 1997
Maternal Age Group (Years)
<20 20-24 25-29 30-34 35-39 40-44 >44
Rat
e
0
20
40
60
80
100
120
CanadaAlbertaCanadaAlberta
Alberta Reproductive Health: Pregnancy Outcomes (2001)
___________________________________________________________________
11
Map 1. General Fertility Rate (per 1,000 Women Aged 15-49) byResidence RHA, Alberta, 1999
Significantly Lower
LowerAverageHigher
Significantly Higher
17
16
15
14
13
1211
8
6
3
1 2
5
7
4
109
12
3 4 5
6
7
8
9
10
1112
1314 15 16
17
RHA Population Cartogram
Rates and Standard Scores
0
20
40
60
80
100
120
1 2 3 4 5 6 7 8 9 10 11 12 13 14 15 16 17
Residence RHA
Rat
e
12
3 4 5
6
7
8
9
10
1112
1314 15 16
17
RHA Population Cartogram
Rates and Standard Scores
0
20
40
60
80
100
120
1 2 3 4 5 6 7 8 9 10 11 12 13 14 15 16 17
Residence RHA
Rat
e
Alberta Reproductive Health: Pregnancy Outcomes (2001)
___________________________________________________________________
12
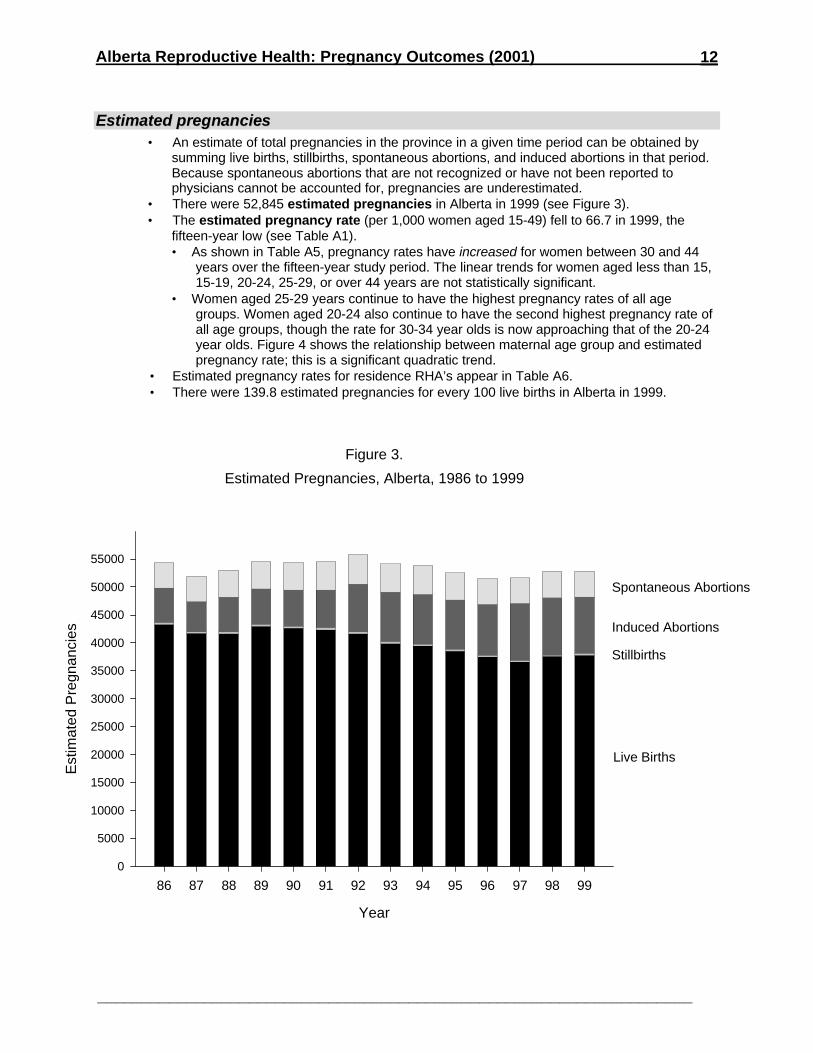
EEssttiimmaatteedd pprreeggnnaanncciieess• An estimate of total pregnancies in the province in a given time period can be obtained by
summing live births, stillbirths, spontaneous abortions, and induced abortions in that period.Because spontaneous abortions that are not recognized or have not been reported tophysicians cannot be accounted for, pregnancies are underestimated.
• There were 52,845 estimated pregnancies in Alberta in 1999 (see Figure 3).• The estimated pregnancy rate (per 1,000 women aged 15-49) fell to 66.7 in 1999, the
fifteen-year low (see Table A1).• As shown in Table A5, pregnancy rates have increased for women between 30 and 44
years over the fifteen-year study period. The linear trends for women aged less than 15,15-19, 20-24, 25-29, or over 44 years are not statistically significant.
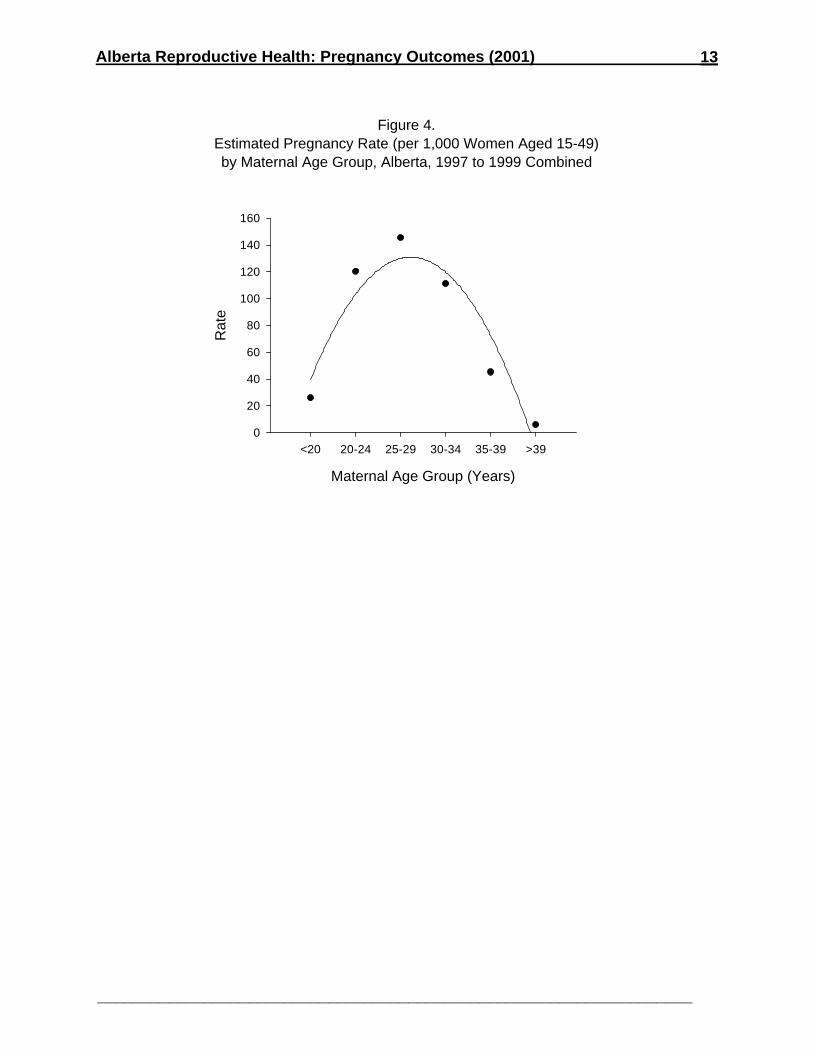
• Women aged 25-29 years continue to have the highest pregnancy rates of all agegroups. Women aged 20-24 also continue to have the second highest pregnancy rate ofall age groups, though the rate for 30-34 year olds is now approaching that of the 20-24year olds. Figure 4 shows the relationship between maternal age group and estimatedpregnancy rate; this is a significant quadratic trend.
• Estimated pregnancy rates for residence RHA’s appear in Table A6.• There were 139.8 estimated pregnancies for every 100 live births in Alberta in 1999.
Figure 3.
Estimated Pregnancies, Alberta, 1986 to 1999
Year
86 87 88 89 90 91 92 93 94 95 96 97 98 99
Est
imat
ed P
regn
anci
es
0
5000
10000
15000
20000
25000
30000
35000
40000
45000
50000
55000
Live Births
Stillbirths
Induced Abortions
Spontaneous Abortions
Alberta Reproductive Health: Pregnancy Outcomes (2001)
___________________________________________________________________
13
Figure 4.Estimated Pregnancy Rate (per 1,000 Women Aged 15-49)by Maternal Age Group, Alberta, 1997 to 1999 Combined
Maternal Age Group (Years)
<20 20-24 25-29 30-34 35-39 >39
Rat
e
0
20
40
60
80
100
120
140
160
Alberta Reproductive Health: Pregnancy Outcomes (2001)
___________________________________________________________________
14
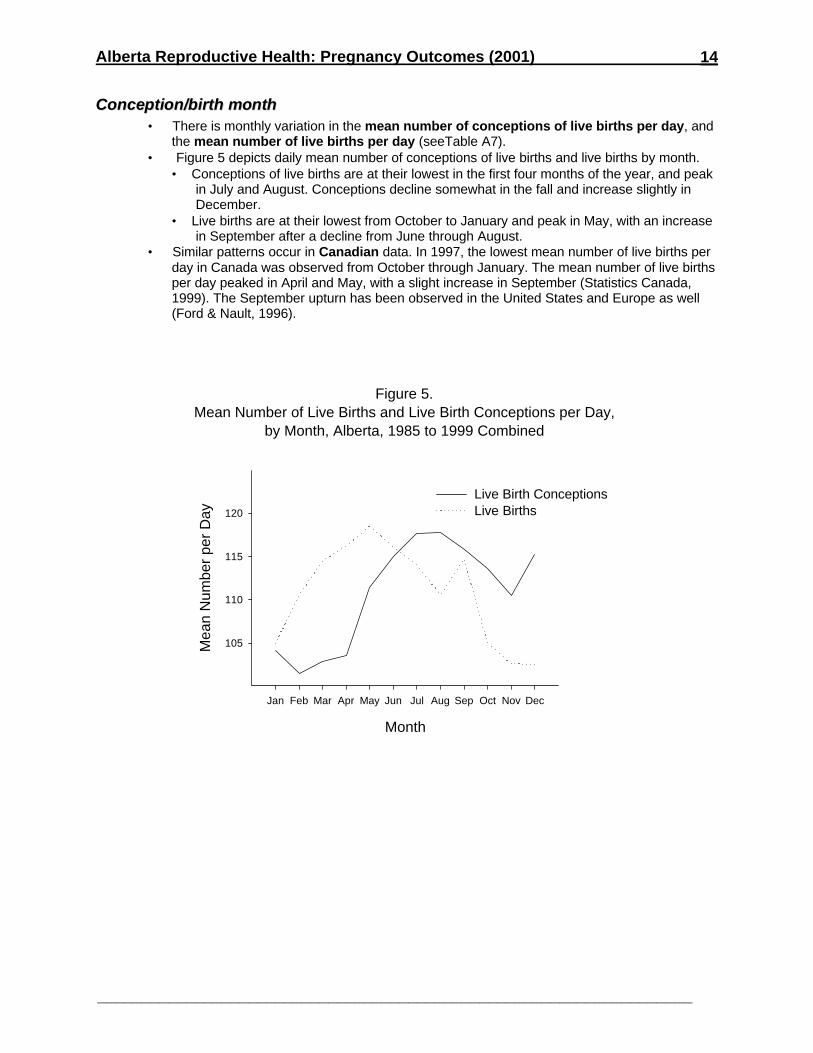
CCoonncceeppttiioonn//bbiirrtthh mmoonntthh• There is monthly variation in the mean number of conceptions of live births per day, and
the mean number of live births per day (seeTable A7).• Figure 5 depicts daily mean number of conceptions of live births and live births by month.
• Conceptions of live births are at their lowest in the first four months of the year, and peakin July and August. Conceptions decline somewhat in the fall and increase slightly inDecember.
• Live births are at their lowest from October to January and peak in May, with an increasein September after a decline from June through August.
• Similar patterns occur in Canadian data. In 1997, the lowest mean number of live births perday in Canada was observed from October through January. The mean number of live birthsper day peaked in April and May, with a slight increase in September (Statistics Canada,1999). The September upturn has been observed in the United States and Europe as well(Ford & Nault, 1996).
Figure 5.Mean Number of Live Births and Live Birth Conceptions per Day,
by Month, Alberta, 1985 to 1999 Combined
Month
Jan Feb Mar Apr May Jun Jul Aug Sep Oct Nov Dec
Mea
n N
umbe
r pe
r D
ay
105
110
115
120
Live Birth Conceptions Live Births
Alberta Reproductive Health: Pregnancy Outcomes (2001)
___________________________________________________________________
15
MMaatteerrnnaall AAggee• Mothers 30 years and over are more likely than mothers aged 20-29 years to have cesarean
sections, low birth weight births, pre-term births, maternal complications, and infants withchromosomal anomalies (MacNab, Macdonald, & Tuk, 1997).
• Delaying childbearing to age 35 or older increases risk of low birth weight, pre-term, andmultiple births (Tough, Svenson, Johnston, Newburn-Cook, Rose, and Belik, 2000).
• Teenaged mothers are more likely than mothers aged 20-29 to have low birth weight or pre-term infants (Tough, Svenson, & Schopflocher, 1999). Pregnant teenagers have increasedrisk of health problems (Dryburgh, 2000).
• Most pregnancy outcomes vary with maternal age. A summary table for 1997 to 1999combined appears below. Note that the midwife attendant rate includes only births for whichthe primary attendant was a midwife (whether in or out of hospital). Thus some births withboth a midwife and physician in attendance would not be included in these counts, leading toan underestimate of the true rate.
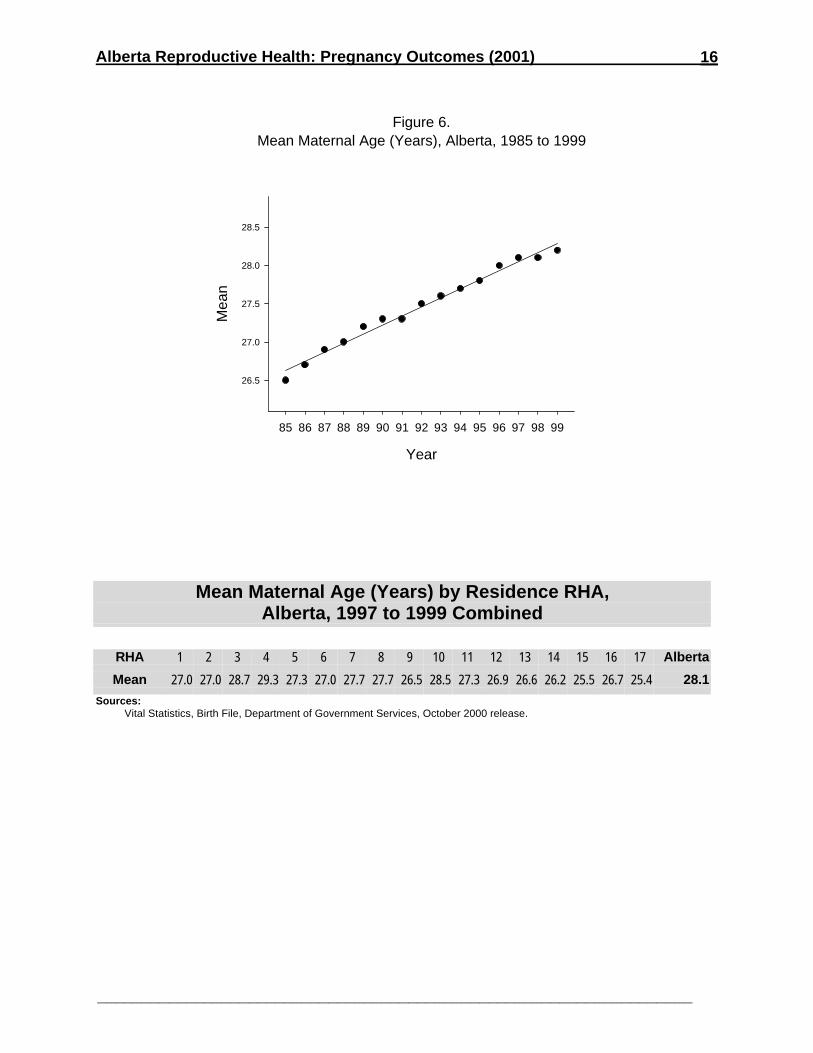
• In 1999, the average maternal age at delivery was 28.2 years, the highest in fifteen years.In 1985, average maternal age was 26.5 years, the fifteen-year low (see Table A8). Thisincrease is a significant linear trend (see Figure 6).• Average maternal age at delivery is slightly lower in Alberta than in Canada as a whole,
but later childbearing is a trend in Canada as well as in Alberta. Mean maternal age inCanada in 1997 was 28.5, compared with 28.1 in Alberta (Statistics Canada, 1999).
• Average maternal age at delivery for live birth by residence RHA for 1997 to 1999combined is shown below. Although average maternal age is somewhat higher than theprovincial average in RHA 4, none of the regional rates are significantly different from theprovincial average.
• Maternal age at first birth has increased in Alberta from 24.7 in 1985 to 26.2 in 1999 (seeTable A8).
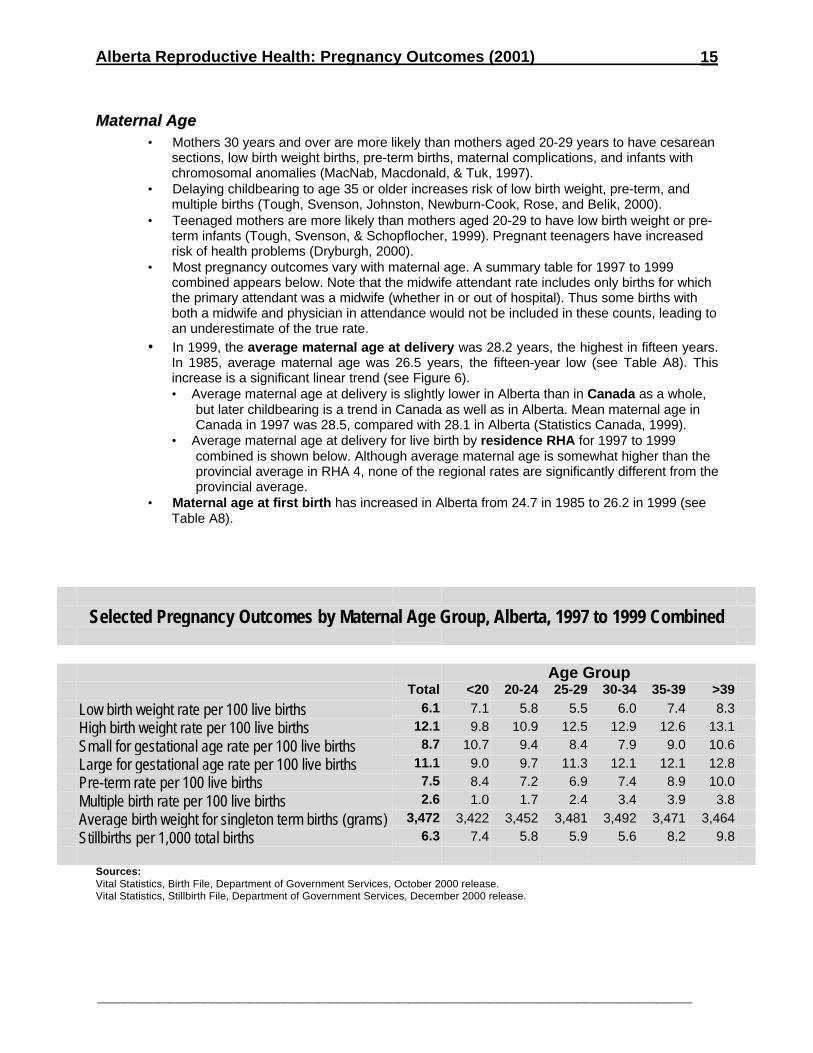
Selected Pregnancy Outcomes by Maternal Age Group, Alberta, 1997 to 1999 Combined
Age GroupTotal <20 20-24 25-29 30-34 35-39 >39
Low birth weight rate per 100 live births 6.1 7.1 5.8 5.5 6.0 7.4 8.3
High birth weight rate per 100 live births 12.1 9.8 10.9 12.5 12.9 12.6 13.1
Small for gestational age rate per 100 live births 8.7 10.7 9.4 8.4 7.9 9.0 10.6
Large for gestational age rate per 100 live births 11.1 9.0 9.7 11.3 12.1 12.1 12.8
Pre-term rate per 100 live births 7.5 8.4 7.2 6.9 7.4 8.9 10.0
Multiple birth rate per 100 live births 2.6 1.0 1.7 2.4 3.4 3.9 3.8
Average birth weight for singleton term births (grams) 3,472 3,422 3,452 3,481 3,492 3,471 3,464
Stillbirths per 1,000 total births 6.3 7.4 5.8 5.9 5.6 8.2 9.8
Sources:Vital Statistics, Birth File, Department of Government Services, October 2000 release.Vital Statistics, Stillbirth File, Department of Government Services, December 2000 release.
Alberta Reproductive Health: Pregnancy Outcomes (2001)
___________________________________________________________________
16
Mean Maternal Age (Years) by Residence RHA,Alberta, 1997 to 1999 Combined
RHA 1 2 3 4 5 6 7 8 9 10 11 12 13 14 15 16 17 Alberta
Mean 27.0 27.0 28.7 29.3 27.3 27.0 27.7 27.7 26.5 28.5 27.3 26.9 26.6 26.2 25.5 26.7 25.4 28.1
Sources:Vital Statistics, Birth File, Department of Government Services, October 2000 release.
Figure 6.Mean Maternal Age (Years), Alberta, 1985 to 1999
Year
85 86 87 88 89 90 91 92 93 94 95 96 97 98 99
Mea
n
26.5
27.0
27.5
28.0
28.5
Alberta Reproductive Health: Pregnancy Outcomes (2001)
___________________________________________________________________
17
Birth Outcomes
SSppoonnttaanneeoouuss AAbboorrttiioonnss• Included in this category are clinical spontaneous abortions treated by a physician; this is of
course an underestimate of all spontaneous abortions. Nevertheless, the rates areinformative, allowing approximation of time trends and maternal age effects.
• The spontaneous abortion rate (per 1,000 women aged 15-49) has declined in recentyears, which is not surprising, given declining fertility rates (see Table A1).
• The spontaneous abortion rate (per 100 estimated pregnancies) has varied over the lastfifteen years, peaking in at 9.8 in 1994 and declining since then (see Table A1). The 1999rate was 9.0.
• Spontaneous abortion rates vary with maternal age group (see Table A9). The rate (per1,000 women aged 15-49) is highest for women in the highest fertility groups, which includedwomen aged 20 –34.
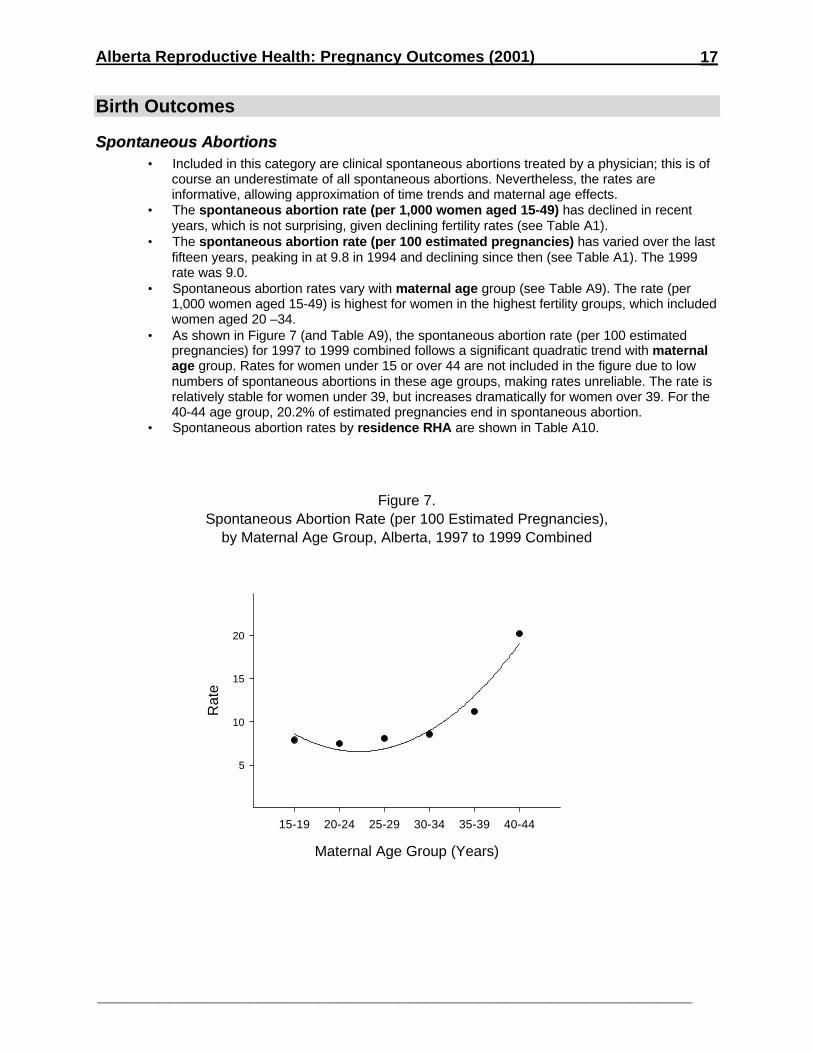
• As shown in Figure 7 (and Table A9), the spontaneous abortion rate (per 100 estimatedpregnancies) for 1997 to 1999 combined follows a significant quadratic trend with maternalage group. Rates for women under 15 or over 44 are not included in the figure due to lownumbers of spontaneous abortions in these age groups, making rates unreliable. The rate isrelatively stable for women under 39, but increases dramatically for women over 39. For the40-44 age group, 20.2% of estimated pregnancies end in spontaneous abortion.
• Spontaneous abortion rates by residence RHA are shown in Table A10.
Figure 7.Spontaneous Abortion Rate (per 100 Estimated Pregnancies),
by Maternal Age Group, Alberta, 1997 to 1999 Combined
Maternal Age Group (Years)
15-19 20-24 25-29 30-34 35-39 40-44
Rat
e
5
10
15
20
Alberta Reproductive Health: Pregnancy Outcomes (2001)
___________________________________________________________________
18
LLiivvee BBiirrtthhss• The total number of live births has fallen 12.8% since the fifteen-year high of 43,327 in
1985, to 37,797 in 1999 (see Table A1).• Total births (including live births and stillbirths) by level of hospital care appear in Table A11
(see Appendix 5 for definition of levels of hospitals). In 1998, 50.8% of births occurred inLevel II hospitals, 24.6% in Level I hospitals, 23.6% in Level III hospitals, and 1.0% out ofhospital (see reference Health Canada 2000b for definition on level of hospital care).
• The decrease in live births is concurrent with an increase in the population of the province.Consequently, the Crude Birth Rate (number of live births per 1,000 population) hasdeclined from the fifteen-year high of 18.5 in 1985 to the fifteen-year low of 12.9 in 1999 (seeTable A1).• The Canadian crude birth rate underwent a similar rate of decline over the last several
years, though the absolute rate was consistently higher in Alberta. In 1997, theCanadian crude birth rate was 11.6, while the Alberta rate was 13.1 (Statistics Canada,1999).
SSttiillllbbiirrtthhss• Stillbirths refer to births with the complete expulsion or the extraction from the mother after at
least 20 weeks pregnancy, or after attaining a weight of 500 grams or more, of a fetus inwhich, after the expulsion or the extraction, there is no breathing, beating of the heart,pulsation of the umbilical cord or unmistakable movement of voluntary muscle (Alberta VitalStatistics Act, RHA 1980,cV-4 s1).
• Many risk factors for stillbirth have been identified, such as low maternal education, smokingduring pregnancy, gender (stillbirths are more often male than female), prematurity, and lowbirth weight (Chen, Fair, Wilkins, Cyr and the Fetal and Infant Mortality Study Group of theCanadian Perinatal Surveillance System, 1998; Tough, Svenson, & Schopflocher, 1999).• MacNab, Macdonald and Tuk (1997) report that multiparous but not primiparous mothers
over 34 years have a higher risk of stillbirth than younger mothers.• There is a risk of recurrence for stillbirth (Oyen, Skjaerven, & Irgens, 1996).
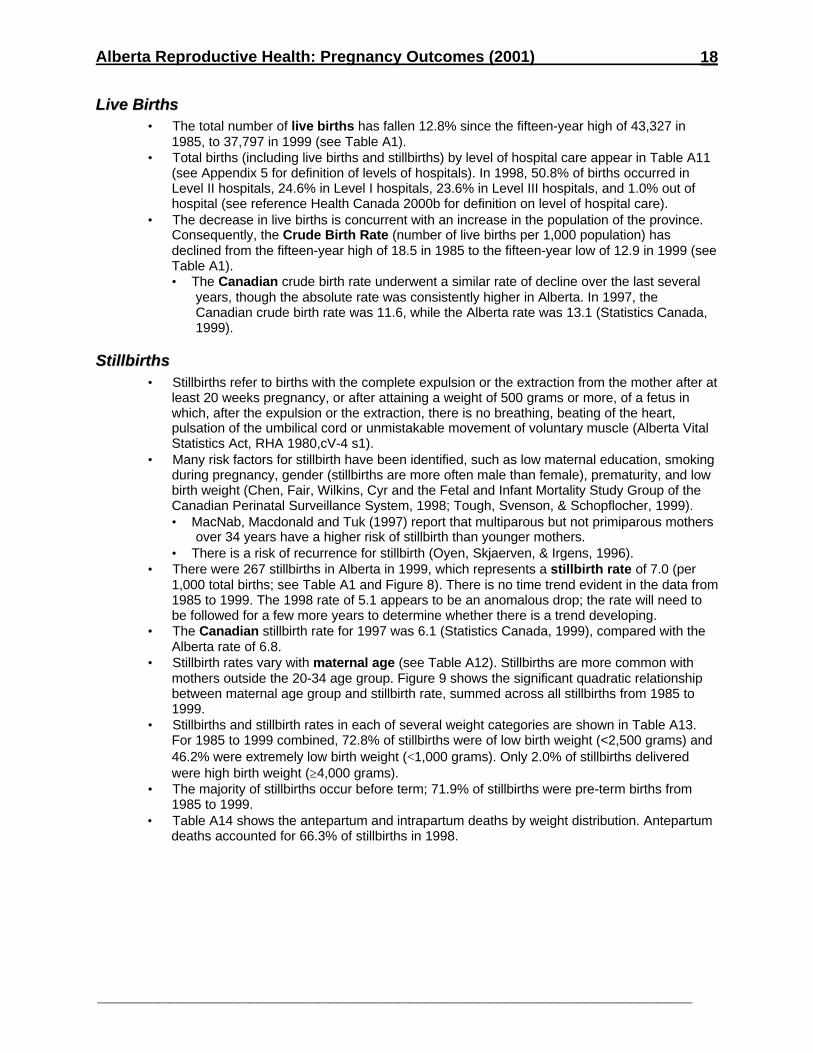
• There were 267 stillbirths in Alberta in 1999, which represents a stillbirth rate of 7.0 (per1,000 total births; see Table A1 and Figure 8). There is no time trend evident in the data from1985 to 1999. The 1998 rate of 5.1 appears to be an anomalous drop; the rate will need tobe followed for a few more years to determine whether there is a trend developing.
• The Canadian stillbirth rate for 1997 was 6.1 (Statistics Canada, 1999), compared with theAlberta rate of 6.8.
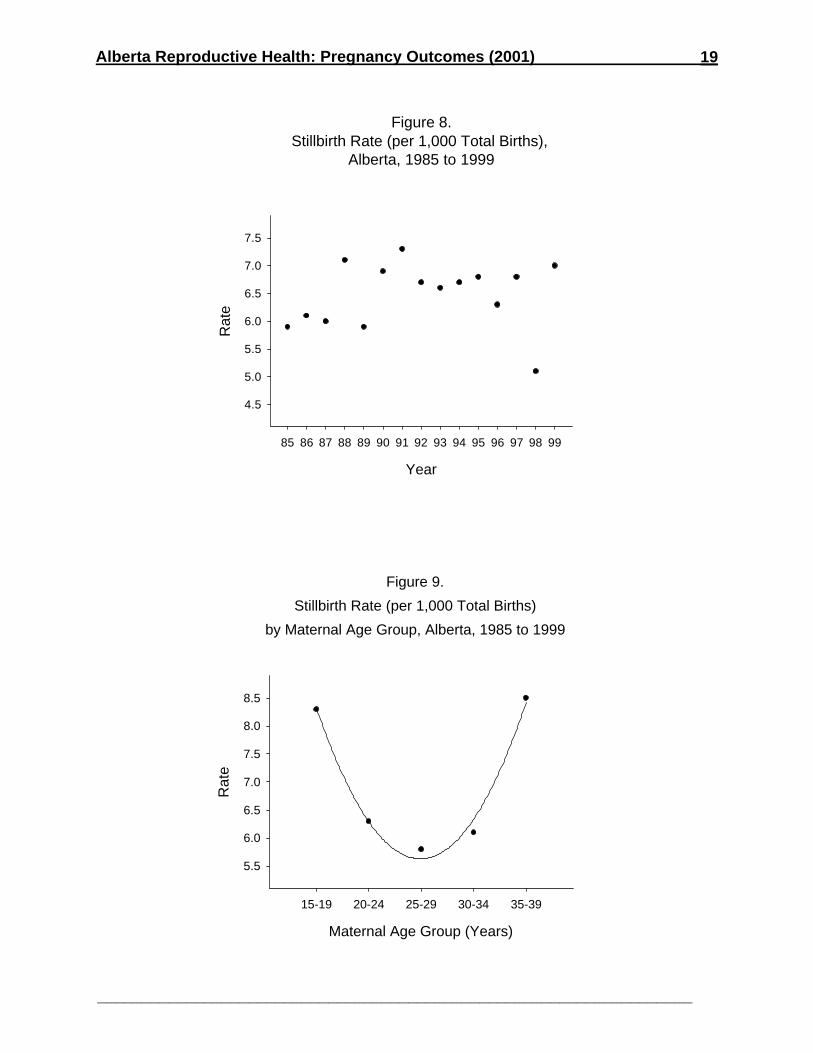
• Stillbirth rates vary with maternal age (see Table A12). Stillbirths are more common withmothers outside the 20-34 age group. Figure 9 shows the significant quadratic relationshipbetween maternal age group and stillbirth rate, summed across all stillbirths from 1985 to1999.
• Stillbirths and stillbirth rates in each of several weight categories are shown in Table A13.For 1985 to 1999 combined, 72.8% of stillbirths were of low birth weight (<2,500 grams) and46.2% were extremely low birth weight (<1,000 grams). Only 2.0% of stillbirths deliveredwere high birth weight (≥4,000 grams).
• The majority of stillbirths occur before term; 71.9% of stillbirths were pre-term births from1985 to 1999.
• Table A14 shows the antepartum and intrapartum deaths by weight distribution. Antepartumdeaths accounted for 66.3% of stillbirths in 1998.
Alberta Reproductive Health: Pregnancy Outcomes (2001)
___________________________________________________________________
19
Figure 9.
Stillbirth Rate (per 1,000 Total Births)
by Maternal Age Group, Alberta, 1985 to 1999
Maternal Age Group (Years)
15-19 20-24 25-29 30-34 35-39
Rat
e
5.5
6.0
6.5
7.0
7.5
8.0
8.5
Figure 8.Stillbirth Rate (per 1,000 Total Births),
Alberta, 1985 to 1999
Year
85 86 87 88 89 90 91 92 93 94 95 96 97 98 99
Rat
e
4.5
5.0
5.5
6.0
6.5
7.0
7.5
Alberta Reproductive Health: Pregnancy Outcomes (2001)
___________________________________________________________________
20
PPeerriinnaattaall MMoorrbbiiddiittyy• See Appendix 5 for a perinatal morbidity report from the Northern Alberta Neonatal and
Infant Follow-up Clinic.
CCoonnggeenniittaall AAnnoommaalliieess• Congenital anomalies are an important indicator of perinatal health. Congenital anomalies
may lead to low birth weight, pre-term delivery, or fetal or infant death.• Table A15 shows the prevalence of selected congenital anomalies from 1985 to 1999.
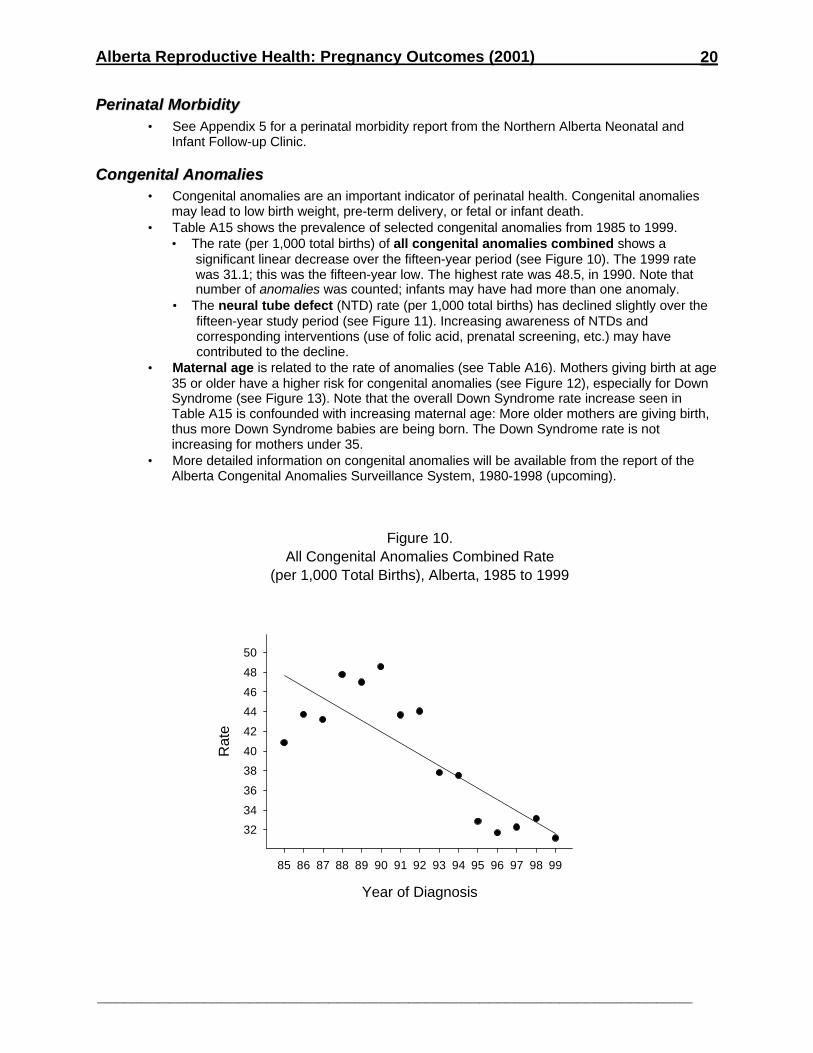
• The rate (per 1,000 total births) of all congenital anomalies combined shows asignificant linear decrease over the fifteen-year period (see Figure 10). The 1999 ratewas 31.1; this was the fifteen-year low. The highest rate was 48.5, in 1990. Note thatnumber of anomalies was counted; infants may have had more than one anomaly.
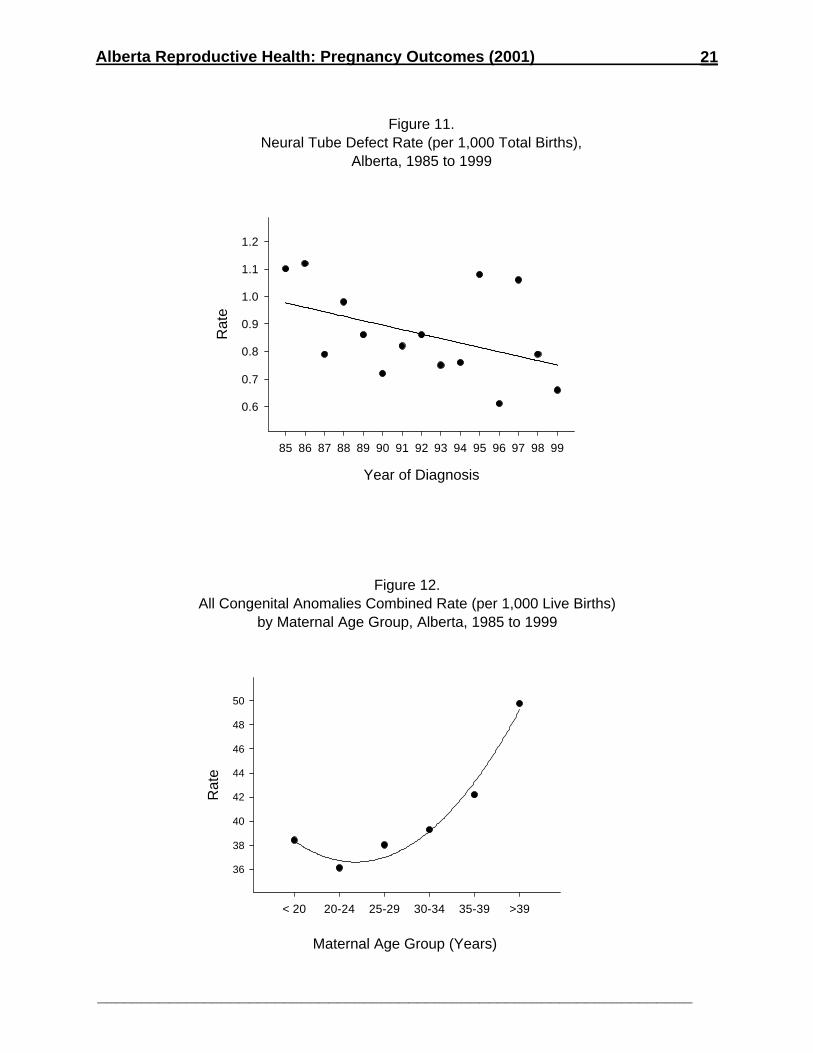
• The neural tube defect (NTD) rate (per 1,000 total births) has declined slightly over thefifteen-year study period (see Figure 11). Increasing awareness of NTDs andcorresponding interventions (use of folic acid, prenatal screening, etc.) may havecontributed to the decline.
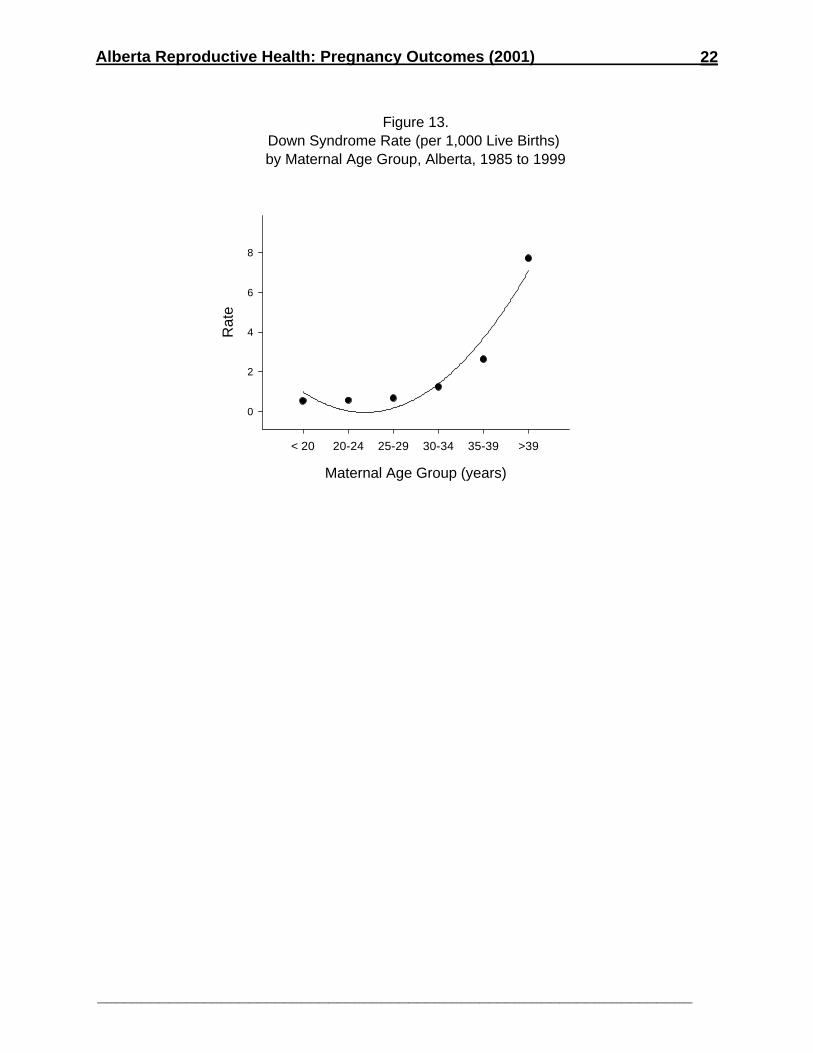
• Maternal age is related to the rate of anomalies (see Table A16). Mothers giving birth at age35 or older have a higher risk for congenital anomalies (see Figure 12), especially for DownSyndrome (see Figure 13). Note that the overall Down Syndrome rate increase seen inTable A15 is confounded with increasing maternal age: More older mothers are giving birth,thus more Down Syndrome babies are being born. The Down Syndrome rate is notincreasing for mothers under 35.
• More detailed information on congenital anomalies will be available from the report of theAlberta Congenital Anomalies Surveillance System, 1980-1998 (upcoming).
Figure 10.All Congenital Anomalies Combined Rate
(per 1,000 Total Births), Alberta, 1985 to 1999
Year of Diagnosis
85 86 87 88 89 90 91 92 93 94 95 96 97 98 99
Rat
e
32
34
36
38
40
42
44
46
48
50
Alberta Reproductive Health: Pregnancy Outcomes (2001)
___________________________________________________________________
21
Figure 11.Neural Tube Defect Rate (per 1,000 Total Births),
Alberta, 1985 to 1999
Year of Diagnosis
85 86 87 88 89 90 91 92 93 94 95 96 97 98 99
Rat
e
0.6
0.7
0.8
0.9
1.0
1.1
1.2
Figure 12.All Congenital Anomalies Combined Rate (per 1,000 Live Births)
by Maternal Age Group, Alberta, 1985 to 1999
Maternal Age Group (Years)
< 20 20-24 25-29 30-34 35-39 >39
Rat
e
36
38
40
42
44
46
48
50
Alberta Reproductive Health: Pregnancy Outcomes (2001)
___________________________________________________________________
22
Figure 13.Down Syndrome Rate (per 1,000 Live Births) by Maternal Age Group, Alberta, 1985 to 1999
Maternal Age Group (years)
< 20 20-24 25-29 30-34 35-39 >39
Rat
e
0
2
4
6
8
Alberta Reproductive Health: Pregnancy Outcomes (2001)
___________________________________________________________________
23
BBiirrtthh WWeeiigghhtt• In 1999, 81.5% of live births were between 2,500 and 3,999 grams, 5.9% were low birth
weight (< 2,500 grams) and 12.6% were high birth weight (≥4,000 grams) (see Table A17).• Mean birth weight in Canada in 1997 was 3,389 grams (Statistics Canada, 1999); the
mean for Alberta in 1997 was 3,368 grams.
Low birth weight
• Low birth weight infants weigh less than 2,500 grams.• Low birth weight is correlated with a number of health concerns, including maternal, fetal,
neonatal and long-term complications (Millar & Chen, 1998; Pivarnik, 1998)) and fetal andinfant mortality (Chen et al., 1998; Nault, 1997). Low birth weight rates are thus an importantindicator of children’s health.
• Numerous risk factors for low birth weight have been identified, including smoking oralcohol/drug use during pregnancy, low or high maternal age, low socioeconomic status,multiple pregnancy, poor prenatal care, low level of maternal education, pre-term birth, andgender (low birth weight infants are more likely to be female) (Chen et al., 1998; Pivarnik,1998; Pollack, Lantz, & Frohna, 2000; Tough, Svenson, & Schopflocher, 1999). Smoking isthe most important modifiable behaviour associated with low birth weight (Wilkins & Houle,1999).
• Increased use of in-vitro fertilization techniques is resulting in the birth of more low birthweight infants (Tough, Greene, Svenson, & Belik, 2000).
• The rate of neurodevelopmental impairment increases with decreasing birth weight(D’Agostino & Clifford, 1998).
• Since 1990, the low birth weight rate has included live newborns weighing less than 500grams (see time trends in Table A17) due to changes in registration and reporting (Svenson,Schopflocher, Sauve, and Robertson, 1998) and improvements in and access to perinatalcare.
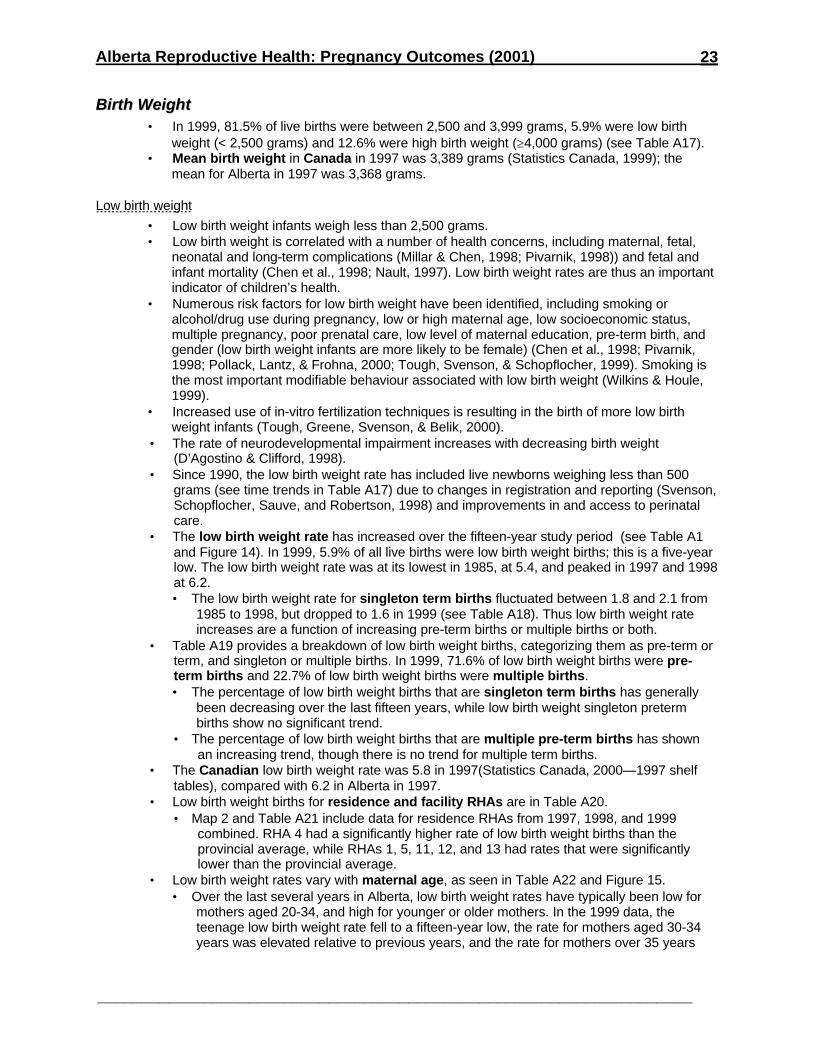
• The low birth weight rate has increased over the fifteen-year study period (see Table A1and Figure 14). In 1999, 5.9% of all live births were low birth weight births; this is a five-yearlow. The low birth weight rate was at its lowest in 1985, at 5.4, and peaked in 1997 and 1998at 6.2.• The low birth weight rate for singleton term births fluctuated between 1.8 and 2.1 from
1985 to 1998, but dropped to 1.6 in 1999 (see Table A18). Thus low birth weight rateincreases are a function of increasing pre-term births or multiple births or both.
• Table A19 provides a breakdown of low birth weight births, categorizing them as pre-term orterm, and singleton or multiple births. In 1999, 71.6% of low birth weight births were pre-term births and 22.7% of low birth weight births were multiple births.• The percentage of low birth weight births that are singleton term births has generally
been decreasing over the last fifteen years, while low birth weight singleton pretermbirths show no significant trend.
• The percentage of low birth weight births that are multiple pre-term births has shownan increasing trend, though there is no trend for multiple term births.
• The Canadian low birth weight rate was 5.8 in 1997(Statistics Canada, 2000—1997 shelftables), compared with 6.2 in Alberta in 1997.
• Low birth weight births for residence and facility RHAs are in Table A20.• Map 2 and Table A21 include data for residence RHAs from 1997, 1998, and 1999
combined. RHA 4 had a significantly higher rate of low birth weight births than theprovincial average, while RHAs 1, 5, 11, 12, and 13 had rates that were significantlylower than the provincial average.
• Low birth weight rates vary with maternal age, as seen in Table A22 and Figure 15.• Over the last several years in Alberta, low birth weight rates have typically been low for
mothers aged 20-34, and high for younger or older mothers. In the 1999 data, theteenage low birth weight rate fell to a fifteen-year low, the rate for mothers aged 30-34years was elevated relative to previous years, and the rate for mothers over 35 years
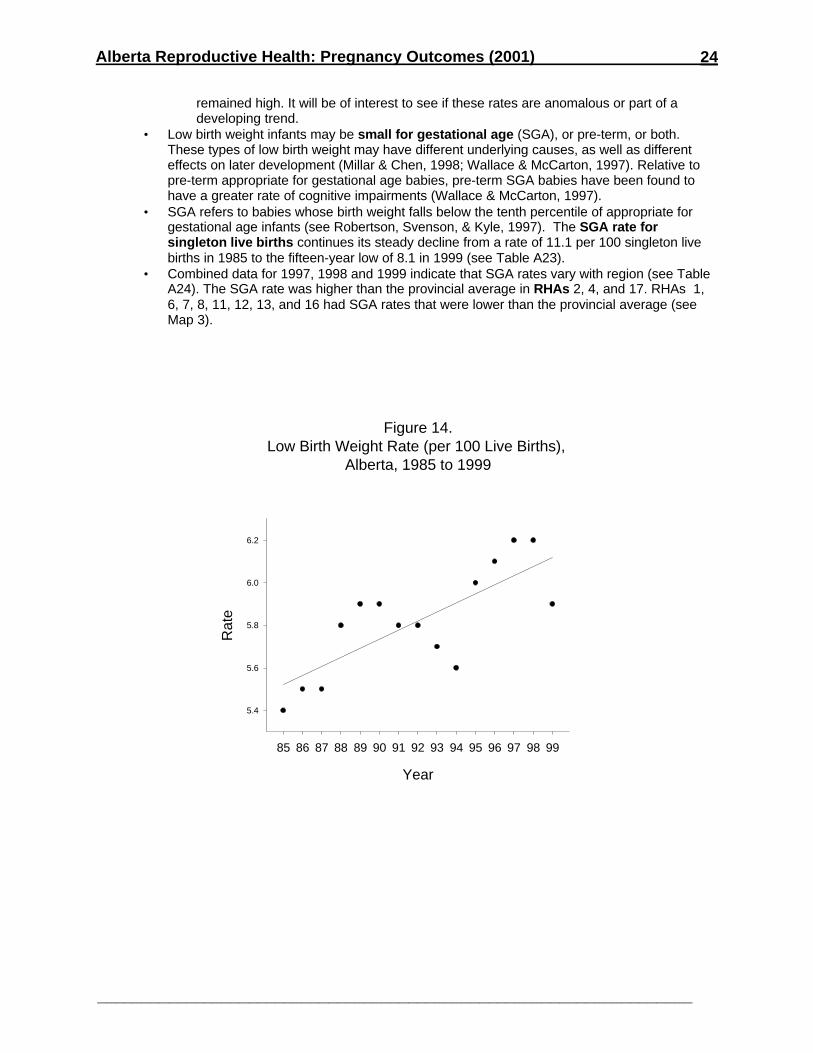
Alberta Reproductive Health: Pregnancy Outcomes (2001)
___________________________________________________________________
24
remained high. It will be of interest to see if these rates are anomalous or part of adeveloping trend.
• Low birth weight infants may be small for gestational age (SGA), or pre-term, or both.These types of low birth weight may have different underlying causes, as well as differenteffects on later development (Millar & Chen, 1998; Wallace & McCarton, 1997). Relative topre-term appropriate for gestational age babies, pre-term SGA babies have been found tohave a greater rate of cognitive impairments (Wallace & McCarton, 1997).
• SGA refers to babies whose birth weight falls below the tenth percentile of appropriate forgestational age infants (see Robertson, Svenson, & Kyle, 1997). The SGA rate forsingleton live births continues its steady decline from a rate of 11.1 per 100 singleton livebirths in 1985 to the fifteen-year low of 8.1 in 1999 (see Table A23).
• Combined data for 1997, 1998 and 1999 indicate that SGA rates vary with region (see TableA24). The SGA rate was higher than the provincial average in RHAs 2, 4, and 17. RHAs 1,6, 7, 8, 11, 12, 13, and 16 had SGA rates that were lower than the provincial average (seeMap 3).
Figure 14.Low Birth Weight Rate (per 100 Live Births),
Alberta, 1985 to 1999
Year
85 86 87 88 89 90 91 92 93 94 95 96 97 98 99
Rat
e
5.4
5.6
5.8
6.0
6.2
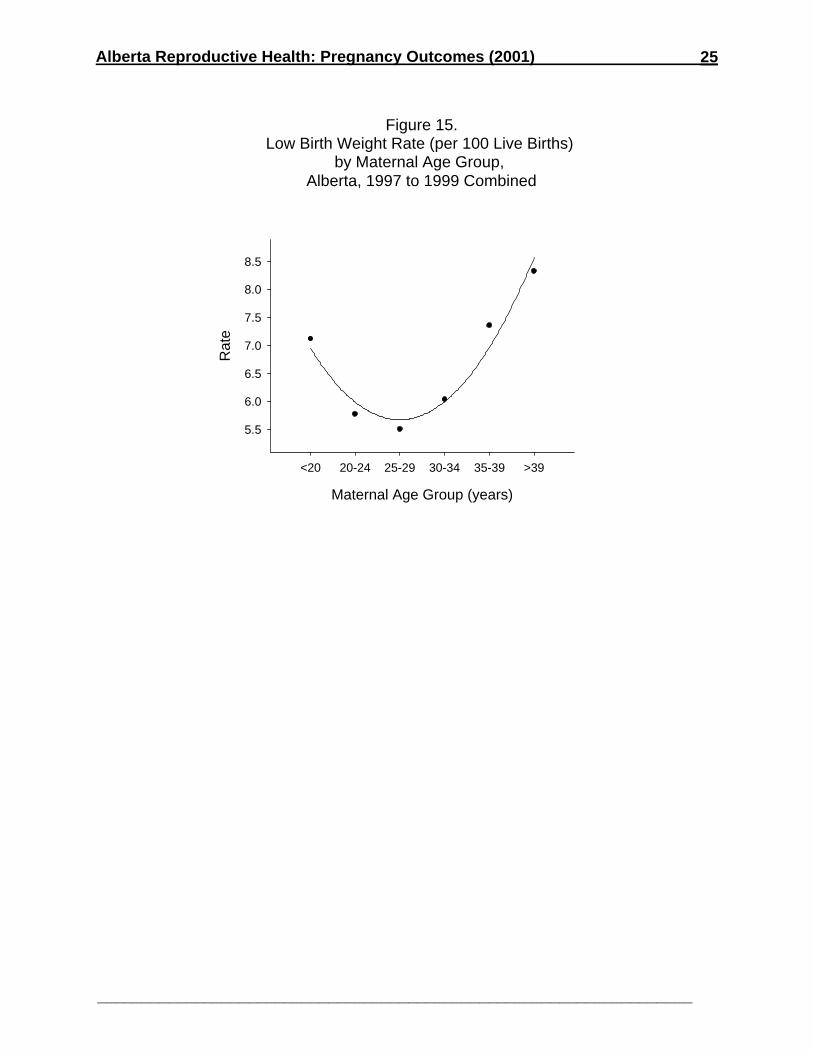
Alberta Reproductive Health: Pregnancy Outcomes (2001)
___________________________________________________________________
25
Figure 15.Low Birth Weight Rate (per 100 Live Births)
by Maternal Age Group, Alberta, 1997 to 1999 Combined
Maternal Age Group (years)
<20 20-24 25-29 30-34 35-39 >39
Rat
e
5.5
6.0
6.5
7.0
7.5
8.0
8.5
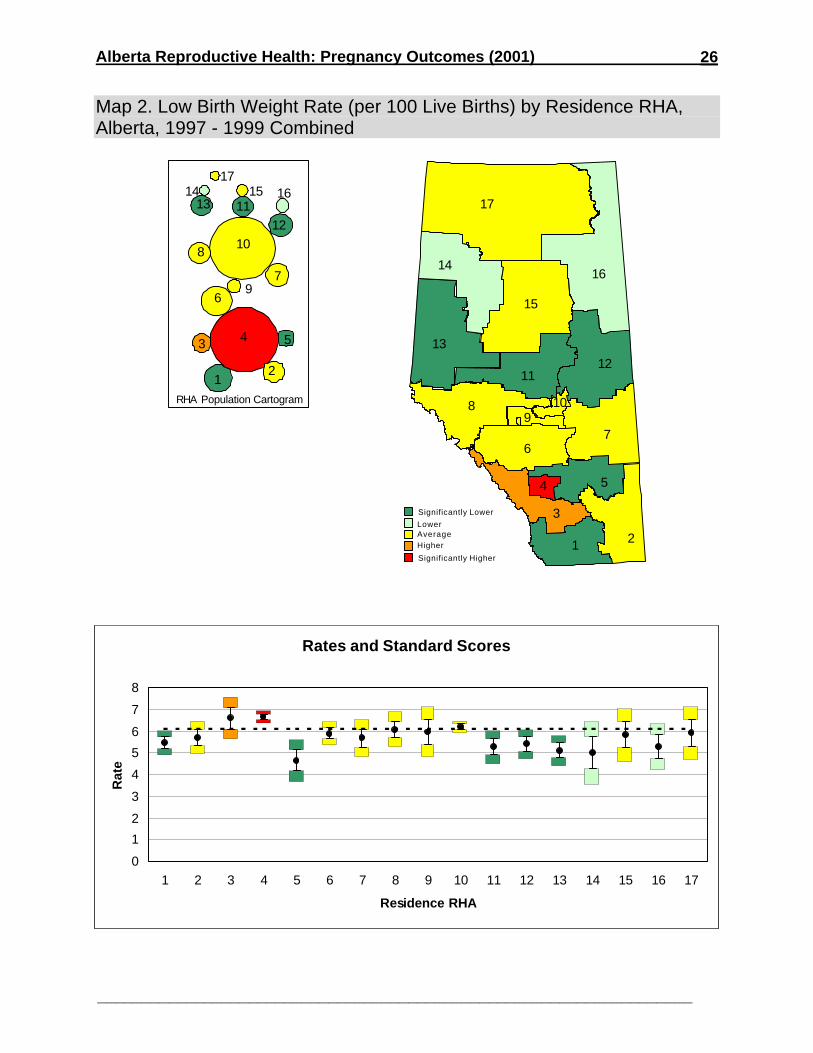
Alberta Reproductive Health: Pregnancy Outcomes (2001)
___________________________________________________________________
26
Map 2. Low Birth Weight Rate (per 100 Live Births) by Residence RHA,Alberta, 1997 - 1999 Combined
Significantly Lower
LowerAverageHigher
Significantly Higher
17
16
15
14
13
1211
8
6
3
1 2
5
7
4
109
12
3 4 5
6
7
8
9
10
1112
1314 15 16
17
RHA Population Cartogram
Rates and Standard Scores
0
1
2
3
4
5
6
7
8
1 2 3 4 5 6 7 8 9 10 11 12 13 14 15 16 17
Residence RHA
Rat
e
Rates and Standard Scores
0
1
2
3
4
5
6
7
8
1 2 3 4 5 6 7 8 9 10 11 12 13 14 15 16 17
Residence RHA
Rat
e
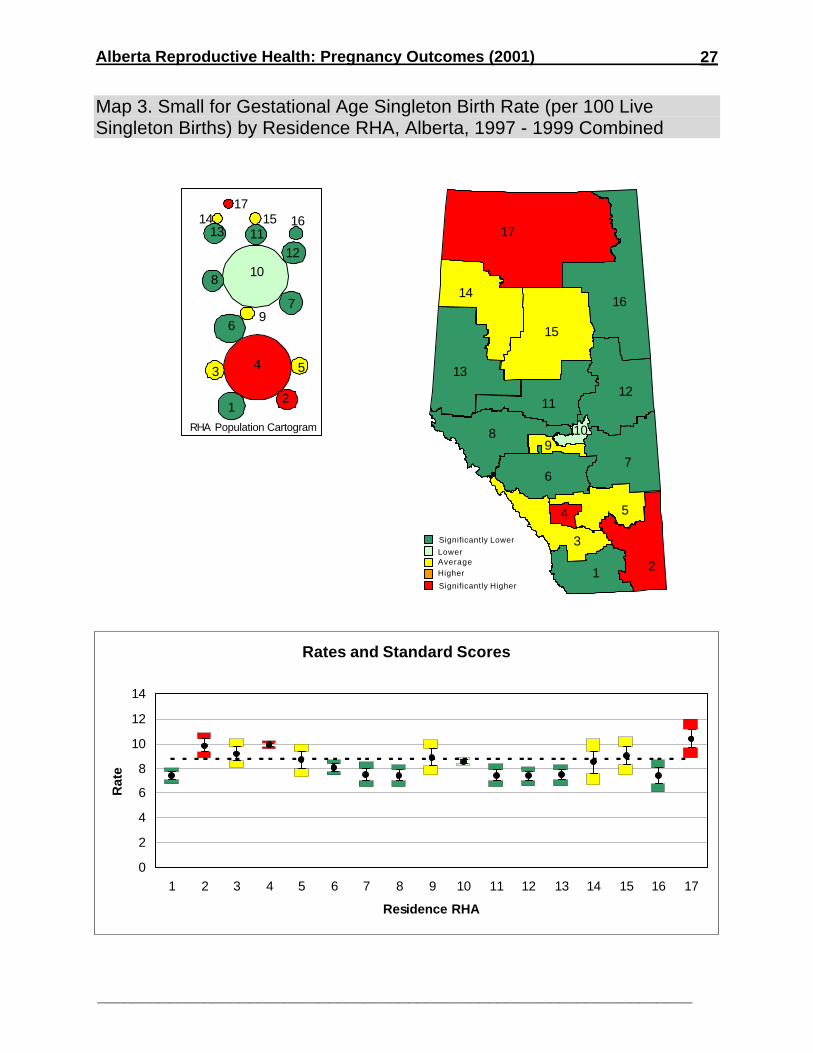
Alberta Reproductive Health: Pregnancy Outcomes (2001)
___________________________________________________________________
27
Map 3. Small for Gestational Age Singleton Birth Rate (per 100 LiveSingleton Births) by Residence RHA, Alberta, 1997 - 1999 Combined
Significantly Lower
LowerAverageHigher
Significantly Higher
17
16
15
14
13
1211
8
6
3
1 2
5
7
4
109
12
3 4 5
6
7
8
9
10
1112
1314 15 16
17
RHA Population Cartogram
Rates and Standard Scores
0
2
4
6
8
10
12
14
1 2 3 4 5 6 7 8 9 10 11 12 13 14 15 16 17
Residence RHA
Rat
e
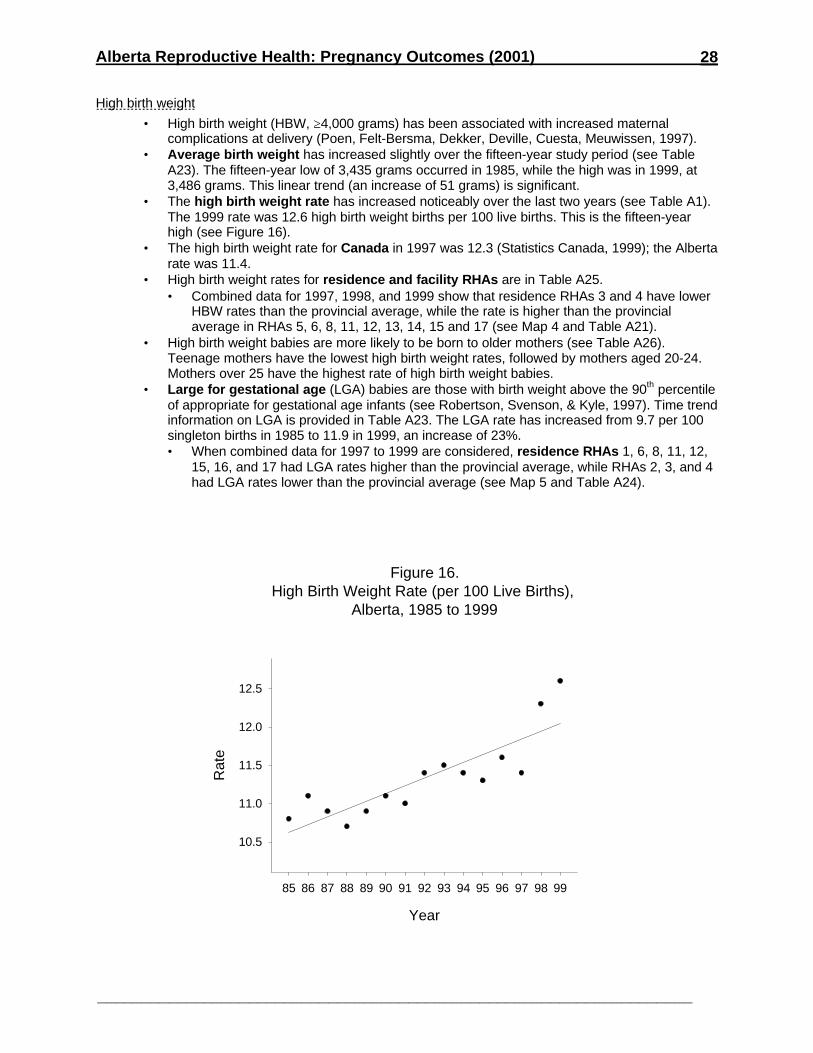
Alberta Reproductive Health: Pregnancy Outcomes (2001)
___________________________________________________________________
28
High birth weight
• High birth weight (HBW, ≥4,000 grams) has been associated with increased maternalcomplications at delivery (Poen, Felt-Bersma, Dekker, Deville, Cuesta, Meuwissen, 1997).
• Average birth weight has increased slightly over the fifteen-year study period (see TableA23). The fifteen-year low of 3,435 grams occurred in 1985, while the high was in 1999, at3,486 grams. This linear trend (an increase of 51 grams) is significant.
• The high birth weight rate has increased noticeably over the last two years (see Table A1).The 1999 rate was 12.6 high birth weight births per 100 live births. This is the fifteen-yearhigh (see Figure 16).
• The high birth weight rate for Canada in 1997 was 12.3 (Statistics Canada, 1999); the Albertarate was 11.4.
• High birth weight rates for residence and facility RHAs are in Table A25.• Combined data for 1997, 1998, and 1999 show that residence RHAs 3 and 4 have lower
HBW rates than the provincial average, while the rate is higher than the provincialaverage in RHAs 5, 6, 8, 11, 12, 13, 14, 15 and 17 (see Map 4 and Table A21).
• High birth weight babies are more likely to be born to older mothers (see Table A26).Teenage mothers have the lowest high birth weight rates, followed by mothers aged 20-24.Mothers over 25 have the highest rate of high birth weight babies.
• Large for gestational age (LGA) babies are those with birth weight above the 90th percentileof appropriate for gestational age infants (see Robertson, Svenson, & Kyle, 1997). Time trendinformation on LGA is provided in Table A23. The LGA rate has increased from 9.7 per 100singleton births in 1985 to 11.9 in 1999, an increase of 23%.• When combined data for 1997 to 1999 are considered, residence RHAs 1, 6, 8, 11, 12,
15, 16, and 17 had LGA rates higher than the provincial average, while RHAs 2, 3, and 4had LGA rates lower than the provincial average (see Map 5 and Table A24).
Figure 16.High Birth Weight Rate (per 100 Live Births),
Alberta, 1985 to 1999
Year
85 86 87 88 89 90 91 92 93 94 95 96 97 98 99
Rat
e
10.5
11.0
11.5
12.0
12.5
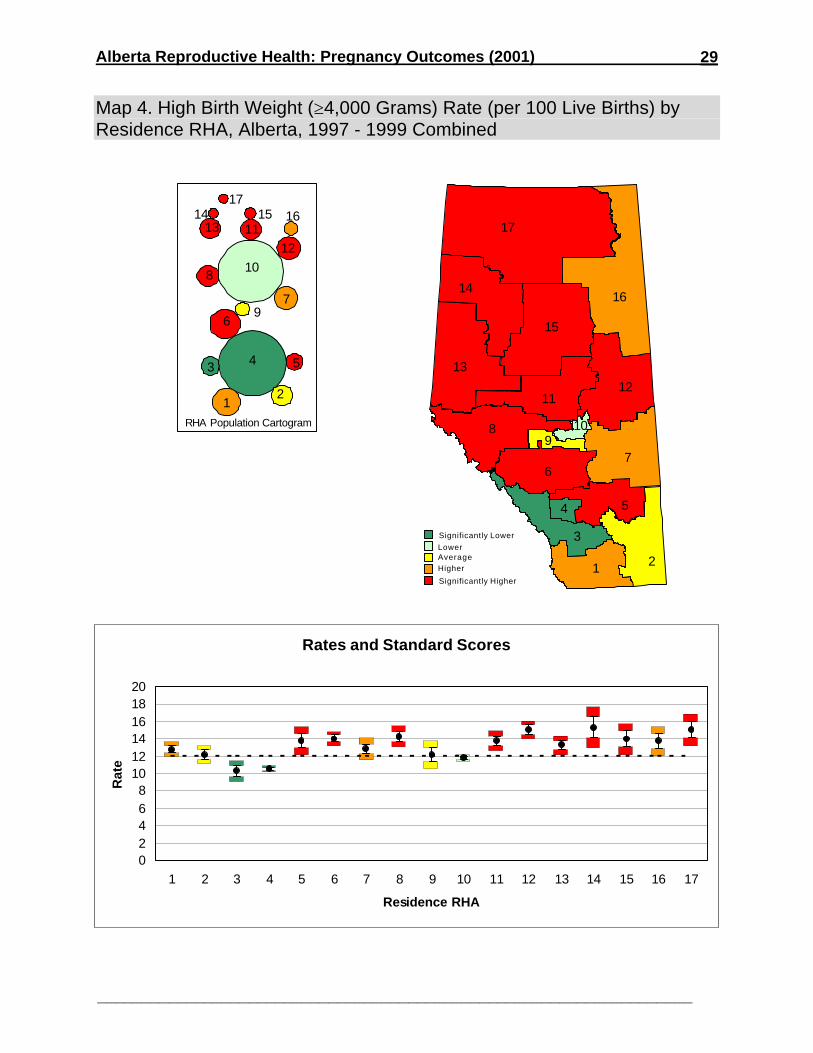
Alberta Reproductive Health: Pregnancy Outcomes (2001)
___________________________________________________________________
29
Map 4. High Birth Weight (≥4,000 Grams) Rate (per 100 Live Births) byResidence RHA, Alberta, 1997 - 1999 Combined
Significantly Lower
LowerAverageHigher
Significantly Higher
17
16
15
14
13
1211
8
6
3
1 2
5
7
4
109
12
3 4 5
6
7
8
9
10
1112
1314 15 16
17
RHA Population Cartogram
Rates and Standard Scores
02468
101214161820
1 2 3 4 5 6 7 8 9 10 11 12 13 14 15 16 17
Residence RHA
Rat
e
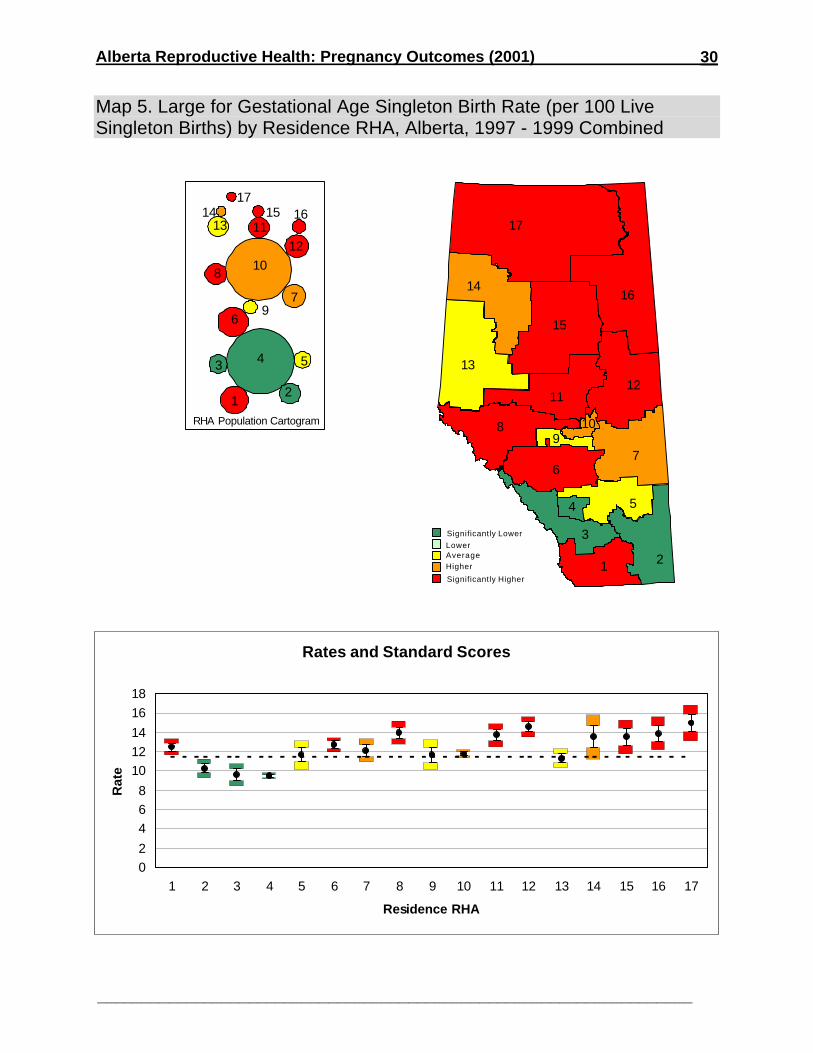
Alberta Reproductive Health: Pregnancy Outcomes (2001)
___________________________________________________________________
30
Map 5. Large for Gestational Age Singleton Birth Rate (per 100 LiveSingleton Births) by Residence RHA, Alberta, 1997 - 1999 Combined
Significantly Lower
LowerAverageHigher
Significantly Higher
17
16
15
14
13
1211
8
6
3
1 2
5
7
4
109
12
3 4 5
6
7
8
9
10
1112
1314 15 16
17
RHA Population Cartogram
Rates and Standard Scores
02
468
1012
14
16
18
1 2 3 4 5 6 7 8 9 10 11 12 13 14 15 16 17
Residence RHA
Rat
e
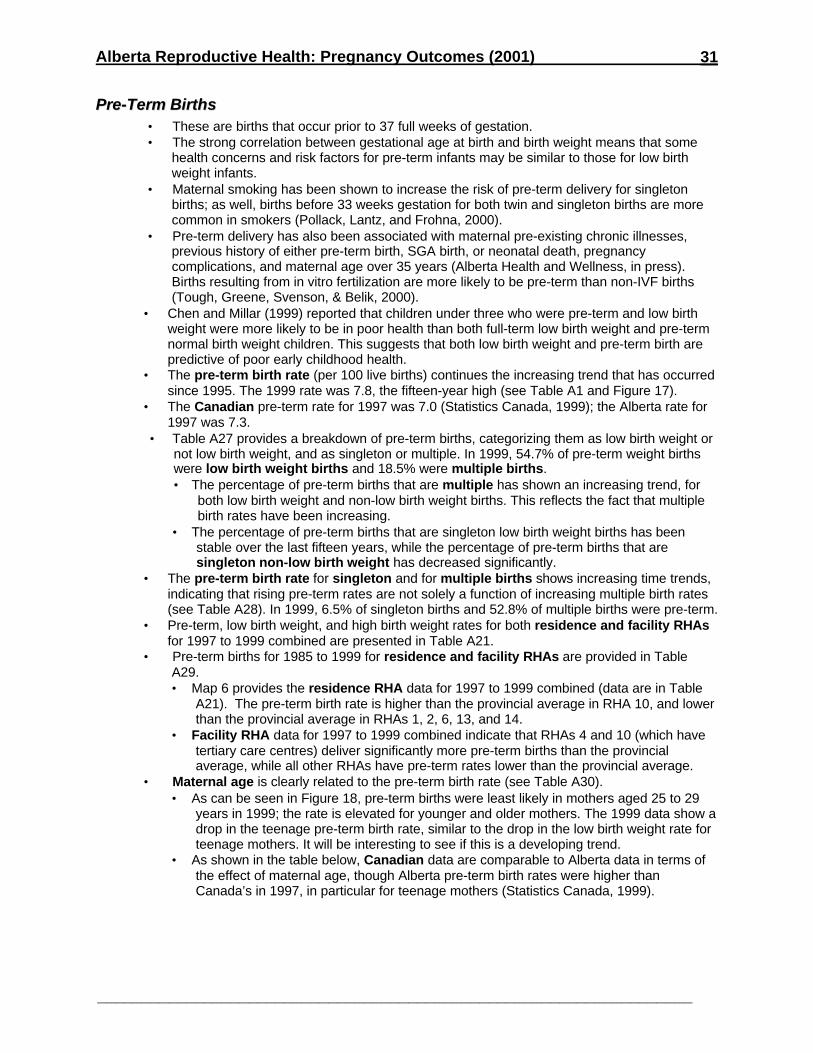
Alberta Reproductive Health: Pregnancy Outcomes (2001)
___________________________________________________________________
31
PPrree--TTeerrmm BBiirrtthhss• These are births that occur prior to 37 full weeks of gestation.• The strong correlation between gestational age at birth and birth weight means that some
health concerns and risk factors for pre-term infants may be similar to those for low birthweight infants.
• Maternal smoking has been shown to increase the risk of pre-term delivery for singletonbirths; as well, births before 33 weeks gestation for both twin and singleton births are morecommon in smokers (Pollack, Lantz, and Frohna, 2000).
• Pre-term delivery has also been associated with maternal pre-existing chronic illnesses,previous history of either pre-term birth, SGA birth, or neonatal death, pregnancycomplications, and maternal age over 35 years (Alberta Health and Wellness, in press).Births resulting from in vitro fertilization are more likely to be pre-term than non-IVF births(Tough, Greene, Svenson, & Belik, 2000).
• Chen and Millar (1999) reported that children under three who were pre-term and low birthweight were more likely to be in poor health than both full-term low birth weight and pre-termnormal birth weight children. This suggests that both low birth weight and pre-term birth arepredictive of poor early childhood health.
• The pre-term birth rate (per 100 live births) continues the increasing trend that has occurredsince 1995. The 1999 rate was 7.8, the fifteen-year high (see Table A1 and Figure 17).
• The Canadian pre-term rate for 1997 was 7.0 (Statistics Canada, 1999); the Alberta rate for1997 was 7.3.
• Table A27 provides a breakdown of pre-term births, categorizing them as low birth weight ornot low birth weight, and as singleton or multiple. In 1999, 54.7% of pre-term weight birthswere low birth weight births and 18.5% were multiple births.• The percentage of pre-term births that are multiple has shown an increasing trend, for
both low birth weight and non-low birth weight births. This reflects the fact that multiplebirth rates have been increasing.
• The percentage of pre-term births that are singleton low birth weight births has beenstable over the last fifteen years, while the percentage of pre-term births that aresingleton non-low birth weight has decreased significantly.
• The pre-term birth rate for singleton and for multiple births shows increasing time trends,indicating that rising pre-term rates are not solely a function of increasing multiple birth rates(see Table A28). In 1999, 6.5% of singleton births and 52.8% of multiple births were pre-term.
• Pre-term, low birth weight, and high birth weight rates for both residence and facility RHAsfor 1997 to 1999 combined are presented in Table A21.
• Pre-term births for 1985 to 1999 for residence and facility RHAs are provided in TableA29.• Map 6 provides the residence RHA data for 1997 to 1999 combined (data are in Table
A21). The pre-term birth rate is higher than the provincial average in RHA 10, and lowerthan the provincial average in RHAs 1, 2, 6, 13, and 14.
• Facility RHA data for 1997 to 1999 combined indicate that RHAs 4 and 10 (which havetertiary care centres) deliver significantly more pre-term births than the provincialaverage, while all other RHAs have pre-term rates lower than the provincial average.
• Maternal age is clearly related to the pre-term birth rate (see Table A30).• As can be seen in Figure 18, pre-term births were least likely in mothers aged 25 to 29
years in 1999; the rate is elevated for younger and older mothers. The 1999 data show adrop in the teenage pre-term birth rate, similar to the drop in the low birth weight rate forteenage mothers. It will be interesting to see if this is a developing trend.
• As shown in the table below, Canadian data are comparable to Alberta data in terms ofthe effect of maternal age, though Alberta pre-term birth rates were higher thanCanada’s in 1997, in particular for teenage mothers (Statistics Canada, 1999).
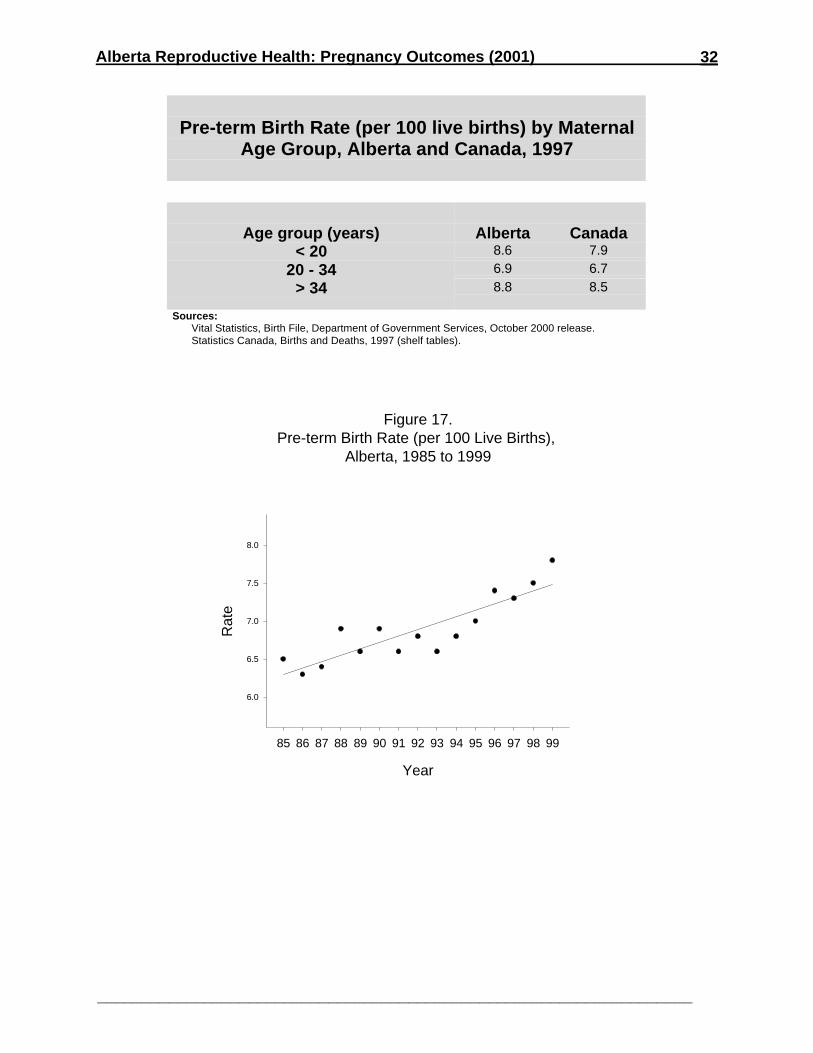
Alberta Reproductive Health: Pregnancy Outcomes (2001)
___________________________________________________________________
32
Pre-term Birth Rate (per 100 live births) by MaternalAge Group, Alberta and Canada, 1997
Age group (years) Alberta Canada< 20 8.6 7.9
20 - 34 6.9 6.7
> 34 8.8 8.5
Sources:Vital Statistics, Birth File, Department of Government Services, October 2000 release.Statistics Canada, Births and Deaths, 1997 (shelf tables).
Figure 17.Pre-term Birth Rate (per 100 Live Births),
Alberta, 1985 to 1999
Year
85 86 87 88 89 90 91 92 93 94 95 96 97 98 99
Rat
e
6.0
6.5
7.0
7.5
8.0
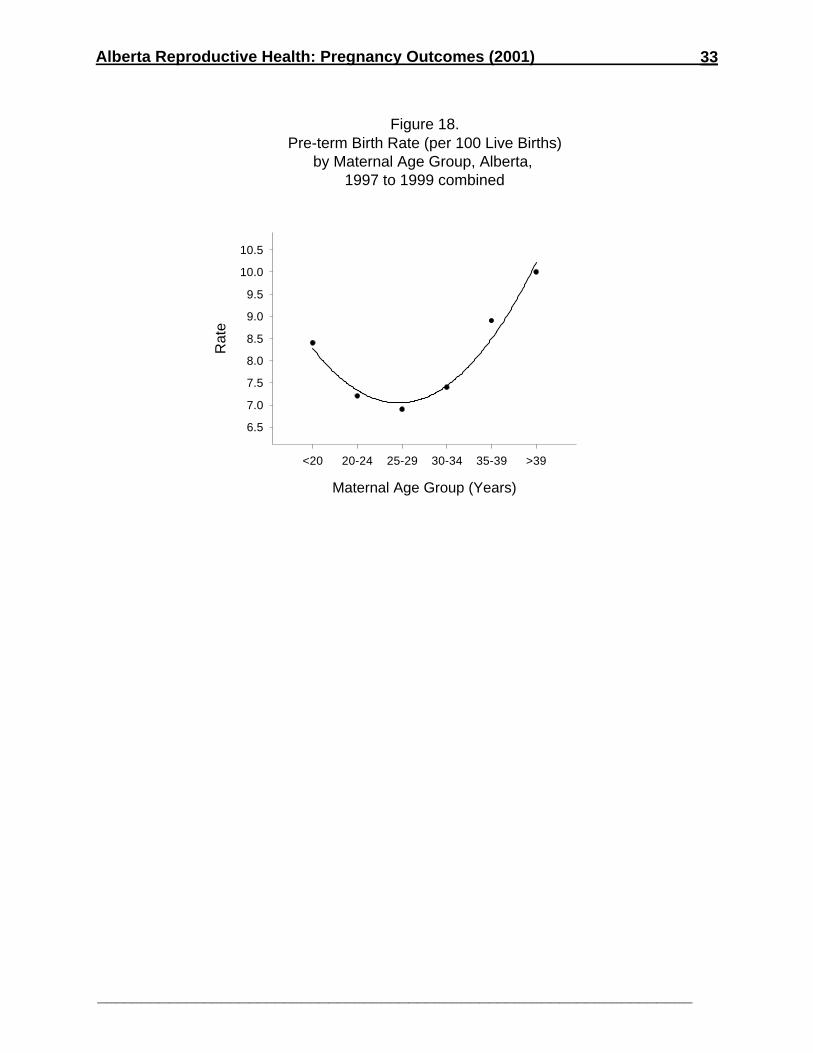
Alberta Reproductive Health: Pregnancy Outcomes (2001)
___________________________________________________________________
33
Figure 18.Pre-term Birth Rate (per 100 Live Births)
by Maternal Age Group, Alberta, 1997 to 1999 combined
Maternal Age Group (Years)
<20 20-24 25-29 30-34 35-39 >39
Rat
e
6.5
7.0
7.5
8.0
8.5
9.0
9.5
10.0
10.5
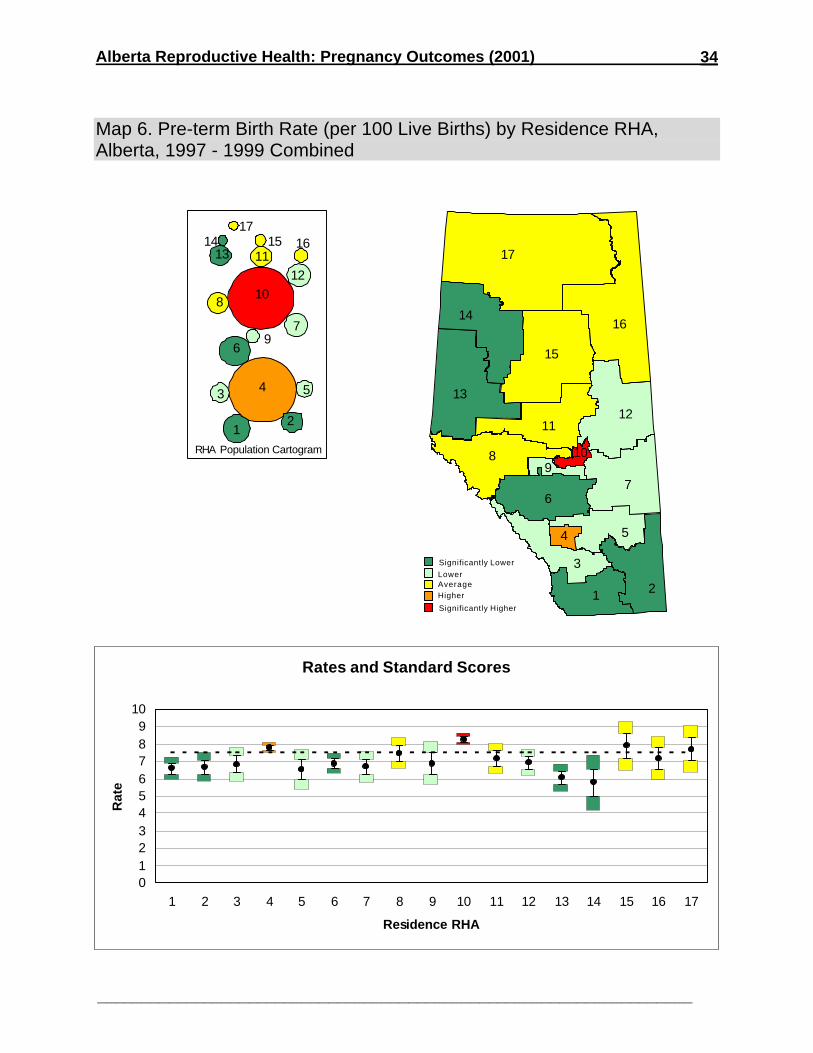
Alberta Reproductive Health: Pregnancy Outcomes (2001)
___________________________________________________________________
34
Map 6. Pre-term Birth Rate (per 100 Live Births) by Residence RHA,Alberta, 1997 - 1999 Combined
Significantly Lower
LowerAverageHigher
Significantly Higher
17
16
15
14
13
1211
8
6
3
1 2
5
7
4
109
12
3 4 5
6
7
8
9
10
1112
1314 15 16
17
RHA Population Cartogram
Rates and Standard Scores
0123456789
10
1 2 3 4 5 6 7 8 9 10 11 12 13 14 15 16 17
Residence RHA
Rat
e

Alberta Reproductive Health: Pregnancy Outcomes (2001)
___________________________________________________________________
35
MMuullttiippllee BBiirrtthhss• A multiple pregnancy occurs when a woman is pregnant with more than one fetus; a multiple
birth occurs when more than one infant is born (whether live or stillbirth).• Multiple pregnancy is associated with a higher incidence of maternal hypertension, post-
partum hemorrhage, and cesarean section (Senat, Ancel, Bouvier-Colle, & Breart, 1998) andhigher rates of intrauterine growth restriction and fetal death (Alexander, Kogan, Martin, &Papiernik, 1998).
• Multiple births are also more likely to be pre-term and result in low birth weight infants(Tough, Svenson, & Schopflocher, 1999).
• Increasing multiple birth rates are thought to be a function of both increasing maternal ageand increasing use of fertility-enhancing drugs (Luke, 1998; Alexander, Kogan, Martin, &Papiernik, 1998). Multiple births are much more likely with in vitro fertilization than without invitro fertilization (Tough, Greene, Svenson, & Belik, 2000).
• The Society of Obstetrics and Gynecology (SOGC) issued a consensus statement on theManagement of Twin Pregnancies (Part I & II) in July and August of 2000. Part I deals withfive areas of priority, listed below. Part II focuses on the impact of multiples – the incidence,perinatal mortality rate, social and financial impact, the role of assisted reproduction, andhealth promotion programs.• Multiple Births 0 – 20 weeks. – Recommendations for early ultrasound and genetic
counseling.• Preterm Labour Prevention.• Fetal Growth in Multiples.• Labour Management and the delivery of the second twin – the evidence and
recommendations.• Special Twin Circumstances – guidelines for diagnosis and management (Twin-Twin
transfusion, monoamniotic pregnancies).• Multiple pregnancies, multiple births and perinatal deaths of multiple births are
detailed for 1998 for each of the RHAs in Table A31. Time trends for multiple pregnancies,multiple births, and perinatal deaths of multiple births are shown in Table A32.• Amongst women with twin pregnancies who had a stillbirth or neonatal death in 1998,
75.0% delivered at less than 32 weeks gestation, and 84.3% delivered at less than 37weeks. For singleton pregnancies with a stillbirth or neonatal death, the respective ratesare 60.4% and 75.6%.
• The rate of twin stillbirth and neonatal deaths with birth weights of less than 2500 gramswas 90.6%; 75.0% were less than 1000 grams, and 37.5 % were less than 500 grams.
• The multiple birth rate (per 100 live births) fluctuated between 1.9 and 2.1 from 1985 to1991, between 2.2 and 2.3 from 1992 to 1995, and increased more obviously from 1996.The rate was 2.7 in 1999 (see Table A1 and Figure 19). The linear increase from 1985 to1999 is a statistically significant trend.• Both Canada and Alberta had multiple birth rates of 2.5 per 100 live births in 1997
(Statistics Canada, 1999).• In 1999, 96.9% of multiple live births were twin births and the remaining 3.1% were
triplet births (see Table A33).• Multiple births for each of the residence and facility RHAs are detailed in Table A34. Rates
are not provided for these frequencies, as the numbers are too small in many cases toprovide reliable estimates of rates.• Combined data for 1997 to 1999 for residence RHAs show that multiple birth rates do
vary across RHAs (see Table A35). RHAs 4 and 8 had multiple birth rates that weresignificantly higher than the provincial average, while the multiple birth rate wassignificantly lower than the provincial average in RHAs 12 and 14 (see Map 7).
• The facility RHA for delivery was RHA 4 or RHA 10 for 79.0% of women experiencinglive multiple births in Alberta from 1997 to 1999. However, only 59.2% of women havingmultiple births during that period actually lived in RHA 4 or RHA 10 (see Table A35). It is
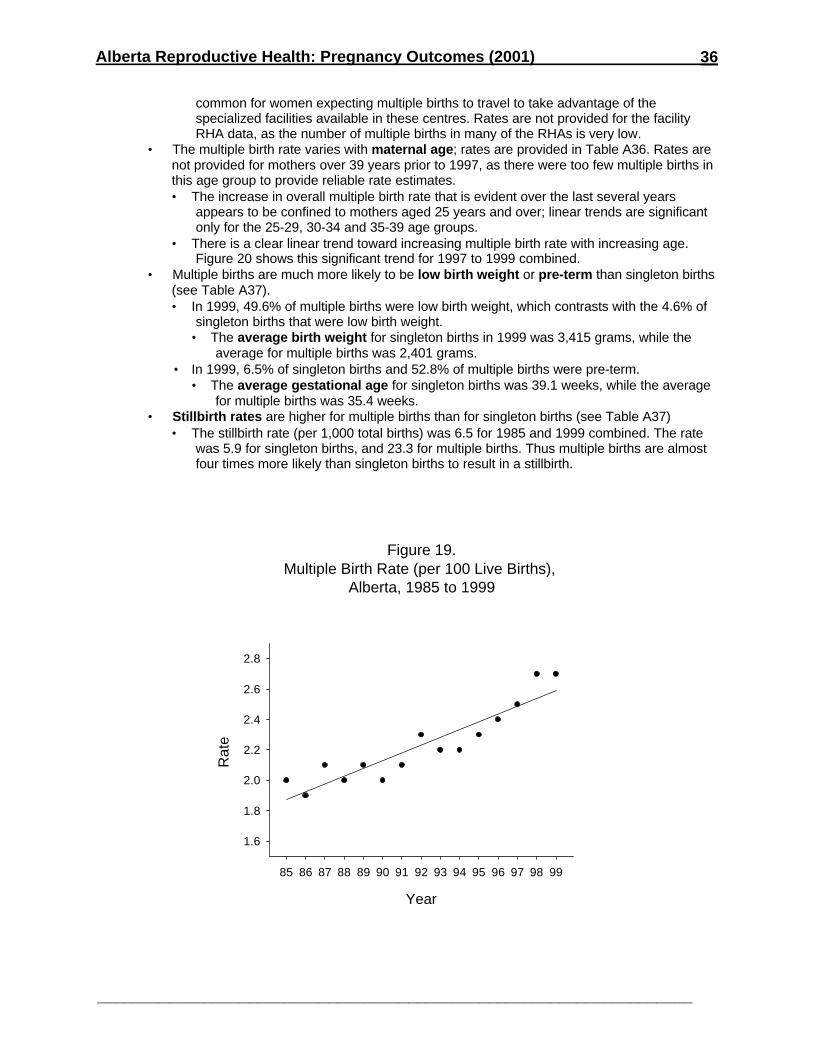
Alberta Reproductive Health: Pregnancy Outcomes (2001)
___________________________________________________________________
36
common for women expecting multiple births to travel to take advantage of thespecialized facilities available in these centres. Rates are not provided for the facilityRHA data, as the number of multiple births in many of the RHAs is very low.
• The multiple birth rate varies with maternal age; rates are provided in Table A36. Rates arenot provided for mothers over 39 years prior to 1997, as there were too few multiple births inthis age group to provide reliable rate estimates.• The increase in overall multiple birth rate that is evident over the last several years
appears to be confined to mothers aged 25 years and over; linear trends are significantonly for the 25-29, 30-34 and 35-39 age groups.
• There is a clear linear trend toward increasing multiple birth rate with increasing age.Figure 20 shows this significant trend for 1997 to 1999 combined.
• Multiple births are much more likely to be low birth weight or pre-term than singleton births(see Table A37).• In 1999, 49.6% of multiple births were low birth weight, which contrasts with the 4.6% of
singleton births that were low birth weight.• The average birth weight for singleton births in 1999 was 3,415 grams, while the
average for multiple births was 2,401 grams.• In 1999, 6.5% of singleton births and 52.8% of multiple births were pre-term.
• The average gestational age for singleton births was 39.1 weeks, while the averagefor multiple births was 35.4 weeks.
• Stillbirth rates are higher for multiple births than for singleton births (see Table A37)• The stillbirth rate (per 1,000 total births) was 6.5 for 1985 and 1999 combined. The rate
was 5.9 for singleton births, and 23.3 for multiple births. Thus multiple births are almostfour times more likely than singleton births to result in a stillbirth.
Figure 19.Multiple Birth Rate (per 100 Live Births),
Alberta, 1985 to 1999
Year
85 86 87 88 89 90 91 92 93 94 95 96 97 98 99
Rat
e
1.6
1.8
2.0
2.2
2.4
2.6
2.8
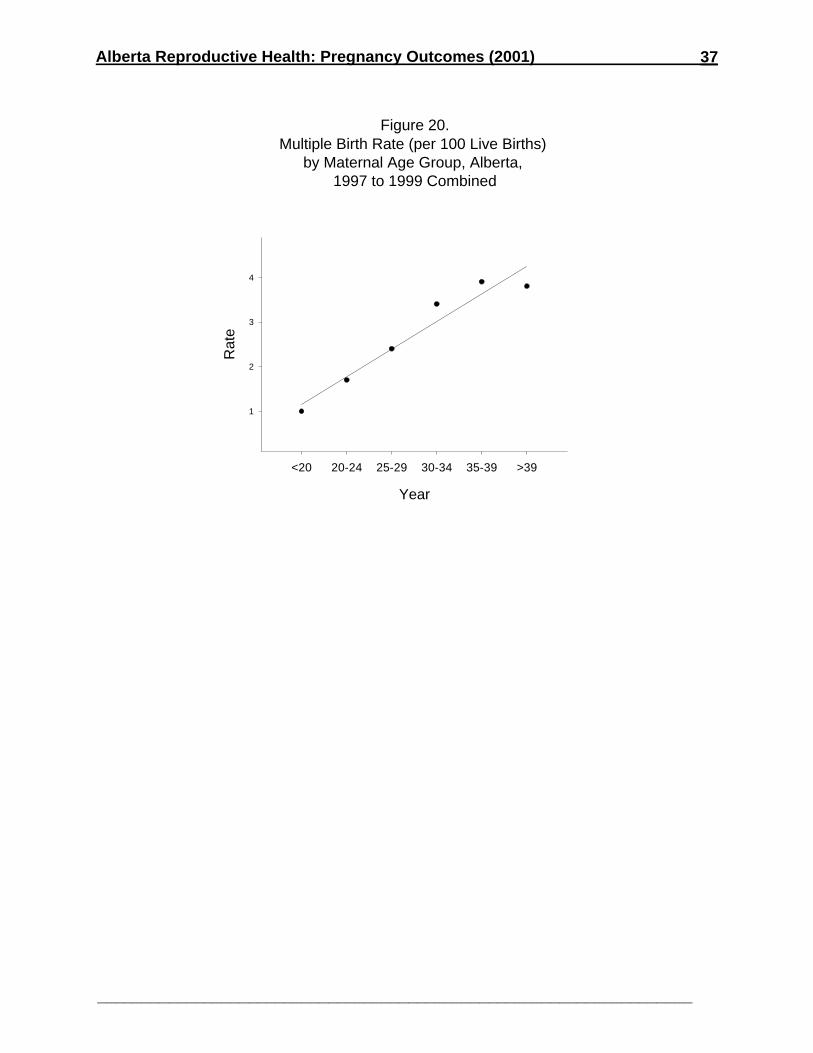
Alberta Reproductive Health: Pregnancy Outcomes (2001)
___________________________________________________________________
37
Figure 20.Multiple Birth Rate (per 100 Live Births)
by Maternal Age Group, Alberta, 1997 to 1999 Combined
Year
<20 20-24 25-29 30-34 35-39 >39
Rat
e
1
2
3
4
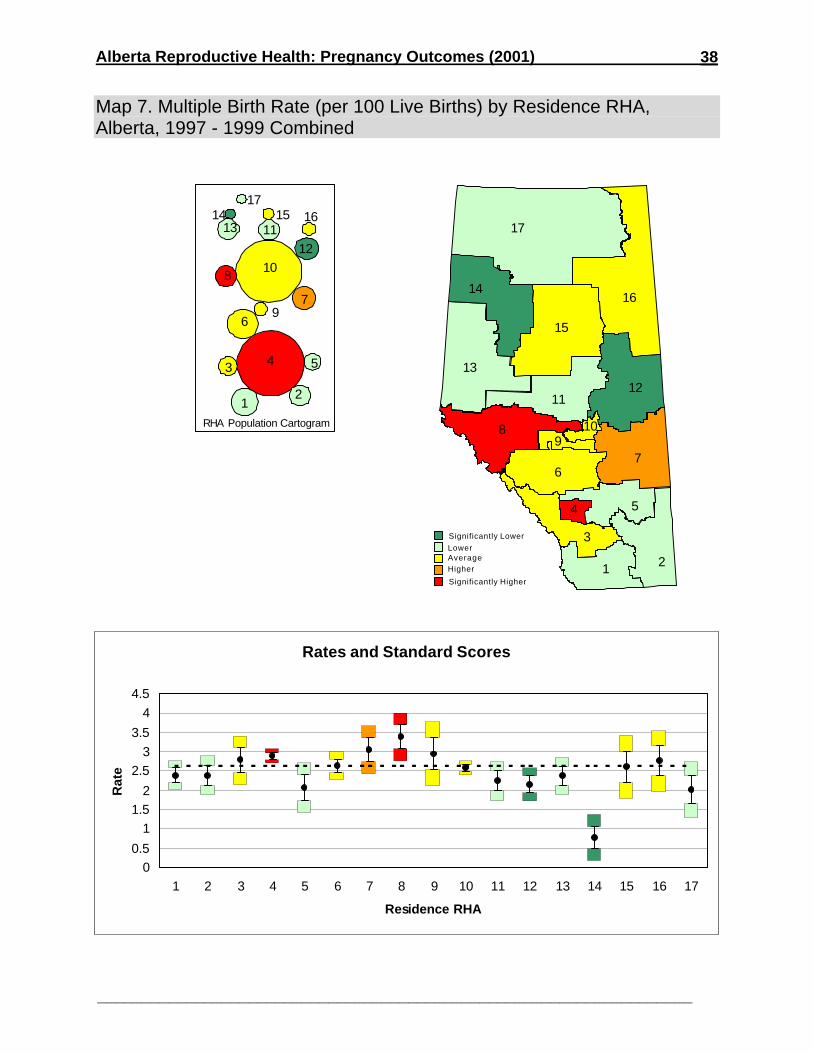
Alberta Reproductive Health: Pregnancy Outcomes (2001)
___________________________________________________________________
38
Map 7. Multiple Birth Rate (per 100 Live Births) by Residence RHA,Alberta, 1997 - 1999 Combined
Significantly Lower
LowerAverageHigher
Significantly Higher
17
16
15
14
13
1211
8
6
3
1 2
5
7
4
109
12
3 4 5
6
7
8
9
10
1112
1314 15 16
17
RHA Population Cartogram
Rates and Standard Scores
00.5
11.5
2
2.53
3.5
4
4.5
1 2 3 4 5 6 7 8 9 10 11 12 13 14 15 16 17
Residence RHA
Rat
e
Alberta Reproductive Health: Pregnancy Outcomes (2001)
___________________________________________________________________
39
Maternal Behaviours
RRiisskk FFaaccttoorrss
Smoking
• Table A38 contains data on smoking among women who gave birth to a live infant in Albertabetween 1997 and 1999.
• 26.4% of Alberta women who gave birth to a live infant between 1997 and 1999 smoked atsome point during pregnancy.• 89.0% of smokers smoked throughout the pregnancy, and 11% quit during pregnancy.
• For the purposes of the following analyses, “smokers” are women who smoked throughoutpregnancy, excluding those who quit smoking at some point during pregnancy. “Non-smokers” did not smoke at all during pregnancy. Table A39 provides separate rates on anumber of indicators for women who smoked throughout pregnancy, women who quit duringpregnancy, women who either smoked or quit during pregnancy, and women who did notsmoke during pregnancy.
• Smokers tend to be younger than non-smoking mothers. Average maternal age forsmokers was 26.0 years; the average age for non-smoking mothers was 29.0 years (seeTable A39).
• Babies born to smokers were smaller than babies born to non-smokers (see Table A39).• Mean birth weight for babies born to smokers was 3,241 grams, compared to 3,424
grams for babies born to non-smokers, a difference of 183 grams.• The low birth weight rate for smokers was 9.7 (per 100 live births); the rate for non-
smokers was 5.4.• The small for gestational age rate was 16.2 (per 100 live births) for babies born to
smokers, and 7.6 for babies born to non-smokers.• Smokers were more likely to give birth to a pre-term infant than were non-smokers. The pre-
term birth rate for smokers was 9.9 (per 100 live births), while the rate was 7.4 for non-smokers (see Table A39).
Alcohol consumption
• Tables A38 and A39 contain data on alcohol consumption among women who gave birth toa live infant in Alberta between 1997 and 1999.
• 4.6% of women consumed alcohol during pregnancy from 1997 to 1999.• As with smoking, mothers who consume alcohol during pregnancy tend to be younger than
mothers who do not consume alcohol. Mean maternal age for mothers who consumedalcohol during pregnancy was 26.9 years, compared with 28.2 years for those who did notconsume alcohol.
• Mean birth weight was 3,315 grams for babies born to mothers who drank alcohol duringpregnancy, compared with 3,384 for babies born to mothers who did not drink alcohol.
• The low birth weight rate was 9.3 (per 100 live births) for babies with mothers who drankalcohol during pregnancy, and 6.2 for those babies whose mothers did not drink alcohol.
• The small for gestational age rate was 13.3 (per 100 live births) for babies with motherswho consumed alcohol during pregnancy, and 9.3 for babies with mothers who did notconsume alcohol.
• Pre-term births occurred at a rate of 10.6 (per 100 live births) amongst babies of womenwho drank alcohol during pregnancy, and at a rate of 7.9 for babies of women who did notdrink alcohol.
Use of street drugs
• Tables A38 and A39 contain data on street drug use among women who gave birth to a liveinfant in Alberta between 1997 and 1999.
Alberta Reproductive Health: Pregnancy Outcomes (2001)
___________________________________________________________________
40
• 1.5% of Alberta women who had a live birth between 1997 and 1999 used street drugsduring pregnancy.
• As with smoking and alcohol use, mothers using street drugs tended to be younger thanthose not using street drugs. The mean maternal age for users of street drugs was 23.7years, while mean maternal age for non-users was 28.3 years.
• Mean birth weight was 3,148 grams for street drug users, and 237 grams higher (3,385grams) for non-users of street drugs.
• Low birth weight babies occurred at a rate of 15.7 (per 100 live births) to users of streetdrugs, compared with a rate of 6.2 for non-users.
• Small for gestational age births comprised 18.4 out of every 100 live births for street drugusers, and 9.3 for non-users.
• The pre-term birth rate was 17.4 (per 100 live births) for users of street drugs. The rate fornon-users was 7.9.
PPrreennaattaall CCllaasssseess• The prenatal class attendance rate for mothers giving birth to live infants between 1997 and
1999 was 33.2%. Of those attending prenatal classes, 78.7% were first-time mothers.• Table A40 contains information on a number of indicators for mothers attending prenatal
classes and mothers not attending.• Mean maternal age for those attending classes was 27.6 years, compared with a mean
maternal age of 28.4 years for those not attending .• Mean birth weight for infants whose mothers attended prenatal classes was 3410 grams,
while the mean for infants whose mothers did not attend was 3368 grams.• The low birth weight rate was 4.8 (per 100 live births) for infants with mothers who
attended prenatal classes and 7.3 for infants with mothers who did not attend.• For mothers attending prenatal classes, the small for gestational age rate was 9.0 (per
100 live births), compared with a rate of 9.6 for mothers not attending.• The pre-term birth rate (per 100 live births) was 6.4 for infants whose mothers attended
prenatal classes, and 9.0 for infants whose mothers did not attend.
BBrreeaassttffeeeeddiinngg IInniittiiaattiioonn• Breastfeeding benefits are well-documented, including (but not limited to) protection from
infection and enhanced cognitive development in infants, and reduced post-partum bleedingand delayed resumption of ovulation in mothers (Health Canada, 2000a).
• Table A41 shows breastfeeding upon discharge by facility RHA from 1996 to 1998. Not allof the hospitals within a region reported on women’s breastfeeding practices. Thosehospitals that did not report have been excluded from the totals within those regions.• Map 8 demonstrates that breastfeeding initiation rates for 1996 to 1998 combined were
higher than the provincial average for women delivering in RHAs 1, 3, and 4, and lowerthan the provincial average in RHAs 2, 7, 8, 9, 11, 12, 14, 15, and 16.
• The provincial breastfeeding initiation rate remained constant across the three years, at83.1% in 1996, 84.1% in 1997, and 85.3% in 1998.
• In Canada in 1997, the breastfeeding initiation rate was 76.7 (per 100 children).
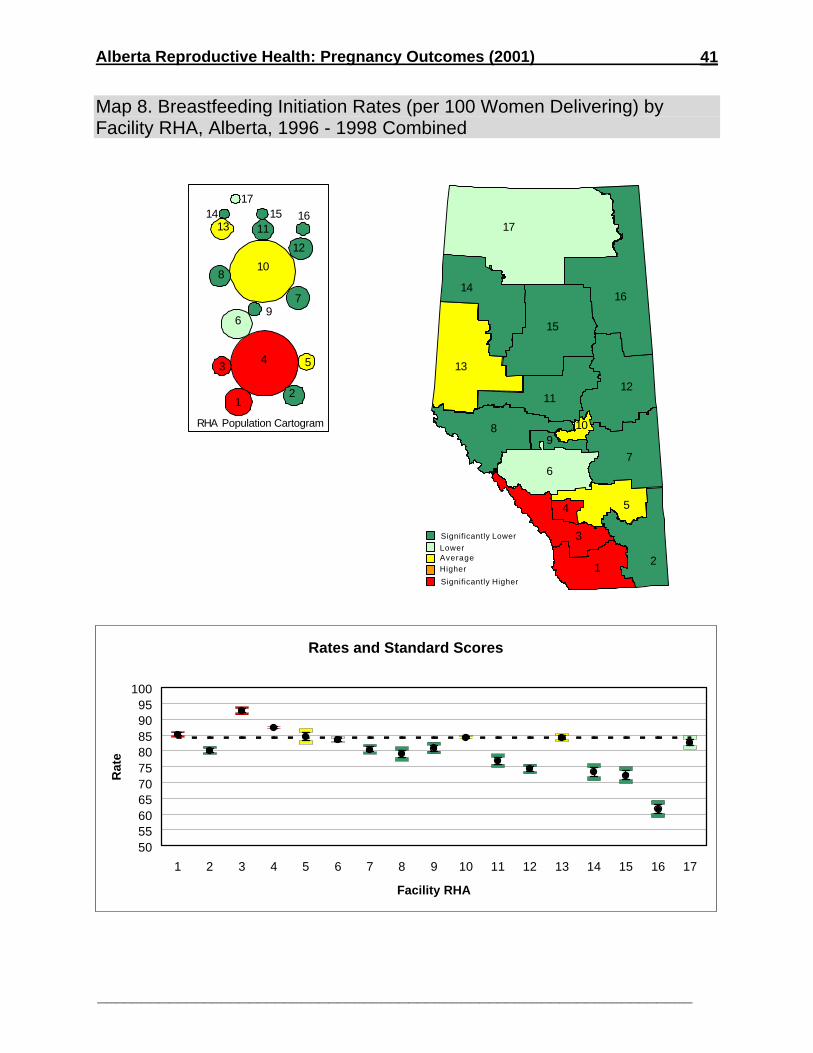
Alberta Reproductive Health: Pregnancy Outcomes (2001)
___________________________________________________________________
41
Map 8. Breastfeeding Initiation Rates (per 100 Women Delivering) byFacility RHA, Alberta, 1996 - 1998 Combined
Significantly Lower
LowerAverageHigher
Significantly Higher
17
16
15
14
13
1211
8
6
3
12
5
7
4
109
12
34 5
6
7
8
9
10
11
12
1314 15 16
17
RHA Population Cartogram
Rates and Standard Scores
50556065707580859095
100
1 2 3 4 5 6 7 8 9 10 11 12 13 14 15 16 17
Facility RHA
Rat
e
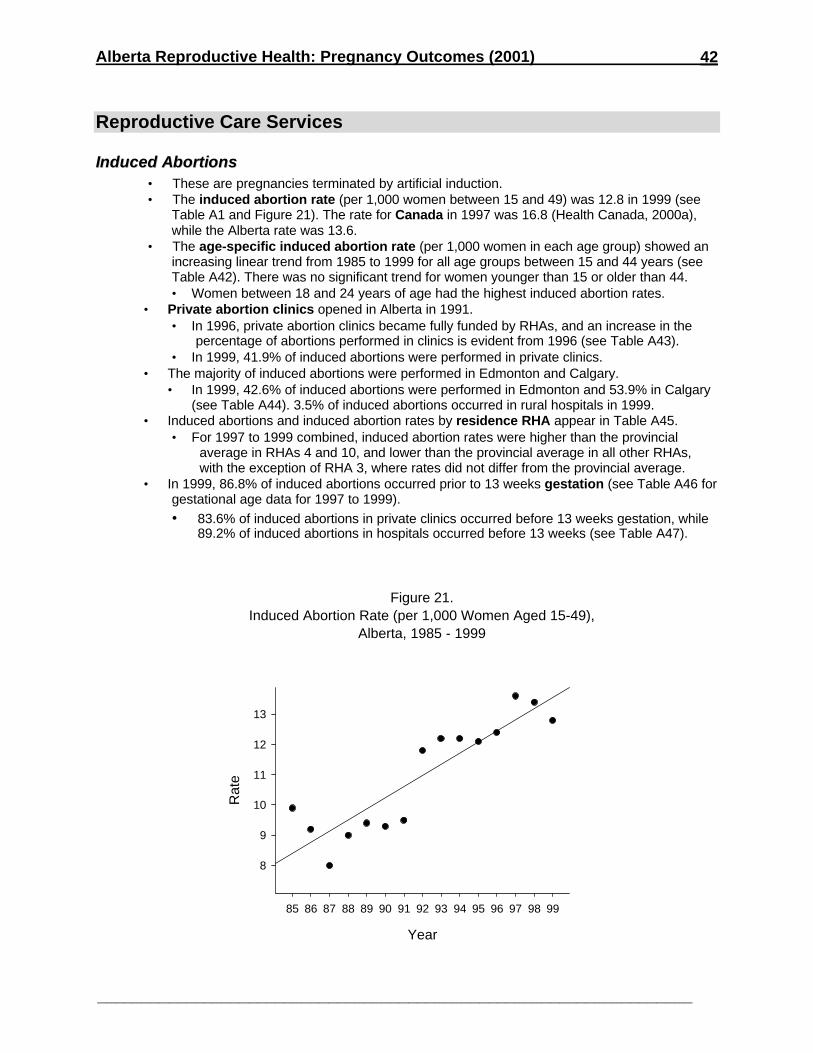
Alberta Reproductive Health: Pregnancy Outcomes (2001)
___________________________________________________________________
42
Reproductive Care Services
IInndduucceedd AAbboorrttiioonnss• These are pregnancies terminated by artificial induction.• The induced abortion rate (per 1,000 women between 15 and 49) was 12.8 in 1999 (see
Table A1 and Figure 21). The rate for Canada in 1997 was 16.8 (Health Canada, 2000a),while the Alberta rate was 13.6.
• The age-specific induced abortion rate (per 1,000 women in each age group) showed anincreasing linear trend from 1985 to 1999 for all age groups between 15 and 44 years (seeTable A42). There was no significant trend for women younger than 15 or older than 44.• Women between 18 and 24 years of age had the highest induced abortion rates.
• Private abortion clinics opened in Alberta in 1991.• In 1996, private abortion clinics became fully funded by RHAs, and an increase in the
percentage of abortions performed in clinics is evident from 1996 (see Table A43).• In 1999, 41.9% of induced abortions were performed in private clinics.
• The majority of induced abortions were performed in Edmonton and Calgary.• In 1999, 42.6% of induced abortions were performed in Edmonton and 53.9% in Calgary
(see Table A44). 3.5% of induced abortions occurred in rural hospitals in 1999.• Induced abortions and induced abortion rates by residence RHA appear in Table A45.
• For 1997 to 1999 combined, induced abortion rates were higher than the provincialaverage in RHAs 4 and 10, and lower than the provincial average in all other RHAs,with the exception of RHA 3, where rates did not differ from the provincial average.
• In 1999, 86.8% of induced abortions occurred prior to 13 weeks gestation (see Table A46 forgestational age data for 1997 to 1999).
• 83.6% of induced abortions in private clinics occurred before 13 weeks gestation, while89.2% of induced abortions in hospitals occurred before 13 weeks (see Table A47).
Figure 21.Induced Abortion Rate (per 1,000 Women Aged 15-49),
Alberta, 1985 - 1999
Year
85 86 87 88 89 90 91 92 93 94 95 96 97 98 99
Rat
e
8
9
10
11
12
13
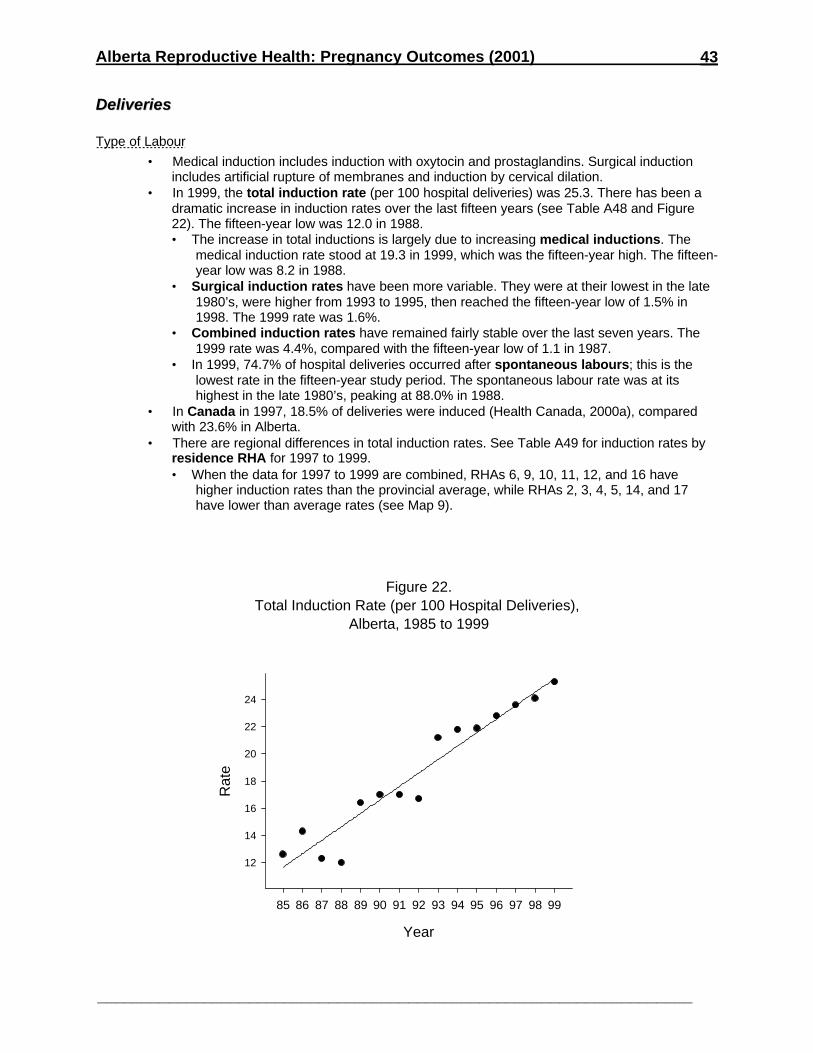
Alberta Reproductive Health: Pregnancy Outcomes (2001)
___________________________________________________________________
43
DDeelliivveerriieess
Type of Labour
• Medical induction includes induction with oxytocin and prostaglandins. Surgical inductionincludes artificial rupture of membranes and induction by cervical dilation.
• In 1999, the total induction rate (per 100 hospital deliveries) was 25.3. There has been adramatic increase in induction rates over the last fifteen years (see Table A48 and Figure22). The fifteen-year low was 12.0 in 1988.• The increase in total inductions is largely due to increasing medical inductions. The
medical induction rate stood at 19.3 in 1999, which was the fifteen-year high. The fifteen-year low was 8.2 in 1988.
• Surgical induction rates have been more variable. They were at their lowest in the late1980’s, were higher from 1993 to 1995, then reached the fifteen-year low of 1.5% in1998. The 1999 rate was 1.6%.
• Combined induction rates have remained fairly stable over the last seven years. The1999 rate was 4.4%, compared with the fifteen-year low of 1.1 in 1987.
• In 1999, 74.7% of hospital deliveries occurred after spontaneous labours; this is thelowest rate in the fifteen-year study period. The spontaneous labour rate was at itshighest in the late 1980’s, peaking at 88.0% in 1988.
• In Canada in 1997, 18.5% of deliveries were induced (Health Canada, 2000a), comparedwith 23.6% in Alberta.
• There are regional differences in total induction rates. See Table A49 for induction rates byresidence RHA for 1997 to 1999.• When the data for 1997 to 1999 are combined, RHAs 6, 9, 10, 11, 12, and 16 have
higher induction rates than the provincial average, while RHAs 2, 3, 4, 5, 14, and 17have lower than average rates (see Map 9).
Figure 22.Total Induction Rate (per 100 Hospital Deliveries),
Alberta, 1985 to 1999
Year
85 86 87 88 89 90 91 92 93 94 95 96 97 98 99
Rat
e
12
14
16
18
20
22
24
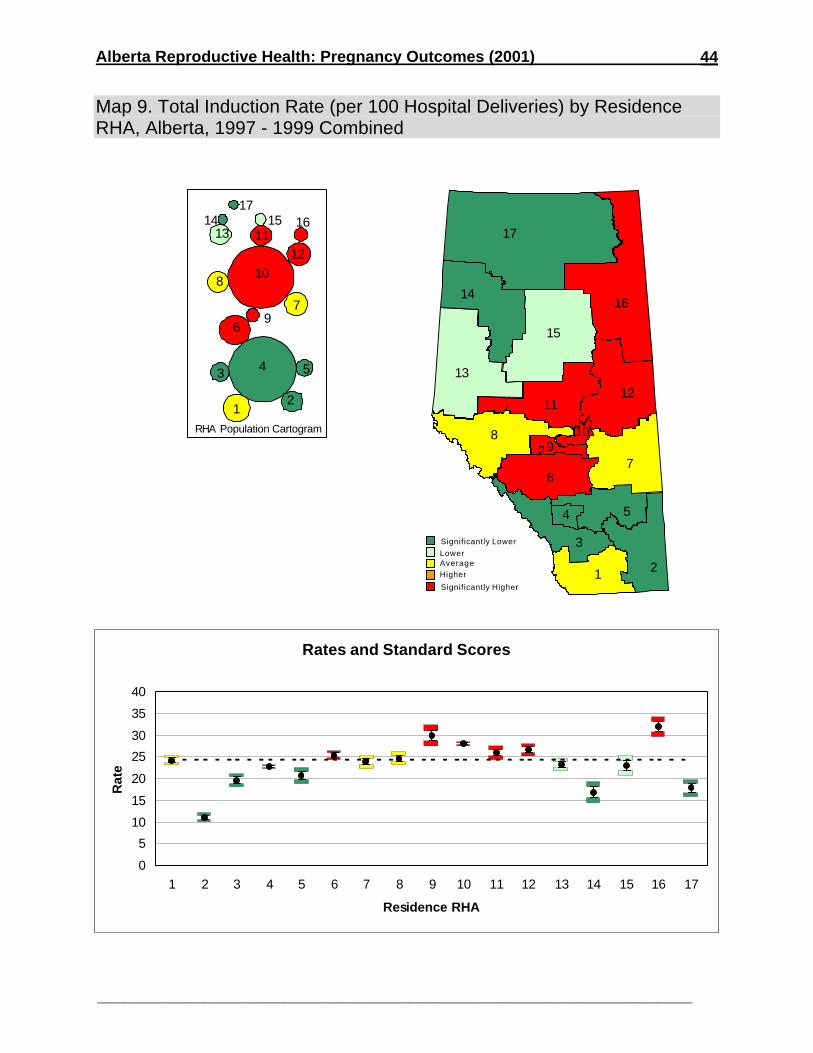
Alberta Reproductive Health: Pregnancy Outcomes (2001)
___________________________________________________________________
44
Map 9. Total Induction Rate (per 100 Hospital Deliveries) by ResidenceRHA, Alberta, 1997 - 1999 Combined
Significantly Lower
LowerAverageHigher
Significantly Higher
17
16
15
14
13
1211
8
6
3
1 2
5
7
4
109
12
3 4 5
6
7
8
9
10
1112
1314 15 16
17
RHA Population Cartogram
Rates and Standard Scores
0
5
10
15
20
25
30
35
40
1 2 3 4 5 6 7 8 9 10 11 12 13 14 15 16 17
Residence RHA
Rat
e
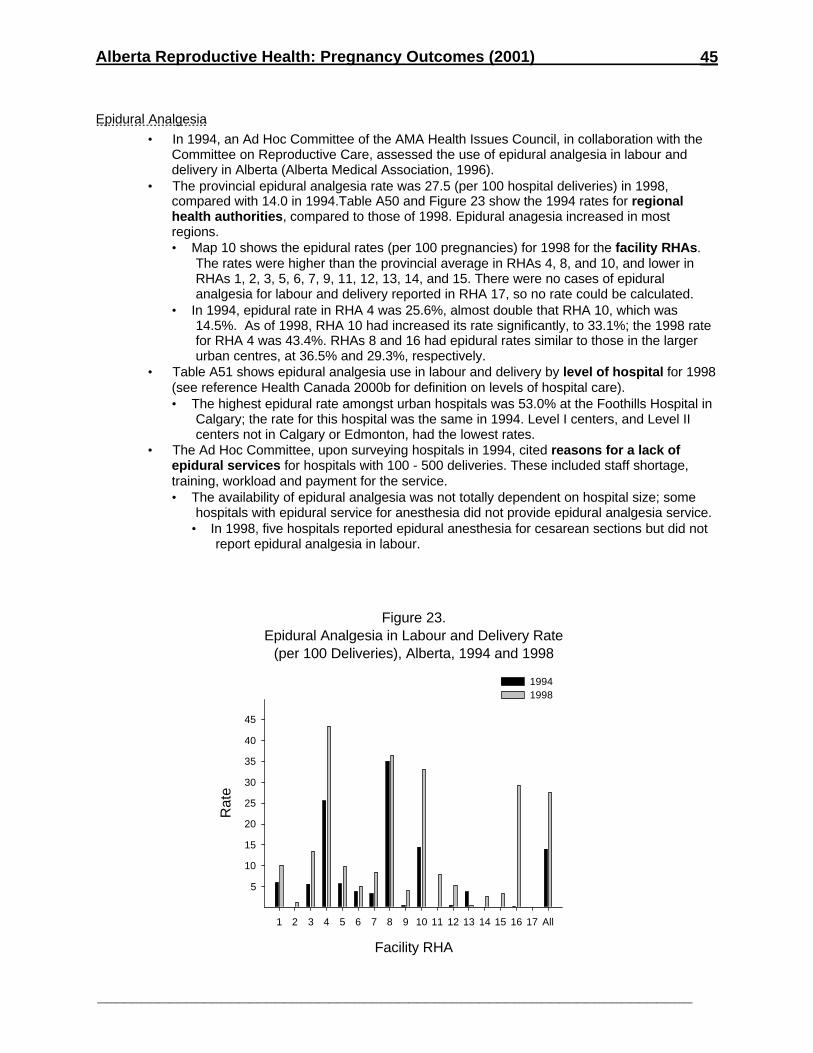
Alberta Reproductive Health: Pregnancy Outcomes (2001)
___________________________________________________________________
45
Epidural Analgesia
• In 1994, an Ad Hoc Committee of the AMA Health Issues Council, in collaboration with theCommittee on Reproductive Care, assessed the use of epidural analgesia in labour anddelivery in Alberta (Alberta Medical Association, 1996).
• The provincial epidural analgesia rate was 27.5 (per 100 hospital deliveries) in 1998,compared with 14.0 in 1994.Table A50 and Figure 23 show the 1994 rates for regionalhealth authorities, compared to those of 1998. Epidural anagesia increased in mostregions.• Map 10 shows the epidural rates (per 100 pregnancies) for 1998 for the facility RHAs.
The rates were higher than the provincial average in RHAs 4, 8, and 10, and lower inRHAs 1, 2, 3, 5, 6, 7, 9, 11, 12, 13, 14, and 15. There were no cases of epiduralanalgesia for labour and delivery reported in RHA 17, so no rate could be calculated.
• In 1994, epidural rate in RHA 4 was 25.6%, almost double that RHA 10, which was14.5%. As of 1998, RHA 10 had increased its rate significantly, to 33.1%; the 1998 ratefor RHA 4 was 43.4%. RHAs 8 and 16 had epidural rates similar to those in the largerurban centres, at 36.5% and 29.3%, respectively.
• Table A51 shows epidural analgesia use in labour and delivery by level of hospital for 1998(see reference Health Canada 2000b for definition on levels of hospital care).• The highest epidural rate amongst urban hospitals was 53.0% at the Foothills Hospital in
Calgary; the rate for this hospital was the same in 1994. Level I centers, and Level IIcenters not in Calgary or Edmonton, had the lowest rates.
• The Ad Hoc Committee, upon surveying hospitals in 1994, cited reasons for a lack ofepidural services for hospitals with 100 - 500 deliveries. These included staff shortage,training, workload and payment for the service.• The availability of epidural analgesia was not totally dependent on hospital size; some
hospitals with epidural service for anesthesia did not provide epidural analgesia service.• In 1998, five hospitals reported epidural anesthesia for cesarean sections but did not
report epidural analgesia in labour.
Figure 23.Epidural Analgesia in Labour and Delivery Rate
(per 100 Deliveries), Alberta, 1994 and 1998
Facility RHA
1 2 3 4 5 6 7 8 9 10 11 12 13 14 15 16 17 All
Rat
e
5
10
15
20
25
30
35
40
45
19941998
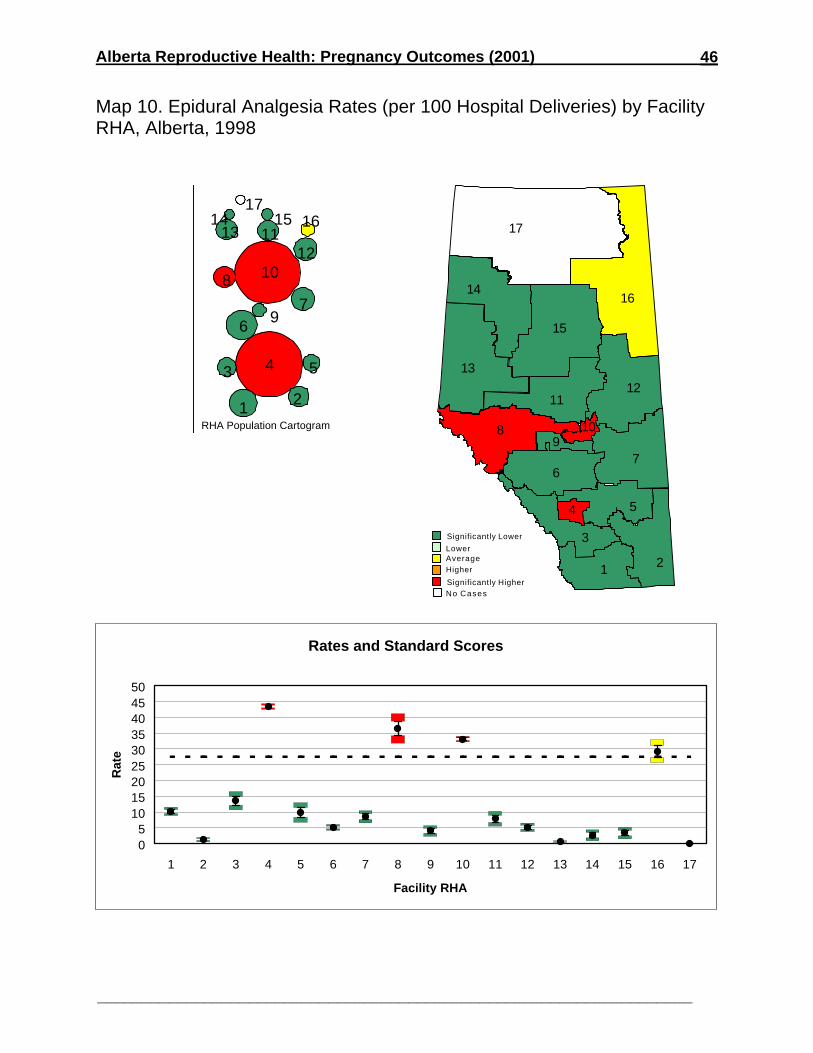
Alberta Reproductive Health: Pregnancy Outcomes (2001)
___________________________________________________________________
46
Map 10. Epidural Analgesia Rates (per 100 Hospital Deliveries) by FacilityRHA, Alberta, 1998
1 2
3 4 5
67
8
9
10
1112
1314 15 16
17
RHA Population Cartogram
Rates and Standard Scores
05
101520253035404550
1 2 3 4 5 6 7 8 9 10 11 12 13 14 15 16 17
Facility RHA
Rat
e
Significantly Lower
LowerAverageHigher
Significantly Higher
17
16
15
14
13
1211
8
6
3
1 2
5
7
4
109
No Cases
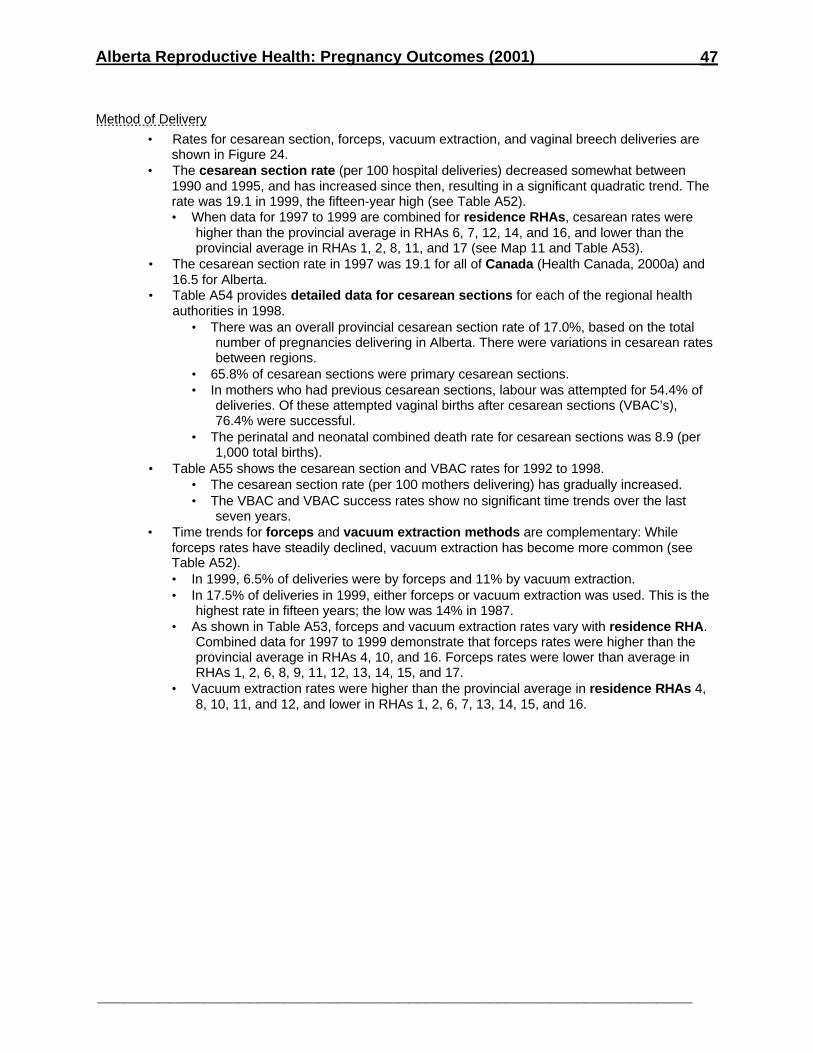
Alberta Reproductive Health: Pregnancy Outcomes (2001)
___________________________________________________________________
47
Method of Delivery
• Rates for cesarean section, forceps, vacuum extraction, and vaginal breech deliveries areshown in Figure 24.
• The cesarean section rate (per 100 hospital deliveries) decreased somewhat between1990 and 1995, and has increased since then, resulting in a significant quadratic trend. Therate was 19.1 in 1999, the fifteen-year high (see Table A52).• When data for 1997 to 1999 are combined for residence RHAs, cesarean rates were
higher than the provincial average in RHAs 6, 7, 12, 14, and 16, and lower than theprovincial average in RHAs 1, 2, 8, 11, and 17 (see Map 11 and Table A53).
• The cesarean section rate in 1997 was 19.1 for all of Canada (Health Canada, 2000a) and16.5 for Alberta.
• Table A54 provides detailed data for cesarean sections for each of the regional healthauthorities in 1998.
• There was an overall provincial cesarean section rate of 17.0%, based on the totalnumber of pregnancies delivering in Alberta. There were variations in cesarean ratesbetween regions.
• 65.8% of cesarean sections were primary cesarean sections.• In mothers who had previous cesarean sections, labour was attempted for 54.4% of
deliveries. Of these attempted vaginal births after cesarean sections (VBAC’s),76.4% were successful.
• The perinatal and neonatal combined death rate for cesarean sections was 8.9 (per1,000 total births).
• Table A55 shows the cesarean section and VBAC rates for 1992 to 1998.• The cesarean section rate (per 100 mothers delivering) has gradually increased.• The VBAC and VBAC success rates show no significant time trends over the last
seven years.• Time trends for forceps and vacuum extraction methods are complementary: While
forceps rates have steadily declined, vacuum extraction has become more common (seeTable A52).• In 1999, 6.5% of deliveries were by forceps and 11% by vacuum extraction.• In 17.5% of deliveries in 1999, either forceps or vacuum extraction was used. This is the
highest rate in fifteen years; the low was 14% in 1987.• As shown in Table A53, forceps and vacuum extraction rates vary with residence RHA.
Combined data for 1997 to 1999 demonstrate that forceps rates were higher than theprovincial average in RHAs 4, 10, and 16. Forceps rates were lower than average inRHAs 1, 2, 6, 8, 9, 11, 12, 13, 14, 15, and 17.
• Vacuum extraction rates were higher than the provincial average in residence RHAs 4,8, 10, 11, and 12, and lower in RHAs 1, 2, 6, 7, 13, 14, 15, and 16.
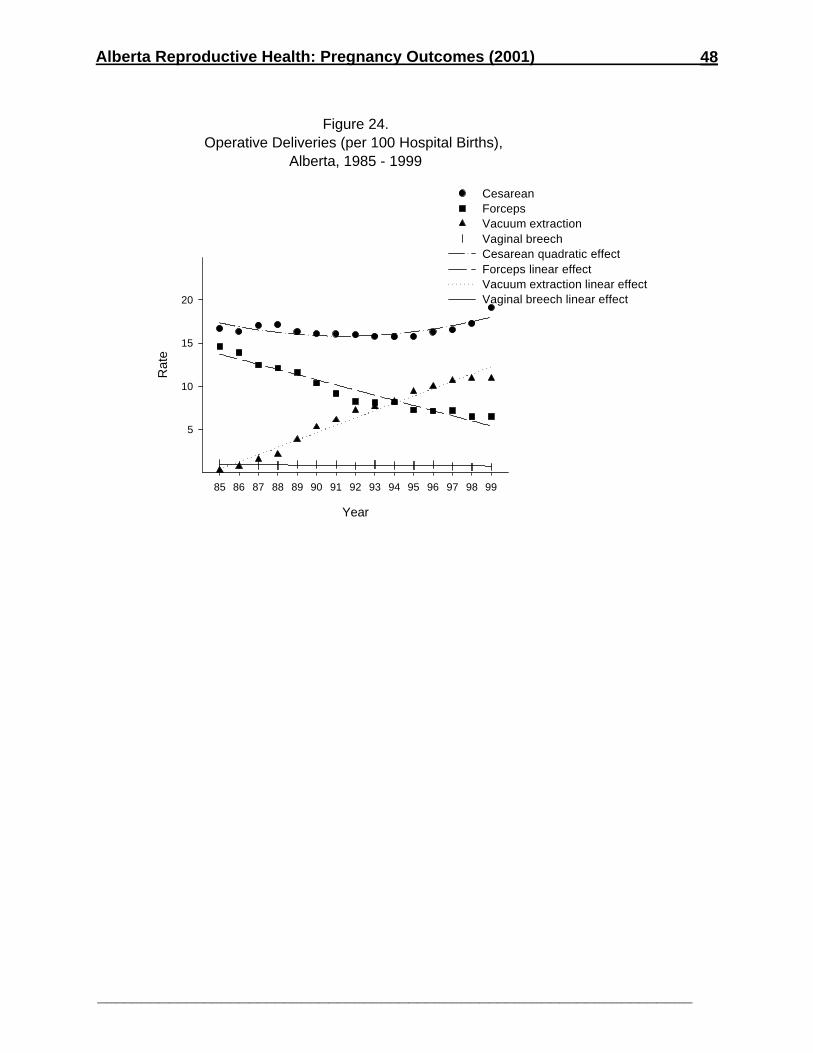
Alberta Reproductive Health: Pregnancy Outcomes (2001)
___________________________________________________________________
48
Figure 24.Operative Deliveries (per 100 Hospital Births),
Alberta, 1985 - 1999
Year
85 86 87 88 89 90 91 92 93 94 95 96 97 98 99
Rat
e
5
10
15
20
Cesarean ForcepsVacuum extractionVaginal breechCesarean quadratic effectForceps linear effectVacuum extraction linear effectVaginal breech linear effect
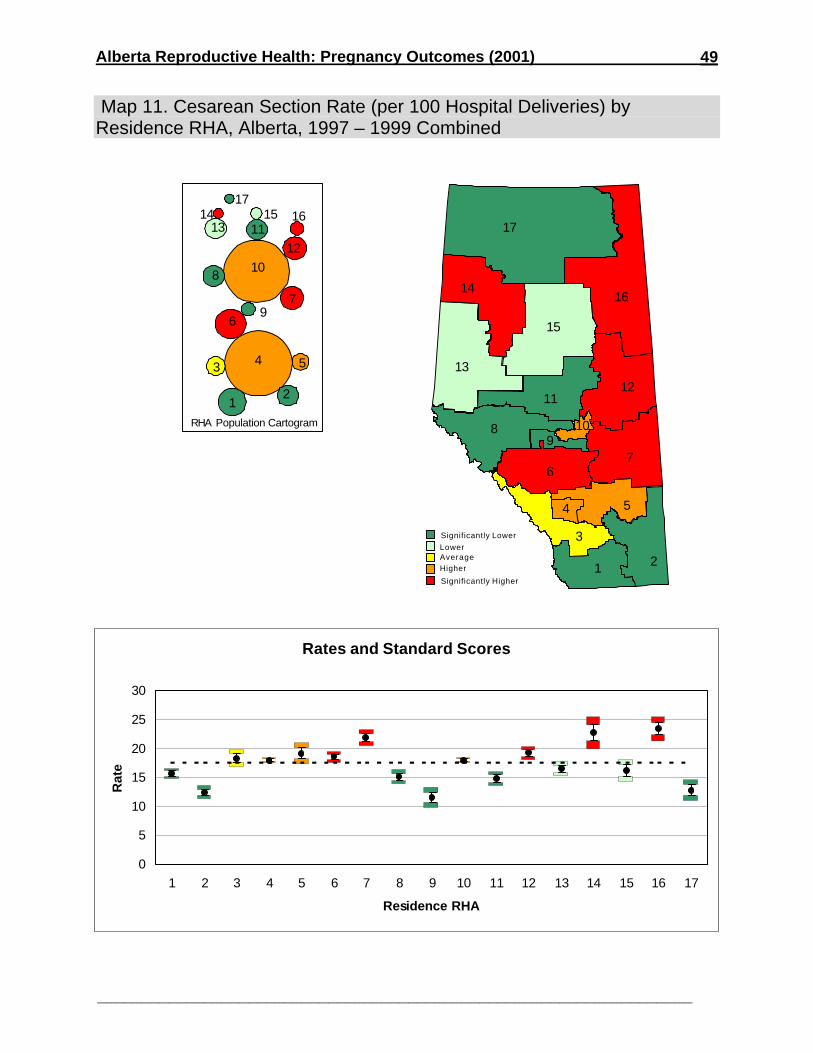
Alberta Reproductive Health: Pregnancy Outcomes (2001)
___________________________________________________________________
49
Map 11. Cesarean Section Rate (per 100 Hospital Deliveries) byResidence RHA, Alberta, 1997 – 1999 Combined
Significantly Lower
LowerAverageHigher
Significantly Higher
17
16
15
14
13
1211
8
6
3
1 2
5
7
4
109
12
3 4 5
6
7
8
9
10
1112
1314 15 16
17
RHA Population Cartogram
Rates and Standard Scores
0
5
10
15
20
25
30
1 2 3 4 5 6 7 8 9 10 11 12 13 14 15 16 17
Residence RHA
Rat
e
Alberta Reproductive Health: Pregnancy Outcomes (2001)
___________________________________________________________________
50
Breech Deliveries
• Breech deliveries accounted for 4.8% of total births in 1998.• Table A56 contains information about breech deliveries in 1998 by level of hospital.
• 41.0% of breech deliveries were in level lll hospitals, 40.8% in level ll hospitals, and18.1% in level l hospitals (see reference Health Canada 2000b for definition on levels ofhospital care).
• 62.1% of breech deliveries were by cesarean section and 37.9% were vaginal breechdeliveries. Vaginal breech deliveries were least common in Level II hospitals.
• Table A57 describes perinatal and neonatal mortality by level of hospital for breechdeliveries in 1998.• Breech delivery occurred in 25.5% of all stillbirths and 25.8% of all neonatal deaths.• The perinatal mortality rate for breech presentation was 42.5 (per 1,000 total breech
births); when corrected for congenital anomalies, the rate was 40.9. The neonatalmortality rate for breech presentation was 19.0 (per 1,000 live breech births); whencorrected for congenital anomalies, the rate was 11.9. These rates must be interpretedwith caution due to the low number of cases involved.
• Of breech presentations resulting in a stillbirth or neonatal death, 83.5% deliveredvaginally and 16.5% delivered by cesarean section.
• The perinatal mortality rate for vaginal breech births was 97.7 (per 1,000 total vaginalbreech births); when corrected for congenital anomalies, the rate was 65.6. Theneonatal mortality for vaginal breech births was 34.5 (per 1,000 live vaginal breechbirths); when corrected for congenital anomalies, the rate was 21.9 These rates mustbe interpreted with caution due to the low number of cases involved.
• The perinatal mortality rate for cesarean breech births was 8.8 (per 1,000 totalcesarean breech births); when corrected for congenital anomalies, the rate was 6.1.The neonatal mortality rate for cesarean breech births was 8.8 (per 1,000 livecesarean breech births); when corrected for congenital anomalies, the rate was 6.2.These rates must be interpreted with caution due to the low number of casesinvolved.
• Table A58 gives details for 1994 to 1998 on perinatal and neonatal mortality for breechdeliveries.
• Factors associated with breech perinatal and neonatal mortality include birth weight,prematurity and anomalies.• 94.1% of breech presentation stillbirths and neonatal deaths involved a birth weight of
less than 2500 grams.• Five breech deaths involved birth weights of 2500 grams or greater; one had an
anomaly, one had asphyxia with severe hypoxic ischemic encephalopathy andintracranial hemorrhage, and three were classified as unknown (autopsies didquestion placental and cord problems but nothing definitive was found).
• Prematurity (less than 37 weeks gestation) occurred in 92.9% of these deaths, with83.5% less than 32 weeks gestation.
• Anomalies were associated with 35.3% of breech presentation stillbirths and neonataldeaths.
• 15.3% of breech presentation stillbirths and neonatal deaths occurred in multiplepregnancies.
• In September 2000 the SOGC produced an Interim Position Paper on the Management ofTerm Breech, following the analysis of an international study. Differences in perinatalmortality and complex neonatal morbidity were significant, with the interim analysis indicatingoutcome is better in the cesarean section group when compared to those undergoing aplanned vaginal birth for the selected breech at term. A final report with detailed analysis ofthe study should be available soon. Until that time the SOGC recommends the following:• Physicians should inform all patients with term breech presentations of the results of this
interim analysis of the term breech trial study.

Alberta Reproductive Health: Pregnancy Outcomes (2001)
___________________________________________________________________
51
• Individual physicians should address their own expertise and skills in the management ofthe term breech.
• Decisions about the method of delivery of the term breech should be made on anindividual basis after full disclosure of the risk and benefits of cesarean and vaginal birthin the term breech presentation.
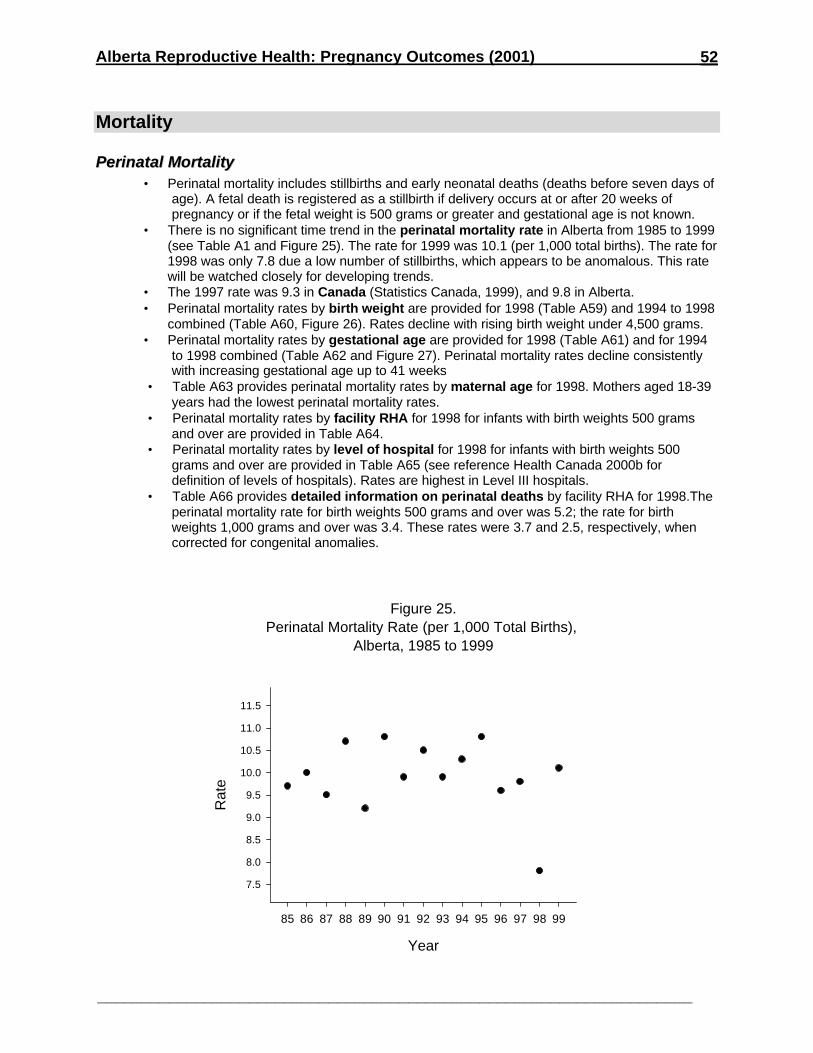
Alberta Reproductive Health: Pregnancy Outcomes (2001)
___________________________________________________________________
52
Mortality
PPeerriinnaattaall MMoorrttaalliittyy• Perinatal mortality includes stillbirths and early neonatal deaths (deaths before seven days of
age). A fetal death is registered as a stillbirth if delivery occurs at or after 20 weeks ofpregnancy or if the fetal weight is 500 grams or greater and gestational age is not known.
• There is no significant time trend in the perinatal mortality rate in Alberta from 1985 to 1999(see Table A1 and Figure 25). The rate for 1999 was 10.1 (per 1,000 total births). The rate for1998 was only 7.8 due a low number of stillbirths, which appears to be anomalous. This ratewill be watched closely for developing trends.
• The 1997 rate was 9.3 in Canada (Statistics Canada, 1999), and 9.8 in Alberta.• Perinatal mortality rates by birth weight are provided for 1998 (Table A59) and 1994 to 1998
combined (Table A60, Figure 26). Rates decline with rising birth weight under 4,500 grams.• Perinatal mortality rates by gestational age are provided for 1998 (Table A61) and for 1994
to 1998 combined (Table A62 and Figure 27). Perinatal mortality rates decline consistentlywith increasing gestational age up to 41 weeks
• Table A63 provides perinatal mortality rates by maternal age for 1998. Mothers aged 18-39years had the lowest perinatal mortality rates.
• Perinatal mortality rates by facility RHA for 1998 for infants with birth weights 500 gramsand over are provided in Table A64.
• Perinatal mortality rates by level of hospital for 1998 for infants with birth weights 500grams and over are provided in Table A65 (see reference Health Canada 2000b fordefinition of levels of hospitals). Rates are highest in Level III hospitals.
• Table A66 provides detailed information on perinatal deaths by facility RHA for 1998.Theperinatal mortality rate for birth weights 500 grams and over was 5.2; the rate for birthweights 1,000 grams and over was 3.4. These rates were 3.7 and 2.5, respectively, whencorrected for congenital anomalies.
Figure 25.Perinatal Mortality Rate (per 1,000 Total Births),
Alberta, 1985 to 1999
Year
85 86 87 88 89 90 91 92 93 94 95 96 97 98 99
Rat
e
7.5
8.0
8.5
9.0
9.5
10.0
10.5
11.0
11.5
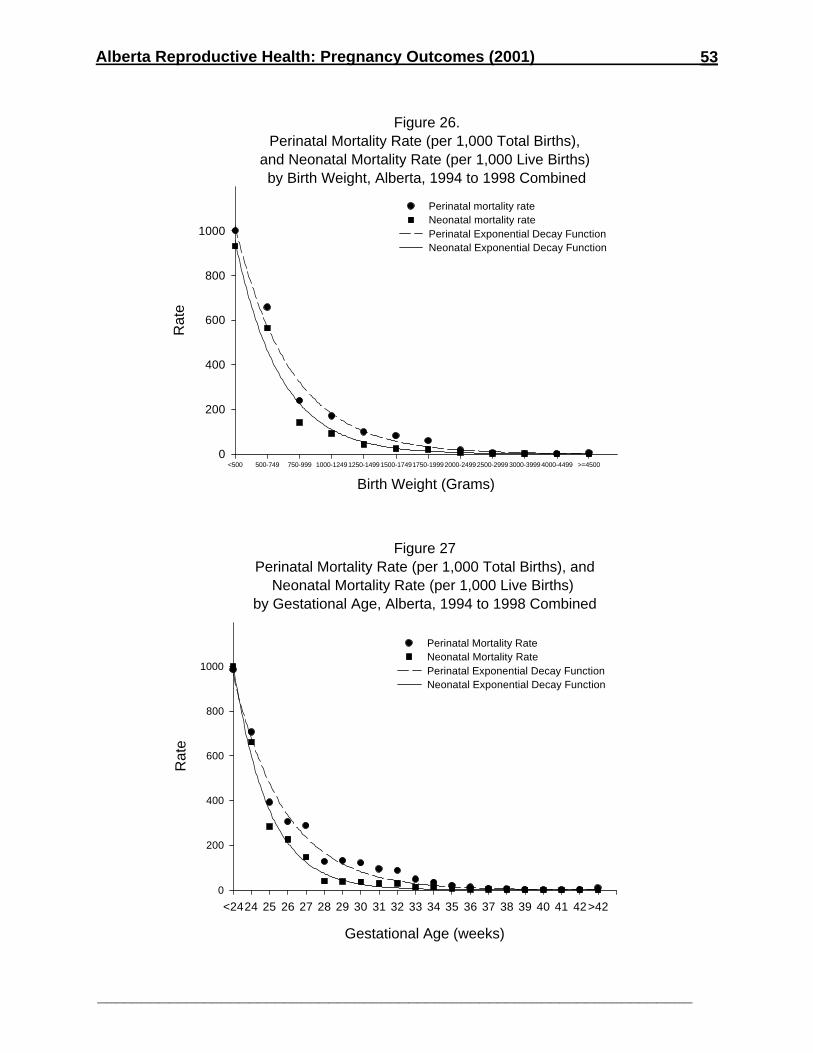
Alberta Reproductive Health: Pregnancy Outcomes (2001)
___________________________________________________________________
53
Figure 27Perinatal Mortality Rate (per 1,000 Total Births), and
Neonatal Mortality Rate (per 1,000 Live Births) by Gestational Age, Alberta, 1994 to 1998 Combined
Gestational Age (weeks)
<2424 25 26 27 28 29 30 31 32 33 34 35 36 37 38 39 40 41 42>42
Rat
e
0
200
400
600
800
1000
Perinatal Mortality RateNeonatal Mortality RatePerinatal Exponential Decay FunctionNeonatal Exponential Decay Function
Figure 26.Perinatal Mortality Rate (per 1,000 Total Births),
and Neonatal Mortality Rate (per 1,000 Live Births) by Birth Weight, Alberta, 1994 to 1998 Combined
Birth Weight (Grams)
<500 500-749 750-999 1000-12491250-14991500-17491750-19992000-24992500-29993000-39994000-4499 >=4500
Rat
e
0
200
400
600
800
1000
Perinatal mortality rateNeonatal mortality ratePerinatal Exponential Decay FunctionNeonatal Exponential Decay Function
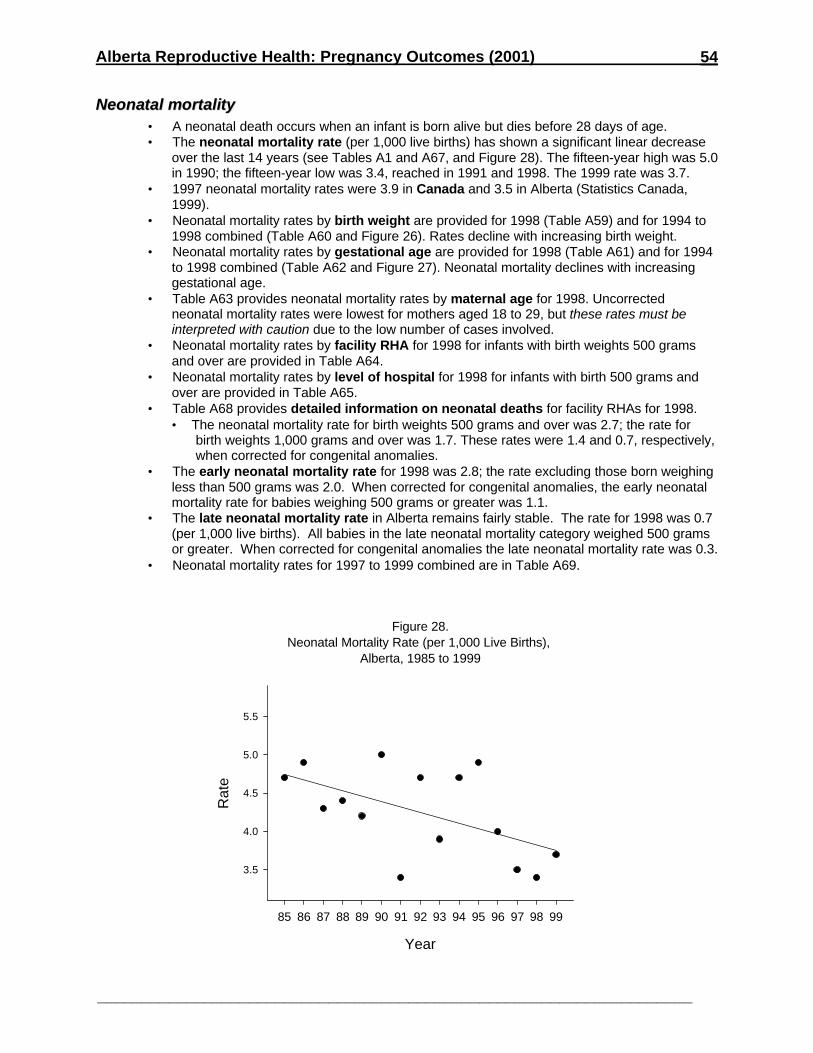
Alberta Reproductive Health: Pregnancy Outcomes (2001)
___________________________________________________________________
54
NNeeoonnaattaall mmoorrttaalliittyy• A neonatal death occurs when an infant is born alive but dies before 28 days of age.• The neonatal mortality rate (per 1,000 live births) has shown a significant linear decrease
over the last 14 years (see Tables A1 and A67, and Figure 28). The fifteen-year high was 5.0in 1990; the fifteen-year low was 3.4, reached in 1991 and 1998. The 1999 rate was 3.7.
• 1997 neonatal mortality rates were 3.9 in Canada and 3.5 in Alberta (Statistics Canada,1999).
• Neonatal mortality rates by birth weight are provided for 1998 (Table A59) and for 1994 to1998 combined (Table A60 and Figure 26). Rates decline with increasing birth weight.
• Neonatal mortality rates by gestational age are provided for 1998 (Table A61) and for 1994to 1998 combined (Table A62 and Figure 27). Neonatal mortality declines with increasinggestational age.
• Table A63 provides neonatal mortality rates by maternal age for 1998. Uncorrectedneonatal mortality rates were lowest for mothers aged 18 to 29, but these rates must beinterpreted with caution due to the low number of cases involved.
• Neonatal mortality rates by facility RHA for 1998 for infants with birth weights 500 gramsand over are provided in Table A64.
• Neonatal mortality rates by level of hospital for 1998 for infants with birth 500 grams andover are provided in Table A65.
• Table A68 provides detailed information on neonatal deaths for facility RHAs for 1998.• The neonatal mortality rate for birth weights 500 grams and over was 2.7; the rate for
birth weights 1,000 grams and over was 1.7. These rates were 1.4 and 0.7, respectively,when corrected for congenital anomalies.
• The early neonatal mortality rate for 1998 was 2.8; the rate excluding those born weighingless than 500 grams was 2.0. When corrected for congenital anomalies, the early neonatalmortality rate for babies weighing 500 grams or greater was 1.1.
• The late neonatal mortality rate in Alberta remains fairly stable. The rate for 1998 was 0.7(per 1,000 live births). All babies in the late neonatal mortality category weighed 500 gramsor greater. When corrected for congenital anomalies the late neonatal mortality rate was 0.3.
• Neonatal mortality rates for 1997 to 1999 combined are in Table A69.
Figure 28.Neonatal Mortality Rate (per 1,000 Live Births),
Alberta, 1985 to 1999
Year
85 86 87 88 89 90 91 92 93 94 95 96 97 98 99
Rat
e
3.5
4.0
4.5
5.0
5.5
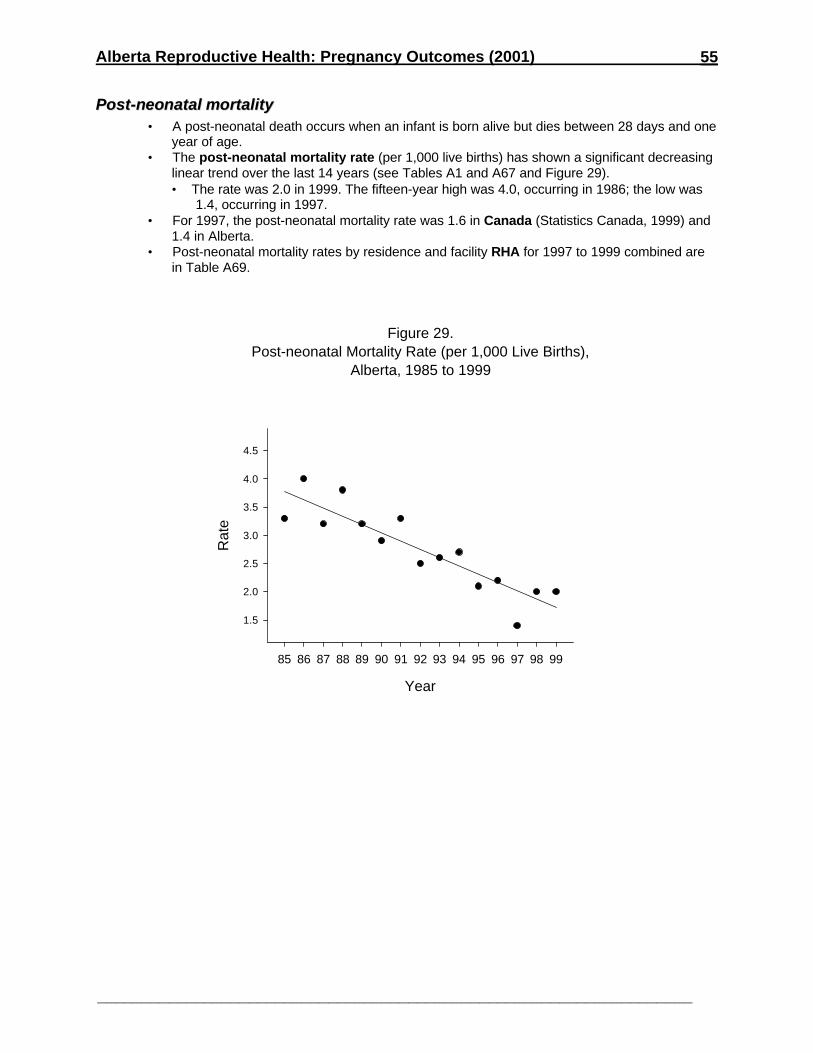
Alberta Reproductive Health: Pregnancy Outcomes (2001)
___________________________________________________________________
55
PPoosstt--nneeoonnaattaall mmoorrttaalliittyy• A post-neonatal death occurs when an infant is born alive but dies between 28 days and one
year of age.• The post-neonatal mortality rate (per 1,000 live births) has shown a significant decreasing
linear trend over the last 14 years (see Tables A1 and A67 and Figure 29).• The rate was 2.0 in 1999. The fifteen-year high was 4.0, occurring in 1986; the low was
1.4, occurring in 1997.• For 1997, the post-neonatal mortality rate was 1.6 in Canada (Statistics Canada, 1999) and
1.4 in Alberta.• Post-neonatal mortality rates by residence and facility RHA for 1997 to 1999 combined are
in Table A69.
Figure 29.Post-neonatal Mortality Rate (per 1,000 Live Births),
Alberta, 1985 to 1999
Year
85 86 87 88 89 90 91 92 93 94 95 96 97 98 99
Rat
e
1.5
2.0
2.5
3.0
3.5
4.0
4.5
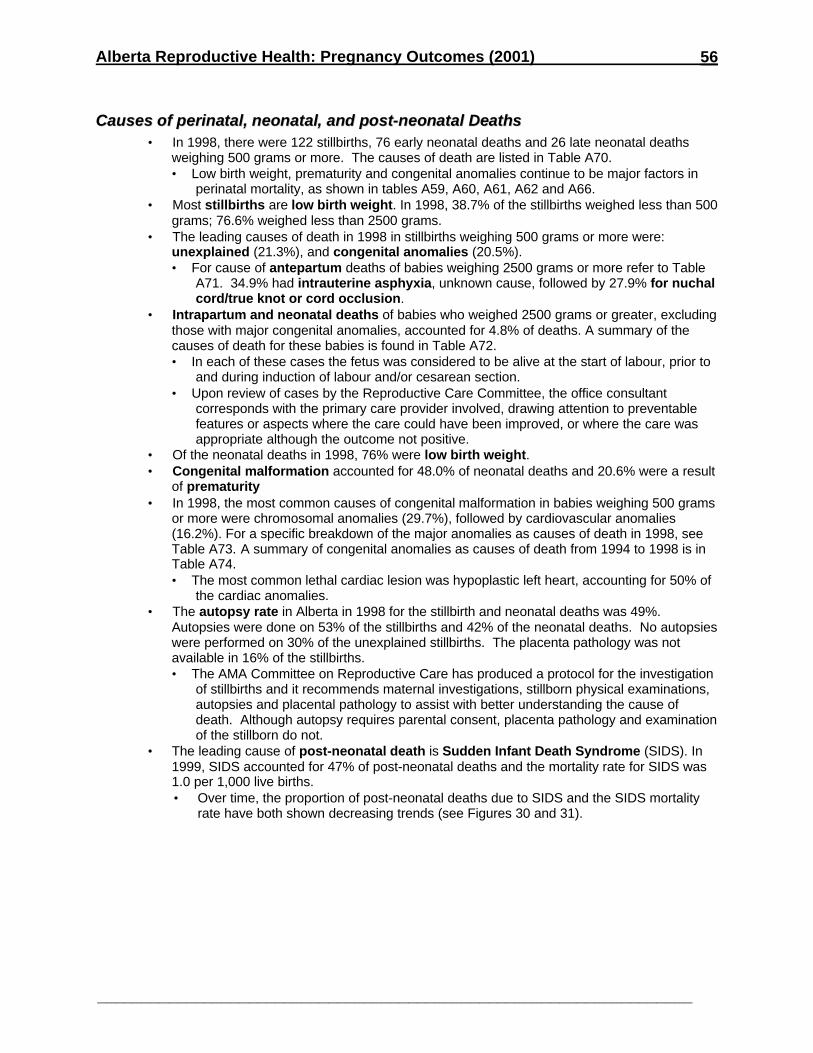
Alberta Reproductive Health: Pregnancy Outcomes (2001)
___________________________________________________________________
56
CCaauusseess ooff ppeerriinnaattaall,, nneeoonnaattaall,, aanndd ppoosstt--nneeoonnaattaall DDeeaatthhss• In 1998, there were 122 stillbirths, 76 early neonatal deaths and 26 late neonatal deaths
weighing 500 grams or more. The causes of death are listed in Table A70.• Low birth weight, prematurity and congenital anomalies continue to be major factors in
perinatal mortality, as shown in tables A59, A60, A61, A62 and A66.• Most stillbirths are low birth weight. In 1998, 38.7% of the stillbirths weighed less than 500
grams; 76.6% weighed less than 2500 grams.• The leading causes of death in 1998 in stillbirths weighing 500 grams or more were:
unexplained (21.3%), and congenital anomalies (20.5%).• For cause of antepartum deaths of babies weighing 2500 grams or more refer to Table
A71. 34.9% had intrauterine asphyxia, unknown cause, followed by 27.9% for nuchalcord/true knot or cord occlusion.
• Intrapartum and neonatal deaths of babies who weighed 2500 grams or greater, excludingthose with major congenital anomalies, accounted for 4.8% of deaths. A summary of thecauses of death for these babies is found in Table A72.• In each of these cases the fetus was considered to be alive at the start of labour, prior to
and during induction of labour and/or cesarean section.• Upon review of cases by the Reproductive Care Committee, the office consultant
corresponds with the primary care provider involved, drawing attention to preventablefeatures or aspects where the care could have been improved, or where the care wasappropriate although the outcome not positive.
• Of the neonatal deaths in 1998, 76% were low birth weight.• Congenital malformation accounted for 48.0% of neonatal deaths and 20.6% were a result
of prematurity• In 1998, the most common causes of congenital malformation in babies weighing 500 grams
or more were chromosomal anomalies (29.7%), followed by cardiovascular anomalies(16.2%). For a specific breakdown of the major anomalies as causes of death in 1998, seeTable A73. A summary of congenital anomalies as causes of death from 1994 to 1998 is inTable A74.• The most common lethal cardiac lesion was hypoplastic left heart, accounting for 50% of
the cardiac anomalies.• The autopsy rate in Alberta in 1998 for the stillbirth and neonatal deaths was 49%.
Autopsies were done on 53% of the stillbirths and 42% of the neonatal deaths. No autopsieswere performed on 30% of the unexplained stillbirths. The placenta pathology was notavailable in 16% of the stillbirths.• The AMA Committee on Reproductive Care has produced a protocol for the investigation
of stillbirths and it recommends maternal investigations, stillborn physical examinations,autopsies and placental pathology to assist with better understanding the cause ofdeath. Although autopsy requires parental consent, placenta pathology and examinationof the stillborn do not.
• The leading cause of post-neonatal death is Sudden Infant Death Syndrome (SIDS). In1999, SIDS accounted for 47% of post-neonatal deaths and the mortality rate for SIDS was1.0 per 1,000 live births.• Over time, the proportion of post-neonatal deaths due to SIDS and the SIDS mortality
rate have both shown decreasing trends (see Figures 30 and 31).
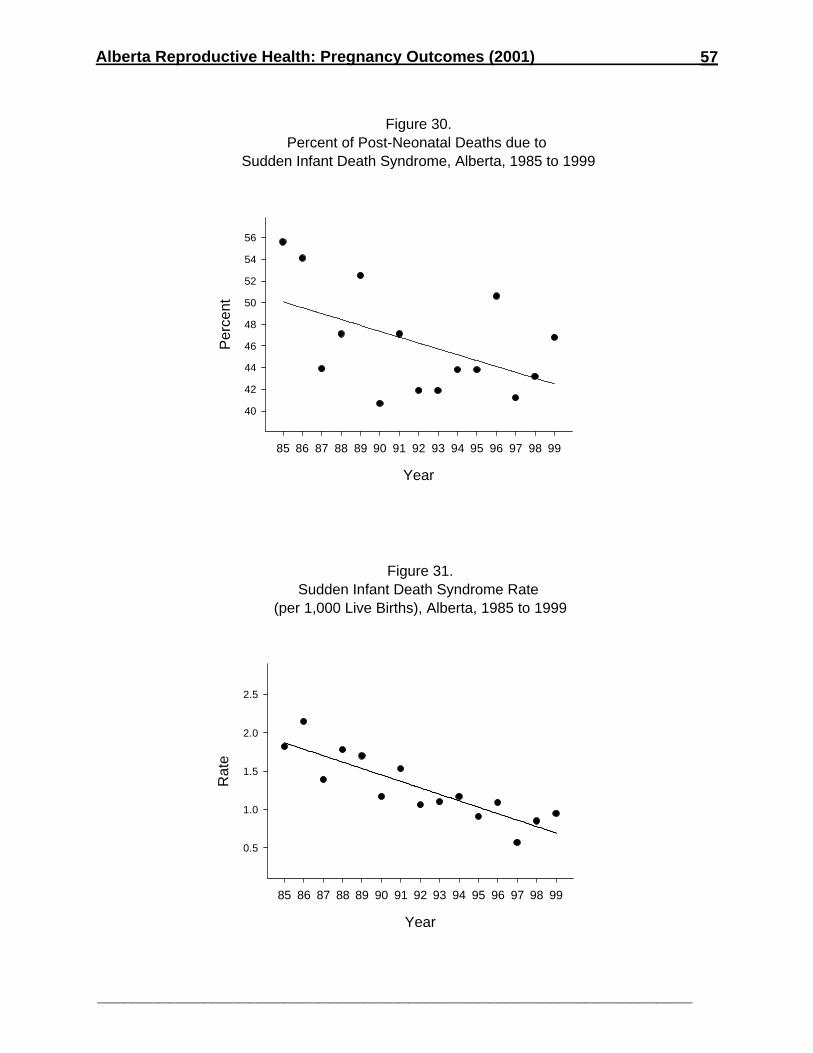
Alberta Reproductive Health: Pregnancy Outcomes (2001)
___________________________________________________________________
57
Figure 30.Percent of Post-Neonatal Deaths due to
Sudden Infant Death Syndrome, Alberta, 1985 to 1999
Year
85 86 87 88 89 90 91 92 93 94 95 96 97 98 99
Per
cent
40
42
44
46
48
50
52
54
56
Figure 31.Sudden Infant Death Syndrome Rate
(per 1,000 Live Births), Alberta, 1985 to 1999
Year
85 86 87 88 89 90 91 92 93 94 95 96 97 98 99
Rat
e
0.5
1.0
1.5
2.0
2.5
Alberta Reproductive Health: Pregnancy Outcomes (2001)
___________________________________________________________________
58
RRiisskk ffaaccttoorrss aassssoocciiaatteedd wwiitthh ppeerriinnaattaall aanndd nneeoonnaattaall mmoorrttaalliittyy• "There is substantial literature that addresses the impact of maternal behaviors on infant
health. Potential risk factors for sub-optimal prenatal and newborn outcome includesmoking, alcohol consumption and the use of illicit drugs. Research literature also indicatesan increased risk for both low birth weight and pre-term delivery among younger and oldermothers." (Tough, Svenson, and Schopflocher, 1999, Executive Summary).
• Statistics reported to the AMA Reproductive Care Committee by Medical RecordsDepartments of hospitals indicate that in Alberta in 1998, 26% of women delivering smokedduring the pregnancy. Thirty-five percent of women who had a stillbirth or neonatal losssmoked throughout pregnancy.
• Of the stillbirth and neonatal deaths that occurred in Alberta in 1998, 6% had substanceabuse scored under risk factors. This figure is likely an underestimate, as it is dependentupon the client revealing that she did drink alcohol or take illicit drugs during pregnancy, andalso upon health care personnel having completed the risk score.
• Table A63 shows the stillbirth and neonatal mortality rates by maternal age.• The perinatal mortality rate for mothers under 18 years was 10.1 (per 1,000 total births) in
1998, while the neonatal mortality rate (per 1,000 live births) was 4.5. For women 35 andover in 1998, the perinatal mortality rate was 11.7 (per 1,000 total births) and theneonatal mortality rate was 6.2 (per 1000 live births). These rates are higher than thosefor 18 to 39 year olds, but they must be interpreted with caution due to the low number ofcases involved.
Alberta Reproductive Health: Pregnancy Outcomes (2001)
___________________________________________________________________
59
WWiiggggeellsswwoorrtthh ccllaassssiiffiiccaattiioonn ooff ppeerriinnaattaall aanndd nneeoonnaattaall ddeeaatthhss• A summary of perinatal and neonatal deaths classified according to Wiggelsworth for 1998 is
in Table A75. Table A76 shows the Wiggelsworth Classification from 1994 to 1998.• Group 1 – Deaths before the start of labour: 29% of deaths were assigned to this
category in 1998. Abruptio was a factor in 22% of these deaths, and 72% occurred before37 weeks gestation.
• Group 2 – Lethal or potentially lethal malformations: Lethal or potentially lethalmalformations accounted for 32% of deaths in 1998.
• Group 3 – Deaths associated with prematurity: Prematurity was a factor in 22% of deathsin 1998; 36% of these deaths were intrapartum deaths. Ninety–five percent of the deaths inthis group had birth weights less than 1000 grams. Of those weighing less than 1000 grams,39% were intrapartum deaths and 61% were neonatal deaths.
• Group 4 – Intrapartum Deaths, Neonatal deaths <4 hours old, Neonatal deaths >1000grams and >4 hours old with evidence of cerebral birth trauma/asphyxia: Four percentof the deaths were in this group in 1998. Massive hemorrhage/abruptio placenta was afactor in 25% of these cases.
• Group 5 – Defined specific condition: A specific condition was defined in 14% of thedeaths in 1998. Table A77 lists these defined specific conditions for 1994 to 1998. Stillbirthsaccounted for 58% of this group, and neonatal deaths accounted for 42%. Of the babies inthis group, 49% weighed 2500 grams or greater. Cord anomalies/accidents are consistentlythe most common finding in this category, followed by deaths at term that could not beexplained.
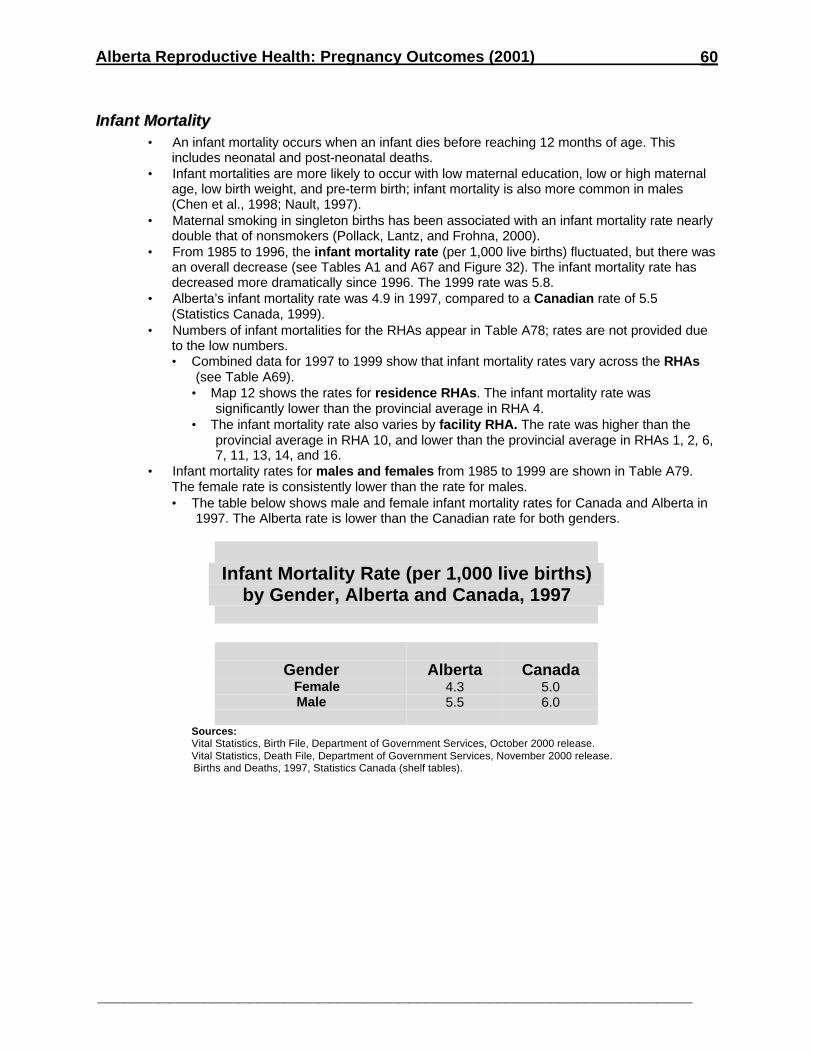
Alberta Reproductive Health: Pregnancy Outcomes (2001)
___________________________________________________________________
60
IInnffaanntt MMoorrttaalliittyy• An infant mortality occurs when an infant dies before reaching 12 months of age. This
includes neonatal and post-neonatal deaths.• Infant mortalities are more likely to occur with low maternal education, low or high maternal
age, low birth weight, and pre-term birth; infant mortality is also more common in males(Chen et al., 1998; Nault, 1997).
• Maternal smoking in singleton births has been associated with an infant mortality rate nearlydouble that of nonsmokers (Pollack, Lantz, and Frohna, 2000).
• From 1985 to 1996, the infant mortality rate (per 1,000 live births) fluctuated, but there wasan overall decrease (see Tables A1 and A67 and Figure 32). The infant mortality rate hasdecreased more dramatically since 1996. The 1999 rate was 5.8.
• Alberta’s infant mortality rate was 4.9 in 1997, compared to a Canadian rate of 5.5(Statistics Canada, 1999).
• Numbers of infant mortalities for the RHAs appear in Table A78; rates are not provided dueto the low numbers.• Combined data for 1997 to 1999 show that infant mortality rates vary across the RHAs
(see Table A69).• Map 12 shows the rates for residence RHAs. The infant mortality rate was
significantly lower than the provincial average in RHA 4.• The infant mortality rate also varies by facility RHA. The rate was higher than the
provincial average in RHA 10, and lower than the provincial average in RHAs 1, 2, 6,7, 11, 13, 14, and 16.
• Infant mortality rates for males and females from 1985 to 1999 are shown in Table A79.The female rate is consistently lower than the rate for males.• The table below shows male and female infant mortality rates for Canada and Alberta in
1997. The Alberta rate is lower than the Canadian rate for both genders.
Infant Mortality Rate (per 1,000 live births)by Gender, Alberta and Canada, 1997
Gender Alberta Canada Female 4.3 5.0
Male 5.5 6.0
Sources:Vital Statistics, Birth File, Department of Government Services, October 2000 release.Vital Statistics, Death File, Department of Government Services, November 2000 release.Births and Deaths, 1997, Statistics Canada (shelf tables).
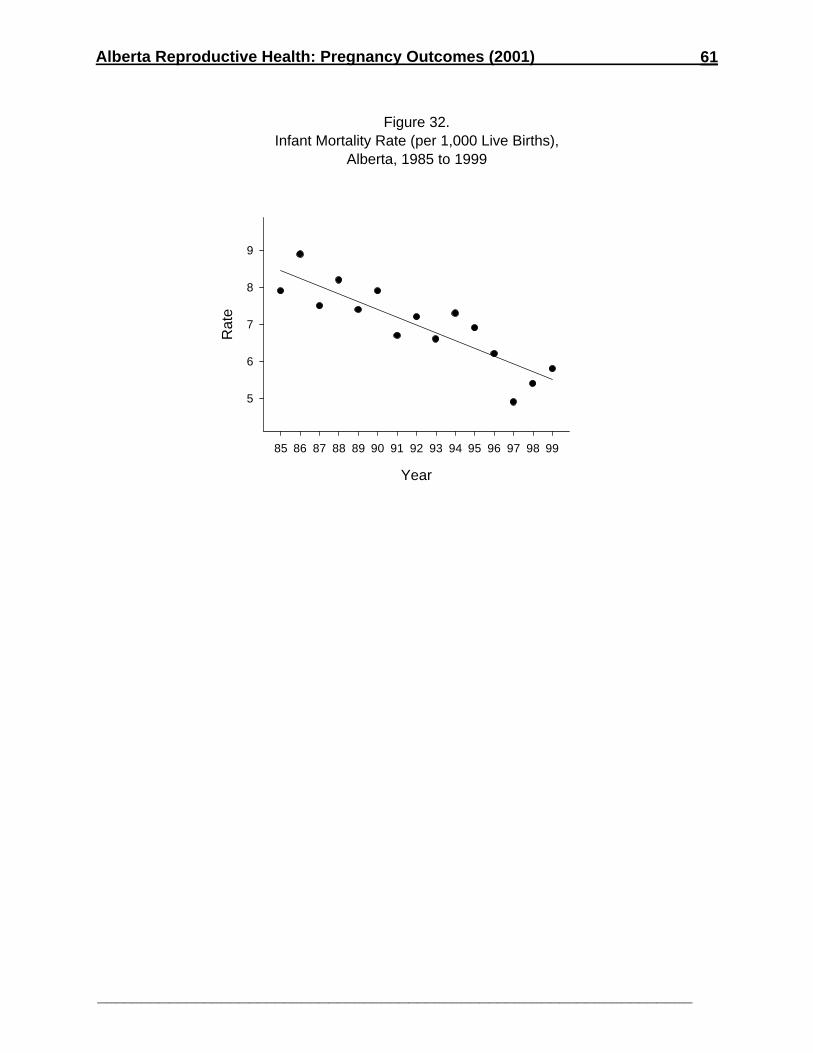
Alberta Reproductive Health: Pregnancy Outcomes (2001)
___________________________________________________________________
61
Figure 32.Infant Mortality Rate (per 1,000 Live Births),
Alberta, 1985 to 1999
Year
85 86 87 88 89 90 91 92 93 94 95 96 97 98 99
Rat
e
5
6
7
8
9
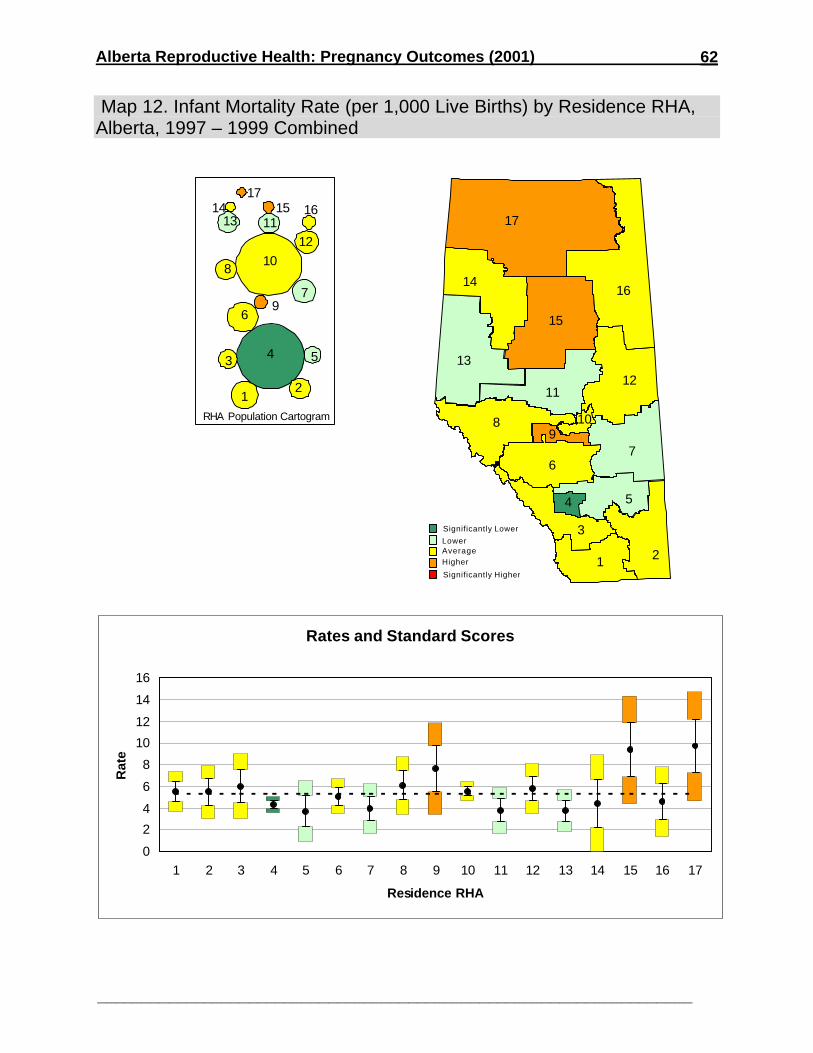
Alberta Reproductive Health: Pregnancy Outcomes (2001)
___________________________________________________________________
62
Map 12. Infant Mortality Rate (per 1,000 Live Births) by Residence RHA,Alberta, 1997 – 1999 Combined
Significantly Lower
LowerAverageHigher
Significantly Higher
17
16
15
14
13
1211
8
6
3
1 2
5
7
4
109
12
3 4 5
6
7
8
9
10
1112
1314 15 16
17
RHA Population Cartogram
Rates and Standard Scores
0
2
4
6
8
10
12
14
16
1 2 3 4 5 6 7 8 9 10 11 12 13 14 15 16 17
Residence RHA
Rat
e
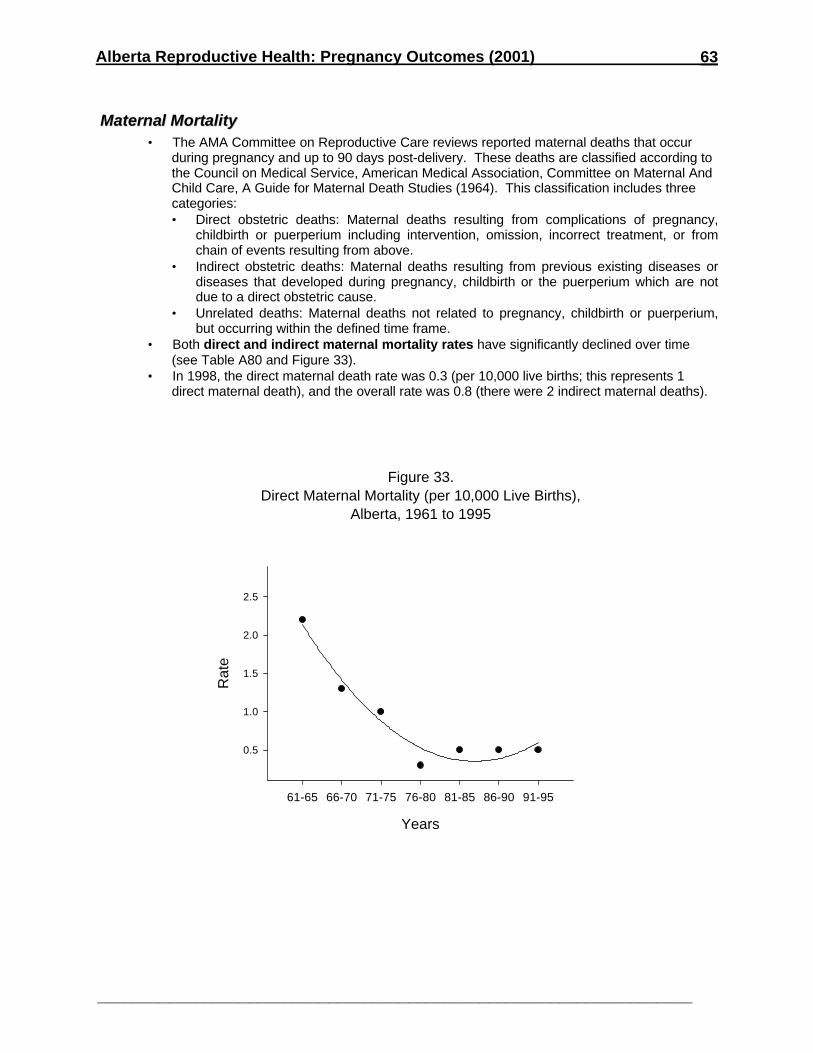
Alberta Reproductive Health: Pregnancy Outcomes (2001)
___________________________________________________________________
63
MMaatteerrnnaall MMoorrttaalliittyy• The AMA Committee on Reproductive Care reviews reported maternal deaths that occur
during pregnancy and up to 90 days post-delivery. These deaths are classified according tothe Council on Medical Service, American Medical Association, Committee on Maternal AndChild Care, A Guide for Maternal Death Studies (1964). This classification includes threecategories:• Direct obstetric deaths: Maternal deaths resulting from complications of pregnancy,
childbirth or puerperium including intervention, omission, incorrect treatment, or fromchain of events resulting from above.
• Indirect obstetric deaths: Maternal deaths resulting from previous existing diseases ordiseases that developed during pregnancy, childbirth or the puerperium which are notdue to a direct obstetric cause.
• Unrelated deaths: Maternal deaths not related to pregnancy, childbirth or puerperium,but occurring within the defined time frame.
• Both direct and indirect maternal mortality rates have significantly declined over time(see Table A80 and Figure 33).
• In 1998, the direct maternal death rate was 0.3 (per 10,000 live births; this represents 1direct maternal death), and the overall rate was 0.8 (there were 2 indirect maternal deaths).
Figure 33.Direct Maternal Mortality (per 10,000 Live Births),
Alberta, 1961 to 1995
Years
61-65 66-70 71-75 76-80 81-85 86-90 91-95
Rat
e
0.5
1.0
1.5
2.0
2.5
Alberta Reproductive Health: Pregnancy Outcomes (2001)
___________________________________________________________________
64
References
Alberta Health and Wellness (in press). Maternal risk factors as predictors of preterm delivery and lowbirth weight in Central and Northern Alberta.
Alberta Medical Association (1996). Final Report of the Ad Hoc Committee on Epidural Analgesia inLabour and Delivery.
Alexander, G. R., Kogan, M., Martin, J. and Papiernik, E. (1998). What are the fetal growth patterns ofsingletons, twins, and triplets in the United States? Clinical Obstetrics and Gynecology, Vol. 41,No. 1, 115-125.
Chen, J. and Millar, W. (1999). Birth outcome, the social environment, and child health. Health Reports,Vol. 10, No. 4, 57-67.
Chen, J., Fair, M., Wilkins, R., Cyr, M. and the Fetal and Infant Mortality Study Group of the CanadianPerinatal Surveillance System (1998). Health Reports, Vol. 10, No. 2, 53-64.
D’Agostino, J. and Clifford, P. (1998). Neurodevelopmental consequences associated with the prematureneonate. AACN Clinical Issues, Vol. 9, No. 1, 11-24.
Dryburgh, H. (2000). Teenage Pregnancy. Health Reports, Vol. 12, No.1, 9-19.
Ford, D. and Nault, F. (1996). Changing fertility patterns, 1974 to 1994. Health Reports, Vol. 8, No. 3, 39-46.
Health Canada (2000a). Canadian Perinatal Health Report. Ottawa: Minister of Public Works andGovernment Services Canada.
Health Canada (2000b). Family-Centered Maternity and Newborn Care: National Guidelines, Minister ofPublic Works and Government Services. (Level of hospital care: Pages 2.13 -2.29)
Luke, B. (1998). What is the influence of maternal weight gain on the fetal growth of twins? ClinicalObstetrics and Gynecology, Vol. 41, No. 1, 57-64.
MacNab, Y. C., Macdonald, J., and Tuk, T. A. (1997). The risks of childbearing at older ages. HealthReports, Vol. 9, No. 2, 41-50.
Millar, W. J. and Chen, J. (1998). Maternal education and risk factors for small-for-gestational-age births.Health Reports, Vol. 10, No. 2, 43-51.
Nault, F. (1997). Infant mortality and low birth weight, 1975 to 1995. Health Reports, Vol. 9, No. 3, 39-46.
Oyen, N., Skjaerven, R. and Irgens, L. M. (1996). Population-based recurrence risk of sudden infantdeath syndrome compared with other infant and fetal deaths. American Journal of Epidemiology,Vol. 144, No. 3, 300-305.
Pivarnik, J. M. (1998). Potential effects of maternal physical activity on birth weight: brief review. Medicine& Science in Sports and Exercise, Vol. 30, No. 3, 400-406.
Pollack, H., Lantz, P. M., and Frohna, J. G. (2000). Maternal smoking and adverse birth outcomes amongsingletons and twins. American Journal of Public Health, 90(3), pp. 395 – 400.
Poen, A. C., Felt-Bersma, R. J., Dekker, G. A., Deville, W., Cuesta, M. A., & Meuwissen, S. G. (1997).Third degree obstetric perineal tears: risk factors and the preventive role of mediolateralepisiotomy. British Journal of Obstetrics & Gynaecology. 104(5):563-566.
Robertson, C.M.T., Svenson, L., & Kyle, J.M. (1997, June). Province-based study of newborns with lowbirthweight for gestational age: 1985 through 1995. Proceedings of the Society for PediatricEpidemiologic Research, Edmonton, Alberta, Canada, p. 45, A#24.
Senat, M-V., Ancel, P-Y., Bouvier-Colle, M-H. and Breart, G. (1998). How does multiple pregnancy affectmaternal mortality and morbidity? Clinical Obstetrics and Gynecology, Vol. 41, No. 1, 79-83.
Alberta Reproductive Health: Pregnancy Outcomes (2001)
___________________________________________________________________
65
Statistics Canada (1997). Births and Deaths, 1995. Catalogue Number 84-210-XPB.
Statistics Canada (1999). Births and Deaths, 1997 (Shelf Tables). Catalogue Number 84F-0210-XPB.
Svenson, L. W., Schopflocher, D., Sauve, R. S. and Robertson, C. M. T. (1998). Alberta’s infant mortalityrate: The effect of the registration of live newborns weighing less than 500 grams. Canadian Journal ofPublic Health, Vol. 89, No. 3, 188-189.
Tough, S., Greene, C., Svenson, L., and Belik, J. (2000). Effects of in vitro fertilization on low birth weight,preterm delivery, and multiple birth. The Journal of Pediatrics, Vol. 136, No. 5, 618- 622.
Tough, S., Svenson, L., Johnston, D., Newburn-Cook, C., Rose, S., and Belik, J. (2000). Delayedchildbearing and its impact on population rate changes in lower birth weight, multiple birth, and pre-termdelivery. Under review.
Tough, S., Svenson, L., and Schopflocher, D. (1999). Maternal risk factors in relationship to birthoutcome. Edmonton: Alberta Health and Wellness.
Wallace, I. F. and McCarton, C. M. (1997). Neurodevelopmental outcomes of the premature, small-for-gestational-age infant through age 6. Clinical Obstetrics and Gynecology, Vol. 40, No. 4, 843-852.
Wilkins, R., and Houle, C. (1999). Health Status of Children. Health Reports, Vol. 11, No. 3, 25-34.
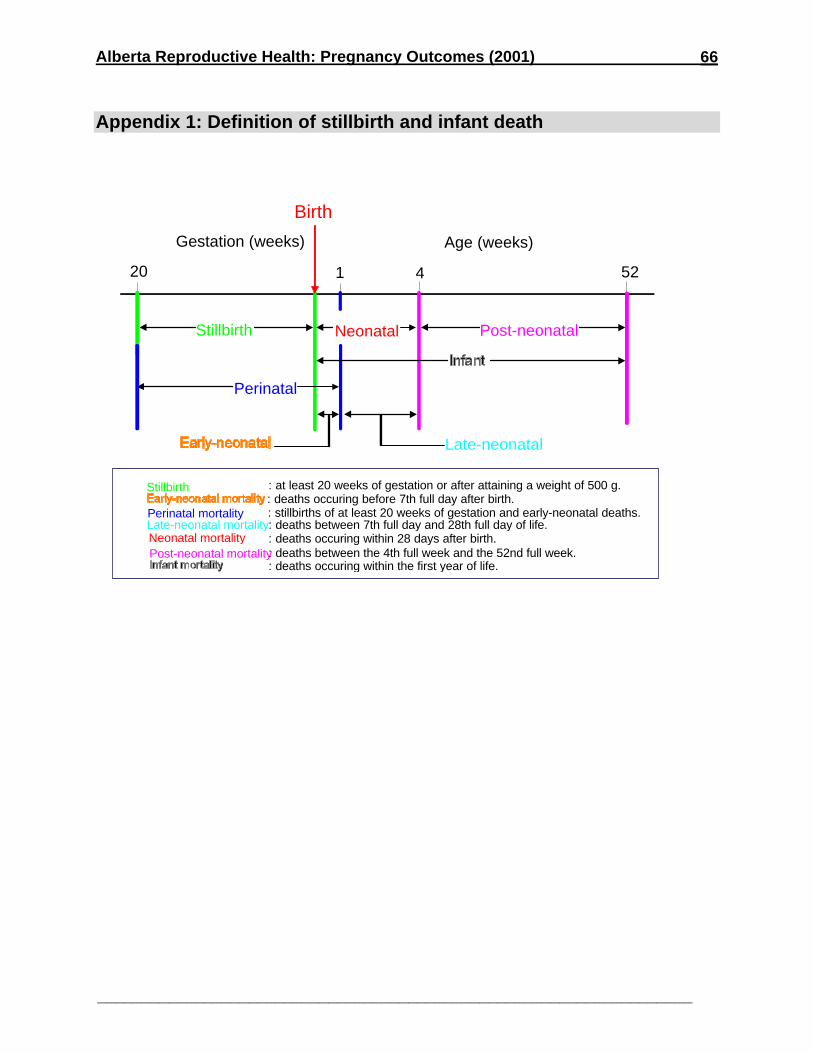
Alberta Reproductive Health: Pregnancy Outcomes (2001)
___________________________________________________________________
66
Appendix 1: Definition of stillbirth and infant death
20 1 4 52
Stillbirth
Birth
Neonatal Post-neonatal
Perinatal
Gestation (weeks) Age (weeks)
Late-neonatal
Stillbirth : at least 20 weeks of gestation or after attaining a weight of 500 g.: deaths occuring before 7th full day after birth.
Perinatal mortality : stillbirths of at least 20 weeks of gestation and early-neonatal deaths.Late-neonatal mortality: deaths between 7th full day and 28th full day of life.Neonatal mortality : deaths occuring within 28 days after birth.Post-neonatal mortality: deaths between the 4th full week and the 52nd full week.
: deaths occuring within the first year of life.
Alberta Reproductive Health: Pregnancy Outcomes (2001)
___________________________________________________________________
67
Appendix 2: Glossary
age: age at the last birth date preceding the event.(Statistics Canada, Births and Deaths, 1995)
age-specific fertility rate: number of live births per 1,000 women in a specific age group. (StatisticsCanada, Births and Deaths, 1995)
abortion: termination of pregnancy before the fetus is viable.spontaneous: abortion occurring naturally.induced: abortion brought on intentionally by medication and instrumentation.
(Encyclopedia and Dictionary of Medicine, Nursing, and Allied Health)
antepartum (AP): before the onset of labour.
birth or live birth: the complete expulsion or extraction from the mother, irrespective of the duration ofthe pregnancy, of a fetus in which, after expulsion or extraction, there is breathing, beating of the heart,pulsation of the umbilical cord or unmistakable movement of voluntary muscle, whether or not theumbilical cord has been cut or the placenta is attached. (Alberta Vital Statistics Act, RSA 1980 cV-4 s1)
birth weight: first weight of the fetus or newborn obtained after birth, expressed in grams. (StatisticsCanada, Births and Deaths, 1995). low birth weight (LBW): birth weight is less than 2,500 grams.(Statistics Canada, Births and Deaths, 1995). very low birth weight (VLBW): birth weight is less than1,500 grams. (Statistics Canada, Births and Deaths, 1995). extreme low birth weight (ELBW): birthweight is less than 1,000 grams. (Statistics Canada, Births and Deaths, 1995) small for gestational age(SGA): birth weight falls below the tenth percentile of that is appropriate for gestational age. large forgestational age (LGA): birth weight falls above the ninetieth percentile of that is appropriate forgestational age.
crude birth rate (CBR): number of live births per 1,000 population. (Statistics Canada, Births andDeaths, 1995)
direct obstetric death: maternal death resulting from complications of pregnancy, childbirth orpuerperium including intervention, omission, incorrect treatment or from a chain of events resulting fromany of the above.
frequency: number of events or cases in a category.
general fertility rate (GFR): total number of live births per 1,000 women aged 15 to 49. (StatisticsCanada, Births and Deaths, 1995)
gestation period: interval, in complete weeks, between the first day of the last menstrual period of themother to the date of removal of fetus from the mother. For cases with unknown date of last normalmenses, gestation period is based on clinical estimation. Pre-term refers to a period of gestation lessthan 37 full weeks; term, 37 to 42 complete weeks; and post-term, more than 42 weeks. (StatisticsCanada: Therapeutic Abortions, 1994; Births and Deaths, 1995)
indirect obstetric deaths: maternal death resulting from previous existing disease or diseases thatdeveloped during pregnancy, childbirth or the puerperium which was not due to direct obstetric cause.
infant mortality: deaths to children under one year of age. (Statistics Canada: Births and Deaths, 1995)
Intrapartum (IP): during labour.
Alberta Reproductive Health: Pregnancy Outcomes (2001)
___________________________________________________________________
68
maternal death: the death of a woman known to be pregnant or within 90 days of delivery or terminationof the pregnancy, irrespective of the duration of or site of the pregnancy.
mean: the arithmetic average of a set of observations, the sum of scores divided by the number ofscores.
median: the middle value in a set of values that have been arranged in order from highest to lowest.
multiple birth: birth in which more than one infant is born, including live births and stillbirths. (StatisticsCanada, Births and Deaths, 1995)
multiple pregnancy: a pregnancy with more than one fetus.
neonatal deaths (NND): death of a live born infant occurring less than 28 full days after birth, includingearly neonatal deaths: before seventh full day or less than 168 hours; and late neonatal deaths:between the seventh and 28th full day of life.
perinatal death (PND): includes stillbirths and early neonatal deaths.
rate: the number of events occurring in a population divided by the size of the population.
stillbirth: the complete expulsion or the extraction from the mother after at least 20 weeks pregnancy, orafter attaining a weight of 500 grams or more, of a fetus in which, after the expulsion or extraction, thereis no breathing, beating of the heart, pulsation of the umbilical cord or unmistakable movement ofvoluntary muscle. (Alberta Vital Statistics Act, RSA 1980 cV-4 s1)
total births: all live births and stillbirths.
total fertility rate (TFR): average number of children a woman can expect to have in her lifetime, basedon the fertility rates of a given year. It is equal to the sum of the age-specific fertility rates (age 15 to 49).(Statistics Canada, Births and Deaths, 1995)
Alberta Reproductive Health: Pregnancy Outcomes (2001)
___________________________________________________________________
69
Appendix 3: Codes used for data extraction
Induced AbortionPhysician claims induced abortion procedure records were identified by the following health servicecodes: 86.41, 87.0, 87.0A, 87.1, 87.21.
International Classification of Disease – 9th Revision – Clinical Modification (ICD-9-CM) Codes
Spontaneous abortionDiagnostic code 634
Congenital AnomaliesDiagnostic Codes
740.0-742.0 Neural Tube Defects745.0-745.9 Heart Septal Defect 758.0 Down Syndrome
For “All congenital anomalies combined” analyses, the following diagnostic codes were included:Congenital Anomalies within ICD-9 740.0-759.9:
740.0-742.9 Nervous System Anomalies743.0-743.9 Eye Anomalies744.0-744.9 Ear, Face and Neck745.0-747.9 Cardiovascular System Defect748.0-748.9 Respiratory System Anomalies749.0-751.9 Digestive System Anomalies752.0-752.9 Genital Organ Anomalies753.0-753.9 Urinary System Anomalies754.0-756.9 Musculoskeletal Anomalies757.0-757.9 Integument Anomalies758.0-758.9 Chromosomal Anomalies759.0-759.9 Other and Unspecified Anomalies
Congenital Anomalies/Disorders Outside ICD-9 740.0-759.9:140-239 Neoplasm243.9 Congenital Hypothyroidism255.2 Adrenogenital Disorders270 Amino Acid and Organic Acid Disorders271 Disorders of CHO Transport and Metabolism275 Disorders of Mineral Metabolism277.00 Cystic Fibrosis282 Hereditary Hemolytic Anemias343 (incl 342, 344) Cerebral Palsy348.0 Cerebral Cysts760.76 Fetal Alcohol Syndrome
Hospital DeliveryDiagnostic Codes
640-648: Complications mainly related to pregnancyFifth digit: 1 Delivered, with or without mention of antepartum condition
2 Delivered, with mention of postpartum complication650: Delivery in a completely normal case651-659: Other indications for care in pregnancy, labour and deliveryFifth digit: 1 Delivered, with or without mention of antepartum condition
2 Delivered, with mention of postpartum complication
Alberta Reproductive Health: Pregnancy Outcomes (2001)
___________________________________________________________________
70
V CodeV27: Outcome of delivery
InductionProcedure Codes
73.4: Medical induction of labour73.01: Induction of labour by artificial rupture of membranes73.1: Other surgical induction of labour
Operative DeliveryProcedure Codes
74: Cesarean section and removal of fetus (7491(hysterotomy to terminatepregnancy) was excluded).
72.0: Low forceps operation72.1: Low forceps operation with episiotomy72.2: Mid forceps operation72.21: Mid forceps with episiotomy72.29: Other mid forceps operation72.3: High forceps operation72.31: High forceps operation with episiotomy72.39: Other high forceps operation72.7: Vacuum extraction72.71: Vacuum extraction with episiotomy
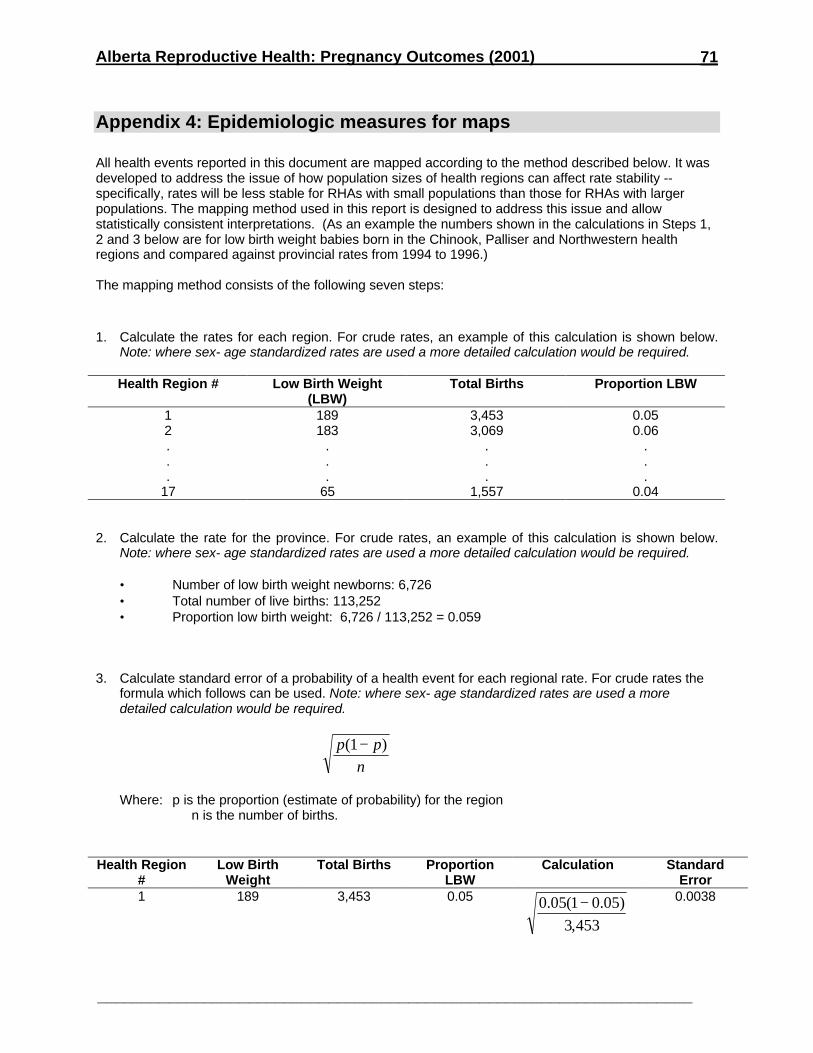
Alberta Reproductive Health: Pregnancy Outcomes (2001)
___________________________________________________________________
71
Appendix 4: Epidemiologic measures for maps
All health events reported in this document are mapped according to the method described below. It wasdeveloped to address the issue of how population sizes of health regions can affect rate stability --specifically, rates will be less stable for RHAs with small populations than those for RHAs with largerpopulations. The mapping method used in this report is designed to address this issue and allowstatistically consistent interpretations. (As an example the numbers shown in the calculations in Steps 1,2 and 3 below are for low birth weight babies born in the Chinook, Palliser and Northwestern healthregions and compared against provincial rates from 1994 to 1996.)
The mapping method consists of the following seven steps:
1. Calculate the rates for each region. For crude rates, an example of this calculation is shown below.Note: where sex- age standardized rates are used a more detailed calculation would be required.
Health Region # Low Birth Weight(LBW)
Total Births Proportion LBW
1 189 3,453 0.052 183 3,069 0.06. . . .. . . .. . . .
17 65 1,557 0.04
2. Calculate the rate for the province. For crude rates, an example of this calculation is shown below.Note: where sex- age standardized rates are used a more detailed calculation would be required.
• Number of low birth weight newborns: 6,726• Total number of live births: 113,252• Proportion low birth weight: 6,726 / 113,252 = 0.059
3. Calculate standard error of a probability of a health event for each regional rate. For crude rates theformula which follows can be used. Note: where sex- age standardized rates are used a moredetailed calculation would be required.
Where: p is the proportion (estimate of probability) for the regionn is the number of births.
Health Region#
Low BirthWeight
Total Births ProportionLBW
Calculation StandardError
1 189 3,453 0.05
453,3
)05.01(05.0 − 0.0038
p p
n
( )1−
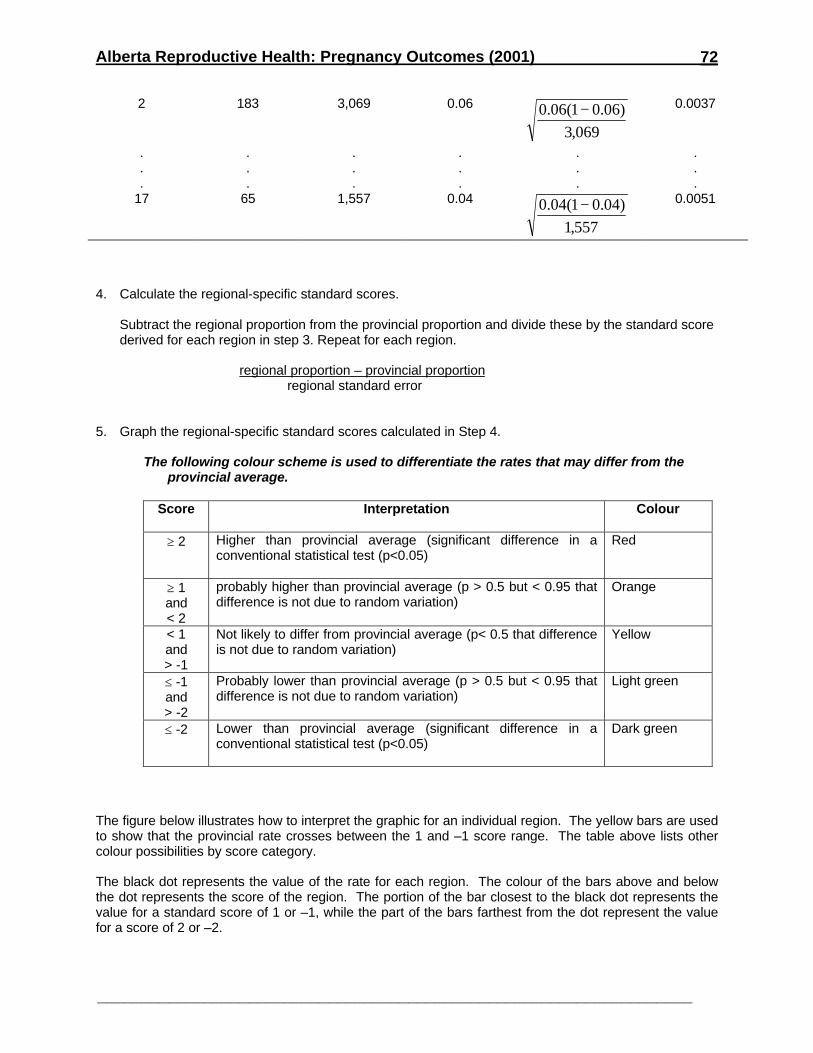
Alberta Reproductive Health: Pregnancy Outcomes (2001)
___________________________________________________________________
72
2 183 3,069 0.06
069,3
)06.01(06.0 − 0.0037
. . . . . .
. . . . . .
. . . . . .17 65 1,557 0.04
557,1
)04.01(04.0 − 0.0051
4. Calculate the regional-specific standard scores.
Subtract the regional proportion from the provincial proportion and divide these by the standard scorederived for each region in step 3. Repeat for each region.
regional proportion – provincial proportion regional standard error
5. Graph the regional-specific standard scores calculated in Step 4.
The following colour scheme is used to differentiate the rates that may differ from theprovincial average.
Score Interpretation Colour
≥ 2 Higher than provincial average (significant difference in aconventional statistical test (p<0.05)
Red
≥ 1and< 2
probably higher than provincial average (p > 0.5 but < 0.95 thatdifference is not due to random variation)
Orange
< 1and> -1
Not likely to differ from provincial average (p< 0.5 that differenceis not due to random variation)
Yellow
≤ -1and> -2
Probably lower than provincial average (p > 0.5 but < 0.95 thatdifference is not due to random variation)
Light green
≤ -2 Lower than provincial average (significant difference in aconventional statistical test (p<0.05)
Dark green
The figure below illustrates how to interpret the graphic for an individual region. The yellow bars are usedto show that the provincial rate crosses between the 1 and –1 score range. The table above lists othercolour possibilities by score category.
The black dot represents the value of the rate for each region. The colour of the bars above and belowthe dot represents the score of the region. The portion of the bar closest to the black dot represents thevalue for a standard score of 1 or –1, while the part of the bars farthest from the dot represent the valuefor a score of 2 or –2.

Alberta Reproductive Health: Pregnancy Outcomes (2001)
___________________________________________________________________
73
6. Generate maps using the same categories for each region as listed in Step 5.
The graph and map are placed in the same page. The map allows the reader to obtain a quick overviewwhile more detailed information is presented on the graph . The colour assigned to each region is basedon the colour of the bars in the graph for the same region. This provides a spatial context to thedistribution patterns and consistency among the two graphic elements.
7. Generate a cartogram.
A cartogram is similar to a map. However, each region is represented by a circle that is sizedproportionately to the regional population. This graphic is useful for interpreting reported rates byproviding an indication of the population size of each region. Each RHA in the cartogram is coloured thesame as it is on the provincial map.
Observed Rate
Score = 1
Score = 2
Score = -2
Score = -1
ProvincialRate
Alberta Reproductive Health: Pregnancy Outcomes (2001)
___________________________________________________________________
74
Appendix 5: Perinatal morbidity report by Dr. Charlene Robertson
Morbidity Report from the Northern AlbertaNeonatal and Infant Follow-up Clinic.
The 1999 Consensus Statement on Intrapartum Asphyxiain Relation to Perinatal Asphyxia at Term
Local data – births 1997 to 1999
The literature states that perinatal asphyxia does not result in adverse outcome beyond whatwould be expected in a population unless moderate or severe neonatal encephalopathy occurs. Asstated by Volpe1 outcome studies of perinatal asphyxia have relied upon the clinical triad of fetal distress(using a variety of measures), depression at birth (the Apgar score) and the need for resuscitation, andabnormal newborn neurological examination often termed neonatal encephalopathy, to diagnoseasphyxia. For previous outcome studies from Northern Alberta, we have used the presence of moderate(hypotonia and suppressed primitive reflexes), or severe (flaccidity and absent primitive reflexes)neonatal encephalopathy occurring after one hour of life and before 7 days of life and thought to be dueto a hypoxic-ischemic event together with abnormal fetal heart rate patterns, a one or five minute Apgarscore of less than 5, and resuscitation at birth or following the neonatal event, to diagnose hypoxic-ischemic encephalopathy. The hypoxic-ischemic event could occur before labour, during labour, at birthor in the very early neonatal period. We have excluded from any reports, children with mild hypoxic-ischemic encephalopathy as their results are similar to corresponding peer groups, children withsyndromes or congenital malformations associated with developmental delay, neonatal absencesyndrome, intracranial bleed as the primary insult, and all other causes of encephalopathy. The followingstatements have no relation to prenatal hypoxic-ischemic events where the term newborn does notpresent with an encephalopathy typical of hypoxic-ischemic encephalopathy.
Our data has repeatedly shown adverse outcome for neonates with moderate or severe neonatalencephalopathy: death or disability, cerebral palsy, cognitive delay, visual loss, epilepsy, and/or ahearing loss in 20% of those with moderate and 100% of those with severe.2 During the 3 years from1997 to 1999, 107 children were cared for in the neonatal intensive care units with hypoxic-ischemicencephalopathy. Of these, 11 had severe and 96 moderate hypoxic-ischemic encephalopathy. Of thosewith severe, 8 died and 3 remained disabled with spastic quadriplegia, mental retardation, and epilepsy.Of the 96 children with moderate hypoxic-ischemic encephalopathy 22 (23%) are disabled at 18 to 24months of age. Of these 22 disabled children, 10 have cerebral palsy with or without cognitive delay,vision loss or epilepsy, another 10 have cognitive delay, and 2 have high frequency sensorineural hearingloss.
In order to further advance the understanding of perinatal asphyxia we need information on itstime of onset. The present operational definition of intrapartum asphyxia gives an opportunity todetermine not only the outcome but also learn more about the causation of this type of perinatal asphyxia.The definition of the 1999 International Consensus Statement3 is as follows.
Intrapartum asphyxia as an acute intrapartum event sufficient to play a causation role in cerebralpalsy has:
- metabolic acidosis (pH less than 7.00 and base deficit > 12 mmol/L),- early onset moderate or severe hypoxic-ischemic encephalopathy, and- spastic quadriplegic or dyskinetic cerebral palsy.
In addition, information of nonspecific evidence to support this diagnosis includes:
- sentinel (single) hypoxic event occurring immediately before or during labour, for exampleprolapsed cord or ruptured uterus,
Alberta Reproductive Health: Pregnancy Outcomes (2001)
___________________________________________________________________
75
- a sudden, rapid, and sustained deterioration of fetal heart rate pattern usually after asentinel event where the pattern was previously normal,
- Apgar score of 0 to 6 for longer than five minutes,- early evidence of multisystem involvement,- early imaging events of acute cerebral abnormality.
The strength of this consensus is that it gives a widely accepted working definition of at least part ofperinatal asphyxia. It gives us an opportunity to review our outcome of neonates so defined.
During the years 1997 through 1999, 41 children were cared for in our tertiary-level NICUs withhistories consistent with intrapartum asphyxia. All children had a pH of less than 7 however, base deficitinformation was missing on many children. Of these 41 children 24% died (4 in hospital and 6 followingdischarge). Of the remaining 31 children eight had spastic quadriplegia or spastic athetoid quadriplegiawith mental retardation; one had spastic athetoid cerebral palsy without mental retardation to date, fivehad mental retardation without cerebral palsy, 14 had borderline mental development without cerebralpalsy, three had normal mental developmental indexes of >85 however two of these had severeexpressive language delay and one had severe attentional deficit.
This definition does not take into consideration many new areas of study such as the maturity of certainbrain cells at the time of hypoxic-ischemic insult hence the susceptibility to insult of specific brain cellsrelated to metabolic function; autoregulation; blood shift protective mechanisms; and the time, degree,and duration of insult as well as re-oxygenation injury.4,5 Various patterns of hypoxic-ischemic insultwithin the area of intrapartum asphyxia are being recognized.
A. A clinical situation of a sudden acute asphyxia such as prolapsed cord may be followed byimaging at 3 days of bilateral basal ganglia and thalamus abnormalities indicating an acute, neartotal asphyxia. Because of the rapidity of insult there may or may not be metabolic acidosis andnonbrain organs may be spared.6 The outcome of the child may be normal but the most likelyoutcome is a moderate neonatal encephalopathy and later a dyskinetic cerebral palsy usuallywith some spasticity with normal intellect and normal head growth.There is a general feeling that the best imaging to document this insult is MRI at 72 hours.
B. If such an acute total asphyxia occurs for a longer period of time, perhaps greater than 20minutes, then the full picture of severe metabolic acidosis and multiorgan failure is seen. Suchchildren may show bilateral basal ganglia and/or thalamus abnormalities but tend to show severegeneralized cerebral edema with generalized necrosis and involvement of the cortical spinaltract, visual cortex, and as well the subcortical nuclei. After a period of time of 10 to 21 days, CTScan show an encephalomalacia. The outcome of such children is usually a severe hypoxic-ischemic encephalopathy and the long term outcome a spastic quadriplegia or spastic athetoidquadriplegia with mental retardation, microcephaly, and possibly epilepsy. Death is a frequentoutcome. A good description of this syndrome of acute near-total intrauterine asphyxia isavailable.7
The more common type of perinatal asphyxia, that of partial, prolonged asphyxia currently has nooperational definition. The early imaging, usually a CT Scan at 3 to 5 days, shows edema andsubsequent parasagittal (watershed) damage is visible. The basal ganglia are usually not affected.Similarly the cortical spinal tract and visual cortex may also not be affected. The clinical pattern of theencephalopathy is somewhat different than those with intrapartum asphyxia in that there is a moreobvious pattern of hypotonia of the upper body compared to the lower body and in particular a greaterhypotonia of the shoulder girdles. This is due to the white matter damage in the watershed region. Thecontroversy for these children is the possible absence of metabolic acidosis at birth. The pH may benormal suggesting that the child has recovered in utero and that the encephalopathy has persisted, inmuch the same fashion as after birth. History suggests that the fetal heart rate tracing when recordedmay be reassuring but we also have a number of cases of no variability of the fetal heart rate lasting for aprolonged period of time before intervention, or variable or late decelerations. Sometimes there is latebradycardia. Such children usually have a moderate, not severe encephalopathy, have early onset of a
Alberta Reproductive Health: Pregnancy Outcomes (2001)
___________________________________________________________________
76
delayed head growth velocity, and may show an outcome of spastic quadriplegia with mental retardation,epilepsy or visual impairment or mental retardation without cerebral palsy. A variety of learning difficultieshave been noted for survivors without cerebral palsy, mental retardation, cortical visual impairment, orepilepsy and the most prevalent in our follow-up is that of a delay in language development andsubsequent central auditory processing difficulties. The outcome in about ½ of the children appears to benormal.
It is felt that we could improve our understanding of the timing of the onset of the hypoxic-ischemic event if we consistently recorded additional information on the children cared for in the intensivecare units with moderate or severe hypoxic-ischemic encephalopathy. These variables would be:
1. record changes in fetal heart patterns and sentinel events, and results of fetal scalp sampling,2. arterial cord pH and base deficit or arterial blood gases within the first hour of life,3. head circumference at birth or within 4 hours of birth, at 3 days, and at discharge from hospital4. cranial imaging done at specific times. It is suggested that a CT Scan or MRI at 72 hours after
birth and a CT Scan at greater than 3 weeks after birth give useful information.
References
1. Volpe JJ. Hypoxic-ischemic encephalopathy: clinical aspects. In: Neurology of the newborn,third edition. Philadelphia: WB Saunders Co.; 1995. P. 314-69.
2. Robertson CMT, Finer NN, Grace MGA. School performance of survivors of neonatalencephalopathy associated with birth asphyxia at term. J Pediatr 1989; 114:753-60.
3. MacLennan A. A template for defining a causal relationship between acute intrapartum eventsand cerebral palsy: international consensus statement. Brit Med J 1999; 319:1054-9.
4. Inder TE, Volpe JJ. Mechanisms of perinatal brain injury. Semin Neonatol 2000;5:3-16.
5. Johnston MV. Selective vulnerability in neonatal brain. Ann Neurol 1998;44:155-8.
6. Dear P, Newell S. Establishing probable cause in cerebral palsy. How much certainty is enough.Brit Med J 2000;320:1075-6.
7. Pasternak JF, Gorey MT. The syndrome of acute near-total intrauterine asphyxia in the terminfant. Pediatr Neurol 1998;18:391-8.
Note: The recommendations in this document are those of the author and have not been endorsed by theAlberta Medical Association or Alberta Health and Wellness.

Alberta Reproductive Health: Pregnancy Outcomes (2001)
___________________________________________________________________
77
Appendix 6: Tables
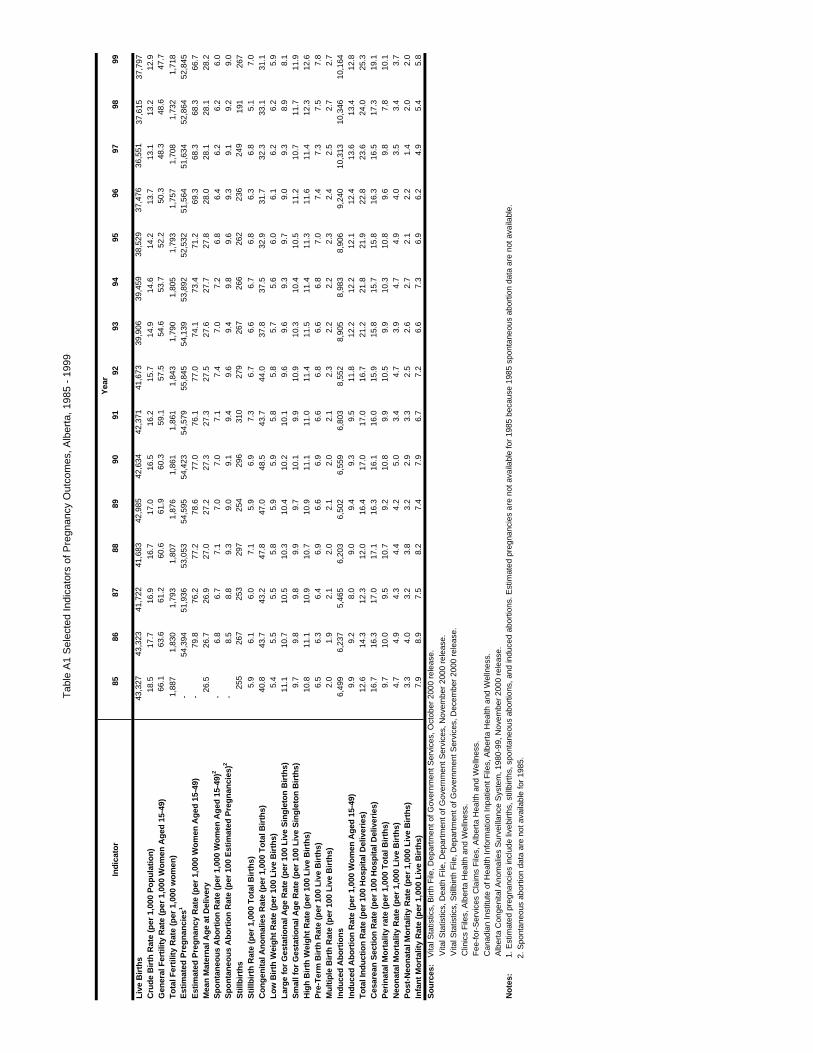
Tab
le A
1 S
elec
ted
Indi
cato
rs o
f Pre
gnan
cy O
utco
mes
, Alb
erta
, 198
5 -
1999
Indi
cato
r85
8687
8889
9091
9293
9495
9697
9899
Live
Birt
hs43
,327
43,3
2341
,722
41,6
8342
,985
42,6
3442
,371
41,6
7339
,906
39,4
5938
,529
37,4
7636
,551
37,6
1537
,797
Cru
de B
irth
Rat
e (p
er 1
,000
Pop
ulat
ion)
18.5
17.7
16.9
16.7
17.0
16.5
16.2
15.7
14.9
14.6
14.2
13.7
13.1
13.2
12.9
Gen
eral
Fer
tility
Rat
e (p
er 1
,000
Wom
en A
ged
15-4
9)66
.163
.661
.260
.661
.960
.359
.157
.554
.653
.752
.250
.348
.348
.647
.7
Tot
al F
ertil
ity R
ate
(per
1,0
00 w
omen
)1,
887
1,83
01,
793
1,80
71,
876
1,86
11,
861
1,84
31,
790
1,80
51,
793
1,75
71,
708
1,73
21,
718
Est
imat
ed P
regn
anci
es1
-54
,394
51,9
3653
,053
54,5
9554
,423
54,5
7955
,845
54,1
3953
,892
52,5
3251
,564
51,6
3452
,864
52,8
45E
stim
ated
Pre
gnan
cy R
ate
(per
1,0
00 W
omen
Age
d 15
-49)
-79
.876
.277
.278
.677
.076
.177
.074
.173
.471
.269
.368
.368
.366
.7M
ean
Mat
erna
l Age
at D
eliv
ery
26.5
26.7
26.9
27.0
27.2
27.3
27.3
27.5
27.6
27.7
27.8
28.0
28.1
28.1
28.2
Spo
ntan
eous
Abo
rtio
n R
ate
(per
1,0
00 W
omen
Age
d 15
-49)
2-
6.8
6.7
7.1
7.0
7.0
7.1
7.4
7.0
7.2
6.8
6.4
6.2
6.2
6.0
Spo
ntan
eous
Abo
rtio
n R
ate
(per
100
Est
imat
ed P
regn
anci
es)
2-
8.5
8.8
9.3
9.0
9.1
9.4
9.6
9.4
9.8
9.6
9.3
9.1
9.2
9.0
Stil
lbirt
hs25
526
725
329
725
429
631
027
926
726
626
223
624
919
126
7S
tillb
irth
Rat
e (p
er 1
,000
Tot
al B
irths
)5.
96.
16.
07.
15.
96.
97.
36.
76.
66.
76.
86.
36.
85.
17.
0C
onge
nita
l Ano
mal
ies
Rat
e (p
er 1
,000
Tot
al B
irths
)40
.843
.743
.247
.847
.048
.543
.744
.037
.837
.532
.931
.732
.333
.131
.1Lo
w B
irth
Wei
ght R
ate
(per
100
Liv
e B
irths
)5.
45.
55.
55.
85.
95.
95.
85.
85.
75.
66.
06.
16.
26.
25.
9La
rge
for
Ges
tatio
nal A
ge R
ate
(per
100
Liv
e S
ingl
eton
Birt
hs)
11.1
10.7
10.5
10.3
10.4
10.2
10.1
9.6
9.6
9.3
9.7
9.0
9.3
8.9
8.1
Sm
all f
or G
esta
tiona
l Age
Rat
e (p
er 1
00 L
ive
Sin
glet
on B
irths
)9.
79.
89.
89.
99.
710
.19.
910
.910
.310
.410
.511
.210
.711
.711
.9H
igh
Birt
h W
eigh
t Rat
e (p
er 1
00 L
ive
Birt
hs)
10.8
11.1
10.9
10.7
10.9
11.1
11.0
11.4
11.5
11.4
11.3
11.6
11.4
12.3
12.6
Pre
-Ter
m B
irth
Rat
e (p
er 1
00 L
ive
Birt
hs)
6.5
6.3
6.4
6.9
6.6
6.9
6.6
6.8
6.6
6.8
7.0
7.4
7.3
7.5
7.8
Mul
tiple
Birt
h R
ate
(per
100
Liv
e B
irths
)2.
01.
92.
12.
02.
12.
02.
12.
32.
22.
22.
32.
42.
52.
72.
7In
duce
d A
borti
ons
6,49
96,
237
5,46
56,
203
6,50
26,
559
6,80
38,
552
8,90
58,
983
8,90
69,
240
10,3
1310
,346
10,1
64In
duce
d A
bort
ion
Rat
e (p
er 1
,000
Wom
en A
ged
15-4
9)9.
99.
28.
09.
09.
49.
39.
511
.812
.212
.212
.112
.413
.613
.412
.8T
otal
Indu
ctio
n R
ate
(per
100
Hos
pita
l Del
iver
ies)
12.6
14.3
12.3
12.0
16.4
17.0
17.0
16.7
21.2
21.8
21.9
22.8
23.6
24.0
25.3
Ces
area
n S
ectio
n R
ate
(per
100
Hos
pita
l Del
iver
ies)
16.7
16.3
17.0
17.1
16.3
16.1
16.0
15.9
15.8
15.7
15.8
16.3
16.5
17.3
19.1
Per
inat
al M
orta
lity
rate
(pe
r 1,
000
Tot
al B
irths
)9.
710
.09.
510
.79.
210
.89.
910
.59.
910
.310
.89.
69.
87.
810
.1N
eona
tal M
orta
lity
Rat
e (p
er 1
,000
Liv
e B
irths
)4.
74.
94.
34.
44.
25.
03.
44.
73.
94.
74.
94.
03.
53.
43.
7P
ost-
Neo
nata
l Mor
talit
y R
ate
(per
1,0
00 L
ive
Birt
hs)
3.3
4.0
3.2
3.8
3.2
2.9
3.3
2.5
2.6
2.7
2.1
2.2
1.4
2.0
2.0
Infa
nt M
orta
lity
Rat
e (p
er 1
,000
Liv
e B
irths
)7.
98.
97.
58.
27.
47.
96.
77.
26.
67.
36.
96.
24.
95.
45.
8
Sou
rces
:
Vita
l Sta
tistic
s, B
irth
File
, Dep
artm
ent o
f Gov
ernm
ent S
ervi
ces,
Oct
ober
200
0 re
leas
e.
V
ital S
tatis
tics,
Dea
th F
ile, D
epar
tmen
t of G
over
nmen
t Ser
vice
s, N
ovem
ber
2000
rel
ease
.
V
ital S
tatis
tics,
Stil
lbirt
h F
ile, D
epar
tmen
t of G
over
nmen
t Ser
vice
s, D
ecem
ber
2000
rel
ease
.
C
linic
s F
iles,
Alb
erta
Hea
lth a
nd W
elln
ess.
Fee
-for
-Ser
vice
s C
laim
s F
iles,
Alb
erta
Hea
lth a
nd W
elln
ess.
Can
adia
n In
stitu
te o
f Hea
lth In
form
atio
n In
patie
nt F
iles,
Alb
erta
Hea
lth a
nd W
elln
ess.
Alb
erta
Con
geni
tal A
nom
alie
s S
urve
illan
ce S
yste
m, 1
980-
99, N
ovem
ber
2000
rel
ease
.N
otes
:
1.
Est
imat
ed p
regn
anci
es in
clud
e liv
ebirt
hs, s
tillb
irths
, spo
ntan
eous
abo
rtio
ns, a
nd in
duce
d ab
ortio
ns. E
stim
ated
pre
gnan
cies
are
not
ava
ilabl
e fo
r 19
85 b
ecau
se 1
985
spon
tane
ous
abor
tion
data
are
not
ava
ilabl
e.
2.
Spo
ntan
eous
abo
rtio
n da
ta a
re n
ot a
vaila
ble
for
1985
.
Yea
r
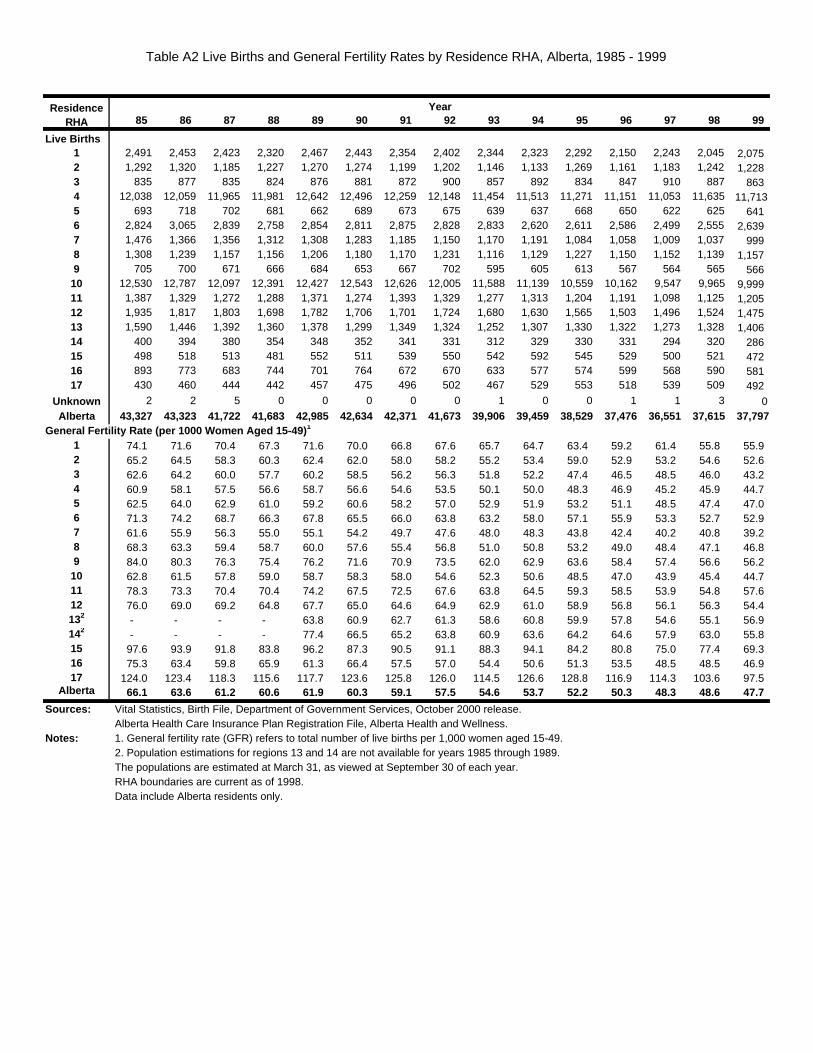
Table A2 Live Births and General Fertility Rates by Residence RHA, Alberta, 1985 - 1999
85 86 87 88 89 90 91 92 93 94 95 96 97 98 99
Live Births1 2,491 2,453 2,423 2,320 2,467 2,443 2,354 2,402 2,344 2,323 2,292 2,150 2,243 2,045 2,075 2 1,292 1,320 1,185 1,227 1,270 1,274 1,199 1,202 1,146 1,133 1,269 1,161 1,183 1,242 1,228 3 835 877 835 824 876 881 872 900 857 892 834 847 910 887 863 4 12,038 12,059 11,965 11,981 12,642 12,496 12,259 12,148 11,454 11,513 11,271 11,151 11,053 11,635 11,7135 693 718 702 681 662 689 673 675 639 637 668 650 622 625 641 6 2,824 3,065 2,839 2,758 2,854 2,811 2,875 2,828 2,833 2,620 2,611 2,586 2,499 2,555 2,639 7 1,476 1,366 1,356 1,312 1,308 1,283 1,185 1,150 1,170 1,191 1,084 1,058 1,009 1,037 999 8 1,308 1,239 1,157 1,156 1,206 1,180 1,170 1,231 1,116 1,129 1,227 1,150 1,152 1,139 1,157 9 705 700 671 666 684 653 667 702 595 605 613 567 564 565 566
10 12,530 12,787 12,097 12,391 12,427 12,543 12,626 12,005 11,588 11,139 10,559 10,162 9,547 9,965 9,999 11 1,387 1,329 1,272 1,288 1,371 1,274 1,393 1,329 1,277 1,313 1,204 1,191 1,098 1,125 1,205 12 1,935 1,817 1,803 1,698 1,782 1,706 1,701 1,724 1,680 1,630 1,565 1,503 1,496 1,524 1,475 13 1,590 1,446 1,392 1,360 1,378 1,299 1,349 1,324 1,252 1,307 1,330 1,322 1,273 1,328 1,406 14 400 394 380 354 348 352 341 331 312 329 330 331 294 320 286 15 498 518 513 481 552 511 539 550 542 592 545 529 500 521 472 16 893 773 683 744 701 764 672 670 633 577 574 599 568 590 581 17 430 460 444 442 457 475 496 502 467 529 553 518 539 509 492
Unknown 2 2 5 0 0 0 0 0 1 0 0 1 1 3 0Alberta 43,327 43,323 41,722 41,683 42,985 42,634 42,371 41,673 39,906 39,459 38,529 37,476 36,551 37,615 37,797
General Fertility Rate (per 1000 Women Aged 15-49) 1
1 74.1 71.6 70.4 67.3 71.6 70.0 66.8 67.6 65.7 64.7 63.4 59.2 61.4 55.8 55.9 2 65.2 64.5 58.3 60.3 62.4 62.0 58.0 58.2 55.2 53.4 59.0 52.9 53.2 54.6 52.6 3 62.6 64.2 60.0 57.7 60.2 58.5 56.2 56.3 51.8 52.2 47.4 46.5 48.5 46.0 43.2 4 60.9 58.1 57.5 56.6 58.7 56.6 54.6 53.5 50.1 50.0 48.3 46.9 45.2 45.9 44.7 5 62.5 64.0 62.9 61.0 59.2 60.6 58.2 57.0 52.9 51.9 53.2 51.1 48.5 47.4 47.0 6 71.3 74.2 68.7 66.3 67.8 65.5 66.0 63.8 63.2 58.0 57.1 55.9 53.3 52.7 52.9 7 61.6 55.9 56.3 55.0 55.1 54.2 49.7 47.6 48.0 48.3 43.8 42.4 40.2 40.8 39.2 8 68.3 63.3 59.4 58.7 60.0 57.6 55.4 56.8 51.0 50.8 53.2 49.0 48.4 47.1 46.8 9 84.0 80.3 76.3 75.4 76.2 71.6 70.9 73.5 62.0 62.9 63.6 58.4 57.4 56.6 56.2
10 62.8 61.5 57.8 59.0 58.7 58.3 58.0 54.6 52.3 50.6 48.5 47.0 43.9 45.4 44.7 11 78.3 73.3 70.4 70.4 74.2 67.5 72.5 67.6 63.8 64.5 59.3 58.5 53.9 54.8 57.6 12 76.0 69.0 69.2 64.8 67.7 65.0 64.6 64.9 62.9 61.0 58.9 56.8 56.1 56.3 54.4 132 - - - - 63.8 60.9 62.7 61.3 58.6 60.8 59.9 57.8 54.6 55.1 56.9 142 - - - - 77.4 66.5 65.2 63.8 60.9 63.6 64.2 64.6 57.9 63.0 55.8 15 97.6 93.9 91.8 83.8 96.2 87.3 90.5 91.1 88.3 94.1 84.2 80.8 75.0 77.4 69.3 16 75.3 63.4 59.8 65.9 61.3 66.4 57.5 57.0 54.4 50.6 51.3 53.5 48.5 48.5 46.9 17 124.0 123.4 118.3 115.6 117.7 123.6 125.8 126.0 114.5 126.6 128.8 116.9 114.3 103.6 97.5
Alberta 66.1 63.6 61.2 60.6 61.9 60.3 59.1 57.5 54.6 53.7 52.2 50.3 48.3 48.6 47.7
Sources: Vital Statistics, Birth File, Department of Government Services, October 2000 release.Alberta Health Care Insurance Plan Registration File, Alberta Health and Wellness.
Notes: 1. General fertility rate (GFR) refers to total number of live births per 1,000 women aged 15-49. 2. Population estimations for regions 13 and 14 are not available for years 1985 through 1989.The populations are estimated at March 31, as viewed at September 30 of each year. RHA boundaries are current as of 1998.Data include Alberta residents only.
Residence RHA
Year
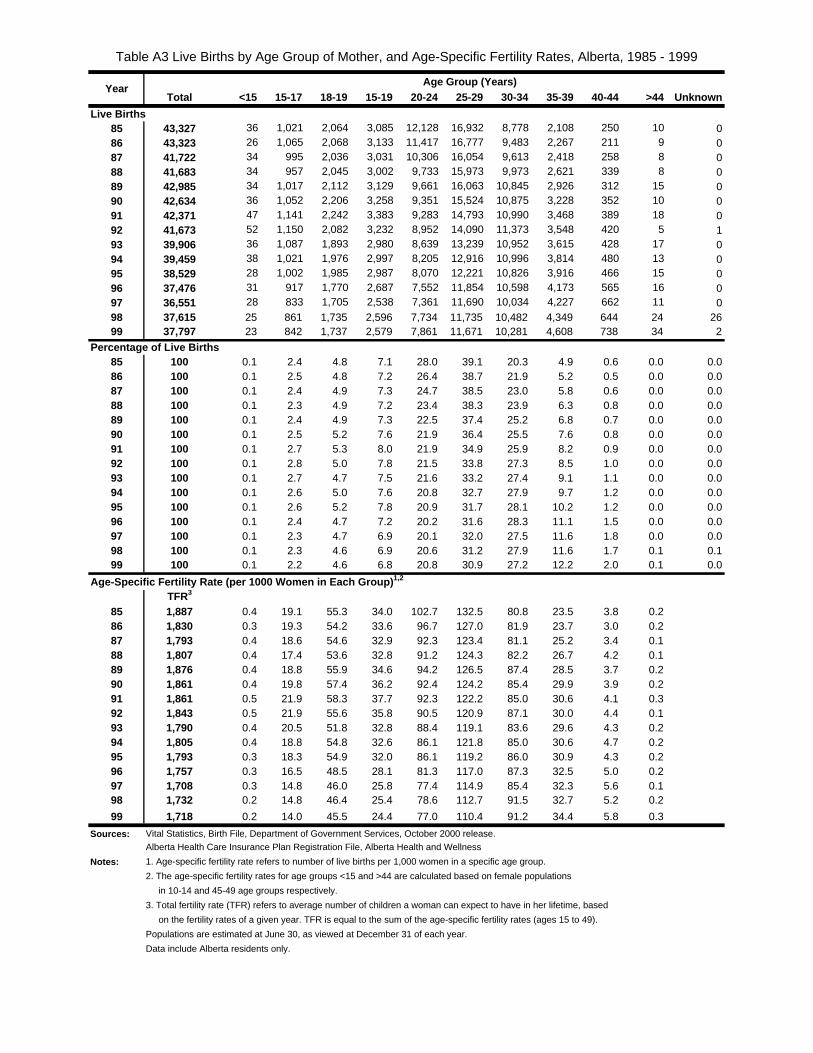
Table A3 Live Births by Age Group of Mother, and Age-Specific Fertility Rates, Alberta, 1985 - 1999
Total <15 15-17 18-19 15-19 20-24 25-29 30-34 35-39 40-44 >44 Unknown
Live Births85 43,327 36 1,021 2,064 3,085 12,128 16,932 8,778 2,108 250 10 086 43,323 26 1,065 2,068 3,133 11,417 16,777 9,483 2,267 211 9 087 41,722 34 995 2,036 3,031 10,306 16,054 9,613 2,418 258 8 088 41,683 34 957 2,045 3,002 9,733 15,973 9,973 2,621 339 8 089 42,985 34 1,017 2,112 3,129 9,661 16,063 10,845 2,926 312 15 090 42,634 36 1,052 2,206 3,258 9,351 15,524 10,875 3,228 352 10 091 42,371 47 1,141 2,242 3,383 9,283 14,793 10,990 3,468 389 18 092 41,673 52 1,150 2,082 3,232 8,952 14,090 11,373 3,548 420 5 193 39,906 36 1,087 1,893 2,980 8,639 13,239 10,952 3,615 428 17 094 39,459 38 1,021 1,976 2,997 8,205 12,916 10,996 3,814 480 13 095 38,529 28 1,002 1,985 2,987 8,070 12,221 10,826 3,916 466 15 096 37,476 31 917 1,770 2,687 7,552 11,854 10,598 4,173 565 16 097 36,551 28 833 1,705 2,538 7,361 11,690 10,034 4,227 662 11 098 37,615 25 861 1,735 2,596 7,734 11,735 10,482 4,349 644 24 2699 37,797 23 842 1,737 2,579 7,861 11,671 10,281 4,608 738 34 2
Percentage of Live Births85 100 0.1 2.4 4.8 7.1 28.0 39.1 20.3 4.9 0.6 0.0 0.086 100 0.1 2.5 4.8 7.2 26.4 38.7 21.9 5.2 0.5 0.0 0.087 100 0.1 2.4 4.9 7.3 24.7 38.5 23.0 5.8 0.6 0.0 0.088 100 0.1 2.3 4.9 7.2 23.4 38.3 23.9 6.3 0.8 0.0 0.089 100 0.1 2.4 4.9 7.3 22.5 37.4 25.2 6.8 0.7 0.0 0.090 100 0.1 2.5 5.2 7.6 21.9 36.4 25.5 7.6 0.8 0.0 0.091 100 0.1 2.7 5.3 8.0 21.9 34.9 25.9 8.2 0.9 0.0 0.092 100 0.1 2.8 5.0 7.8 21.5 33.8 27.3 8.5 1.0 0.0 0.093 100 0.1 2.7 4.7 7.5 21.6 33.2 27.4 9.1 1.1 0.0 0.094 100 0.1 2.6 5.0 7.6 20.8 32.7 27.9 9.7 1.2 0.0 0.095 100 0.1 2.6 5.2 7.8 20.9 31.7 28.1 10.2 1.2 0.0 0.096 100 0.1 2.4 4.7 7.2 20.2 31.6 28.3 11.1 1.5 0.0 0.097 100 0.1 2.3 4.7 6.9 20.1 32.0 27.5 11.6 1.8 0.0 0.098 100 0.1 2.3 4.6 6.9 20.6 31.2 27.9 11.6 1.7 0.1 0.199 100 0.1 2.2 4.6 6.8 20.8 30.9 27.2 12.2 2.0 0.1 0.0
Age-Specific Fertility Rate (per 1000 Women in Each Group) 1,2
TFR3
85 1,887 0.4 19.1 55.3 34.0 102.7 132.5 80.8 23.5 3.8 0.286 1,830 0.3 19.3 54.2 33.6 96.7 127.0 81.9 23.7 3.0 0.287 1,793 0.4 18.6 54.6 32.9 92.3 123.4 81.1 25.2 3.4 0.188 1,807 0.4 17.4 53.6 32.8 91.2 124.3 82.2 26.7 4.2 0.189 1,876 0.4 18.8 55.9 34.6 94.2 126.5 87.4 28.5 3.7 0.290 1,861 0.4 19.8 57.4 36.2 92.4 124.2 85.4 29.9 3.9 0.291 1,861 0.5 21.9 58.3 37.7 92.3 122.2 85.0 30.6 4.1 0.392 1,843 0.5 21.9 55.6 35.8 90.5 120.9 87.1 30.0 4.4 0.193 1,790 0.4 20.5 51.8 32.8 88.4 119.1 83.6 29.6 4.3 0.294 1,805 0.4 18.8 54.8 32.6 86.1 121.8 85.0 30.6 4.7 0.295 1,793 0.3 18.3 54.9 32.0 86.1 119.2 86.0 30.9 4.3 0.296 1,757 0.3 16.5 48.5 28.1 81.3 117.0 87.3 32.5 5.0 0.297 1,708 0.3 14.8 46.0 25.8 77.4 114.9 85.4 32.3 5.6 0.198 1,732 0.2 14.8 46.4 25.4 78.6 112.7 91.5 32.7 5.2 0.2
99 1,718 0.2 14.0 45.5 24.4 77.0 110.4 91.2 34.4 5.8 0.3
Sources: Vital Statistics, Birth File, Department of Government Services, October 2000 release.
Alberta Health Care Insurance Plan Registration File, Alberta Health and Wellness
Notes: 1. Age-specific fertility rate refers to number of live births per 1,000 women in a specific age group.
2. The age-specific fertility rates for age groups <15 and >44 are calculated based on female populations
in 10-14 and 45-49 age groups respectively.
3. Total fertility rate (TFR) refers to average number of children a woman can expect to have in her lifetime, based
on the fertility rates of a given year. TFR is equal to the sum of the age-specific fertility rates (ages 15 to 49).
Populations are estimated at June 30, as viewed at December 31 of each year.
Data include Alberta residents only.
YearAge Group (Years)
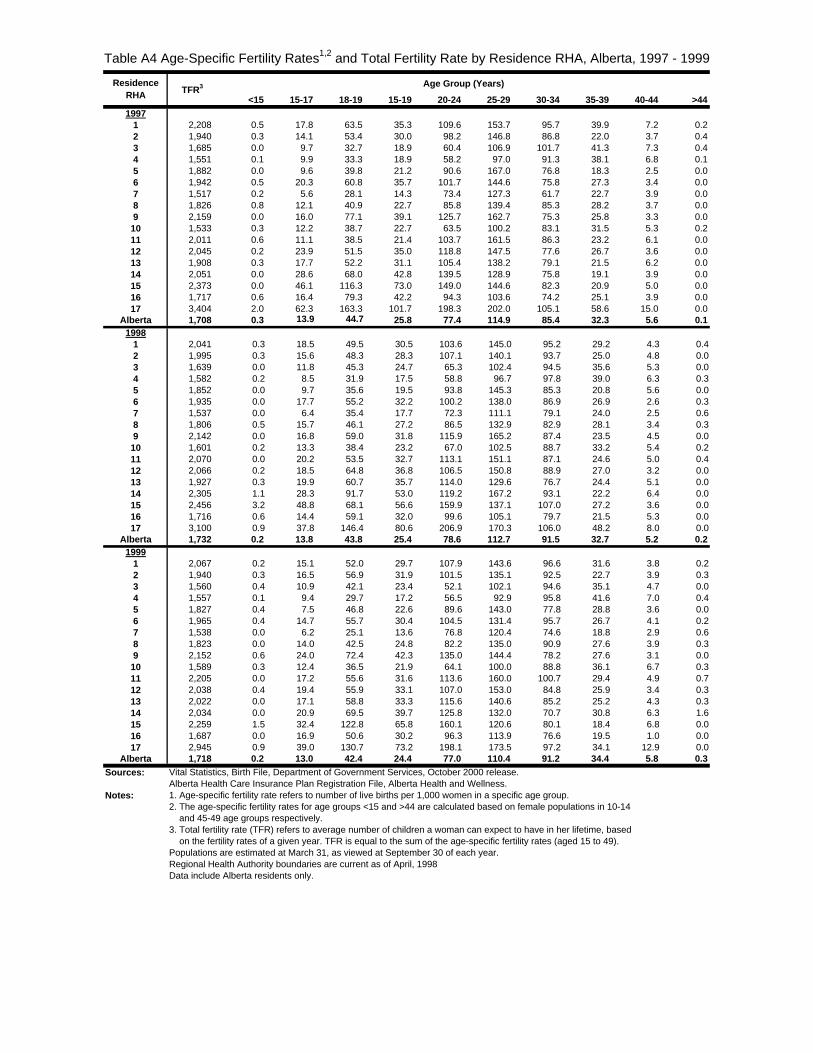
Table A4 Age-Specific Fertility Rates1,2 and Total Fertility Rate by Residence RHA, Alberta, 1997 - 1999
<15 15-17 18-19 15-19 20-24 25-29 30-34 35-39 40-44 >441997
1 2,208 0.5 17.8 63.5 35.3 109.6 153.7 95.7 39.9 7.2 0.22 1,940 0.3 14.1 53.4 30.0 98.2 146.8 86.8 22.0 3.7 0.43 1,685 0.0 9.7 32.7 18.9 60.4 106.9 101.7 41.3 7.3 0.44 1,551 0.1 9.9 33.3 18.9 58.2 97.0 91.3 38.1 6.8 0.15 1,882 0.0 9.6 39.8 21.2 90.6 167.0 76.8 18.3 2.5 0.06 1,942 0.5 20.3 60.8 35.7 101.7 144.6 75.8 27.3 3.4 0.07 1,517 0.2 5.6 28.1 14.3 73.4 127.3 61.7 22.7 3.9 0.08 1,826 0.8 12.1 40.9 22.7 85.8 139.4 85.3 28.2 3.7 0.09 2,159 0.0 16.0 77.1 39.1 125.7 162.7 75.3 25.8 3.3 0.010 1,533 0.3 12.2 38.7 22.7 63.5 100.2 83.1 31.5 5.3 0.211 2,011 0.6 11.1 38.5 21.4 103.7 161.5 86.3 23.2 6.1 0.012 2,045 0.2 23.9 51.5 35.0 118.8 147.5 77.6 26.7 3.6 0.013 1,908 0.3 17.7 52.2 31.1 105.4 138.2 79.1 21.5 6.2 0.014 2,051 0.0 28.6 68.0 42.8 139.5 128.9 75.8 19.1 3.9 0.015 2,373 0.0 46.1 116.3 73.0 149.0 144.6 82.3 20.9 5.0 0.016 1,717 0.6 16.4 79.3 42.2 94.3 103.6 74.2 25.1 3.9 0.017 3,404 2.0 62.3 163.3 101.7 198.3 202.0 105.1 58.6 15.0 0.0
Alberta 1,708 0.3 13.9 44.7 25.8 77.4 114.9 85.4 32.3 5.6 0.11998
1 2,041 0.3 18.5 49.5 30.5 103.6 145.0 95.2 29.2 4.3 0.42 1,995 0.3 15.6 48.3 28.3 107.1 140.1 93.7 25.0 4.8 0.03 1,639 0.0 11.8 45.3 24.7 65.3 102.4 94.5 35.6 5.3 0.04 1,582 0.2 8.5 31.9 17.5 58.8 96.7 97.8 39.0 6.3 0.35 1,852 0.0 9.7 35.6 19.5 93.8 145.3 85.3 20.8 5.6 0.06 1,935 0.0 17.7 55.2 32.2 100.2 138.0 86.9 26.9 2.6 0.37 1,537 0.0 6.4 35.4 17.7 72.3 111.1 79.1 24.0 2.5 0.68 1,806 0.5 15.7 46.1 27.2 86.5 132.9 82.9 28.1 3.4 0.39 2,142 0.0 16.8 59.0 31.8 115.9 165.2 87.4 23.5 4.5 0.010 1,601 0.2 13.3 38.4 23.2 67.0 102.5 88.7 33.2 5.4 0.211 2,070 0.0 20.2 53.5 32.7 113.1 151.1 87.1 24.6 5.0 0.412 2,066 0.2 18.5 64.8 36.8 106.5 150.8 88.9 27.0 3.2 0.013 1,927 0.3 19.9 60.7 35.7 114.0 129.6 76.7 24.4 5.1 0.014 2,305 1.1 28.3 91.7 53.0 119.2 167.2 93.1 22.2 6.4 0.015 2,456 3.2 48.8 68.1 56.6 159.9 137.1 107.0 27.2 3.6 0.016 1,716 0.6 14.4 59.1 32.0 99.6 105.1 79.7 21.5 5.3 0.017 3,100 0.9 37.8 146.4 80.6 206.9 170.3 106.0 48.2 8.0 0.0
Alberta 1,732 0.2 13.8 43.8 25.4 78.6 112.7 91.5 32.7 5.2 0.21999
1 2,067 0.2 15.1 52.0 29.7 107.9 143.6 96.6 31.6 3.8 0.22 1,940 0.3 16.5 56.9 31.9 101.5 135.1 92.5 22.7 3.9 0.33 1,560 0.4 10.9 42.1 23.4 52.1 102.1 94.6 35.1 4.7 0.04 1,557 0.1 9.4 29.7 17.2 56.5 92.9 95.8 41.6 7.0 0.45 1,827 0.4 7.5 46.8 22.6 89.6 143.0 77.8 28.8 3.6 0.06 1,965 0.4 14.7 55.7 30.4 104.5 131.4 95.7 26.7 4.1 0.27 1,538 0.0 6.2 25.1 13.6 76.8 120.4 74.6 18.8 2.9 0.68 1,823 0.0 14.0 42.5 24.8 82.2 135.0 90.9 27.6 3.9 0.39 2,152 0.6 24.0 72.4 42.3 135.0 144.4 78.2 27.6 3.1 0.010 1,589 0.3 12.4 36.5 21.9 64.1 100.0 88.8 36.1 6.7 0.311 2,205 0.0 17.2 55.6 31.6 113.6 160.0 100.7 29.4 4.9 0.712 2,038 0.4 19.4 55.9 33.1 107.0 153.0 84.8 25.9 3.4 0.313 2,022 0.0 17.1 58.8 33.3 115.6 140.6 85.2 25.2 4.3 0.314 2,034 0.0 20.9 69.5 39.7 125.8 132.0 70.7 30.8 6.3 1.615 2,259 1.5 32.4 122.8 65.8 160.1 120.6 80.1 18.4 6.8 0.016 1,687 0.0 16.9 50.6 30.2 96.3 113.9 76.6 19.5 1.0 0.017 2,945 0.9 39.0 130.7 73.2 198.1 173.5 97.2 34.1 12.9 0.0
Alberta 1,718 0.2 13.0 42.4 24.4 77.0 110.4 91.2 34.4 5.8 0.3Sources: Vital Statistics, Birth File, Department of Government Services, October 2000 release.
Alberta Health Care Insurance Plan Registration File, Alberta Health and Wellness.Notes: 1. Age-specific fertility rate refers to number of live births per 1,000 women in a specific age group.
2. The age-specific fertility rates for age groups <15 and >44 are calculated based on female populations in 10-14 and 45-49 age groups respectively.3. Total fertility rate (TFR) refers to average number of children a woman can expect to have in her lifetime, based on the fertility rates of a given year. TFR is equal to the sum of the age-specific fertility rates (aged 15 to 49). Populations are estimated at March 31, as viewed at September 30 of each year. Regional Health Authority boundaries are current as of April, 1998Data include Alberta residents only.
Residence RHA
Age Group (Years)TFR3
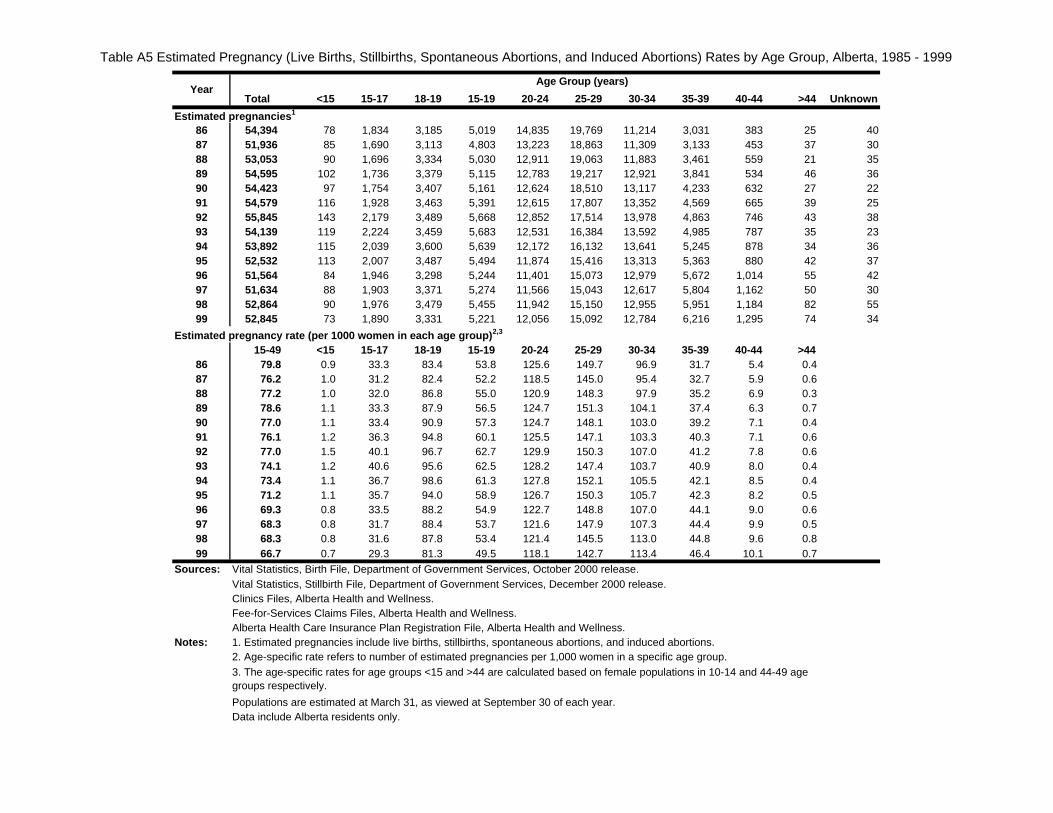
Table A5 Estimated Pregnancy (Live Births, Stillbirths, Spontaneous Abortions, and Induced Abortions) Rates by Age Group, Alberta, 1985 - 1999
Total <15 15-17 18-19 15-19 20-24 25-29 30-34 35-39 40-44 >44 Unknown
Estimated pre gnancies 1
86 54,394 78 1,834 3,185 5,019 14,835 19,769 11,214 3,031 383 25 40 87 51,936 85 1,690 3,113 4,803 13,223 18,863 11,309 3,133 453 37 30 88 53,053 90 1,696 3,334 5,030 12,911 19,063 11,883 3,461 559 21 35 89 54,595 102 1,736 3,379 5,115 12,783 19,217 12,921 3,841 534 46 36 90 54,423 97 1,754 3,407 5,161 12,624 18,510 13,117 4,233 632 27 22 91 54,579 116 1,928 3,463 5,391 12,615 17,807 13,352 4,569 665 39 25 92 55,845 143 2,179 3,489 5,668 12,852 17,514 13,978 4,863 746 43 38 93 54,139 119 2,224 3,459 5,683 12,531 16,384 13,592 4,985 787 35 23 94 53,892 115 2,039 3,600 5,639 12,172 16,132 13,641 5,245 878 34 36 95 52,532 113 2,007 3,487 5,494 11,874 15,416 13,313 5,363 880 42 37 96 51,564 84 1,946 3,298 5,244 11,401 15,073 12,979 5,672 1,014 55 42 97 51,634 88 1,903 3,371 5,274 11,566 15,043 12,617 5,804 1,162 50 30 98 52,864 90 1,976 3,479 5,455 11,942 15,150 12,955 5,951 1,184 82 55 99 52,845 73 1,890 3,331 5,221 12,056 15,092 12,784 6,216 1,295 74 34
Estimated pregnancy rate (per 1000 women in each age group) 2,3
15-49 <15 15-17 18-19 15-19 20-24 25-29 30-34 35-39 40-44 >4486 79.8 0.9 33.3 83.4 53.8 125.6 149.7 96.9 31.7 5.4 0.487 76.2 1.0 31.2 82.4 52.2 118.5 145.0 95.4 32.7 5.9 0.688 77.2 1.0 32.0 86.8 55.0 120.9 148.3 97.9 35.2 6.9 0.389 78.6 1.1 33.3 87.9 56.5 124.7 151.3 104.1 37.4 6.3 0.790 77.0 1.1 33.4 90.9 57.3 124.7 148.1 103.0 39.2 7.1 0.491 76.1 1.2 36.3 94.8 60.1 125.5 147.1 103.3 40.3 7.1 0.692 77.0 1.5 40.1 96.7 62.7 129.9 150.3 107.0 41.2 7.8 0.693 74.1 1.2 40.6 95.6 62.5 128.2 147.4 103.7 40.9 8.0 0.494 73.4 1.1 36.7 98.6 61.3 127.8 152.1 105.5 42.1 8.5 0.495 71.2 1.1 35.7 94.0 58.9 126.7 150.3 105.7 42.3 8.2 0.596 69.3 0.8 33.5 88.2 54.9 122.7 148.8 107.0 44.1 9.0 0.697 68.3 0.8 31.7 88.4 53.7 121.6 147.9 107.3 44.4 9.9 0.598 68.3 0.8 31.6 87.8 53.4 121.4 145.5 113.0 44.8 9.6 0.899 66.7 0.7 29.3 81.3 49.5 118.1 142.7 113.4 46.4 10.1 0.7
Sources: Vital Statistics, Birth File, Department of Government Services, October 2000 release.Vital Statistics, Stillbirth File, Department of Government Services, December 2000 release.Clinics Files, Alberta Health and Wellness.Fee-for-Services Claims Files, Alberta Health and Wellness.Alberta Health Care Insurance Plan Registration File, Alberta Health and Wellness.
Notes: 1. Estimated pregnancies include live births, stillbirths, spontaneous abortions, and induced abortions.2. Age-specific rate refers to number of estimated pregnancies per 1,000 women in a specific age group.
Populations are estimated at March 31, as viewed at September 30 of each year. Data include Alberta residents only.
YearAge Group (years)
3. The age-specific rates for age groups <15 and >44 are calculated based on female populations in 10-14 and 44-49 age groups respectively.
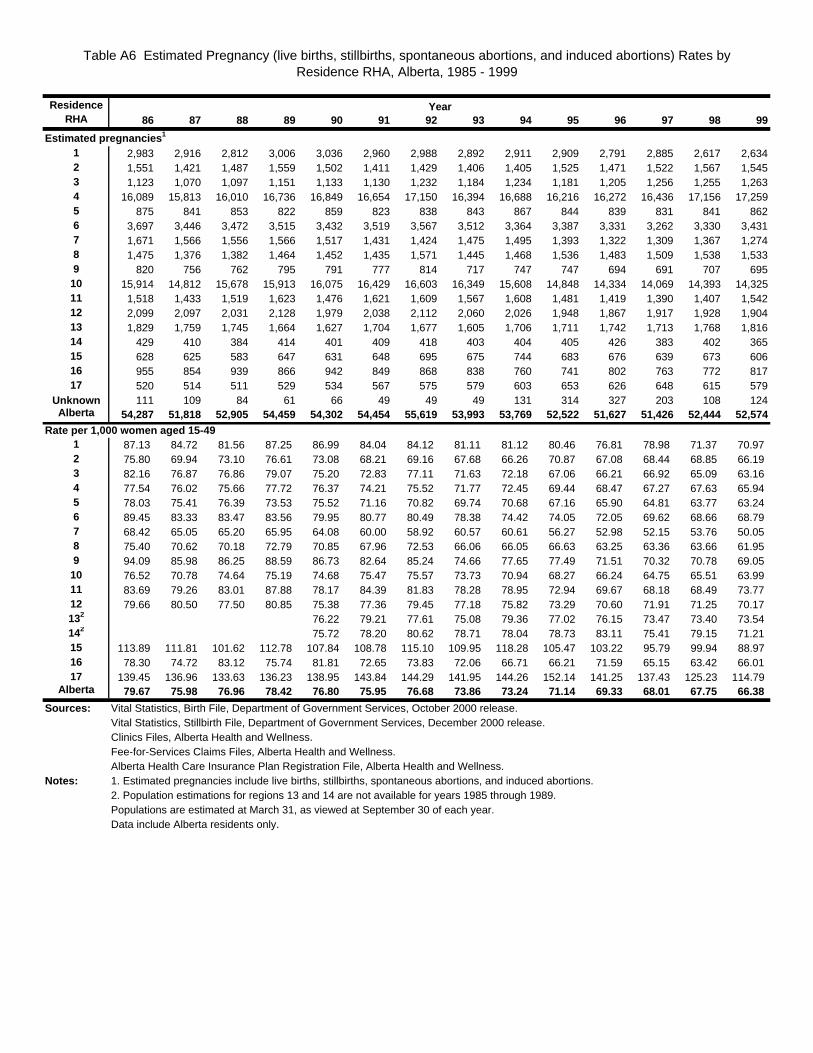
Table A6 Estimated Pregnancy (live births, stillbirths, spontaneous abortions, and induced abortions) Rates by Residence RHA, Alberta, 1985 - 1999
86 87 88 89 90 91 92 93 94 95 96 97 98 99
Estimated pregnancies 1
1 2,983 2,916 2,812 3,006 3,036 2,960 2,988 2,892 2,911 2,909 2,791 2,885 2,617 2,6342 1,551 1,421 1,487 1,559 1,502 1,411 1,429 1,406 1,405 1,525 1,471 1,522 1,567 1,5453 1,123 1,070 1,097 1,151 1,133 1,130 1,232 1,184 1,234 1,181 1,205 1,256 1,255 1,2634 16,089 15,813 16,010 16,736 16,849 16,654 17,150 16,394 16,688 16,216 16,272 16,436 17,156 17,2595 875 841 853 822 859 823 838 843 867 844 839 831 841 8626 3,697 3,446 3,472 3,515 3,432 3,519 3,567 3,512 3,364 3,387 3,331 3,262 3,330 3,4317 1,671 1,566 1,556 1,566 1,517 1,431 1,424 1,475 1,495 1,393 1,322 1,309 1,367 1,2748 1,475 1,376 1,382 1,464 1,452 1,435 1,571 1,445 1,468 1,536 1,483 1,509 1,538 1,5339 820 756 762 795 791 777 814 717 747 747 694 691 707 695
10 15,914 14,812 15,678 15,913 16,075 16,429 16,603 16,349 15,608 14,848 14,334 14,069 14,393 14,32511 1,518 1,433 1,519 1,623 1,476 1,621 1,609 1,567 1,608 1,481 1,419 1,390 1,407 1,54212 2,099 2,097 2,031 2,128 1,979 2,038 2,112 2,060 2,026 1,948 1,867 1,917 1,928 1,90413 1,829 1,759 1,745 1,664 1,627 1,704 1,677 1,605 1,706 1,711 1,742 1,713 1,768 1,81614 429 410 384 414 401 409 418 403 404 405 426 383 402 36515 628 625 583 647 631 648 695 675 744 683 676 639 673 60616 955 854 939 866 942 849 868 838 760 741 802 763 772 81717 520 514 511 529 534 567 575 579 603 653 626 648 615 579
Unknown 111 109 84 61 66 49 49 49 131 314 327 203 108 124Alberta 54,287 51,818 52,905 54,459 54,302 54,454 55,619 53,993 53,769 52,522 51,627 51,426 52,444 52,574
Rate per 1,000 women aged 15-491 87.13 84.72 81.56 87.25 86.99 84.04 84.12 81.11 81.12 80.46 76.81 78.98 71.37 70.972 75.80 69.94 73.10 76.61 73.08 68.21 69.16 67.68 66.26 70.87 67.08 68.44 68.85 66.193 82.16 76.87 76.86 79.07 75.20 72.83 77.11 71.63 72.18 67.06 66.21 66.92 65.09 63.164 77.54 76.02 75.66 77.72 76.37 74.21 75.52 71.77 72.45 69.44 68.47 67.27 67.63 65.945 78.03 75.41 76.39 73.53 75.52 71.16 70.82 69.74 70.68 67.16 65.90 64.81 63.77 63.246 89.45 83.33 83.47 83.56 79.95 80.77 80.49 78.38 74.42 74.05 72.05 69.62 68.66 68.797 68.42 65.05 65.20 65.95 64.08 60.00 58.92 60.57 60.61 56.27 52.98 52.15 53.76 50.058 75.40 70.62 70.18 72.79 70.85 67.96 72.53 66.06 66.05 66.63 63.25 63.36 63.66 61.959 94.09 85.98 86.25 88.59 86.73 82.64 85.24 74.66 77.65 77.49 71.51 70.32 70.78 69.05
10 76.52 70.78 74.64 75.19 74.68 75.47 75.57 73.73 70.94 68.27 66.24 64.75 65.51 63.9911 83.69 79.26 83.01 87.88 78.17 84.39 81.83 78.28 78.95 72.94 69.67 68.18 68.49 73.7712 79.66 80.50 77.50 80.85 75.38 77.36 79.45 77.18 75.82 73.29 70.60 71.91 71.25 70.17132 76.22 79.21 77.61 75.08 79.36 77.02 76.15 73.47 73.40 73.54142 75.72 78.20 80.62 78.71 78.04 78.73 83.11 75.41 79.15 71.2115 113.89 111.81 101.62 112.78 107.84 108.78 115.10 109.95 118.28 105.47 103.22 95.79 99.94 88.9716 78.30 74.72 83.12 75.74 81.81 72.65 73.83 72.06 66.71 66.21 71.59 65.15 63.42 66.0117 139.45 136.96 133.63 136.23 138.95 143.84 144.29 141.95 144.26 152.14 141.25 137.43 125.23 114.79
Alberta 79.67 75.98 76.96 78.42 76.80 75.95 76.68 73.86 73.24 71.14 69.33 68.01 67.75 66.38
Sources: Vital Statistics, Birth File, Department of Government Services, October 2000 release.Vital Statistics, Stillbirth File, Department of Government Services, December 2000 release.Clinics Files, Alberta Health and Wellness.Fee-for-Services Claims Files, Alberta Health and Wellness.Alberta Health Care Insurance Plan Registration File, Alberta Health and Wellness.
Notes: 1. Estimated pregnancies include live births, stillbirths, spontaneous abortions, and induced abortions.2. Population estimations for regions 13 and 14 are not available for years 1985 through 1989.Populations are estimated at March 31, as viewed at September 30 of each year. Data include Alberta residents only.
Residence RHA
Year
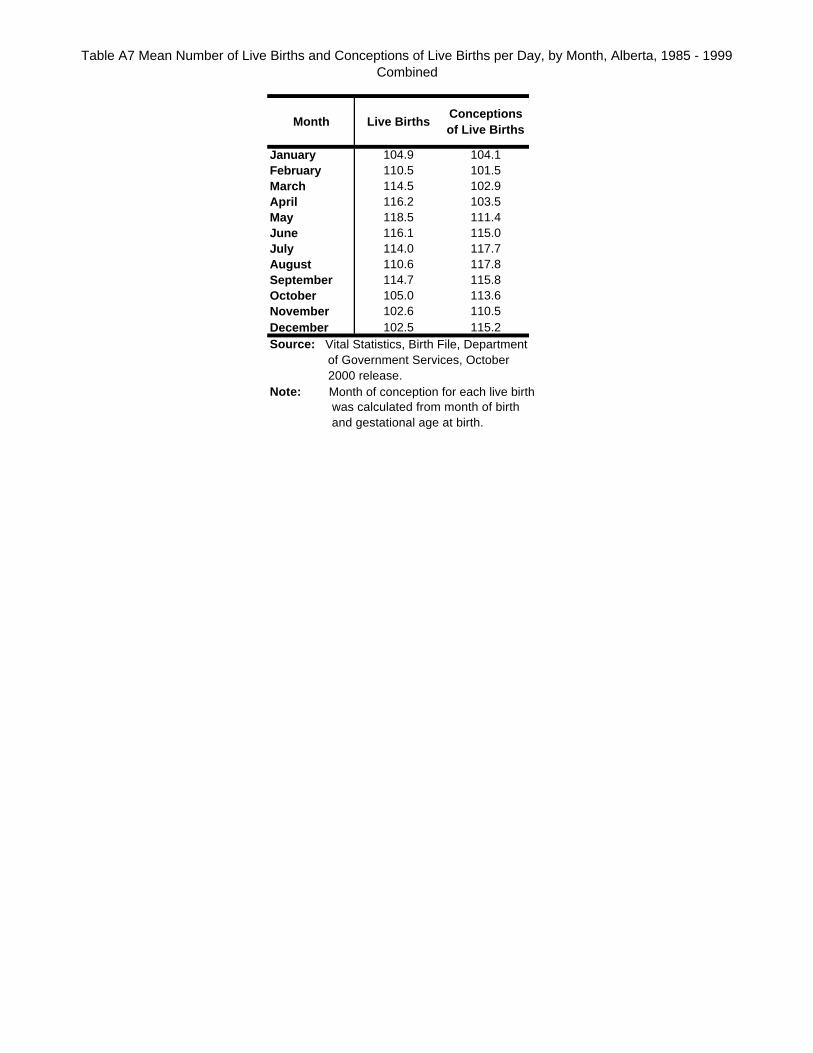
Table A7 Mean Number of Live Births and Conceptions of Live Births per Day, by Month, Alberta, 1985 - 1999 Combined
Month Live BirthsConceptions of Live Births
January 104.9 104.1February 110.5 101.5March 114.5 102.9April 116.2 103.5May 118.5 111.4June 116.1 115.0July 114.0 117.7August 110.6 117.8September 114.7 115.8October 105.0 113.6November 102.6 110.5December 102.5 115.2Source: Vital Statistics, Birth File, Department of Government Services, October 2000 release.Note: Month of conception for each live birth was calculated from month of birth and gestational age at birth.
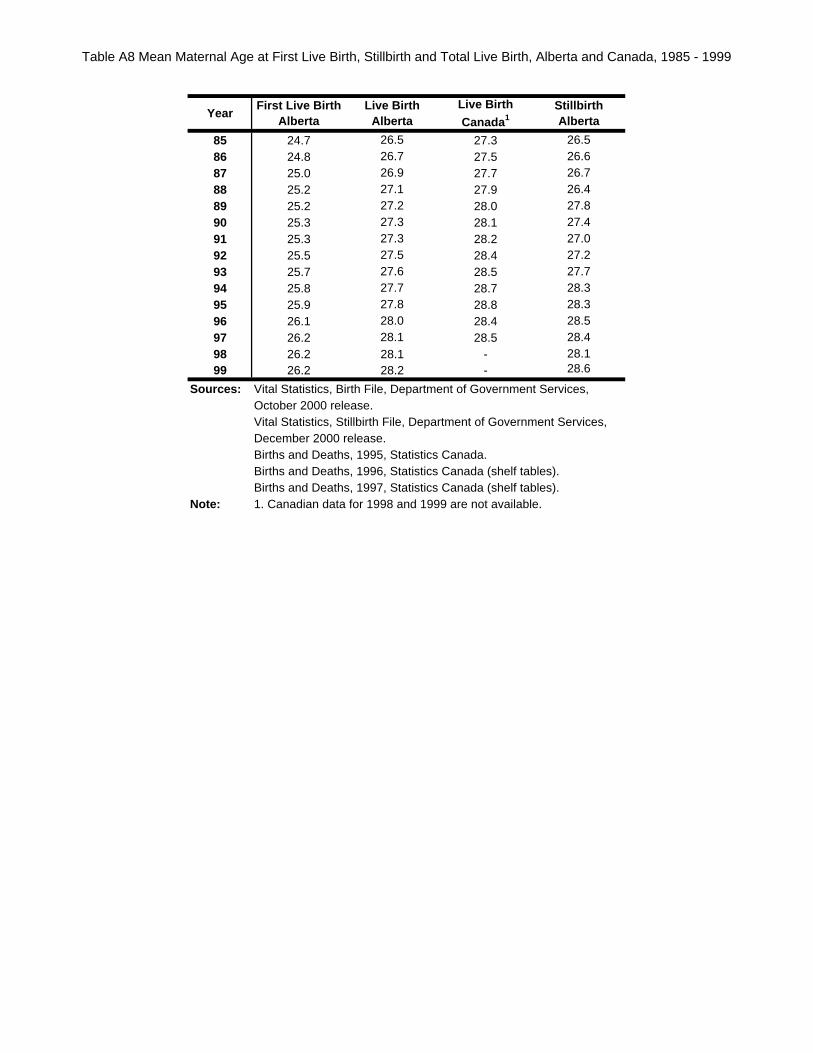
Table A8 Mean Maternal Age at First Live Birth, Stillbirth and Total Live Birth, Alberta and Canada, 1985 - 1999
85 24.7 26.5 27.3 26.586 24.8 26.7 27.5 26.687 25.0 26.9 27.7 26.788 25.2 27.1 27.9 26.489 25.2 27.2 28.0 27.890 25.3 27.3 28.1 27.491 25.3 27.3 28.2 27.092 25.5 27.5 28.4 27.293 25.7 27.6 28.5 27.794 25.8 27.7 28.7 28.395 25.9 27.8 28.8 28.396 26.1 28.0 28.4 28.597 26.2 28.1 28.5 28.498 26.2 28.1 - 28.199 26.2 28.2 - 28.6
Sources: Vital Statistics, Birth File, Department of Government Services, October 2000 release.Vital Statistics, Stillbirth File, Department of Government Services, December 2000 release.Births and Deaths, 1995, Statistics Canada.Births and Deaths, 1996, Statistics Canada (shelf tables).Births and Deaths, 1997, Statistics Canada (shelf tables).
Note: 1. Canadian data for 1998 and 1999 are not available.
Stillbirth Alberta
YearFirst Live Birth
AlbertaLive Birth
AlbertaLive Birth
Canada1
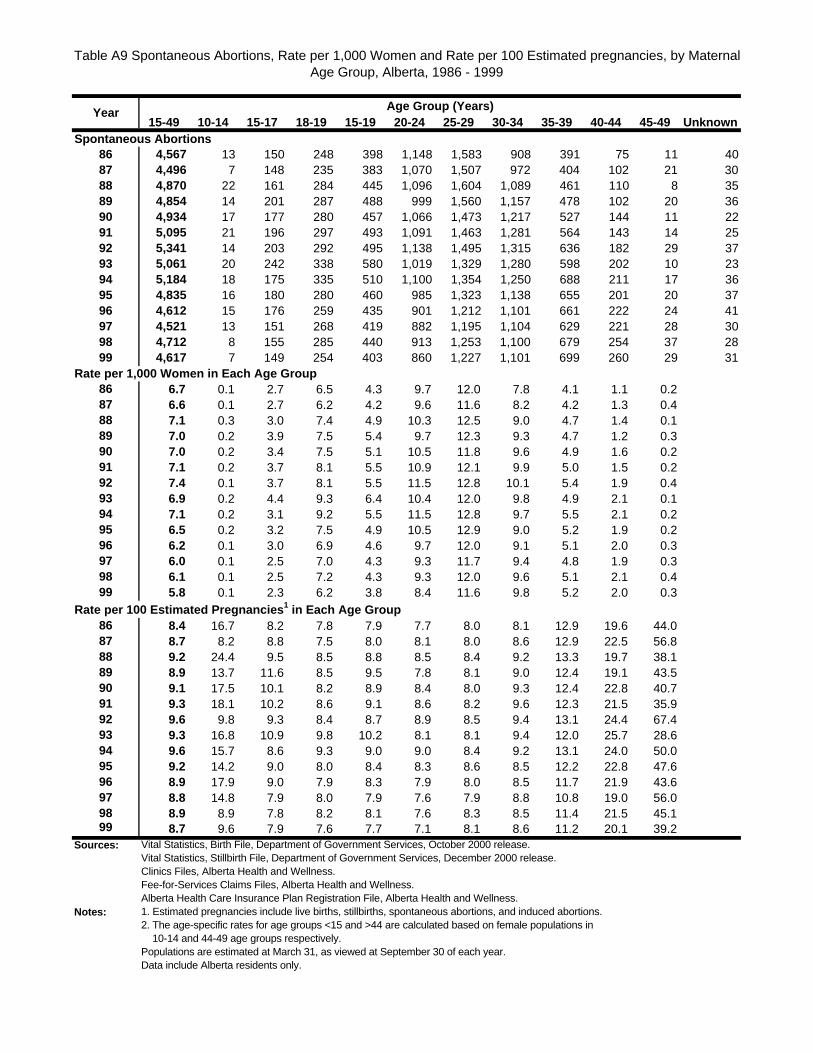
Table A9 Spontaneous Abortions, Rate per 1,000 Women and Rate per 100 Estimated pregnancies, by Maternal Age Group, Alberta, 1986 - 1999
15-49 10-14 15-17 18-19 15-19 20-24 25-29 30-34 35-39 40-44 45-49 UnknownSpontaneous Abortions
86 4,567 13 150 248 398 1,148 1,583 908 391 75 11 40 87 4,496 7 148 235 383 1,070 1,507 972 404 102 21 30 88 4,870 22 161 284 445 1,096 1,604 1,089 461 110 8 35 89 4,854 14 201 287 488 999 1,560 1,157 478 102 20 36 90 4,934 17 177 280 457 1,066 1,473 1,217 527 144 11 22 91 5,095 21 196 297 493 1,091 1,463 1,281 564 143 14 25 92 5,341 14 203 292 495 1,138 1,495 1,315 636 182 29 37 93 5,061 20 242 338 580 1,019 1,329 1,280 598 202 10 23 94 5,184 18 175 335 510 1,100 1,354 1,250 688 211 17 36 95 4,835 16 180 280 460 985 1,323 1,138 655 201 20 37 96 4,612 15 176 259 435 901 1,212 1,101 661 222 24 41 97 4,521 13 151 268 419 882 1,195 1,104 629 221 28 30 98 4,712 8 155 285 440 913 1,253 1,100 679 254 37 28 99 4,617 7 149 254 403 860 1,227 1,101 699 260 29 31
Rate per 1,000 Women in Each Age Group86 6.7 0.1 2.7 6.5 4.3 9.7 12.0 7.8 4.1 1.1 0.287 6.6 0.1 2.7 6.2 4.2 9.6 11.6 8.2 4.2 1.3 0.488 7.1 0.3 3.0 7.4 4.9 10.3 12.5 9.0 4.7 1.4 0.189 7.0 0.2 3.9 7.5 5.4 9.7 12.3 9.3 4.7 1.2 0.390 7.0 0.2 3.4 7.5 5.1 10.5 11.8 9.6 4.9 1.6 0.291 7.1 0.2 3.7 8.1 5.5 10.9 12.1 9.9 5.0 1.5 0.292 7.4 0.1 3.7 8.1 5.5 11.5 12.8 10.1 5.4 1.9 0.493 6.9 0.2 4.4 9.3 6.4 10.4 12.0 9.8 4.9 2.1 0.194 7.1 0.2 3.1 9.2 5.5 11.5 12.8 9.7 5.5 2.1 0.295 6.5 0.2 3.2 7.5 4.9 10.5 12.9 9.0 5.2 1.9 0.296 6.2 0.1 3.0 6.9 4.6 9.7 12.0 9.1 5.1 2.0 0.397 6.0 0.1 2.5 7.0 4.3 9.3 11.7 9.4 4.8 1.9 0.398 6.1 0.1 2.5 7.2 4.3 9.3 12.0 9.6 5.1 2.1 0.499 5.8 0.1 2.3 6.2 3.8 8.4 11.6 9.8 5.2 2.0 0.3
Rate per 100 Estimated Pregnancies 1 in Each Age Group86 8.4 16.7 8.2 7.8 7.9 7.7 8.0 8.1 12.9 19.6 44.087 8.7 8.2 8.8 7.5 8.0 8.1 8.0 8.6 12.9 22.5 56.888 9.2 24.4 9.5 8.5 8.8 8.5 8.4 9.2 13.3 19.7 38.189 8.9 13.7 11.6 8.5 9.5 7.8 8.1 9.0 12.4 19.1 43.590 9.1 17.5 10.1 8.2 8.9 8.4 8.0 9.3 12.4 22.8 40.791 9.3 18.1 10.2 8.6 9.1 8.6 8.2 9.6 12.3 21.5 35.992 9.6 9.8 9.3 8.4 8.7 8.9 8.5 9.4 13.1 24.4 67.493 9.3 16.8 10.9 9.8 10.2 8.1 8.1 9.4 12.0 25.7 28.694 9.6 15.7 8.6 9.3 9.0 9.0 8.4 9.2 13.1 24.0 50.095 9.2 14.2 9.0 8.0 8.4 8.3 8.6 8.5 12.2 22.8 47.696 8.9 17.9 9.0 7.9 8.3 7.9 8.0 8.5 11.7 21.9 43.697 8.8 14.8 7.9 8.0 7.9 7.6 7.9 8.8 10.8 19.0 56.098 8.9 8.9 7.8 8.2 8.1 7.6 8.3 8.5 11.4 21.5 45.199 8.7 9.6 7.9 7.6 7.7 7.1 8.1 8.6 11.2 20.1 39.2
Sources: Vital Statistics, Birth File, Department of Government Services, October 2000 release.Vital Statistics, Stillbirth File, Department of Government Services, December 2000 release.Clinics Files, Alberta Health and Wellness.Fee-for-Services Claims Files, Alberta Health and Wellness.Alberta Health Care Insurance Plan Registration File, Alberta Health and Wellness.
Notes: 1. Estimated pregnancies include live births, stillbirths, spontaneous abortions, and induced abortions.2. The age-specific rates for age groups <15 and >44 are calculated based on female populations in 10-14 and 44-49 age groups respectively.Populations are estimated at March 31, as viewed at September 30 of each year. Data include Alberta residents only.
Age Group (Years)Year
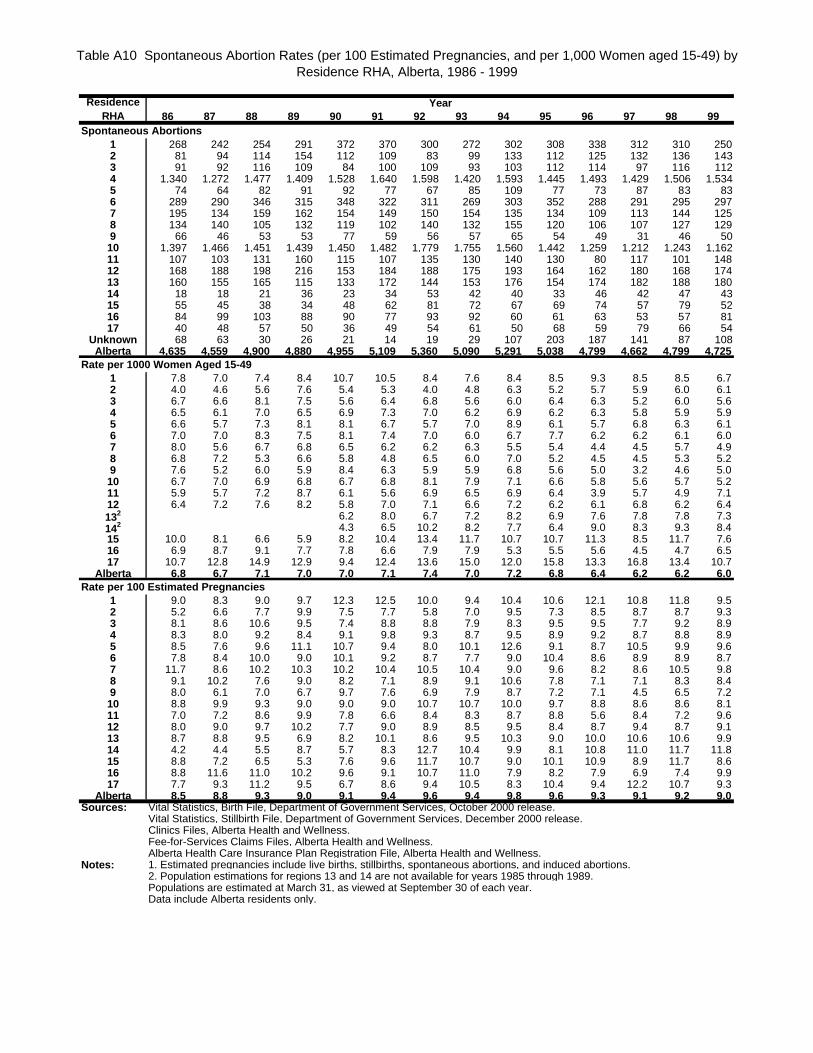
Table A10 Spontaneous Abortion Rates (per 100 Estimated Pregnancies, and per 1,000 Women aged 15-49) by Residence RHA, Alberta, 1986 - 1999
86 87 88 89 90 91 92 93 94 95 96 97 98 99Spontaneous Abortions
1 268 242 254 291 372 370 300 272 302 308 338 312 310 250 2 81 94 114 154 112 109 83 99 133 112 125 132 136 143 3 91 92 116 109 84 100 109 93 103 112 114 97 116 112 4 1,340 1,272 1,477 1,409 1,528 1,640 1,598 1,420 1,593 1,445 1,493 1,429 1,506 1,534 5 74 64 82 91 92 77 67 85 109 77 73 87 83 83 6 289 290 346 315 348 322 311 269 303 352 288 291 295 297 7 195 134 159 162 154 149 150 154 135 134 109 113 144 125 8 134 140 105 132 119 102 140 132 155 120 106 107 127 129 9 66 46 53 53 77 59 56 57 65 54 49 31 46 50 10 1,397 1,466 1,451 1,439 1,450 1,482 1,779 1,755 1,560 1,442 1,259 1,212 1,243 1,162 11 107 103 131 160 115 107 135 130 140 130 80 117 101 148 12 168 188 198 216 153 184 188 175 193 164 162 180 168 174 13 160 155 165 115 133 172 144 153 176 154 174 182 188 180 14 18 18 21 36 23 34 53 42 40 33 46 42 47 43 15 55 45 38 34 48 62 81 72 67 69 74 57 79 52 16 84 99 103 88 90 77 93 92 60 61 63 53 57 81 17 40 48 57 50 36 49 54 61 50 68 59 79 66 54
Unknown 68 63 30 26 21 14 19 29 107 203 187 141 87 108 Alberta 4 ,635 4,559 4,900 4,880 4,955 5,109 5,360 5,090 5,291 5,038 4,799 4,662 4,799 4,725
Rate per 1000 Women Aged 15-491 7.8 7.0 7.4 8.4 10.7 10.5 8.4 7.6 8.4 8.5 9.3 8.5 8.5 6.72 4.0 4.6 5.6 7.6 5.4 5.3 4.0 4.8 6.3 5.2 5.7 5.9 6.0 6.13 6.7 6.6 8.1 7.5 5.6 6.4 6.8 5.6 6.0 6.4 6.3 5.2 6.0 5.64 6.5 6.1 7.0 6.5 6.9 7.3 7.0 6.2 6.9 6.2 6.3 5.8 5.9 5.95 6.6 5.7 7.3 8.1 8.1 6.7 5.7 7.0 8.9 6.1 5.7 6.8 6.3 6.16 7.0 7.0 8.3 7.5 8.1 7.4 7.0 6.0 6.7 7.7 6.2 6.2 6.1 6.07 8.0 5.6 6.7 6.8 6.5 6.2 6.2 6.3 5.5 5.4 4.4 4.5 5.7 4.98 6.8 7.2 5.3 6.6 5.8 4.8 6.5 6.0 7.0 5.2 4.5 4.5 5.3 5.29 7.6 5.2 6.0 5.9 8.4 6.3 5.9 5.9 6.8 5.6 5.0 3.2 4.6 5.010 6.7 7.0 6.9 6.8 6.7 6.8 8.1 7.9 7.1 6.6 5.8 5.6 5.7 5.211 5.9 5.7 7.2 8.7 6.1 5.6 6.9 6.5 6.9 6.4 3.9 5.7 4.9 7.112 6.4 7.2 7.6 8.2 5.8 7.0 7.1 6.6 7.2 6.2 6.1 6.8 6.2 6.4132 6.2 8.0 6.7 7.2 8.2 6.9 7.6 7.8 7.8 7.3142 4.3 6.5 10.2 8.2 7.7 6.4 9.0 8.3 9.3 8.415 10.0 8.1 6.6 5.9 8.2 10.4 13.4 11.7 10.7 10.7 11.3 8.5 11.7 7.616 6.9 8.7 9.1 7.7 7.8 6.6 7.9 7.9 5.3 5.5 5.6 4.5 4.7 6.517 10.7 12.8 14.9 12.9 9.4 12.4 13.6 15.0 12.0 15.8 13.3 16.8 13.4 10.7
Alberta 6.8 6.7 7.1 7.0 7.0 7.1 7.4 7.0 7.2 6.8 6.4 6.2 6.2 6.0Rate per 100 Estimated Pregnancies
1 9.0 8.3 9.0 9.7 12.3 12.5 10.0 9.4 10.4 10.6 12.1 10.8 11.8 9.52 5.2 6.6 7.7 9.9 7.5 7.7 5.8 7.0 9.5 7.3 8.5 8.7 8.7 9.33 8.1 8.6 10.6 9.5 7.4 8.8 8.8 7.9 8.3 9.5 9.5 7.7 9.2 8.94 8.3 8.0 9.2 8.4 9.1 9.8 9.3 8.7 9.5 8.9 9.2 8.7 8.8 8.95 8.5 7.6 9.6 11.1 10.7 9.4 8.0 10.1 12.6 9.1 8.7 10.5 9.9 9.66 7.8 8.4 10.0 9.0 10.1 9.2 8.7 7.7 9.0 10.4 8.6 8.9 8.9 8.77 11.7 8.6 10.2 10.3 10.2 10.4 10.5 10.4 9.0 9.6 8.2 8.6 10.5 9.88 9.1 10.2 7.6 9.0 8.2 7.1 8.9 9.1 10.6 7.8 7.1 7.1 8.3 8.49 8.0 6.1 7.0 6.7 9.7 7.6 6.9 7.9 8.7 7.2 7.1 4.5 6.5 7.210 8.8 9.9 9.3 9.0 9.0 9.0 10.7 10.7 10.0 9.7 8.8 8.6 8.6 8.111 7.0 7.2 8.6 9.9 7.8 6.6 8.4 8.3 8.7 8.8 5.6 8.4 7.2 9.612 8.0 9.0 9.7 10.2 7.7 9.0 8.9 8.5 9.5 8.4 8.7 9.4 8.7 9.113 8.7 8.8 9.5 6.9 8.2 10.1 8.6 9.5 10.3 9.0 10.0 10.6 10.6 9.914 4.2 4.4 5.5 8.7 5.7 8.3 12.7 10.4 9.9 8.1 10.8 11.0 11.7 11.815 8.8 7.2 6.5 5.3 7.6 9.6 11.7 10.7 9.0 10.1 10.9 8.9 11.7 8.616 8.8 11.6 11.0 10.2 9.6 9.1 10.7 11.0 7.9 8.2 7.9 6.9 7.4 9.917 7.7 9.3 11.2 9.5 6.7 8.6 9.4 10.5 8.3 10.4 9.4 12.2 10.7 9.3
Alberta 8.5 8.8 9.3 9.0 9.1 9.4 9.6 9.4 9.8 9.6 9.3 9.1 9.2 9.0Sources: Vital Statistics, Birth File, Department of Government Services, October 2000 release.
Vital Statistics, Stillbirth File, Department of Government Services, December 2000 release.Clinics Files, Alberta Health and Wellness.Fee-for-Services Claims Files, Alberta Health and Wellness.Alberta Health Care Insurance Plan Registration File, Alberta Health and Wellness.
Notes: 1. Estimated pregnancies include live births, stillbirths, spontaneous abortions, and induced abortions.2. Population estimations for regions 13 and 14 are not available for years 1985 through 1989.Populations are estimated at March 31, as viewed at September 30 of each year. Data include Alberta residents only.
Residence RHA
Year
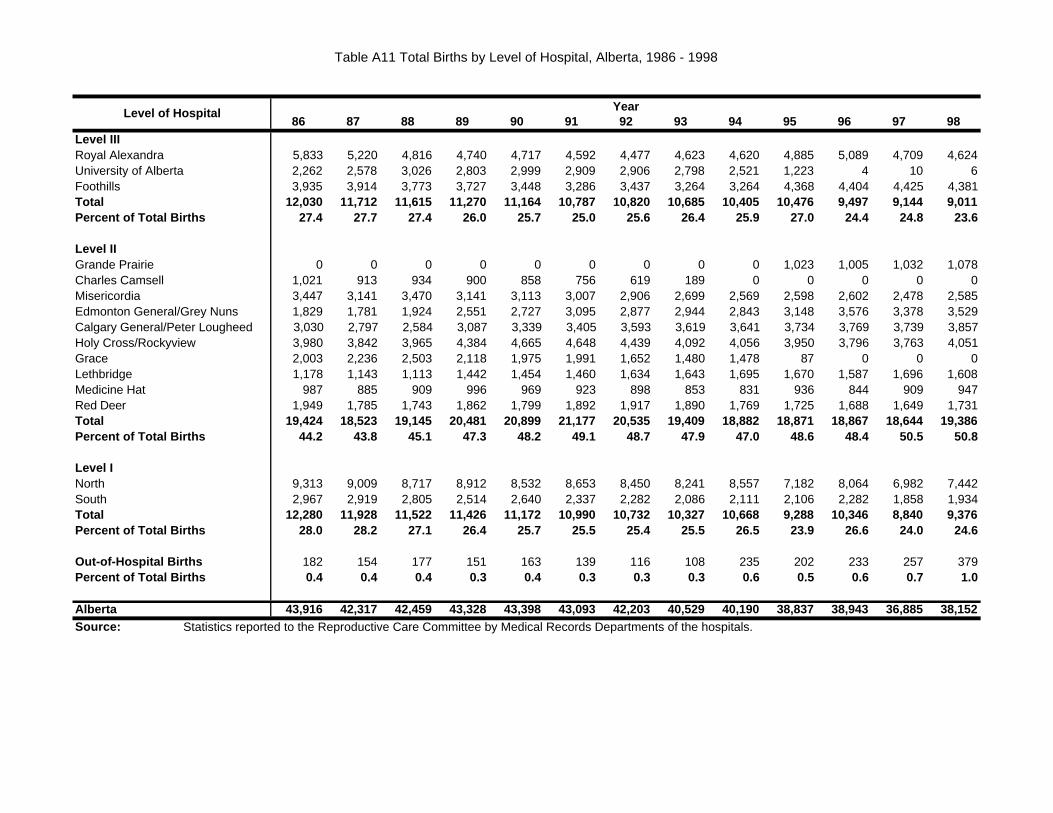
Table A11 Total Births by Level of Hospital, Alberta, 1986 - 1998
86 87 88 89 90 91 92 93 94 95 96 97 98Level IIIRoyal Alexandra 5,833 5,220 4,816 4,740 4,717 4,592 4,477 4,623 4,620 4,885 5,089 4,709 4,624University of Alberta 2,262 2,578 3,026 2,803 2,999 2,909 2,906 2,798 2,521 1,223 4 10 6Foothills 3,935 3,914 3,773 3,727 3,448 3,286 3,437 3,264 3,264 4,368 4,404 4,425 4,381Total 12,030 11,712 11,615 11,270 11,164 10,787 10,820 10,685 10,405 10,476 9,497 9,144 9,011Percent of Total Births 27.4 27.7 27.4 26.0 25.7 25.0 25.6 26.4 25.9 27.0 24.4 24.8 23.6
Level IIGrande Prairie 0 0 0 0 0 0 0 0 0 1,023 1,005 1,032 1,078Charles Camsell 1,021 913 934 900 858 756 619 189 0 0 0 0 0Misericordia 3,447 3,141 3,470 3,141 3,113 3,007 2,906 2,699 2,569 2,598 2,602 2,478 2,585Edmonton General/Grey Nuns 1,829 1,781 1,924 2,551 2,727 3,095 2,877 2,944 2,843 3,148 3,576 3,378 3,529Calgary General/Peter Lougheed 3,030 2,797 2,584 3,087 3,339 3,405 3,593 3,619 3,641 3,734 3,769 3,739 3,857Holy Cross/Rockyview 3,980 3,842 3,965 4,384 4,665 4,648 4,439 4,092 4,056 3,950 3,796 3,763 4,051Grace 2,003 2,236 2,503 2,118 1,975 1,991 1,652 1,480 1,478 87 0 0 0Lethbridge 1,178 1,143 1,113 1,442 1,454 1,460 1,634 1,643 1,695 1,670 1,587 1,696 1,608Medicine Hat 987 885 909 996 969 923 898 853 831 936 844 909 947Red Deer 1,949 1,785 1,743 1,862 1,799 1,892 1,917 1,890 1,769 1,725 1,688 1,649 1,731Total 19,424 18,523 19,145 20,481 20,899 21,177 20,535 19,409 18,882 18,871 18,867 18,644 19,386Percent of Total Births 44.2 43.8 45.1 47.3 48.2 49.1 48.7 47.9 47.0 48.6 48.4 50.5 50.8
Level INorth 9,313 9,009 8,717 8,912 8,532 8,653 8,450 8,241 8,557 7,182 8,064 6,982 7,442South 2,967 2,919 2,805 2,514 2,640 2,337 2,282 2,086 2,111 2,106 2,282 1,858 1,934Total 12,280 11,928 11,522 11,426 11,172 10,990 10,732 10,327 10,668 9,288 10,346 8,840 9,376Percent of Total Births 28.0 28.2 27.1 26.4 25.7 25.5 25.4 25.5 26.5 23.9 26.6 24.0 24.6
Out-of-Hospital Births 182 154 177 151 163 139 116 108 235 202 233 257 379Percent of Total Births 0.4 0.4 0.4 0.3 0.4 0.3 0.3 0.3 0.6 0.5 0.6 0.7 1.0
Alberta 43,916 42,317 42,459 43,328 43,398 43,093 42,203 40,529 40,190 38,837 38,943 36,885 38,152Source: Statistics reported to the Reproductive Care Committee by Medical Records Departments of the hospitals.
YearLevel of Hospital
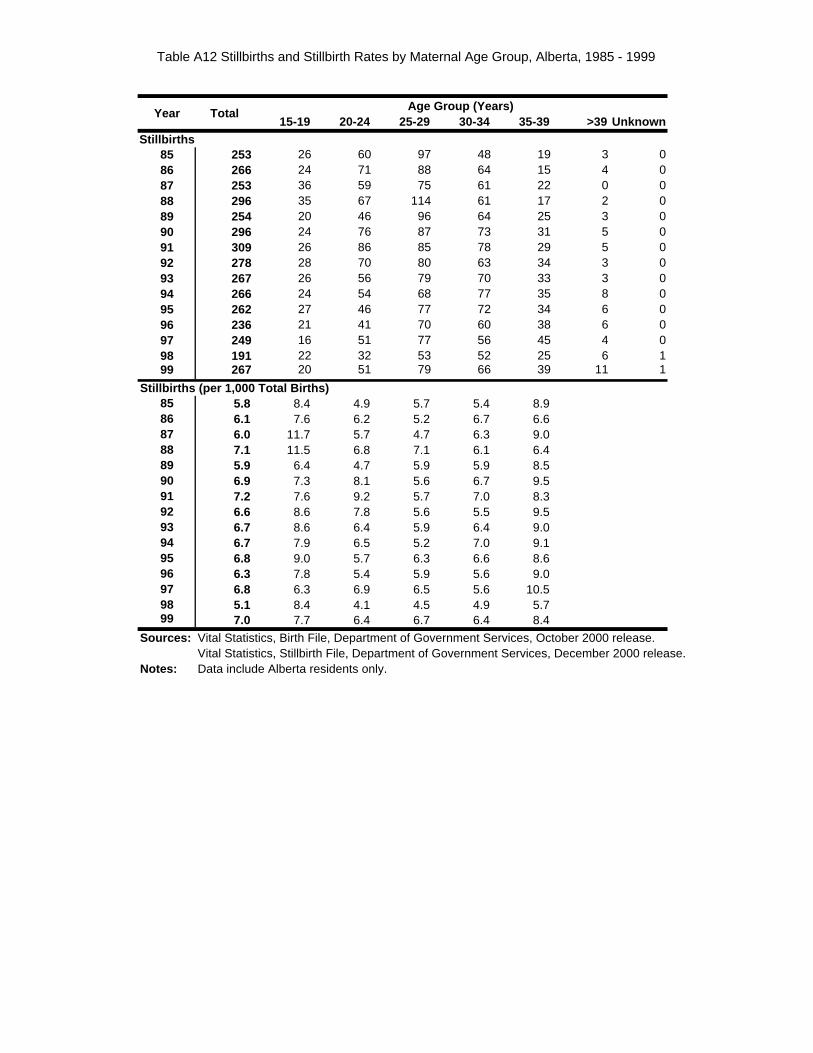
Table A12 Stillbirths and Stillbirth Rates by Maternal Age Group, Alberta, 1985 - 1999
15-19 20-24 25-29 30-34 35-39 >39 UnknownStillbirths
85 253 26 60 97 48 19 3 086 266 24 71 88 64 15 4 087 253 36 59 75 61 22 0 088 296 35 67 114 61 17 2 089 254 20 46 96 64 25 3 090 296 24 76 87 73 31 5 091 309 26 86 85 78 29 5 092 278 28 70 80 63 34 3 093 267 26 56 79 70 33 3 094 266 24 54 68 77 35 8 095 262 27 46 77 72 34 6 096 236 21 41 70 60 38 6 097 249 16 51 77 56 45 4 098 191 22 32 53 52 25 6 199 267 20 51 79 66 39 11 1
Stillbirths (per 1,000 Total Births)85 5.8 8.4 4.9 5.7 5.4 8.986 6.1 7.6 6.2 5.2 6.7 6.687 6.0 11.7 5.7 4.7 6.3 9.088 7.1 11.5 6.8 7.1 6.1 6.489 5.9 6.4 4.7 5.9 5.9 8.590 6.9 7.3 8.1 5.6 6.7 9.591 7.2 7.6 9.2 5.7 7.0 8.392 6.6 8.6 7.8 5.6 5.5 9.593 6.7 8.6 6.4 5.9 6.4 9.094 6.7 7.9 6.5 5.2 7.0 9.195 6.8 9.0 5.7 6.3 6.6 8.696 6.3 7.8 5.4 5.9 5.6 9.097 6.8 6.3 6.9 6.5 5.6 10.598 5.1 8.4 4.1 4.5 4.9 5.799 7.0 7.7 6.4 6.7 6.4 8.4
Sources: Vital Statistics, Birth File, Department of Government Services, October 2000 release.Vital Statistics, Stillbirth File, Department of Government Services, December 2000 release.
Notes: Data include Alberta residents only.
YearAge Group (Years)
Total
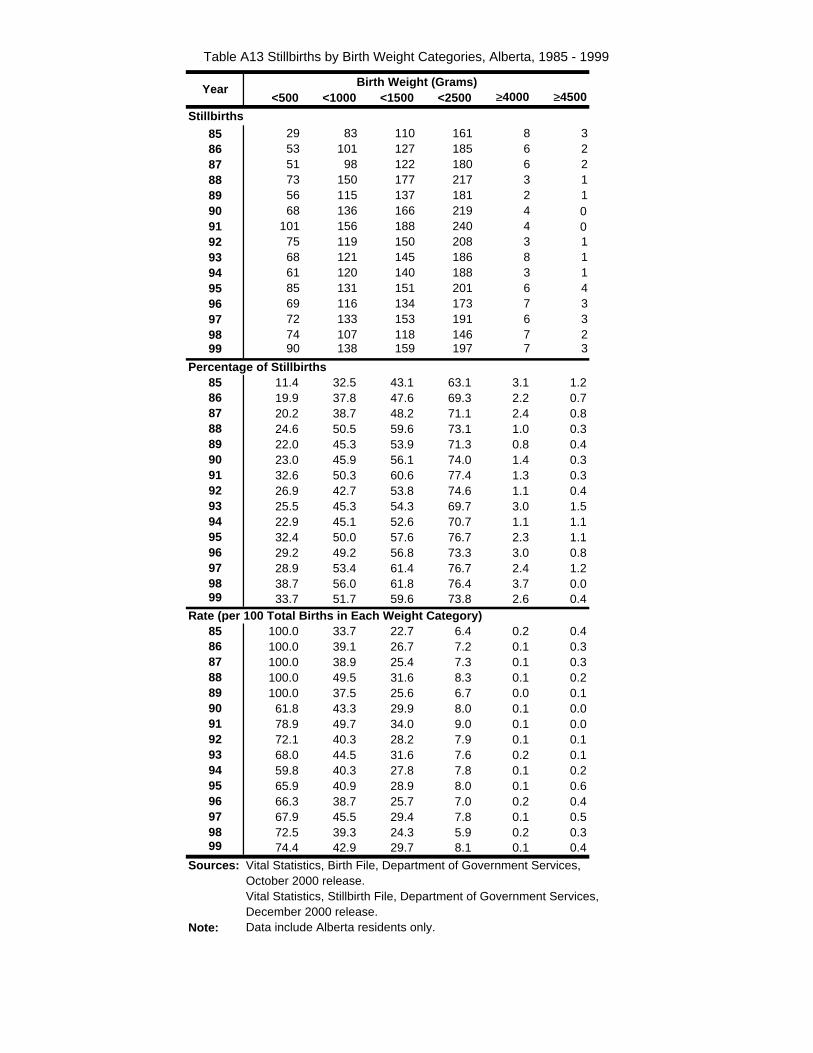
Table A13 Stillbirths by Birth Weight Categories, Alberta, 1985 - 1999
<500 <1000 <1500 <2500 ≥4000 ≥4500
Stillbirths85 29 83 110 161 8 386 53 101 127 185 6 287 51 98 122 180 6 288 73 150 177 217 3 189 56 115 137 181 2 190 68 136 166 219 4 091 101 156 188 240 4 092 75 119 150 208 3 193 68 121 145 186 8 194 61 120 140 188 3 195 85 131 151 201 6 496 69 116 134 173 7 397 72 133 153 191 6 398 74 107 118 146 7 299 90 138 159 197 7 3
Percentage of Stillbirths85 11.4 32.5 43.1 63.1 3.1 1.286 19.9 37.8 47.6 69.3 2.2 0.787 20.2 38.7 48.2 71.1 2.4 0.888 24.6 50.5 59.6 73.1 1.0 0.389 22.0 45.3 53.9 71.3 0.8 0.490 23.0 45.9 56.1 74.0 1.4 0.391 32.6 50.3 60.6 77.4 1.3 0.392 26.9 42.7 53.8 74.6 1.1 0.493 25.5 45.3 54.3 69.7 3.0 1.594 22.9 45.1 52.6 70.7 1.1 1.195 32.4 50.0 57.6 76.7 2.3 1.196 29.2 49.2 56.8 73.3 3.0 0.897 28.9 53.4 61.4 76.7 2.4 1.298 38.7 56.0 61.8 76.4 3.7 0.099 33.7 51.7 59.6 73.8 2.6 0.4
Rate (per 100 Total Births in Each Weight Category)85 100.0 33.7 22.7 6.4 0.2 0.486 100.0 39.1 26.7 7.2 0.1 0.387 100.0 38.9 25.4 7.3 0.1 0.388 100.0 49.5 31.6 8.3 0.1 0.289 100.0 37.5 25.6 6.7 0.0 0.190 61.8 43.3 29.9 8.0 0.1 0.091 78.9 49.7 34.0 9.0 0.1 0.092 72.1 40.3 28.2 7.9 0.1 0.193 68.0 44.5 31.6 7.6 0.2 0.194 59.8 40.3 27.8 7.8 0.1 0.295 65.9 40.9 28.9 8.0 0.1 0.696 66.3 38.7 25.7 7.0 0.2 0.497 67.9 45.5 29.4 7.8 0.1 0.598 72.5 39.3 24.3 5.9 0.2 0.399 74.4 42.9 29.7 8.1 0.1 0.4
Sources: Vital Statistics, Birth File, Department of Government Services, October 2000 release.Vital Statistics, Stillbirth File, Department of Government Services, December 2000 release.
Note: Data include Alberta residents only.
YearBirth Weight (Grams)
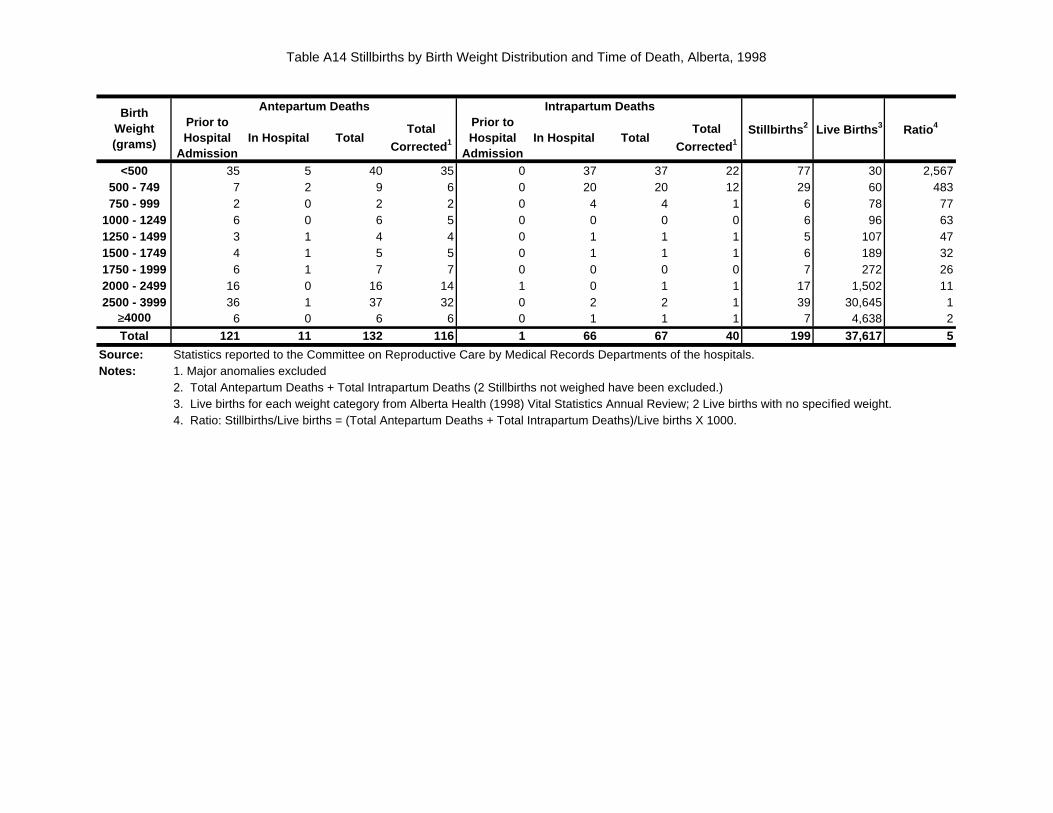
Table A14 Stillbirths by Birth Weight Distribution and Time of Death, Alberta, 1998
Prior to Hospital
AdmissionIn Hospital Total
Total
Corrected 1
Prior to Hospital
AdmissionIn Hospital Total
Total
Corrected 1
<500 35 5 40 35 0 37 37 22 77 30 2,567500 - 749 7 2 9 6 0 20 20 12 29 60 483750 - 999 2 0 2 2 0 4 4 1 6 78 77
1000 - 1249 6 0 6 5 0 0 0 0 6 96 631250 - 1499 3 1 4 4 0 1 1 1 5 107 471500 - 1749 4 1 5 5 0 1 1 1 6 189 321750 - 1999 6 1 7 7 0 0 0 0 7 272 262000 - 2499 16 0 16 14 1 0 1 1 17 1,502 112500 - 3999 36 1 37 32 0 2 2 1 39 30,645 1
≥4000 6 0 6 6 0 1 1 1 7 4,638 2
Total 121 11 132 116 1 66 67 40 199 37,617 5
Source: Statistics reported to the Committee on Reproductive Care by Medical Records Departments of the hospitals.Notes: 1. Major anomalies excluded
2. Total Antepartum Deaths + Total Intrapartum Deaths (2 Stillbirths not weighed have been excluded.)3. Live births for each weight category from Alberta Health (1998) Vital Statistics Annual Review; 2 Live births with no specified weight.4. Ratio: Stillbirths/Live births = (Total Antepartum Deaths + Total Intrapartum Deaths)/Live births X 1000.
Birth Weight (grams)
Ratio 4
Antepartum Deaths Intrapartum Deaths
Stillbirths 2 Live Births 3
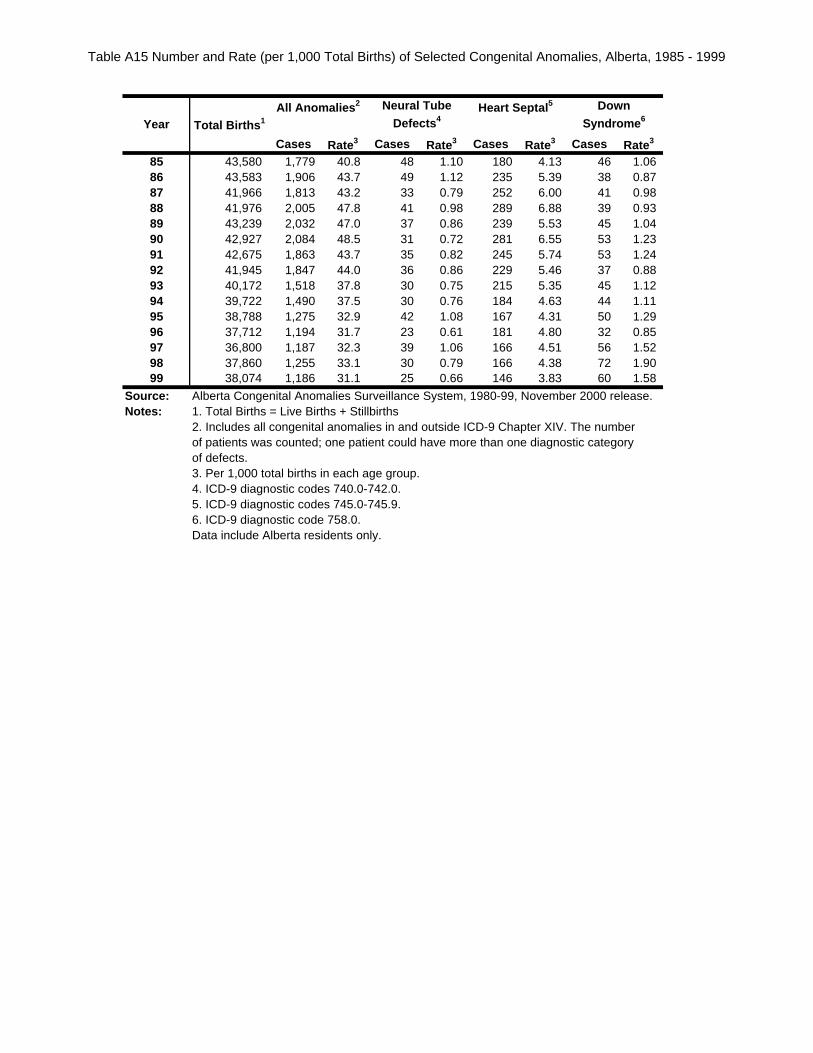
Table A15 Number and Rate (per 1,000 Total Births) of Selected Congenital Anomalies, Alberta, 1985 - 1999
Cases Rate3 Cases Rate3 Cases Rate3 Cases Rate3
85 43,580 1,779 40.8 48 1.10 180 4.13 46 1.0686 43,583 1,906 43.7 49 1.12 235 5.39 38 0.8787 41,966 1,813 43.2 33 0.79 252 6.00 41 0.9888 41,976 2,005 47.8 41 0.98 289 6.88 39 0.9389 43,239 2,032 47.0 37 0.86 239 5.53 45 1.0490 42,927 2,084 48.5 31 0.72 281 6.55 53 1.2391 42,675 1,863 43.7 35 0.82 245 5.74 53 1.2492 41,945 1,847 44.0 36 0.86 229 5.46 37 0.8893 40,172 1,518 37.8 30 0.75 215 5.35 45 1.1294 39,722 1,490 37.5 30 0.76 184 4.63 44 1.1195 38,788 1,275 32.9 42 1.08 167 4.31 50 1.2996 37,712 1,194 31.7 23 0.61 181 4.80 32 0.8597 36,800 1,187 32.3 39 1.06 166 4.51 56 1.5298 37,860 1,255 33.1 30 0.79 166 4.38 72 1.9099 38,074 1,186 31.1 25 0.66 146 3.83 60 1.58
Source: Alberta Congenital Anomalies Surveillance System, 1980-99, November 2000 release.Notes: 1. Total Births = Live Births + Stillbirths
2. Includes all congenital anomalies in and outside ICD-9 Chapter XIV. The number of patients was counted; one patient could have more than one diagnostic category of defects.3. Per 1,000 total births in each age group.4. ICD-9 diagnostic codes 740.0-742.0.5. ICD-9 diagnostic codes 745.0-745.9.6. ICD-9 diagnostic code 758.0.Data include Alberta residents only.
Year
Down
Syndrome 6Total Births 1
All Anomalies 2 Neural Tube
Defects 4Heart Septal 5
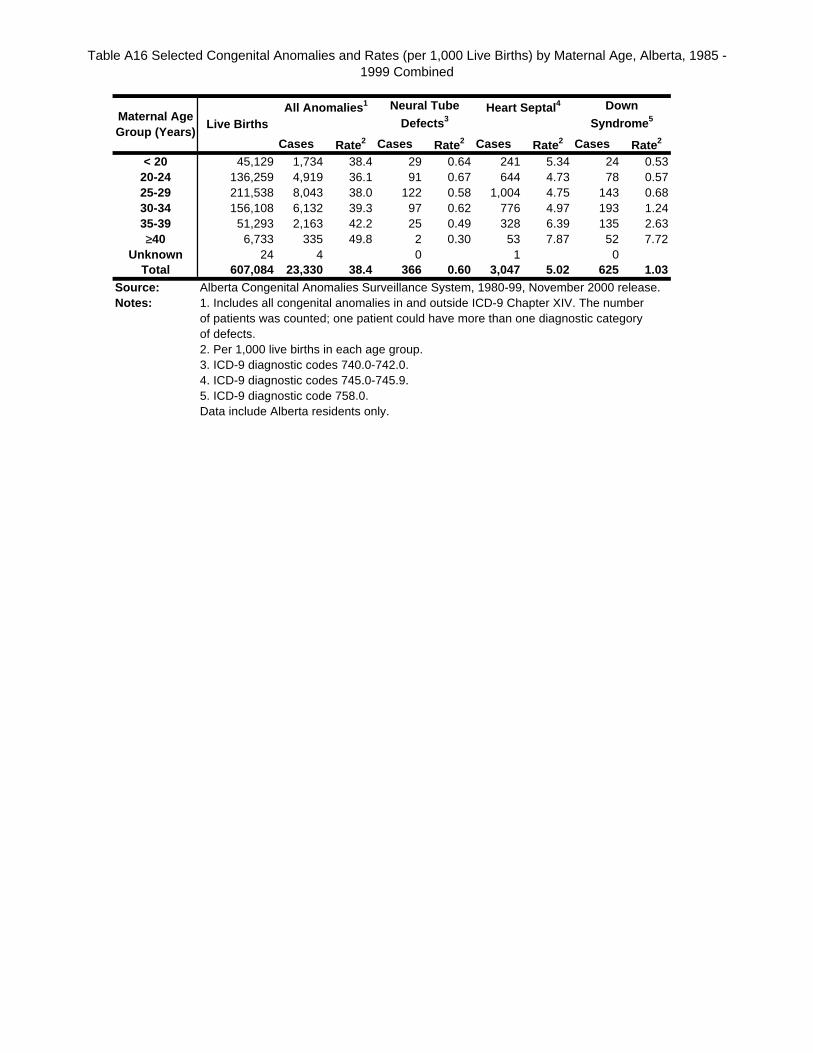
Table A16 Selected Congenital Anomalies and Rates (per 1,000 Live Births) by Maternal Age, Alberta, 1985 - 1999 Combined
Cases Rate2 Cases Rate2 Cases Rate2 Cases Rate2
< 20 45,129 1,734 38.4 29 0.64 241 5.34 24 0.5320-24 136,259 4,919 36.1 91 0.67 644 4.73 78 0.5725-29 211,538 8,043 38.0 122 0.58 1,004 4.75 143 0.6830-34 156,108 6,132 39.3 97 0.62 776 4.97 193 1.2435-39 51,293 2,163 42.2 25 0.49 328 6.39 135 2.63≥40 6,733 335 49.8 2 0.30 53 7.87 52 7.72
Unknown 24 4 0 1 0Total 607,084 23,330 38.4 366 0.60 3,047 5.02 625 1.03
Source: Alberta Congenital Anomalies Surveillance System, 1980-99, November 2000 release.Notes: 1. Includes all congenital anomalies in and outside ICD-9 Chapter XIV. The number
of patients was counted; one patient could have more than one diagnostic category of defects.2. Per 1,000 live births in each age group.3. ICD-9 diagnostic codes 740.0-742.0.4. ICD-9 diagnostic codes 745.0-745.9.5. ICD-9 diagnostic code 758.0.Data include Alberta residents only.
Maternal Age Group (Years)
Down
Syndrome 5Live BirthsAll Anomalies 1 Neural Tube
Defects 3Heart Septal 4
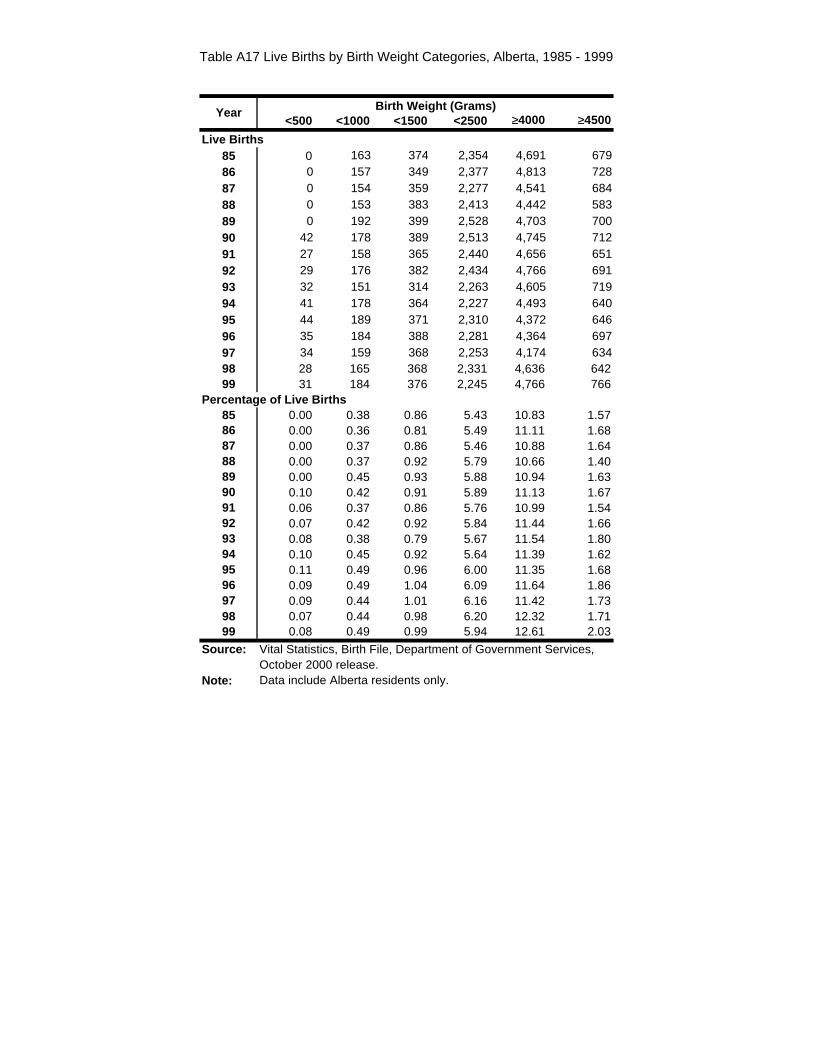
Table A17 Live Births by Birth Weight Categories, Alberta, 1985 - 1999
<500 <1000 <1500 <2500 ≥4000 ≥4500
Live Births85 0 163 374 2,354 4,691 67986 0 157 349 2,377 4,813 72887 0 154 359 2,277 4,541 68488 0 153 383 2,413 4,442 58389 0 192 399 2,528 4,703 70090 42 178 389 2,513 4,745 71291 27 158 365 2,440 4,656 65192 29 176 382 2,434 4,766 69193 32 151 314 2,263 4,605 71994 41 178 364 2,227 4,493 64095 44 189 371 2,310 4,372 64696 35 184 388 2,281 4,364 69797 34 159 368 2,253 4,174 63498 28 165 368 2,331 4,636 64299 31 184 376 2,245 4,766 766
Percentage of Live Births85 0.00 0.38 0.86 5.43 10.83 1.5786 0.00 0.36 0.81 5.49 11.11 1.6887 0.00 0.37 0.86 5.46 10.88 1.6488 0.00 0.37 0.92 5.79 10.66 1.4089 0.00 0.45 0.93 5.88 10.94 1.6390 0.10 0.42 0.91 5.89 11.13 1.6791 0.06 0.37 0.86 5.76 10.99 1.5492 0.07 0.42 0.92 5.84 11.44 1.6693 0.08 0.38 0.79 5.67 11.54 1.8094 0.10 0.45 0.92 5.64 11.39 1.6295 0.11 0.49 0.96 6.00 11.35 1.6896 0.09 0.49 1.04 6.09 11.64 1.8697 0.09 0.44 1.01 6.16 11.42 1.7398 0.07 0.44 0.98 6.20 12.32 1.7199 0.08 0.49 0.99 5.94 12.61 2.03
Source: Vital Statistics, Birth File, Department of Government Services, October 2000 release.
Note: Data include Alberta residents only.
Year Birth Weight (Grams)
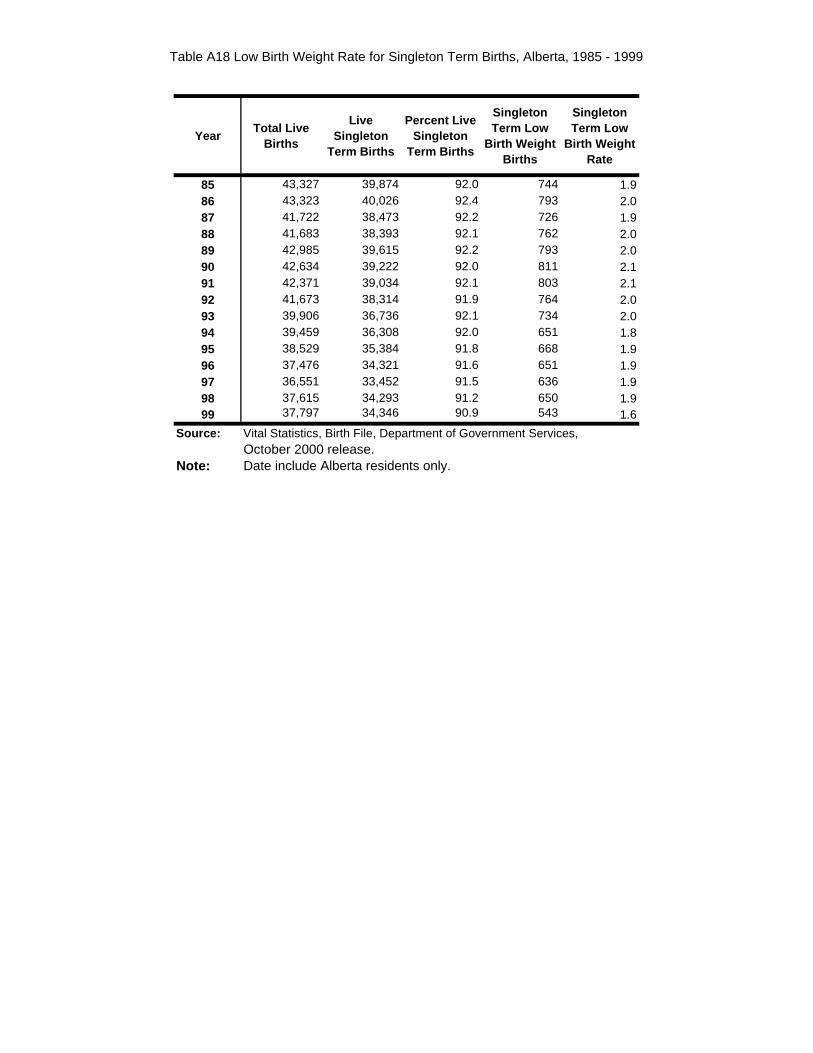
Table A18 Low Birth Weight Rate for Singleton Term Births, Alberta, 1985 - 1999
YearTotal Live
Births
Live Singleton
Term Births
Percent Live Singleton
Term Births
Singleton Term Low
Birth Weight Births
Singleton Term Low
Birth Weight Rate
85 43,327 39,874 92.0 744 1.986 43,323 40,026 92.4 793 2.087 41,722 38,473 92.2 726 1.988 41,683 38,393 92.1 762 2.089 42,985 39,615 92.2 793 2.090 42,634 39,222 92.0 811 2.191 42,371 39,034 92.1 803 2.192 41,673 38,314 91.9 764 2.093 39,906 36,736 92.1 734 2.094 39,459 36,308 92.0 651 1.895 38,529 35,384 91.8 668 1.996 37,476 34,321 91.6 651 1.997 36,551 33,452 91.5 636 1.998 37,615 34,293 91.2 650 1.999 37,797 34,346 90.9 543 1.6
Source: Vital Statistics, Birth File, Department of Government Services, October 2000 release.
Note: Date include Alberta residents only.
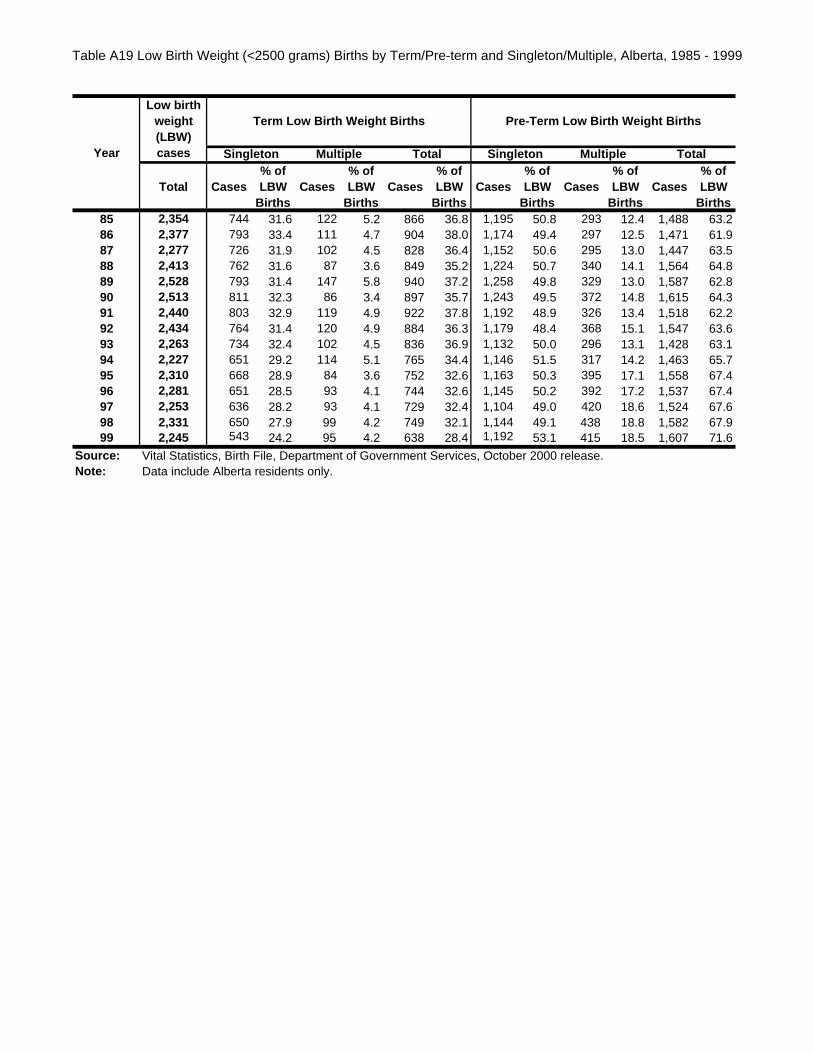
Table A19 Low Birth Weight (<2500 grams) Births by Term/Pre-term and Singleton/Multiple, Alberta, 1985 - 1999
Total Cases% of LBW
BirthsCases
% of LBW
BirthsCases
% of LBW
BirthsCases
% of LBW
BirthsCases
% of LBW
BirthsCases
% of LBW
Births85 2,354 744 31.6 122 5.2 866 36.8 1,195 50.8 293 12.4 1,488 63.286 2,377 793 33.4 111 4.7 904 38.0 1,174 49.4 297 12.5 1,471 61.987 2,277 726 31.9 102 4.5 828 36.4 1,152 50.6 295 13.0 1,447 63.588 2,413 762 31.6 87 3.6 849 35.2 1,224 50.7 340 14.1 1,564 64.889 2,528 793 31.4 147 5.8 940 37.2 1,258 49.8 329 13.0 1,587 62.890 2,513 811 32.3 86 3.4 897 35.7 1,243 49.5 372 14.8 1,615 64.391 2,440 803 32.9 119 4.9 922 37.8 1,192 48.9 326 13.4 1,518 62.292 2,434 764 31.4 120 4.9 884 36.3 1,179 48.4 368 15.1 1,547 63.693 2,263 734 32.4 102 4.5 836 36.9 1,132 50.0 296 13.1 1,428 63.194 2,227 651 29.2 114 5.1 765 34.4 1,146 51.5 317 14.2 1,463 65.795 2,310 668 28.9 84 3.6 752 32.6 1,163 50.3 395 17.1 1,558 67.496 2,281 651 28.5 93 4.1 744 32.6 1,145 50.2 392 17.2 1,537 67.497 2,253 636 28.2 93 4.1 729 32.4 1,104 49.0 420 18.6 1,524 67.698 2,331 650 27.9 99 4.2 749 32.1 1,144 49.1 438 18.8 1,582 67.999 2,245 543 24.2 95 4.2 638 28.4 1,192 53.1 415 18.5 1,607 71.6
Source: Vital Statistics, Birth File, Department of Government Services, October 2000 release.Note: Data include Alberta residents only.
Year Multiple Total
Pre-Term Low Birth Weight BirthsLow birth
weight (LBW) cases
Term Low Birth Weight Births
Singleton Multiple Total Singleton
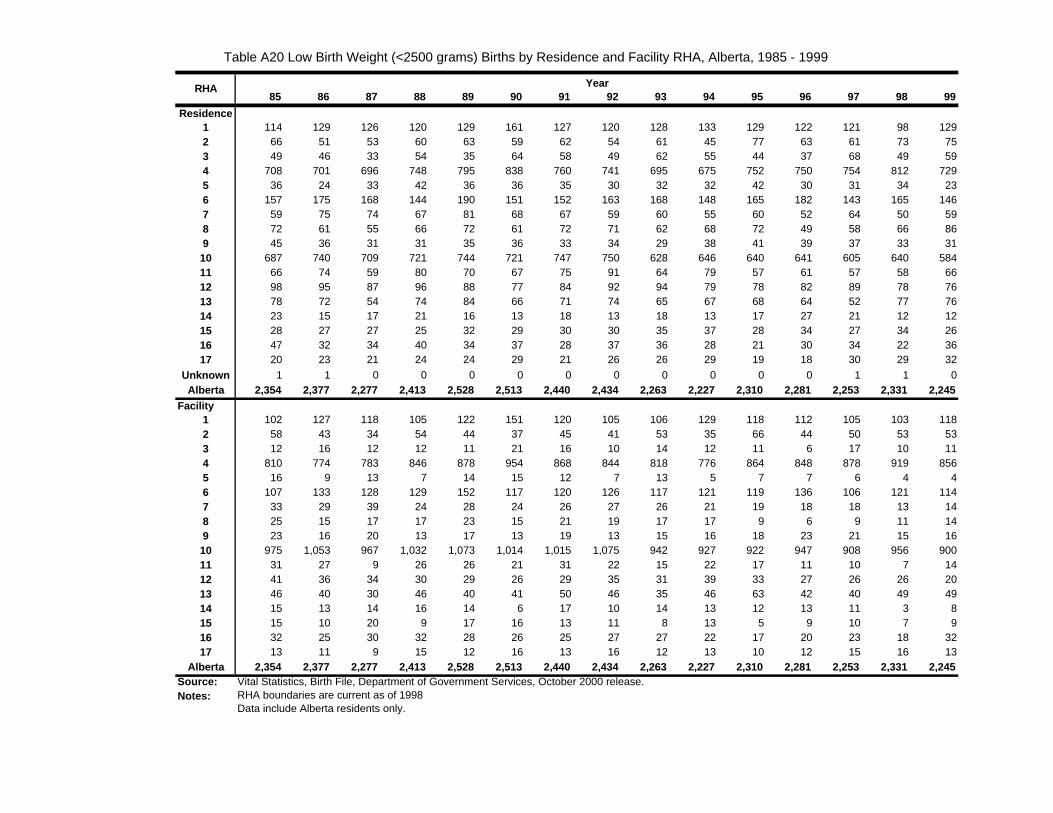
Table A20 Low Birth Weight (<2500 grams) Births by Residence and Facility RHA, Alberta, 1985 - 1999
85 86 87 88 89 90 91 92 93 94 95 96 97 98 99
Residence1 114 129 126 120 129 161 127 120 128 133 129 122 121 98 1292 66 51 53 60 63 59 62 54 61 45 77 63 61 73 753 49 46 33 54 35 64 58 49 62 55 44 37 68 49 594 708 701 696 748 795 838 760 741 695 675 752 750 754 812 7295 36 24 33 42 36 36 35 30 32 32 42 30 31 34 236 157 175 168 144 190 151 152 163 168 148 165 182 143 165 1467 59 75 74 67 81 68 67 59 60 55 60 52 64 50 598 72 61 55 66 72 61 72 71 62 68 72 49 58 66 869 45 36 31 31 35 36 33 34 29 38 41 39 37 33 3110 687 740 709 721 744 721 747 750 628 646 640 641 605 640 58411 66 74 59 80 70 67 75 91 64 79 57 61 57 58 6612 98 95 87 96 88 77 84 92 94 79 78 82 89 78 7613 78 72 54 74 84 66 71 74 65 67 68 64 52 77 7614 23 15 17 21 16 13 18 13 18 13 17 27 21 12 1215 28 27 27 25 32 29 30 30 35 37 28 34 27 34 2616 47 32 34 40 34 37 28 37 36 28 21 30 34 22 3617 20 23 21 24 24 29 21 26 26 29 19 18 30 29 32
Unknown 1 1 0 0 0 0 0 0 0 0 0 0 1 1 0Alberta 2,354 2,377 2,277 2,413 2,528 2,513 2,440 2,434 2,263 2,227 2,310 2,281 2,253 2,331 2,245
Facility1 102 127 118 105 122 151 120 105 106 129 118 112 105 103 1182 58 43 34 54 44 37 45 41 53 35 66 44 50 53 533 12 16 12 12 11 21 16 10 14 12 11 6 17 10 114 810 774 783 846 878 954 868 844 818 776 864 848 878 919 8565 16 9 13 7 14 15 12 7 13 5 7 7 6 4 46 107 133 128 129 152 117 120 126 117 121 119 136 106 121 1147 33 29 39 24 28 24 26 27 26 21 19 18 18 13 148 25 15 17 17 23 15 21 19 17 17 9 6 9 11 149 23 16 20 13 17 13 19 13 15 16 18 23 21 15 1610 975 1,053 967 1,032 1,073 1,014 1,015 1,075 942 927 922 947 908 956 90011 31 27 9 26 26 21 31 22 15 22 17 11 10 7 1412 41 36 34 30 29 26 29 35 31 39 33 27 26 26 2013 46 40 30 46 40 41 50 46 35 46 63 42 40 49 4914 15 13 14 16 14 6 17 10 14 13 12 13 11 3 815 15 10 20 9 17 16 13 11 8 13 5 9 10 7 916 32 25 30 32 28 26 25 27 27 22 17 20 23 18 3217 13 11 9 15 12 16 13 16 12 13 10 12 15 16 13
Alberta 2,354 2,377 2,277 2,413 2,528 2,513 2,440 2,434 2,263 2,227 2,310 2,281 2,253 2,331 2,245Source: Vital Statistics, Birth File, Department of Government Services, October 2000 release.Notes: RHA boundaries are current as of 1998
Data include Alberta residents only.
RHA Year
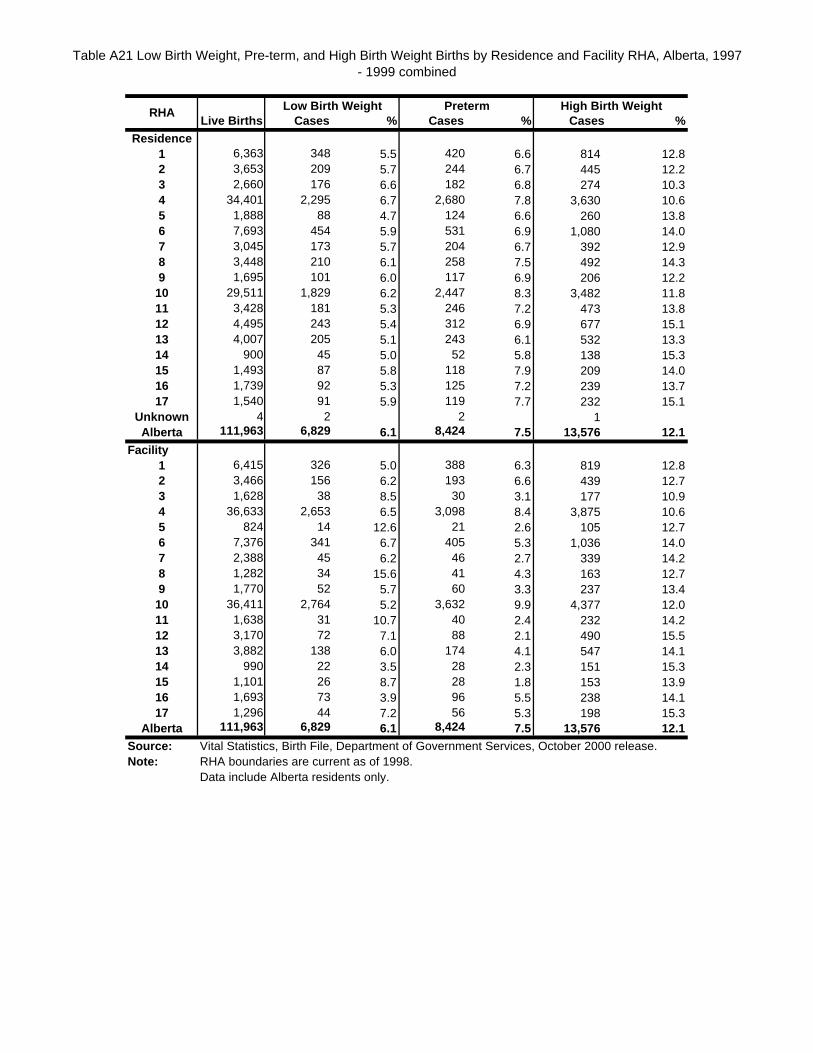
Table A21 Low Birth Weight, Pre-term, and High Birth Weight Births by Residence and Facility RHA, Alberta, 1997 - 1999 combined
Live Births Cases % Cases % Cases %Residence
1 6,363 348 5.5 420 6.6 814 12.82 3,653 209 5.7 244 6.7 445 12.23 2,660 176 6.6 182 6.8 274 10.34 34,401 2,295 6.7 2,680 7.8 3,630 10.65 1,888 88 4.7 124 6.6 260 13.86 7,693 454 5.9 531 6.9 1,080 14.07 3,045 173 5.7 204 6.7 392 12.98 3,448 210 6.1 258 7.5 492 14.39 1,695 101 6.0 117 6.9 206 12.2
10 29,511 1,829 6.2 2,447 8.3 3,482 11.811 3,428 181 5.3 246 7.2 473 13.812 4,495 243 5.4 312 6.9 677 15.113 4,007 205 5.1 243 6.1 532 13.314 900 45 5.0 52 5.8 138 15.315 1,493 87 5.8 118 7.9 209 14.016 1,739 92 5.3 125 7.2 239 13.717 1,540 91 5.9 119 7.7 232 15.1
Unknown 4 2 2 1 Alberta 111,963 6,829 6.1 8,424 7.5 13,576 12.1
Facility1 6,415 326 5.0 388 6.3 819 12.82 3,466 156 6.2 193 6.6 439 12.73 1,628 38 8.5 30 3.1 177 10.94 36,633 2,653 6.5 3,098 8.4 3,875 10.65 824 14 12.6 21 2.6 105 12.76 7,376 341 6.7 405 5.3 1,036 14.07 2,388 45 6.2 46 2.7 339 14.28 1,282 34 15.6 41 4.3 163 12.79 1,770 52 5.7 60 3.3 237 13.4
10 36,411 2,764 5.2 3,632 9.9 4,377 12.011 1,638 31 10.7 40 2.4 232 14.212 3,170 72 7.1 88 2.1 490 15.513 3,882 138 6.0 174 4.1 547 14.114 990 22 3.5 28 2.3 151 15.315 1,101 26 8.7 28 1.8 153 13.916 1,693 73 3.9 96 5.5 238 14.117 1,296 44 7.2 56 5.3 198 15.3
Alberta 111,963 6,829 6.1 8,424 7.5 13,576 12.1Source: Vital Statistics, Birth File, Department of Government Services, October 2000 release.Note: RHA boundaries are current as of 1998.
Data include Alberta residents only.
Low Birth Weight Preterm High Birth WeightRHA
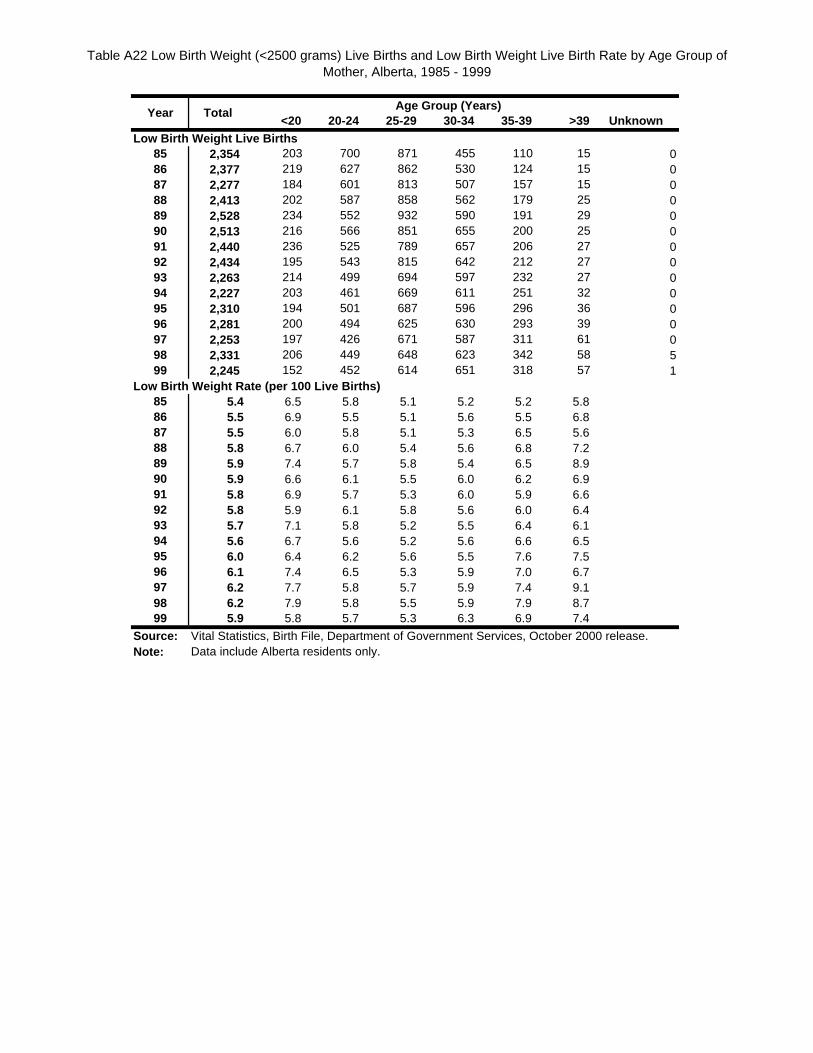
Table A22 Low Birth Weight (<2500 grams) Live Births and Low Birth Weight Live Birth Rate by Age Group of Mother, Alberta, 1985 - 1999
Age Group (Years)<20 20-24 25-29 30-34 35-39 >39 Unknown
Low Birth Weight Live Births85 2,354 203 700 871 455 110 15 086 2,377 219 627 862 530 124 15 087 2,277 184 601 813 507 157 15 088 2,413 202 587 858 562 179 25 089 2,528 234 552 932 590 191 29 090 2,513 216 566 851 655 200 25 091 2,440 236 525 789 657 206 27 092 2,434 195 543 815 642 212 27 093 2,263 214 499 694 597 232 27 094 2,227 203 461 669 611 251 32 095 2,310 194 501 687 596 296 36 096 2,281 200 494 625 630 293 39 097 2,253 197 426 671 587 311 61 098 2,331 206 449 648 623 342 58 599 2,245 152 452 614 651 318 57 1
Low Birth Weight Rate (per 100 Live Births)85 5.4 6.5 5.8 5.1 5.2 5.2 5.886 5.5 6.9 5.5 5.1 5.6 5.5 6.887 5.5 6.0 5.8 5.1 5.3 6.5 5.688 5.8 6.7 6.0 5.4 5.6 6.8 7.289 5.9 7.4 5.7 5.8 5.4 6.5 8.990 5.9 6.6 6.1 5.5 6.0 6.2 6.991 5.8 6.9 5.7 5.3 6.0 5.9 6.692 5.8 5.9 6.1 5.8 5.6 6.0 6.493 5.7 7.1 5.8 5.2 5.5 6.4 6.194 5.6 6.7 5.6 5.2 5.6 6.6 6.595 6.0 6.4 6.2 5.6 5.5 7.6 7.596 6.1 7.4 6.5 5.3 5.9 7.0 6.797 6.2 7.7 5.8 5.7 5.9 7.4 9.198 6.2 7.9 5.8 5.5 5.9 7.9 8.799 5.9 5.8 5.7 5.3 6.3 6.9 7.4
Source: Vital Statistics, Birth File, Department of Government Services, October 2000 release.Note: Data include Alberta residents only.
Year Total
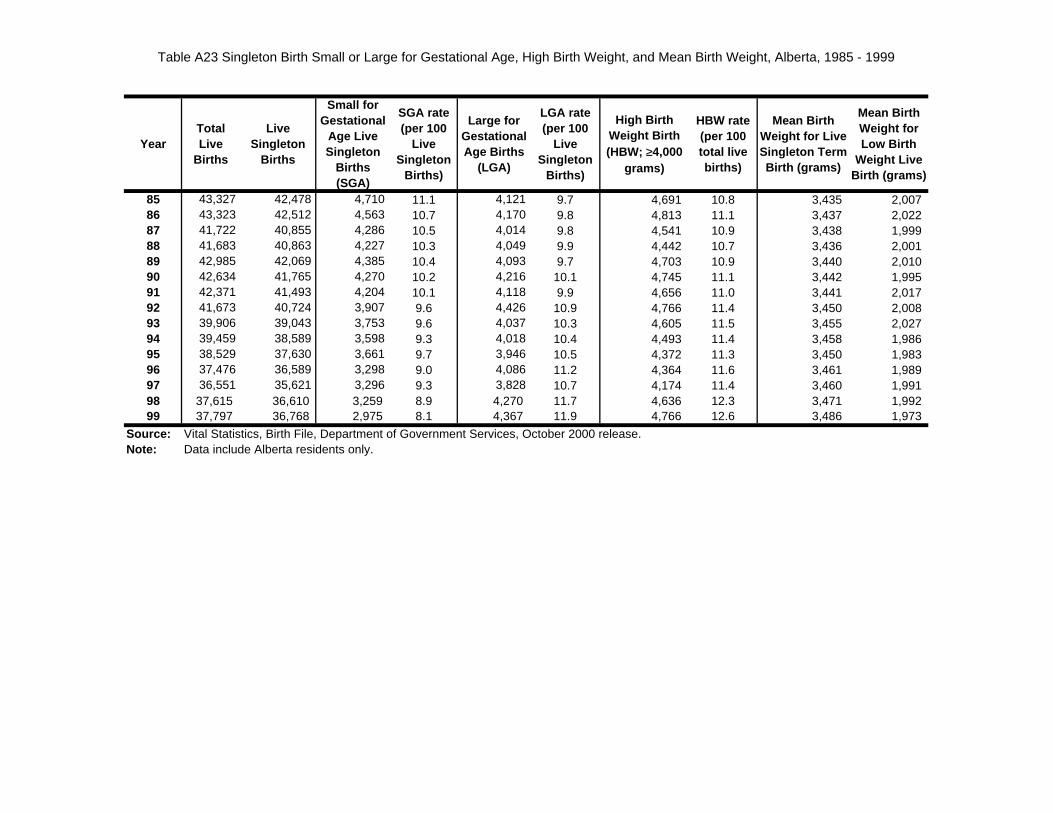
Table A23 Singleton Birth Small or Large for Gestational Age, High Birth Weight, and Mean Birth Weight, Alberta, 1985 - 1999
YearTotal Live
Births
Live Singleton
Births
Small for Gestational
Age Live Singleton
Births (SGA)
SGA rate (per 100
Live Singleton
Births)
Large for Gestational Age Births
(LGA)
LGA rate (per 100
Live Singleton
Births)
High Birth Weight Birth (HBW; ≥4,000
grams)
HBW rate (per 100 total live births)
Mean Birth Weight for Live Singleton Term Birth (grams)
Mean Birth Weight for Low Birth
Weight Live Birth (grams)
85 43,327 42,478 4,710 11.1 4,121 9.7 4,691 10.8 3,435 2,007 86 43,323 42,512 4,563 10.7 4,170 9.8 4,813 11.1 3,437 2,022 87 41,722 40,855 4,286 10.5 4,014 9.8 4,541 10.9 3,438 1,999 88 41,683 40,863 4,227 10.3 4,049 9.9 4,442 10.7 3,436 2,001 89 42,985 42,069 4,385 10.4 4,093 9.7 4,703 10.9 3,440 2,010 90 42,634 41,765 4,270 10.2 4,216 10.1 4,745 11.1 3,442 1,995 91 42,371 41,493 4,204 10.1 4,118 9.9 4,656 11.0 3,441 2,017 92 41,673 40,724 3,907 9.6 4,426 10.9 4,766 11.4 3,450 2,008 93 39,906 39,043 3,753 9.6 4,037 10.3 4,605 11.5 3,455 2,027 94 39,459 38,589 3,598 9.3 4,018 10.4 4,493 11.4 3,458 1,986 95 38,529 37,630 3,661 9.7 3,946 10.5 4,372 11.3 3,450 1,983 96 37,476 36,589 3,298 9.0 4,086 11.2 4,364 11.6 3,461 1,989 97 36,551 35,621 3,296 9.3 3,828 10.7 4,174 11.4 3,460 1,991 98 37,615 36,610 3,259 8.9 4,270 11.7 4,636 12.3 3,471 1,992 99 37,797 36,768 2,975 8.1 4,367 11.9 4,766 12.6 3,486 1,973
Source: Vital Statistics, Birth File, Department of Government Services, October 2000 release.Note: Data include Alberta residents only.
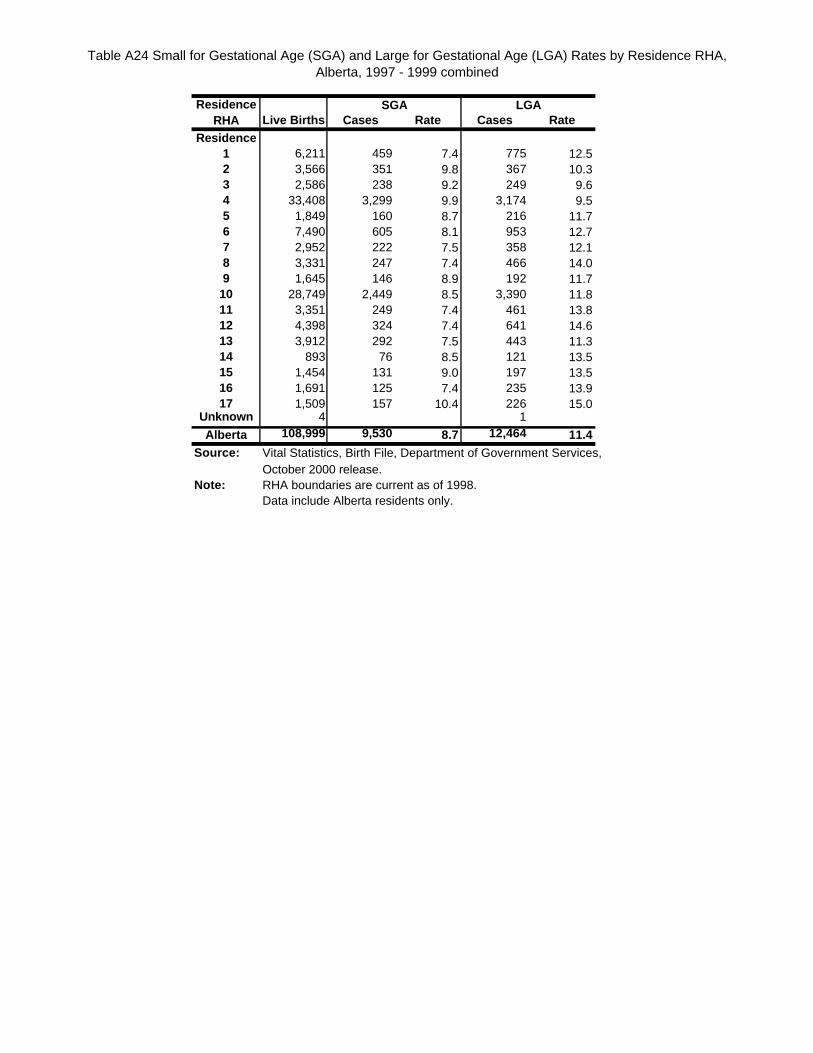
Table A24 Small for Gestational Age (SGA) and Large for Gestational Age (LGA) Rates by Residence RHA, Alberta, 1997 - 1999 combined
Live Births Cases Rate Cases RateResidence
1 6,211 459 7.4 775 12.52 3,566 351 9.8 367 10.33 2,586 238 9.2 249 9.64 33,408 3,299 9.9 3,174 9.55 1,849 160 8.7 216 11.76 7,490 605 8.1 953 12.77 2,952 222 7.5 358 12.18 3,331 247 7.4 466 14.09 1,645 146 8.9 192 11.7
10 28,749 2,449 8.5 3,390 11.811 3,351 249 7.4 461 13.812 4,398 324 7.4 641 14.613 3,912 292 7.5 443 11.314 893 76 8.5 121 13.515 1,454 131 9.0 197 13.516 1,691 125 7.4 235 13.917 1,509 157 10.4 226 15.0
Unknown 4 1
Alberta 108,999 9,530 8.7 12,464 11.4Source: Vital Statistics, Birth File, Department of Government Services,
October 2000 release.Note: RHA boundaries are current as of 1998.
Data include Alberta residents only.
SGA LGAResidence RHA
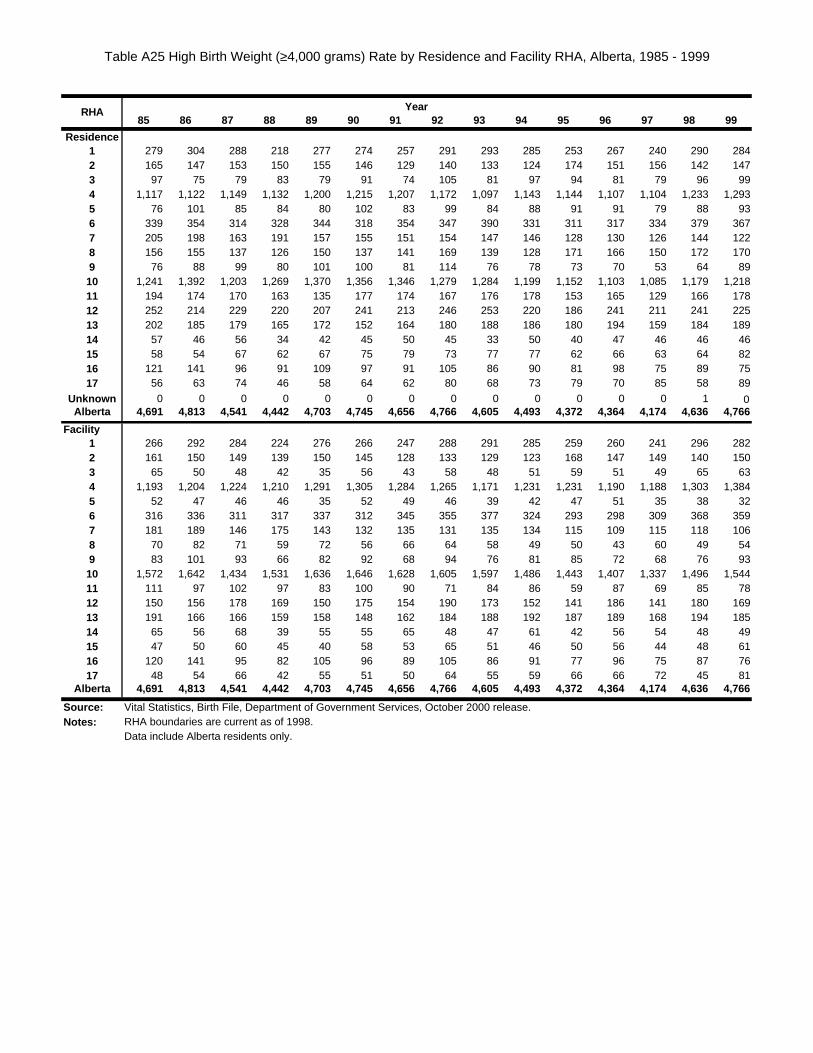
Table A25 High Birth Weight (≥4,000 grams) Rate by Residence and Facility RHA, Alberta, 1985 - 1999
85 86 87 88 89 90 91 92 93 94 95 96 97 98 99
Residence1 279 304 288 218 277 274 257 291 293 285 253 267 240 290 2842 165 147 153 150 155 146 129 140 133 124 174 151 156 142 1473 97 75 79 83 79 91 74 105 81 97 94 81 79 96 994 1,117 1,122 1,149 1,132 1,200 1,215 1,207 1,172 1,097 1,143 1,144 1,107 1,104 1,233 1,2935 76 101 85 84 80 102 83 99 84 88 91 91 79 88 936 339 354 314 328 344 318 354 347 390 331 311 317 334 379 3677 205 198 163 191 157 155 151 154 147 146 128 130 126 144 1228 156 155 137 126 150 137 141 169 139 128 171 166 150 172 1709 76 88 99 80 101 100 81 114 76 78 73 70 53 64 8910 1,241 1,392 1,203 1,269 1,370 1,356 1,346 1,279 1,284 1,199 1,152 1,103 1,085 1,179 1,21811 194 174 170 163 135 177 174 167 176 178 153 165 129 166 17812 252 214 229 220 207 241 213 246 253 220 186 241 211 241 22513 202 185 179 165 172 152 164 180 188 186 180 194 159 184 18914 57 46 56 34 42 45 50 45 33 50 40 47 46 46 4615 58 54 67 62 67 75 79 73 77 77 62 66 63 64 8216 121 141 96 91 109 97 91 105 86 90 81 98 75 89 7517 56 63 74 46 58 64 62 80 68 73 79 70 85 58 89
Unknown 0 0 0 0 0 0 0 0 0 0 0 0 0 1 0Alberta 4,691 4,813 4,541 4,442 4,703 4,745 4,656 4,766 4,605 4,493 4,372 4,364 4,174 4,636 4,766
Facility1 266 292 284 224 276 266 247 288 291 285 259 260 241 296 2822 161 150 149 139 150 145 128 133 129 123 168 147 149 140 1503 65 50 48 42 35 56 43 58 48 51 59 51 49 65 634 1,193 1,204 1,224 1,210 1,291 1,305 1,284 1,265 1,171 1,231 1,231 1,190 1,188 1,303 1,3845 52 47 46 46 35 52 49 46 39 42 47 51 35 38 326 316 336 311 317 337 312 345 355 377 324 293 298 309 368 3597 181 189 146 175 143 132 135 131 135 134 115 109 115 118 1068 70 82 71 59 72 56 66 64 58 49 50 43 60 49 549 83 101 93 66 82 92 68 94 76 81 85 72 68 76 9310 1,572 1,642 1,434 1,531 1,636 1,646 1,628 1,605 1,597 1,486 1,443 1,407 1,337 1,496 1,54411 111 97 102 97 83 100 90 71 84 86 59 87 69 85 7812 150 156 178 169 150 175 154 190 173 152 141 186 141 180 16913 191 166 166 159 158 148 162 184 188 192 187 189 168 194 18514 65 56 68 39 55 55 65 48 47 61 42 56 54 48 4915 47 50 60 45 40 58 53 65 51 46 50 56 44 48 6116 120 141 95 82 105 96 89 105 86 91 77 96 75 87 7617 48 54 66 42 55 51 50 64 55 59 66 66 72 45 81
Alberta 4,691 4,813 4,541 4,442 4,703 4,745 4,656 4,766 4,605 4,493 4,372 4,364 4,174 4,636 4,766
Source: Vital Statistics, Birth File, Department of Government Services, October 2000 release.Notes: RHA boundaries are current as of 1998.
Data include Alberta residents only.
YearRHA
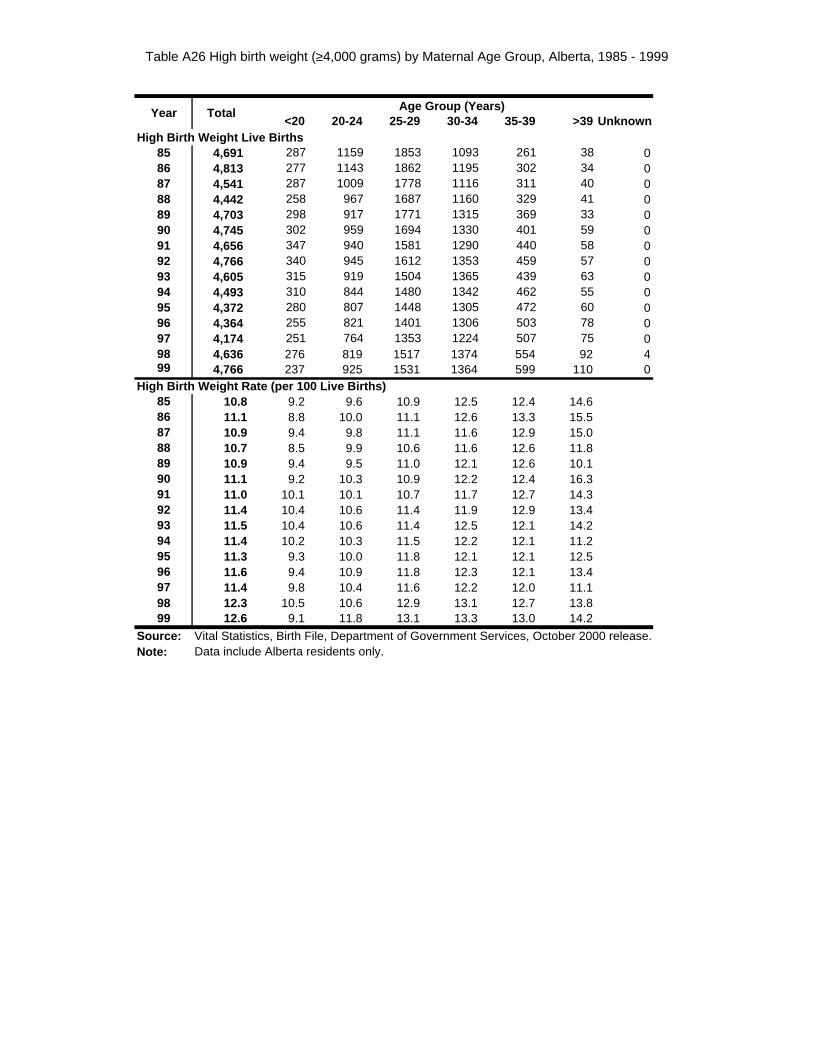
Table A26 High birth weight (≥4,000 grams) by Maternal Age Group, Alberta, 1985 - 1999
<20 20-24 25-29 30-34 35-39 >39 UnknownHigh Birth Weight Live Births
85 4,691 287 1159 1853 1093 261 38 086 4,813 277 1143 1862 1195 302 34 087 4,541 287 1009 1778 1116 311 40 088 4,442 258 967 1687 1160 329 41 089 4,703 298 917 1771 1315 369 33 090 4,745 302 959 1694 1330 401 59 091 4,656 347 940 1581 1290 440 58 092 4,766 340 945 1612 1353 459 57 093 4,605 315 919 1504 1365 439 63 094 4,493 310 844 1480 1342 462 55 095 4,372 280 807 1448 1305 472 60 096 4,364 255 821 1401 1306 503 78 097 4,174 251 764 1353 1224 507 75 098 4,636 276 819 1517 1374 554 92 499 4,766 237 925 1531 1364 599 110 0
High Birth Weight Rate (per 100 Live Births)85 10.8 9.2 9.6 10.9 12.5 12.4 14.686 11.1 8.8 10.0 11.1 12.6 13.3 15.587 10.9 9.4 9.8 11.1 11.6 12.9 15.088 10.7 8.5 9.9 10.6 11.6 12.6 11.889 10.9 9.4 9.5 11.0 12.1 12.6 10.190 11.1 9.2 10.3 10.9 12.2 12.4 16.391 11.0 10.1 10.1 10.7 11.7 12.7 14.392 11.4 10.4 10.6 11.4 11.9 12.9 13.493 11.5 10.4 10.6 11.4 12.5 12.1 14.294 11.4 10.2 10.3 11.5 12.2 12.1 11.295 11.3 9.3 10.0 11.8 12.1 12.1 12.596 11.6 9.4 10.9 11.8 12.3 12.1 13.497 11.4 9.8 10.4 11.6 12.2 12.0 11.198 12.3 10.5 10.6 12.9 13.1 12.7 13.899 12.6 9.1 11.8 13.1 13.3 13.0 14.2
Source: Vital Statistics, Birth File, Department of Government Services, October 2000 release.Note: Data include Alberta residents only.
Age Group (Years)Year Total
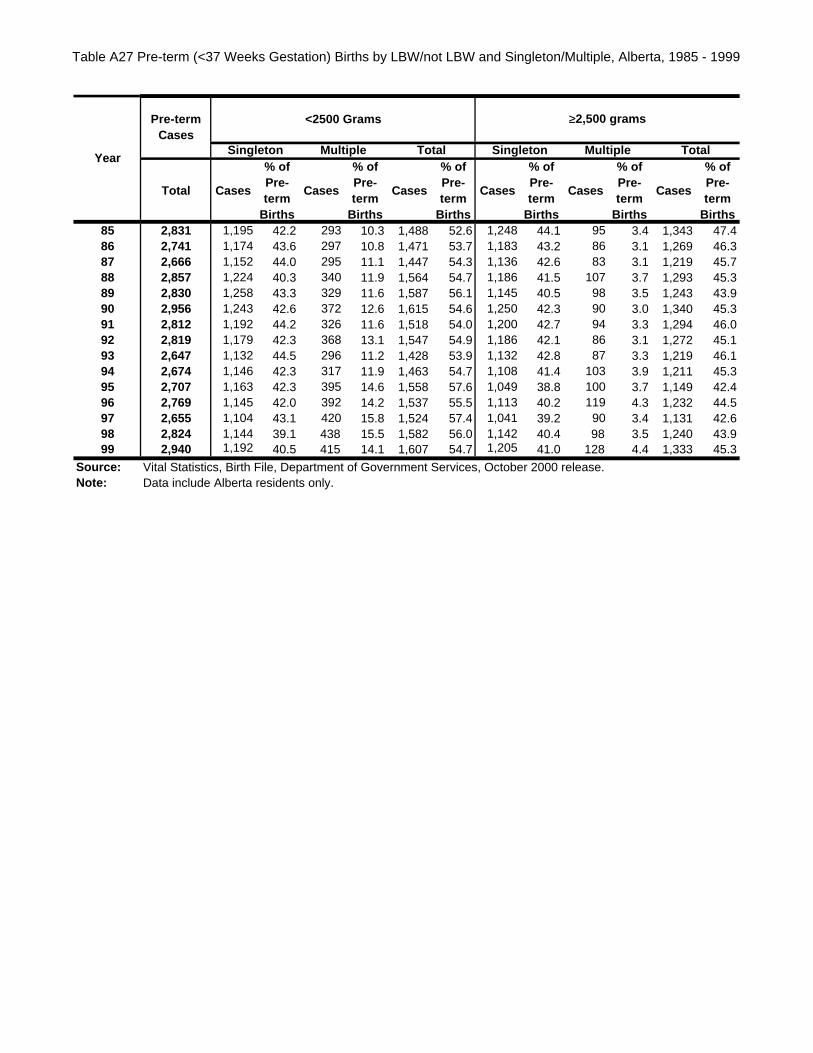
Table A27 Pre-term (<37 Weeks Gestation) Births by LBW/not LBW and Singleton/Multiple, Alberta, 1985 - 1999
Total Cases
% of Pre-term
Births
Cases
% of Pre-term
Births
Cases
% of Pre-term
Births
Cases
% of Pre-term
Births
Cases
% of Pre-term
Births
Cases
% of Pre-term
Births85 2,831 1,195 42.2 293 10.3 1,488 52.6 1,248 44.1 95 3.4 1,343 47.486 2,741 1,174 43.6 297 10.8 1,471 53.7 1,183 43.2 86 3.1 1,269 46.387 2,666 1,152 44.0 295 11.1 1,447 54.3 1,136 42.6 83 3.1 1,219 45.788 2,857 1,224 40.3 340 11.9 1,564 54.7 1,186 41.5 107 3.7 1,293 45.389 2,830 1,258 43.3 329 11.6 1,587 56.1 1,145 40.5 98 3.5 1,243 43.990 2,956 1,243 42.6 372 12.6 1,615 54.6 1,250 42.3 90 3.0 1,340 45.391 2,812 1,192 44.2 326 11.6 1,518 54.0 1,200 42.7 94 3.3 1,294 46.092 2,819 1,179 42.3 368 13.1 1,547 54.9 1,186 42.1 86 3.1 1,272 45.193 2,647 1,132 44.5 296 11.2 1,428 53.9 1,132 42.8 87 3.3 1,219 46.194 2,674 1,146 42.3 317 11.9 1,463 54.7 1,108 41.4 103 3.9 1,211 45.395 2,707 1,163 42.3 395 14.6 1,558 57.6 1,049 38.8 100 3.7 1,149 42.496 2,769 1,145 42.0 392 14.2 1,537 55.5 1,113 40.2 119 4.3 1,232 44.597 2,655 1,104 43.1 420 15.8 1,524 57.4 1,041 39.2 90 3.4 1,131 42.698 2,824 1,144 39.1 438 15.5 1,582 56.0 1,142 40.4 98 3.5 1,240 43.999 2,940 1,192 40.5 415 14.1 1,607 54.7 1,205 41.0 128 4.4 1,333 45.3
Source: Vital Statistics, Birth File, Department of Government Services, October 2000 release.Note: Data include Alberta residents only.
YearTotal
≥2,500 gramsPre-term Cases
Singleton Multiple Singleton MultipleTotal
<2500 Grams
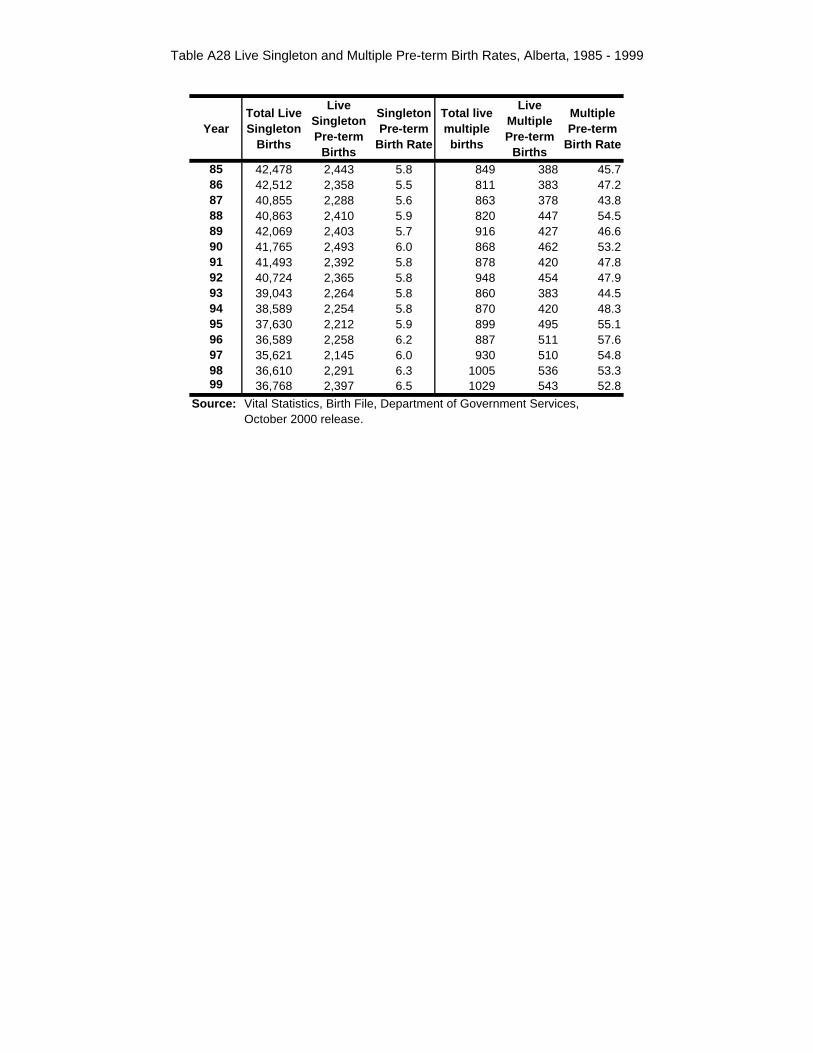
Table A28 Live Singleton and Multiple Pre-term Birth Rates, Alberta, 1985 - 1999
YearTotal Live Singleton
Births
Live Singleton Pre-term
Births
Singleton Pre-term
Birth Rate
Total live multiple births
Live Multiple Pre-term
Births
Multiple Pre-term
Birth Rate
85 42,478 2,443 5.8 849 388 45.786 42,512 2,358 5.5 811 383 47.287 40,855 2,288 5.6 863 378 43.888 40,863 2,410 5.9 820 447 54.589 42,069 2,403 5.7 916 427 46.690 41,765 2,493 6.0 868 462 53.291 41,493 2,392 5.8 878 420 47.892 40,724 2,365 5.8 948 454 47.993 39,043 2,264 5.8 860 383 44.594 38,589 2,254 5.8 870 420 48.395 37,630 2,212 5.9 899 495 55.196 36,589 2,258 6.2 887 511 57.697 35,621 2,145 6.0 930 510 54.898 36,610 2,291 6.3 1005 536 53.399 36,768 2,397 6.5 1029 543 52.8
Source: Vital Statistics, Birth File, Department of Government Services, October 2000 release.
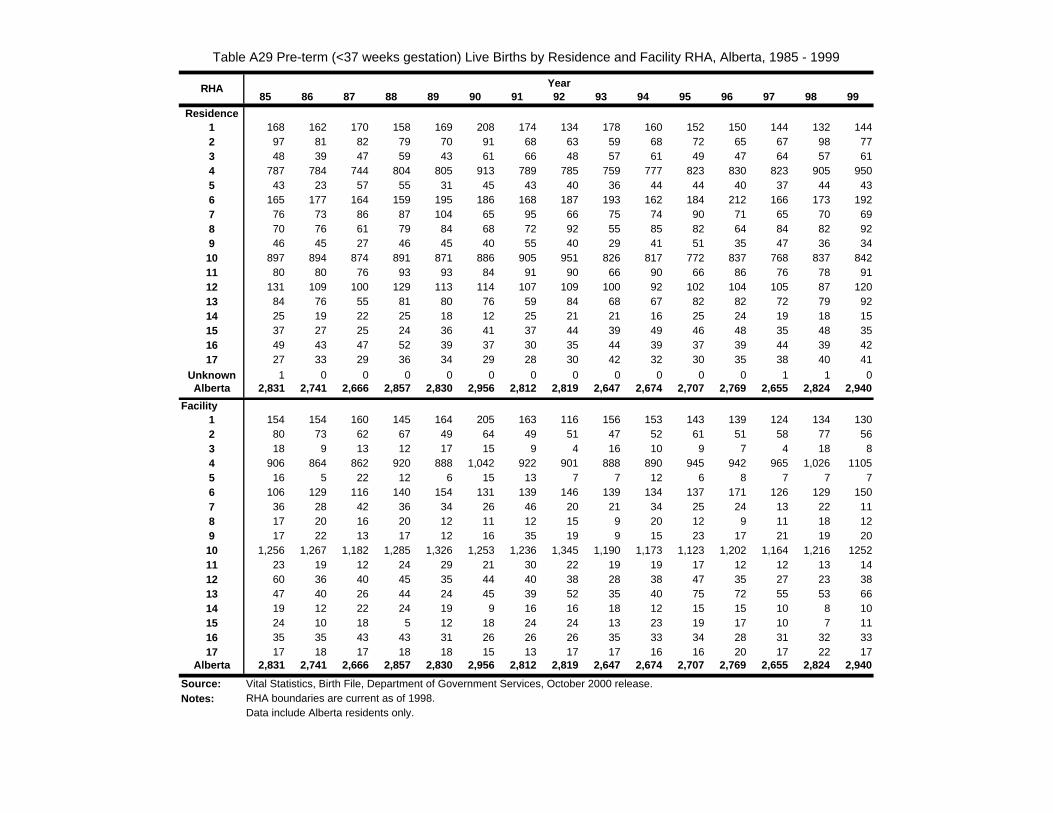
Table A29 Pre-term (<37 weeks gestation) Live Births by Residence and Facility RHA, Alberta, 1985 - 1999
85 86 87 88 89 90 91 92 93 94 95 96 97 98 99
Residence1 168 162 170 158 169 208 174 134 178 160 152 150 144 132 1442 97 81 82 79 70 91 68 63 59 68 72 65 67 98 773 48 39 47 59 43 61 66 48 57 61 49 47 64 57 614 787 784 744 804 805 913 789 785 759 777 823 830 823 905 9505 43 23 57 55 31 45 43 40 36 44 44 40 37 44 436 165 177 164 159 195 186 168 187 193 162 184 212 166 173 1927 76 73 86 87 104 65 95 66 75 74 90 71 65 70 698 70 76 61 79 84 68 72 92 55 85 82 64 84 82 929 46 45 27 46 45 40 55 40 29 41 51 35 47 36 3410 897 894 874 891 871 886 905 951 826 817 772 837 768 837 84211 80 80 76 93 93 84 91 90 66 90 66 86 76 78 9112 131 109 100 129 113 114 107 109 100 92 102 104 105 87 12013 84 76 55 81 80 76 59 84 68 67 82 82 72 79 9214 25 19 22 25 18 12 25 21 21 16 25 24 19 18 1515 37 27 25 24 36 41 37 44 39 49 46 48 35 48 3516 49 43 47 52 39 37 30 35 44 39 37 39 44 39 4217 27 33 29 36 34 29 28 30 42 32 30 35 38 40 41
Unknown 1 0 0 0 0 0 0 0 0 0 0 0 1 1 0Alberta 2,831 2,741 2,666 2,857 2,830 2,956 2,812 2,819 2,647 2,674 2,707 2,769 2,655 2,824 2,940
Facility1 154 154 160 145 164 205 163 116 156 153 143 139 124 134 1302 80 73 62 67 49 64 49 51 47 52 61 51 58 77 563 18 9 13 12 17 15 9 4 16 10 9 7 4 18 84 906 864 862 920 888 1,042 922 901 888 890 945 942 965 1,026 11055 16 5 22 12 6 15 13 7 7 12 6 8 7 7 76 106 129 116 140 154 131 139 146 139 134 137 171 126 129 1507 36 28 42 36 34 26 46 20 21 34 25 24 13 22 118 17 20 16 20 12 11 12 15 9 20 12 9 11 18 129 17 22 13 17 12 16 35 19 9 15 23 17 21 19 2010 1,256 1,267 1,182 1,285 1,326 1,253 1,236 1,345 1,190 1,173 1,123 1,202 1,164 1,216 125211 23 19 12 24 29 21 30 22 19 19 17 12 12 13 1412 60 36 40 45 35 44 40 38 28 38 47 35 27 23 3813 47 40 26 44 24 45 39 52 35 40 75 72 55 53 6614 19 12 22 24 19 9 16 16 18 12 15 15 10 8 1015 24 10 18 5 12 18 24 24 13 23 19 17 10 7 1116 35 35 43 43 31 26 26 26 35 33 34 28 31 32 3317 17 18 17 18 18 15 13 17 17 16 16 20 17 22 17
Alberta 2,831 2,741 2,666 2,857 2,830 2,956 2,812 2,819 2,647 2,674 2,707 2,769 2,655 2,824 2,940
Source: Vital Statistics, Birth File, Department of Government Services, October 2000 release.Notes: RHA boundaries are current as of 1998.
Data include Alberta residents only.
RHA Year
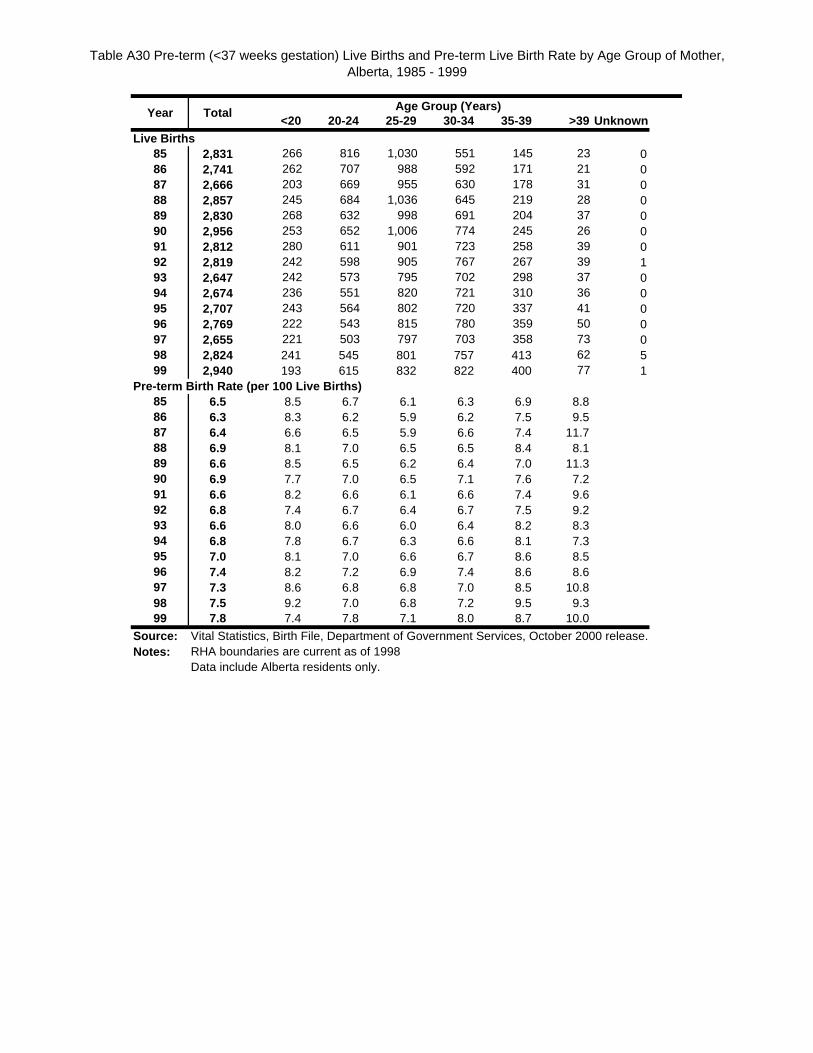
Table A30 Pre-term (<37 weeks gestation) Live Births and Pre-term Live Birth Rate by Age Group of Mother, Alberta, 1985 - 1999
<20 20-24 25-29 30-34 35-39 >39 UnknownLive Births
85 2,831 266 816 1,030 551 145 23 086 2,741 262 707 988 592 171 21 087 2,666 203 669 955 630 178 31 088 2,857 245 684 1,036 645 219 28 089 2,830 268 632 998 691 204 37 090 2,956 253 652 1,006 774 245 26 091 2,812 280 611 901 723 258 39 092 2,819 242 598 905 767 267 39 193 2,647 242 573 795 702 298 37 094 2,674 236 551 820 721 310 36 095 2,707 243 564 802 720 337 41 096 2,769 222 543 815 780 359 50 097 2,655 221 503 797 703 358 73 098 2,824 241 545 801 757 413 62 599 2,940 193 615 832 822 400 77 1
Pre-term Birth Rate (per 100 Live Births)85 6.5 8.5 6.7 6.1 6.3 6.9 8.886 6.3 8.3 6.2 5.9 6.2 7.5 9.587 6.4 6.6 6.5 5.9 6.6 7.4 11.788 6.9 8.1 7.0 6.5 6.5 8.4 8.189 6.6 8.5 6.5 6.2 6.4 7.0 11.390 6.9 7.7 7.0 6.5 7.1 7.6 7.291 6.6 8.2 6.6 6.1 6.6 7.4 9.692 6.8 7.4 6.7 6.4 6.7 7.5 9.293 6.6 8.0 6.6 6.0 6.4 8.2 8.394 6.8 7.8 6.7 6.3 6.6 8.1 7.395 7.0 8.1 7.0 6.6 6.7 8.6 8.596 7.4 8.2 7.2 6.9 7.4 8.6 8.697 7.3 8.6 6.8 6.8 7.0 8.5 10.898 7.5 9.2 7.0 6.8 7.2 9.5 9.399 7.8 7.4 7.8 7.1 8.0 8.7 10.0
Source: Vital Statistics, Birth File, Department of Government Services, October 2000 release.Notes: RHA boundaries are current as of 1998
Data include Alberta residents only.
Age Group (Years)TotalYear
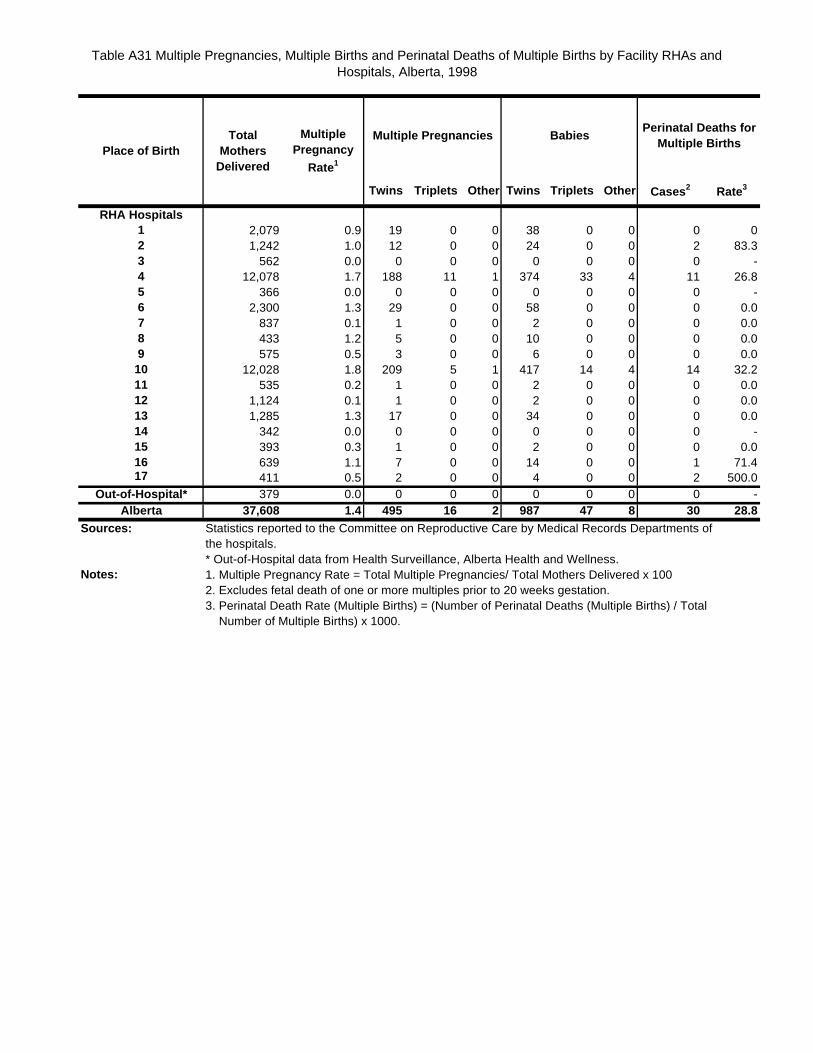
Table A31 Multiple Pregnancies, Multiple Births and Perinatal Deaths of Multiple Births by Facility RHAs and Hospitals, Alberta, 1998
Multiple Pregnancies
Twins Triplets Other Twins Triplets Other Cases 2 Rate3
RHA Hospitals1 2,079 0.9 19 0 0 38 0 0 0 02 1,242 1.0 12 0 0 24 0 0 2 83.33 562 0.0 0 0 0 0 0 0 0 -4 12,078 1.7 188 11 1 374 33 4 11 26.85 366 0.0 0 0 0 0 0 0 0 -6 2,300 1.3 29 0 0 58 0 0 0 0.07 837 0.1 1 0 0 2 0 0 0 0.08 433 1.2 5 0 0 10 0 0 0 0.09 575 0.5 3 0 0 6 0 0 0 0.0
10 12,028 1.8 209 5 1 417 14 4 14 32.211 535 0.2 1 0 0 2 0 0 0 0.012 1,124 0.1 1 0 0 2 0 0 0 0.013 1,285 1.3 17 0 0 34 0 0 0 0.014 342 0.0 0 0 0 0 0 0 0 -15 393 0.3 1 0 0 2 0 0 0 0.016 639 1.1 7 0 0 14 0 0 1 71.417 411 0.5 2 0 0 4 0 0 2 500.0
Out-of-Hospital* 379 0.0 0 0 0 0 0 0 0 -Alberta 37,608 1.4 495 16 2 987 47 8 30 28.8
Sources: Statistics reported to the Committee on Reproductive Care by Medical Records Departments of the hospitals.* Out-of-Hospital data from Health Surveillance, Alberta Health and Wellness.
Notes: 1. Multiple Pregnancy Rate = Total Multiple Pregnancies/ Total Mothers Delivered x 100 2. Excludes fetal death of one or more multiples prior to 20 weeks gestation. 3. Perinatal Death Rate (Multiple Births) = (Number of Perinatal Deaths (Multiple Births) / Total Number of Multiple Births) x 1000.
Perinatal Deaths for Multiple Births
Place of BirthTotal
Mothers Delivered
Multiple Pregnancy
Rate1
Babies
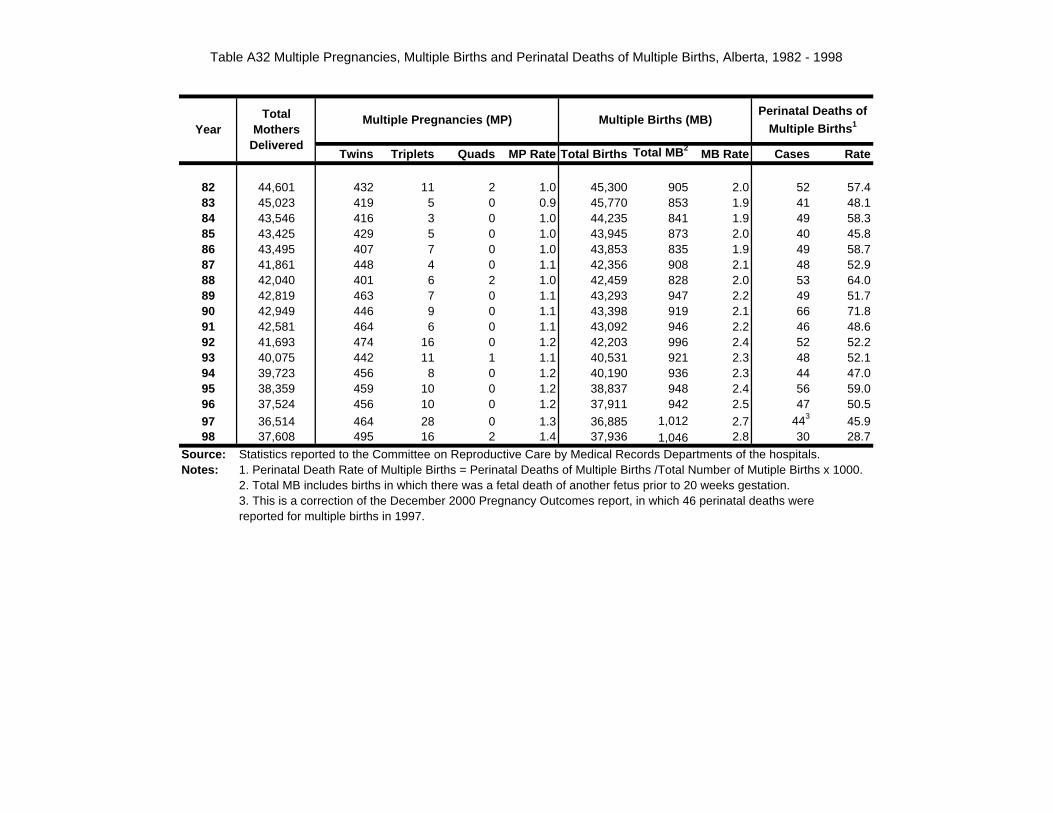
Table A32 Multiple Pregnancies, Multiple Births and Perinatal Deaths of Multiple Births, Alberta, 1982 - 1998
Twins Triplets Quads MP Rate Total Births Total MB 2MB Rate Cases Rate
82 44,601 432 11 2 1.0 45,300 905 2.0 52 57.483 45,023 419 5 0 0.9 45,770 853 1.9 41 48.184 43,546 416 3 0 1.0 44,235 841 1.9 49 58.385 43,425 429 5 0 1.0 43,945 873 2.0 40 45.886 43,495 407 7 0 1.0 43,853 835 1.9 49 58.787 41,861 448 4 0 1.1 42,356 908 2.1 48 52.988 42,040 401 6 2 1.0 42,459 828 2.0 53 64.089 42,819 463 7 0 1.1 43,293 947 2.2 49 51.790 42,949 446 9 0 1.1 43,398 919 2.1 66 71.891 42,581 464 6 0 1.1 43,092 946 2.2 46 48.692 41,693 474 16 0 1.2 42,203 996 2.4 52 52.293 40,075 442 11 1 1.1 40,531 921 2.3 48 52.194 39,723 456 8 0 1.2 40,190 936 2.3 44 47.095 38,359 459 10 0 1.2 38,837 948 2.4 56 59.096 37,524 456 10 0 1.2 37,911 942 2.5 47 50.5
97 36,514 464 28 0 1.3 36,885 1,012 2.7 443 45.998 37,608 495 16 2 1.4 37,936 1,046 2.8 30 28.7
Source: Statistics reported to the Committee on Reproductive Care by Medical Records Departments of the hospitals.Notes: 1. Perinatal Death Rate of Multiple Births = Perinatal Deaths of Multiple Births /Total Number of Mutiple Births x 1000.
2. Total MB includes births in which there was a fetal death of another fetus prior to 20 weeks gestation.3. This is a correction of the December 2000 Pregnancy Outcomes report, in which 46 perinatal deaths were reported for multiple births in 1997.
YearMultiple Births (MB)Multiple Pregnancies (MP)
Perinatal Deaths of
Multiple Births 1Total
Mothers Delivered
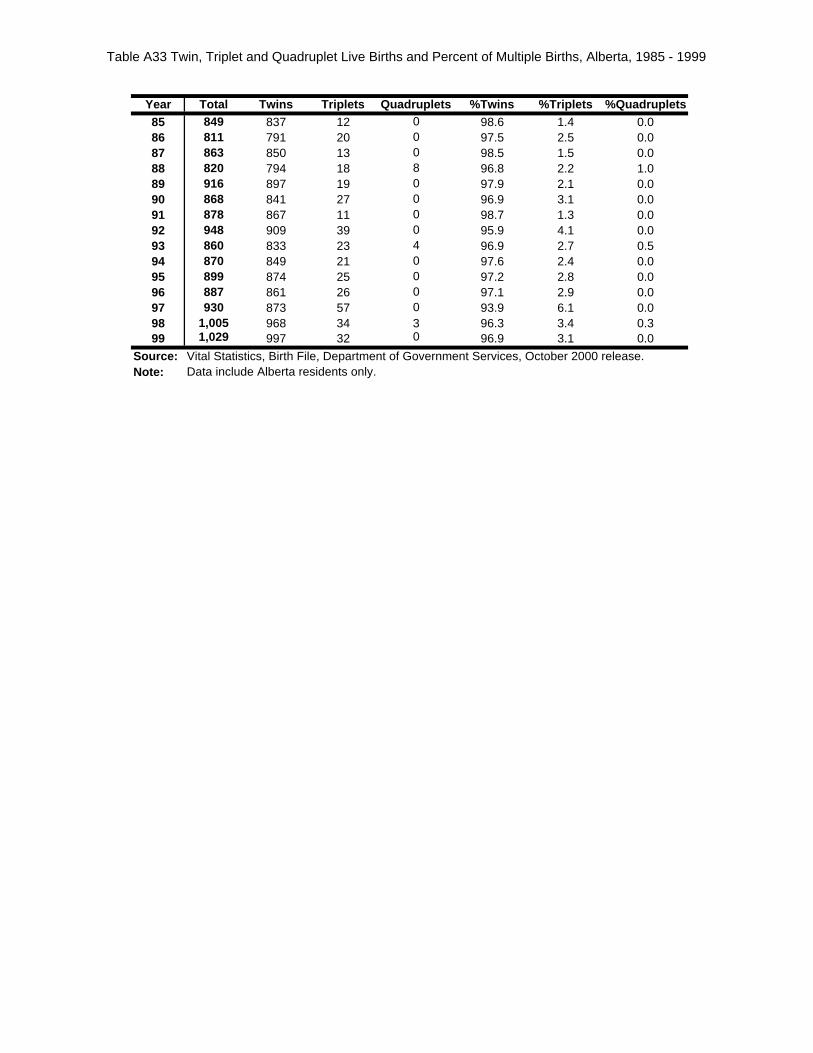
Table A33 Twin, Triplet and Quadruplet Live Births and Percent of Multiple Births, Alberta, 1985 - 1999
Year Total Twins Triplets Quadruplets %Twins %Triplets %Quadruplets85 849 837 12 0 98.6 1.4 0.086 811 791 20 0 97.5 2.5 0.087 863 850 13 0 98.5 1.5 0.088 820 794 18 8 96.8 2.2 1.089 916 897 19 0 97.9 2.1 0.090 868 841 27 0 96.9 3.1 0.091 878 867 11 0 98.7 1.3 0.092 948 909 39 0 95.9 4.1 0.093 860 833 23 4 96.9 2.7 0.594 870 849 21 0 97.6 2.4 0.095 899 874 25 0 97.2 2.8 0.096 887 861 26 0 97.1 2.9 0.097 930 873 57 0 93.9 6.1 0.098 1,005 968 34 3 96.3 3.4 0.399 1,029 997 32 0 96.9 3.1 0.0
Source: Vital Statistics, Birth File, Department of Government Services, October 2000 release.Note: Data include Alberta residents only.
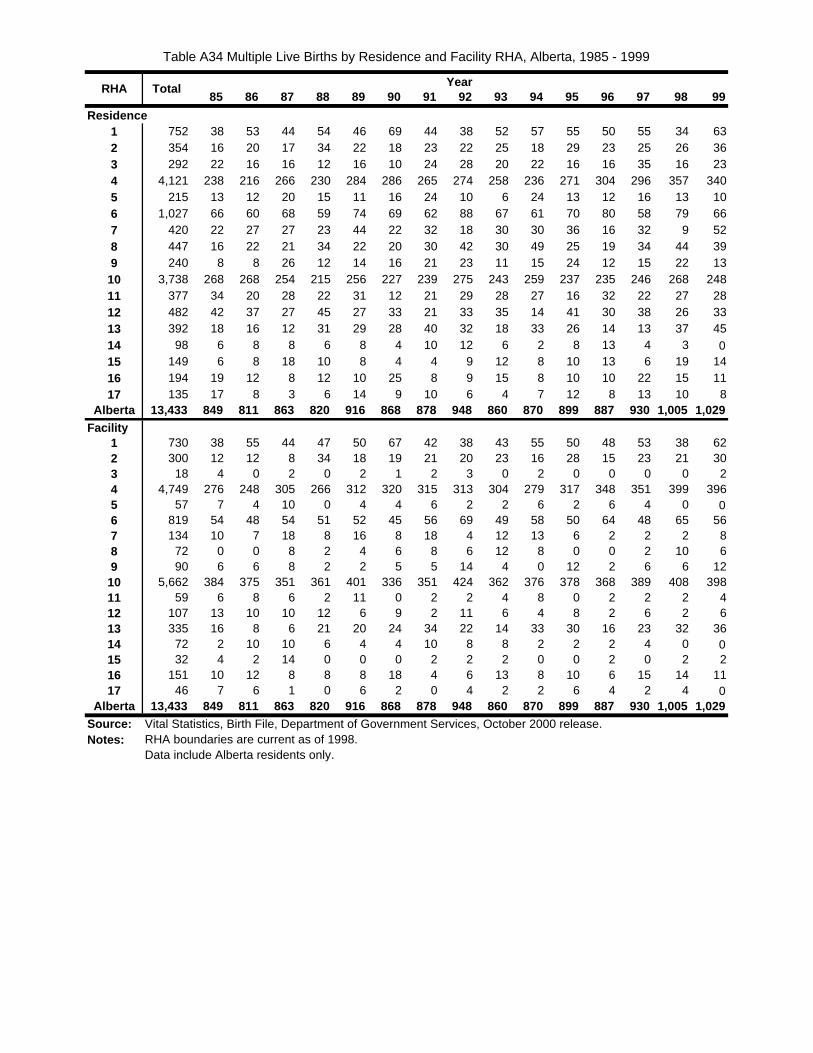
Table A34 Multiple Live Births by Residence and Facility RHA, Alberta, 1985 - 1999
85 86 87 88 89 90 91 92 93 94 95 96 97 98 99
Residence1 752 38 53 44 54 46 69 44 38 52 57 55 50 55 34 632 354 16 20 17 34 22 18 23 22 25 18 29 23 25 26 363 292 22 16 16 12 16 10 24 28 20 22 16 16 35 16 234 4,121 238 216 266 230 284 286 265 274 258 236 271 304 296 357 3405 215 13 12 20 15 11 16 24 10 6 24 13 12 16 13 106 1,027 66 60 68 59 74 69 62 88 67 61 70 80 58 79 667 420 22 27 27 23 44 22 32 18 30 30 36 16 32 9 528 447 16 22 21 34 22 20 30 42 30 49 25 19 34 44 399 240 8 8 26 12 14 16 21 23 11 15 24 12 15 22 13
10 3,738 268 268 254 215 256 227 239 275 243 259 237 235 246 268 24811 377 34 20 28 22 31 12 21 29 28 27 16 32 22 27 2812 482 42 37 27 45 27 33 21 33 35 14 41 30 38 26 3313 392 18 16 12 31 29 28 40 32 18 33 26 14 13 37 4514 98 6 8 8 6 8 4 10 12 6 2 8 13 4 3 015 149 6 8 18 10 8 4 4 9 12 8 10 13 6 19 1416 194 19 12 8 12 10 25 8 9 15 8 10 10 22 15 1117 135 17 8 3 6 14 9 10 6 4 7 12 8 13 10 8
Alberta 13,433 849 811 863 820 916 868 878 948 860 870 899 887 930 1,005 1,029Facility
1 730 38 55 44 47 50 67 42 38 43 55 50 48 53 38 622 300 12 12 8 34 18 19 21 20 23 16 28 15 23 21 303 18 4 0 2 0 2 1 2 3 0 2 0 0 0 0 24 4,749 276 248 305 266 312 320 315 313 304 279 317 348 351 399 3965 57 7 4 10 0 4 4 6 2 2 6 2 6 4 0 06 819 54 48 54 51 52 45 56 69 49 58 50 64 48 65 567 134 10 7 18 8 16 8 18 4 12 13 6 2 2 2 88 72 0 0 8 2 4 6 8 6 12 8 0 0 2 10 69 90 6 6 8 2 2 5 5 14 4 0 12 2 6 6 12
10 5,662 384 375 351 361 401 336 351 424 362 376 378 368 389 408 39811 59 6 8 6 2 11 0 2 2 4 8 0 2 2 2 412 107 13 10 10 12 6 9 2 11 6 4 8 2 6 2 613 335 16 8 6 21 20 24 34 22 14 33 30 16 23 32 3614 72 2 10 10 6 4 4 10 8 8 2 2 2 4 0 015 32 4 2 14 0 0 0 2 2 2 0 0 2 0 2 216 151 10 12 8 8 8 18 4 6 13 8 10 6 15 14 1117 46 7 6 1 0 6 2 0 4 2 2 6 4 2 4 0
Alberta 13,433 849 811 863 820 916 868 878 948 860 870 899 887 930 1,005 1,029Source: Vital Statistics, Birth File, Department of Government Services, October 2000 release.Notes: RHA boundaries are current as of 1998.
Data include Alberta residents only.
RHA Total Year
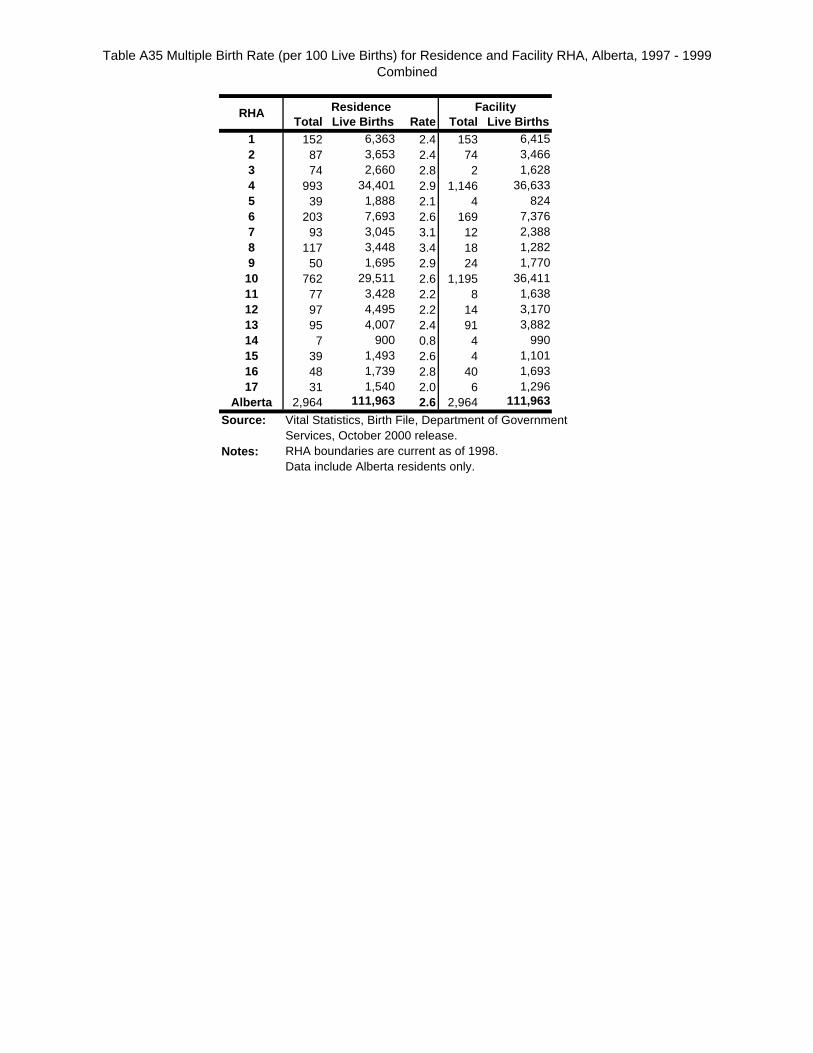
Table A35 Multiple Birth Rate (per 100 Live Births) for Residence and Facility RHA, Alberta, 1997 - 1999 Combined
Total Live Births Rate Total Live Births1 152 6,363 2.4 153 6,4152 87 3,653 2.4 74 3,4663 74 2,660 2.8 2 1,6284 993 34,401 2.9 1,146 36,6335 39 1,888 2.1 4 8246 203 7,693 2.6 169 7,3767 93 3,045 3.1 12 2,3888 117 3,448 3.4 18 1,2829 50 1,695 2.9 24 1,770
10 762 29,511 2.6 1,195 36,41111 77 3,428 2.2 8 1,63812 97 4,495 2.2 14 3,17013 95 4,007 2.4 91 3,88214 7 900 0.8 4 99015 39 1,493 2.6 4 1,10116 48 1,739 2.8 40 1,69317 31 1,540 2.0 6 1,296
Alberta 2,964 111,963 2.6 2,964 111,963
Source: Vital Statistics, Birth File, Department of Government Services, October 2000 release.
Notes: RHA boundaries are current as of 1998.Data include Alberta residents only.
RHA Residence Facility
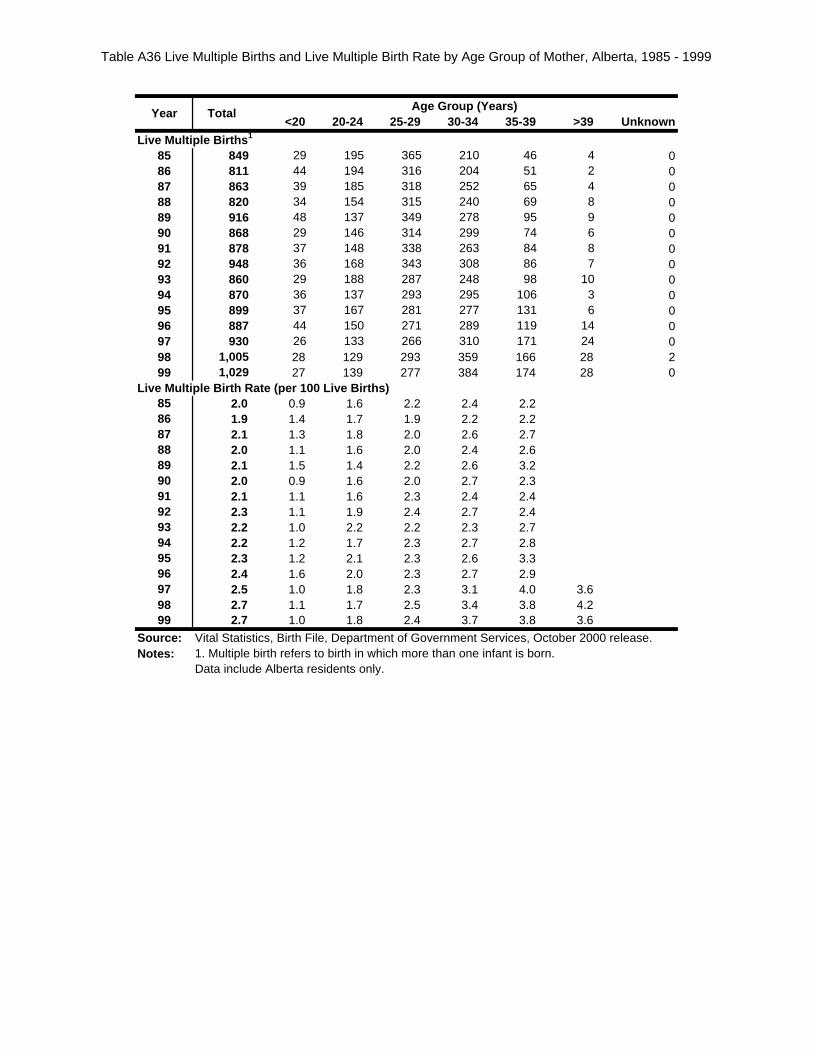
Table A36 Live Multiple Births and Live Multiple Birth Rate by Age Group of Mother, Alberta, 1985 - 1999
<20 20-24 25-29 30-34 35-39 >39 Unknown
Live Multiple Births 1
85 849 29 195 365 210 46 4 086 811 44 194 316 204 51 2 087 863 39 185 318 252 65 4 088 820 34 154 315 240 69 8 089 916 48 137 349 278 95 9 090 868 29 146 314 299 74 6 091 878 37 148 338 263 84 8 092 948 36 168 343 308 86 7 093 860 29 188 287 248 98 10 094 870 36 137 293 295 106 3 095 899 37 167 281 277 131 6 096 887 44 150 271 289 119 14 097 930 26 133 266 310 171 24 098 1,005 28 129 293 359 166 28 299 1,029 27 139 277 384 174 28 0
Live Multiple Birth Rate (per 100 Live Births)85 2.0 0.9 1.6 2.2 2.4 2.286 1.9 1.4 1.7 1.9 2.2 2.287 2.1 1.3 1.8 2.0 2.6 2.788 2.0 1.1 1.6 2.0 2.4 2.689 2.1 1.5 1.4 2.2 2.6 3.290 2.0 0.9 1.6 2.0 2.7 2.391 2.1 1.1 1.6 2.3 2.4 2.492 2.3 1.1 1.9 2.4 2.7 2.493 2.2 1.0 2.2 2.2 2.3 2.794 2.2 1.2 1.7 2.3 2.7 2.895 2.3 1.2 2.1 2.3 2.6 3.396 2.4 1.6 2.0 2.3 2.7 2.997 2.5 1.0 1.8 2.3 3.1 4.0 3.698 2.7 1.1 1.7 2.5 3.4 3.8 4.299 2.7 1.0 1.8 2.4 3.7 3.8 3.6
Source: Vital Statistics, Birth File, Department of Government Services, October 2000 release.Notes: 1. Multiple birth refers to birth in which more than one infant is born.
Data include Alberta residents only.
TotalYearAge Group (Years)
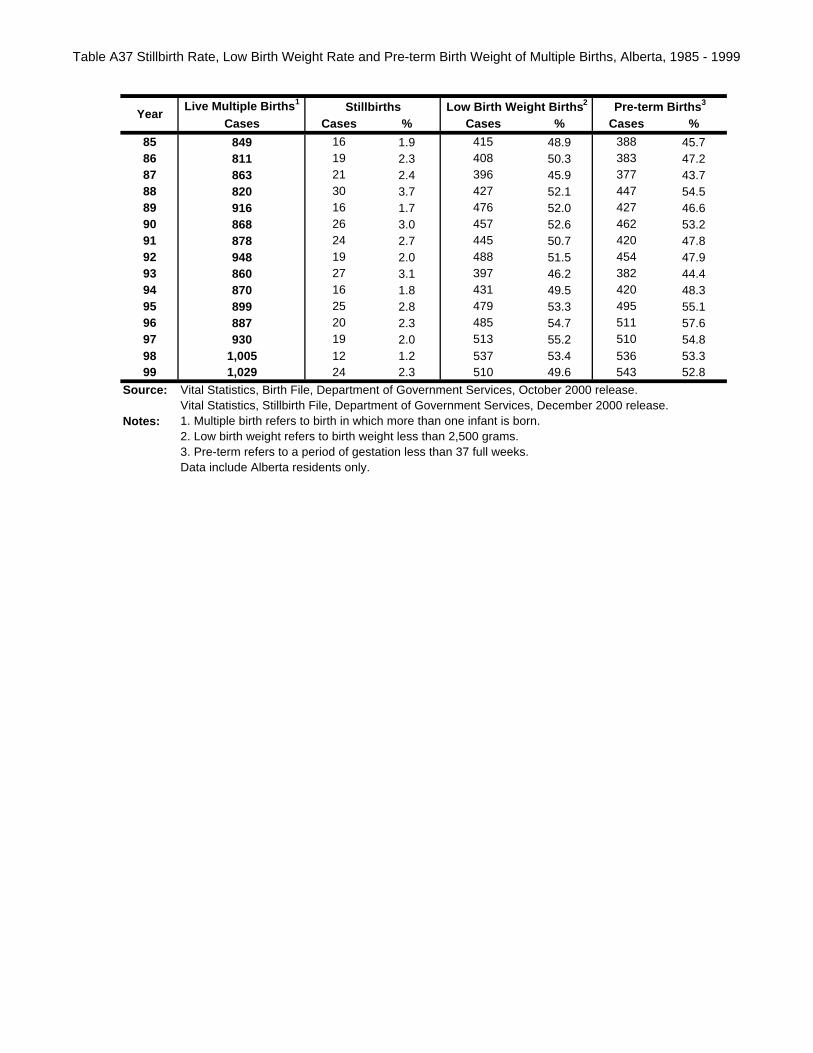
Table A37 Stillbirth Rate, Low Birth Weight Rate and Pre-term Birth Weight of Multiple Births, Alberta, 1985 - 1999
Live Multiple Births 1
Cases Cases % Cases % Cases %
85 849 16 1.9 415 48.9 388 45.786 811 19 2.3 408 50.3 383 47.287 863 21 2.4 396 45.9 377 43.788 820 30 3.7 427 52.1 447 54.589 916 16 1.7 476 52.0 427 46.690 868 26 3.0 457 52.6 462 53.291 878 24 2.7 445 50.7 420 47.892 948 19 2.0 488 51.5 454 47.993 860 27 3.1 397 46.2 382 44.494 870 16 1.8 431 49.5 420 48.395 899 25 2.8 479 53.3 495 55.196 887 20 2.3 485 54.7 511 57.697 930 19 2.0 513 55.2 510 54.898 1,005 12 1.2 537 53.4 536 53.399 1,029 24 2.3 510 49.6 543 52.8
Source: Vital Statistics, Birth File, Department of Government Services, October 2000 release.Vital Statistics, Stillbirth File, Department of Government Services, December 2000 release.
Notes: 1. Multiple birth refers to birth in which more than one infant is born.2. Low birth weight refers to birth weight less than 2,500 grams.3. Pre-term refers to a period of gestation less than 37 full weeks.Data include Alberta residents only.
Stillbirths Low Birth Weight Births 2 Pre-term Births 3
Year
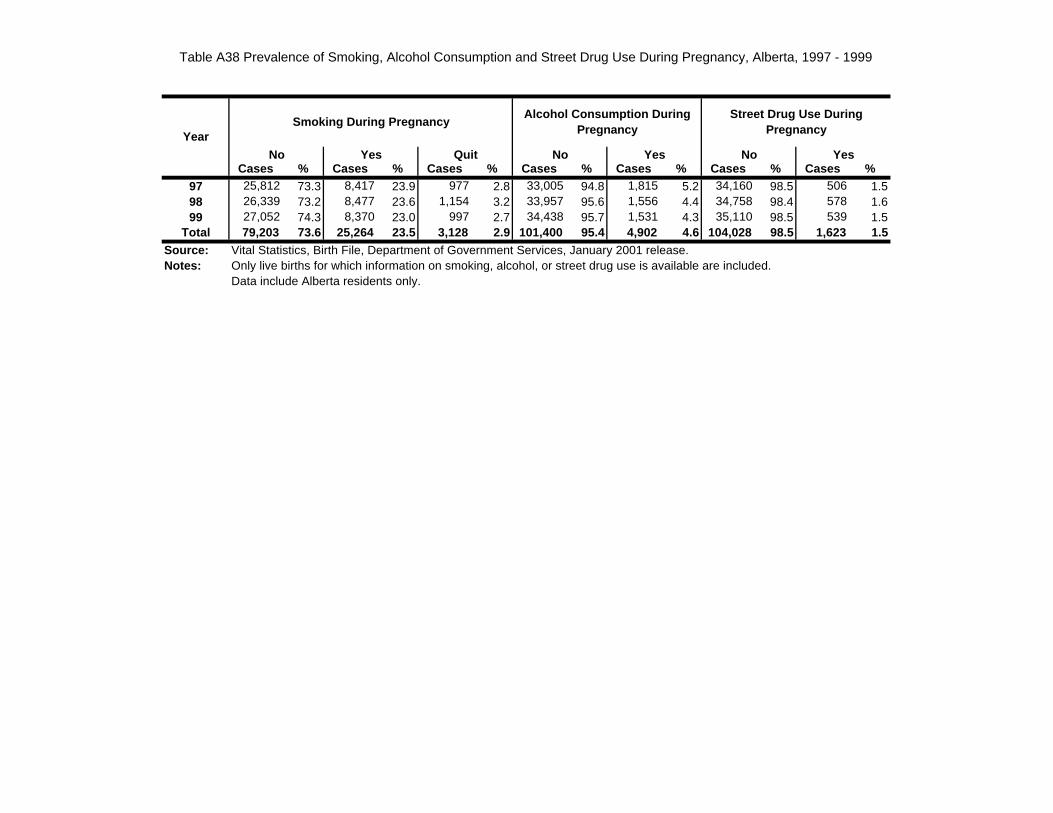
Table A38 Prevalence of Smoking, Alcohol Consumption and Street Drug Use During Pregnancy, Alberta, 1997 - 1999
Cases % Cases % Cases % Cases % Cases % Cases % Cases %97 25,812 73.3 8,417 23.9 977 2.8 33,005 94.8 1,815 5.2 34,160 98.5 506 1.598 26,339 73.2 8,477 23.6 1,154 3.2 33,957 95.6 1,556 4.4 34,758 98.4 578 1.699 27,052 74.3 8,370 23.0 997 2.7 34,438 95.7 1,531 4.3 35,110 98.5 539 1.5
Total 79,203 73.6 25,264 23.5 3,128 2.9 101,400 95.4 4,902 4.6 104,028 98.5 1,623 1.5Source: Vital Statistics, Birth File, Department of Government Services, January 2001 release.Notes: Only live births for which information on smoking, alcohol, or street drug use is available are included.
Data include Alberta residents only.
Yes
YearSmoking During Pregnancy
Alcohol Consumption During Pregnancy
Street Drug Use During Pregnancy
No Yes Quit No Yes No
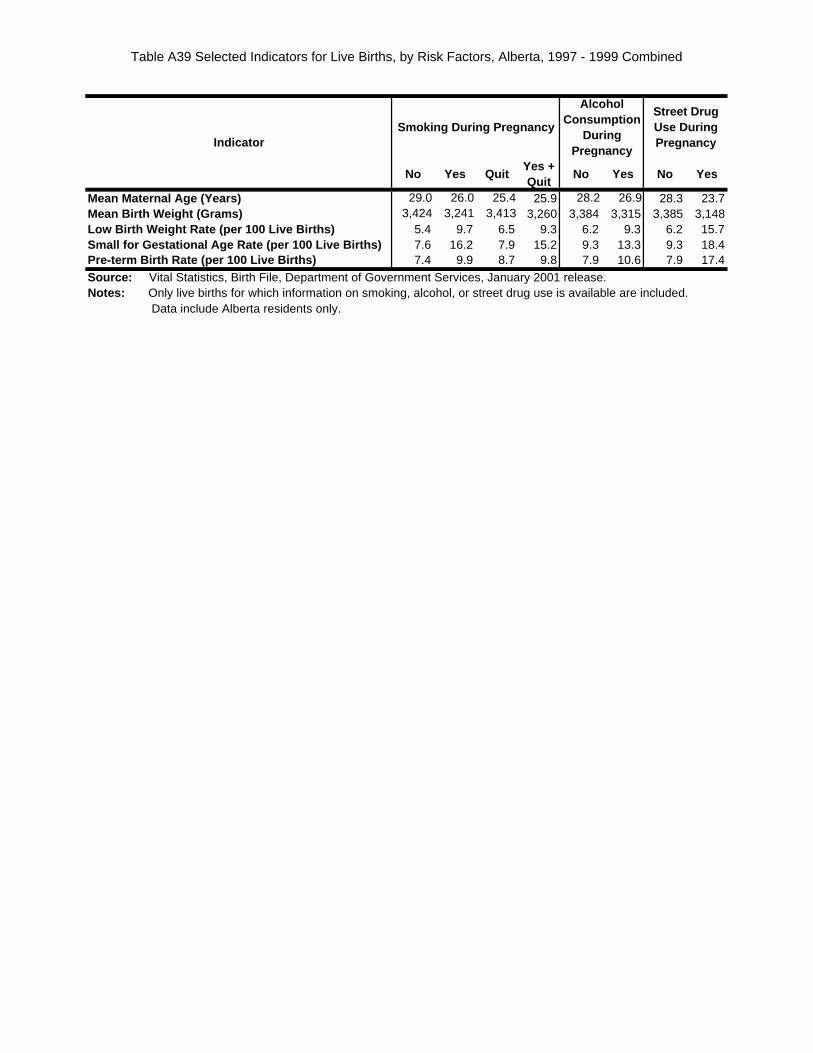
Table A39 Selected Indicators for Live Births, by Risk Factors, Alberta, 1997 - 1999 Combined
No Yes QuitYes + Quit
No Yes No Yes
Mean Maternal Age (Years) 29.0 26.0 25.4 25.9 28.2 26.9 28.3 23.7Mean Birth Weight (Grams) 3,424 3,241 3,413 3,260 3,384 3,315 3,385 3,148Low Birth Weight Rate (per 100 Live Births) 5.4 9.7 6.5 9.3 6.2 9.3 6.2 15.7Small for Gestational Age Rate (per 100 Live Births) 7.6 16.2 7.9 15.2 9.3 13.3 9.3 18.4Pre-term Birth Rate (per 100 Live Births) 7.4 9.9 8.7 9.8 7.9 10.6 7.9 17.4
Source: Vital Statistics, Birth File, Department of Government Services, January 2001 release.Notes: Only live births for which information on smoking, alcohol, or street drug use is available are included. Data include Alberta residents only.
Smoking During Pregnancy
Alcohol Consumption
During Pregnanc y
Street Drug Use During PregnancyIndicator
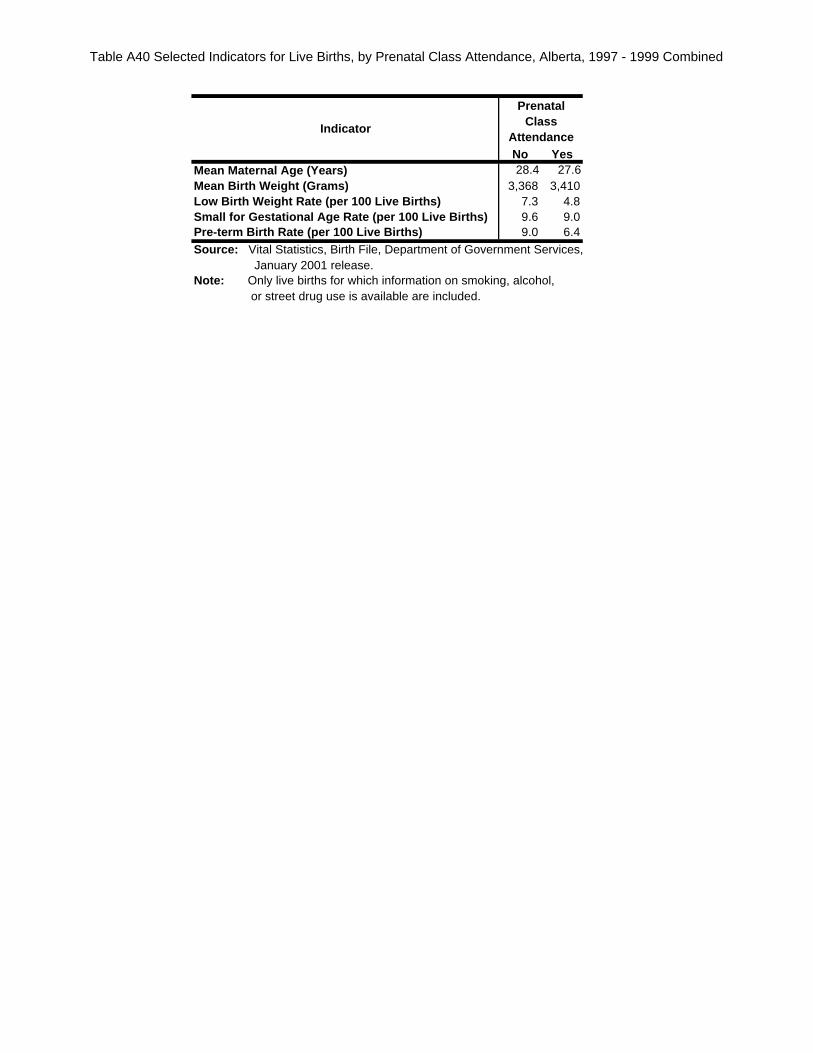
Table A40 Selected Indicators for Live Births, by Prenatal Class Attendance, Alberta, 1997 - 1999 Combined
No YesMean Maternal Age (Years) 28.4 27.6Mean Birth Weight (Grams) 3,368 3,410Low Birth Weight Rate (per 100 Live Births) 7.3 4.8Small for Gestational Age Rate (per 100 Live Births) 9.6 9.0Pre-term Birth Rate (per 100 Live Births) 9.0 6.4
Source: Vital Statistics, Birth File, Department of Government Services, January 2001 release.Note: Only live births for which information on smoking, alcohol, or street drug use is available are included.
Prenatal Class
AttendanceIndicator
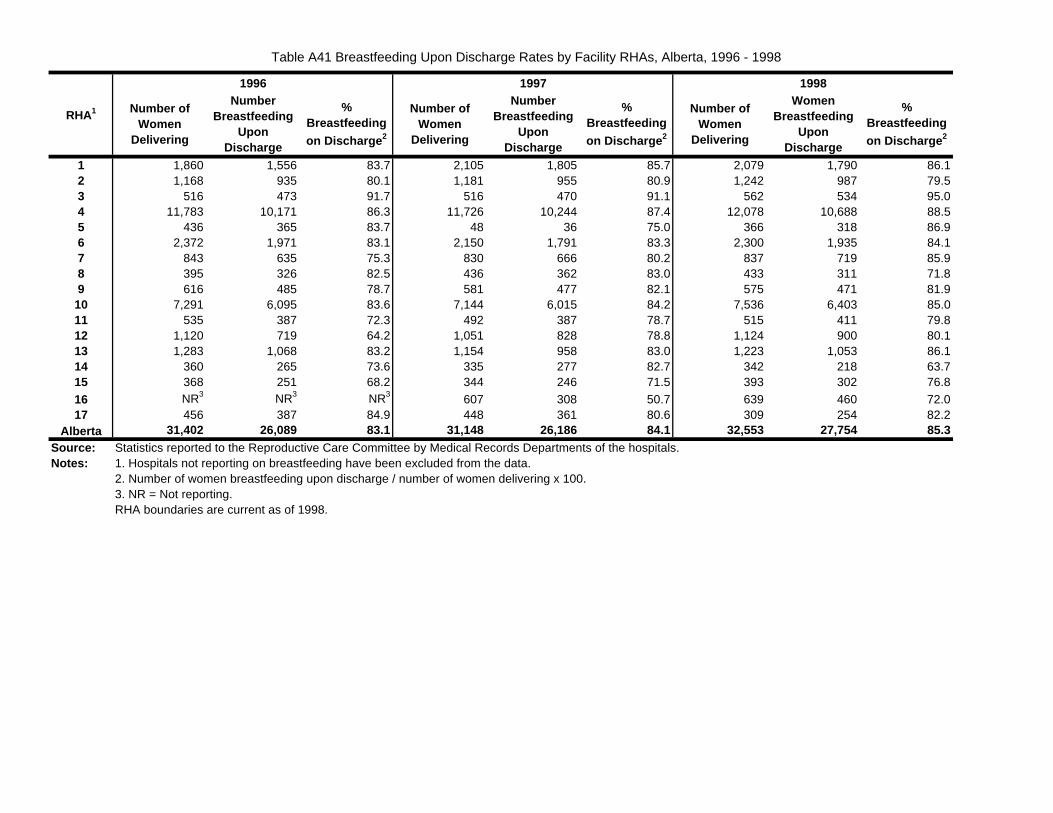
Table A41 Breastfeeding Upon Discharge Rates by Facility RHAs, Alberta, 1996 - 1998
Number of Women
Delivering
Number Breastfeeding
Upon Discharge
% Breastfeeding
on Discharge 2
Number of Women
Delivering
Number Breastfeeding
Upon Discharge
% Breastfeeding
on Discharge 2
Number of Women
Delivering
Women Breastfeeding
Upon Discharge
% Breastfeeding
on Discharge 2
1 1,860 1,556 83.7 2,105 1,805 85.7 2,079 1,790 86.12 1,168 935 80.1 1,181 955 80.9 1,242 987 79.53 516 473 91.7 516 470 91.1 562 534 95.04 11,783 10,171 86.3 11,726 10,244 87.4 12,078 10,688 88.55 436 365 83.7 48 36 75.0 366 318 86.96 2,372 1,971 83.1 2,150 1,791 83.3 2,300 1,935 84.17 843 635 75.3 830 666 80.2 837 719 85.98 395 326 82.5 436 362 83.0 433 311 71.89 616 485 78.7 581 477 82.1 575 471 81.9
10 7,291 6,095 83.6 7,144 6,015 84.2 7,536 6,403 85.011 535 387 72.3 492 387 78.7 515 411 79.812 1,120 719 64.2 1,051 828 78.8 1,124 900 80.113 1,283 1,068 83.2 1,154 958 83.0 1,223 1,053 86.114 360 265 73.6 335 277 82.7 342 218 63.715 368 251 68.2 344 246 71.5 393 302 76.8
16 NR3 NR3 NR3 607 308 50.7 639 460 72.017 456 387 84.9 448 361 80.6 309 254 82.2
Alberta 31,402 26,089 83.1 31,148 26,186 84.1 32,553 27,754 85.3Source: Statistics reported to the Reproductive Care Committee by Medical Records Departments of the hospitals.Notes: 1. Hospitals not reporting on breastfeeding have been excluded from the data.
2. Number of women breastfeeding upon discharge / number of women delivering x 100. 3. NR = Not reporting. RHA boundaries are current as of 1998.
19971996 1998
RHA1
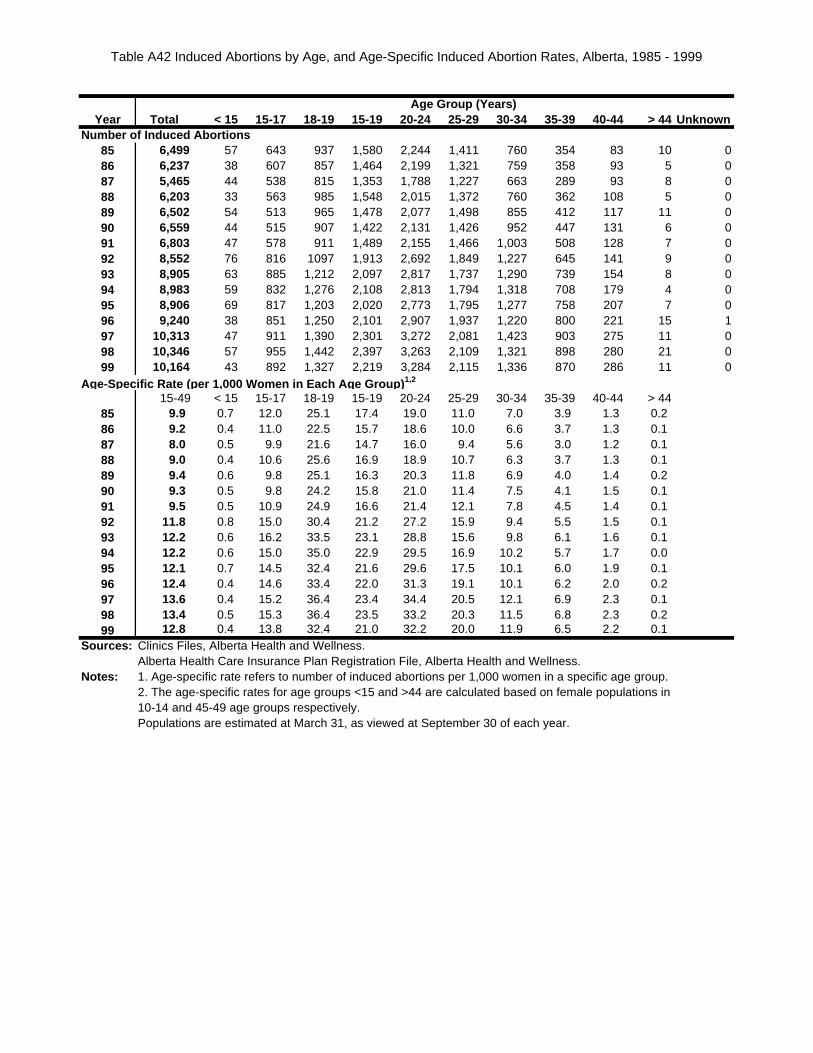
Table A42 Induced Abortions by Age, and Age-Specific Induced Abortion Rates, Alberta, 1985 - 1999
Age Group (Years)Year Total < 15 15-17 18-19 15-19 20-24 25-29 30-34 35-39 40-44 > 44 Unknown
Number of Induced Abortions85 6,499 57 643 937 1,580 2,244 1,411 760 354 83 10 086 6,237 38 607 857 1,464 2,199 1,321 759 358 93 5 087 5,465 44 538 815 1,353 1,788 1,227 663 289 93 8 088 6,203 33 563 985 1,548 2,015 1,372 760 362 108 5 089 6,502 54 513 965 1,478 2,077 1,498 855 412 117 11 090 6,559 44 515 907 1,422 2,131 1,426 952 447 131 6 091 6,803 47 578 911 1,489 2,155 1,466 1,003 508 128 7 092 8,552 76 816 1097 1,913 2,692 1,849 1,227 645 141 9 093 8,905 63 885 1,212 2,097 2,817 1,737 1,290 739 154 8 094 8,983 59 832 1,276 2,108 2,813 1,794 1,318 708 179 4 095 8,906 69 817 1,203 2,020 2,773 1,795 1,277 758 207 7 096 9,240 38 851 1,250 2,101 2,907 1,937 1,220 800 221 15 197 10,313 47 911 1,390 2,301 3,272 2,081 1,423 903 275 11 098 10,346 57 955 1,442 2,397 3,263 2,109 1,321 898 280 21 099 10,164 43 892 1,327 2,219 3,284 2,115 1,336 870 286 11 0
Age-Specific Rate (per 1,000 Women in Each A ge Grou p)1,2
15-49 < 15 15-17 18-19 15-19 20-24 25-29 30-34 35-39 40-44 > 4485 9.9 0.7 12.0 25.1 17.4 19.0 11.0 7.0 3.9 1.3 0.286 9.2 0.4 11.0 22.5 15.7 18.6 10.0 6.6 3.7 1.3 0.187 8.0 0.5 9.9 21.6 14.7 16.0 9.4 5.6 3.0 1.2 0.188 9.0 0.4 10.6 25.6 16.9 18.9 10.7 6.3 3.7 1.3 0.189 9.4 0.6 9.8 25.1 16.3 20.3 11.8 6.9 4.0 1.4 0.290 9.3 0.5 9.8 24.2 15.8 21.0 11.4 7.5 4.1 1.5 0.191 9.5 0.5 10.9 24.9 16.6 21.4 12.1 7.8 4.5 1.4 0.192 11.8 0.8 15.0 30.4 21.2 27.2 15.9 9.4 5.5 1.5 0.193 12.2 0.6 16.2 33.5 23.1 28.8 15.6 9.8 6.1 1.6 0.194 12.2 0.6 15.0 35.0 22.9 29.5 16.9 10.2 5.7 1.7 0.095 12.1 0.7 14.5 32.4 21.6 29.6 17.5 10.1 6.0 1.9 0.196 12.4 0.4 14.6 33.4 22.0 31.3 19.1 10.1 6.2 2.0 0.297 13.6 0.4 15.2 36.4 23.4 34.4 20.5 12.1 6.9 2.3 0.198 13.4 0.5 15.3 36.4 23.5 33.2 20.3 11.5 6.8 2.3 0.299 12.8 0.4 13.8 32.4 21.0 32.2 20.0 11.9 6.5 2.2 0.1
Sources: Clinics Files, Alberta Health and Wellness.Alberta Health Care Insurance Plan Registration File, Alberta Health and Wellness.
Notes: 1. Age-specific rate refers to number of induced abortions per 1,000 women in a specific age group. 2. The age-specific rates for age groups <15 and >44 are calculated based on female populations in 10-14 and 45-49 age groups respectively.Populations are estimated at March 31, as viewed at September 30 of each year.
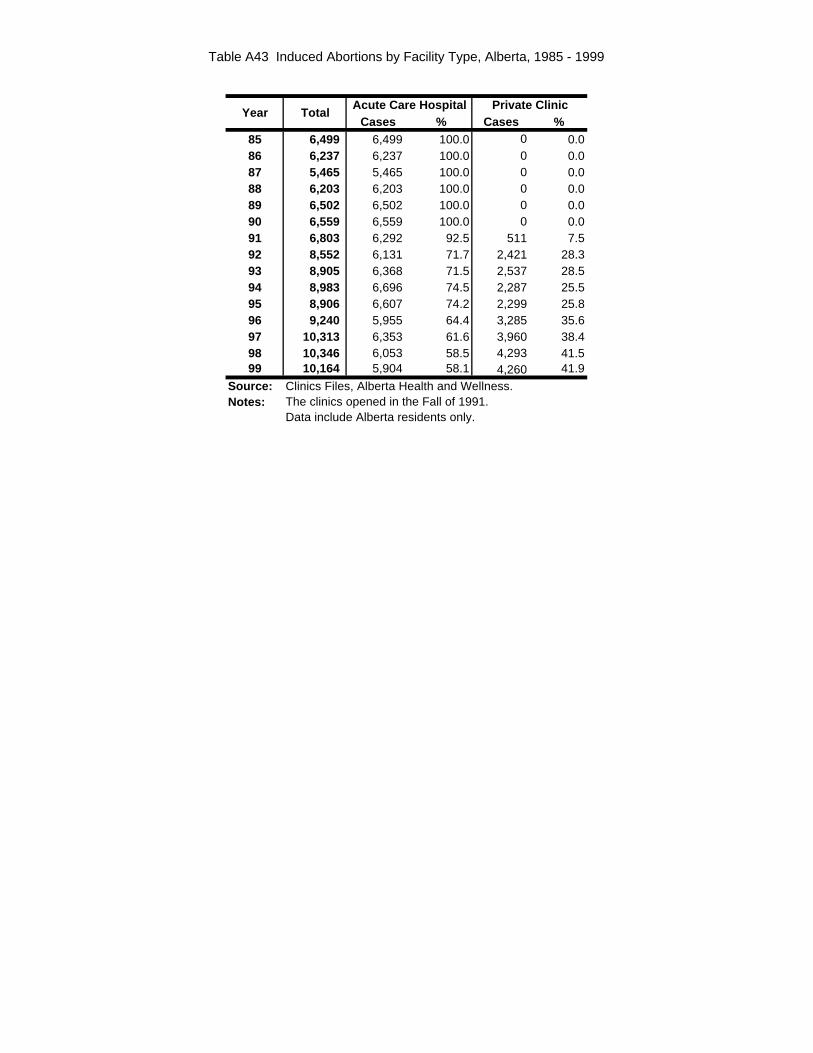
Table A43 Induced Abortions by Facility Type, Alberta, 1985 - 1999
Acute Care Hospital Private ClinicCases % Cases %
85 6,499 6,499 100.0 0 0.086 6,237 6,237 100.0 0 0.087 5,465 5,465 100.0 0 0.088 6,203 6,203 100.0 0 0.089 6,502 6,502 100.0 0 0.090 6,559 6,559 100.0 0 0.091 6,803 6,292 92.5 511 7.592 8,552 6,131 71.7 2,421 28.393 8,905 6,368 71.5 2,537 28.594 8,983 6,696 74.5 2,287 25.595 8,906 6,607 74.2 2,299 25.896 9,240 5,955 64.4 3,285 35.697 10,313 6,353 61.6 3,960 38.498 10,346 6,053 58.5 4,293 41.599 10,164 5,904 58.1 4,260 41.9
Source: Clinics Files, Alberta Health and Wellness.Notes: The clinics opened in the Fall of 1991.
Data include Alberta residents only.
Year Total
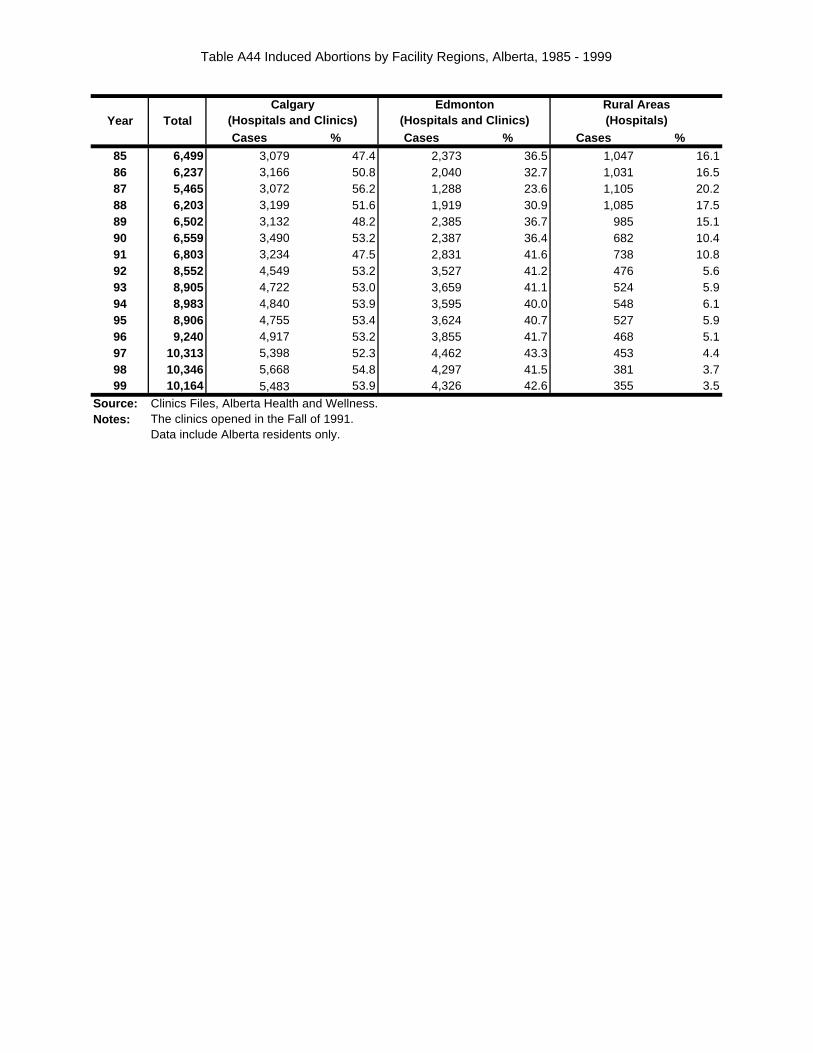
Table A44 Induced Abortions by Facility Regions, Alberta, 1985 - 1999
Cases % Cases % Cases %
85 6,499 3,079 47.4 2,373 36.5 1,047 16.186 6,237 3,166 50.8 2,040 32.7 1,031 16.587 5,465 3,072 56.2 1,288 23.6 1,105 20.288 6,203 3,199 51.6 1,919 30.9 1,085 17.589 6,502 3,132 48.2 2,385 36.7 985 15.190 6,559 3,490 53.2 2,387 36.4 682 10.491 6,803 3,234 47.5 2,831 41.6 738 10.892 8,552 4,549 53.2 3,527 41.2 476 5.693 8,905 4,722 53.0 3,659 41.1 524 5.994 8,983 4,840 53.9 3,595 40.0 548 6.195 8,906 4,755 53.4 3,624 40.7 527 5.996 9,240 4,917 53.2 3,855 41.7 468 5.197 10,313 5,398 52.3 4,462 43.3 453 4.498 10,346 5,668 54.8 4,297 41.5 381 3.799 10,164 5,483 53.9 4,326 42.6 355 3.5
Source: Clinics Files, Alberta Health and Wellness.Notes: The clinics opened in the Fall of 1991.
Data include Alberta residents only.
TotalYearRural Areas(Hospitals)
Calgary Edmonton(Hospitals and Clinics) (Hospitals and Clinics)
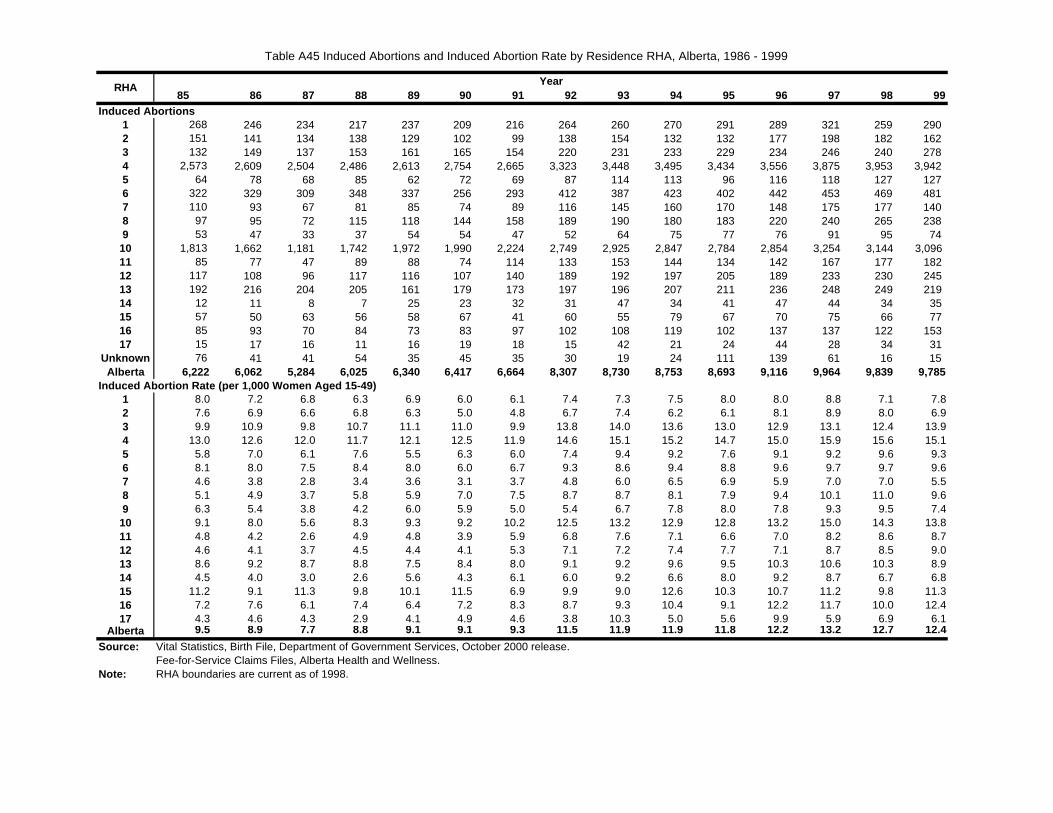
Table A45 Induced Abortions and Induced Abortion Rate by Residence RHA, Alberta, 1986 - 1999
85 86 87 88 89 90 91 92 93 94 95 96 97 98 99Induced Abortions
1 268 246 234 217 237 209 216 264 260 270 291 289 321 259 290 2 151 141 134 138 129 102 99 138 154 132 132 177 198 182 162 3 132 149 137 153 161 165 154 220 231 233 229 234 246 240 278 4 2,573 2,609 2,504 2,486 2,613 2,754 2,665 3,323 3,448 3,495 3,434 3,556 3,875 3,953 3,942 5 64 78 68 85 62 72 69 87 114 113 96 116 118 127 127 6 322 329 309 348 337 256 293 412 387 423 402 442 453 469 481 7 110 93 67 81 85 74 89 116 145 160 170 148 175 177 140 8 97 95 72 115 118 144 158 189 190 180 183 220 240 265 238 9 53 47 33 37 54 54 47 52 64 75 77 76 91 95 74
10 1,813 1,662 1,181 1,742 1,972 1,990 2,224 2,749 2,925 2,847 2,784 2,854 3,254 3,144 3,096 11 85 77 47 89 88 74 114 133 153 144 134 142 167 177 182 12 117 108 96 117 116 107 140 189 192 197 205 189 233 230 245 13 192 216 204 205 161 179 173 197 196 207 211 236 248 249 219 14 12 11 8 7 25 23 32 31 47 34 41 47 44 34 35 15 57 50 63 56 58 67 41 60 55 79 67 70 75 66 77 16 85 93 70 84 73 83 97 102 108 119 102 137 137 122 153 17 15 17 16 11 16 19 18 15 42 21 24 44 28 34 31
Unknown 76 41 41 54 35 45 35 30 19 24 111 139 61 16 15 Alberta 6,222 6,062 5,284 6,025 6,340 6,417 6,664 8,307 8,730 8,753 8,693 9,116 9,964 9,839 9,785
Induced Abortion Rate (per 1,000 Women Aged 15-49)1 8.0 7.2 6.8 6.3 6.9 6.0 6.1 7.4 7.3 7.5 8.0 8.0 8.8 7.1 7.82 7.6 6.9 6.6 6.8 6.3 5.0 4.8 6.7 7.4 6.2 6.1 8.1 8.9 8.0 6.93 9.9 10.9 9.8 10.7 11.1 11.0 9.9 13.8 14.0 13.6 13.0 12.9 13.1 12.4 13.94 13.0 12.6 12.0 11.7 12.1 12.5 11.9 14.6 15.1 15.2 14.7 15.0 15.9 15.6 15.15 5.8 7.0 6.1 7.6 5.5 6.3 6.0 7.4 9.4 9.2 7.6 9.1 9.2 9.6 9.36 8.1 8.0 7.5 8.4 8.0 6.0 6.7 9.3 8.6 9.4 8.8 9.6 9.7 9.7 9.67 4.6 3.8 2.8 3.4 3.6 3.1 3.7 4.8 6.0 6.5 6.9 5.9 7.0 7.0 5.58 5.1 4.9 3.7 5.8 5.9 7.0 7.5 8.7 8.7 8.1 7.9 9.4 10.1 11.0 9.69 6.3 5.4 3.8 4.2 6.0 5.9 5.0 5.4 6.7 7.8 8.0 7.8 9.3 9.5 7.4
10 9.1 8.0 5.6 8.3 9.3 9.2 10.2 12.5 13.2 12.9 12.8 13.2 15.0 14.3 13.811 4.8 4.2 2.6 4.9 4.8 3.9 5.9 6.8 7.6 7.1 6.6 7.0 8.2 8.6 8.712 4.6 4.1 3.7 4.5 4.4 4.1 5.3 7.1 7.2 7.4 7.7 7.1 8.7 8.5 9.013 8.6 9.2 8.7 8.8 7.5 8.4 8.0 9.1 9.2 9.6 9.5 10.3 10.6 10.3 8.914 4.5 4.0 3.0 2.6 5.6 4.3 6.1 6.0 9.2 6.6 8.0 9.2 8.7 6.7 6.815 11.2 9.1 11.3 9.8 10.1 11.5 6.9 9.9 9.0 12.6 10.3 10.7 11.2 9.8 11.316 7.2 7.6 6.1 7.4 6.4 7.2 8.3 8.7 9.3 10.4 9.1 12.2 11.7 10.0 12.417 4.3 4.6 4.3 2.9 4.1 4.9 4.6 3.8 10.3 5.0 5.6 9.9 5.9 6.9 6.1
Alberta 9.5 8.9 7.7 8.8 9.1 9.1 9.3 11.5 11.9 11.9 11.8 12.2 13.2 12.7 12.4
Source: Vital Statistics, Birth File, Department of Government Services, October 2000 release.Fee-for-Service Claims Files, Alberta Health and Wellness.
Note: RHA boundaries are current as of 1998.
YearRHA
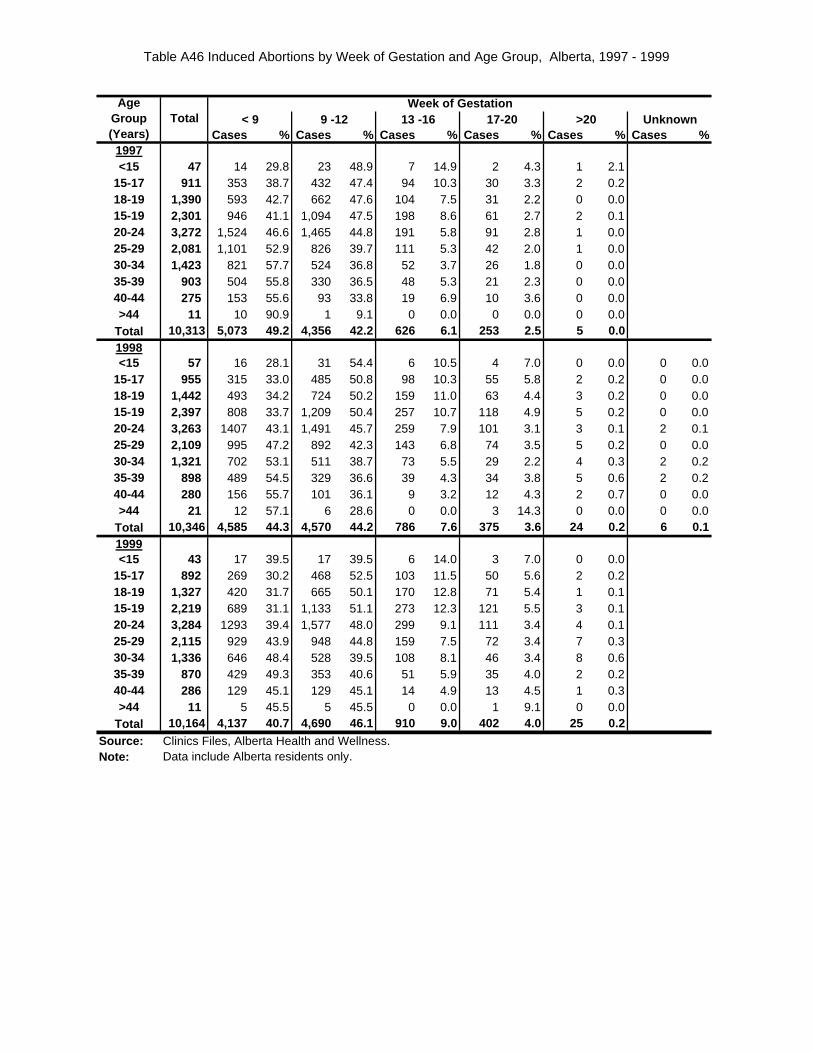
Table A46 Induced Abortions by Week of Gestation and Age Group, Alberta, 1997 - 1999
< 9 9 -12 13 -16 17-20 >20 UnknownCases % Cases % Cases % Cases % Cases % Cases %
1997<15 47 14 29.8 23 48.9 7 14.9 2 4.3 1 2.1
15-17 911 353 38.7 432 47.4 94 10.3 30 3.3 2 0.218-19 1,390 593 42.7 662 47.6 104 7.5 31 2.2 0 0.015-19 2,301 946 41.1 1,094 47.5 198 8.6 61 2.7 2 0.120-24 3,272 1,524 46.6 1,465 44.8 191 5.8 91 2.8 1 0.025-29 2,081 1,101 52.9 826 39.7 111 5.3 42 2.0 1 0.030-34 1,423 821 57.7 524 36.8 52 3.7 26 1.8 0 0.035-39 903 504 55.8 330 36.5 48 5.3 21 2.3 0 0.040-44 275 153 55.6 93 33.8 19 6.9 10 3.6 0 0.0>44 11 10 90.9 1 9.1 0 0.0 0 0.0 0 0.0
Total 10,313 5,073 49.2 4,356 42.2 626 6.1 253 2.5 5 0.01998<15 57 16 28.1 31 54.4 6 10.5 4 7.0 0 0.0 0 0.0
15-17 955 315 33.0 485 50.8 98 10.3 55 5.8 2 0.2 0 0.018-19 1,442 493 34.2 724 50.2 159 11.0 63 4.4 3 0.2 0 0.015-19 2,397 808 33.7 1,209 50.4 257 10.7 118 4.9 5 0.2 0 0.020-24 3,263 1407 43.1 1,491 45.7 259 7.9 101 3.1 3 0.1 2 0.125-29 2,109 995 47.2 892 42.3 143 6.8 74 3.5 5 0.2 0 0.030-34 1,321 702 53.1 511 38.7 73 5.5 29 2.2 4 0.3 2 0.235-39 898 489 54.5 329 36.6 39 4.3 34 3.8 5 0.6 2 0.240-44 280 156 55.7 101 36.1 9 3.2 12 4.3 2 0.7 0 0.0>44 21 12 57.1 6 28.6 0 0.0 3 14.3 0 0.0 0 0.0
Total 10,346 4,585 44.3 4,570 44.2 786 7.6 375 3.6 24 0.2 6 0.11999<15 43 17 39.5 17 39.5 6 14.0 3 7.0 0 0.0
15-17 892 269 30.2 468 52.5 103 11.5 50 5.6 2 0.218-19 1,327 420 31.7 665 50.1 170 12.8 71 5.4 1 0.115-19 2,219 689 31.1 1,133 51.1 273 12.3 121 5.5 3 0.120-24 3,284 1293 39.4 1,577 48.0 299 9.1 111 3.4 4 0.125-29 2,115 929 43.9 948 44.8 159 7.5 72 3.4 7 0.330-34 1,336 646 48.4 528 39.5 108 8.1 46 3.4 8 0.635-39 870 429 49.3 353 40.6 51 5.9 35 4.0 2 0.240-44 286 129 45.1 129 45.1 14 4.9 13 4.5 1 0.3>44 11 5 45.5 5 45.5 0 0.0 1 9.1 0 0.0
Total 10,164 4,137 40.7 4,690 46.1 910 9.0 402 4.0 25 0.2Source: Clinics Files, Alberta Health and Wellness.Note: Data include Alberta residents only.
Week of GestationAge Group (Years)
Total
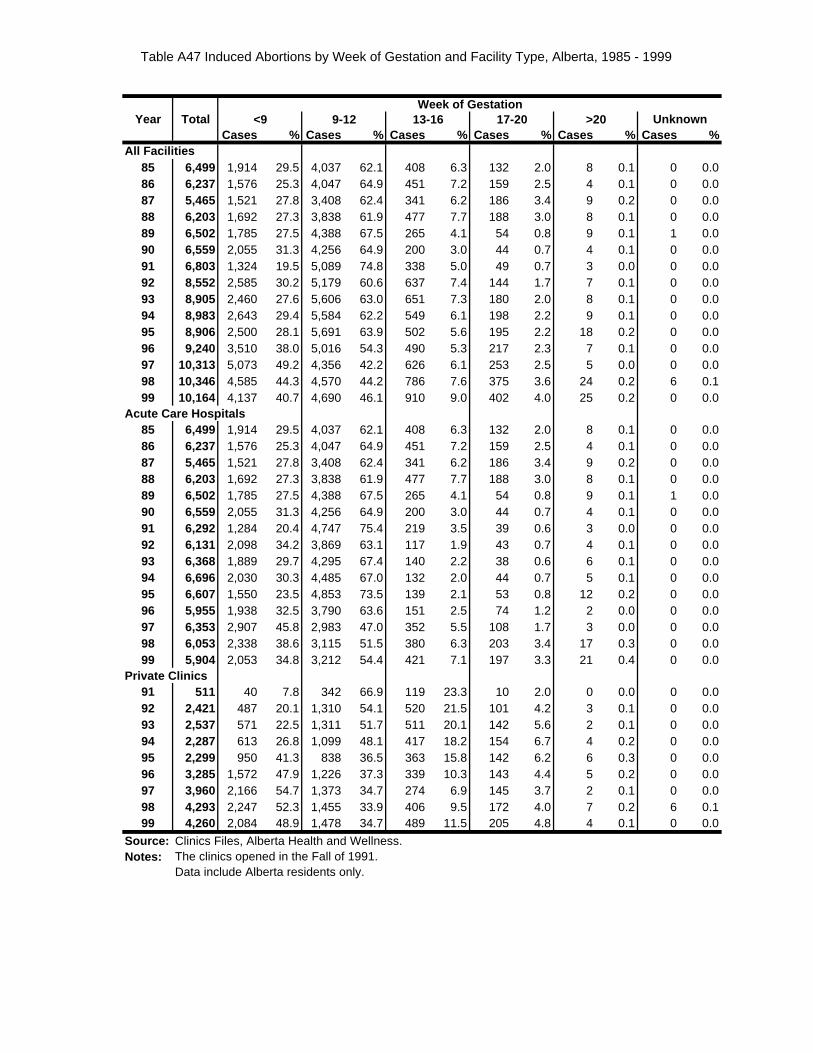
Table A47 Induced Abortions by Week of Gestation and Facility Type, Alberta, 1985 - 1999
<9 9-12 13-16 17-20 >20Cases % Cases % Cases % Cases % Cases % Cases %
All Facilities85 6,499 1,914 29.5 4,037 62.1 408 6.3 132 2.0 8 0.1 0 0.086 6,237 1,576 25.3 4,047 64.9 451 7.2 159 2.5 4 0.1 0 0.087 5,465 1,521 27.8 3,408 62.4 341 6.2 186 3.4 9 0.2 0 0.088 6,203 1,692 27.3 3,838 61.9 477 7.7 188 3.0 8 0.1 0 0.089 6,502 1,785 27.5 4,388 67.5 265 4.1 54 0.8 9 0.1 1 0.090 6,559 2,055 31.3 4,256 64.9 200 3.0 44 0.7 4 0.1 0 0.091 6,803 1,324 19.5 5,089 74.8 338 5.0 49 0.7 3 0.0 0 0.092 8,552 2,585 30.2 5,179 60.6 637 7.4 144 1.7 7 0.1 0 0.093 8,905 2,460 27.6 5,606 63.0 651 7.3 180 2.0 8 0.1 0 0.094 8,983 2,643 29.4 5,584 62.2 549 6.1 198 2.2 9 0.1 0 0.095 8,906 2,500 28.1 5,691 63.9 502 5.6 195 2.2 18 0.2 0 0.096 9,240 3,510 38.0 5,016 54.3 490 5.3 217 2.3 7 0.1 0 0.097 10,313 5,073 49.2 4,356 42.2 626 6.1 253 2.5 5 0.0 0 0.098 10,346 4,585 44.3 4,570 44.2 786 7.6 375 3.6 24 0.2 6 0.199 10,164 4,137 40.7 4,690 46.1 910 9.0 402 4.0 25 0.2 0 0.0
Acute Care Hospitals85 6,499 1,914 29.5 4,037 62.1 408 6.3 132 2.0 8 0.1 0 0.086 6,237 1,576 25.3 4,047 64.9 451 7.2 159 2.5 4 0.1 0 0.087 5,465 1,521 27.8 3,408 62.4 341 6.2 186 3.4 9 0.2 0 0.088 6,203 1,692 27.3 3,838 61.9 477 7.7 188 3.0 8 0.1 0 0.089 6,502 1,785 27.5 4,388 67.5 265 4.1 54 0.8 9 0.1 1 0.090 6,559 2,055 31.3 4,256 64.9 200 3.0 44 0.7 4 0.1 0 0.091 6,292 1,284 20.4 4,747 75.4 219 3.5 39 0.6 3 0.0 0 0.092 6,131 2,098 34.2 3,869 63.1 117 1.9 43 0.7 4 0.1 0 0.093 6,368 1,889 29.7 4,295 67.4 140 2.2 38 0.6 6 0.1 0 0.094 6,696 2,030 30.3 4,485 67.0 132 2.0 44 0.7 5 0.1 0 0.095 6,607 1,550 23.5 4,853 73.5 139 2.1 53 0.8 12 0.2 0 0.096 5,955 1,938 32.5 3,790 63.6 151 2.5 74 1.2 2 0.0 0 0.097 6,353 2,907 45.8 2,983 47.0 352 5.5 108 1.7 3 0.0 0 0.098 6,053 2,338 38.6 3,115 51.5 380 6.3 203 3.4 17 0.3 0 0.099 5,904 2,053 34.8 3,212 54.4 421 7.1 197 3.3 21 0.4 0 0.0
Private Clinics91 511 40 7.8 342 66.9 119 23.3 10 2.0 0 0.0 0 0.092 2,421 487 20.1 1,310 54.1 520 21.5 101 4.2 3 0.1 0 0.093 2,537 571 22.5 1,311 51.7 511 20.1 142 5.6 2 0.1 0 0.094 2,287 613 26.8 1,099 48.1 417 18.2 154 6.7 4 0.2 0 0.095 2,299 950 41.3 838 36.5 363 15.8 142 6.2 6 0.3 0 0.096 3,285 1,572 47.9 1,226 37.3 339 10.3 143 4.4 5 0.2 0 0.097 3,960 2,166 54.7 1,373 34.7 274 6.9 145 3.7 2 0.1 0 0.098 4,293 2,247 52.3 1,455 33.9 406 9.5 172 4.0 7 0.2 6 0.199 4,260 2,084 48.9 1,478 34.7 489 11.5 205 4.8 4 0.1 0 0.0
Source: Clinics Files, Alberta Health and Wellness.Notes: The clinics opened in the Fall of 1991.
Data include Alberta residents only.
UnknownYear TotalWeek of Gestation
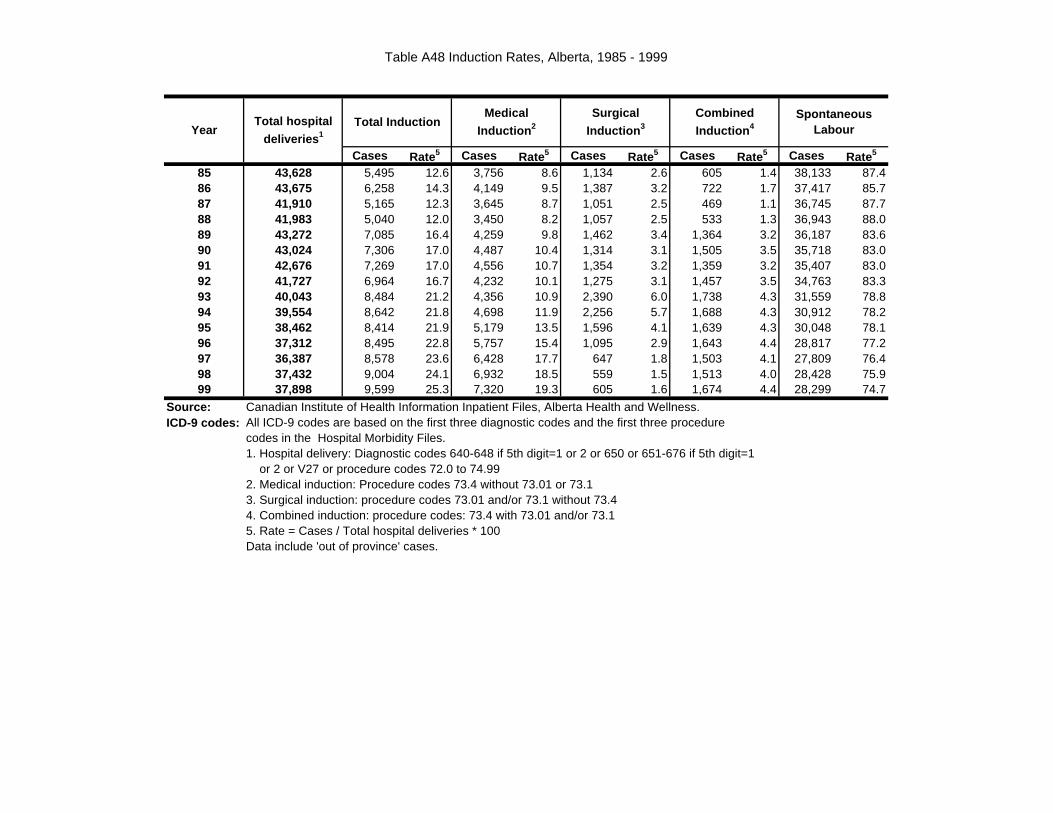
Table A48 Induction Rates, Alberta, 1985 - 1999
Medical
Induction 2
Surgical
Induction 3
Combined
Induction 4Spontaneous
Labour
Cases Rate5 Cases Rate5 Cases Rate5 Cases Rate5 Cases Rate5
85 43,628 5,495 12.6 3,756 8.6 1,134 2.6 605 1.4 38,133 87.486 43,675 6,258 14.3 4,149 9.5 1,387 3.2 722 1.7 37,417 85.787 41,910 5,165 12.3 3,645 8.7 1,051 2.5 469 1.1 36,745 87.788 41,983 5,040 12.0 3,450 8.2 1,057 2.5 533 1.3 36,943 88.089 43,272 7,085 16.4 4,259 9.8 1,462 3.4 1,364 3.2 36,187 83.690 43,024 7,306 17.0 4,487 10.4 1,314 3.1 1,505 3.5 35,718 83.091 42,676 7,269 17.0 4,556 10.7 1,354 3.2 1,359 3.2 35,407 83.092 41,727 6,964 16.7 4,232 10.1 1,275 3.1 1,457 3.5 34,763 83.393 40,043 8,484 21.2 4,356 10.9 2,390 6.0 1,738 4.3 31,559 78.894 39,554 8,642 21.8 4,698 11.9 2,256 5.7 1,688 4.3 30,912 78.295 38,462 8,414 21.9 5,179 13.5 1,596 4.1 1,639 4.3 30,048 78.196 37,312 8,495 22.8 5,757 15.4 1,095 2.9 1,643 4.4 28,817 77.297 36,387 8,578 23.6 6,428 17.7 647 1.8 1,503 4.1 27,809 76.498 37,432 9,004 24.1 6,932 18.5 559 1.5 1,513 4.0 28,428 75.999 37,898 9,599 25.3 7,320 19.3 605 1.6 1,674 4.4 28,299 74.7
Source: Canadian Institute of Health Information Inpatient Files, Alberta Health and Wellness.ICD-9 codes: All ICD-9 codes are based on the first three diagnostic codes and the first three procedure
codes in the Hospital Morbidity Files.1. Hospital delivery: Diagnostic codes 640-648 if 5th digit=1 or 2 or 650 or 651-676 if 5th digit=1 or 2 or V27 or procedure codes 72.0 to 74.992. Medical induction: Procedure codes 73.4 without 73.01 or 73.13. Surgical induction: procedure codes 73.01 and/or 73.1 without 73.44. Combined induction: procedure codes: 73.4 with 73.01 and/or 73.15. Rate = Cases / Total hospital deliveries * 100Data include 'out of province' cases.
Total InductionYear
Total hospital
deliveries 1
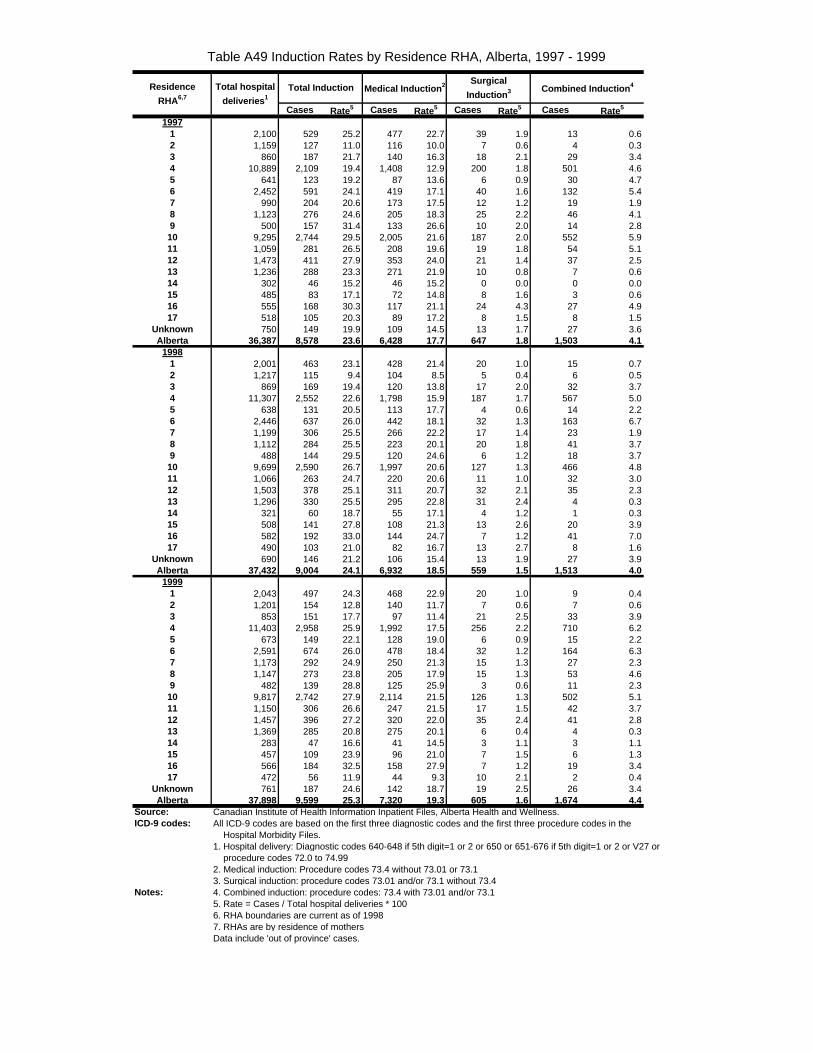
Table A49 Induction Rates by Residence RHA, Alberta, 1997 - 1999
Medical Induction 2 Surgical
Induction 3
Cases Rate5 Cases Rate5 Cases Rate5 Cases Rate5
19971 2,100 529 25.2 477 22.7 39 1.9 13 0.62 1,159 127 11.0 116 10.0 7 0.6 4 0.33 860 187 21.7 140 16.3 18 2.1 29 3.44 10,889 2,109 19.4 1,408 12.9 200 1.8 501 4.65 641 123 19.2 87 13.6 6 0.9 30 4.76 2,452 591 24.1 419 17.1 40 1.6 132 5.47 990 204 20.6 173 17.5 12 1.2 19 1.98 1,123 276 24.6 205 18.3 25 2.2 46 4.19 500 157 31.4 133 26.6 10 2.0 14 2.810 9,295 2,744 29.5 2,005 21.6 187 2.0 552 5.911 1,059 281 26.5 208 19.6 19 1.8 54 5.112 1,473 411 27.9 353 24.0 21 1.4 37 2.513 1,236 288 23.3 271 21.9 10 0.8 7 0.614 302 46 15.2 46 15.2 0 0.0 0 0.015 485 83 17.1 72 14.8 8 1.6 3 0.616 555 168 30.3 117 21.1 24 4.3 27 4.917 518 105 20.3 89 17.2 8 1.5 8 1.5
Unknown 750 149 19.9 109 14.5 13 1.7 27 3.6Alberta 36,387 8,578 23.6 6,428 17.7 647 1.8 1,503 4.1
19981 2,001 463 23.1 428 21.4 20 1.0 15 0.72 1,217 115 9.4 104 8.5 5 0.4 6 0.53 869 169 19.4 120 13.8 17 2.0 32 3.74 11,307 2,552 22.6 1,798 15.9 187 1.7 567 5.05 638 131 20.5 113 17.7 4 0.6 14 2.26 2,446 637 26.0 442 18.1 32 1.3 163 6.77 1,199 306 25.5 266 22.2 17 1.4 23 1.98 1,112 284 25.5 223 20.1 20 1.8 41 3.79 488 144 29.5 120 24.6 6 1.2 18 3.710 9,699 2,590 26.7 1,997 20.6 127 1.3 466 4.811 1,066 263 24.7 220 20.6 11 1.0 32 3.012 1,503 378 25.1 311 20.7 32 2.1 35 2.313 1,296 330 25.5 295 22.8 31 2.4 4 0.314 321 60 18.7 55 17.1 4 1.2 1 0.315 508 141 27.8 108 21.3 13 2.6 20 3.916 582 192 33.0 144 24.7 7 1.2 41 7.017 490 103 21.0 82 16.7 13 2.7 8 1.6
Unknown 690 146 21.2 106 15.4 13 1.9 27 3.9Alberta 37,432 9,004 24.1 6,932 18.5 559 1.5 1,513 4.0
19991 2,043 497 24.3 468 22.9 20 1.0 9 0.42 1,201 154 12.8 140 11.7 7 0.6 7 0.63 853 151 17.7 97 11.4 21 2.5 33 3.94 11,403 2,958 25.9 1,992 17.5 256 2.2 710 6.25 673 149 22.1 128 19.0 6 0.9 15 2.26 2,591 674 26.0 478 18.4 32 1.2 164 6.37 1,173 292 24.9 250 21.3 15 1.3 27 2.38 1,147 273 23.8 205 17.9 15 1.3 53 4.69 482 139 28.8 125 25.9 3 0.6 11 2.310 9,817 2,742 27.9 2,114 21.5 126 1.3 502 5.111 1,150 306 26.6 247 21.5 17 1.5 42 3.712 1,457 396 27.2 320 22.0 35 2.4 41 2.813 1,369 285 20.8 275 20.1 6 0.4 4 0.314 283 47 16.6 41 14.5 3 1.1 3 1.115 457 109 23.9 96 21.0 7 1.5 6 1.316 566 184 32.5 158 27.9 7 1.2 19 3.417 472 56 11.9 44 9.3 10 2.1 2 0.4
Unknown 761 187 24.6 142 18.7 19 2.5 26 3.4Alberta 37,898 9,599 25.3 7,320 19.3 605 1.6 1,674 4.4
Source: Canadian Institute of Health Information Inpatient Files, Alberta Health and Wellness.ICD-9 codes: All ICD-9 codes are based on the first three diagnostic codes and the first three procedure codes in the
Hospital Morbidity Files.1. Hospital delivery: Diagnostic codes 640-648 if 5th digit=1 or 2 or 650 or 651-676 if 5th digit=1 or 2 or V27 or procedure codes 72.0 to 74.992. Medical induction: Procedure codes 73.4 without 73.01 or 73.13. Surgical induction: procedure codes 73.01 and/or 73.1 without 73.4
Notes: 4. Combined induction: procedure codes: 73.4 with 73.01 and/or 73.15. Rate = Cases / Total hospital deliveries * 1006. RHA boundaries are current as of 19987. RHAs are by residence of mothersData include 'out of province' cases.
Total InductionTotal hospital
deliveries 1Combined Induction 4Residence
RHA6,7
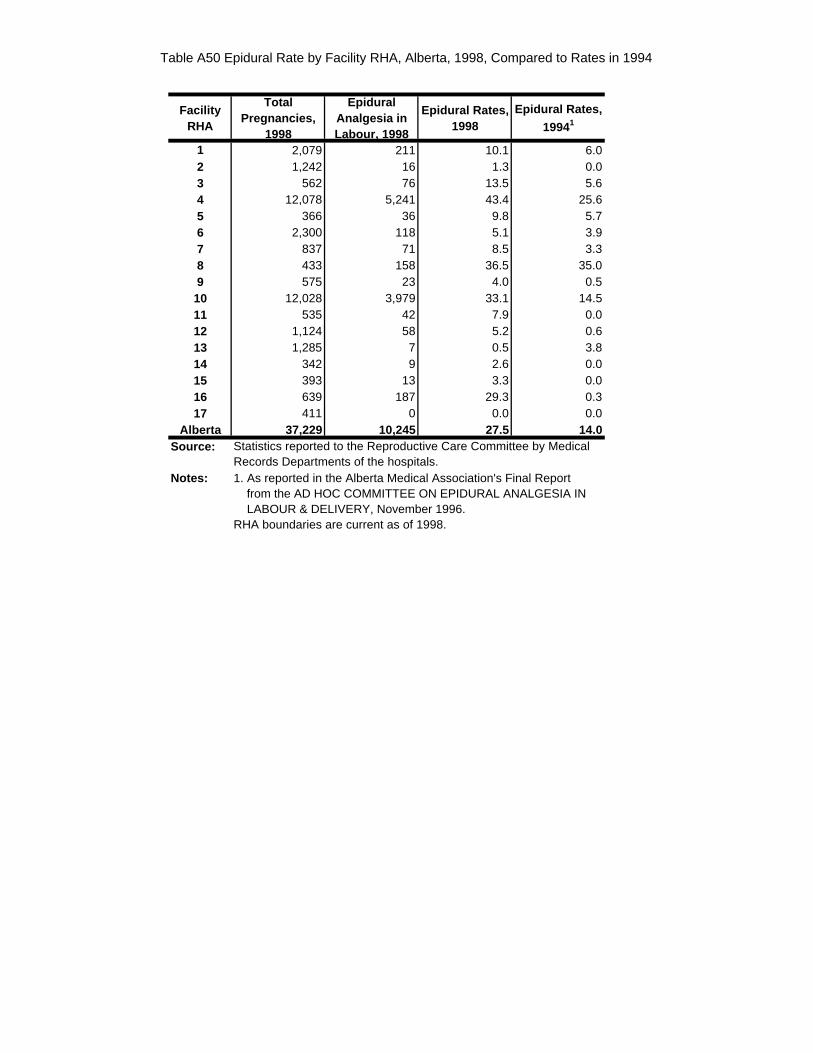
Table A50 Epidural Rate by Facility RHA, Alberta, 1998, Compared to Rates in 1994
Facility RHA
Total Pregnancies,
1998
Epidural Analgesia in Labour , 1998
Epidural Rates, 1998
Epidural Rates,
19941
1 2,079 211 10.1 6.02 1,242 16 1.3 0.03 562 76 13.5 5.64 12,078 5,241 43.4 25.65 366 36 9.8 5.76 2,300 118 5.1 3.97 837 71 8.5 3.38 433 158 36.5 35.09 575 23 4.0 0.5
10 12,028 3,979 33.1 14.511 535 42 7.9 0.012 1,124 58 5.2 0.613 1,285 7 0.5 3.814 342 9 2.6 0.015 393 13 3.3 0.016 639 187 29.3 0.317 411 0 0.0 0.0
Alberta 37,229 10,245 27.5 14.0Source: Statistics reported to the Reproductive Care Committee by Medical
Records Departments of the hospitals.Notes: 1. As reported in the Alberta Medical Association's Final Report
from the AD HOC COMMITTEE ON EPIDURAL ANALGESIA IN LABOUR & DELIVERY, November 1996.RHA boundaries are current as of 1998.
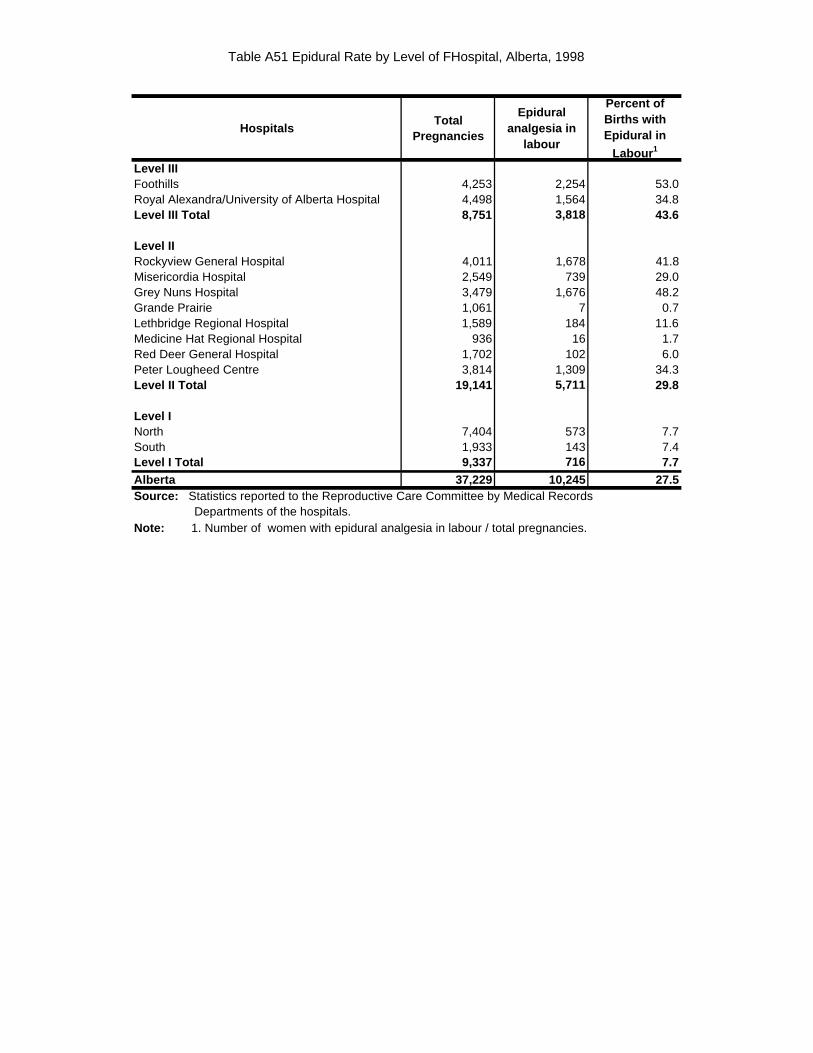
Table A51 Epidural Rate by Level of FHospital, Alberta, 1998
HospitalsTotal
Pregnancies
Epidural analgesia in
labour
Percent of Births with Epidural in
Labour 1
Level IIIFoothills 4,253 2,254 53.0Royal Alexandra/University of Alberta Hospital 4,498 1,564 34.8Level III Total 8,751 3,818 43.6
Level IIRockyview General Hospital 4,011 1,678 41.8Misericordia Hospital 2,549 739 29.0Grey Nuns Hospital 3,479 1,676 48.2Grande Prairie 1,061 7 0.7Lethbridge Regional Hospital 1,589 184 11.6Medicine Hat Regional Hospital 936 16 1.7Red Deer General Hospital 1,702 102 6.0Peter Lougheed Centre 3,814 1,309 34.3Level II Total 19,141 5,711 29.8
Level INorth 7,404 573 7.7South 1,933 143 7.4Level I Total 9,337 716 7.7Alberta 37,229 10,245 27.5Source: Statistics reported to the Reproductive Care Committee by Medical Records Departments of the hospitals. Note: 1. Number of women with epidural analgesia in labour / total pregnancies.
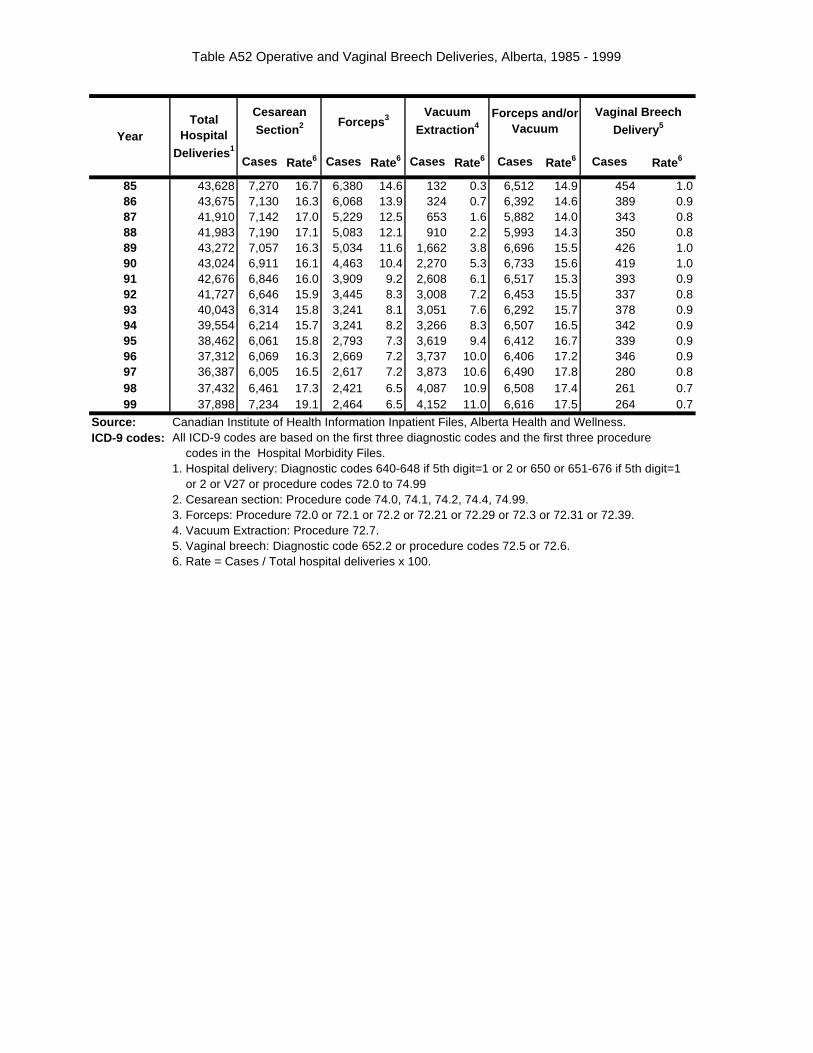
Table A52 Operative and Vaginal Breech Deliveries, Alberta, 1985 - 1999
Cesarean
Section 2 Forceps 3 Vacuum
Extraction 4Forceps and/or
VacuumVaginal Breech
Delivery 5
Cases Rate6 Cases Rate6 Cases Rate6 Cases Rate6 Cases Rate6
85 43,628 7,270 16.7 6,380 14.6 132 0.3 6,512 14.9 454 1.086 43,675 7,130 16.3 6,068 13.9 324 0.7 6,392 14.6 389 0.987 41,910 7,142 17.0 5,229 12.5 653 1.6 5,882 14.0 343 0.888 41,983 7,190 17.1 5,083 12.1 910 2.2 5,993 14.3 350 0.889 43,272 7,057 16.3 5,034 11.6 1,662 3.8 6,696 15.5 426 1.090 43,024 6,911 16.1 4,463 10.4 2,270 5.3 6,733 15.6 419 1.091 42,676 6,846 16.0 3,909 9.2 2,608 6.1 6,517 15.3 393 0.992 41,727 6,646 15.9 3,445 8.3 3,008 7.2 6,453 15.5 337 0.893 40,043 6,314 15.8 3,241 8.1 3,051 7.6 6,292 15.7 378 0.994 39,554 6,214 15.7 3,241 8.2 3,266 8.3 6,507 16.5 342 0.995 38,462 6,061 15.8 2,793 7.3 3,619 9.4 6,412 16.7 339 0.996 37,312 6,069 16.3 2,669 7.2 3,737 10.0 6,406 17.2 346 0.997 36,387 6,005 16.5 2,617 7.2 3,873 10.6 6,490 17.8 280 0.898 37,432 6,461 17.3 2,421 6.5 4,087 10.9 6,508 17.4 261 0.799 37,898 7,234 19.1 2,464 6.5 4,152 11.0 6,616 17.5 264 0.7
Source: Canadian Institute of Health Information Inpatient Files, Alberta Health and Wellness.ICD-9 codes: All ICD-9 codes are based on the first three diagnostic codes and the first three procedure
codes in the Hospital Morbidity Files.1. Hospital delivery: Diagnostic codes 640-648 if 5th digit=1 or 2 or 650 or 651-676 if 5th digit=1 or 2 or V27 or procedure codes 72.0 to 74.992. Cesarean section: Procedure code 74.0, 74.1, 74.2, 74.4, 74.99.3. Forceps: Procedure 72.0 or 72.1 or 72.2 or 72.21 or 72.29 or 72.3 or 72.31 or 72.39.4. Vacuum Extraction: Procedure 72.7.5. Vaginal breech: Diagnostic code 652.2 or procedure codes 72.5 or 72.6.6. Rate = Cases / Total hospital deliveries x 100.
YearTotal
Hospital
Deliveries 1
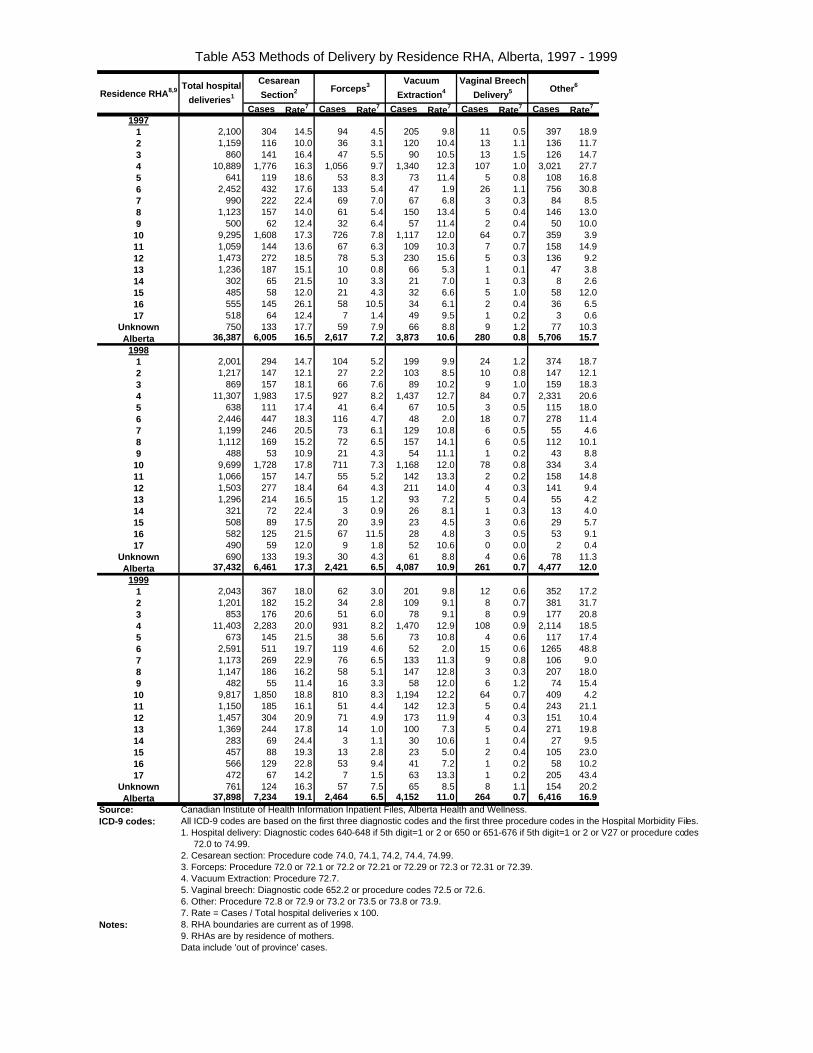
Table A53 Methods of Delivery by Residence RHA, Alberta, 1997 - 1999
Cesarean
Section 2 Forceps 3 Vacuum
Extraction 4
Vaginal Breech
Delivery 5
Cases Rate7 Cases Rate7 Cases Rate7 Cases Rate7 Cases Rate7
19971 2,100 304 14.5 94 4.5 205 9.8 11 0.5 397 18.92 1,159 116 10.0 36 3.1 120 10.4 13 1.1 136 11.73 860 141 16.4 47 5.5 90 10.5 13 1.5 126 14.74 10,889 1,776 16.3 1,056 9.7 1,340 12.3 107 1.0 3,021 27.75 641 119 18.6 53 8.3 73 11.4 5 0.8 108 16.86 2,452 432 17.6 133 5.4 47 1.9 26 1.1 756 30.87 990 222 22.4 69 7.0 67 6.8 3 0.3 84 8.58 1,123 157 14.0 61 5.4 150 13.4 5 0.4 146 13.09 500 62 12.4 32 6.4 57 11.4 2 0.4 50 10.010 9,295 1,608 17.3 726 7.8 1,117 12.0 64 0.7 359 3.911 1,059 144 13.6 67 6.3 109 10.3 7 0.7 158 14.912 1,473 272 18.5 78 5.3 230 15.6 5 0.3 136 9.213 1,236 187 15.1 10 0.8 66 5.3 1 0.1 47 3.814 302 65 21.5 10 3.3 21 7.0 1 0.3 8 2.615 485 58 12.0 21 4.3 32 6.6 5 1.0 58 12.016 555 145 26.1 58 10.5 34 6.1 2 0.4 36 6.517 518 64 12.4 7 1.4 49 9.5 1 0.2 3 0.6
Unknown 750 133 17.7 59 7.9 66 8.8 9 1.2 77 10.3Alberta 36,387 6,005 16.5 2,617 7.2 3,873 10.6 280 0.8 5,706 15.7
19981 2,001 294 14.7 104 5.2 199 9.9 24 1.2 374 18.72 1,217 147 12.1 27 2.2 103 8.5 10 0.8 147 12.13 869 157 18.1 66 7.6 89 10.2 9 1.0 159 18.34 11,307 1,983 17.5 927 8.2 1,437 12.7 84 0.7 2,331 20.65 638 111 17.4 41 6.4 67 10.5 3 0.5 115 18.06 2,446 447 18.3 116 4.7 48 2.0 18 0.7 278 11.47 1,199 246 20.5 73 6.1 129 10.8 6 0.5 55 4.68 1,112 169 15.2 72 6.5 157 14.1 6 0.5 112 10.19 488 53 10.9 21 4.3 54 11.1 1 0.2 43 8.810 9,699 1,728 17.8 711 7.3 1,168 12.0 78 0.8 334 3.411 1,066 157 14.7 55 5.2 142 13.3 2 0.2 158 14.812 1,503 277 18.4 64 4.3 211 14.0 4 0.3 141 9.413 1,296 214 16.5 15 1.2 93 7.2 5 0.4 55 4.214 321 72 22.4 3 0.9 26 8.1 1 0.3 13 4.015 508 89 17.5 20 3.9 23 4.5 3 0.6 29 5.716 582 125 21.5 67 11.5 28 4.8 3 0.5 53 9.117 490 59 12.0 9 1.8 52 10.6 0 0.0 2 0.4
Unknown 690 133 19.3 30 4.3 61 8.8 4 0.6 78 11.3Alberta 37,432 6,461 17.3 2,421 6.5 4,087 10.9 261 0.7 4,477 12.0
19991 2,043 367 18.0 62 3.0 201 9.8 12 0.6 352 17.22 1,201 182 15.2 34 2.8 109 9.1 8 0.7 381 31.73 853 176 20.6 51 6.0 78 9.1 8 0.9 177 20.84 11,403 2,283 20.0 931 8.2 1,470 12.9 108 0.9 2,114 18.55 673 145 21.5 38 5.6 73 10.8 4 0.6 117 17.46 2,591 511 19.7 119 4.6 52 2.0 15 0.6 1265 48.87 1,173 269 22.9 76 6.5 133 11.3 9 0.8 106 9.08 1,147 186 16.2 58 5.1 147 12.8 3 0.3 207 18.09 482 55 11.4 16 3.3 58 12.0 6 1.2 74 15.410 9,817 1,850 18.8 810 8.3 1,194 12.2 64 0.7 409 4.211 1,150 185 16.1 51 4.4 142 12.3 5 0.4 243 21.112 1,457 304 20.9 71 4.9 173 11.9 4 0.3 151 10.413 1,369 244 17.8 14 1.0 100 7.3 5 0.4 271 19.814 283 69 24.4 3 1.1 30 10.6 1 0.4 27 9.515 457 88 19.3 13 2.8 23 5.0 2 0.4 105 23.016 566 129 22.8 53 9.4 41 7.2 1 0.2 58 10.217 472 67 14.2 7 1.5 63 13.3 1 0.2 205 43.4
Unknown 761 124 16.3 57 7.5 65 8.5 8 1.1 154 20.2Alberta 37,898 7,234 19.1 2,464 6.5 4,152 11.0 264 0.7 6,416 16.9
Source: Canadian Institute of Health Information Inpatient Files, Alberta Health and Wellness.ICD-9 codes: All ICD-9 codes are based on the first three diagnostic codes and the first three procedure codes in the Hospital Morbidity Files.
1. Hospital delivery: Diagnostic codes 640-648 if 5th digit=1 or 2 or 650 or 651-676 if 5th digit=1 or 2 or V27 or procedure codes 72.0 to 74.99.2. Cesarean section: Procedure code 74.0, 74.1, 74.2, 74.4, 74.99.3. Forceps: Procedure 72.0 or 72.1 or 72.2 or 72.21 or 72.29 or 72.3 or 72.31 or 72.39.4. Vacuum Extraction: Procedure 72.7.5. Vaginal breech: Diagnostic code 652.2 or procedure codes 72.5 or 72.6.6. Other: Procedure 72.8 or 72.9 or 73.2 or 73.5 or 73.8 or 73.9.7. Rate = Cases / Total hospital deliveries x 100.
Notes: 8. RHA boundaries are current as of 1998.9. RHAs are by residence of mothers.Data include 'out of province' cases.
Total hospital
deliveries 1Other 6
Residence RHA 8,9
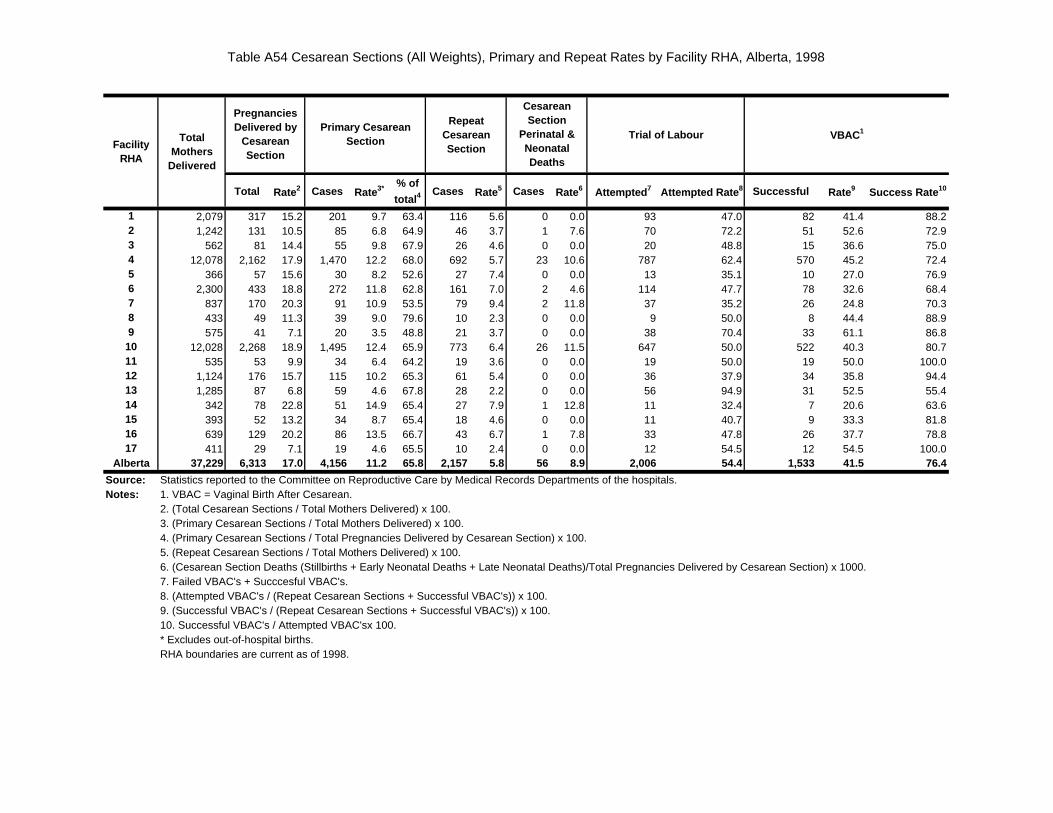
Table A54 Cesarean Sections (All Weights), Primary and Repeat Rates by Facility RHA, Alberta, 1998
Repeat Cesarean Section
Trial of Labour
Total Rate2 Cases Rate3* % of
total 4 Cases Rate5 Cases Rate6 Attempted 7 Attempted Rate 8 Successful Rate9 Success Rate 10
1 2,079 317 15.2 201 9.7 63.4 116 5.6 0 0.0 93 47.0 82 41.4 88.22 1,242 131 10.5 85 6.8 64.9 46 3.7 1 7.6 70 72.2 51 52.6 72.93 562 81 14.4 55 9.8 67.9 26 4.6 0 0.0 20 48.8 15 36.6 75.04 12,078 2,162 17.9 1,470 12.2 68.0 692 5.7 23 10.6 787 62.4 570 45.2 72.45 366 57 15.6 30 8.2 52.6 27 7.4 0 0.0 13 35.1 10 27.0 76.96 2,300 433 18.8 272 11.8 62.8 161 7.0 2 4.6 114 47.7 78 32.6 68.47 837 170 20.3 91 10.9 53.5 79 9.4 2 11.8 37 35.2 26 24.8 70.38 433 49 11.3 39 9.0 79.6 10 2.3 0 0.0 9 50.0 8 44.4 88.99 575 41 7.1 20 3.5 48.8 21 3.7 0 0.0 38 70.4 33 61.1 86.8
10 12,028 2,268 18.9 1,495 12.4 65.9 773 6.4 26 11.5 647 50.0 522 40.3 80.711 535 53 9.9 34 6.4 64.2 19 3.6 0 0.0 19 50.0 19 50.0 100.012 1,124 176 15.7 115 10.2 65.3 61 5.4 0 0.0 36 37.9 34 35.8 94.413 1,285 87 6.8 59 4.6 67.8 28 2.2 0 0.0 56 94.9 31 52.5 55.414 342 78 22.8 51 14.9 65.4 27 7.9 1 12.8 11 32.4 7 20.6 63.615 393 52 13.2 34 8.7 65.4 18 4.6 0 0.0 11 40.7 9 33.3 81.816 639 129 20.2 86 13.5 66.7 43 6.7 1 7.8 33 47.8 26 37.7 78.817 411 29 7.1 19 4.6 65.5 10 2.4 0 0.0 12 54.5 12 54.5 100.0
Alberta 37,229 6,313 17.0 4,156 11.2 65.8 2,157 5.8 56 8.9 2,006 54.4 1,533 41.5 76.4
Source: Statistics reported to the Committee on Reproductive Care by Medical Records Departments of the hospitals.Notes: 1. VBAC = Vaginal Birth After Cesarean.
2. (Total Cesarean Sections / Total Mothers Delivered) x 100. 3. (Primary Cesarean Sections / Total Mothers Delivered) x 100.4. (Primary Cesarean Sections / Total Pregnancies Delivered by Cesarean Section) x 100.5. (Repeat Cesarean Sections / Total Mothers Delivered) x 100.6. (Cesarean Section Deaths (Stillbirths + Early Neonatal Deaths + Late Neonatal Deaths)/Total Pregnancies Delivered by Cesarean Section) x 1000.7. Failed VBAC's + Succcesful VBAC's.8. (Attempted VBAC's / (Repeat Cesarean Sections + Successful VBAC's)) x 100.9. (Successful VBAC's / (Repeat Cesarean Sections + Successful VBAC's)) x 100.10. Successful VBAC's / Attempted VBAC'sx 100.* Excludes out-of-hospital births.RHA boundaries are current as of 1998.
VBAC1
Facility RHA
Primary Cesarean SectionTotal
Mothers Delivered
Pregnancies Delivered by
Cesarean Section
Cesarean Section
Perinatal & Neonatal Deaths
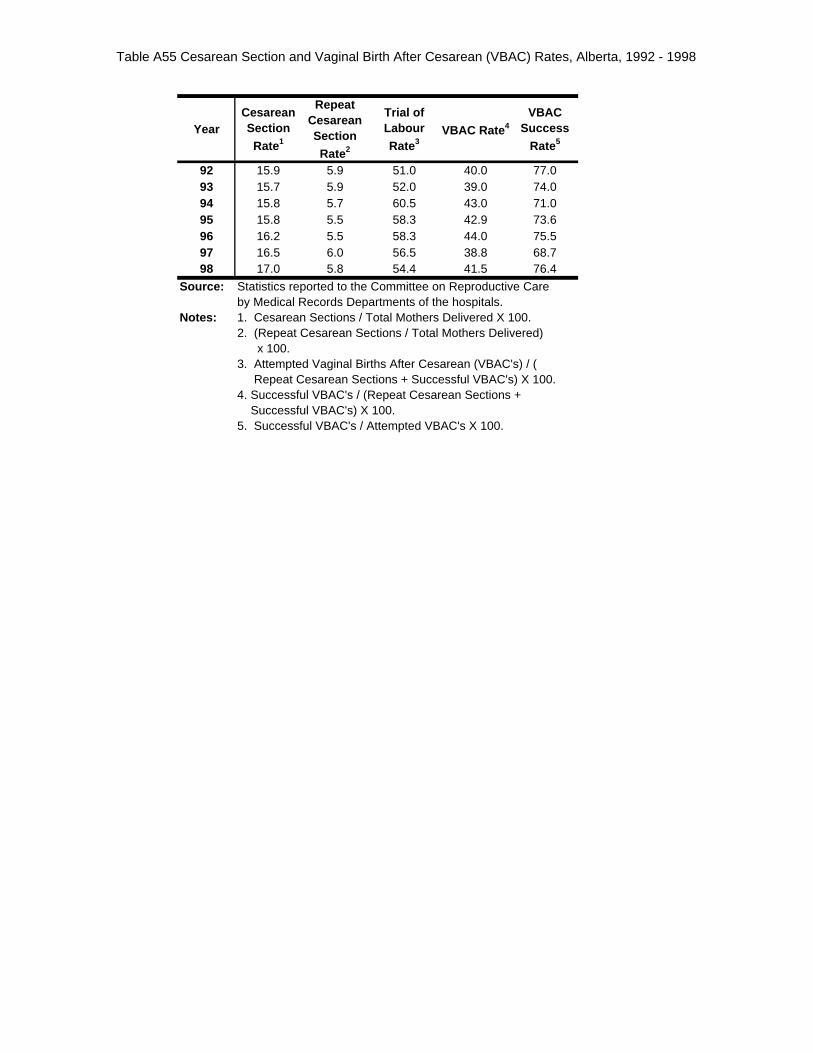
Table A55 Cesarean Section and Vaginal Birth After Cesarean (VBAC) Rates, Alberta, 1992 - 1998
YearCesarean Section
Rate1
Repeat Cesarean Section
Rate2
Trial of Labour
Rate3VBAC Rate 4
VBAC Success
Rate5
92 15.9 5.9 51.0 40.0 77.093 15.7 5.9 52.0 39.0 74.094 15.8 5.7 60.5 43.0 71.095 15.8 5.5 58.3 42.9 73.696 16.2 5.5 58.3 44.0 75.597 16.5 6.0 56.5 38.8 68.798 17.0 5.8 54.4 41.5 76.4
Source: Statistics reported to the Committee on Reproductive Care by Medical Records Departments of the hospitals.
Notes: 1. Cesarean Sections / Total Mothers Delivered X 100.2. (Repeat Cesarean Sections / Total Mothers Delivered) x 100.3. Attempted Vaginal Births After Cesarean (VBAC's) / ( Repeat Cesarean Sections + Successful VBAC's) X 100.4. Successful VBAC's / (Repeat Cesarean Sections + Successful VBAC's) X 100.5. Successful VBAC's / Attempted VBAC's X 100.
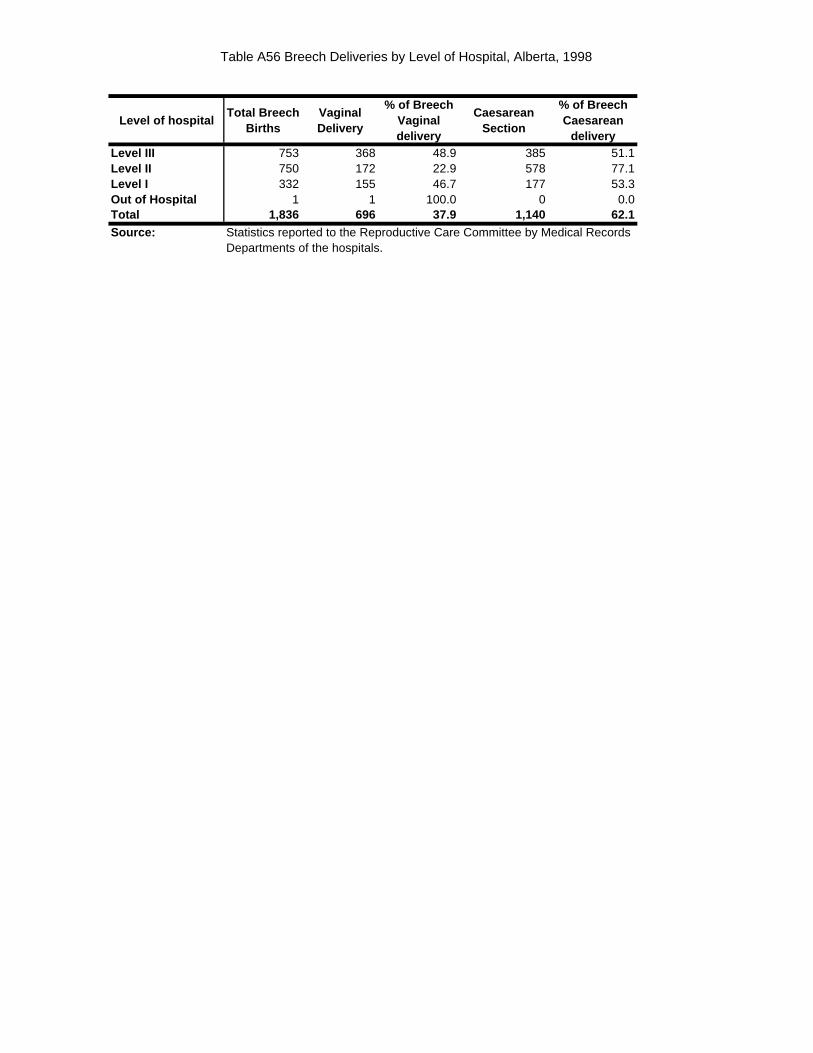
Table A56 Breech Deliveries by Level of Hospital, Alberta, 1998
Level of hospitalTotal Breech
BirthsVaginal Delivery
% of Breech Vaginal delivery
Caesarean Section
% of Breech Caesarean
deliveryLevel III 753 368 48.9 385 51.1Level II 750 172 22.9 578 77.1Level I 332 155 46.7 177 53.3Out of Hospital 1 1 100.0 0 0.0Total 1,836 696 37.9 1,140 62.1Source: Statistics reported to the Reproductive Care Committee by Medical Records
Departments of the hospitals.
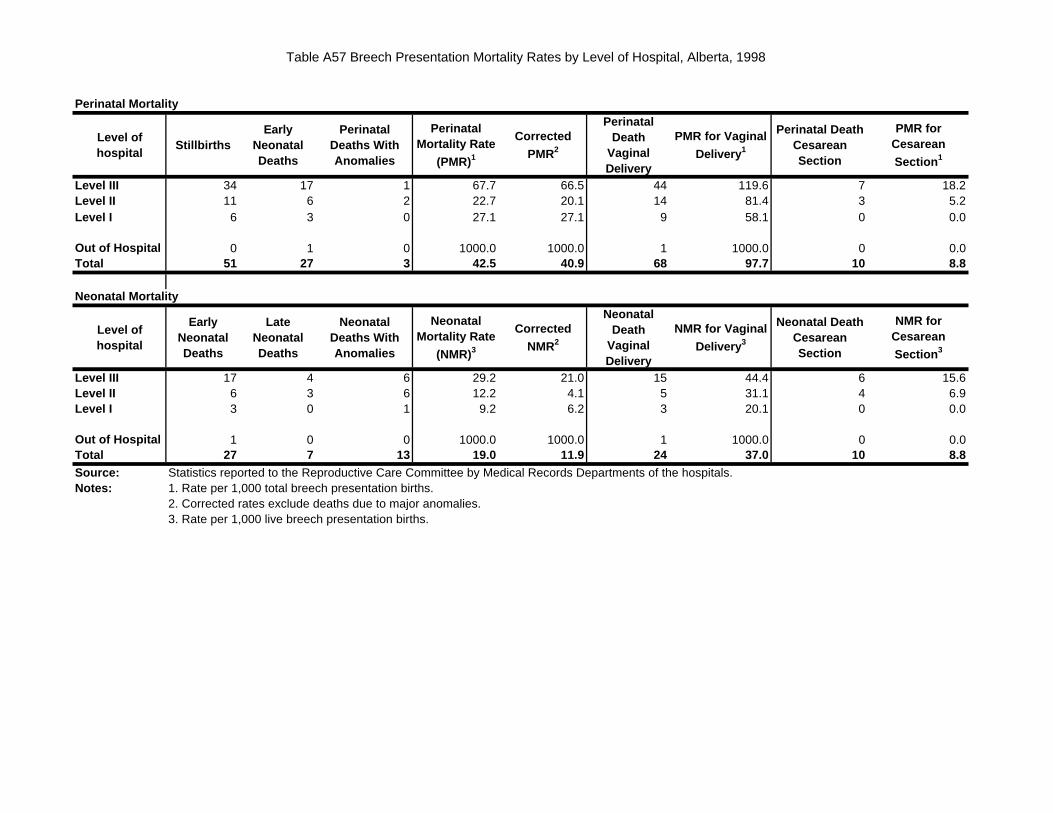
Table A57 Breech Presentation Mortality Rates by Level of Hospital, Alberta, 1998
Perinatal Mortality
Level of hospital
StillbirthsEarly
Neonatal Deaths
Perinatal Deaths With Anomalies
Perinatal Mortality Rate
(PMR)1
Corrected
PMR2
Perinatal Death
Vaginal Delivery
PMR for Vaginal
Delivery 1
Perinatal Death Cesarean Section
PMR for Cesarean
Section 1
Level III 34 17 1 67.7 66.5 44 119.6 7 18.2Level II 11 6 2 22.7 20.1 14 81.4 3 5.2Level I 6 3 0 27.1 27.1 9 58.1 0 0.0
Out of Hospital 0 1 0 1000.0 1000.0 1 1000.0 0 0.0Total 51 27 3 42.5 40.9 68 97.7 10 8.8
Neonatal Mortality
Level of hospital
Early Neonatal Deaths
Late Neonatal Deaths
Neonatal Deaths With Anomalies
Neonatal Mortality Rate
(NMR)3
Corrected
NMR2
Neonatal Death
Vaginal Delivery
NMR for Vaginal
Delivery 3
Neonatal Death Cesarean Section
NMR for Cesarean
Section 3
Level III 17 4 6 29.2 21.0 15 44.4 6 15.6Level II 6 3 6 12.2 4.1 5 31.1 4 6.9Level I 3 0 1 9.2 6.2 3 20.1 0 0.0
Out of Hospital 1 0 0 1000.0 1000.0 1 1000.0 0 0.0Total 27 7 13 19.0 11.9 24 37.0 10 8.8Source: Statistics reported to the Reproductive Care Committee by Medical Records Departments of the hospitals. Notes: 1. Rate per 1,000 total breech presentation births.
2. Corrected rates exclude deaths due to major anomalies.3. Rate per 1,000 live breech presentation births.
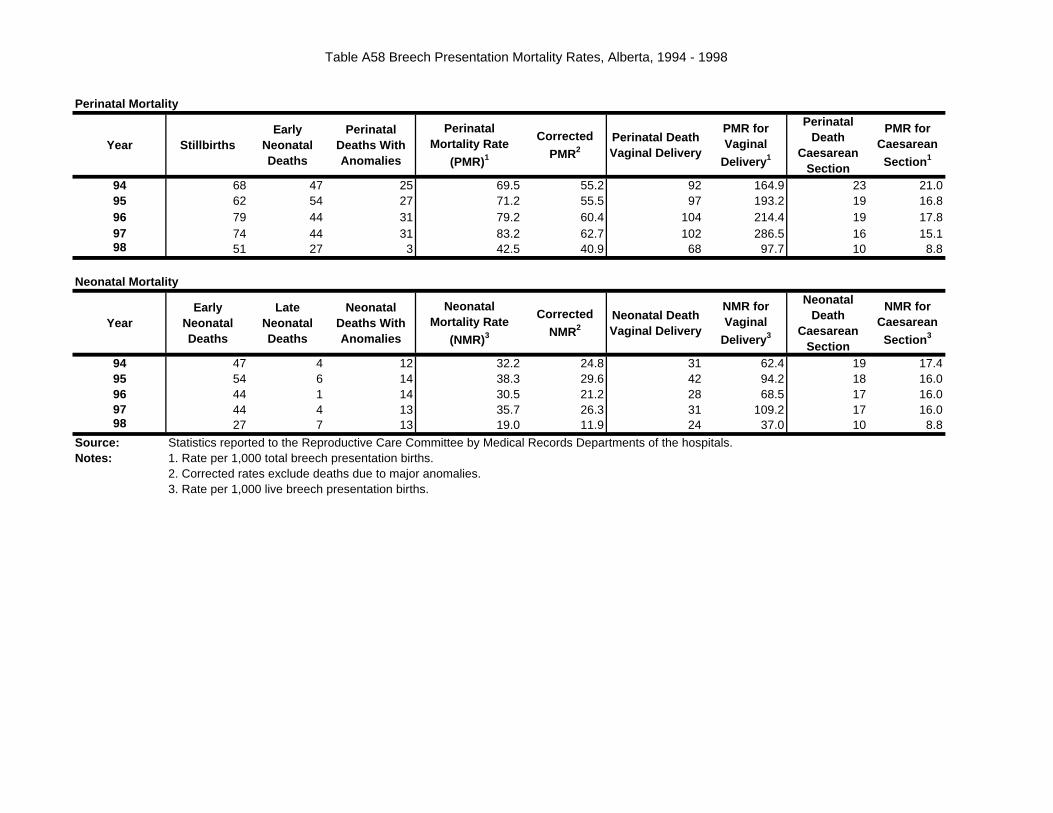
Table A58 Breech Presentation Mortality Rates, Alberta, 1994 - 1998
Perinatal Mortality
Year StillbirthsEarly
Neonatal Deaths
Perinatal Deaths With Anomalies
Perinatal Mortality Rate
(PMR)1
Corrected
PMR2Perinatal Death Vaginal Delivery
PMR for Vaginal
Delivery 1
Perinatal Death
Caesarean Section
PMR for Caesarean
Section 1
94 68 47 25 69.5 55.2 92 164.9 23 21.095 62 54 27 71.2 55.5 97 193.2 19 16.896 79 44 31 79.2 60.4 104 214.4 19 17.897 74 44 31 83.2 62.7 102 286.5 16 15.198 51 27 3 42.5 40.9 68 97.7 10 8.8
Neonatal Mortality
YearEarly
Neonatal Deaths
Late Neonatal Deaths
Neonatal Deaths With Anomalies
Neonatal Mortality Rate
(NMR)3
Corrected
NMR2Neonatal Death Vaginal Delivery
NMR for Vaginal
Delivery 3
Neonatal Death
Caesarean Section
NMR for Caesarean
Section 3
94 47 4 12 32.2 24.8 31 62.4 19 17.495 54 6 14 38.3 29.6 42 94.2 18 16.096 44 1 14 30.5 21.2 28 68.5 17 16.097 44 4 13 35.7 26.3 31 109.2 17 16.098 27 7 13 19.0 11.9 24 37.0 10 8.8
Source: Statistics reported to the Reproductive Care Committee by Medical Records Departments of the hospitals. Notes: 1. Rate per 1,000 total breech presentation births.
2. Corrected rates exclude deaths due to major anomalies.3. Rate per 1,000 live breech presentation births.
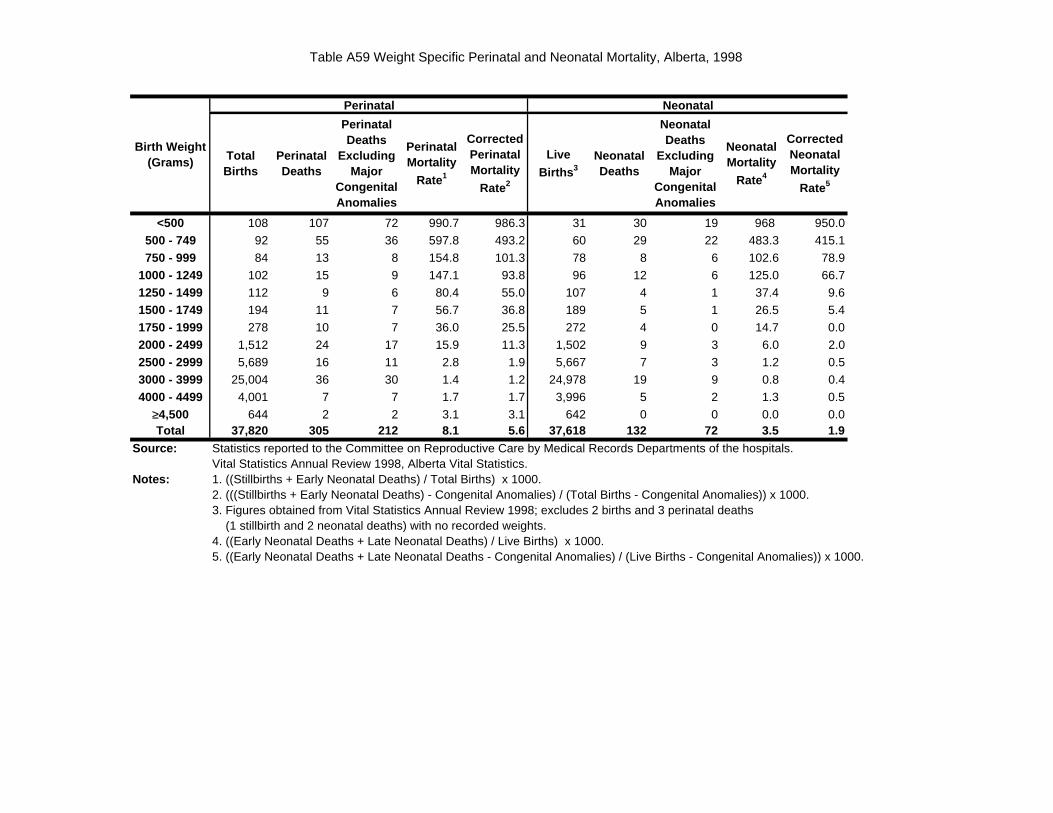
Table A59 Weight Specific Perinatal and Neonatal Mortality, Alberta, 1998
Total Births
Perinatal Deaths
Perinatal Deaths
Excluding Major
Congenital Anomalies
Perinatal Mortality
Rate1
Corrected Perinatal Mortality
Rate2
Live
Births 3Neonatal Deaths
Neonatal Deaths
Excluding Major
Congenital Anomalies
Neonatal Mortality
Rate4
Corrected Neonatal Mortality
Rate5
<500 108 107 72 990.7 986.3 31 30 19 968 950.0
500 - 749 92 55 36 597.8 493.2 60 29 22 483.3 415.1
750 - 999 84 13 8 154.8 101.3 78 8 6 102.6 78.9
1000 - 1249 102 15 9 147.1 93.8 96 12 6 125.0 66.7
1250 - 1499 112 9 6 80.4 55.0 107 4 1 37.4 9.6
1500 - 1749 194 11 7 56.7 36.8 189 5 1 26.5 5.4
1750 - 1999 278 10 7 36.0 25.5 272 4 0 14.7 0.0
2000 - 2499 1,512 24 17 15.9 11.3 1,502 9 3 6.0 2.0
2500 - 2999 5,689 16 11 2.8 1.9 5,667 7 3 1.2 0.5
3000 - 3999 25,004 36 30 1.4 1.2 24,978 19 9 0.8 0.4
4000 - 4499 4,001 7 7 1.7 1.7 3,996 5 2 1.3 0.5
≥4,500 644 2 2 3.1 3.1 642 0 0 0.0 0.0Total 37,820 305 212 8.1 5.6 37,618 132 72 3.5 1.9
Source: Statistics reported to the Committee on Reproductive Care by Medical Records Departments of the hospitals.Vital Statistics Annual Review 1998, Alberta Vital Statistics.
Notes: 1. ((Stillbirths + Early Neonatal Deaths) / Total Births) x 1000.2. (((Stillbirths + Early Neonatal Deaths) - Congenital Anomalies) / (Total Births - Congenital Anomalies)) x 1000.3. Figures obtained from Vital Statistics Annual Review 1998; excludes 2 births and 3 perinatal deaths (1 stillbirth and 2 neonatal deaths) with no recorded weights.4. ((Early Neonatal Deaths + Late Neonatal Deaths) / Live Births) x 1000.5. ((Early Neonatal Deaths + Late Neonatal Deaths - Congenital Anomalies) / (Live Births - Congenital Anomalies)) x 1000.
Perinatal Neonatal
Birth Weight (Grams)
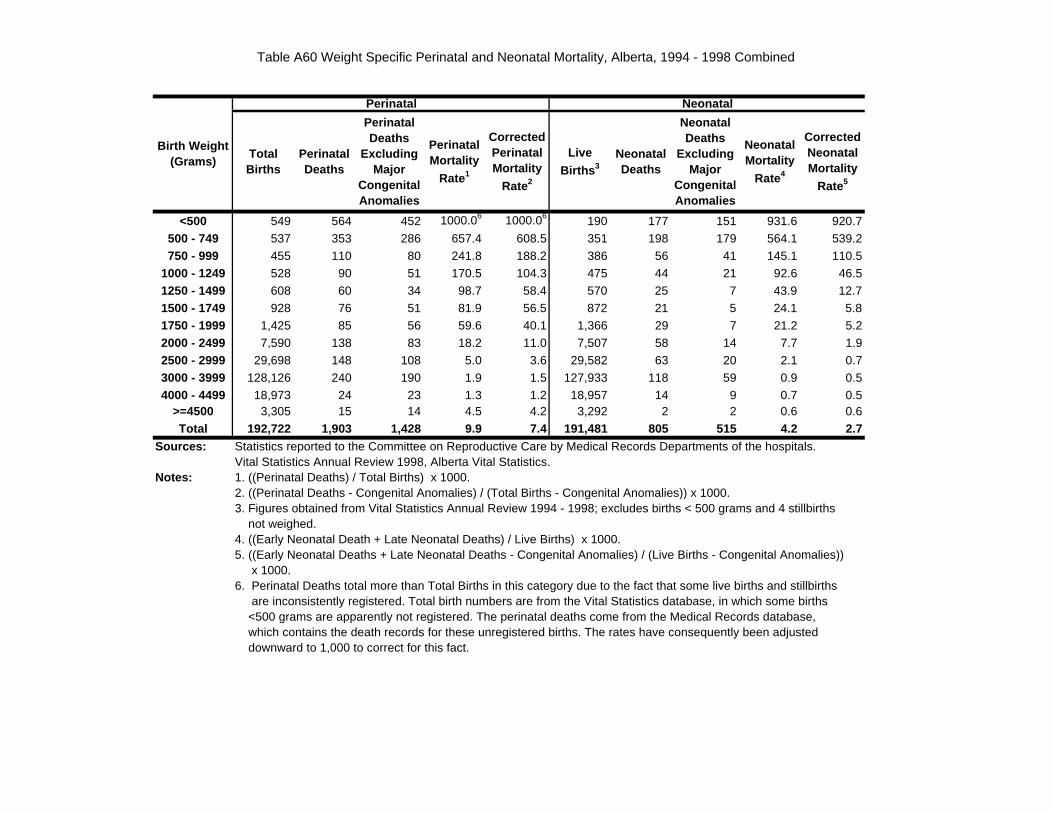
Table A60 Weight Specific Perinatal and Neonatal Mortality, Alberta, 1994 - 1998 Combined
Total Births
Perinatal Deaths
Perinatal Deaths
Excluding Major
Congenital Anomalies
Perinatal Mortality
Rate1
Corrected Perinatal Mortality
Rate2
Live
Births 3Neonatal Deaths
Neonatal Deaths
Excluding Major
Congenital Anomalies
Neonatal Mortality
Rate4
Corrected Neonatal Mortality
Rate5
<500 549 564 452 1000.06 1000.06 190 177 151 931.6 920.7
500 - 749 537 353 286 657.4 608.5 351 198 179 564.1 539.2
750 - 999 455 110 80 241.8 188.2 386 56 41 145.1 110.5
1000 - 1249 528 90 51 170.5 104.3 475 44 21 92.6 46.5
1250 - 1499 608 60 34 98.7 58.4 570 25 7 43.9 12.7
1500 - 1749 928 76 51 81.9 56.5 872 21 5 24.1 5.8
1750 - 1999 1,425 85 56 59.6 40.1 1,366 29 7 21.2 5.2
2000 - 2499 7,590 138 83 18.2 11.0 7,507 58 14 7.7 1.9
2500 - 2999 29,698 148 108 5.0 3.6 29,582 63 20 2.1 0.7
3000 - 3999 128,126 240 190 1.9 1.5 127,933 118 59 0.9 0.5
4000 - 4499 18,973 24 23 1.3 1.2 18,957 14 9 0.7 0.5>=4500 3,305 15 14 4.5 4.2 3,292 2 2 0.6 0.6
Total 192,722 1,903 1,428 9.9 7.4 191,481 805 515 4.2 2.7Sources: Statistics reported to the Committee on Reproductive Care by Medical Records Departments of the hospitals.
Vital Statistics Annual Review 1998, Alberta Vital Statistics.Notes: 1. ((Perinatal Deaths) / Total Births) x 1000.
2. ((Perinatal Deaths - Congenital Anomalies) / (Total Births - Congenital Anomalies)) x 1000.3. Figures obtained from Vital Statistics Annual Review 1994 - 1998; excludes births < 500 grams and 4 stillbirths not weighed.4. ((Early Neonatal Death + Late Neonatal Deaths) / Live Births) x 1000.5. ((Early Neonatal Deaths + Late Neonatal Deaths - Congenital Anomalies) / (Live Births - Congenital Anomalies)) x 1000.6. Perinatal Deaths total more than Total Births in this category due to the fact that some live births and stillbirths are inconsistently registered. Total birth numbers are from the Vital Statistics database, in which some births <500 grams are apparently not registered. The perinatal deaths come from the Medical Records database, which contains the death records for these unregistered births. The rates have consequently been adjusted downward to 1,000 to correct for this fact.
Perinatal Neonatal
Birth Weight (Grams)
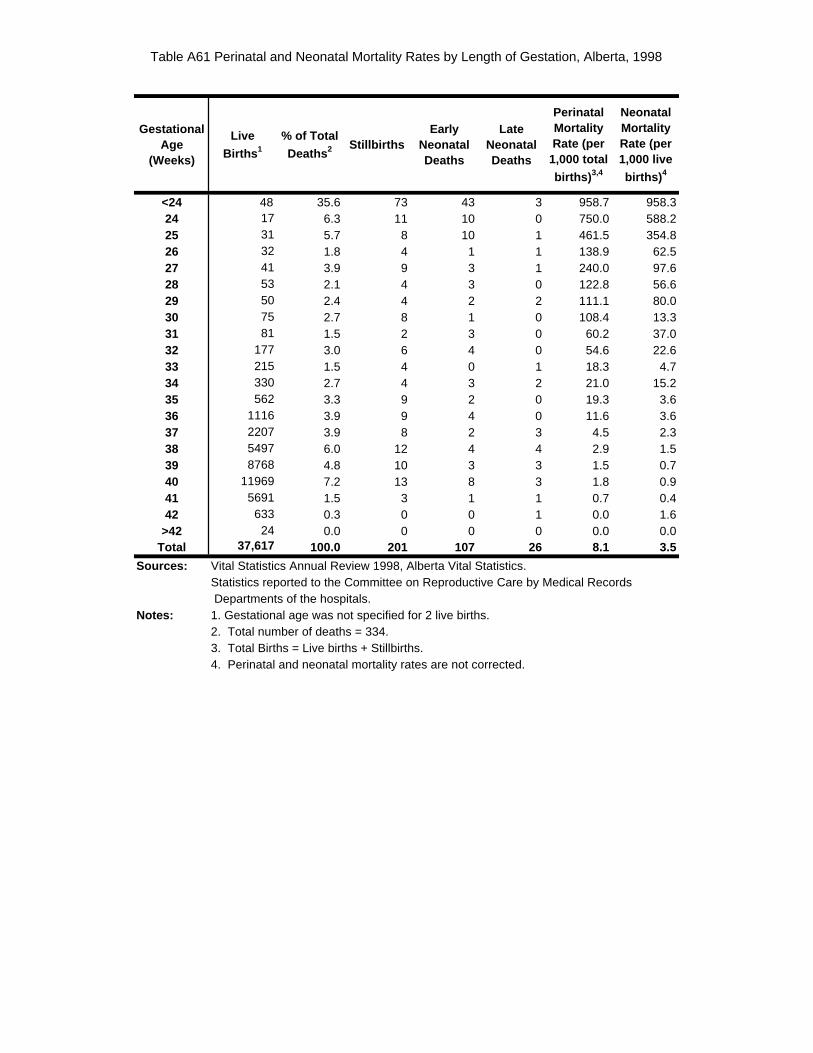
Table A61 Perinatal and Neonatal Mortality Rates by Length of Gestation, Alberta, 1998
Gestational Age
(Weeks)
Live
Births 1
% of Total
Deaths 2 StillbirthsEarly
Neonatal Deaths
Late Neonatal Deaths
Perinatal Mortality Rate (per
1,000 total
births) 3,4
Neonatal Mortality Rate (per 1,000 live
births) 4
<24 48 35.6 73 43 3 958.7 958.324 17 6.3 11 10 0 750.0 588.225 31 5.7 8 10 1 461.5 354.826 32 1.8 4 1 1 138.9 62.527 41 3.9 9 3 1 240.0 97.628 53 2.1 4 3 0 122.8 56.629 50 2.4 4 2 2 111.1 80.030 75 2.7 8 1 0 108.4 13.331 81 1.5 2 3 0 60.2 37.032 177 3.0 6 4 0 54.6 22.633 215 1.5 4 0 1 18.3 4.734 330 2.7 4 3 2 21.0 15.235 562 3.3 9 2 0 19.3 3.636 1116 3.9 9 4 0 11.6 3.637 2207 3.9 8 2 3 4.5 2.338 5497 6.0 12 4 4 2.9 1.539 8768 4.8 10 3 3 1.5 0.740 11969 7.2 13 8 3 1.8 0.941 5691 1.5 3 1 1 0.7 0.442 633 0.3 0 0 1 0.0 1.6
>42 24 0.0 0 0 0 0.0 0.0Total 37,617 100.0 201 107 26 8.1 3.5
Sources: Vital Statistics Annual Review 1998, Alberta Vital Statistics.Statistics reported to the Committee on Reproductive Care by Medical Records Departments of the hospitals.
Notes: 1. Gestational age was not specified for 2 live births.2. Total number of deaths = 334.3. Total Births = Live births + Stillbirths.4. Perinatal and neonatal mortality rates are not corrected.
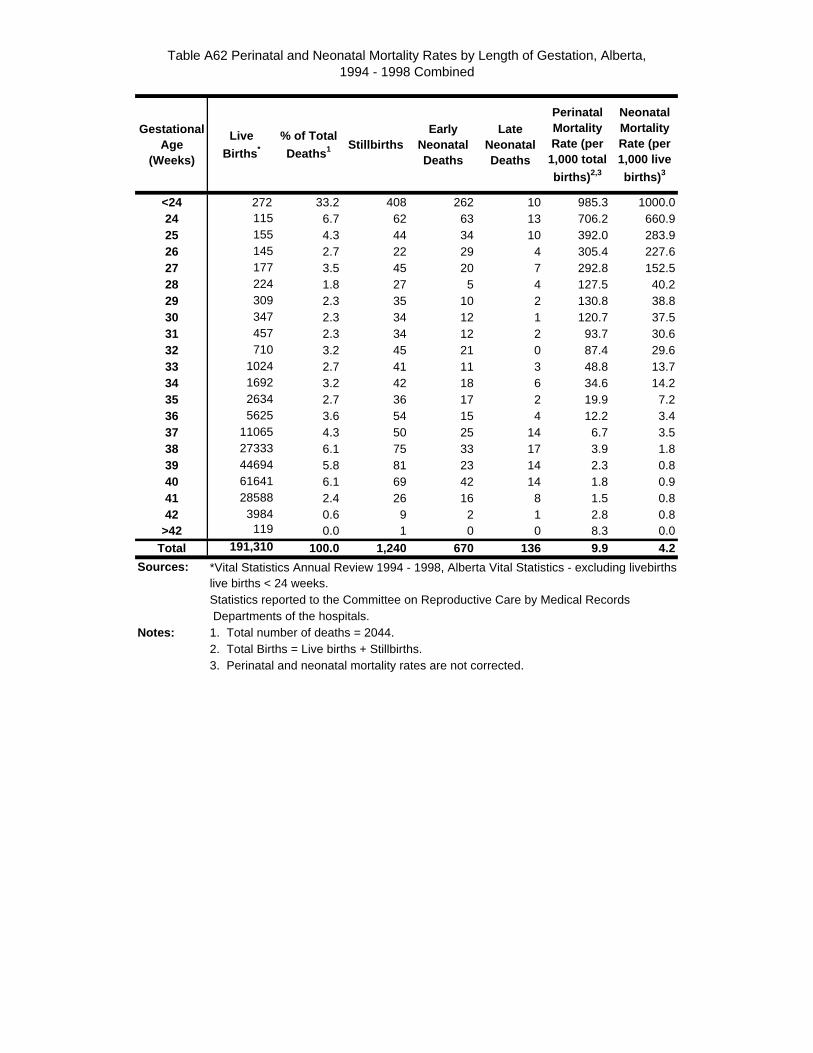
Table A62 Perinatal and Neonatal Mortality Rates by Length of Gestation, Alberta,1994 - 1998 Combined
Gestational Age
(Weeks)
Live
Births *
% of Total
Deaths 1 StillbirthsEarly
Neonatal Deaths
Late Neonatal Deaths
Perinatal Mortality Rate (per
1,000 total
births) 2,3
Neonatal Mortality Rate (per 1,000 live
births) 3
<24 272 33.2 408 262 10 985.3 1000.024 115 6.7 62 63 13 706.2 660.925 155 4.3 44 34 10 392.0 283.926 145 2.7 22 29 4 305.4 227.627 177 3.5 45 20 7 292.8 152.528 224 1.8 27 5 4 127.5 40.229 309 2.3 35 10 2 130.8 38.830 347 2.3 34 12 1 120.7 37.531 457 2.3 34 12 2 93.7 30.632 710 3.2 45 21 0 87.4 29.633 1024 2.7 41 11 3 48.8 13.734 1692 3.2 42 18 6 34.6 14.235 2634 2.7 36 17 2 19.9 7.236 5625 3.6 54 15 4 12.2 3.437 11065 4.3 50 25 14 6.7 3.538 27333 6.1 75 33 17 3.9 1.839 44694 5.8 81 23 14 2.3 0.840 61641 6.1 69 42 14 1.8 0.941 28588 2.4 26 16 8 1.5 0.842 3984 0.6 9 2 1 2.8 0.8
>42 119 0.0 1 0 0 8.3 0.0
Total 191,310 100.0 1,240 670 136 9.9 4.2
Sources:live births < 24 weeks.Statistics reported to the Committee on Reproductive Care by Medical Records Departments of the hospitals.
Notes: 1. Total number of deaths = 2044.2. Total Births = Live births + Stillbirths.3. Perinatal and neonatal mortality rates are not corrected.
*Vital Statistics Annual Review 1994 - 1998, Alberta Vital Statistics - excluding livebirths
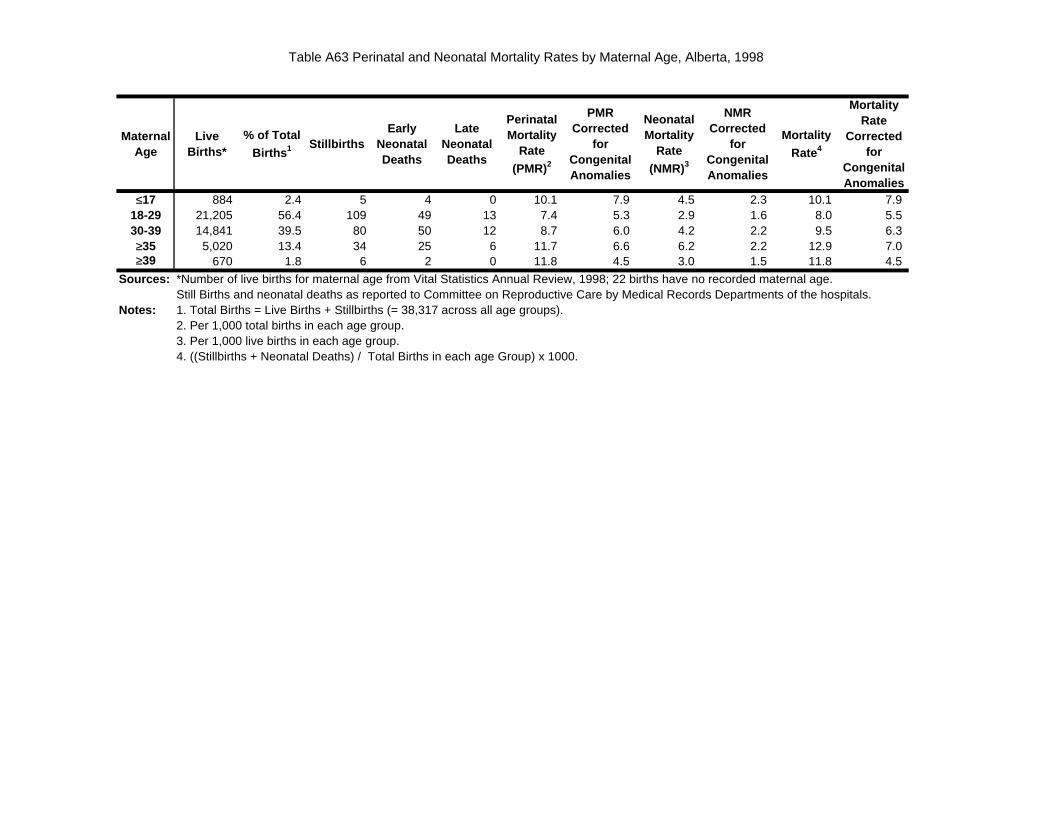
Table A63 Perinatal and Neonatal Mortality Rates by Maternal Age, Alberta, 1998
Maternal Age
Live Births*
% of Total
Births 1 StillbirthsEarly
Neonatal Deaths
Late Neonatal Deaths
Perinatal Mortality
Rate
(PMR)2
PMR Corrected
for Congenital Anomalies
Neonatal Mortality
Rate
(NMR)3
NMR Corrected
for Congenital Anomalies
Mortality
Rate4
Mortality Rate
Corrected for
Congenital Anomalies
≤17 884 2.4 5 4 0 10.1 7.9 4.5 2.3 10.1 7.9 18-29 21,205 56.4 109 49 13 7.4 5.3 2.9 1.6 8.0 5.5 30-39 14,841 39.5 80 50 12 8.7 6.0 4.2 2.2 9.5 6.3 ≥35 5,020 13.4 34 25 6 11.7 6.6 6.2 2.2 12.9 7.0 ≥39 670 1.8 6 2 0 11.8 4.5 3.0 1.5 11.8 4.5
Sources: *Number of live births for maternal age from Vital Statistics Annual Review, 1998; 22 births have no recorded maternal age.Still Births and neonatal deaths as reported to Committee on Reproductive Care by Medical Records Departments of the hospitals.
Notes: 1. Total Births = Live Births + Stillbirths (= 38,317 across all age groups).2. Per 1,000 total births in each age group.3. Per 1,000 live births in each age group.4. ((Stillbirths + Neonatal Deaths) / Total Births in each age Group) x 1000.
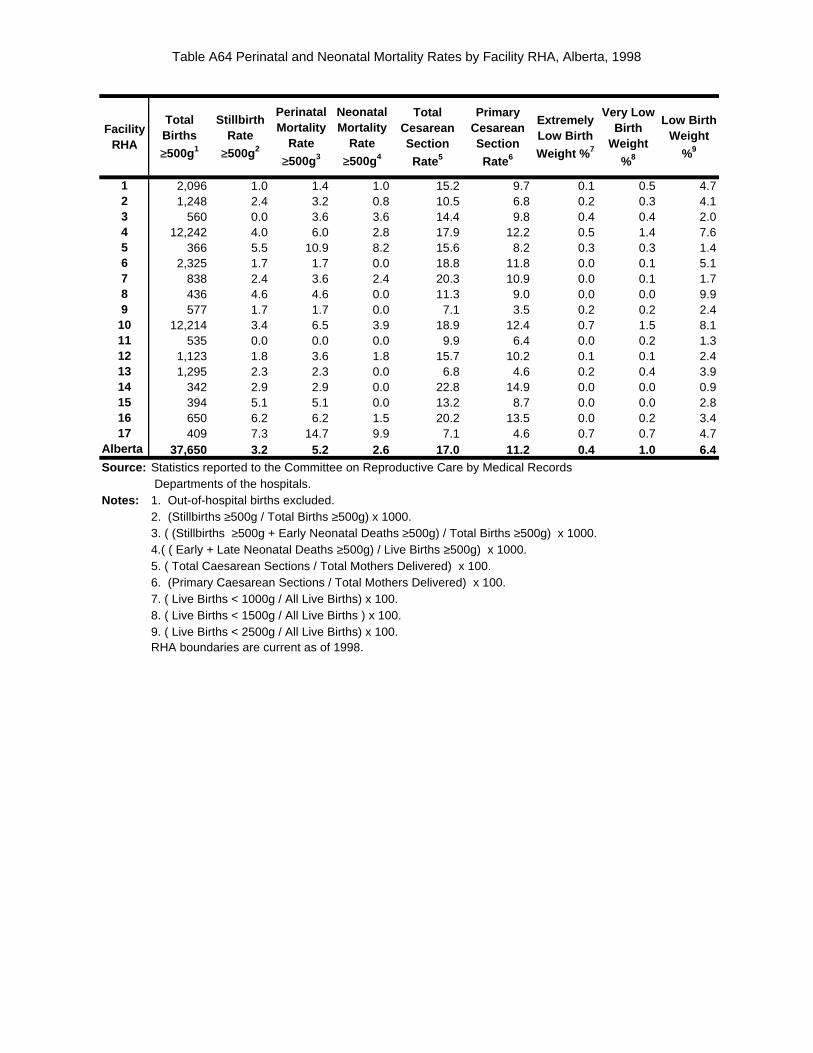
Table A64 Perinatal and Neonatal Mortality Rates by Facility RHA, Alberta, 1998
Facility RHA
Total Births
≥500g1
Stillbirth Rate
≥500g2
Perinatal Mortality
Rate
≥500g3
Neonatal Mortality
Rate
≥500g4
Total Cesarean Section
Rate5
Primary Cesarean Section
Rate6
Extremely Low Birth
Weight % 7
Very Low Birth
Weight
%8
Low Birth Weight
%9
1 2,096 1.0 1.4 1.0 15.2 9.7 0.1 0.5 4.72 1,248 2.4 3.2 0.8 10.5 6.8 0.2 0.3 4.13 560 0.0 3.6 3.6 14.4 9.8 0.4 0.4 2.04 12,242 4.0 6.0 2.8 17.9 12.2 0.5 1.4 7.65 366 5.5 10.9 8.2 15.6 8.2 0.3 0.3 1.46 2,325 1.7 1.7 0.0 18.8 11.8 0.0 0.1 5.17 838 2.4 3.6 2.4 20.3 10.9 0.0 0.1 1.78 436 4.6 4.6 0.0 11.3 9.0 0.0 0.0 9.99 577 1.7 1.7 0.0 7.1 3.5 0.2 0.2 2.4
10 12,214 3.4 6.5 3.9 18.9 12.4 0.7 1.5 8.111 535 0.0 0.0 0.0 9.9 6.4 0.0 0.2 1.312 1,123 1.8 3.6 1.8 15.7 10.2 0.1 0.1 2.413 1,295 2.3 2.3 0.0 6.8 4.6 0.2 0.4 3.914 342 2.9 2.9 0.0 22.8 14.9 0.0 0.0 0.915 394 5.1 5.1 0.0 13.2 8.7 0.0 0.0 2.816 650 6.2 6.2 1.5 20.2 13.5 0.0 0.2 3.417 409 7.3 14.7 9.9 7.1 4.6 0.7 0.7 4.7
Alberta 37,650 3.2 5.2 2.6 17.0 11.2 0.4 1.0 6.4Source: Statistics reported to the Committee on Reproductive Care by Medical Records
Departments of the hospitals.Notes: 1. Out-of-hospital births excluded. 2. (Stillbirths ≥500g / Total Births ≥500g) x 1000. 3. ( (Stillbirths ≥500g + Early Neonatal Deaths ≥500g) / Total Births ≥500g) x 1000. 4.( ( Early + Late Neonatal Deaths ≥500g) / Live Births ≥500g) x 1000. 5. ( Total Caesarean Sections / Total Mothers Delivered) x 100. 6. (Primary Caesarean Sections / Total Mothers Delivered) x 100. 7. ( Live Births < 1000g / All Live Births) x 100. 8. ( Live Births < 1500g / All Live Births ) x 100. 9. ( Live Births < 2500g / All Live Births) x 100.
RHA boundaries are current as of 1998.
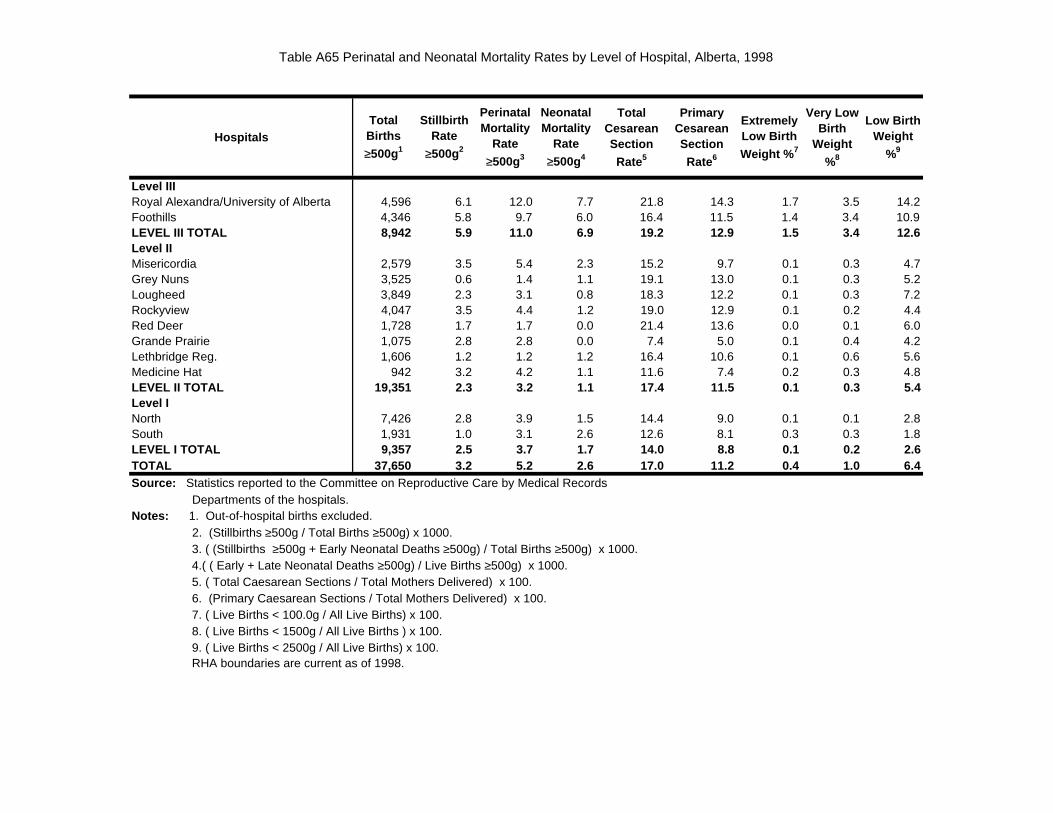
Table A65 Perinatal and Neonatal Mortality Rates by Level of Hospital, Alberta, 1998
HospitalsTotal Births
≥500g1
Stillbirth Rate
≥500g2
Perinatal Mortality
Rate
≥500g3
Neonatal Mortality
Rate
≥500g4
Total Cesarean Section
Rate5
Primary Cesarean Section
Rate6
Extremely Low Birth
Weight % 7
Very Low Birth
Weight
%8
Low Birth Weight
%9
Level IIIRoyal Alexandra/University of Alberta 4,596 6.1 12.0 7.7 21.8 14.3 1.7 3.5 14.2Foothills 4,346 5.8 9.7 6.0 16.4 11.5 1.4 3.4 10.9LEVEL III TOTAL 8,942 5.9 11.0 6.9 19.2 12.9 1.5 3.4 12.6Level IIMisericordia 2,579 3.5 5.4 2.3 15.2 9.7 0.1 0.3 4.7Grey Nuns 3,525 0.6 1.4 1.1 19.1 13.0 0.1 0.3 5.2Lougheed 3,849 2.3 3.1 0.8 18.3 12.2 0.1 0.3 7.2Rockyview 4,047 3.5 4.4 1.2 19.0 12.9 0.1 0.2 4.4Red Deer 1,728 1.7 1.7 0.0 21.4 13.6 0.0 0.1 6.0Grande Prairie 1,075 2.8 2.8 0.0 7.4 5.0 0.1 0.4 4.2Lethbridge Reg. 1,606 1.2 1.2 1.2 16.4 10.6 0.1 0.6 5.6Medicine Hat 942 3.2 4.2 1.1 11.6 7.4 0.2 0.3 4.8LEVEL II TOTAL 19,351 2.3 3.2 1.1 17.4 11.5 0.1 0.3 5.4Level INorth 7,426 2.8 3.9 1.5 14.4 9.0 0.1 0.1 2.8South 1,931 1.0 3.1 2.6 12.6 8.1 0.3 0.3 1.8LEVEL I TOTAL 9,357 2.5 3.7 1.7 14.0 8.8 0.1 0.2 2.6TOTAL 37,650 3.2 5.2 2.6 17.0 11.2 0.4 1.0 6.4Source: Statistics reported to the Committee on Reproductive Care by Medical Records Departments of the hospitals.Notes: 1. Out-of-hospital births excluded. 2. (Stillbirths ≥500g / Total Births ≥500g) x 1000. 3. ( (Stillbirths ≥500g + Early Neonatal Deaths ≥500g) / Total Births ≥500g) x 1000. 4.( ( Early + Late Neonatal Deaths ≥500g) / Live Births ≥500g) x 1000. 5. ( Total Caesarean Sections / Total Mothers Delivered) x 100. 6. (Primary Caesarean Sections / Total Mothers Delivered) x 100. 7. ( Live Births < 100.0g / All Live Births) x 100. 8. ( Live Births < 1500g / All Live Births ) x 100. 9. ( Live Births < 2500g / All Live Births) x 100. RHA boundaries are current as of 1998.
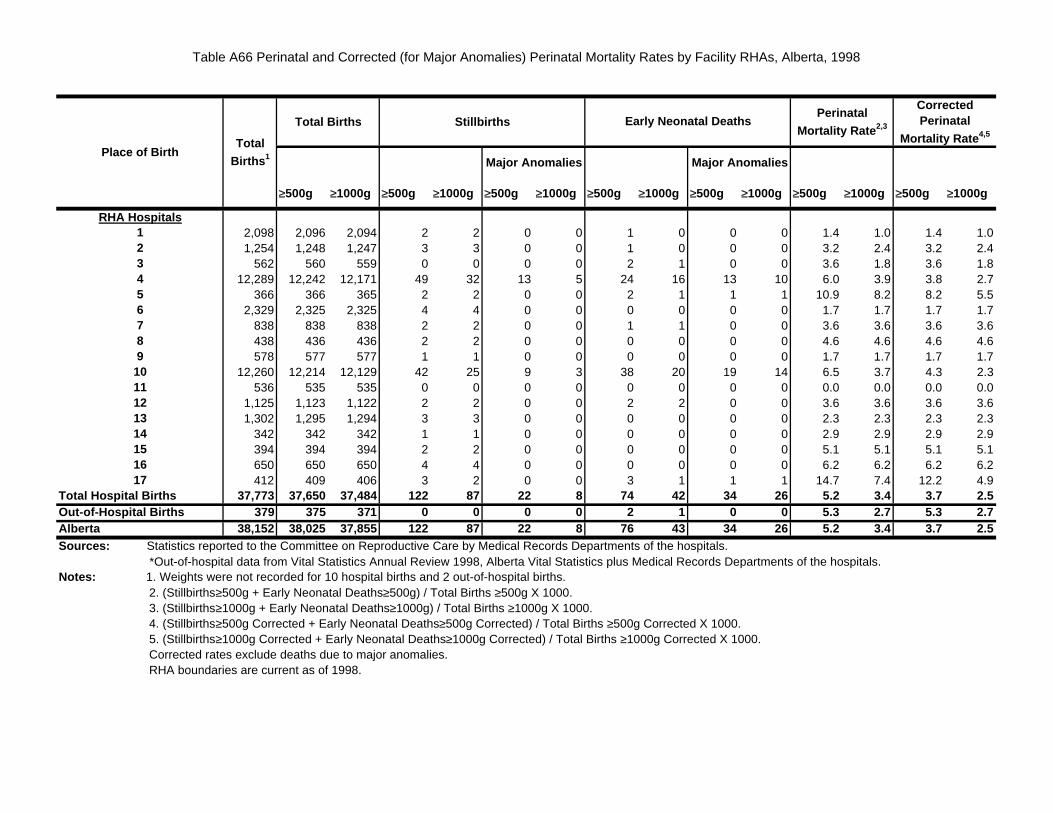
Table A66 Perinatal and Corrected (for Major Anomalies) Perinatal Mortality Rates by Facility RHAs, Alberta, 1998
Total Births StillbirthsPerinatal
Mortality Rate 2,3
Corrected Perinatal
Mortality Rate 4,5
Major Anomalies Major Anomalies
≥500g ≥1000g ≥500g ≥1000g ≥500g ≥1000g ≥500g ≥1000g ≥500g ≥1000g ≥500g ≥1000g ≥500g ≥1000g
RHA Hospitals1 2,098 2,096 2,094 2 2 0 0 1 0 0 0 1.4 1.0 1.4 1.02 1,254 1,248 1,247 3 3 0 0 1 0 0 0 3.2 2.4 3.2 2.43 562 560 559 0 0 0 0 2 1 0 0 3.6 1.8 3.6 1.84 12,289 12,242 12,171 49 32 13 5 24 16 13 10 6.0 3.9 3.8 2.75 366 366 365 2 2 0 0 2 1 1 1 10.9 8.2 8.2 5.56 2,329 2,325 2,325 4 4 0 0 0 0 0 0 1.7 1.7 1.7 1.77 838 838 838 2 2 0 0 1 1 0 0 3.6 3.6 3.6 3.68 438 436 436 2 2 0 0 0 0 0 0 4.6 4.6 4.6 4.69 578 577 577 1 1 0 0 0 0 0 0 1.7 1.7 1.7 1.7
10 12,260 12,214 12,129 42 25 9 3 38 20 19 14 6.5 3.7 4.3 2.311 536 535 535 0 0 0 0 0 0 0 0 0.0 0.0 0.0 0.012 1,125 1,123 1,122 2 2 0 0 2 2 0 0 3.6 3.6 3.6 3.613 1,302 1,295 1,294 3 3 0 0 0 0 0 0 2.3 2.3 2.3 2.314 342 342 342 1 1 0 0 0 0 0 0 2.9 2.9 2.9 2.915 394 394 394 2 2 0 0 0 0 0 0 5.1 5.1 5.1 5.116 650 650 650 4 4 0 0 0 0 0 0 6.2 6.2 6.2 6.217 412 409 406 3 2 0 0 3 1 1 1 14.7 7.4 12.2 4.9
Total Hospital Births 37,773 37,650 37,484 122 87 22 8 74 42 34 26 5.2 3.4 3.7 2.5Out-of-Hospital Births 379 375 37 1 0 0 0 0 2 1 0 0 5.3 2.7 5.3 2.7Alberta 38,152 38,025 37,855 122 87 22 8 76 43 34 26 5.2 3.4 3.7 2.5Sources: Statistics reported to the Committee on Reproductive Care by Medical Records Departments of the hospitals. *Out-of-hospital data from Vital Statistics Annual Review 1998, Alberta Vital Statistics plus Medical Records Departments of the hospitals.Notes: 1. Weights were not recorded for 10 hospital births and 2 out-of-hospital births. 2. (Stillbirths≥500g + Early Neonatal Deaths≥500g) / Total Births ≥500g X 1000. 3. (Stillbirths≥1000g + Early Neonatal Deaths≥1000g) / Total Births ≥1000g X 1000. 4. (Stillbirths≥500g Corrected + Early Neonatal Deaths≥500g Corrected) / Total Births ≥500g Corrected X 1000. 5. (Stillbirths≥1000g Corrected + Early Neonatal Deaths≥1000g Corrected) / Total Births ≥1000g Corrected X 1000. Corrected rates exclude deaths due to major anomalies. RHA boundaries are current as of 1998.
Early Neonatal Deaths
Place of BirthTotal
Births 1
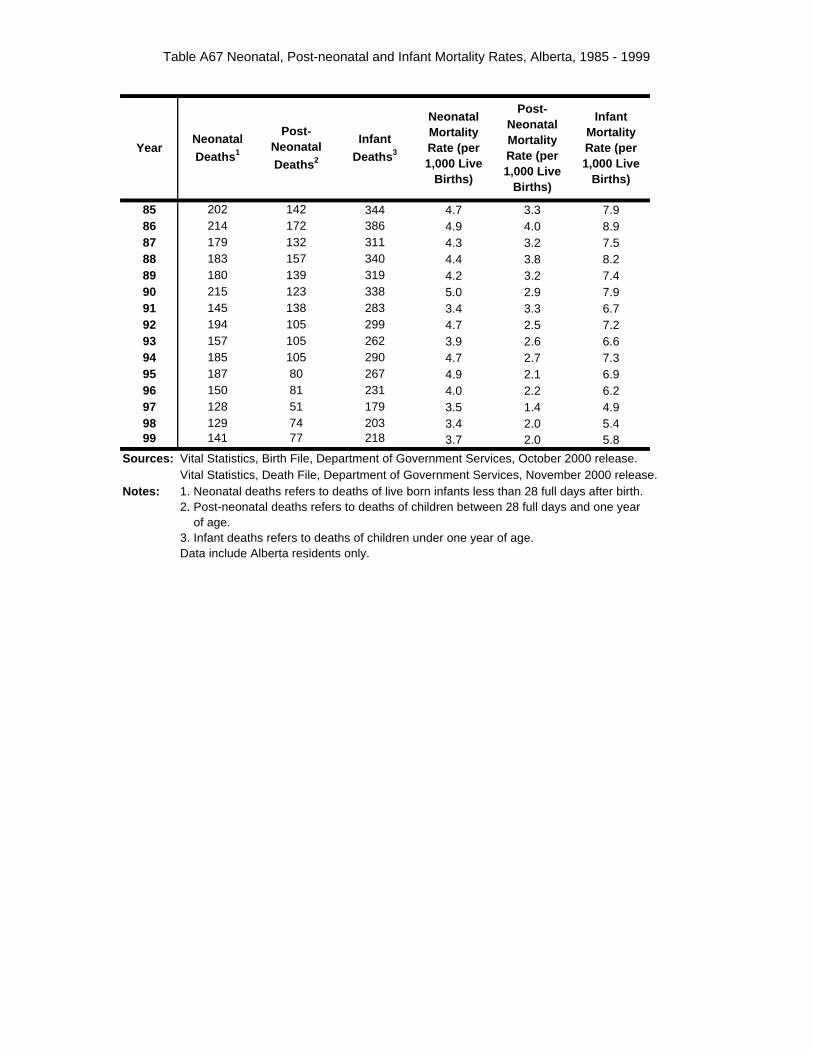
Table A67 Neonatal, Post-neonatal and Infant Mortality Rates, Alberta, 1985 - 1999
85 202 142 344 4.7 3.3 7.986 214 172 386 4.9 4.0 8.987 179 132 311 4.3 3.2 7.588 183 157 340 4.4 3.8 8.289 180 139 319 4.2 3.2 7.490 215 123 338 5.0 2.9 7.991 145 138 283 3.4 3.3 6.792 194 105 299 4.7 2.5 7.293 157 105 262 3.9 2.6 6.694 185 105 290 4.7 2.7 7.395 187 80 267 4.9 2.1 6.996 150 81 231 4.0 2.2 6.297 128 51 179 3.5 1.4 4.998 129 74 203 3.4 2.0 5.499 141 77 218 3.7 2.0 5.8
Sources: Vital Statistics, Birth File, Department of Government Services, October 2000 release.Vital Statistics, Death File, Department of Government Services, November 2000 release.
Notes: 1. Neonatal deaths refers to deaths of live born infants less than 28 full days after birth.2. Post-neonatal deaths refers to deaths of children between 28 full days and one year of age.3. Infant deaths refers to deaths of children under one year of age.Data include Alberta residents only.
Year
Post-Neonatal Mortality Rate (per 1,000 Live
Births)
Infant Mortality Rate (per 1,000 Live
Births)
Neonatal
Deaths 1
Post-Neonatal
Deaths 2
Infant
Deaths 3
Neonatal Mortality Rate (per 1,000 Live
Births)
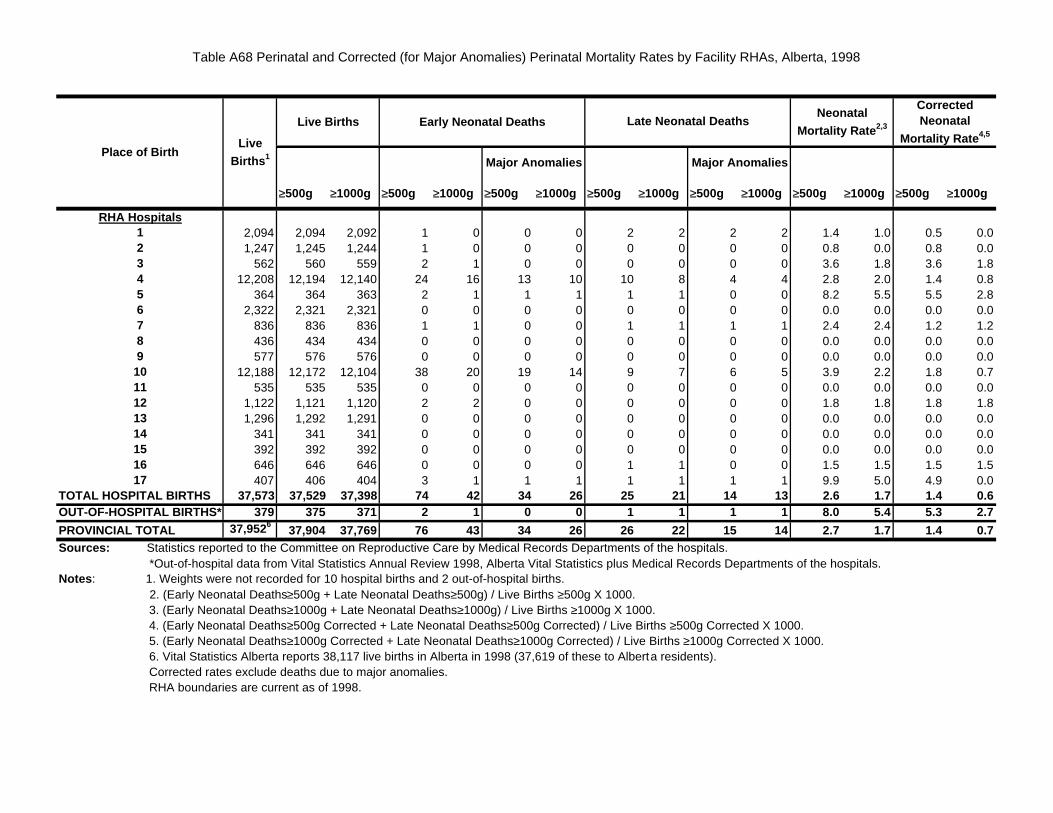
Table A68 Perinatal and Corrected (for Major Anomalies) Perinatal Mortality Rates by Facility RHAs, Alberta, 1998
Live Births Early Neonatal DeathsNeonatal
Mortality Rate 2,3
Corrected Neonatal
Mortality Rate 4,5
Major Anomalies Major Anomalies
≥500g ≥1000g ≥500g ≥1000g ≥500g ≥1000g ≥500g ≥1000g ≥500g ≥1000g ≥500g ≥1000g ≥500g ≥1000g
RHA Hospitals1 2,094 2,094 2,092 1 0 0 0 2 2 2 2 1.4 1.0 0.5 0.02 1,247 1,245 1,244 1 0 0 0 0 0 0 0 0.8 0.0 0.8 0.03 562 560 559 2 1 0 0 0 0 0 0 3.6 1.8 3.6 1.84 12,208 12,194 12,140 24 16 13 10 10 8 4 4 2.8 2.0 1.4 0.85 364 364 363 2 1 1 1 1 1 0 0 8.2 5.5 5.5 2.86 2,322 2,321 2,321 0 0 0 0 0 0 0 0 0.0 0.0 0.0 0.07 836 836 836 1 1 0 0 1 1 1 1 2.4 2.4 1.2 1.28 436 434 434 0 0 0 0 0 0 0 0 0.0 0.0 0.0 0.09 577 576 576 0 0 0 0 0 0 0 0 0.0 0.0 0.0 0.0
10 12,188 12,172 12,104 38 20 19 14 9 7 6 5 3.9 2.2 1.8 0.711 535 535 535 0 0 0 0 0 0 0 0 0.0 0.0 0.0 0.012 1,122 1,121 1,120 2 2 0 0 0 0 0 0 1.8 1.8 1.8 1.813 1,296 1,292 1,291 0 0 0 0 0 0 0 0 0.0 0.0 0.0 0.014 341 341 341 0 0 0 0 0 0 0 0 0.0 0.0 0.0 0.015 392 392 392 0 0 0 0 0 0 0 0 0.0 0.0 0.0 0.016 646 646 646 0 0 0 0 1 1 0 0 1.5 1.5 1.5 1.517 407 406 404 3 1 1 1 1 1 1 1 9.9 5.0 4.9 0.0
TOTAL HOSPITAL BIRTHS 37,573 37,529 37,398 74 42 34 26 25 21 14 13 2.6 1.7 1.4 0.6OUT-OF-HOSPITAL BIRTHS* 379 375 37 1 2 1 0 0 1 1 1 1 8.0 5.4 5.3 2.7
PROVINCIAL TOTAL 37,952637,904 37,769 76 43 34 26 26 22 15 14 2.7 1.7 1.4 0.7
Sources: Statistics reported to the Committee on Reproductive Care by Medical Records Departments of the hospitals. *Out-of-hospital data from Vital Statistics Annual Review 1998, Alberta Vital Statistics plus Medical Records Departments of the hospitals.Notes : 1. Weights were not recorded for 10 hospital births and 2 out-of-hospital births. 2. (Early Neonatal Deaths≥500g + Late Neonatal Deaths≥500g) / Live Births ≥500g X 1000. 3. (Early Neonatal Deaths≥1000g + Late Neonatal Deaths≥1000g) / Live Births ≥1000g X 1000. 4. (Early Neonatal Deaths≥500g Corrected + Late Neonatal Deaths≥500g Corrected) / Live Births ≥500g Corrected X 1000. 5. (Early Neonatal Deaths≥1000g Corrected + Late Neonatal Deaths≥1000g Corrected) / Live Births ≥1000g Corrected X 1000. 6. Vital Statistics Alberta reports 38,117 live births in Alberta in 1998 (37,619 of these to Alberta residents). Corrected rates exclude deaths due to major anomalies. RHA boundaries are current as of 1998.
Late Neonatal Deaths
Place of BirthLive
Births 1
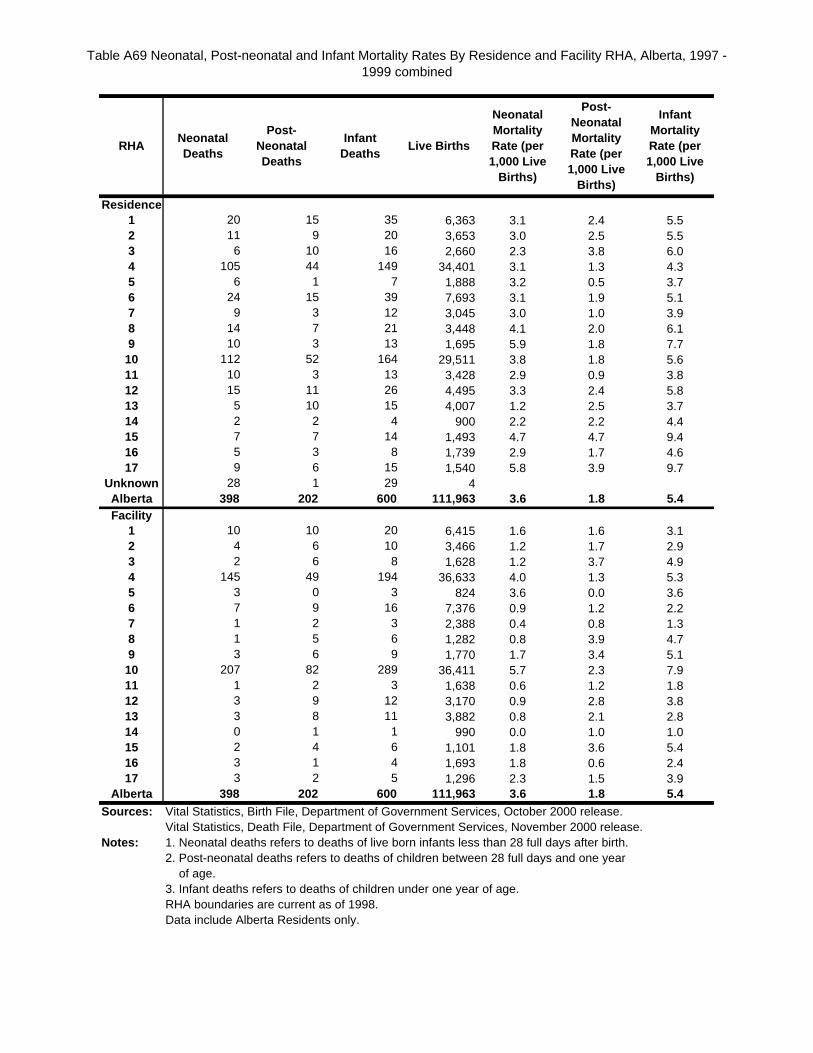
Table A69 Neonatal, Post-neonatal and Infant Mortality Rates By Residence and Facility RHA, Alberta, 1997 - 1999 combined
Residence1 20 15 35 6,363 3.1 2.4 5.52 11 9 20 3,653 3.0 2.5 5.53 6 10 16 2,660 2.3 3.8 6.04 105 44 149 34,401 3.1 1.3 4.35 6 1 7 1,888 3.2 0.5 3.76 24 15 39 7,693 3.1 1.9 5.17 9 3 12 3,045 3.0 1.0 3.98 14 7 21 3,448 4.1 2.0 6.19 10 3 13 1,695 5.9 1.8 7.7
10 112 52 164 29,511 3.8 1.8 5.611 10 3 13 3,428 2.9 0.9 3.812 15 11 26 4,495 3.3 2.4 5.813 5 10 15 4,007 1.2 2.5 3.714 2 2 4 900 2.2 2.2 4.415 7 7 14 1,493 4.7 4.7 9.416 5 3 8 1,739 2.9 1.7 4.617 9 6 15 1,540 5.8 3.9 9.7
Unknown 28 1 29 4Alberta 398 202 600 111,963 3.6 1.8 5.4Facility
1 10 10 20 6,415 1.6 1.6 3.12 4 6 10 3,466 1.2 1.7 2.93 2 6 8 1,628 1.2 3.7 4.94 145 49 194 36,633 4.0 1.3 5.35 3 0 3 824 3.6 0.0 3.66 7 9 16 7,376 0.9 1.2 2.27 1 2 3 2,388 0.4 0.8 1.38 1 5 6 1,282 0.8 3.9 4.79 3 6 9 1,770 1.7 3.4 5.1
10 207 82 289 36,411 5.7 2.3 7.911 1 2 3 1,638 0.6 1.2 1.812 3 9 12 3,170 0.9 2.8 3.813 3 8 11 3,882 0.8 2.1 2.814 0 1 1 990 0.0 1.0 1.015 2 4 6 1,101 1.8 3.6 5.416 3 1 4 1,693 1.8 0.6 2.417 3 2 5 1,296 2.3 1.5 3.9
Alberta 398 202 600 111,963 3.6 1.8 5.4Sources: Vital Statistics, Birth File, Department of Government Services, October 2000 release.
Vital Statistics, Death File, Department of Government Services, November 2000 release.Notes: 1. Neonatal deaths refers to deaths of live born infants less than 28 full days after birth.
2. Post-neonatal deaths refers to deaths of children between 28 full days and one year of age.3. Infant deaths refers to deaths of children under one year of age.RHA boundaries are current as of 1998.Data include Alberta Residents only.
RHANeonatal Deaths
Post-Neonatal Deaths
Infant Deaths
Post-Neonatal Mortality Rate (per 1,000 Live
Births)
Neonatal Mortality Rate (per 1,000 Live
Births)
Infant Mortality Rate (per 1,000 Live
Births)
Live Births
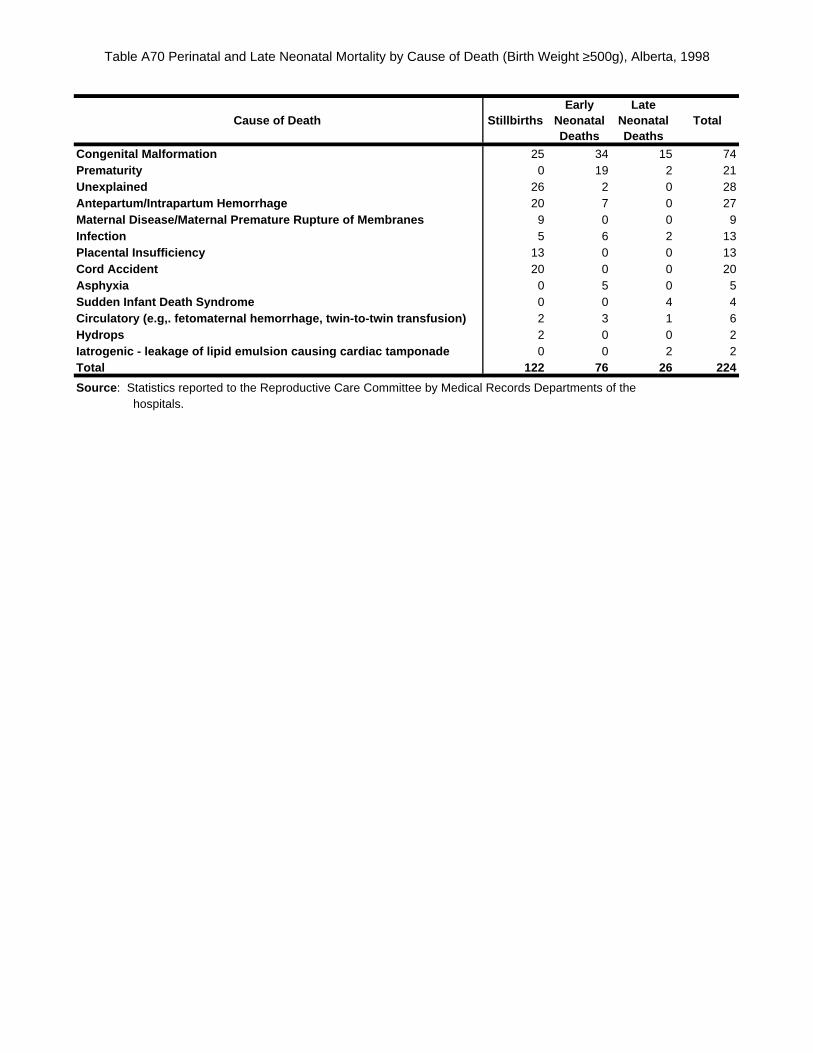
Table A70 Perinatal and Late Neonatal Mortality by Cause of Death (Birth Weight ≥500g), Alberta, 1998
Cause of Death StillbirthsEarly
Neonatal Deaths
Late Neonatal Deaths
Total
Congenital Malformation 25 34 15 74Prematurity 0 19 2 21Unexplained 26 2 0 28Antepartum/Intrapartum Hemorrhage 20 7 0 27Maternal Disease/Maternal Premature Rupture of Membranes 9 0 0 9Infection 5 6 2 13Placental Insufficiency 13 0 0 13Cord Accident 20 0 0 20Asphyxia 0 5 0 5Sudden Infant Death Syndrome 0 0 4 4Circulatory (e.g,. fetomaternal hemorrhage, twin-to-twin transfusion) 2 3 1 6Hydrops 2 0 0 2Iatrogenic - leakage of lipid emulsion causing cardiac tamponade 0 0 2 2Total 122 76 26 224
Source : Statistics reported to the Reproductive Care Committee by Medical Records Departments of the hospitals.
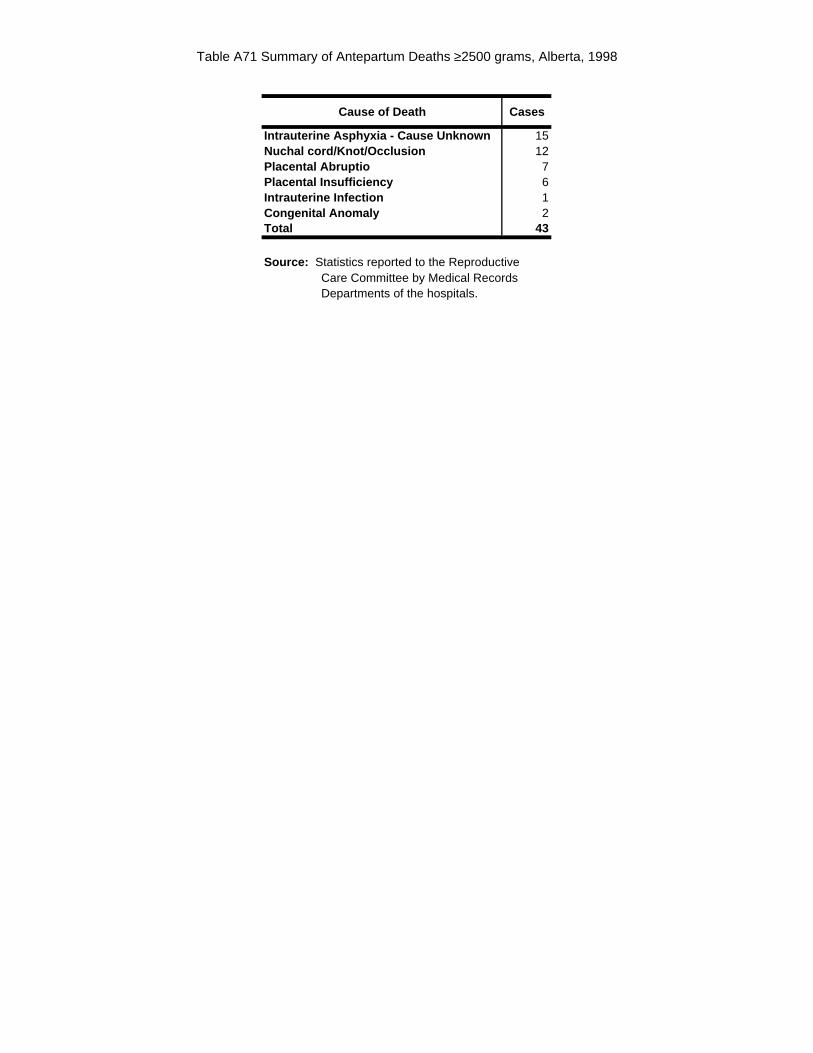
Table A71 Summary of Antepartum Deaths ≥2500 grams, Alberta, 1998
Cause of Death Cases
Intrauterine Asphyxia - Cause Unknown 15Nuchal cord/Knot/Occlusion 12Placental Abruptio 7Placental Insufficiency 6Intrauterine Infection 1Congenital Anomaly 2Total 43
Source: Statistics reported to the Reproductive Care Committee by Medical Records Departments of the hospitals.
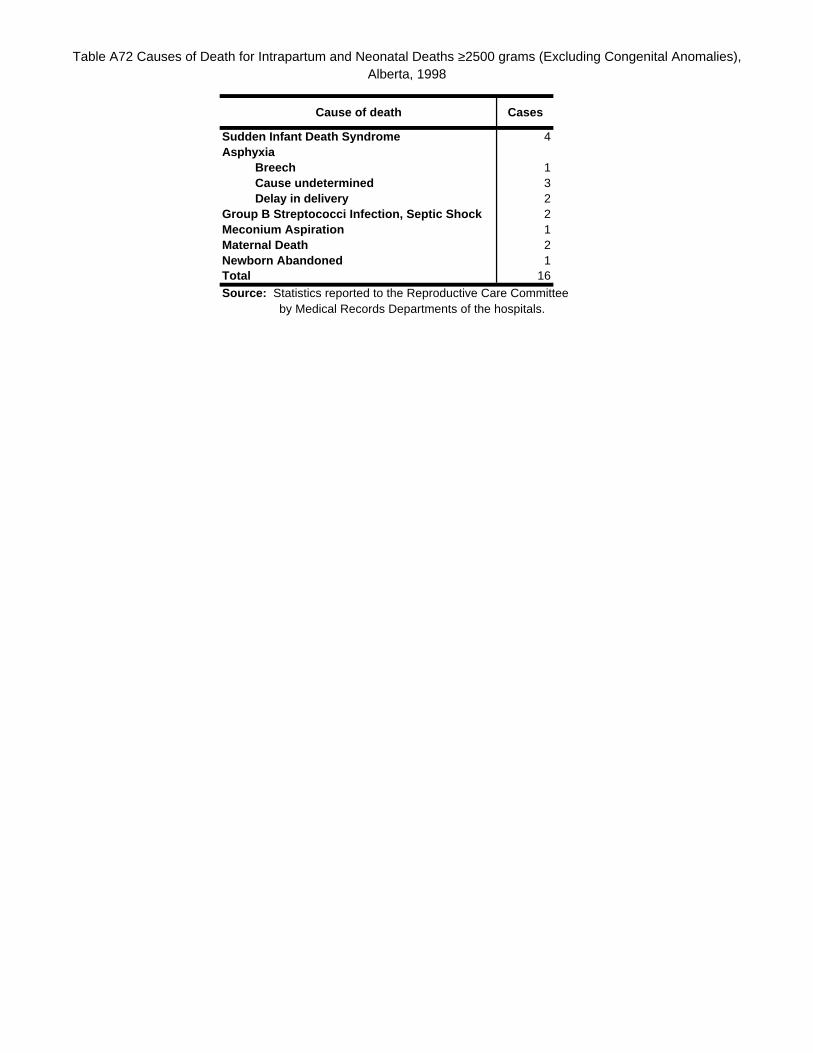
Table A72 Causes of Death for Intrapartum and Neonatal Deaths ≥2500 grams (Excluding Congenital Anomalies), Alberta, 1998
Cause of death Cases
Sudden Infant Death Syndrome 4Asphyxia
Breech 1Cause undetermined 3Delay in delivery 2
Group B Streptococci Infection, Septic Shock 2Meconium Aspiration 1Maternal Death 2Newborn Abandoned 1Total 16
Source: Statistics reported to the Reproductive Care Committee by Medical Records Departments of the hospitals.
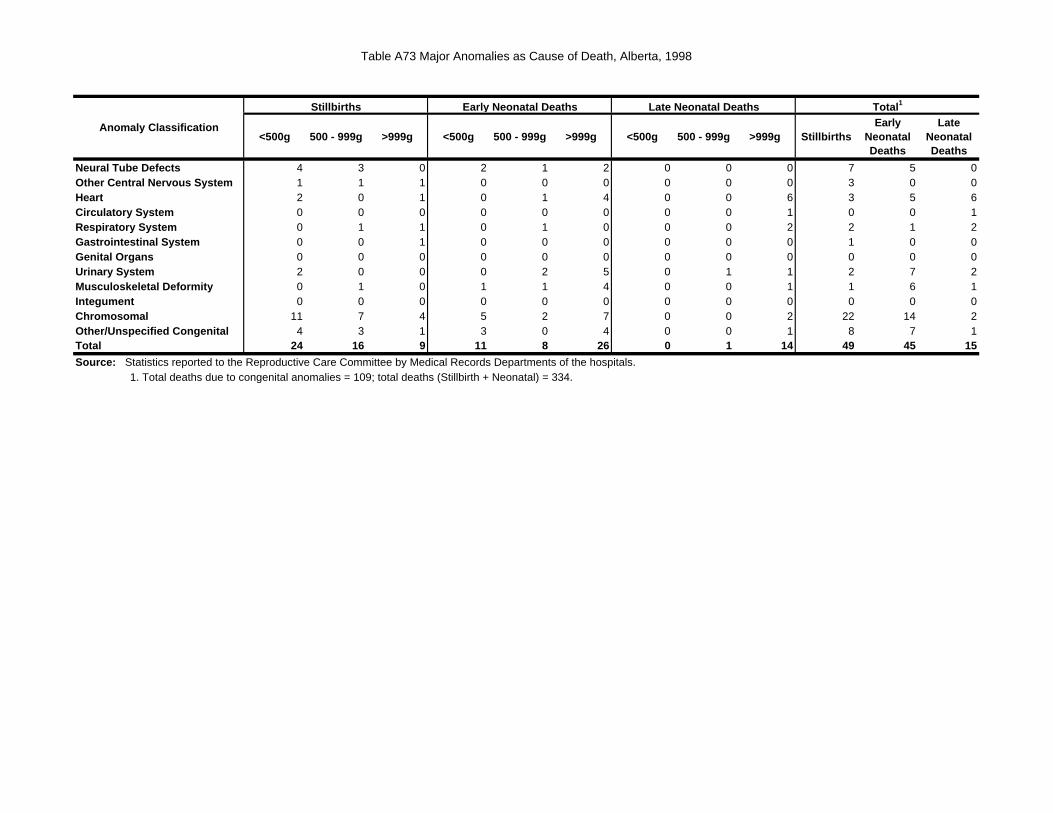
Table A73 Major Anomalies as Cause of Death, Alberta, 1998
<500g 500 - 999g >999g <500g 500 - 999g >999g <500g 500 - 999g >999g StillbirthsEarly
Neonatal Deaths
Late Neonatal Deaths
Neural Tube Defects 4 3 0 2 1 2 0 0 0 7 5 0Other Central Nervous System 1 1 1 0 0 0 0 0 0 3 0 0Heart 2 0 1 0 1 4 0 0 6 3 5 6Circulatory System 0 0 0 0 0 0 0 0 1 0 0 1Respiratory System 0 1 1 0 1 0 0 0 2 2 1 2Gastrointestinal System 0 0 1 0 0 0 0 0 0 1 0 0Genital Organs 0 0 0 0 0 0 0 0 0 0 0 0Urinary System 2 0 0 0 2 5 0 1 1 2 7 2Musculoskeletal Deformity 0 1 0 1 1 4 0 0 1 1 6 1Integument 0 0 0 0 0 0 0 0 0 0 0 0Chromosomal 11 7 4 5 2 7 0 0 2 22 14 2Other/Unspecified Congenital 4 3 1 3 0 4 0 0 1 8 7 1Total 24 16 9 11 8 26 0 1 14 49 45 15
Source: Statistics reported to the Reproductive Care Committee by Medical Records Departments of the hospitals. 1. Total deaths due to congenital anomalies = 109; total deaths (Stillbirth + Neonatal) = 334.
Total 1
Anomaly Classification
Stillbirths Earl y Neonatal Deaths Late Neonatal Deaths
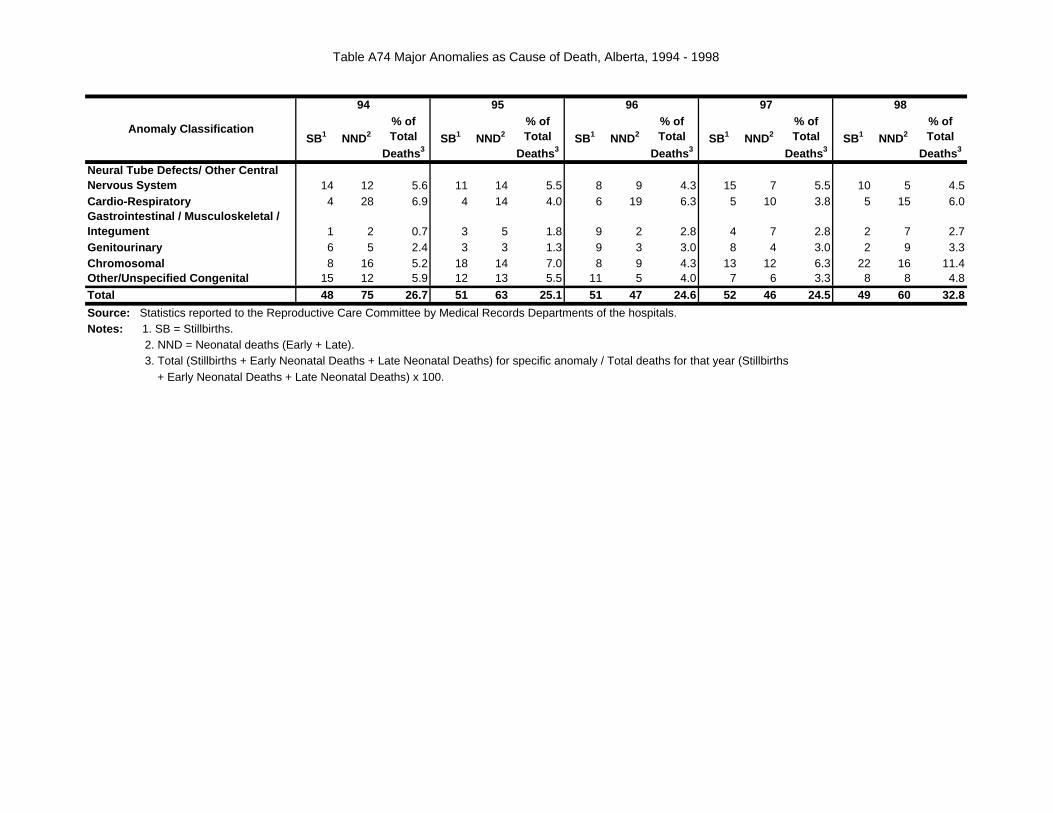
Table A74 Major Anomalies as Cause of Death, Alberta, 1994 - 1998
SB1 NND2
% of Total
Deaths 3SB1 NND2
% of Total
Deaths 3SB1 NND2
% of Total
Deaths 3SB1 NND2
% of Total
Deaths 3SB1 NND2
% of Total
Deaths 3
Neural Tube Defects/ Other Central Nervous System 14 12 5.6 11 14 5.5 8 9 4.3 15 7 5.5 10 5 4.5Cardio-Respiratory 4 28 6.9 4 14 4.0 6 19 6.3 5 10 3.8 5 15 6.0Gastrointestinal / Musculoskeletal / Integument 1 2 0.7 3 5 1.8 9 2 2.8 4 7 2.8 2 7 2.7Genitourinary 6 5 2.4 3 3 1.3 9 3 3.0 8 4 3.0 2 9 3.3Chromosomal 8 16 5.2 18 14 7.0 8 9 4.3 13 12 6.3 22 16 11.4Other/Unspecified Congenital 15 12 5.9 12 13 5.5 11 5 4.0 7 6 3.3 8 8 4.8
Total 48 75 26.7 51 63 25.1 51 47 24.6 52 46 24.5 49 60 32.8
Source: Statistics reported to the Reproductive Care Committee by Medical Records Departments of the hospitals.Notes: 1. SB = Stillbirths. 2. NND = Neonatal deaths (Early + Late). 3. Total (Stillbirths + Early Neonatal Deaths + Late Neonatal Deaths) for specific anomaly / Total deaths for that year (Stillbirths + Early Neonatal Deaths + Late Neonatal Deaths) x 100.
Anomaly Classification
97 9894 95 96
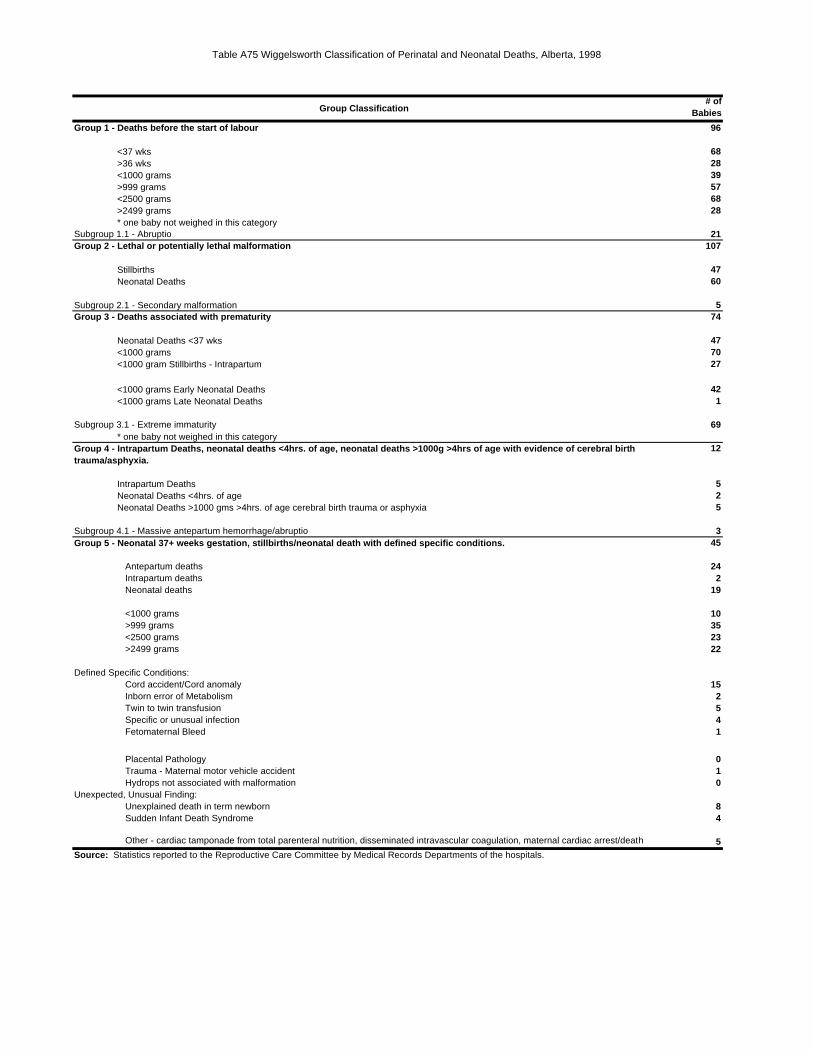
Table A75 Wiggelsworth Classification of Perinatal and Neonatal Deaths, Alberta, 1998
# ofBabies
Group 1 - Deaths before the start of labour 96
682839576828
Subgroup 1.1 - Abruptio 21Group 2 - Lethal or potentially lethal malformation 107
4760
5Group 3 - Deaths associated with prematurity 74
477027
421
Subgroup 3.1 - Extreme immaturity 69
12
525
Subgroup 4.1 - Massive antepartum hemorrhage/abruptio 345
Antepartum deaths 24Intrapartum deaths 2Neonatal deaths 19
<1000 grams 10>999 grams 35<2500 grams 23>2499 grams 22
Defined Specific Conditions:Cord accident/Cord anomaly 15Inborn error of Metabolism 2Twin to twin transfusion 5Specific or unusual infection 4Fetomaternal Bleed 1
Placental Pathology 0Trauma - Maternal motor vehicle accident 1Hydrops not associated with malformation 0
Unexpected, Unusual Finding:Unexplained death in term newborn 8Sudden Infant Death Syndrome 4
Other - cardiac tamponade from total parenteral nutrition, disseminated intravascular coagulation, maternal cardiac arrest/death 5Source: Statistics reported to the Reproductive Care Committee by Medical Records Departments of the hospitals.
Neonatal Deaths <4hrs. of ageNeonatal Deaths >1000 gms >4hrs. of age cerebral birth trauma or asphyxia
Group 5 - Neonatal 37+ weeks gestation, stillbirths/neonatal death with defined specific conditions.
<1000 grams Late Neonatal Deaths
* one baby not weighed in this category
Intrapartum Deaths
Group 4 - Intrapartum Deaths, neonatal deaths <4hrs. of age, neonatal deaths >1000g >4hrs of age with evidence of cerebral birt h trauma/asphyxia.
Neonatal Deaths <37 wks<1000 grams<1000 gram Stillbirths - Intrapartum
<1000 grams Early Neonatal Deaths
* one baby not weighed in this category
StillbirthsNeonatal Deaths
Subgroup 2.1 - Secondary malformation
>999 grams<2500 grams>2499 grams
Group Classification
<37 wks>36 wks<1000 grams
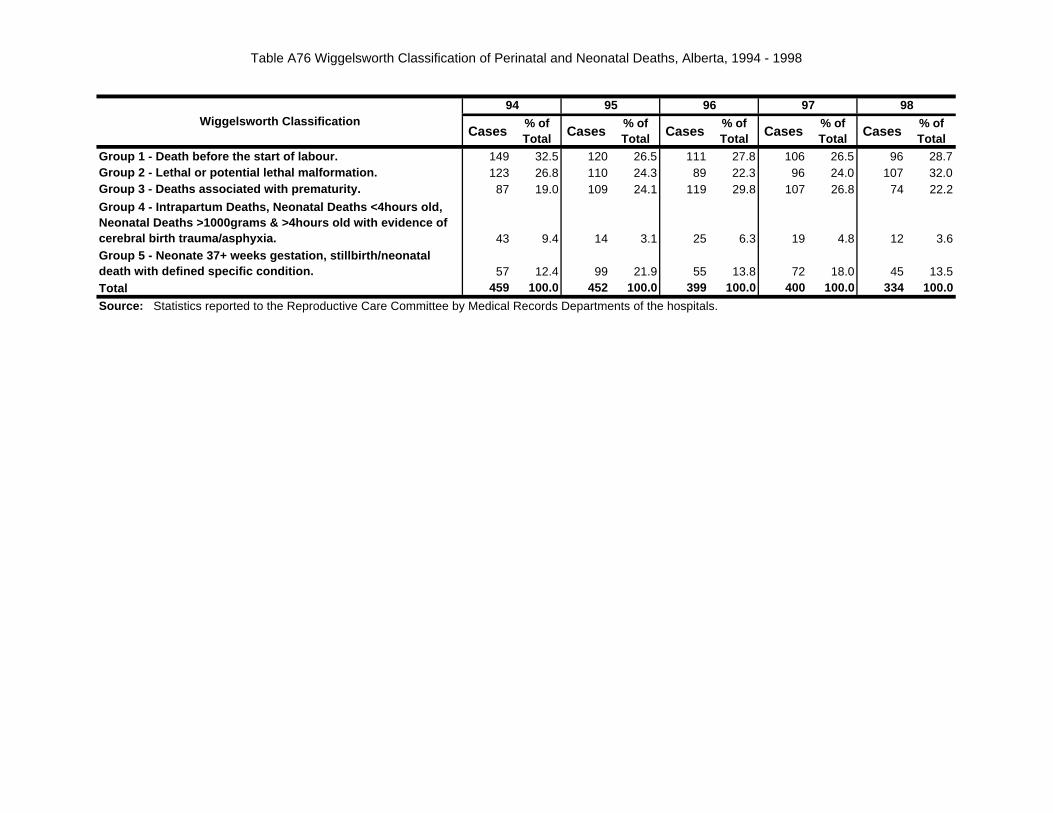
Table A76 Wiggelsworth Classification of Perinatal and Neonatal Deaths, Alberta, 1994 - 1998
Cases% ofTotal Cases
% ofTotal Cases
% ofTotal Cases
% ofTotal Cases
% ofTotal
Group 1 - Death before the start of labour. 149 32.5 120 26.5 111 27.8 106 26.5 96 28.7Group 2 - Lethal or potential lethal malformation. 123 26.8 110 24.3 89 22.3 96 24.0 107 32.0Group 3 - Deaths associated with prematurity. 87 19.0 109 24.1 119 29.8 107 26.8 74 22.2
Group 4 - Intrapartum Deaths, Neonatal Deaths <4hours old, Neonatal Deaths >1000grams & >4hours old with evidence of cerebral birth trauma/asphyxia. 43 9.4 14 3.1 25 6.3 19 4.8 12 3.6Group 5 - Neonate 37+ weeks gestation, stillbirth/neonatal death with defined specific condition. 57 12.4 99 21.9 55 13.8 72 18.0 45 13.5Total 459 100.0 452 100.0 399 100.0 400 100.0 334 100.0
Source: Statistics reported to the Reproductive Care Committee by Medical Records Departments of the hospitals.
98Wiggelsworth Classification
94 95 96 97
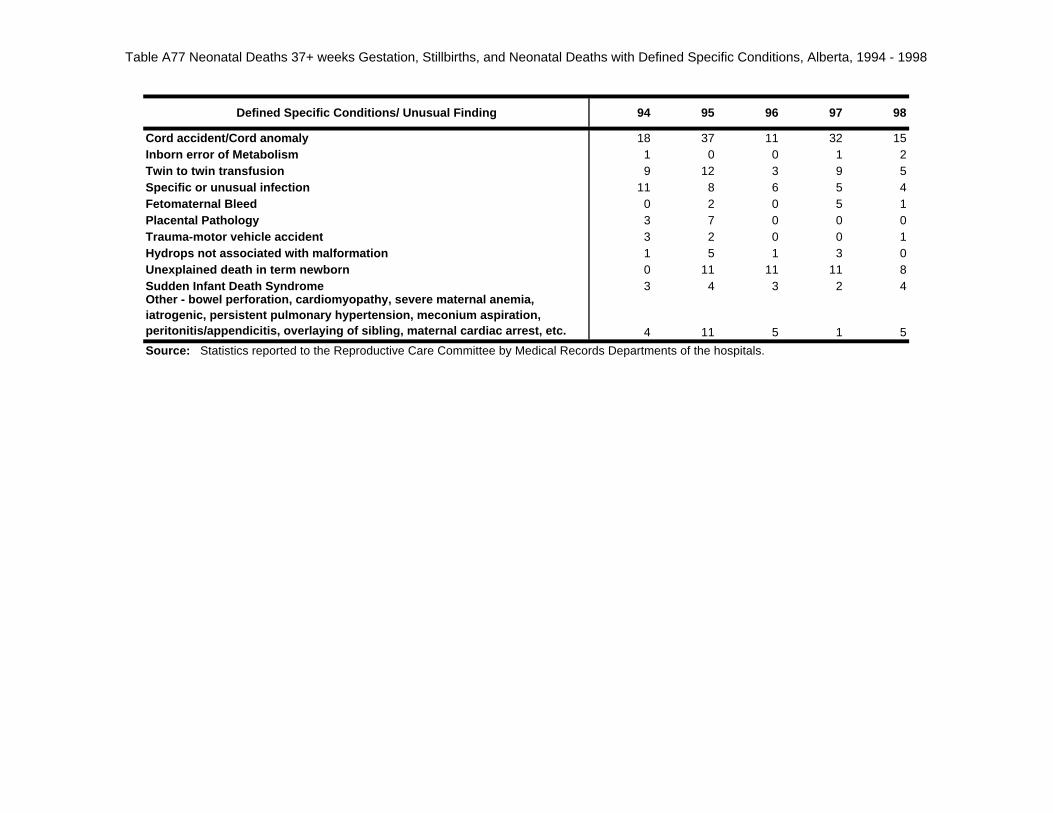
Table A77 Neonatal Deaths 37+ weeks Gestation, Stillbirths, and Neonatal Deaths with Defined Specific Conditions, Alberta, 1994 - 1998
Defined Specific Conditions/ Unusual Finding 94 95 96 97 98
Cord accident/Cord anomaly 18 37 11 32 15Inborn error of Metabolism 1 0 0 1 2Twin to twin transfusion 9 12 3 9 5Specific or unusual infection 11 8 6 5 4Fetomaternal Bleed 0 2 0 5 1Placental Pathology 3 7 0 0 0Trauma-motor vehicle accident 3 2 0 0 1Hydrops not associated with malformation 1 5 1 3 0Unexplained death in term newborn 0 11 11 11 8Sudden Infant Death Syndrome 3 4 3 2 4Other - bowel perforation, cardiomyopathy, severe maternal anemia, iatrogenic, persistent pulmonary hypertension, meconium aspiration, peritonitis/appendicitis, overlaying of sibling, maternal cardiac arrest, etc. 4 11 5 1 5
Source: Statistics reported to the Reproductive Care Committee by Medical Records Departments of the hospitals.
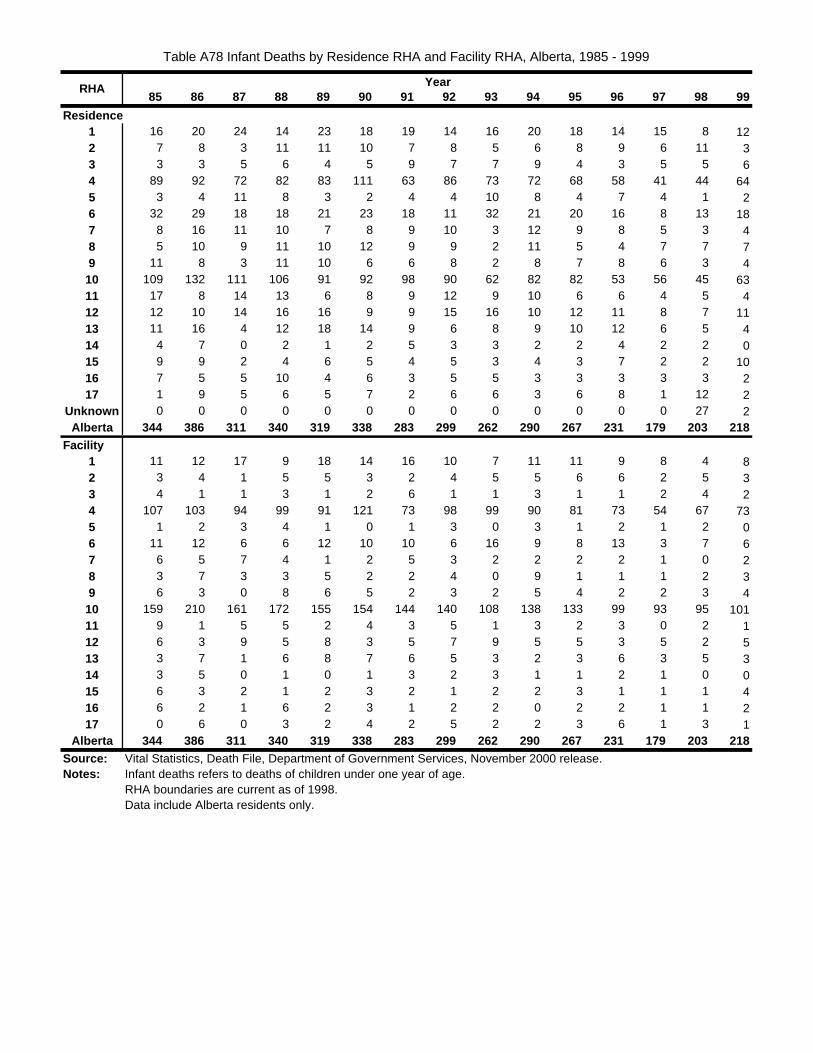
Table A78 Infant Deaths by Residence RHA and Facility RHA, Alberta, 1985 - 1999
85 86 87 88 89 90 91 92 93 94 95 96 97 98 99
Residence1 16 20 24 14 23 18 19 14 16 20 18 14 15 8 122 7 8 3 11 11 10 7 8 5 6 8 9 6 11 33 3 3 5 6 4 5 9 7 7 9 4 3 5 5 64 89 92 72 82 83 111 63 86 73 72 68 58 41 44 645 3 4 11 8 3 2 4 4 10 8 4 7 4 1 26 32 29 18 18 21 23 18 11 32 21 20 16 8 13 187 8 16 11 10 7 8 9 10 3 12 9 8 5 3 48 5 10 9 11 10 12 9 9 2 11 5 4 7 7 79 11 8 3 11 10 6 6 8 2 8 7 8 6 3 4
10 109 132 111 106 91 92 98 90 62 82 82 53 56 45 6311 17 8 14 13 6 8 9 12 9 10 6 6 4 5 412 12 10 14 16 16 9 9 15 16 10 12 11 8 7 1113 11 16 4 12 18 14 9 6 8 9 10 12 6 5 414 4 7 0 2 1 2 5 3 3 2 2 4 2 2 015 9 9 2 4 6 5 4 5 3 4 3 7 2 2 1016 7 5 5 10 4 6 3 5 5 3 3 3 3 3 217 1 9 5 6 5 7 2 6 6 3 6 8 1 12 2
Unknown 0 0 0 0 0 0 0 0 0 0 0 0 0 27 2Alberta 344 386 311 340 319 338 283 299 262 290 267 231 179 203 218
Facility1 11 12 17 9 18 14 16 10 7 11 11 9 8 4 82 3 4 1 5 5 3 2 4 5 5 6 6 2 5 33 4 1 1 3 1 2 6 1 1 3 1 1 2 4 24 107 103 94 99 91 121 73 98 99 90 81 73 54 67 735 1 2 3 4 1 0 1 3 0 3 1 2 1 2 06 11 12 6 6 12 10 10 6 16 9 8 13 3 7 67 6 5 7 4 1 2 5 3 2 2 2 2 1 0 28 3 7 3 3 5 2 2 4 0 9 1 1 1 2 39 6 3 0 8 6 5 2 3 2 5 4 2 2 3 4
10 159 210 161 172 155 154 144 140 108 138 133 99 93 95 10111 9 1 5 5 2 4 3 5 1 3 2 3 0 2 112 6 3 9 5 8 3 5 7 9 5 5 3 5 2 513 3 7 1 6 8 7 6 5 3 2 3 6 3 5 314 3 5 0 1 0 1 3 2 3 1 1 2 1 0 015 6 3 2 1 2 3 2 1 2 2 3 1 1 1 416 6 2 1 6 2 3 1 2 2 0 2 2 1 1 217 0 6 0 3 2 4 2 5 2 2 3 6 1 3 1
Alberta 344 386 311 340 319 338 283 299 262 290 267 231 179 203 218Source: Vital Statistics, Death File, Department of Government Services, November 2000 release.Notes: Infant deaths refers to deaths of children under one year of age.
RHA boundaries are current as of 1998.Data include Alberta residents only.
RHA Year
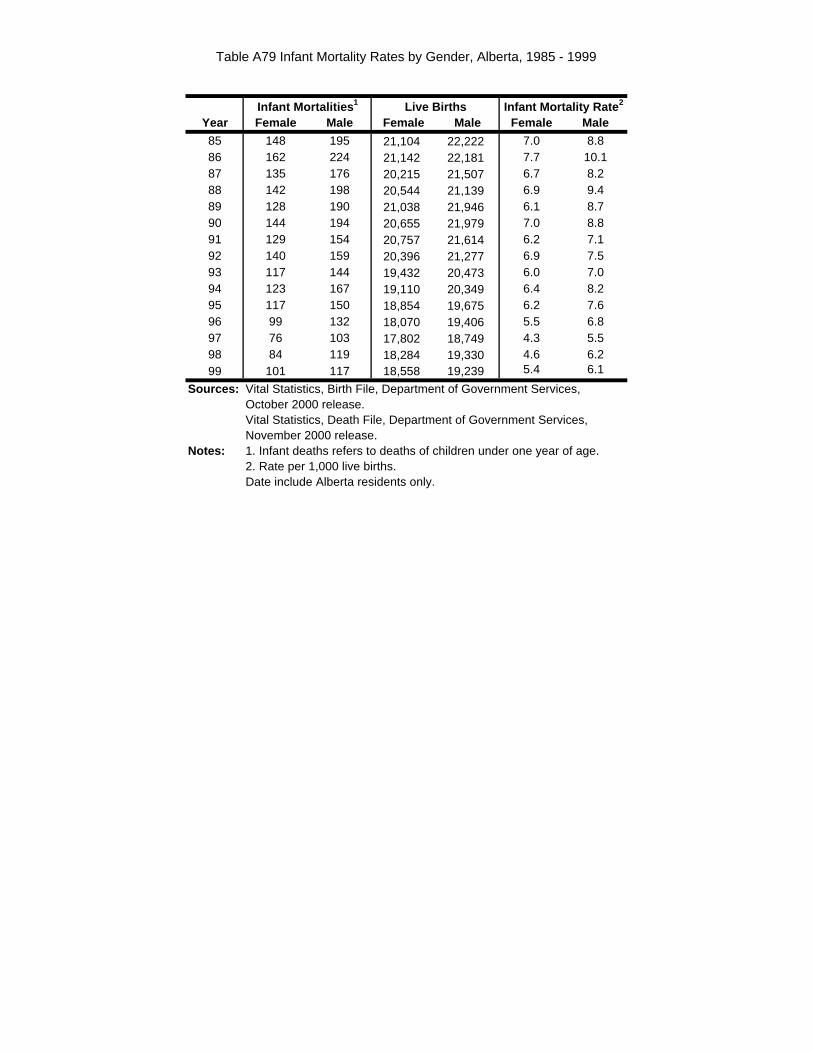
Table A79 Infant Mortality Rates by Gender, Alberta, 1985 - 1999
Year Female Male Female Male Female Male
85 148 195 21,104 22,222 7.0 8.886 162 224 21,142 22,181 7.7 10.187 135 176 20,215 21,507 6.7 8.288 142 198 20,544 21,139 6.9 9.489 128 190 21,038 21,946 6.1 8.790 144 194 20,655 21,979 7.0 8.891 129 154 20,757 21,614 6.2 7.192 140 159 20,396 21,277 6.9 7.593 117 144 19,432 20,473 6.0 7.094 123 167 19,110 20,349 6.4 8.295 117 150 18,854 19,675 6.2 7.696 99 132 18,070 19,406 5.5 6.897 76 103 17,802 18,749 4.3 5.598 84 119 18,284 19,330 4.6 6.299 101 117 18,558 19,239 5.4 6.1
Sources: Vital Statistics, Birth File, Department of Government Services, October 2000 release.Vital Statistics, Death File, Department of Government Services, November 2000 release.
Notes: 1. Infant deaths refers to deaths of children under one year of age.2. Rate per 1,000 live births.Date include Alberta residents only.
Infant Mortalities 1 Live Births Infant Mortality Rate 2
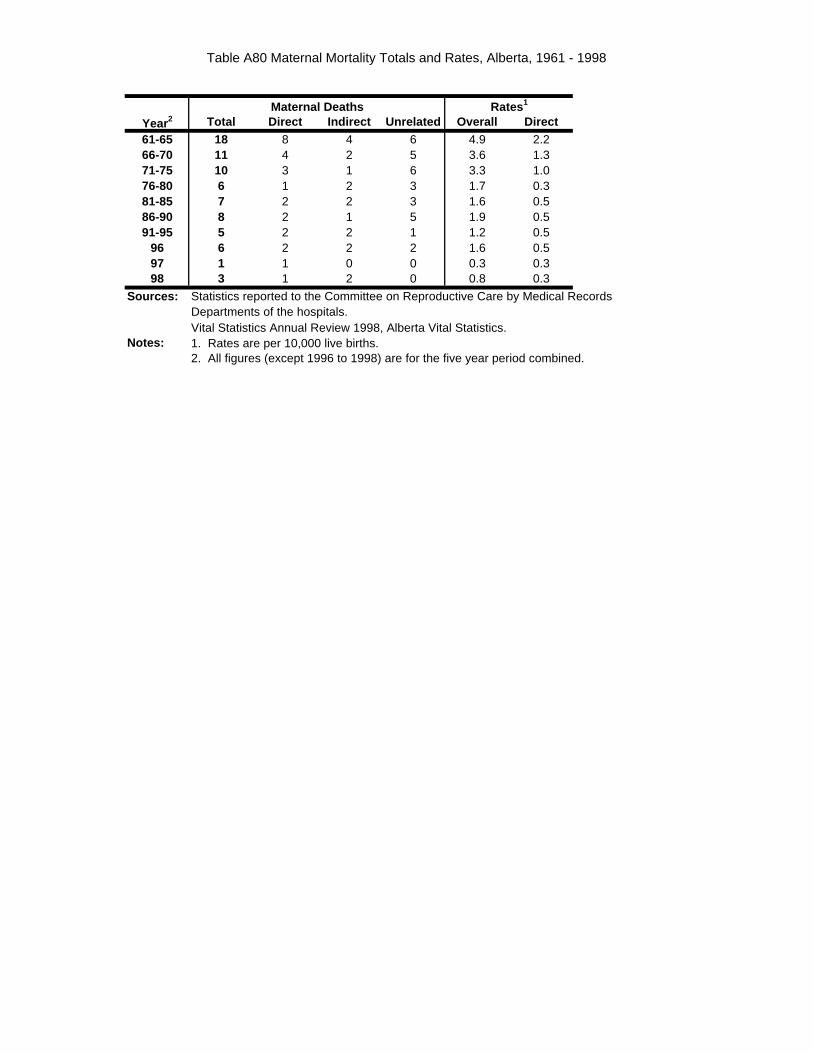
Table A80 Maternal Mortality Totals and Rates, Alberta, 1961 - 1998
Total Direct Indirect Unrelated Overall Direct61-65 18 8 4 6 4.9 2.266-70 11 4 2 5 3.6 1.371-75 10 3 1 6 3.3 1.076-80 6 1 2 3 1.7 0.381-85 7 2 2 3 1.6 0.586-90 8 2 1 5 1.9 0.591-95 5 2 2 1 1.2 0.5
96 6 2 2 2 1.6 0.597 1 1 0 0 0.3 0.398 3 1 2 0 0.8 0.3
Sources: Statistics reported to the Committee on Reproductive Care by Medical Records Departments of the hospitals.
Notes:2. All figures (except 1996 to 1998) are for the five year period combined.
Year2Maternal Deaths Rates 1
Vital Statistics Annual Review 1998, Alberta Vital Statistics.1. Rates are per 10,000 live births.