Embed Size (px)
Citation preview

7: 7th Street & Packer Avenue 2016 & 2021 Build wit ImpsTraffic Conditions - PM Event Peak 2/2/2013
> > < < \ t /- V i V l l . 'J^ . jEBL^cT^Ji lEBF '-^EBR . W B L . WBTj^ 'WBR: . .MNBl:; J . ; 'NBT; " ' .NBR' . • i S B L - i r ^ j S B T & a S B ^
Lane Configurations Volume (yeh/h) Number
84 ffli.
228 183 508 800 77 43 48 _4f
25 48 706
12 1 16 18 626 14
Initial Q (Qb), veh 0 0 0 0 0 0 0 0 0 Ped-Bike Adj(A_pbT) Par1<ing Bus Adj Adj Sat Flow veK/h/In
roo 1,00 1.00 1.00 1.00 1.00 1.00
1.C 1.00 1.00 roo 1.00 1.00 1.00 l.QQ l.QO
1.00 1.00 1.00 roQ 190.0 178.5 1776 166.7 180,1 190.0 184.5 172.7 147.3 190.0 183.8 I S a t
Lanes Cap, veh/h AmveOn Green
1 377
o:69
3 1689 o:69
Q 789
0.69
1 497
0:69
3 2469 0:69
0 147
0.69
1 195
0.37
2 820
0.37
0 362
0.37
0 98
0.37
2 1188 0.37
1 592
aoo Sat Flow, veh/h 689 3249 1517 897 4748 282 759 2215 979 156 3210 1599 Grp Volumefv); veh/h Grp Sat Flow(s),veh/h/ln Q Servefg s), s Cycle Q CIear(g_c), s Prop In Lane Lane,Grp Capfc), veh/h V/C RatiofX) Avail Cap(c_a), veh/h HCM Platoon Ratio Upsfi-eam Filterfl) Unifonri'Delay (d), s/veh Incr Delay (d2),s7veh Inifial Q DelayfdS), s/veh %ile Back of Q (50%), veh/ln Lane Grp Delay (d), sA/eh Lane Grp LOS
'Approach Vol, veh/h Approach Delay, sA/eh Approach LOS
93 689 6.8
14,5 1,00 377
o:25 377 1.33
l.OQ 11.6 r.6 0.0 1.2
13.1 B
253 1624
2.7 2,7
1689 0.15 1689 1.33 1.00 7.8 0.2 ,0.0
ro 8.0
A 536 9,2
A
190 1517
4.6 4.6
1.00 789 0.24 789 1.33 1.00 8,1
a7 ao •1.7^ 8.8
A
564 897
47,4 52.0 1,00 497 1:14. 497 1,33. 1.00 21.2 83.1
o:o 23.8
104.2 F
613 1639
7.7 7.7
1705 0.36 1705 1.33 1.00 8.6 a6 0.0 2,7 9.2-
A 1506 44.9
D
329 1752
7.7 77
0.16 911
0.36 911 1.33 1,00 8.6 1,1 Q.O 3.0 9.7
A
48 759 5.7
26.4 1.00 195
0.25 195
1.00 1.00 37,4 3.0 0,0 1.3
40.4 D
38 1641
1.5 1.5
607 0.06 607 1,00 1.00 2a3 a2 0,0 0.6
2Q.5 C
126 28.1
C
40 1554
17 17
0.63 575
0.07 575 1.Q0
roo 20.4 a2
ao 0.7
20.6 C
443 1776 11.1 2a7 a i2 697
0.64 697 l.QQ 1.00 2a3 4.4 Q.O
10.0 30.7
C
394 1589 20.7 20.7
588 0.67 588 1.00 1,00 26.4 6.0
ao 9.0
32,3 C
837 31.4
C
Q 1599
0.0 O.Q
1.00 592
Q.OO 592 1.00 0.00 0.0 0.0
ao ao 0,0
1
1 TimerJUi_^ ' i -9^ : : . - •; ..! :
'Assigned Phs Phs Durafion (G+Y+Rc). s
._iJ-.:; - - ' . _ . .
2 57.0
^ ^ ,•£'. • ' ' - r
6 57.0
.iVi„.^'i... • : : • ; -_-_[ •
8 43.0
] : _ * -
4 43.0
- _ . : - : • !
1 Chanqe Period fY+Rc), s 5.0 '5.0 6.0 Max Green Setting (Gmax), s 52.0 52,0 37.0 Max Q Clear Time (q_c+l1), s Green Ext Time (p_c), s
16.5 54.0 28,4 7.6 0,0 1.9
ao 37.0 22.7
2.3
|ntersectioniSummary.'j,'_ ^ •v. i ^
HCM 2010 Cbi Delay HCM 2010 LOS
, i - ' 1
34.1 C
-'.!L-1^.-..T . .--. :..t.^]l
I W^m^jSi^:e^t^. "r.i % '•', .'- * "'-I -^i' 'V.r • <,- _ ' -v•.:iJ^J^.. 0_ • • r ^ ^ - : ^ : ^
HCM 201Q Signalized Intersection Summary Pennoni Associates, Inc
Synchro 8 Report P a g e l

8: Darien Street & Packer Avenue 2016 & 2021 Build wit ImpsTraffic Conditions - PM Event Peak 2/2/2013
> > < ^ ^ \ A ^ \ ^ f^ovement EBL EBT EBR WBL WBT WBR NBL NBT NBR SBL SBT SBR Lane Configurafi'ons Volume (veh/h) Number InitialQ (Qb), veh Ped-Bike Adj(A_pbT) ParicinqBusAdi
43 5 0
1.00
roo
fn 136
2 0
1.00
207 12 0
l.QQ 1.00
i •673
1 0
1.00 1.00
f f 541
6 0
1.00
f 70 16 0
1.00 0.90
210 3 0
1.00 1.00
f 57 8 0
1,00
f 214
18 0
1.00 1.00
241 7 0
l.OQ l.QQ
f 318
4 Q
1.00
f 183 14 Q
1.00
roo Adj Sat Flow veh/h/ln Lanes
18ai 186.7 18ai 188.1 182.7 186.3 181.0 18ai 172.7 182.7 188.1 18a2 1 Q 1 1 1 1 1 1 1 1
Cap, veh/h 487 1868 873 531 1493 613 268 640 499 424 640 544 Arrive On Green Q.09 0.73 0.73 0,57 0,57 Q.OO 0.34 0.34 0.34 0.34 a 3 4 O.QQ Sat Flow, veh/h 1792 3397 1587 1068 3471. 1425 1045 1881 1468 1108 1881 1600
Grp Volumefv), veh/h Grp Sat Flow(s),veh/h/ln QServe(g s ) ,s Cycle Q"CIear(g_c), s Prop In Lane Lane Grp Capfc), veh/h
48 1792
1.3 1.3
1.00 487
151 1699
1.3 1.3
1868
224 1587
.4.7 4.7
1.00 873
748 1068 43.0 43.0 1.00 531
601 1736
9,6
ae
1493
0 1425
0.0 0,0
1.00 613
233 1045 18.8 34.0. 1.00 268
63 1881
2.3 2.3
640
226 1468 12.0 12.0
r.oo 499
268 11Q8 21.8 24.1 1,00 424
353 1881 15.2 15.2
640
Q 1600
Q.Q Q.O
1.00 544
V/C RafiofX)
Avail Cap(c_a), veh/h a i O 0.08 a26 1.41 0.40 0.00 0.87 a i O 0.45 0,63 0.55 487 1868 873 531 1493 613
Q.OO 268 640 499 424 640 544
HCM Platoon Ratio 1.33 1.33 1.33 1.33 1.33 1.33 1.00 1.00 1,00 1.00 1,00 1.00 Upstream Fllter(l) 1.00 1.00 1.00 1.00 1.00 0.00 1.00 1.00 1.00 1.00 1.00 0.00 Uniform Delay fd), sVeh 12.5 6.2 Incr Delay (d2), s/veh 0.4 0.1
6 7 24.3 14.3 0.0 42.1 22,5 25:7 30,8 26:8 a ? 194.8 0.8 0.0 29.7 a3 2.9 7.0 3.4
0.0 0.0
lnitia[£Delay(d3),s/veh_ 0,0 0,0 ao 0.0 0,0 0.0 ao ao Q.Q Q.O 0.0 ao %ile Back of Q (50%). veh/ln 0.6 0.5 1.7 41.9 3.7 0.0 8,2 1.1 4.7 6.9 Lane Grp Delay fd). sAreh 12,9 Lane Grp LOS B
6.3 7.4 219.2 15,1
B D
7.7 Q.O - 7 r 9 22.8 28.7 37.8 3 a 2
0,0 0.0
Approach'Vol, veh/h 423 1349 522 Approach Delay, s/veh 7.6 128:2 47.3
621 33,5
Approach LOS A F' D C
fTimer |
'Assigned Phs Phs Duration (G+Y+Rc), s Change Period (Y+Rc), s Max Green Setting (Gmax), s Max Q Clear Time fq c+ l l ) , s Green Ext Time (p_c), s
5 12.0 5.5 6.5 3.3 0.0
2 61.0
ao 55.0 6.7 6,5
6 49.0
ao 43.0 45.0 0.0
8 39.0 5.0
34.0 36.0 0.0
4 39.0 5,0
34.0 25.1 2.3
" 1
1
1
Intersection Summary 1
HCM 2010 Ctri Delay HCM 2010 LOS
76:o E 1
Notes
HCM 2010 Signalized Intersection Summary Pennoni Associates, Inc
Synchro 8 Report Page 1

HQ^
™ n
PENN NATIONAL GAMING INC.
Hollywood Casino - Philadelphia Transportation Impact Study
November 14, 2012
APPENDIX i
QUEUE ANALYSIS WORKSHEETS
Pennoni

2012 EXISTING WEEKDAY PM PEAK HOUR

Queuing and Blocking Report 2012 Existing Traffic Conditions - PM Reak
Intersection: 6:10th Street & PackerAvenue "
Moveiiient- -i=Z- \'-.r^::'.^. . JEB .. 'EB .. ,EB._:^EB
Directions Served ,L T T TR
-,WB
L ;WB^ -
"T JWB.-
T _^WB; ..
TR J_J|NBW:-
L ^NB: '-
T ^.m^
L (Sq
T Maximum Queue (ft)' Average Queue (ft) 95th.Queue (ft) '_' Link Distance (ft)
87 47 '49 82 97 60 37 40 114 44 30 39 27 29 16 50 10
81 28 .34 62 .70 -40 22 28 33 254 254 254 604 604 604 768 768
Upstream BIk Time"(%) ' 1 Queuing Penalty (veh)
Storaqe.Bay Dist (if.) 150 250 150 250 1
Storage.Blk Time (%) Queuing Penalty (veh) 1
Intersection: 6:10th Street & PackerAvenue
Movement-'.;'• " i - j J ^ i - ^
Directions Served Maximum Queue (ft) Average Queue.(fl) 95fii Queue (ft) Link" Distance (ft)
- SB ••' - i i ' :•.. ' r '
TR 77 29 64
768
_ _ ! : : . _ , ^ - . ^ 1= .L- - I S'J 1
1
1 UpstreamBlkTime'(%) 1 Queuing Penalty,(veh) Storaqe Bay Dist (ft) 1 Storage Blk Time (%) Queuing Penalty (veh)_
2012 Existing Traffic Condifions - PM Peak
Pennoni Associates, Inc
SimTraffic Report Pagel

Queuing and Blocking Report 2012 Existing Traffic Conditions - PM Peak
Intersection: 7: 7th Street & PackerAvenue
Movement EB. EB EB EB Directions Served L T T TR-
WB, L
WB T
WB T
WB TR.
NB 1 .
NB T
NB TR
S^ LT
MaxirhumQueue(ft) Average .Queue'(fl) 95yi Queue (ft) Unk Distance (ft)
164 •81 145
112 46 87
560
,106' 45 92
560;
98' 40 88'
560
67 12, 40
66 •23 53
1936:
95 34 > 76
1936
104 24 69
,1935
60 15 42'
50 14 38
1460.
60 17 50
1460
77, 28 64
610 UpsfieaiTiBlkTime:(%). 1 Queuing Penalty (veh)' Storaqe Bay Dist (ft) 200 275 :225 Storage Blk Time (%) Queuing Penalty'fveh) i
Intersection: 7: 7th Street & Packer Avenue
Movement SB DirecfidnsSen/ed Maximum Qijeue. (ft) 23 Average Queue (ft) 1 95fli Queue (ft) i2_ Link Dislahce:(ft) 610. Upstream Blk Time (%) Queuing Penalty,'(veh)i Storaqe.Bay Di5t(ft) Storage Blk Time (%) Queuirigpenally'fv^nyy
intersection:.8: Darien Street &: Packer Avenue
Movement. EB EB Directions'Served L T Maximum Queue(ft) 78 66 Average Queue (ft). '34 17 95tfi Queue(ft) 65 47 Link Distance (ft) 604 Upstream Blk Time f%) Queuing Penalty (veh) Storaqe Bay.Dist (ft) 200 Storage Blk Time (%) Queuinq.Penalty'(veh)
EB •T
'51 9
36 604
EB TR. 42 12 •38
604
WB L
52 10' =34
225
WB. T
113 41 89
560
WB •T
155 72.
133 •'560
NB L
82 29 68
150
NB T
88 37 75
1137
0 0
NB-R
71 21 52
1137
SB LT
309 187 309, 293
3 0
27 10
•s^
R 160 22
11.1
1 110
1
2Q12 Existing Traffic Conditions - PM Peak SimTraffic Report Pennoni Associates/Inc Page 2

Queuing and Blocking Report 2012 Existing Traffic Conditions - PM Peak
Intersection: 15: Front Streets Packer Avenue/1-95
Movement
Directions Served Maximum Queue (ft) Average Queue (ft) 95th Queue (ft) Link Distance (ft)
EB L
250 135 220 771
EB L
202 90
163 771
EB TR 104 27 75
771
WB LTR'
55 5
26 128
NB L
58 8
30
NB T
112 33 83
453
NB TR 36 4
19 453
SB L
34 6
25
SB T
143 52
111 334
SB TR
247 1 61
183 1 334
Upstream Blk Time (%) 1 Queuing Penalty (veh) Storaqe Bay Dist (ft) Storage Blk Time (%) QueulnqPenalty fveh)
Intersection: 22:
100
Front Street & Walt Whitman Br
0 0
100 2 0
1
1
\(1ovement
Directions Served Maximum Queue (ft) Average Queue (ft) 95th Queue (ft) Link Distance (ft)
NB L
157 49
116
SB T
42 2
18 561
SB TR 101 12 53
561
1
1
1
Upstream Blk Time (%) 1 Queuing Penalty (veh)
Storaqe Bay Dist (ft) Storage Blk Time (%) Queuing Penalty (veh)
Intersection: 23:
180 0 0
Front street & Walt Whitman Bridge/1-95 SB
1
1
Movement
Directions Served Maximum Queue (ft) Average Queue (ft) 95th Queue (ft) Link Distance (ft) Upstream Blk" Time (%) Queuing Penalty (veh) Storaqe Bay Dist (ft) Storage Blk Time (%) Queuing Penalty (veh)
EB L
203 53
145 261
1 0
EB LT
299 185 297 261
5 0
9 2
EB R
134 5
58
200 0 0
WB T
17 1 9
175
NB T
272 138 221 561
NB TR 213 105 181
.561
SB L
137 34 89
240
SB T
268 134 246 555
1 0
•SB T
286 167 276 555
2012 Existing Traffic Condifions - PM Peak Pennoni Associates, Inc
SimTraffic Report Page 3

Queuing and Blocking Report 2012 Existing Traffic Conditions - PM Peak
Intersection: 27: Front Street & 1-95 Ramps
M6 rfientl Jtti4'f .'_ :",? '?nJEBP^EBg::aWBJLliijNB --TNB-f'i .'- NBi'. -:'- SB i MSB Directions Served L LTR LTR L T TR T TR Maximum Queue (ft) Average Queue (ft) 95Ui Queue (ft) Link Distance (ft) Upstream Blk Time (%) Queuing Penalty (veh) Storaqe Bay Dist (ft) Storage Blk Time (%) Queuinq Penalty (veh)
350 2Q6 313 420
0 0
306 158 281 420
28, 2
14 47 0 0
224. 122 206
250 0 1
112: 40 95
555
126 49 96
555
311 212 328 272
5 0
•329 1 248 364 272
17 1 0
1
1
Network Summary Networit wide Queuinq Penalty: 14 ]
2012 Existing Traffic Conditions - PM Peak SimTraffic Report Pennoni Associates, Inc Page 4
2016 NO BUILD WEEKDAY PM PEAK HOUR CONDITIONS

2016 No Build Traffic Conditions - PM Peak Queuing and Blocking Report
Intersection: 6:10th Street & Packer Avenue ^
Mdvementr^'V ' - . L i i := ' . .^EBri ;^. !EB:; : : EB 'EB; .
Directions Served L T T TR
•-•WB :
L ::WB,:
T "-WB
T--WB,-' _
TR NB-.
L riNB'.L-
T !SB.=
L ^s'sa
T Maximum.Queue(ft) .86- 118 60 '58 14 64- 82 66 37 48 406 33 Average Queue.(ft)" ^ 29 38 8 15 1 29 28 18 5 8 53 7 95tti Queue (ft)' " 70 62 .37 . 44. 6' 59- 65 44. 22_ 31 93 -27. Link Distance"(ft) 254 • 254 254 604 604 604 768 768 Upstream Blk T'ime.f%) ' " Queuing Penalty (veh) Storaqe Bay Dist'(ft) Storage Blk Time (%) Queuinq Penalty.(veh)
150 250 0 0
150:
1
250 1
1
Intersection: 6: 10th Street & Packer Avenue
Mdvemerit'-r-^i. = v , ""=" -^ - '
Directions Served Maximum Queue (ft) Average Queue (ft) 95tfi Queue (ft) Link.Distance (ft)
_,SB"_?i. 1 =:•••• '• i ' • J. - y • L
TR 73' 32 64
768
- : - 1
1
1 Upstream Blk Time(%) 1 QueuingPenalty.(veh) Storaqe Bay Disl (ft) i Storage Blk Time (%) Queuinq .Penaltv'(veh'i 1
2016 No Build Traffic Conditions - PM Peak SimTraffic Report Pennoni Associates, Inc Page 1
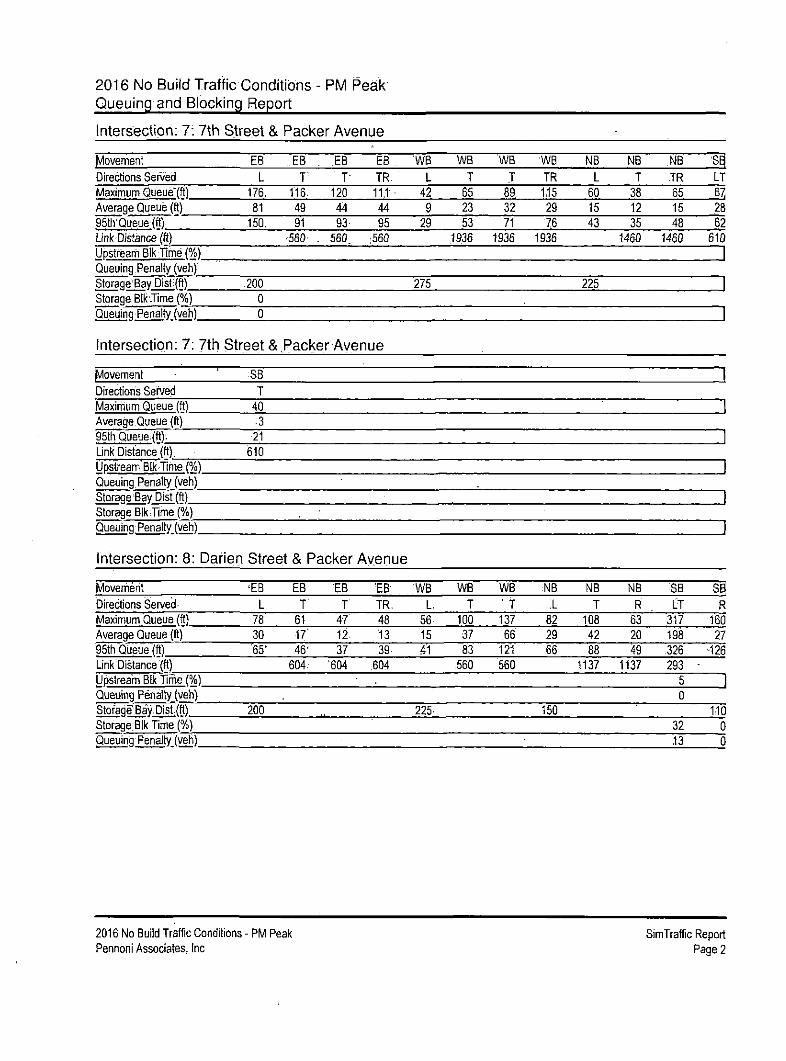
2016 No Build Trafific Conditions ~ PM Peak Queuing and Blocking Report
Intersection: 7: 7th Street & Packe r Avenue .'
Movement
Directions Served. Maximum Queue"(ft) Average Queue (ft) 95fii'Queue(ft). Link-Distance (ft)
EB L
176, 81
150,
EB T'
116 49 91
•560' .
EB T
120 44 93'
560
EB TR. i r i • 44 95
;560
WB L
42 9
29
WB T
65 23 53
1936
WB T
89 32 71
1936
WB TR 115 29
76 1936
NB L
60 15 43
NB T
38 12 35
1460
NB TR 65 15 48
1460
S^ LT 6^ 28 62
610 Upstrearn Blk Time (%)
Queuing Penalty (veh) Storage Bay Disti(ft) JOO 275 225 Storage Blk-Time (%) 0 . Queuing Penalty (veh) 0
Intersection: 7: 7th Street & Packer Avenue
Movement SB_
Directions Served Maxirtium Queue (ft) 40_ Average Queue (ft) -3 95lh Queue (ft). 2 1 Link Distance (ft). 610 Upstream Blk^Time (%) Queuing.Penalty (veh)_
Storaqe Bay DisF(ft) Storage Blk-Time (%) Queuing Penalty (veh)
Intersection: 8: Darien Street & Packer Avenue
Movement
DirecfionsSen/ed' Maximum Queue;(ft) Average Queue (ft) 95ih:Queue(ft) Link Distance (ft) Upstream Blk time (%) Queuing Penalty (veh) StbraqeBay.Dist.(ft) Storage.Blk Time (%) Queuinq Penalty (veh)
'EB EB
L T' 78 61 30 17 •65' 46'
604.
200
'EB T
47' 12 37
•604
'EB TR. 48 13 39
,604
WB L,
56. 15 41
225.
WB T
100 37 83
.560
WB • T
137 :66 121 560
NB ,L
82 29 66
150
NB T
108 42 88
1137
NB R
63 20 49
1137
SB LT
317 198 326 293
5 0
32 13
3^ R
160 27
126
1 no
0 0
2Q16 No Build Traffic Conditions - PM Peak SimTraffic Report Pennoni Associates, Inc Page 2

2016 No Build Traffic Conditions - PM P .ak Queuing and Blocking Report
Intersection: 15: Front.Street &, Packer,Avenue/1-95
M o l T e m e h t U K l t l U A H B i l J E t i ! :
Directions Served
Maximum Queue (ft)
Average Queue (ft)
95th Queue (ft)
Link Distance (ft)
Upstream Blk Time (%)
Queuing'Penalty, (veh)
Storaqe Bay Dist (fi)
Storage Blk Time (%)
Queuing Penally (veh)
Intersection; 22:
L 281 144 252 771
.MEB^' L
232 102 ,
193 771'
"'AEB'SJ^WB]*-.. . m \ :
TR
'l.1fl 34 '90
77.1,
LTR L
41 44.
5 8
23 '32
128-
100'
FrontStreet & Walt Whitman Br
]NB' '_' T
142 34, 86
.453
2 Q
JNB: ••
TR 72' 4
•24 .453
' .SB', V
L. 51 9
•34.
100
'. -:sB-.. T
158 49
110 334
1 0
! ' l ? S B i ^ - ^ _ " ^ : ' j j : ; ] ; ^ - l
TR 265 68
197 334
0 0
^ovemen^mVMSk^ym,? Directions Served
Maximum .Queue (ft)
Average Queue (ft)
95th Queue (ft)
Link Distance.(ft)
L 166 59
125
^ N B - ' ;
T 43 2
32 334
^"iSBL
T ;29.
2 •19
561
J M S B M - . .' . - : -
JR ria '18 73
561
. 1 _ _Ti.'._^_=_= "TU.. . - - . - . - I -/ -•'. .1
1 1
UpstreamBlkTimef%) 1
Queuing Pen ally,, (veh)
Storaqe Bay Dist (ft)
Storage Blk Time (%)
Queuinq Penalty (veh)
Intersection: 23:
180 0 1
0 0
Front Street & Walt Whitman,Bridge/1-95 SB
1 1
Movementi_ii^'^_:;; t ^ ' £ . \ _ . ^ l E B ^
Directions Served
Maximum'Queue (ft)
Average Queue (ft)
95fii Queue(ft)
Link Distance (ft)
Upstream^Blk Time (%)
Queuing.Penalty,(veh)
Storaqe Bay Dist (ft)
Storage Blk Time (%).
Queuinq Penalty'(veh)
L 172 52
138 261
0 Q
z i - .EB^ .
XT 307 189 312 261 ,
7 0
13 3
..'. lEB..
R 225
14 105
200 0 0
^JAWBl.j.-NB:^' T 'T
24 243 V 152
1:1 227 175 561'
MB: . TR, 203 '115 197 561
J..SB
L 142 39 97
240
SB T
291 152 261 555
0 0
. "SB^
T 304 192 292 555
_ • _ . 1 :
,
2016 No Build Traffic Conditions - PM Peak
Pennoni Associates, Inc
SimTraffic Report
Page 3

2016 No Build Traffic Conditions - PM Peak Queuing and Blocking Report
Intersection: 27: Front Street & 1-95 Ramps
MdverrientOrf^i-y..^ J .
Directions Se"rved MaximufTi Queue (ft)' Average Queue (ft) 95tii Queue (ft) Link Distance.(ft) Upstream'Blk time (%) Queuing Penalty (veh)'
Storaqe Bay Dist (ft) Storage Blk-Time(%), Queuing Penalty-(veh)
r i f ^EB !^ : L
370 207 313 420
Q 0
^EBLTR 304 154 '271 420
0 0
iT iWB^.
LTR 18 1 9
47 0 0
rf[!NBj;: L
254 136 218
250 0 0
.::NB2s T
108 35 •83
555
_ N B ^ TR 122 .61
102 555
AJSB,._ T
317 231 341 272 •12
0
i 'iSB: L . .. ^ : TR
329, 261 377 272 :32
0.
n - ' . - _ ' z! ..
1
Network Summary Networt; vtflde Queuing Penalty:^!8
2016 No Build Traffic Conditions - PM Peak SimTraffic Report Pennoni Associates, Inc Page 4


2016 Build Traffic Conditions - PM Peak Queuing and Blocking Report
Intersection: 1: Darien Street & Port Cochere Exit
Movement WB
Directions Served LR Maximum Queue (ft). 55 Average Queue (ft) 27 95fii:Queue(ft) 52^ Link Distance (ft) 68 Upstream Blk.Time(%) 0 Queuing Penalty (veh) _0 )_
Storaqe!BavDisF(ft) • ^ (_ Storage Blk Time (%) Queuing Penalty (veh)
Intersection: 3: 7th Street & Port Cochere Enter
Movement
Directions Served Maximum Queue (ft) Average Queue (ft) 95th Queue (ft)
!NB ' - . . — -.
LT 40'
3 19,
: • 1
1
t Link Distance (ft) Upstream.Blk,T'ime(%) 1 Queuing Penalty (veh) Storaqe^Bay Dist (ft) , 150 _J Storage Blk Time (%) Queuing Penalty (veh) J
Intersection: 5: 7th Street & Garage Enter
Movement 'NB . . (SB
Directions Served L TR Maximum Queue (ft) Average Queue (ft) 95th .Queue (ft) Unk Distance (ft)
.39 10 34
13 . . 1 0 5 1
435 Upstream'Blk Time (%) 1 Queuing Penalty (veh) Storaqe:Bay Dist (ft) 100 1 Storage Blk Time (%) Queuinq Penalty (veh)' I
2016 Build Traffic Conditions - PM Peak SimTraffic Report Pennoni Associates, Inc Page 1

2016 Build Traffic Conditions - PM Peak, Queuing and Blocking Report
Intersection: 7; 7th Street & PackerAvenue
MoverTfentiLk.'r,::'.: i . ' ^ > ' ^ ' JEBV;• '.t.JEB?' •• "jEBf- ' - * ' ' EB : _ '[nWE . :WB . • \ W B ^ . ; iWB". , .iirNB)iln"JNB- 'NB' M Direcfions Sen/ed' Maximum Queue (ft) Average Queue (ft) 95th.Queue.(ftl Link^Distance(ft) Upstream;BlkTime(%)
1 166 80
139
'T 109
51 . 94
560
T 134 60
ri5 560
TR 159 74
135 56Q
L 164 72
1 1
T 70 25 57
1938
T .94 35 75
1938
TR 117 30 :80
1938
L 70 15 45
237
T 61 13
•40 237
TR 71. 18 53
237
LT 85 23 62
610
• 1 Queuing Penalty (veh) Storaqe Bay Dist (ft) Storage.Blk Tirrie{%) Queuing Perialty (veh)
200 0 0
275 1 1
Intersection: 7; 7th Street & Packer Avenue
yovement5fcfl!i^+iE!>M"SBi^ J i."" v..?'-=' -='J!<rt. ..--. i:^v->, ,'__.-Di^ections'Served Maximum;Queue.(ft), Average Queue (ft) 95th.Queue(ft) Link Distance (ft)
58 21 51
610
1
1 Upstream Blk Time (%) 1 Queuing Penalty, (veh) StdraqeBavDist(ft) 1 Storage'BikTirTie.(%) Queuinq Penalty (veh) ' . ' 1
Intersection: 8: Darien Streets Packer Avenue
M6vemrnl^J^-:JLt1L%^;^:- ; !EB^:.-£B.^LlEBs!: jXEB". j ;^ '-WB . ' WB ,WB. NB: NB-: ' .1NB:T S B \ i.^Sg
Directions Serjed Maximum'Queue (ft) Average, Queue; (ft) 95fii Queue (ft) Link Distance (ft) Upstream'Blk Time (%) Queuing Penalty (veh)
StoraqeBayDlsKft) Storage Blk Time (%) Queuinq Penaltyiveh) .
L 95 .37 77
200
T 75 19 54
604,
T ,42 13
:39 604
TR 44 '16 43
604
L •65 17 46
225
T :ri'4 43 90
560
T 137 69
121 560
L 151 90
144
0 0
150 1 1
T 183' 69
141 161
0' 1
0 1
R-. 112 51 :88 161
LT 340 310 342 293 79 0
81 33
R 235 117 310
1
no
1
2016 Build Traffic Condifions - PM Peak Pennoni Associates, Inc
SimTraffic Report Page 3

2016 Build Traffic Conditions - PM Peak Queuing and.Blocking Report
Intersection: 14: Darien Street & Garage Exit
Movement^V'-VS W l - t i l
Directions.Served Maximum Qijeue (ft) Average Queue (ft) 95tii Queue (ft) Link Distance (ft) Upstream Blk Time;(%) Queuing Penalty,(veh)
'"iWRT"-»i;=i'i
LR 135 '69 109 .110
1 Q
. . f " . - 'i'—.Ztj^ ,.. - ,; r^ ' - 'Jk i ' • • - . - • = _•' • . u i i - _ " : ' ' : \ - o . : - ' . 1 • ,' Z 1
J
1 1
Storaqe Bay.Dist (ft) 1 storage Blk;Tlme'(%) Queuinq Penalty (veh) !
Intersection: 15: Front Street:&Packer Avenue/1-95
Move[Tierit'*iil, :z.EB £iaEB»ggEBkSittWB: „jNBsis:jNB' HNB^ ^aT ls fT iHsF m Directions Served T R ; LTR T TR TR-Maximum Queue (ft) Average'Queue (ft) 95Ui Queuei(ft) Link Distance (ft)
316, 173 279 771
258. 130. 223 771
124 •29, :79
771
38-7
.27 128,
45' 10 33.
123 35-89.
453'
69 8
37 453
39: 5
24
128 50
102 334
220 58
•169 334
1
1 Up'stream Blk Time f%) i Queuing Penalty (veh) Storaqe Bay Dist (ft) StQrage'B[kTime(%) Queuing.Penalty (veh)
100 1 0
100 1 0
1
1 Intersection: 18: Darien Street & Employee Drivewa
L^B:.-..:iSBu}fT:L^.^i'.;; Movement'.^_s_i. i*''
Directions Served LR L Maximum Queue (ft) Average Queue (ft) 95fiTQueue(ft) Link Distance (ft)
J l 31 32 59 29
131 Upstream Blk Time (%) Queuing Penalty (veh) Storage.Bay Dist (ft) Storage Blk .Time (%) .Queuing Penalty (veh)
100
2016 Build Traffic Conditions - PM Peak Pennoni Associates, Inc
SimTraffic Report Page 4

2016Bui!d Traffic Conditions - PM Peak Queuing and Blocking Report
Intersection: 22: Fi-ont Street & Walt Whitman Br
Moveniehli-lj: ^ " • - - i *
Directions Served
Maximum Queue (ft)
Average .Queue (ft)
95th Queue:(ft)
Link'Distance'(ft)
',-,7J' '.SNBL;;,
L
'170
72
137 '
'('SBl^l
T
24.
1
12
561
. SB; I
TR
178
30
104'
561
• j _ . . . _•. • — * , . . . -T^c-:.- .1' - - - r : . J r - . l j -., ^^ .S^/ l
1
1
Upstream Blk time (%), 1
Queuing Penalty (veh)
Storage Bay Dist (ft)
Storage Blk Time (%)
QueulnqPenalty (veh)
180
0
r
1
1
Intersection: 23: Front Street.& Walt Whitman Bridge/i-95 SB
\^ovement t*i.'./".r.wT?
Directions Sen/ed
Maximum Queue'(ft)
Average .Queue (ft)
95tti Queue (ft)
Link,Distance (ft)
UiDstream Blk Time (%)
Queuing.Penalty (veh)
Storaqe Bay Dist (ft)
Storage BIk-Time (%)
Queuinq^Penalty (veh)
Intersection: 27:
'^.^. ^._3EB;L_
L
162
43
107
261
0-
0'
••'JEB^^EBl l ^WBr
LT
297
194:
299
261
•4
0
10*
2
.R' 224.
18'
117'
200
0.
'0
T
12.
1
10
175:
Front Street & 1-95 Ramps
.•NB:.
T
;357
188
;290-
561
3.^NBl.^
TR
306
158
"259
561
-,::^SB'.^.
1
63
16 .
51
240
• SB _
" T
149
52
127
'556
• ISB ' J . v V v
T
'474
123
335
556
0
0
r -JH^-J-irA
1
1
1 !
1
Moveriiehl'"jir^-o"' " '
Direcfions Served
Maximum Queue.(ft)
Average Queue (ff)
95th.Queue(ft),
Link Distance (ft)
Upsfi'eam Blk Time.(%)
Queuing Penalty (veh)
SloraQeiBayDist'(ft)
Storage Blk •Time.(%)
Queuing.Penalty (veh)
) • .,;iEB;r
L
,407
242
377
473
0
Q
- JEBs-
LTR
,407
206-
365
473i
1
0
J.\WB^'
LTR,
29
,2
13:
47-
0:.
0
^,'iNBr
L
•279
135
^229
:250
.0
0
. NB!
T'
122
20
91
•556
t_ :iNBi_„
TR
60
15
47
556
_^:SBL.,
T
321
•230
348
272
14
Q
.•:SB "
TR
330
268
376
272
30
0
'-. ' - ' . . ' ' . ":- ^ : : } : ^ \
1
1
1
1
1
Network Summary Network wide Queuing Peha[ty;_:4Q_
2016 Build Traffic Condifions - PM Peak
Pennoni Associates, Inc
SimTraffic Report
Page 5

2016 BUILD WITH IMPROVEMENTS WEEKDAY

2016 Build with Improvements Traffic Conditions - PM Peak Queuing and Blocking Report
Intersection: 1: Darien Street & Port Cochere Exit
Movement WB
Directions Served LR Maximum .Queue (ft)
Average Queue (ft) 95th Queue (ft) Link Distance (ft) Upstream'Blk time (%) Queuing Penalty (veh) Storage Bay Dist (ft)
67 1 28 55 1 68 0 1 0
1 Storage Blk Time (%) Queuinq Penalty (veh) 1
Intersection: 3: 7th Street & Port Cochere Enter
Movement
Directions Served Maximum Queue (ft)
Average Queue (ft) 95tii Queue (ft)
NB 1
LT 28 1 2
15 1 Unk Distance (ft) Upstream,Blktime(%) I
Queuing Penalty (veh) Storage'BavDist(ft) 150 1 Storage Blk Time (%) Queuing'Penaltv(veh) |
Intersection: 5: 7th Street & Garage Enter
Movement
Direction's Served Maximuni Queue (ft)
Average Queue (ft) 95fii Queue (ft) Link Distance (ft)
NB SB
L TR 44 17 1 11 1 37 9 1
435 Upstream Blk Time (%) i Queuing Penalty (veh) Storage Bay Dist (ft) 100 j Storage Blk Time (%) Queuing 1 Penalty (veh) |
2016 Build with Improvements Traffic Condifions - PM Peak SimTraffic Report Pennoni Associates, Inc Page 1

2016 Build with Improvements Traffic Conditions - PM Peak Queuing and Blocking Report
Intersection: 6:10th Street & PackerAvenue
Mdvemerilhgi£..';.-^ "•^i.v.,'lEBLT-.'..!EBgT.;7.EBi,-,-'JEB ^•-,WB,:L^WBl.VMWBf gfiWB::_.._ ,NB'.. .. NB • -liSB;;.' 'iSB
Directions Served TR TR Maximum Queue (ft) Average Queue (ft) 95«i Queue (ft) Unk Distance (ft)
78 30 68
98 43 85
254
48 7
32 254
55 13 43
254
9 1 7
119 60
106 604
114 59
102 604
60 17 42
604
37 5
23
36 8
29 768
145 51
109
44 7
29 768
Upstream Blk Time (%) 1 Queuing Penalty (veh) Storaqe Bay Dist (ft) Storage Blk Time.(%) Queuing Penalty (veh)
150 0 0
250 150 250 1 1
Intersection: 6; 10th Street & PackerAvenue
Uo^^f^mi^^ i^v^ , r : " -!!SB^^^^^>^^i!Jkm!:, 1^ >- -2 - ':-:LjG?fe^;r. " ^ C F Directions Served TR Maximum Queue (ft) Average .Queue (ft) 95tii Queue(ft) Unk Distance (ft)
82 1 29 67 1
768 Upstream Blk time.(%) 1 Queuing Penalty (veh) Storaqe Bay DisUft) Storage Blk Time (%) Queuinq Penalty (veh)
2016 Build wflth Improvements Traffic Conditions - PM Peak Pennoni Associates, Inc
SimTraffic Report Page 2

2016 Build with Improvements Traffic Conditions - PM Peak, Queuing and Blocking Report-
Intersection; 7: 7th Street & Packer Avenue
Mdvernerit: ; ^ ..• • ^ 'J:J-. : 'c""^EB, . . EB L .EBFl?^EB^ •
Direcfions Seived L T T TR:
!,""'-WBJ.-
L ..tWB:
•T' ••-WB..
T JWB,
"TR •NB :
L NB .
T •^NB:'
TR -^s^
LT Maximum Queue.(ft)
Average Queue (ft)
95aiQueue(ft)
Unk Distance (ft)
132 74
120
103 48 92
560
124-
53 101 560
146 64
114 560
145-
55 112
72 21 53
1938.
85 27 67
1938'
97 23 68
1938
46 13 38
237
52 15 43
'237
61 12 43.
237
81 24 62
610 Upstream Sik T)m8'(%) 1
Queuing.Penaltyi(veh).
Storaqe Bay Dist (ft) 200 275 storage Blk Time (%)
Queuinq Penalty (veh). 1
Intersection: 7: 7th Street & Packer Avenue
M6vemenl4"*K^>"J>.-^ju-:: L I E B T . i " , ^ l i i ' l?= / ' t ] ' L I : , ; T 1 -
Directions Served
Maximum Queue (ft).
Average Queue (ft) 64 19
95thQueue(ft)
Unk Distance (ft)
Upstream Blk jTmef%)
Queuing Penalty (veh)
StoraqeiBay Disffft)
Storage Blk Time (%)
Queuirig'Pehaity(veh)
52 510
Intersection: 8: Darien Street & Packer Avenue
Wovementlj_i_;^i:!^E...
Direcfions Served
Maximum Queue (ft)
Average Queue (ft)
95Ui Queue'(ft)
Unk Distance (ft)
Upstream Blk Time (%)
Queuing Penalty (veh)
Storage Bay Dist fft)
Storage.Blk Time (%)
..7:.^:- -EB L
126 53
104
200 0
.jJEBi'_ T
,66' 23 55
604
.-J.lEB'^j^aJEBS^iiiWBi"; T- TR; L
50 63, 66
12 17' 22,
39' 46 56
604 604
225'
j - i .WB; •'•
T-139 70-
125 560
..'WB .
•T
'169
95. 150 560
:NB
L 156 77
139
•0 0
150 0
•iNB '
T 141 45 96
161 .0 0
0
• NB
R 101 46 79
161
;SB- •
LT ,312
204 319 293
4 0
33
, .' SE
R 235 22
133
1
110
Queuinq Penalty (veh) 13
2016 Build with Improvements Traffic Conditions - PM Peak
Pennoni Associates, Inc SimTraffic Report
Page 3

2016 Build with Improvements Traffic Conditions - PM Peak Queuing and Blocking Report
Intersection: 14: Darien Street & Garage Exit
Movement';i;jl,"t: ''v.
Directions Served Maximum Queue (ft) Average Queue (ft) 95fii Queue (ft) Link Distance (ft)
Upstream BlkTime (%) Queuing Penalty (veh)
• 'y ' - ' i : : - :m-^M-:. . '.. • ' ' ' j , ' : y \ - - t . ; • ' ! . : . LR
118 70 J
109 110
1 0
.- _, l l ^ - - - • ' ' _ •
1
1 1
Storaqe Bay Dist (ft) 1 Storage Blk Time (%) Queuinq.Penalty (veh) 1
Intersection: 15: Front Street & Packer Avenue/1-95
M6vernent^*LI'^j ^.:,"
Directions Served Maximum Queue fft) Average Queue (ft) 95th Queue (ff) Unk Distance (ft) Upstream Blk Time (%) Queuing Penalty (veh) Storaqe'Bay Dist fft) Storage Blk Time (%) Queuinq Penalty (veh)
Intersection: 18:
x-_L._.-!EBiiiTJBEB.'4ifi!?TiEBi^aWB.fid«NBa
L L TR LTR L 356 286 99 45 47 170 125 29 7 11 289 227 77 ,27 37 771 771 771 128
too
Darien Street & Employee Drivewa
^m. T
111 35 87
453
1 0
JNBL
TR 42 5
23 453
\_ ?SB; ;
L 54 5,
28
100
•iSB'
T 140 47
103 334
1 0
: ,SB
TR 238 58
169 334
0 0
,--'n
Movement L ^ - : < J L ' ^ " '
Directions Served Maximum Queue (ft) Average Queue (ft) 95fii Queue (ft) Unk Distance (ft)
••- "-..>.wB.:.,,,,'?NBtj:::ii.iSBiBe'V4^i:^5rj:jSL£ i , LR TR L 53 4 35 27 0 5 50 3 24
131 215
J - T L . _ 1 1 1
1 Upsfi-eam Blk Time (%) I Queuing,Penalty (veh) Storaqe Bay Dist (ft) 100 . • _ 1 Storage Blk Time (%) Queuinq Penalty (veh) I
2016 Build witti Improvements Traffic Conditions - PM Peak Pennoni Associates, Inc
SimTraffic Report Page 4
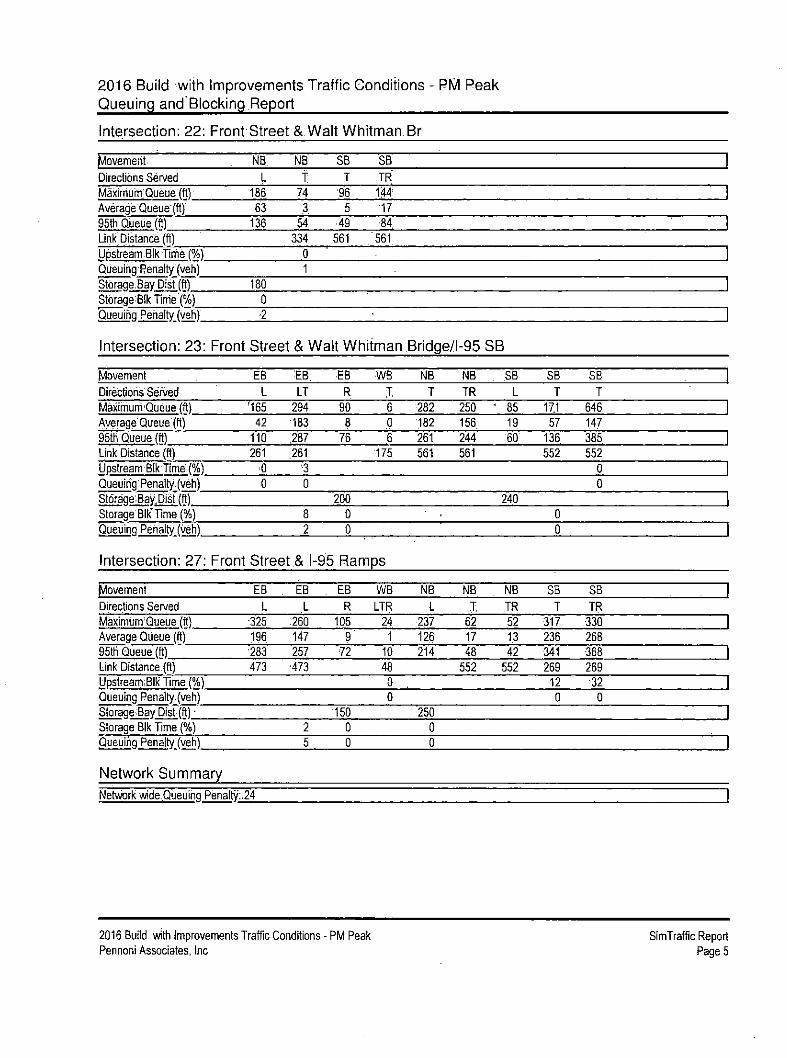
2016 Build with Improvements Traffic Conditions - PM Peak Queuing and Blocking Report
Intersection: 22: Front Street & Walt Whitman Br
Movement
Direcfions Ser /ed Maximum'Queue (ft) Average Queue(ft)' 95fii Queue fft) Unk Distance (ft) Upstream Blk Time (%) Queuing Penalty (veh) Storage.Bay Dist (ft) Storage:B!kTime(%) Queuing Penalty (veh)
Intersection: 23:
NB L
186 63
136
180 0 2
NB
T 74 3
54 334
0 1
SB T
'96 5
49 561
SB TR l ft4 17 •84
561
Front Street & Walt Whitman Bridge/1-95 SB
Movement
Directions Served Maximum'Queue (ft) Average'Queue (ft) 95th Queue (ft)
Unk Distance (fi) Upstream Blk Time (%) Queuing Penally, (veh) Sto'raqe;Bay,Dist(ft) Storage Blk'Time (%) Queuinq Penalty (veh)
Intersection: 27:
EB L
'165 42
110 261
•0 0
'EQ LT
294 183 287 ,261
'3 0
8 2
EB R
90 8
75
200 0 0
-WB X 6 0 6
175
Front Street & 1-95 Ramps
NB T
282 182 261 561
.
NB TR 250 156 244 561
SB L
' 85 19 60
240
SB T
171 57
136 552
0 Q
SB T
646 147 385 552
0 0
Movement
Directions Served Maximum^Queue (ft) Average Queue (ft) 95th Queue fft) Unk Distance (ft) Upstream:Blk Time f%) Queuing Penalty (veh) Storaqe.Bay Dist (ft)-storage Blk Time (%) QueulnqPenalty (veh)
EB L
•325 196 283 473
EB L
,260 147 257 '473
2 5
EB R
105 9
72
150 0 0
WB LTR
24 1
10 48 0 0
NB L
237 126 214
250 0 0
NB T,
62 17 48
552
NB TR 52 13 42
552
SB T
317 236 341 269 12 0
SB TR 330 268 -368 269 •32
0
Network Summary Network wide.Qijeuinq Penalty:.24
2016 Build witii Improvements Traffic Conditions - PM Peak Pennoni Associates, Inc
SimTraffic Report Page 5

2021 NO BUILD WEEKDAY PM PEAK HOUR

2021 No Build Traflic Conditions - PM Peak Queuing and Blocking Report
[ntersection; 6: 10th Street & Packer Avenue
Movement i -X '•
Directions Served Maximum Queue fft) Average .Queue (ft)
95th"Queue (ft) Unk Distance (ft)
: .JEB'-
L 94 30 '74
,.;EB-^ EB J ^ E B : _
T' T TR
93 65 41 39 ,6 12 80, 30 36
.254 254 ~254
:i.iWB...M-
L 10 1 5
J W B - .
T •76 29 62
604
: ,WB. .:
T .94 32 75 604
= li.WS. ..
TR 49 20 42
•604
^'M8:z I
.26 5
21
I . J N B ^ , .
T 50 13 38
768
.. SB
L 121 57
100
_ , S B
T ;39 . 7 •27,
768 y pstream Blk J ime (%) Queuing Penally (veh) StQraqe;Bay Disr(ft) Storage Blk Time. (%) .Queuing Penalty ( '^h)
150 250 150 250
Intersection: 6:10th Street & PackerAvenue
:^.ij!^a*riiA^ Moverrient / ._ .'y--\ -jSBiir,;.iJ, ^-:ji..-
Directiohs Served' TR Maximum Qijeue (ft) Average'Queue (ft)
9,1 37
95th .Queue (ft) UnkiDlstance (ft)
77 768
Upstream Blk Time f%) Queuing,Penalty (veh)
Storage Bay Dist (ft) Storage'Blk Time (%) .Queuing Penalty (veh)
2021 No Build Traffic Conditions - PM Peak Pennoni Associates, Inc
SimTraffic Report Page 1
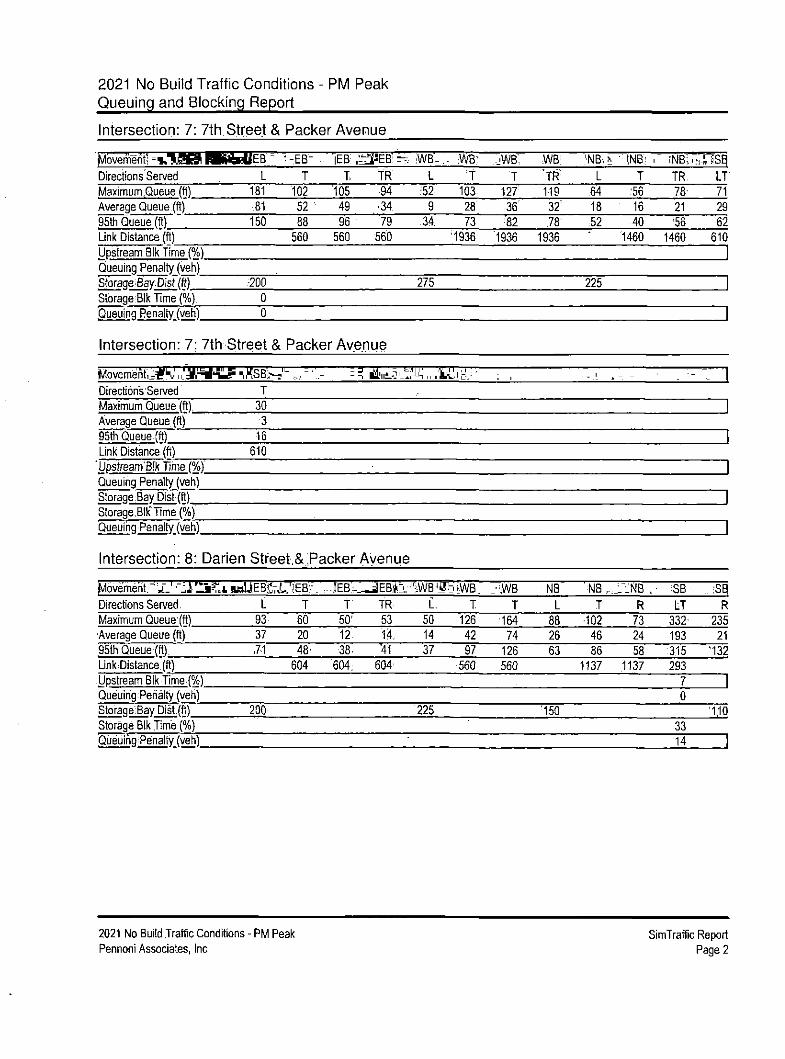
2021 No Build Traffic Conditions - PM Peak Queuing and Blocking Report
Intersection: 7: 7th Street & Packer Avenue
Movemehti < ^ J S ^ miMeUEB -Directions Served Maximum .Queue (ft) Average Queue (ft) 95tii Queue (ft)
L 181 81
150
- -EB-T
102 52 88
lEB T.
105 49 96
; ^ E B ! ^ TR 94 .34 79
. i.WB . L
;52 9
34,
WB: T
103 28 73
JWB;
T 127 36 •82
WB' 'TR' 119 32' ,78
'NB.. y
L 64 18 ,52
^tNB: 1
T :56 16 40
rNB;i
TR, 78' 21 •55
:'n f'S^
LT 71 29 62
Unk Distance (ft) 560 560 560 '1936 '1936 1936 ' 1460 1460 610
Upstream Blk Time (%) . _ _ _ . . Queuing Penalty (veh)
Storaqe eay,D(st (ft)
SlorageBlk Time (%) Queuinq Penalty (veh)
-200 275 0 0
225 1
1
Intersection: 7: 7th Street & Packer Avenue
Movem^nt , .#k ' i , ' ^^41^ Directions Sen/ed Maximum Queue (ft) Average Queue (ft) 95tii Queue (ft) Unk Distance (ft)
^KSB>,"-....-••- =^^i ,^^ 'J: .^- ; i i . i^s^.- : , T
30 '3 16
610
. _ 1 _ _ : -
1
1
Upstream'Blk Time (%) I Queuing Penalty (veh) Storage.Bay Dist (ft) J Storage.Blk* Time (%) Queuing Penalty (veh) |
Intersection: 8: Darien Streets Packer Ayenue
Movement, WL_ ' ' j i ' j = ' i t 4
Directions Served,
Maximum Queue'fft) Average Queue (ft) 95tii Queue (ft)
Unk:Distance(ft).
Upstream BlkTime (%) Queuing:Perialty (veh)
Storaqe:Bay Disl,(ft)
Storage Blk Time (%) Qijeuinq Penalty fveh)
!lBUEBi!^,U'JEB'.-.
L T
93 60: 37 20
7-1 48'
604
200
:.|EB,:;-_JEB*^i.;
T 50' 12 38.
604,
TR 53 14, 41
604'
iWB'a>iiWB.
L, 50 14 37
225
T 126 42 97
560
-;WB
T •164
74 126
,560
NB L
88 26 63
•150
NB „
T •102
46 86
1137
^"if^B .
R 73 24 58
1137
SB LT
332-
193 315 293
7 Q
33 14
:Sd R
235 21
"132
1 '1,1Q
1
2021 No Build ,Traff!C Conditions - PM Peak SimTraffic Report
Pennoni Associates, Inc Page 2

2021 No Build Traffic Conditions - PM Peak Queuing and Blocking Report
Intersection: 15: Front Streets. Packer Avenue/1-95
Movemetit3fiK&WjJ«' Directions'Served Maximum Queue,fft) Average Queue (ft) 95th Queue (ft) Unk Distance (ft)
, i - - ! L i i : E B : i * : ; E B A : :
L L 248 209 139 102 222 182 .771 771
r'EB i TR 119 29 75
771
? i W B : : ; ,LTR
•32 3
18 128
.iNB-_,.:'NB
L T •56 129 10 40
;35 .99 453
.' INB'
TR 110 12 55
453
. ' SB;.
L 47 9
32
. SB.._
T 130 50
107 334
..•SBj _. • __-•- 1
TR 253 1 78
217 1 334
Upstream Blk Tirrie (%) 1 Queuirig.Penalty (veh) Storage Bay Dist (ft) Storage Blk Time-(%) Queuinq Penalty (veh)
Intersection:.22:
100 2 0
Front Street & Walt Whitman Br
100 2 0
-1
Moveiiieht.^i.p^».1l^"««i&=4l.:]NB5^-lSB'sji;SSBl3M[' ^
Direcfiori's Served, Maxirhum Queue, (ft) Average Queue (ft) 95tti,Queue (ft) Unk Distance (ft)
L T-161 12 66. ,0
129 0 561
TR 105 ,13 58
561
r2 ' j~: . z —>• " - . J_ . j _ - t . i - y ^ . . .. • 1
1
i
Upstream BlkTime f%) 1 Queuing.Penalty (veh) Storaqe Bay-Dist fft) Storage Blk Time'(%) Queuing;Penally (veh)
Intersection; 23:
180, 0
-0
Front Street & Walt Whitman Bridge/I:95 SB:
1
1
Moverhenta.iS jj> -.. '7rtlfiEBfT-:iEBe: Direcfions Senyed Maximum Queue fft) Average,Queue (ft) 95th-Queue (ft) Unk Distance (ft) Upsfi-eam Blk Time [%) Queuing Penalty (veh) Storaqe Bay Dist (ft) Storage Blk'Time(%) Oueuinp'Penaltyfveh)
L LT 158 297 47 .202:
102 318. 261 261
•6
0
12 3
i l lEBcil
R, '225i
20 126
200, 0 •0
NNBl:: i t t . iNB". ' -^SB,
T ;290 156
:257 561
TR L 267 126
119 41 .212 101 561
240
_. . .^SB^
J 322 156 267 .555
0 0
•,-!SB
T 498 208 357 555
1
1
1
i
1
2021 No Build Traffic Conditions - PM Peak Pennoni Associates, Inc
SimTraffic Report
Pages
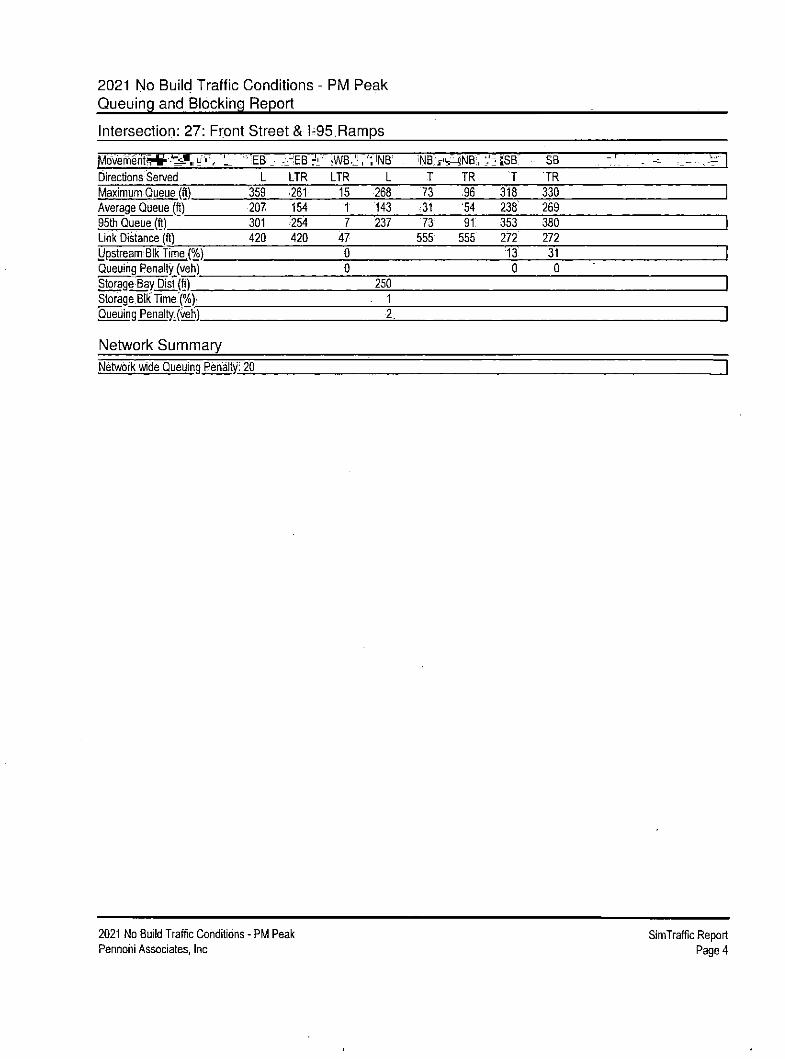
2021 No Build Traffic Conditions - PM Peak Queuing and Blocking Report
Intersection: 27: Front Street & 1 95.Ramps
Movemerit?y'^-^*.,^"^'S L ^MEB'_. .-^^EBri'' tWB.j.^'.'NB iNBV'ASNB:, ::':iSB ~ S B "
Directions Served L LTR LTR L T TR T TR Maximum.Queue (ft) Average Queue (ft) 95th Queue (ft) Link Distance (ft) Upstream^BlkTime(%) Queuing Penalty (veh) StoraqeBay Dist (ft) Storage.Blk'Time'f%). Queuinq Penalty, fveh)
359 207 301 42Q
261 154 ;254 420
15 t 7
47 0 0
268 143 237
250 . 1
2.
73 -31 73
555
.96 54 91
555
318 238' 353 272 13 Q
330 1 269 380 1 272 31 1 0
1
Network Summary Network wide Queuinq Penalty 20
2021 No Build Traffic Conditions - PM Peak SimTraffic Report Pennoni Associates, Inc Page 4

2021 BUDLO WEEKDAY PBVi PEAK HOUR

2021 Build TrafficConditions - PM Peak Queuing and Blocking Report
Intersection: 1: Darien Street & Port Coch'ere Exit
Movement
Directions Served Maximum Queue,fft) Average,Queue (ft). 95tii:Qlieue (ft) Unk Distancej(ft)
Upsfi-eam Blk.Time (%) Queuing Penalty (veh)
WB LR 70 1 26 55 1 48.
1 1 0
Storaqe Bay Dist (ft)' | Storage BlkTime (%) Queuing Penalty (veh) |
Intersection: 3: Darien Street &,Garage.Exit
Movement
Direcfions Served Maximum Queue'(fty Average.Queue (ft) 95th Queue (ft) Unk Distance .(ft) Upstreatti Blk'Tlme (%)
WB LR
130 1 78
121 1 108
.2' 1 Queuing Penalty (veh) Storage.Bay Dist,(ft) J SlorageBlk Time (%) Queuing Penalty (veh) ' ]
Intersection: 5: 7th Street & Garage Enter
Movement
Directions'Served Maximurti Queue"'(ft) Average Queue (ft) 95th;Queue.(ft) Unk Distance (ft) Upstream Blk Time,f%)
NB :L 31 13 37'
•SB TR
7 0 •4
478-
1
1
. . 1 Queuing Penalty, (veh) StoraqeiBay Dist (ft) 100 ._ . _ 1 Storage BlkTime (%) Queuinq:Penaltv(veh) 1
2021 Build Traffic Conditions - PM Peak SimTraffic Report Pennoni Associates, Inc Pagel

2021 Build Traffic Conditions - PM Peak Queuing and Blocking Report
Intersection: 6:10th Street & PackerAvenue
Movemehtf.=l- i=!_5flf lWW!WEB!fl:^i|EB,..
Direcfions Served Maximum Queue (ft) Average Queue (ft) 95tii Queue fft) Unk Distance'(ft)
L 85 32 70
T 104 44 •86. 254
_ J E B ^
T 44: 6
27 254
IJ^EB^:,,, TR' "
m 13 39'
254.
i-iWR '"
L .23
1 9.
-i:WB/_z
T
m-55' 99'
604
. J W B - . .-
T 119 61
m: 604
•WB TR 58. 20 46
604
.•••NB,'::^
,L 40
6 26
- ( N B , . .
T 35 8
29 768
'SB •
L 137 54
104
•,^SE
T 28 8
28 768
Upstream.BlkTime:(%) 1 Queuing Penalty (veh)
St6raqe.Bav.Dist.(ft) 150 250 150 250 Storage Blk Time (%) Queuinq Penalty (veh) (
Intersection: 6:10th Street & Packer Avenue.
Mdverneiiti.y-;' i i ^ l i d f f i ^SSB^ j iO ! - . : : -. Directions Served Maximum Queue (ft) Average Queue (ft)
TR 85 36
.: -J . __-i!i-i,./|-i" .-:-._', !!.L ^ 1 , . , - J -1
1 95tfi Queue fft) 71_ Unk Distance (ft) 768 Upstream-Blk-Timef%) Queuing Penalty,(veh) StorageiBay Dist fft) Storage:Blk Time (%)• Queuing Penally fveh)
2021 Build Traffic Conditions - PM Peak SimTraffic Report Pennoni Associates, Inc Page 2

2021 Build Traffic Conditions - PM Peak Queuing and Blocking Report
Intersection: 7: 7th Street & Packer Avenue
Movertierit;^>S' - t ' ^ • ^ i - '•'WEB-:;-:L>,1E8]|' '" '• 'iEBr-l.OEBr Directions Served L T T TR'.
'.: WB'^I^; . ;WB"?.
L T
•'•IWB;>
T' • W B L . .
TR : :NB ;:^
L \ :m: L. :NBL-
T TR asq
LT Maximum Queue (ft) Average Queue (ft) 95tii Queue fft) Unk Distance fft)
177 •83 151
129' 64
ill 4 560
133 67
.117 560
164 85
145' 560
172? 66
147
72 23-55
1934
88 23 64
1934
108 24 • 68
1934
54 13 39
246
53 13 38
246
85 15 49
246
92 26 ,69
610 Upstream Blk Time.'(%) 1
Queuing Penally,(veh). Storaqe Bay Dist fft) Storage Blk Time (%)
Queuinq Penalty (veh)
•200 0 Q
275: 1 1
Intersection: 7: 7th Street & Packer Avenue
MovemefitirT.&Jrti^~:-'-^*»*l:jiSB •• ' •••• L T ^ T T I B K ^
Directions Served
Maximum Queue (ft) Average Queue'(ft) 95th Queue (ft) Unk Distance (ft)
92 1 24 67 •!
610 Upstream Blk Time (%) 1 Queuing Penalty (veh) Slara<3e:BayDist(ft) 1 Storage Blk Time (%) Queuinq Penalty fveh) 1
Intersection; 8: Darien Street & Packer Avenue
Movemeri tJ^^r^^Al-a."^ i , ^ iEBUMJEB^'^^ ' iEB: ' i !B^EB._. ."WBA^WB iWB . NB'- NB^J.. NB .. SB . , - 3 8
Directions Served L T T' TR L T T L T R LT R Maximum'Queue (ft) Average Queue (ft) 95th.Queue(ft) • Unk Distance:(ft)
Upstream BIk.Time f%) Queuing Penalty (veh) Sloraqe'Bay Dist (ft) Storage Blk Time (%) Queuing'Penalty (veH)
138 50
101
200.
64. 26' 57
604.
64 19 50
604:.
64 23 54
'604
83 21 59
225
191-79
146 560
Q 0
182 105 165 560
131 69
117
Q Q
150 0 0
132 48
105 143
0 0
0 0
93 46 77
143 0 0
314 206 336 293
7 0
34 14
235 17
•ri6
1 •110
. 1
2021 BuildTraffic Conditions - PM Peak SimTraffic Report Pennoni Associates, Inc Page 3

2021 Build Traffic Conditions - PM Peak Queuing and Blocking Report.
Intersection: 14: 7th Street & Port.,Cochere Enter
M o w S f ^ ,.•••"__ - • ""UxTinrz Directions Served LT Maximum Queue (ft)' Average Queue (fi) 95thiQueue.(ft)
30. 4
20
1
1 Unk Distance (ft)' Upstream BIk'Time (%) 1 Qijeuing.Penalty (veh) StoraqeBay Dist.(ft) 150 Storage Blkjime(%) Queuinq; Penalty, (veh) 1
Intersection: 15: Front Street & Packer Avenue/1-95
MoveirieniaSyiiJiU'Jt'-" Directions Served. Maximum Queue (ft) Average Queue (ft) 95tii Queue (ft) Unk Distance (ft) Upstream,BlkTime(%) Queuing:Penalty(veh) Storage:BavDist'fft) Storage Blk Tirhe f%) Queuing Penalty fveh)
.'lEB .'.'" "fEB'i --^CBL'^iWB-ii L . L, TR LTR,
405' .283, 104 58 193. 139 32 7 315 ,241 75' 31 771 771 771 128.
NB:. > .1
52 11 39
100
-NB • T
127 42 97
453
2, 0
• lis TR 84 12 49
453
"r^Sa ' L
26 6
23
100
•: ' S B -T
174 58
127 334
1 0
.^:SB^^. • TR 320 71
200 334
Q 0
J: .,.-,:.-ouj
Intersection: 18: Darien Street &.Employee Driveway
Movement3T£i."j ^SA-. r ' 1 Direcfions Served -Maximum Queue (ft) Average,Queue (ft) 95tfi",Queue,fft) Unk Distance:(ft)
y m \ ' . K S B ; " . ^ , , : - „ ... ,
LR ,L 68 46 29 9 53- 33
119
, . , . - ,- : : . : . . l
1 1
Upstream Blk Time (%) I Queuing Penalty (veh) StoraqeiBay Dist(ft), loo: 1 Storage Blk .Time (%) QueuinQ'Penalty (veh) ' * I
2021 Build Traffic Conditions - PM Peak SimTraffic Report Pennoni Associates, Inc Page 4

2021 Build Traffic Conditions - PMPeak Queuing and Blocking Report
Intersection:.22: Front Street,& Walt Whitman Br
Movement3^J_^,'^i\,
Directions,Served
Maximum Queue (ft)
Average.Queue (ft)
95th Queue:(ft)
Unk Distance (ft)
• r ^ l I ^ N B K t ^ S B r =
L 184 81
152
T •53
6 40
561
' .^SB'"
TR 206 34
1,16
561,
•.'>r.'\. A^^:i'^ - - ' - " = -
• 1
Upstream Blk Time;(%) 1
Queuing,Renalty.fveh)
Storaqe Bay Dist (ft)
Storage Blk Time (%)
Queuinq Penalty (veh)
Intersection: 23:
180 1 2
Front Street & Walt Whitman Bridge/1-95 SB
1
]
M o v e m e n t ^ ^ l ? ! _.=„
Directions Served
Mawmum Queue (ft)
Average Queue (ft)
95th Queue (ft) Unk Distance (ft)
Upstream Blk'T'ime(%) Queuing Penalty (veh)
Storaqe Bay Dist.(ft)
Storage:BlkTime;(%)
Queuing Penalty fveh)
Intersection: 27:
:'ii-.''mEB'-L
175 52
•130
261 0 0
£?EB^: LT,
313 187 309 261
6 0
11 3
'HEB,-
R 225 19
121
200 0 0
i.MB]!'-' T
37,4
204 320,
56r
Front Streets l-95-:Ramps
'^NBU?T^SBi .
TR 288 168 264.
561
L 75 19 •55
240:
_SBi
T 153 59
134 555
SB _ .
T 497 128 328 555
0 Q
. _.___"!;. ]
Mdvemenls^j _^".'
Direcfions Served
Maximum Queue.fft)
Average Queue (ft)
95fii Queue (ft)
Unk'Distance (ft)
Upstream'Blk"Time:(%) Queuing Penalty (veh)
Storaqe:Bay,Dist(ft)
Storage Blk Time (%)
Queuinq Penalty.(veh)'.
" • : i i . ' ^ ^ E B .
L 388 •
253 •370
420 0 0
SQEBJ .
"ITR
396 218 359 420
1 0
J W B .
LTR 10 1 8
47 0. 0
i ^ ! iNB._
L 279,
150 249
250 1 .1
_ IINB:_
T 155
18 •89
555
.
J!_lNB:z
TR 68 17 '51
555.
ir_'SB: .
T 316 245 342 272 14. 0
SB TR
328 278 365 272 38 0
Network Summary Network.wde Que"0ing:Pen"3lty:.22
2021 Build Traffic Conditions - PM Peak
Pennoni Associates, Inc SimTraffic Report
Page 5

2021 BUILD WITH IMPROVEMENTS WEEKDAY

2021 Build with Improvements Traffic Conditions - PM Peak Queuing and Blocking Report
Intersection: 1: Darien Street & Port Cochere Exit
Movement
Direcfions Served Maximum Queue fft) Average.Queue (ft). 95tii Queue'(ft) Link Distance (ft) Upstream Blk Time (%) Queuing Penalty.(veh)
WB LR' 62 . , 1 27 50 48 1 ^ • 1 Q
Storage Bay Dist (ft) 1 Storage Blk Time (%) Queuinq Penalty fveh)' I
Intersection: 3: Darien Street & Garage Exit
iMovement.
Directions Served Maxirnum Queue fft) Average Queue (ft) 95th Queue (ft) Link Distance (ft) UpstreamBlkTime':(%) Queuing Penalty, (veh)
WB LR
130 1 80
121 108
2 0
Storage Bay Dist fft) 1 Storage Blk Time (%) Queuinq Penalty, (veh) I
Intersection: 5: 7th Street & Garage Enter
Movement
Directions Sen/ed Maximum.Queue fft) Average Queue fft) 95thQueue'fft) Unk" Distance (ft)
NB SB 1
L TR 31 15 1 10 1 34 6 1
467 Upstreatti Blk Tim"e'(%) | Queuing Penalty (veh) Storaqe Bay Dist (ft) 100 1 Storage Blk Time f%) Queuinq Penalty, fveh) . 1
2021 Build with Improvements Traffic Conditions - PM Peak SimTraffic Report Pennoni Associates, Inc Page 1

2021 Build with Improvements Traffic Conditions - PM Peak Queuing and Blocking Report
Intersection: 6:10th Street & PackerAvenue
^dvement'.:^ -",, =-_." OilEB^^-;.'r;iEB'?:.-:-=iEB:. i .;EB; .
Directions Sen/ed L T T TR
1 *.WBi:
L _-jwB_':
T r jJWBvDWB
T TR T N B -
L . 'JNBA.-
T 3 6 _
•'I -.^s^
T .Maximum Queue:(ft) 77 101 54 . 56 23 138 118 56 38 . 35 118 42 Average Queue (ft)" 29 41 6 15 2 60 56 21 5 8 49 7 95th:Queue (ft) 64 -81 30 42 12 108 98 44 23 29 95 28 Link Distance"(ft) 254 254 254 604 604 604 768 768 Upstream Blk .Time (%) - 1 Queuing^Penalty (veh) StorageiBay Dist (ft). 150' i250 150 250 1 Storage:B!k.Time,(%) Queuihq'Penaltv,(veh) 1
Intersection: 6:10th Street &, Packer Avenue
vldverfient-.v , .
Direcfions Served' Maximum Queue.(ft) Average Queue (ft) 95th Qiieue (ft) Unk Distance (ft)
jvjSB^ j ' L J i ^ : - j t J V ' ' • TR 76 33 66
768
,J Yl^^. '^ i^ t^^ in i^ . i r ' . . - J L _._ _ . . . ^ - ^ - 1 . . 1
1
1
Upstream Blk-;Time f%) I Queuirig Penalty, (veh) Storaqe Bay Dist fft) 1 Storage Blk Time f%) Queuing Penalty fveh) )
2021 Build with Improvements Traffic Conditions - PM Peak SimTraffic Report Pennoni Associates, Inc Page 2

2021 Build with Improvements Traffic Conditions - PM Peak Queuing and Blocking Report
Intersection: 7: 7th Street &,Packer Avenue
. ? ^ ^ ^ 1 E B ^ WB:.:^-WB, wB.' i-xWB . .NB. jNB . .mr-r:M DirectionsServed L T T TR. L T T' TR ,L T TR LT Maximum Queue fft) Averaqe,Queue (ft)
95tiiQLjeue (ft) Link Distance (ft)
166, 81
138.
121 62
108. 560
145-6Q
113 560
171 89
152 560
161 56
115'
76 23 56
1934
66 23 58
1934-
92 24 68
1934
68 11 40
246
46 13 39
246
67 17 51
246
82 25 63
610 Upstream Blk Time (%) ' 1 Queuing Penalty (veh) Storage Bay Dist fft) 200: :275' 1 Storage BIk'Time (%) Queuing Penalty'(veh)
Intersection: 7: 7th Street & Packer Avenue
|Movemeht53r,'_.:^'_ L">
Directidns Served Maximum'Queue fft) Average Queue.(ft)
95th Queue;(ft) Unk.Distance(ft)
' ' ^sBb^J=•••lVc^"i+^^^-••'^ •'. '- '•.. T
80' 30 .68
610
.^'-: jVEi.r-_ ._ . ' - r ^ i - . . . ^ - : - \
1
1 Upstream Blk Time (%) I Queuing Penalty (veh) Storaqe Bay Dist (ft) 1 Storage Blk Time (%) Queuinq Penalty (veh) I
Intersection: 8: Darien Street & Packer Avenue
Movemei>lft: j t 7 \ i " ; - - , ^ .- • rEB- - r iEB i ' ^IEB'".JL-EB^i'.-. WBr .Q/VB^ ._ .'WBii^^ iNB: ^NB' ;NB SB .i, :Sg
DirectionsServed L T T 'TR L "T t L T' R LT R Maximum Queue fft) Average Queue (ft) 95thQueue,fft) Unk Distance (ft) Uostream Blk Time f%) Queuing Penalty (veh) Storaqe Bay Dist (ft) Storage Blk Time (%) Queuinq Penalty (veh)
111 45 .87
200
50 22 52'
604
58 11 40
604
65' 22 •54
604
75' 25' 59i
225'
152-,77'
135 560
164 105 160 .560
133 73
123
0 0
150 0 0
132 45 94.
143 0 0
0 0
97 46 79
143
:326 211 332
293 7 0
36 15
•235 22
136
1 110
1
2021 Build witii Improvements Traffic Conditions - PM Peak SimTraffic Report Pennoni Associates, Inc Page 3

2021 Build with Improvements Traffic Conditions - PM Peak Queuing and Blocking Report
Intersection: 14: 7th Street & Port Cochere Enter
Movement
Direcfions Served, Maximum Queue.(ft) Avera'ge Qijeue (ft) 95th''Queue (ft) '
NB LT 31 5'
23
'
1
1 Unk Distance (ft)
Upstream BlkTime (%) " | Queuing Penally (veh)' Storaqe Bay Dist fft) 150 1 Storage Blk.,Time (%) Queuinq Penalty (veh) I
Intersection: 15: Front Street & Packer Averiue/l-95
Movement
Directions Seri ed Maximum Queue (ft) Average Queue (ft) 95th,Qijeue(ft) Link Distance (ft) UpstreartiBlkJirne(%)
Queuing,Penalty (veh) Storaqe'BayDist.fft). Storage Blk TimeX%) Queuing'Penalty(veh)
Intersection: 18:
EB L
339' 176 279 771
EB' EB WB NB
L, TR, LTR L 250' 117 59 59 135- 29 8 8
,219 75. 33 33 771 :771 128
100
Darien Street & Employee Driveway
NB T
122 40 94
453
2 0
NB TR 41 •5
23 453
SB L
34 3
18
100
SB T
179 58
128 334
2 0
SB 1
TR 263 1 70
190 1 334
0 1 0
— Movement
Difectioris Serve'd Maximum Queue (ft) Average Queue (ft) 95th,Queue (ft) Link Distance (ft)
WB LR 63-26 50
119,
SB ,L,
45 8
31
1
• !
1
Upstream Blk Time f%) I Queuing Penalty (veh) StoraqeiBay Dist fft) 100 1 Storage Blk-Time (%) Queuing Penalty (veh) 1
2021 Build with Improvenients Traffic Conditions - PM Peak SimTraffic Report Pennoni Associates, Inc Page 4
2021 Build with Improvements Traffic Conditions - PM Peak Queuing and Blocking Report
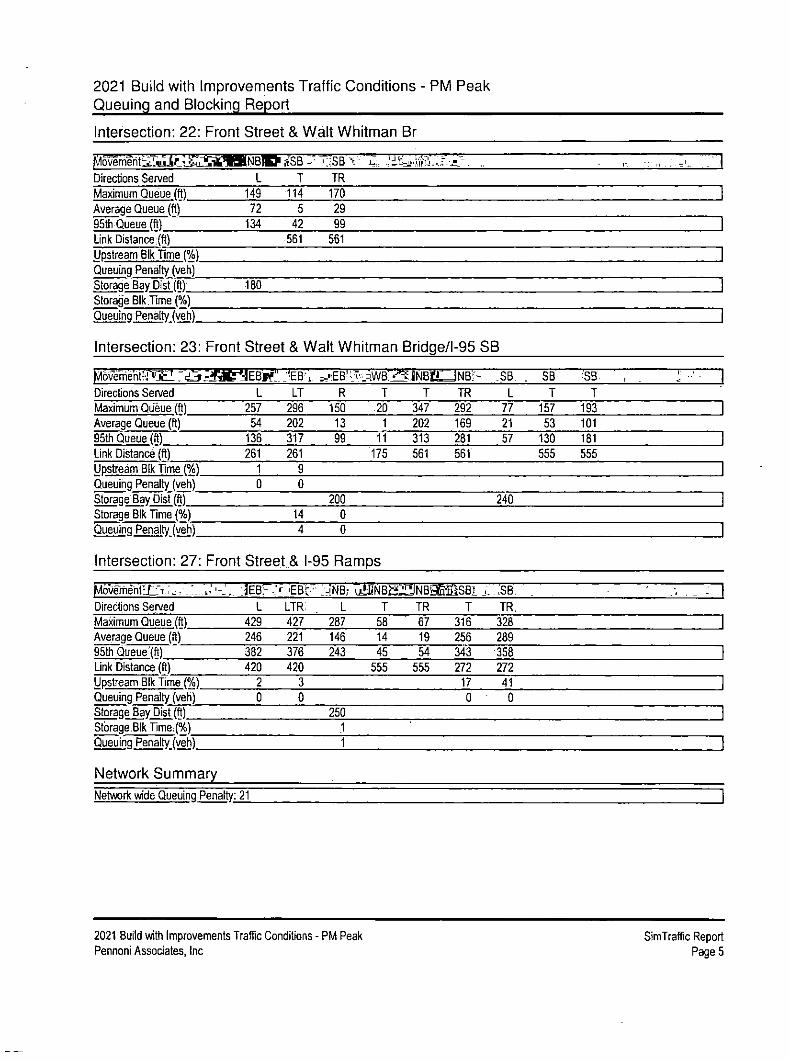
Intersection; 22: Front Street & Walt Whitman Br
f;iS^mthiut«Ltr4J^,LiitWlNB» Directions Served Maximum Queue (ft) Average Queue (ft) 95tii Queue (ft) Unk Distance.(ft)
L 149 72
134
i iSB/ T
114 5
42 561
.::SB^
TR 170 29 99
561
:• . ^ . . .d X^ 'M. ' . ^ • JL^ , r. • • • M ; ^ 1 .
1
1
Upstream Blk Time (%) 1 Queuing Penalty (veh) Storage Bav Dist fft) 180 1 Storage BlkTime (%) Queuinq Penalty (veh) 1
Intersection: 23: Front Street & Walt Whitman Bridge/1-95 SB
v1ovemeht-J I'SLL T d j
Direcfions Served Maximum Queue (ft) Average Queue (ft) 95fii Queue (ft) Unk Distance (ft) Upstream Blk Time (%) Queuing Penalty (veh) Storaqe Bay Disl (ft) Storage Blk Time (%) Queuinq Penalty fveh)
Intersection: 27:
; ifat^jEBif: ' L
257 54
136 261
1 0
_'EB-.. LT
296 202 317 261
9 0
14 4
=."EB-
R 150 13 99
200 0 0
T'.L4WB;_!
T 20 1
11 175
Front Street & 1-95 Ramps
^UNBtLJNBf-T
347 202 313 561
TR 292 169 281 561
_SB.
L 77 21 57
240
SB T
157 53
130 555
•:SB
T 193 101 181 555
1 1
Mdvement-_L:'T-i - • / . . Directions Served Maximum Queue (ft) Average Queue (ft) 95tti Queue fft) Unk Distance (ft) Upstream Blk Time (%) Queuing Penalty (veh) Storage Bay Dist (ft) Storage.Blk Time;(%) Queuinq Penalty (veh)
.;•-_. jEBr-,* L
429 246 382 420
2 0
r •€Bt'-LTR; 427 221 376 420
3 Q
: J N B ;
L 287 146 243
250 1 1
^iU^NBS22lNB@EiiiSB,l
T 58 14 45'
555
TR 67 19 54
555
T 316 256 343 272
17 0
j , . : sB ,
TR, 328 289 358 272 41 Q
- . - t
Network Summary Network wide Queuing Penalty: 21
2021 Build with Improvements Traffic Conditions - PM Peak Pennoni Associates, Inc
SimTraffic Report Page 5

2012 EXISTING WEEKDAY PRE-PHILLIES EVENT PEAK HOUR CONDITIONS

2012 Existing Traffic Conditions - PM Event Peak Queuing and Blocking Report
Intersection: 3:
Movement,J •M-:--."-K'TU,.-^ I I
Directions Served Maximum Queue fft) Average Queue (ft) 95fiiQueue(ft) Unk Distance (ft) Upstream Blk Time (%) Queuing Penalty (veh) Storage Bay DisUft) Storage Blk Time (%) Queuing Penalty (vehT~
Intersection: 6:10th Street & Packer Avenue
Movement - . .., - ^ v iEB ' ' 'EB_-_.; EB . _ : E B •
Directions Sen/ed L T T TR
•• WB .
L _ ,WB
T .WB,-
T WB
JR-NB
L NB
T NB-.
R • i^;S^
L Maximum Queue fft) Average Queue (ft) 95th Queue fft) Unk Distance (ft) Upstream Blk Time (%) Queuing,Penalty (veh) Storage Bay Dist (ft) Storage Blk Time (%) Queuinq Penalty (veh)
70 20 54
150
97 36 79
254
0 ,0
105 16 59
254
198 82
153 254
315 251 366
250 36 35
556 206 596 598
2 4
0 0
393 109 418 598
1 2
368 74
371 598
0 0
49 7
29
150
28 3
18 768
30 7
26 768
111 50 95
1 250
1
Intersection: 6 10th Street & Packer Avenue
Movement; .'-i ;
Directions Ser/ed
\ ^•.' . .-'SB.
T SB ., , ^ 1
TR Maximum Queue (ft) Average Queue (fi) 95th Queue (ft) Unk.Distance (ft)
122 59
105 768
112 1
41 88
768 Upstream Blk Time (%) I Queuing Penalty (veh) Storage Bay Dist (ft) I Storage Blk Time (%) Queuing Penalty (veh) . |
2012 Existing Traffic Conditions - PM Event Peak SimTraffic Report Pennoni Associates, Inc Page 1

2012 Existing Traffic Conditions - PM Event Peak Queuing and Blocking Report
Intersection: 7: 7th Street & Packer Avenue
M6vement;r'.n'.' . '•/ ' ". V^ ' . iEBLf:-:^EB.l!I^T3EBL:: L^EB/ Direcfions Sen/ed L T T TR
- >WB^J 1
.":sWB?.i^.jWB' ,i::.WB T T TR
_'NB,:-.^ N B -L T
. .ml. TR
• isa LT
MaxImumQueueJft) 118 65 59, 108 380 1590 1349 1066 92 55 73 637 Average Queue (ft)' 47 23 19 43 365 1089 748 201 31 18 18 358 95tti Queue (ft) 91 55 49 87 466 1563 1386 775 73 46 54 745 Unk Distance'(ft) 560 560 '560 1936 1936 1936 1460 1460 610 Upstream Blk Time (%) Queuing Penalty (veh) storaqe Bay Dist (ft) Storage Blk Time (%) Queuinq Penalty (veh)
200 275 11 3Q:
82 366
225
5 0
1
1
Intersection: 7: 7th Street & Packer Avenue
\ dvementS- _^_' ~ ' r *^ V Directions Served Maximum Queue (ft) Average Queue (ft) 95tti Queue fft) Unk Distance (ft) Upstream Blk Time (%) Queuing Penally (veh)
iSB. " T
655 627 643 610 86 0
. . . ^ S B ^ - ^ a j M M E l E L R
669 630 649 610 98 Q
,.L^ri-- •,,*-Tii ' v r - ' « . - . i r ^ " •-. - . 1 ' . . - : : . 1
1
1
1
Storaqe Bay Dist (ft) 1 Storage Blk Time (%) Queuinq Penalty fveh) 1
2012 Existing Traffic Condifions - PM Event Peak SimTraffic Report Pennoni Associates, Inc Page 2

2012 Existing Traffic Conditions - PM Event Peak Queuing and Blocking Report
Intersection: 8: Darien Sireet & Packer Avenue
Movement EB EB EB EB WB WB WB WB NB NB NB Sp
DirectionsServed L T T T R L T T R L T R L T
Maximum Queue fft) Average Queue (ft) 95tii Queue (ft) Unk Distance (ft) Upstream Blk Time (%) Queuing Penalty (veh) Storaqe Bay Dist.(ft) Storage Blk Time (%) Queuinq Penalty fveh)
69 20 50
200
63 24 54
598
50 IQ 35
598
129 52
101 598
325 324 326
225 85
230
591 568 584 560 28
137
4 28
587 509 613 560
4 21
681 641 769 560 98
476
162 80
146
150 4 1
i87 20 67
1137
73 33 66
1137
333 279 368 292 34 0
1 54 98
Intersection: 8: Darien Street & Packer Avenue
Movement
Directions Served Maximum Queue (ft) Average Queue (ft) 95tti Queue fft)
SB R
160 126 232
1
1
t Unk Distance (ft) Upstream'Blk Time (%) 1 Queuing Penalty (veh) Storaqe Bay Dist (ft) Storage Blk Time (%) Queuing Penalty (veh)
Intersection: 15:
110 0 0
Front Street & Packer Avenue/1-95
1
1
Movement
Directions Served Maximum Queue (ft) Average Queue (ft) 95tii Queue (ft) Unk Distance (ft) Upstream BlkTime f%) Queuing Penalty (veh) Storaqe Bay Dist (ft) Storage Blk Time (%) Queuing Penalty (veh)
EB EB 'EB
,L L TR 307 209 63 154 103 9 258 185 40 771 771 771
WB LTR
28 2
13 128
NB L
77 31 72
100 0 ,0
NB T
143 55
119 453
2 1
NB TR 79 12 43
453
SB L
57 4
29
1QQ
SB T
304 165 273 334
0 1
24 2
SB 1
TR 352 1 239 398 1 334
2 I 18
2012 Existing Traffic Conditions - PM Event Peak SimTraffic Report Pennoni Associates, Inc Page 3

2012 Existing Traffic Conditions - PM Event Peak Queuing and Blocking Report
Intersection; 22: Front Street & Walt.Whitman Br
Movement, ':!_MT:!I . ' ^ T S l H i N B S S l l . / S B r ^
DirectionsServed Maximum Que'ue (ft) Average Queue (ft) 95tti Queue (ft)
LinJ<,Distance"(ft)' Upstream BlkTime (%) Queuing Penally (veh) Storaqe Bay Dist (ft) Storage BlkTime (%) 'QueuihqiPenalty.(veh)
Intersection: 23:
L 186
69. 136'
180 1 2
T-308 27
156' .• 561
0: Q
..TSBi:"N ^ . "TR 404 120 409 561
6' 57
• : :
Front Street & Walt Whitman Bri.dge/l-95 SB
1
1
1
1
1
\^6vemeiit j_'^:^, i ^ J
Directions Served Maximum Queue (ft) Average.Queue (ft)' 95thQueue (ft) Unk Distance (ft) Upstream BlkTime (%) Queuing penalty, (veh) Storaqe Bay Dist fft) Storage Blk Time (%) Queuing Penalty.fveh)
Intersection: 27:
^^^^^EBfi^EBL;-. L
276 77
205 261
• 1'
Q
LT 320 296 317 261 70 0
10 71
- lEB lVHWB^
;R ^T
225 , 6 225 0 226 •• 5
175
•200 81
517
Front Street & 1-95 Ramps
,)NB,.-
T 197 102' •169 561
't: !NB1 '
TR 162
80' 139. 561
;SB':
L, 133; 57
115
240
'SB
T 270 185' 260 555
1 1
•^SB _ . 1
T 521 1 211
•356 1 555
0' 1 0
Movemerit.., J L L S J I __
DirectionsServed MaximumiQueuefft) Average Queue (ft) 95th Queue fft) Unk Distance (ft) Upstream Blk^Tlme (%) Queuing Penalty.(veh) Storage Bay Dist (ft)
.-._.. ; L . J E B ' »- , - E B I B F , . R W B = . !J.aNB., '
L ;47S 447 468 420
56 0
LTR 478 456 478 420 97 0
LTR L 61 161
.25 74 57 138 47 •4
0 250
, 1NB_
T 85
,29 68
555
•NB \
TR 76 18 55
555
•••SB
T 305 '177 278 272
1 0
SB TR
312 158 304 272
3 Q
Storage BlkTimei(%) Queuinq Penalty fveh) )
Network Summary Netwod<.wide Queuing Perialty; 2098
2012 Existing Traffic Conditions - PM Event Peak Pennoni Associates, Inc
SimTraffic Report Page 4

2016 AND 2021 NO BUILD WEEKDAY PRE-
PHILLIES EVENT PEAK HOUR CONDITIONS

2016 No Build Traffic Conditions - PM Event Peak Queuing and Blocking Report
Intersection: 6:10th Street & PackerAvenue
Movement-, -, •••'
Direcfions Served Maximum Queue (ft) Average Queue (ft) 95tii Queue (ft) Unk Distance (ft) Upstream Blk Time (%) Queuing Penalty (veh) Storaqe Bay Dist (ft) Storage Blk Time (%) Queuinq Penalty (veh)
i ^ . . 'iEB--.-
L 64 18 48
150
•'-EB "...,iEBL^
T T 82 114 33 17 75 66
254 254
.?!,yEB:^::
TR 175 87
153 254
• . ' .WB:. .
L 315 257 373
250 39 38
.. .'WB.
T 596 225 629 604
1 4
0 0
WB T
502 120 445 604'
0 1
,WB TR
341 34
228 604
0 Q
;NB:
L 42 7
28
150
'NB T
28 3
15 768
, NB
R 30 8
29 768
. ^S^
L 114 51 98
1 250
1
Intersection: 6:10th Street & PackerAvenue
Movernerit • _. •••.h-.e-SB' - S B . . . - - . . i : .:_.:-.., ! 'J /_. ^ . . - .
Direcfions Served T TR , . 1
Maximum Queue (ft) Average Queue (ft) 95th Queue (ft) Unk Distance,(ft)
126 56
101 768
124 45 91
768
1
1 Upstream Blk •nme,(%) 1 Queuing Penalty (veh) Storaqe Bay Disl (ft) I Storage Blk Time (%) Queuinq Penalty fveh) 1
2015 No Build Trafiic Conditions - PM Event Peak Pennoni Associates, Inc
SimTraffic Report Paget

2016 No Build Traffic Conditions - PM Event Peak Queuing and Blocking Report
Intersection: 7: 7th Street & Packer Avenue
^oveme^ tLJ . " : ^ ' : l L : Jp^d7^ • :EBJ : : ^ :EB ' ^ l ! ^EBJ ' ^EB_ : : : ; ^ ..jWB^' . . M / B L V - I N B J T . JNB.. :, ;NB- ^Sg
Directions Served
MaxihiLim Queue (ft) Average Queue (ft) 95tiiQueue (ft) Unk Distance (ft) Upstream'Blk Time f%) Queuing Penalty (veh) Storaq'e^BayDist(ft) Storage Blk Time (%) Queuing Penalty (veh)
L 123 53
103
200
T 64 22 50
560
T 67 20 54
560
TR 102 42 84
.560
L 380 370 442
275 15 40
T 1440 1010 1461 1936
83 367
T 1201 728
1327 1936
TR 931 129 526
"1936
L 105 ,34 86
225
T 55 17 43
1460
TR' 72 18
i52. 1460
LT 623 311 675 610
3 0
1 1
Intersection: 7: 7th Street & Packer Avenue
Movement .L.-VT ' ' . raeLtu'.i r
Directions Served
Maximum Queue (ft) Average.Queue (ft) 95tii Queue:(ft) Unk,Distance (ft)
Upstream'BlkTime f%) QueuingPehaltyfveh) Storaqe Bay Dist (ft)'
.HSB.C ll fSBk. ^-J-t t . -JfUTfei. :
T R 656 .657 613 627 746. 655 610 610
83 94 0 0
"^ 7..r^M-- ^ - - =-'
Storage.Blk Time(%) Queuing Penalty (veh) 1
2016 No Build Traffic Conditions - PM Event Peak SimTraffic Report Pennoni Associates, Inc Page 2

2016 AND 2021 BUILD WEEKDAY PRE-
PHILLIES EVENT PEAK HOUR CONDITIONS

2016 & 2021 Build Traffic Conditions - PM Event Peak Queuing and Blocking Report
Intersection: 1 Darier Street & Employee Driveway
Movement,
Directions Served
WB LR
NB TR
SB 1
L Maximum Qijeue fft) Average Queue,(ft) 95tti Queue fft) Unk Distance (ft)
54 23 46 95
4 0 3
215
. :3i 1 5
23
Upstream Blk Time f%) 1 Queuing.Penalty (veh) Storage'BayDist(ft) 100 1 Storage Blk Time (%) Queuinq Penalty fveh) I
Intersection: 6: 10th Street & Packer Avenue
Movement
Direcfions Sen/ed Maximum Queue (ft) Average Queije (ft)
EB L
60 21
EB T-
93 31
EB T
139 25
EB TR . 173 87
WB L
309 213
- WB
T 436 161
WB T
309 ,86
WB TR 230 ,25
NB L
45 9
NB T
31, 3
NB R
.-30 8
sd L
127, 56
95tii,Queue (ft) Link Distance (ft) Upsti-eam Blk Time f%) Queuing.Penalty (veh) Storage.Bay D.is[ fft) Storage BlkTime (%)
50 87 157 :359 513 327 187 '33 18 28 107 254 254 254 604 604 604 768 768
0
150 ••250 150 250 24
Queuing:Penal ty fveh) 32
Intersection: 6: 10th Street & Packer Avenue
Movement SB SB 1
Direcfions Served TR Maximurri Queue (ft) Average Queue (ft) 95tiTQueue(ft) Unk Distance (ft) Upstream Blk tirne (%)
116: 58
102 768
95: 41 81
768
1
1
I Queuing Penalty (veh)
Storage Bay Dist (ft) Storage Blk Time (%) Queuing Penalty (veh).
2016 & 2021 Build Traffic Conditions - PM Event Peak Pennoni Associates, Inc
SimTraffic Report Page 1

2016 & 2021 Build Traffic Conditions ~ PM Event Peak Queuing and Biocking Report
Intersection: 7: 7th Street & Packer Avenue
Move m'eritirjiUi^J. JL
Directions.Se'fved Maximum Queue fft) Avefage^ijeuefft)'
95th Qijeue fft), Unk'Distance (ft) Upsfi-eam BlkTime (%) Queuing'Penalty (veh)
= ? i . L^^EBlJ^-aEBii".. ...EBV.r^EB, :W
L T T TR 127' 71 82 160: 49 27 31 67 :97 ,57' 68 • 124-
560 560 560
. jWB II
L 380. 374 434-
iWB';
T' '1528 .1102 1453' 1936:
,. 'WB:
T 1294 845
1349 1936
WB/
TR 1064 '190 735
1936^
.'NB'.F
L 100 28 70
244
i,--JNB,..l
T' 46 14 38
244
. )NB.
TR 68, 18 53
244
. . 'JS^
LT 632 367 752 610
.5 0
Storage Bay Dist (ft) 200 275' SlorageBlk Time (%) 42 57 QijeuJng:Pe.n.ajtv(veh) 113 288i
Intersection: 7: 7th Street & Packer Avenue
MQvementfy.>^.LS,-S-^f^SSBl®^l .SB^
DirectionsServed T R Maximum.Queue fft) Average Queue fft) 95tii Queuefft) Unkpistance (ft) Upstream Blk Time (%) Queuing Penalty (veh)
659 623 694 610 83 0
661 1 629 644 1 610, 98 1 0
storage Bay Dist (ft) I storage Blk Time (%) Queuinq^ Penalty (veh) I
2016 & 2021 Build Traffic Conditions - PM Event Peak SimTraffic Report Pennoni Associates, Inc Page 2

2016 & 2021 Build Traffic Conditions - PM Event Peak Queuing and Blocking Report
Intersection: 8: Darien Street &, Packer Avenue
Movement't4JijUtffl:«lft^
Direcfions Served Maximum Queue fft) Average Queue (ft) 95thQueuefft) Unk Distance:(ft) Upstream Blk;time {%) Queuing Penalty^veh)
Storaqe'BayDist.fft) Storage Blk Time (%) Queuing Penaiti/ fveh)
^JkEBL-
L 52 19 46
200;
feiEBfe--^
T 59 21 49
604;
'lEB;
T' 56 14 42:
604.
HUEBC.^
TR 149 57
112 604
LiWBv.
L. •325 324
325
225 84
. 226
••,^WB'^-
T 589 •560 :612 560 27
132
A 8
- WB,
T
,607 506 651 560
4 21
]m~. R
677 649 '665 :560
99 486
: ' 'NB,^ : '
L 163 124 183
11. 0
•150 23 13
NB,=..
T
224 101
. 245 •164
16 39
12 26
; NB
R 126 52 96
164
0 Q
s LT
349 316
336 293 75 0
1 80
147,
Intersection: 8: Darien Street & PackerAvenue
Movemenl%g^:^3f^'^^ji!L^SBtJ!pL,.-:r-•-''•' ^'VB&^E.TTJC.-.r^-'^ ' • ; . : - . ' ' n •;, ^ . ^ ' . \
Directions Served: R Maximum'Queue fft) 235 .Average Queue (ft) 221 95th Queue (ft) 311_
Unk'Distance (ft); Upstream BIk-Tiffie (%) Queuing Penalty (veh) .SlQrage:BayDist:fft). 110 Storage. Bl.k",Tlme(%) Queuing,Penalty (veh)
Intersection:, 13: Darien Street.&.Port Cochere Exit
l ioSen^r^^^^^WBE^^i^JB^iTOji^Bniir^ Directions'Served' LR, T' T' Ma'xinnum Queue (ft) Average" Queue (ft) 95tii^Queuefft). ' Unk:Distance(ft) Upstream'Blk Time (%) Queuing Penalty (veh) Storage Bay Dist'(ft).
70 22: 53-86
1 0
182 30
138 460
67 2
30 460
1
!
1
1 Storage Blk Time (%) Queuing Penal tyjyeh)
2016 & 2021 Build Traffic Condifions - PM Event Peak .SimTraffic Report Pennoni Associates, Inc Page 3

2016 & 2021 Build Traffic Conditions - PM Event .Peak Queuing and Blocking Report
Intersection; 15: Front Street &Packer Avenue/1-95
Movement
DirectionsServed Maximum'Queue (ft) Average Queue (ft) 95tii Queue (ft) Unk Distance (ft) Upstream Blk Time (%) Queuing Penally (veh) Storaqe Bay Dist fft) Storage Blk Time (%) Queuinq Penalty fveh)
EB L
316 182 291 771
EB L
•267 134 238 771
EB. TR .59 10
.38 771
WB :LTR
28 2
15 128
NB L
107 34 86
100 2 4
NB T
127 51'
108 453
1 0
NB TR, 56 10' -35
453
SB L
55 3
27
100
SB T
320 156' 252 334
0 0
23 2
SB 1 TR
,368 1 230 392 1 334
2 1 19
Intersection: 17: Darien Street & Garage Exit
Movement
Directions Served Maximum Queue fft) Average Queue (ft) 95tii:Queue.(ft) Unk Distance (ft) Upstream Blk Time (%) Queuing Penalty (veh)
WB LR-'
121 58
• 99 113
1 0
I
1
1
I
storaqe Bay Dist (ft) 1
Storage BlkTime (%) Queuinq Penalty (veh) 1
Intersection: 19: 7th Street & Garage Enter
Movement
DirectionsServed MaximumiQueue fft) Average Queue fft) 95fii.Queuefft) Unk Distance (ft)
NB L
54 17 47
SB ,' • 1
TR • 9 1
0 5 1
459 Upstream Blk Time'(%) | Queuing Penalty (veh) Slo"raqe:Bay Dist (ft) . too 1 Storage.Blk Time (%) Queuinq Penalty (veh) 1
2016 & 2021 Build Traffic Conditions - PM Event Peak SimTraffic Report Pennoni Associates, Inc Page 4

2016 & 2021 Build Traffic Conditions - PM EventfPeak Queuing and Blocking Report
Intersection: 22: Front Street & Walt Whitman^Br
Movement < u\' ^iv! ^.4
DirectionsServed Maximum Queue (ft) Average Queue.(ft) 95fii Queue (ft) Unk Distance (ft) Upstream BlkTime (%) Queuing Penalty (veh) Storaqe Bay.Dist (ft) Storage Blk Time (%) Queuinq Penalty (veh)
•^':S'iNB^
L 182 77
145
180 1 3
- N B ' -
T •109
4 58
334 0 0
Q 0
-;NB„.;
T 60 2
44 334
, ^ : s B , T
424 42
•202 561
• 'SB, i , i , '_ , ' , " : " . _ . . , , . . : . ^ .
TR 493 1 156 511 I 561
11 • 1
no
2016 & 2021 Build Traffic Conditions - PM Evenl Peak SimTraffic Report Pennoni Associates, Inc Page 5

2016 AND 2021 BUBLD WITH BMPROVEMENTS
WEEKDAY PRE-PHILLIES EVENT PEAK HOUR

2016 & 2021 Build wit ImpsTraffic Conditions - PM Event Peak Queuing and Blocking Report
Intersection: 1 Darier Street & Employee Driveway
Movement
Directions Served
WB LR
NB' T
NB TR
SB 1
L Maximum Queue.(ft) Average Queue (ft) 95th Queue (ft) Unk Distance (ft) Upstream Blk Time f%) Queuinq Penally,(veh) Storaqe.Bay Dist (ft)
62 27 •53 95
145 22
116 215
1 2
130 11 '80
215 1 1
31 1 4
22 1
100 1 Storaqe Blk Time (%) Queuinq Penalty (veh) 1
Intersection: 6:10th Street & Packer Avenue
Movi5ment
Directions Served Maximum Queue (ft) Average Queue (ft) 95th Queue (ft) Unk Distance (ft)
EB L
51 15 42
EB T
65 18 51
254
EB T
•46 6
30 254
EB TR 128 54
104 254
WB L
271 • 113 206
WB T
38 9
•33 605
WB T
57 14 -43 605
WB TR 17 2
11 605
NB L
45 9
,32
NB' T
40 5
23 768
NB R
34. 10 33
768
sq L
171 84
146
Upstrearfi,Blktime(%) 1 Queuing Penalty (veh) Storaqe.Bay Dist (ft) Storage Blk Time (%) QueulnqPenalty (veh)
150 250 0 •r
.150 250 0 0
Intersection: 6:10th Street & PackerAvenue
Movement
Direcfions Served
Maximum Queue'(ft) Average Queue (ft) 95tii'Queuefft). Unk Distance (ft)
SB T
163 90
150 768
SB TR 160 • 1 74
140, 1 768
Upstream Blk Time (%) 1 Queuing Penalty (veh) Storaqe Bay Dist(ft)' I Storage Blk Time (%) Queuinq Penalty (veh) . , I
2016 &. 2021 Build vwt ImpsTraffic Conditions - PM Event Peak SimTraffic Report Pennoni Associates, Inc Page 1

2016 & 2021 Build wit ImpsTraffic Conditions - PM Event Peak Queuing and Blocking Report
Intersection: 7: 7th Street & Packer Avenue
|\j1ovement—1 _' ':• ' I
Direcfions Sen/ed Maximum Queue fft) Average Queue (ft) 95tti.Queue(ft) Unk Distance.(ft)
" ' \n^^SEB^._- ;EB- : .^ " , , ,EBl j lHEB:
L T T TR
136 95 106 '185 61 45 42 91
120 83 85 164 560 560 560
tL-^m^^Bm L
-380 312 471'
T 1021 478
1017 1936
.:WB
T 922 298 827
1936
WB TR
463 48
276 1936
NBn L
102' 38 88
244
^ ^NB;-: T .
55 15 41
244
- NB
TR 70 19 53
244
•S^
LT 612 274 563 610
Upstream B!k.Time'f%) Queuing Penalty (veh) StorageiBay Distfft) Storage Blk Time f%) Queuing.Penalty (veh)
200 0 0
•275 31 20 84 105
Q 0
1
i
Intersection: 7: 7th Street & Packer Avenue
Movement','; _._, . _ j ^
Directiolis Served Maxiffiiim Queue fft) Average Queue (ft) 95th'Queue-(ft) Link Distance (ft) Upstream Blk Time f%) Queuing Penalty (veh)
: X O i ' S B i 3 L J S B ' i L i i r i " _ T - ^ " ^ •
T 655 555 825 610 56 0
R 656' 589 804. 610 82 0,
'- .'iwv-;. 1
1
1
1
Storage Bay Dist fft) 1 Storage BlkTlme'f%)
Queuinq Penalty (veh) . |
2Q16 & 2021 Build wit ImpsTraffic Conditions - PM Event Peak SimTraffic Report Pennoni Associates, Inc Page 2
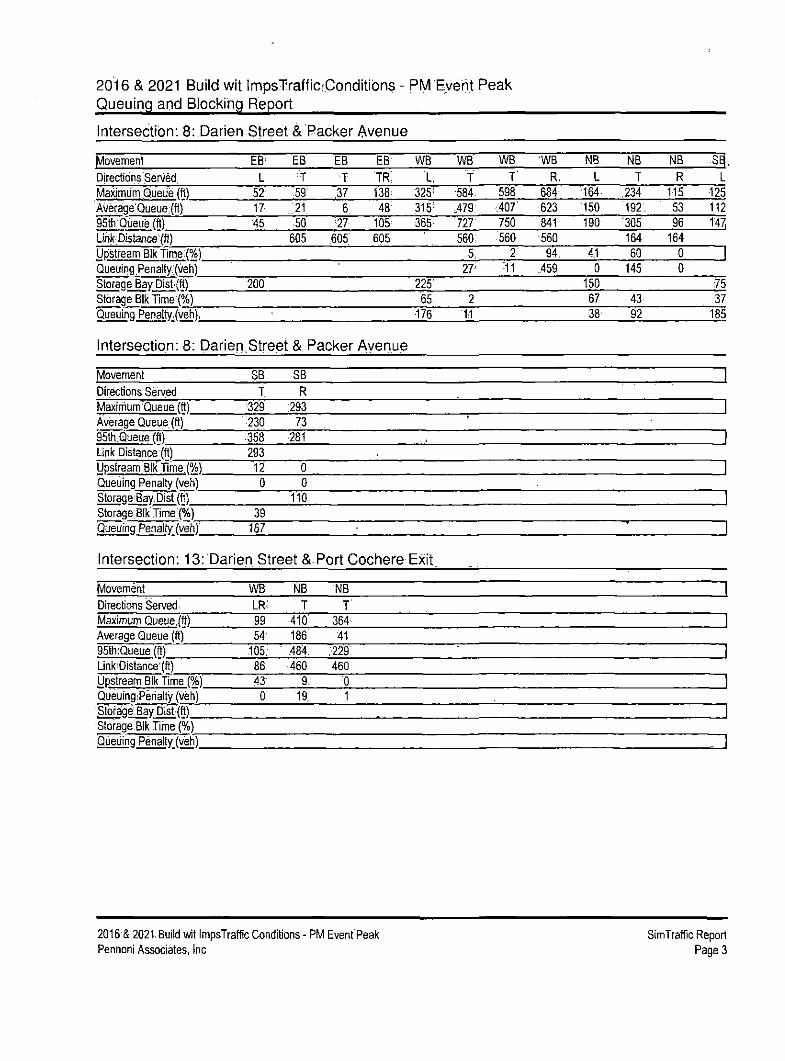
2016 & 2021 Build wit ImpsTrafficjConditions - PM Event Peak Queuing and Blocking Report
Intersection: 8: Darien Street &; Packer Avenue
Movement EB' EB EB EB: WB WB WB 'WB NB NB NB Sq.
DirectidnsSen/ed L T T TR. L, T T' R, L T R L Maximum Queue (ft) Average Queue, (ft) 95tii Queue (ft) Link.Distance~(ft) Upstream Blk Time.(%) Queuing.PenalEy:(veh). Storaqe Bay DisL(ft) Storage Blk Time (%) Queuing Penalty.(veh),
52 17 45
200
.59' 21 .50
605
,37 6
27 605
138: 48
105-605
325" 315' 365
225' 65
•176
•584, ...479 '727' 560;
5. 27'
2 t l
598 •.407' 750 560
2 '11
684 623 841
•560 94,
,459
1&4^ 150 190
41 Q
150 67 38-
,234 192, 305 164 60
145
43 92
115 53 96
164 0 0
•125 112 14^
1 :75 37
185
Intersection: 8: Darien Street & Packer Avenue
Movement
Directions Sen/ed Maximum'Queue,(ft) Average Queue (ft) 95th,Queue fft) Unk Distance (ft)
Upstream Blk t ime.(%) Queuing Penalty (veh)
Storaqe Bay.Dist (ft) Storage BlkTime (%) Queuinq,Penalty (veh)'
Intersection: 13:
SB T
329 230
.358 293 12 0
39 167
SB R
293 73
281
0 0
110
'
Darien Street &.Port Cochere Exit
Movement
DirectionsServed. Maximum Queue (ft) Average Queue (ft) 95yi:Queue (ft) Unk Distance'(ft) Upstream Blk Time (%) Queuing! Peri ally (veh)
WB LR-99 54'
105, 86 43 Q
NB T
410' 186
• 484, 460
9: 19:
NB T
364^ 41
,•229 460
0 1
1
1
1
I
Storage.Bay D!st(ft) J Storage.Blk Time (%) Queuing Penalty (veh) 1
2016 & 2021.Buiid wit ImpsTraffic Condifions - PM Event Peak SimTraffic Report Pennoni Associates, Inc Page 3

2016 & 2021 Build wit ImpsTraffic Conditions - PM Event Peak Queuing and Blocking Report
Intersection: 15: Front Street & Packer Avenue/1-95
Movement,-'Ji ^ ' : ^ *L^,fr-^
Direcfions Served
Maximum Queue fft)
Average Queue (ft)
95th Queue (ft)
Unk Distance:(ft)
Upstream Blk Time {%)
Queuing Penalty (veh)"
Storaqe.Bay.DisKft)
Storage Blk Time (%)
Queuinq Penaity,(veh)
•-^EBy^'tSEBU^JEB':,.li:tWB;.
L L TR LTR.
371. 267 67" .50.
197 135 11 4
319 234:' - 43 22
771 771 771 128
NB-
X, 118
38
88:
100,
2
1
^^NB=
T'
152
55'
114.
453.
2
1
-:NB..
TR
79
11 38
453
:SB,
L,
86
6
40
100
SB
T 314
163
•276
334
0
0
22
2:
iSB •
TR
347 1
235
•390 1
334
2 1
19
1
1
Intersection: 17: Darien Street & Garage Exit
Moverrient!, --L I ' z - ^ J - i ^ ' •
Direcfions Served
Maximum Queue (ft)
Average Queue (ft)
95fii Queue (ft)
Unk Distance (ft)
Upstream Blk Time (%)"
Queuing Penalty (veh)
niWBTrt^JNB^'ni^ ^.ij.iO..'"-.
LR T
131 11
63 0
107 8
113 333
'1
0
. • • _ . - i _ -^ 1
1
1
I
Storaqe.Bay Dist (ft) 1
Storage Blk Time •(%)
Queuinq Penalty (veh) 1
\r)tersect\on: 19: 7th Street & Garage Enter
Movernerit; .....7 -.-_^ ''L6_l
Directions Sen/ed
Maximum Queue*fft)
Average Queue (ft)
95th'Queuei(ft)
Unk Distant "(ft)
_.3NB;: :M ;SBi:....jSBi ;J|'^IL^-::,
L T TR
58" 10 ,13;
21 0 1
50' 7 '7
459 459
1
!
1
Upstrearii Blk Time (%) - 1
Queuing Penalty (veh) Storaqe Bay Dfst.fftj 100: 1 Storage Blk:7ime (%)
Queuing Penally fveh) I
2016 & 2021 BuM.wit ImpsTraffic Conditions - PM Event Peak SimTraffic Report
Pennoni Associates, Inc Page 4

2016 & 2021 Build wit ImpsTraffic,Conditions - PM Event Peak Queuing and Blocking Report
Intersection: 22: Front Street & Walt Whitman Br
Movement
Direcfions Sen/ed Maximum Queue fft) Average Queue (ft) 95fii Qijeue (ft) Unk Distance (ft) Upstreatti Blk Tlme'(%) Queuing Penalty (veh) Storage Bay Dist (ft) Storage Blk Time (%) Queuinq Penalty (veh)
Intersection: 23;
NB L
211 96
187
180 6
16
NB T
218 23
155 334
1 3
0 0
NB T
• 78^ 8
.93 334
0 0
SB T
425' 44
221, 561
SB TR' 555 324. 811 561 40,
393
,
Front Street & Walt Whitman Bridge/1-95 SB
Movement
Direcfions Seived MaxiriTum.Queue (ft) Average Queue (ft) 95th Queue (ft) UnkDistance(ft). Upstream'Blk Time'(%) Queuing Penalty (veh) Storaqe Bay Disl (ft) Storage Blk Time(%) Queuinq Penalty (veh)
Intersection: 27:
EB L
•264 69
•183 261
1 0
EB LT
316 294 316 261 73 0
8 55
EB R
225 225 231
200 86
553
WB T 6 0 5
175
FroritStreet,& 1-95 Ramps,
NB T
222 120 200 561
NB TR 193 102 173 561
SB L
170 61
131
240
SB T
311 183 263, 552
1 1
SB 1
T 482 1 205 326 1 552
0 1 Q
Movement
Direcfions Served Maximum Queue '(ft) Average Queue (ft) 95th^Queue'(ft) Unk Distance (ft) Upstream BlkTime f%) Queuing,Penalty (veh) Storaqe Bay Dist (ft) Storage Blk Time (%) Q'ueuinq: Penalty (veh)
EB L
410 205 398 419
2 0
EB L
482; 460 481 419. 98 0
17 139
EB R,
•175 175 176.
150 22' 52:
WB LTR.
60 24 56 48 •3
Q
NB L
228 •118 208
:250 0 Q,
NB T
89 23 62
1552
NB TR 78 18 56
552
SB T
285 165 •266 268
1 0
SB 1
TR 309 1 148 289 1 268
3 1 0
2016 & 2021 Build w l ImpsTraffic Conditions - PM Event Peak Pennoni Associates, Inc
SimTraffic Report Page 5

2016 & 2021 Build wit ImpsTraffic Conditions - PM Event Peak Queuing and Blocking Report
Intersection: 32: 7th Street & Port Cochere Enter
M6vement;rj-H_"-_-: ^^^'•"^..^iNBJt-
Directions Sen/ed Maximum Queue'(ft) Average Queue.(ft) 95th Queue (ft) Unk,Distance,(ft)
LT 60 :8
37
•snSB '. ,.
T 6 0 4
244
.11 - ^ - ^ v / - ; •
1
1
Upstream Blk'.Time f%) 1 Queuing Penalty (veh) Storage Bay Dist (ft) 150. 1 Storage Blk Time (%) Queuinq Penalty (veh) j
Network Summary Network,\MdeQueuing Penalty: 2760
2Q16 & 2021 Build wit ImpsTraffic Condifions - PM Event Peak SimTraffic Report Pennoni Associates, Inc Page 6

PENN NATIONAL G A M I N G I N C .
Hollywood Casino - Philadelphia Transportation Impact Study
November 14, 2012

PROPERTY DEVELOPMENT
Parking and Profits in Indian Country
by James M. Klas
rj
Parking at Indi-an casinos is often an underappreciated issue in the gaming industry. Kive years
ago, ramps were more the exception than the rule. Parking was generally'considered a cost of doing business rather than a direct enhancement to bottom hne performance. The main question was, "How mucii do T need?" as opposed to, "How can parking, both in terms of amount and configuration, help maximize profits for the complex as a whole?" Much has liappened in five years. Structured parking is now commonplace among new facilities and cvpansions. It's time not only to pro'vide updated parking rules of thumb and statistics, hut also to explain in detail just why arid how parking can affect your profits to a significant degi'cc.
Suppose that ypu have a casino \yith 1,000 gaming positions (895 machines and 15 tables for example) making Si 75 per gaming position perday You have all the typical base amenities in terms of food and beverage and retail, but no hote), no big showroom or other component that requires extra parking spaces. Suppose also that your casino docs not have a significant busing program. ILssentiallyall of your customers come by car. If the casino has 1,200 parking spaces available for customers (not countiiig employees) and a typical customer flow from hour to hour and day to day, the parking pattern might look something like the graph in Figure 1.
FIGURE 1: PARKING SUPPLY vs DEMAND (1,000 POSmON CASINO)
I
3 i 'i i 1 i l i i i i l l i l ' l i l l i ^ ^ i i j i i i l i H l i M i i i A i ^ " " a 3 a ?' ". | j | ^ ' ^ ' ' e e ' e £ * * ; s ^ " ' ' " | i 2 ' ^ " ' c s 5 ' A J, i
-fuxnatioitHD -WK»OH»*ir
t ab le 1: Parking Ratios
ALLU.S. CASINOS (parking spaces per gaming position)
GAaNGS WtTH^Bll GO HALLS (parking spaces per goming position and bingo seat)
.CASINOS'WITH" HOTELS
(parking spaces per gaming position and iiofel iborh)'
.GASINOSV /ITH HOTELS.AND;cpN\yENTlO.N SPACE (pgricing spaces jDer gaming posllionjhqlej iq^^^ i(X}sp:Jts {of.kinction space)
CASiNps.vyrrH HqreLs.cpNyENnavirsPACE A N D ' B I N G O HALLS
(corking spaces per gaming pt^ t ion: lioiel ipom Singh seat!bhd 100 sq. ft.ofconyenljonjspace).
CASINOS AMJH TO HOTE_l : CONVENTION ^ ^ (parking spaces per garrahg position),
Median
li07'
'0,68
Q.as
o.ao,
0.62;
0.98:
lower Quartlla
•0.75:
•0.54
o:6i
0,55
b:45
o:63'
Source:'KlosRohir>son O.f.D.and CasinoCity's Gaming Bu^ness'Directory August ^ 1 0
Upper Quartile
i;59
0.96'
1.35
1.07
0.81
1,69
Tf you look at the graph, it appears that 1 j200 spaces i,s more than enough for the customer base except for a few hours on Friday.and Saturday night. Surely adding parking that would only-be used for about seven hours per week would be too expensive, right? Not so fast.
The. ' to ta l shortage in the example amounts to 2,468 vehicle hours per week. Now some of those vehicles will wait for
a spot. Some of those vehicles will come back another time. Some of them will just park in some area that isn't supposed to be used. Tn each case, your casino will still get some or all of the money those people 'intended to spend. Nevertheless, some of those vehicles vvill turn around and go home (and probably not come back again). How many? Suppose che figure is half If those cars avei"-aged between 2.0 and 2.1 people per vehic)c and those people planned to spend S65 apiece on your gaming floor, you just lost
44 Indian Gaming OdQber2010

Tati|e,2:;Parking Rules ofThurrib
Component,
• CASINO
BINGO HALL
HOTEL
CONVENTION SPACE
.SHOWROOMS
RESTAURANTS BARS'
OTHER ATTRACTIONS/AMENmES
Source
Spaces
I'to 1'.2 per position
l;2.seats_or^2r3 seats
'2;3;rooms of.'3;4 rooms
l':2ppsq.ft,or3:3D0-sq,^fl.-
1:2 seals
included^
Varies by h/pe/mdikei
Xlaslfoblnson.Q.E'.D.
over $164,000 in^amins" revenue chat week. Since this is:an average week, you will continue to lose Sl64,000 per week every week, or $8.5 million per year.
Maybe your customers are more resilient or more determined. , Maybe you only lose one out of ever)'four instead of half. That still amounts to nearly S4.3 million per year in lost revenue.
VVhac would ic take to get that revenue back? An additional 628 parking spaces would meanthat inan average week there would never be a parking shortage. Now;628 spaces can be expensive to build. Assume there isn't-enough space for that many additional surface spots and you have to build.a^ramp. At a cose of 514,000 per space, that ramp w^ould cost nearly S8:8 million dollars. Wliile that's quite a.sum, the return.on^that investment In terms of extra gaming revenue equals almost 49 percent if you are losing one in lour and a whop]iing 97 percent ac one half!
The e.\ample might not fie your property', but the principle certainly does.,If you are losing customers because of insufficient parking, even just a few customers during jiist a few hours on one or two peak nights, the money you lose in gaming revenue is niore than enough tojustily the cost of building the extra space, even if it's ramp space. In fact, ramp space in general can offer more than just added capacity. Shorter walks from tlie car to the casino equals more time on the gaming floor. Protection from the elements makes it easier for customers to spend their rainy days or sweltering days or snowy days with your casino rather than stuck ac home waiting for better weather. Shorter valet waits, premium parking spots for top players, these and other advantages have caused r-ariips to increase in popularity and importance for casinos across the country.
So how much parking do you need? Table I shows the median and quartile statistics for all U.S. casinos and for sub-categories depending upon what ancillary facilities and amenities they have. For each category, the relevant ratio is described below the line item. For all U^S. casinos and for casinos without hotels, convention space or bingo, the measure is parking spaces per gaming position (tables count for seven
positions). For casinos with bingo halls, the bingo seating is added to the gamijig position count. For casiiios with hotels, the room count is added to the gaming positions. For convention space,the ratio reflects the inclusion of each 100 sq. ft. of space.
lahle 2 provides general rules of thumb by component that scr\'e as a stardhg point. It's important tb reniembcr that these'rules of thumb are minimums for parking and that more is not orily desirable, it may even be necessary. Nore in Table:l chc'.range between the lower arid upper quartiles for each category',,keeping in mind,that one quarter of the U.S. casinos,in cach.categorj' have "even more parking than the upper.quartile ratios shown. In fact, if the hypothetical casino we u.sed for bur example followed the i-ules of thumb shown, •'it would have had even fewer than the 1,200 spaces assumed.
Parking.and profits? Lets call it parking for profits. Tt.has'. long bee riunder'stopd thatganu'ng floors should bc.built large enough to accommodate near peak demand. The same concept applies,CO parking, garages included.-The returns are better than meets";the eye. *
Jaiims'M. Klas is Co-Foiineler and Piincipalof KlasRohiuson Q.E.D, He can lie'.reacimi i y caliing (SOO) 415-S140 or einail
Jkl(is@kla.<rt'olnnsonqed.co?f!.
PERFORMANCE YOU CAN DEPEND ON: • 'Zero defects; no jamming, no downtime
• Easy-lift, banded packs simplify unpacking & loading
• . Multiple plants for expeditious production S: delivery
• Inventory management services
Approved for use by all TITO peripheral equipment OEMs and slot machine manufacturers worldwide
For exceptional service, contact Susan Mitchell
901-377-1849 susa n, mitchelieslot-tickets.co m
vvww. s lot-tickets.com
October 2010 Indian Gaming AS

PITG Gaming, LLC
THE MAJESTIC STAR GASINO, PITTSBURGH TRANSPORTATION AND PARKING ASSESSMENT
FINAL REPORT
DECEMBER 2005 • REV OCT 2006
IBI GROUP

IBI GROUP FINAL REPORT
PITG Gaming; LLG THE MAJESTIC STAR CASINO, PlfTSBURGH
TRANSPORTATION AND PARKING ASSESSMENT
Exhibit 7-1 - Design Levelof Daijy Person Visits
Day
Sunday Weekday
Friday Saturday
Recorded Average Visits (WlSC/Trump
3265 slots) 15600 11500 16500 20200
Estimated:Daily Visits Per Slot
4:8 3.5 5.1 6.2
Estimated Daily Visits Per 5000 Slots
23,890 17,611 25,268 30,934
Daily Visit Design Levels
30,000 20,000 30,000 36,000
Hourly Variation
Hourly arrival and departure patterns were obtained from data measured at Casino Niagara in Niagara Falls, Canada. When,surveyed, Casino Niagara^hadahnual attendance of approximately 10 million per year for a 3,000 slottfacility. The proposed North Shore Casino is expected to draw a maximum of 10 million visits per year. The total inbound.hourly visits as a percentage ofthe daily visits are shown in Exhibit 7-2below.
Exhibit 7-2 - Houriy Variation of Visits
Hourly Distribution - Total Inbound and Outbound Visitation (Assumes Average Four Hour Stay)
/ \ — 7 / A - \ ^"*"-"•, • / " ' ' • • a _
/ xfi// \ \ ' / \ ^*
/ * / \ / ^ ^ V . / ' ' * ^ ^ V ^ *"/• \ \
• ••
• --Typical Weekday
I—FraJay
I— Saturday
:—SunOay
A= ^^ ^^ ,^* . ' ^ ^^ . f ^^ , # -.- ^ .*^ ,^* / ^ ^ / / «^ <^ ^ ^^ V # 4 Hour B«glnning
The number of automobiles entering the proposed North Shore Casino site was calculated using the following assumed parameters, based on Casino Niagara data, but adjusted to reflect a lower percentage of people walking to the site for the North Shore location.
• Automobile modal split: 90% by car {assumes remaining 10% arrives by taxi, charter bus, water taxi or walking); and
December 2005 - Rev Oct 2006 Page 19

Philadelphia Sports Complex Parking and Traffic Management Plan
Philadelphia, Pennsylvania
Prepared For:
Phi ladelphia Industr ia l Deve lopmen t Corpora t ion 2600,Centre Square West, Suite 2600
SW Corner 15^ Street and Market Street Philadelphia, PA 19102
Prepared By:
Langan Engineer ing & Env i ronmenta l Services, P.C. 30 South 17^ Street, Suite 1300
Philadelphia, PA 19103-4099
September 21,2010 220017201
/—: L A N E A N (glM MAHON ^ ^ ^ ^ r ENGINEERING & ENVlflONMejfTAL SERVICES ^^-Hll'IIJ.n;BM;il!MIJj|imjr<;i!l|,ff
30 South 17iti Street, Suite 1300 Philadelphia, PA 19103 1:215.854.0640 F: 215.864.0671 www.langan.com
M-i'.-ji J.iii'sv • F'^ifErvlv:; 111,1 • t jcvi.^ft. • i;Qfinrcli.;i=l • F1-t:<lii • vir^iiiir) • Mrt-j it l - OslJ'woia • .i.,^ll C+aDi • Tnlftii • ^ i ! i *n !

Philadelphia Sports Complex Parking and Traffic Management Plan September 2010
2 Existing Event Parking Analysis
The following is a brief discussion of various large eyents at the existing Sports Complex, including parking demands and a summary of traffic and parking management for events. Events are currently scheduled so that there is ample parking for all events, except for some dual events, v^hen all lots can approach capacity- Table 1 summarizes peak demands for each individual existing use.
Table 1 Single Event Peak Parking Demand Existing Events at the Philadelphia Sports Complex
Event
Wachovia Spectrum/Center Event MLB Game MLB Post-Season Game NFL Game
Peak Single-Event Demand
7,200 •10,000 15,000 18,000
Lincoln Financial Field
Located within the sports complex,^south of Pattison Avenue, Lincoln Financial Field (LFF) Is the home of the NFL's Philadelphia Eagles.. Lincoln Financial Fie(d also hosts Temple University football games and. occasional soccer games, concerts, the Army-Navy football game. From Septeniber 2008 through August 2009, Lincoln Financial Field hosted 21 major events.
Lincoln Financial Field has 68,532';seats for football games. Typically, almost all of the seats are sold for pro football games/however'actual attendance is typically lower due to "no shows". During the 2008 seasons,;the average attendance was almost 96% of capacity. Pre-season game's typically have an attendance of approximately 55,000.
Not every striped on-site space is used for Eagles games, due to parking inefficiencies from tailgating (most,evident in the Wachovia lots), aswell as the availability-of parking in several large off-site private lots. The total supply of striped spaces for NFL games is 19,765 (5,497 spaces at Lincoln Financial.Field, 8,318 spaces at Citizens Bank Park, and 5,959 spaces at the Wachovia complex). There are also about 2,600 overflow parking spaces in FDR Park and in the Naval'Hospital lot.
Citizens Bank Park
The baseball stadium, with 43,647 seats, is the home of the Philadelphia Phillies (MLB). It also hosts occasional concerts.
1 = LAIMGAIM

Philadelphia Sports Complex Parking and Traffic Management Plan .. . . September 2010
Intersection Signalization
The City of Philadelphia Streets Department, Engineering Division, owns, operates, and maintains the traffic signal system enclosed in the Sports Complex area along with all signals within the City limits.
Interconnect
The traffic signals in the system are interconnected with fiber optic cable on three (3) corridors.
1. Broad Street between City Hall to Terminal Avenue 2. Pattison Avenue between'7'*^Streetto f^enrose Avenue 3. Front Street between Oregon Avenue to Packer Avenue
All fiber optic cable is multimode with the exception of Pattison Avenue east of Broad Street which is single mode fiber optic: cable. The. Broad Street and Pattison Avenue corridors are interconnected together. The Front Street corridor is a stand alone system. All fiber optic cable is Ideated in underground conduit.
A gap within the system is on Pattison Avenue from 7* Street to Front Street, When the system is being updated, this gap should be closed.
Controller Cabinet Equipment
The signalized intersections within in the Sports Complex area are equipped with solid state Type 170 coritroller cabinets, image video detection for vehicle detection, along with upgraded pedestrian facilities.including pedestrian countdown Hand/Man signals and ADA compliant handicap ramps.
When the system upgrade is undertaken, complete equipment upgrades are recommended for the traffic signals along Packer Avenue.
Timing
The central hub intersection within the system is located at,Broad Street and Pattison Avenue. The controller cabinet houses a special "manual plan select" panel with four (4) buttons that control traffic signal timings and cycle lengths along Broad Street and Pattison Avenue. The limits of the timing changes along the corridors are as follows;
1. Broad Street between Bigler Street to Terminal Avenue 2. Pattison Avenue between 7' Street to Penrose Avenue
Prior to an event, a Philadelphia Police Department representative opens the controller cabinet at Broad Street and Pattison Avenue and institutes one of the following four (4) programs;
> Program 1: normal operation - 90 second cycle length.
i^LAlMBAM ^ ^ ^ ^ B T f ^ j f t i t r j z Af i i r rKns:^ VTA." r*wn':f>.

Philadelphia Sports Complex parking and Traffic Mahagehnent Plan •Septerhber2010
> Program 2: pre-game operation - 100-second cycle length. Consistent and synchronized green time on Broad Street.
> Program 3: pre-game operation - 120 second cycle length. Designed to move traffic'along Broad StreettoPattison Avenue.
> Program 4: post-game operation - 120 second cycle length. Timing favors Pattison Avenue and progresses traffic flow towards 1-95 and 1-76.
It is important to note that three hours after a program is Instituted norma! operation is supposed to return, it has also been reported through stakeholder discussions that normal operations doesn't alwayS)';resume;within those three,hours, therefore It would be important that operations staff verify that,the.time-out feature is functioning properly.
Intelligent Transportation Svstems
Currently a stimulus driven ITS design buitd project ls:at the 30% design phase named 1-95. GRI ITS. This PennDOT project proposes to install two CCTV cameras on Broad Street and permanent: Variable^ Message. Signs (VMS) along both Broad Street and Pattison Avenue. As stated earlier, this project.is in the early design phase and as such the final locations of-these devices'has not been deterrnihed at the time of this report. The proposed VMS signs are small two line message boards to provide immediate incident manage messages to the motoring public.
Operations
A comprehensive signal plan should be developed - these improvements should be Implemented in conjunction with event day signal programs along the Packer Avenue and Front Street corridors to fully realize thebenefits of thesemeasures,
Figure 5-10 shows existing queues along the Front Street and Packer Avenue corridors for egress froman Eagles event.. After impiementing,the;Signal tirriing changes at Front Street and the 1-76 West off-ramp, andjmproving coordination along the Front Street and Packer Avenue corridors, projected queues may-he reduced to the extents shown in Figure 5-11. A,side benefit.of the^reduced queues and overall improved-operations along the Front Street and Packer.Avenue corridors would likely be a decrease in the number of vehicles using, 10'" Street north df Packer Avenue as an alternate egress route.
Note that additional coordination may be required In the Front Street and Packer Avenue corridors to ensure that the projected benefits are realized. For example, the intersections along these corridors should be coordinated with the new signal timing.
i=LAA/GA/V

Philadelphia Sports Complex Parking and Traffic Management Plan September 2010
Figure 5-10: Queues from the intersections along Front Street typically extend back to and add to congestion on Packer Avenue.
Figure 5-11: Signal timing improvements along Front Street should help reduce queues along Packer Street on egress.
Coordinated Signal Control
In general, the program for post-event conditions may improve egress conditions significantly if it is consistently adhered to. The Front Street signal corridor should be connected to the Broad Street and Pattison Avenue signal corridors. Once all three corridors are connected, a central control point, such as at the Traffic Management Center at the Wachovia Center, should be established from which all the signals can be set to operate on the appropriate ingress or egress program.
The event programs should be triggered at the following times, depending on the event type:
22 i^LAlMGAIM

Gaming Casino Traffic
THE AUTHORS
SUMMARIZE RESUITS
FROM TRAFFIC VOLUME
STUDIES OF TWO
GAMING CASINOS—
THE CASINO ST. CHARLES
AND THE CASINO QUEEN.
GAMING CASINOS GENERATE significant volumes of iraiTic—especially during the evening peak hour. Two studies of existing operations were made in the St. Louis, Mo., USA, metropolitan area, including hourly vehicular volumes and daily variations. Also, the projections from an economic report for a proposed casino were utilized to provide multiplication ftictors for traffic counted in any given month, to that expected during the peak summer months.
Gaming casinos have three general types of positions—individual, such as slots and video poker; table, such as blackjack and poker; and audience, such as Kcno or racing. For riverboat type facilities, a land-side staging area is used. Other customary services include bar and restaurant.
The Casino St. Charles is located in the metropolitan area, west of the Missouri River. It is reported to have about 2,500 gaming positions, about 80 percent of which are slots or video poker machines.
In January 1995, counts of entering and leaving traffic were taken across weekdays, Saturday and Sunday.' For the peak hours, the counts were converted into rates of flow in and out ofthe facilit)' per gaming position and were expanded to the summer peak conditions (see Table 1). The highest weekday traffic occurs on Friday, while the absolute peak hour occurs on Saturday evening.
From the counts, it also was possible to calculate the hourly variation by the days of the week during which counts
BY PAUL C. BOX AND WILLIAM BUNTE
Table^l,(Casino'St.lCha rles;peakihour Yates df^vehicular (flowiper(ganilngippsit)on.
irhursday.facilityipeak •IN (OUT
Thursday street'peak, UN OUT' •
(Friday-'lacility peak IN OUT
'Fridaysucet.peak IN OUT
'Saturday/facility peak IN OUT
'Sunday facility peak IN-OUT
^Expanded to summer p( Source: Ref. 1
18:00 to:i9:00
l_6:30ito (17:30
18:00;to 19i0a
'I6:30itb 17:30
18i00;to 19:00
13:00 to 14:00-16:00 ro 17:00
•aks.
0:25 '0:23
0.19 !0.'23 '
1
;0.29 :o,25
0.19 :0d4
o:34: 0:30
0.25-0.25
42 i n JOURNAL/MARCH 1998
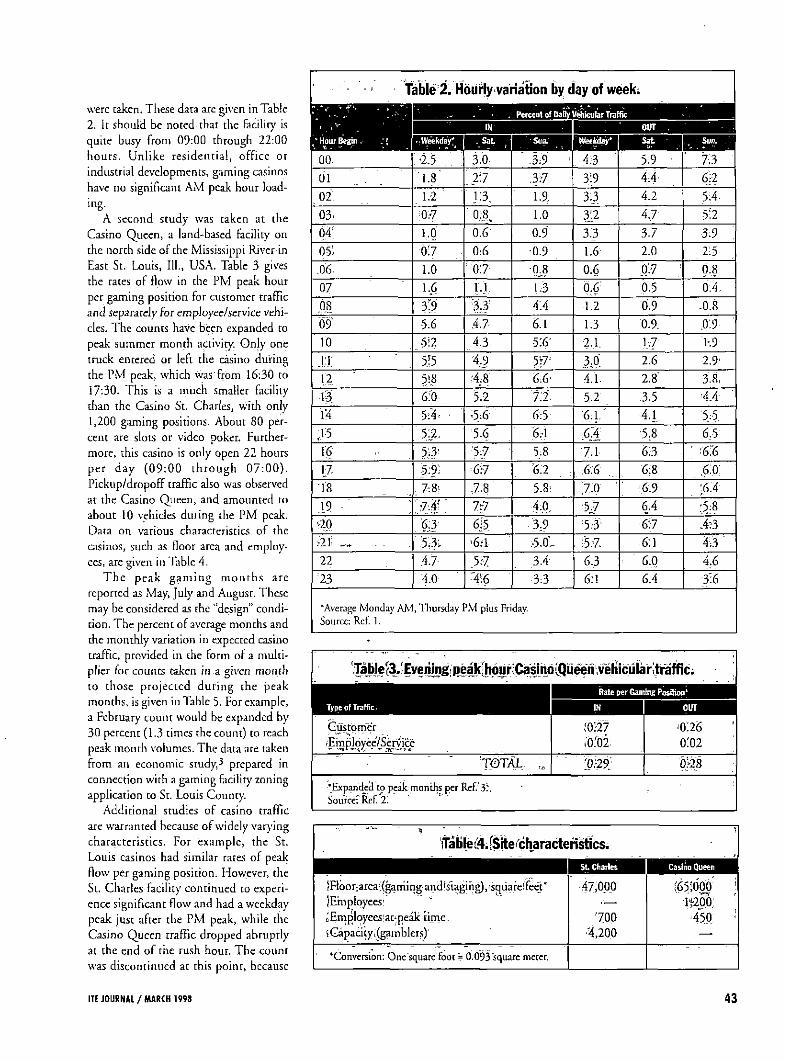
were taken. These data are given in Table 2. It should be notedthat the Facility is quite busy from 09:00 through 22:00 hours. Unlike residential, office or industrial developments, gaming casinos have no significant AiM peak hour loading.
A second study was taken at the Casino Queen, a land-based facilit)' on the north side ofthe Mississippi River in East St. Louis, 111., USA. Table 3 gives the rates of flow in the PM peak hour per gaming position for customer traffic and separately for employee/service vehicles. The counts have bceri expanded to peak summer month activity. Only one truck entered or left the casino during the PM peak, which wasfrom 16:30 to 17:30. This is a much smaller facility than the Casino St. Charles, with only 1,200 gaming positions. About 80 percent are slots or video poker. Furthermore, this casino is only open 22 hours per day (09:00 through 07:00). Pickup/dropoff traffic also was observed at the Casino Queen, and amounted to about 10 vehicles during the PM peak. Data on various characteristics of the casinos, such,as floor area and employees, are given in Table 4.
The peak gaming months arc reported as May, July and August. These may be considered as the "design" condition. The percent of average months and the monthly variation in expected casino traffic, provided in the form of a multiplier for counts taken in a given month to those projected during the peak months, is given in Table 5. For example, a February count would be expanded by 30 percent (1.3 times the count) to reach peak mondi volumes. The data are taken from an economic study,^ prepared in connection with a gaming facility zoning application to St. Louis County.
Additional studies of casino traffic arc warranted because of widely varying charactciistics. For example, the St. Louis casinos had similar rates of peak flow per gaming position. However, the St. Charles facilit)' continued to experience significant flow and had a weekday peak just after the PM peak, while the Casino Queen traffic dropped abruptly at the end ot the rush hour. The count was discontinued at this point, because
table 2. Hourly variation by day of week;
. Percent of DaHv Vehicular Traffic
. 'Hour Begin. j ; ...Weekiiayt 1 . S a t . Sun.
00.
01 02
03-
04';
05;
,06.
07
08
69' 10
J ' l '
1.2'
•13
V4 .15
16
!7 •]'8
19 -
'•20
- 21' . . .
22
"23
'2.5 .,
1.8
1.2
.0.-7
1,0'
0:7
1.0
1.6
3:9
5.6
5!2
5j5
518
6:0
5^4- •
5:2,
5:3^
5:9;
. 7:8!
•.-7:4-"
•6.3
5.3.
.4.7
•4.0
3.0.
2-7
]-3.
0.-8.
0.6
0:6
0 7
1.1,
3.3
.4.7
4.3,
•4,9
:4,8
5.2
'5:6
5.6
'•5:7'
•6:7
-7.8
7;:7
6j5
'6.4
5.'7 '4^6
.3;9
.3:7
I.a 1_.0
0.9
•0.9
•0.8
1:3
4.4
6.1
5:6-
5t7-
6.6-
J . l .
6:5
H 5:8
'6:2
5.8^
IP. 3:9
,=5.0V
3.4
3 3
Vfeekday*
4:3
3:9
3:3
3:2
3.3
1.6
0.6
0:6'
1.2
1.3
2:1.
.3:.0
4.1.
5.2
6.1,
•^li 7:1-
G.6 .
"7-0
^5.7
'5.'3-
•i"57.
6,3
6:1
SJL
5:9 •
4.4
A.l
Q 3.7
2.0
0--7
0.5
0.9
0.9.
1--7 2.6
2.8'
.3.5
4.1
5.8
6.3
6:8
• :6.9
6.4
6:7
6.1
6.0
G.A
. ^ r
7.3
6;-2
5.4. 5:2
3:9
2-;5
0.8
0:4.
-0.8
.0:9
h9
2.9.'
3.8,
A.A
•5-5
6.5
' ^6.6
,6.0:
•(>.A'
:5,^8
i ; 3
4.3
A.C
3:6
'Average Monday AM, Thursday PM pins Friday.
Source: Ret. 1.
,TaJ>]e^3.'Everiing!p^ea klh6urvCas
Rate per Gamine Position'
itable(4;fSltei^charactenstics.
Type of Traffic. IN
Customer
^Einpjoyee/Service
TOTAL ,,
;o: '27 .o.'oi
'00:
OUT
-0:26
0:02
p>28
'Expanctcd [o peak mondis per Ref.'3^ SouiceVRcf. 2.
1 S t Charles Casino Queen
rFlbo t; area ((ganiing and^stagihg), I sqiia re! feet'
)Ernployees!
^Employees;at:peak time
iCapaciiy; (gamblers)
'Conversion: One'sqiiare foot = 0.093'squarc meter.
47,000
700
'^4,200
(65tdp0 ' lt200: .450 '
ITE JOURNAL/MARCH 1998 43

lableSJMdnthly variations
Montli of CoLnt Percent of
Averse Month Multiplier to Expand'
to Seasonal Peak -
lFebrua^y;...^.•.^.^...v^,...^TT:...^.r-..:.v;T;T^vv;..:;v.,;:vr.,,.„jS^^
March ,..,.„.,...~r."r.v.7:r^,n,;v;n.^^^.::.,^l•0i^n.;;.,;.>;.O;^v.vAl•V
April , .n..,.;~.:rlp83^:;;7;..r.iv^.-:;?:.r-l/l
Way. , l:]6%....,,......:.:.r7V.;.-H0
June: ; ;I08% ,, .1.1
July : ! 121%...., 1:0
'August, ,^„:„^.„...^.^.........T.:v...: ; r...., .,..121%..; 1. 0
:September„,,,„„,,^^.^w^..:,.,,^^ -l.!
t0ewb«^v..;;^..,.;;^;.;,,,.,,.,....^.^.;^.„^„,.^^ : 1 ;^-
^NmTn]ber.;..^,^/;..7.:v;;y.,;;v^
.DeCenibe^....,;.;..:.;:r..;-...,:^^;.v.yvy.;T^.,l:;-.VV7;V:-.:;nr:;^;10^^
Source: I Ref. 3.
the scope of study was intended to analyze only the PM street peak hour generation.
The two sites studied have provided useful infotmation on hourly and monthly variation. These data.should guide studies of other sites. Separate counts of customer and employee vehicular traffic, plus trucks, shotild be taken on busy weekdays and perhaps on a Saturday evening, if a street capacity problem is likely. A: some locations, large numbets of patrons may arrive by bus, which relates to geometric design of driveways.
Othet studies of gaming facilities needed include parking generation, which represents a niajor factor. The developrnent of gaming on Native American tribal lands is often away from ot at the fringe of metropolitan areas. Traffic and parking characteristics of these facilities may diffet from those
44 ITE JOURNAl / MARCH 1998

within a metropolitan area. Busing may
tepresent a more significant factor—espe
cially relative to parking layout. •
References
1. Traffic Impact Study for the Ultimate Devel
opment of St. Charles Riverfront Station, Final
Report. Crawford, Bunte, Brammeier, August
1995, unpublished.
2. Study of(2asino Queen. Paul C. Box and
Associaccs Inc., Novcnibcr 1996, unpublished.
3. Horseshoe Gaming, St Louis County Pro
ject. Economics Research Associates, a.'! pre
sented to County Pla/i Commission about
September 1996, unpublished.
PAUL C. BOX, P.H., has about 17years
pfexperittKe working for
cities a nd some 33 years
of experience as a traffic
consultant. He has more,
than 100 publications in
the traffic engineering
fieldy has lectured exteiuively and has chaired a
number of ITE Standard Practice technical
committees. He is d Fellotv and Life Member of
ITE.
WILLIAM F.
BUNTE,
P.E:, receivedhis
bachelor's and mas-
'ter's degrees in civil
. engineering from the
University of Illinois.
During the past 32
years he has provided traffic and transportation
engineering consulting services for a variety af
private and public clients. He currently is a
partner in the firm of Crawford, Bunte,
Brammeier. He is a Fellow of ITE.
ITI JOURNAL/MARCH 1998 45

Executive Summary of the
INTERIM
Philadelphia Gaming Advisory Task Force

TnteriiTi Report of Findings iri Brief | 1.1
TABLE 3: Casino Visitation Patterns by Time of Day
. t - ; - - ; •..
J
Monday
Thursday
Friday
Saturday
Sunday
• . ,
1
i average
peak
average
peak
average
peak
average
peak
•"Moming; •
I-18-Ila .
[ - . " .i 8%
10%
7%
9%
9%
11,5%
7.5%
10%
Aftern'ooJi «:
^y;fa^i4p ' ;
30% '
33%
1S%
2 1 %
24%
26.5%
29%
31.5%
Adj.'iTo'
(34iour.. •penod '
18%
19,8%
10,8%
12,6%
14,4%
15,9%
17,4%
18,9%
Rush Hour
/4p'r7p:" ' ' : ' !
17%
20%
12%
15%
15%
17;5%
20%
22,5%
"Evening
^JR-IOP' ^
18.5%
20%
18%
22%
17:5%
•'22%
18,5%
21%
Night Graveyardi, •
^lOp-^ai'
14,5%
17%
18%
20.5%
16.5%
19%
14%
16%
Cla'^a; . . " |
12%
14%
27%
30%
18%
20.5%
11%
13%
Adj/ToJ
J3-hbuf \ Wia.-.-J-,. •; penod f
5.1%
6.0%
11.6%
12.9%
7.7%
8.8%
4.7%
5.6%
Source: Iruiovation Group
Mode of Arrival
With up to 5,000 slot machines per gamitig facility' and between 12,000 and 36,000 \nsirors per day, traffic and parking demands generated by Philadelphia slots-only casinos will be substanidal. Understanding how gamers are likely to arrive at PliiladelpWa slots parlors is a necessar}' first step iii assessing the potential traffic impacts associated with casino development. Graph 2 displays the expected t)'pical distribution of trans por tatitjn modes for a casino located in a given area of the City.
Private automobile will be the overwhelming preferred mode of arrival at Pliiladelpliia gaming sites, with more than half of gamers expected to drive to a casino in or near Center Cit}', and more than three-quarters arriving by car at other sites in the city. Philadelphia casinos are expected to rely on chartered buses significandy less than Atlantic Cit\% but suU will draw approximately 8 percent of their visitors bv coach.
Public transit share would be significant only for casinos located in Center Cir\" and,.to a lesser degree, at Penn's Landing. Despite Philadelphia's extensive transit infrastructure, it is anticipated that no more than 20 percent of casino customers would arrive via transit at a Center City site, and as Ktrie as two percent for a site along the South Delaware.
More tiian half of regional survey respondents (52 percent) claim diat having public transportation proximate to a Philadelphia casino would be important to them. However, current behavior heavily favoring personal automobile use — 83 percent of respondents said they drive into the cit)' for leisure activity -suggests that while people may think transit is important in general or for others, they personally will continue to drive.
Pedestrian volume to Philadelphia casino locations will be minimal except for Center Cit\' or Penn's Landing locations, and taxi volumes would be maxiiniiced at sites in, or close to, Center Cit\'.

16 THE PHILADELPHIA GAMING ADVISORY TASK FORCE
GRAPH 2: Mode of Arrival
nPectesttn
• Taxi
• Cas'noBis
o PuHic Trarsft
DAuto
CenterCiy Penn's Landing florti Delaware South Delnvare l-7GfRl1AR
Source; Innovation Group
Transportation Access Analysis
In order to assess traffic impacts, the Task Force conducted a detailed analysis of existing and projected traffic volumes on streets surroutiding potential gaming sites, as well as an engineering review of the capacity of those streets and intersectitins to carr}' the increased volumes. A summary of current traffic volutiies on major roads near potential gaming sites and the projected additional traffic demand generated by casino development at each site are presented in Tables 4 and 5. For each site, the numbers in the first row are current traffic volumes based on electronic coutits of vehicles conducted during May 2005. The second row shows
the estimated number of additional vehicles on weekdays and Saturdays if a slots-only casino were to be placed at that location. The. estimates van' between sites for two main reasons: (1) Based on Task Force projections, different sites will experience different levels of visitation based on tiieir var\ang proximit)' and accessibiiit}' to patrons and (2) it is estitnated that some sites will draw more patrons by public transit and therefore the number of automobiles would be less.
It is important to note that conclusions about potential congestion -problems at these sites cannot be drawn without analyzing projected traffic volumes witliin the context of existing roadway and intersection capacity and without an understanding of peak traffic volumes. A projected sharp increase in traffic volume


PHASE I ENVIRONMENTAL SITE ASSESSMENT
The Turf d u b 700 Packer Avenue
Philadelphia, Pennsylvania 19148
Submitted To:
Mr. Alex Stolyar, Vice President, Corporate Development Penn National Gaming, Inc.
825 Berkshire Boulevard Wyomissing, Pennsylvania 19610
r > __j Submitted By:
Pennoni Associates Inc. One Drexel Plaza
3001 Market Street Philadelphia, Pennsylvania 19104
Jennifer L. Higgins Project Envirormiental Scientist
Williain F. Schmidt, PE Associate Vice President
Prqj. No. PNGI 1201 November 6. 2012

TABLE OF CONTENTS
Page
EXECUTIVE.SUMMARY iii Findings and Opinion iii Conclusions iv
1.0 INTRODUCTION I 1.1 Purpose 1 1.2 Scope of Work , 1 1.3 Limitations, Exceptions, Special Terms and Conditions 2 1.4 User Reliance , 2
2.0 SUBJECT PROPERTY DESCRIPTION 3 2.1 Property Location and Legal Description 3 2.2 Subject Property Characteristics 3
2.2.1 Current Use of the Subject Property 3 2.2.2 Site Structures...., 3 2.2.3 Site Utilities -...._ 3
2.3 Current Uses of Adjoining Properties and Properties in the Surrounding Area 4
3.0 USER PROVIDED INFORMATION 5 3.1 Chain of Title Information 5 3.2, Environmental Liens and/or Activity and Use Limitations 5 3.3 Specialized Knowledge and Interviews 5 3.4 Commonly Known or Reasonably Ascertainable Information 5 3.5 Valuation Reduction for Envirormiental Issues 5 3.6 Presence or Likely Presence of Contamination at the Subject Property 5 3.7 Previous Reports 6
4.0 PHYSICAL SETTING 7 4.1 Topography/Regional Drainage. ; •.... 7 4.2 Soils 7 4.3 Underlying Formation 7 4.4 Groundwater 7 4.5 Water Migrator)' Pathways 8
5.0 HISTORICAL RECORDS 9 5.1 Aerial Photographs 9 5.2 Historical Maps 10 5.3 Propertj'Tax Files 11 5.4 Recorded Land Title Records 11 5.5 Historical Topographical Maps 11 5.6 Local Street Directories 11 5.7 Building Department Records 11 5.8 Zoning/Land Use Records 11 5.9 Previous Environmental Reports 12

6.0 REGULATORY AGENCY RECORDS REVIEW ,.., 13 6.1 Standard Environmental,Record Sources, Federal and State 13
6.1.1 Subject Property d4 6.1.2 Vicinity Properties - Facilities of Potential Concern 14 6.1.3 Orphan Sites ,.....,,. 15
6.2 Additional Environmental Records Sources- Stateand Federal 15 6.2.1 Pennsylyania Department of Environmental Protection....... 15 6.2.2 United States Environmental Protection Agency 15
6.3 Additional Enviromnental Records Sources—Regional and Local 15 6.3.1 Philadelphia Water Department 15 6.3.2 City of Philadelphia Department of Licenses and Inspections 15
7.0 SITE RECONNAISSANCE. 17 7.1 General Obser\'ations - Exterior Areas 17 7.2 General Observations - Interior Areas 17 7.3 Hazardous Substances in Connection with Identified Uses 17 7.4 Storage Tanks .' , 18 7.5 Floor Drains and/or Sumps 18 7.6 Other Obser\'ations :. 18 7.7 Polychlorinated Biphenyls (PCBs) 18
7.7.1 Transformers and Capacitors 19 7.7.2 Fluorescent Light Ballasts 19 7.7.3 Elevators and Hydraulic Equipment 19
7.8 Non-Scope Considerations 19 7.8.1 Asbestos-Containing Material (ACM) 19 7.8.2 Lead-Based Paint : 21 7.8.3 Lead in Drinking Water 22 7.8.4 Wetlands 22 7.8.5 Radon Gas 22 7.8.6 Mold 22
8.0 DATA GAPS AND DEVIATIONS 24
9.0 ENVIRONMENTAL PROFESSIONAL STATEMENT AND SIGNATURE 25
10.0 REFERENCES .; 26
APPENDICES A Figures B Environmental Database Report C Supporting Documentation D Photographs

EXECUTIVE SUMMARY
On behalf of Penn National Gaming, Inc. (Client), Pennoni Associates Inc. (Pennoni) has performed a Phase i Environmental Site Assessment (ESA) of the propert>' located at 700 Packer Avenue in Philadelphia, Pennsylvania. The subject, property consists of approximately 13.35 acres of land improved with an apprbximateiy 120,218 square foot mixed use commercial building.
Pennoni conducted the ESA in general conformance with the scope and limitations of the American Society for Testing and Materials (ASTM) Standard Practice for Environmental Site Assessments: Phase I Environmental Site Assessment Process, Designation E 1527-05. ASTM E 1527-05 is a voluntar>' consensus standard that constitutes "all appropriate inquiry into the previous ov\Tier ship and uses ofthe propert}' consistent with good commercial or customar>' practice." The procedures included in the ASTM E1527-05 standard comply with the United States Environmental Protection Agency (USEPA) 40 CFR Part 312, Standards and Practices for All Appropriate Inquiries; Final Rule.
The primar)' objective of the Phase 1 ESA was to identify recognized enviromnental conditions (RECs) in connection with the subject propert>'. A REC is defined as the presence or likely presence ofany hazardous substance or petroleum products on a property under conditions that indicate an existing release.a past release, or a material threat of release of any hazardous substances or petroleum products into structures on the property or into the ground, groundwater, or surface water ofthe property.
To identify RECs in connection with the subject property, Pemioni's Phase I ESA included a records revievv, a site reconnaissance, interviews with owners, operators, and occupants ofthe subject property, interviews with local, state, and federal government, officials, a review of information provided by the User (i.e., the party seeking to complete an enviromnental site assessment ofthe subject property); and preparation of a report presenting Pennoni's findings, opinions, conclusions and supporting documentation. The Phase I ESA for the subject propert>' did not include any testing or sampling of materials (e.g., soil, water, air, building materials).
Our findings, opinions, and conclusions regarding RECs in connection with the subject property are summarized below. Results of our evaluation of non-scope considerations including wetlands, fiood zones, and radon are also summarized below.
Findings and Opinion
The key findings of Pennoni's Phase I ESA for the subject property are presented in the table below.
FINDINGS SUMMARY TABLE
; Arcajof Concern Historical Review On-Site Industrial Operations User Provided Information Adjoining Properties of Concern
Not: Idenfificd/No
Significant) Finding
X X
X
• mif I wits
ASTM Nonr Scope
REG/ HRF:G
X
, Further Action Recommended
YES
Ul

Area^of Concern . Regulator}' Agency Review Hazardous Substances Storage Tanks Floor Drains/Sumps Other Issues - stains and corrosion,.drains, sumps, stressed vegetation, solid waste, septic systems, etc. PCBs Asbestos-Containing Materials Lead-Based Paint Wetlands Radon
Not ' " identificd/Nd'
Significant Finding.
X X X
X
X X
) De minimis:
'
X
• ASTM- Non-
,_ Scope/
X X
.REC^ HREC
X
Eurtlier Action Recommended
YES
YES YES YES
Conclusions
This assessment has revealed the following RECs or conditions indicative of releases or threatened releases of hazardous substances on, at, in or to the subject property:
1. Reyiew ofthe 1951 historic Sanborn map reveals the former ,use ofthe subject property as a Gily Dump/Public Dump. .Historic dumping of unknown materials may have impacted subsurface soil and groundwater beneath the subject property. Pennoni recommends that a subsurface soil and groundwater investigation be performed to detennine if regulated compounds are present in either media at concentrations exceeding the Pennsylvania Department of Environmental Protection (PADEP) Residential or Non-Residential Used Aquifer Statewide Health Standards.
2. Pennoni obser\'ed evidence of six (6) below-ground hydraulic lifts which appear to have been removed and filled within the vacant truck repair garage on the subject propert}'. Controls for the six (6) underground lifts were also observed along the walls ofthe building. The condition ofthe hydraulic fluid supply lines that formerly provided hydraulic oil to the underground cylinders is not known. There is a potential that subsurface soils in the vicinit>' of the lifts may have been impacted with concentrations of polycyclic aromatic hydrocarbons (PAHs) and polychlorinated biphenyls (PCBs) at concentrations exceeding PADEP Residential or Non-Residential Used Aquifer Statewide Health Standards as a result of releases from the hydraulic fluid supply lines. Pennoni recommends that a subsurface soil investigation be conducted within the vacant truck garage building to evaluate soil quality in.the vicinity ofthe lifts.
3. Pennoni observed floor drains throughout the vacant truck repair garage on the subject property. Pennoni also obser\'ed two (2) manhole covers which appear lo be access ways for an oil/water separator within the building; however,, the presence of an. oil/water separator could not be verified. Notable staining was not observed in the vicinity of the drains and no chemical or petroleum odors were noted; however, the integrity of a holding tank associated with the oil/water separator could not be verified. Therefore, subsurface soils in the vicinity of the suspect oil/water separator may be impacted with regulated compounds at concentrations
IV

exceeding the PADEP Residential or Non-Residential Used Aquifer Statewide Health Standards. Peimoni recommends that a subsurface soil investigation be conducted in the vicinity of the oil/water separator holding tank.
Additionally, Pennoni has identified the following de minimis conditions in connection with the subject property:
• Pennoni obsen'ed a pad-mounted transformer located in the southeast corner of the subject propert>^ Pennoni did not observe a placard indicating the PCB-content of the transformer. No evidence of leaking or staining was obser\'ed on the concrete pad or grass surrounding the transformer.
•• Fluorescent lights were observed throughout the subject property buildings. Based on the age of the buildings of the subject property building, it is possible that the ballasts contains PCBs. Evidence of staining or leaking was not observed in the vicinity of the fluorescent lights; however, it would be prudent to check the lighting for PCB labeling prior to disposal.
Pennoni has also identified the following ASTM Non-Scope Considerations in connection with the subject property:
• No ACM was definitively identified during this ESA and.no sampling was perfomied. During the site visit; however, some suspect materials were ob'ser\'ed within the subject property buildings. The materials include, but are not limited to, 12 x 12 in. vinyl floor tile and 2.x 2 ft. ceiling tile. The obser\'ed suspect materials appeared by be infair'to good condition. Whether or not these materials are asbestos containing can only be confirmed by manufacturer knowledge or by collecting samples ofthe materials and having them analyzed by an accredited laborator>'. Prior to renovations or demotion, an ACM survey should be performed.
• No LBP was definitively identified during the ESA; however, the subject propert}' buildings would be expected to have one or morelayer of LBP based oh'the datesof construction. Testing ofthe paint can be performed to determine if any ofthe older layers are lead containing, or the materials can merely be presumed to be LBP and, subsequent to receiving proper notice ofthe potential presence of LBP on or,in the structures, renovation or demolition contractors can take appropriate precautiohar>' measures to prevent worker exposure and proper handling during renovation or demolition activities.

1.0 INTRODUCTION
On behalf of Penn National Gaming (Client), Pennoni Associates Inc. (Pennoni) has performed a Phase 1 Environmental Site Assessment (ESA) ofthe property located at 700 Packer Avenue in Philadelphia, Pennsylvania.
Pennoni conducted the Phase I ESA in general conformance with the scope and limitations of the American Societ>' for Testing and Materials (ASTM) Standard Practice for Environmental Site Assessments: Phase I Environmental Site Assessment Process, Designation E 1527-05. The procedures included in the ASTM E1527-05 standard comply with the United States Enyironmental Protection Agency (USEPA) 40 CFR Part 312, Standards and Practices for All Appropriate Inquiries; Final Rule.
ASTM E 1527-05 is a voluntar}' consensus .standard that constitutes "all appropriate inquiry into the previous ownership and uses ofthe property consistent with good commercial or customar>' practice." The ASTM practice is intended to permit a User (i.e., the party seeking to complete an environmental site assessment ofthe subject property, in this case, Penn National Gaming, Inc.) to satisfy one ofthe requirements to qualify for the innocent landowner, contiguous propert)' owner, or bona fide prospective purchaser limitations on Comprehensive Environmental Response, Compensation and Liability Act (CERCLA) liability (i.e., landowner liability protections or LLPs). The practice does not address whether requirements in addition to all appropriate inquiry have been met in order to qualify for LLPs (e.g., continuing obligations not to impede the integrity and effectiveness of AULs, the duty to take reasonable steps to prevent releases, or the duty to comply with legally required release reporting obligafions).
ASTM E 1527-05 does not include any testing or sampling of materials (e.g., soil, water, air, building materials).
This report presents the findings, opinions, and conclusions, and supporting documentation for the Phase I ESA of the subject property, completed by Pennoni as of the date of this report. Information made available lo Pennoni after this date,, which would change the conclusions of this report, will be forwarded upon receipt.
1.1 Purpose
The purpose of the assessment was to identify recognized environmental conditions (RECs) in connection with the subject property. A REC is defined as the presence or likely presence of any hazardous substance or petroleum products on a property under conditions that indicate an existing release, a past release, or a material threat of release ofany hazardous substances or petroleum products into structures on the property or into the ground, groundwater, or surface water, of the propert>'.
1.2 Scope of Work
Pennoni's Phase I ESA for the subject propert}' included a records review, site recomiaissance, interviews with owners, operators, and occupants of the subject property, inter\'iews with local, state, and federal government officials, review of information provided by the User, and preparation of this report presenfing Pennoni's findings, opinions, conclusions and supporting documentation.
The enviromnental professionals responsible for the preparation of this Report have the specific qualifications based on education, training, and experience to assess a property ofthe nature, hislor>', and
I

setting ofthe subject property. The Report was reviewed by Mr. William Schmidt, PE, Associate Vice President of Pennoni Associates Inc. Mr. Schmidt was supported by various staff, including Ms. Jennifer Higgins, Project Environmental Scientist, with Permoni. Mr. Schmidt and Ms. Higgins meet the definition of an "Environmental Professional" as defined in the ASTM standard and AAI regulation. The Environmental Professional Statement and Signature are presented in Section 9.0 of this report.
1.3 Limitations, Exceptions, Special Terms and Conditions
Pennoni conducted a Phase I ESA of the subject property in general conformance with the scope and limitations of ASTM Standard E 1527-05. The Phase 1 ESA for the subject property did not deviate from this standard. Data gaps that would affect the ability ofthe environmental professional to identify conditions indicative of releases or threatened releases of pollutants, contaminants, petroleum and petroleum products are idenfified in Section 8.0 of this report. This Phase I ESA is presumed lo be valid provided it has been completed less than 180 days prior to the acquisition ofthe subject property or the date ofthe intended transaction. Recognizing that the,passage of time affects the information provided in the reports; our opinions relating to site conditions are based upon information that existed at the time our conclusions were formulated.
1.4 User Reliance
This Report and findings, conclusions, and recommendafions contained herein, are furnished forthe sole use and benefit ofthe Client to aid in understanding the environmental condifion and potential liabilifies ofthe subject propert>'. This Report may not be assigned, quoted, reproduced, relied upon, or otherwise used without the express prior written consent of Pennoni.
All documents prepared by Pennoni Associates Inc. are the instruments of service in respecl of the project. They are not intended or represented to be suitable for reuse by owner or others on extensions ofthe project or on any other project.
Any reuse without the written verification or adaptation by Pennoni Associates Inc. for the specific purpose intended will be al owner's sole risk and without liability or legal exposure to Pennoni Associates and owner shall indemnify and hold harmless Pennoni Associates Inc. from all claims, damages, losses, and expenses arising out of or.resulling there from.
2.0 SUBJECT PROPERTY DESCRIPTION
The following paragraphs provide a description of the subject property including its location, general characteristics, and current use. Current uses of adjoining properties and properties in the surrounding area are also described below.
2.1 Propert}' Location and Legal Description
The subject property is located in Philadelphia, Pennsylvania-along the south side of Packer Avenue between I)arien and South 7"' Streets. The property can be found on the United States Geological Sur\'ey (USGS) 7.5- minute topographic quadrangle for Philadelphia. Pennsylvania-New Jersey at map coordinates longitude 75.162093 West, latitude 39.908892 North. A copy of a topographic map is provided in Appendix A.
The subject property is idenfified on the City of Philadelphia Tax Map 48-S-02 as Tax Parcel 0072. A copy ofthe City of Philadelphia Tax Map depicting-the subject propert>' is included in Appendix A.
2.2 Subject Propertj' Characteristics
The following paragraphs describe the general characteristics of the subject property, including its current use and a description of structures; roads, and other improvements (i;e., heafing/cooling system, sewage disposal, source of potable water, etc.) on the subject property.
2.2.1 Current Use ofthe Subiect Propertv
The subject property is idenfified as an approximate 13"35 acre area occupied by the Philadelphia Turf Club off-track betting facility which includes tenant space occupied by the Pennsylvania Lottery offices, Catch Packer Recovery Program; PharmDoor, Verifone, and Packer Avenue Foods. The subject property also contains a^vacant truck repair garage.
2.2.2 Site Structures
The subject property is improved with an approximately 120,218 square foot mixed use commercial building which contains an off track betting lounge, vacant warehouse space, warehouse space occupied by Packer Avenue Foods, a garage used for installation of taxi radios by Verifone, and office space occupied by PharmDoor, Catch Packer Recover}' Program, and.the Pennsylvania Lottery. Additionally, the subject property contains an approximately 9,000 square foot vacant truck repair garage. Based on a review of historical documentation, the subject property buildings were constructed in 1969.
2.2.3 Site Utilities
The subject property is serviced by standard utilities. Sanitar>' sewer and water service are provided by the Philadelphia Water Department. Electrical ser\'ice is provided by PECO and natural gas.service is provided by the Philadelphia,Gas Works.

2.3 Current Uses of Adjoining Properties and Properties in the Surrounding Area
Adjoining properties, and properties and roads in the area surrounding the subject property, are identified below.
• North - Packer Avenue borders the subject property to the north, followed by a grass area and I-76, the Schuylkill Expressway.
• South - A warehouse building is located adjacentto the south.of the subject property, followed by a parking lot for Citizens Bank Park.
• East - South 7* Street is localed adjacent to the east ofthe subject property, followed by an industrial property occupied by Sysco Philadelphia.
" West - South Darien Sireet borders the subject property to the west followed by a Holiday Inn hotel.

3.0 USER PROVIDED INFORMATION
3.1 Chain of Title Information
Chain of title informaiion was nol provided by the User for review and inclusion in this report.
3.2 Environmental Liens and/or Activit>' and Use Limitations
jThe Client is not aware ofany environmental liens that are filed or recorded against the subject property'.' 'Furthermore, the Client is not aware of any acfivity and use limitations (AULs) (e.g., engineering controls, land use restrictions, or insfitutional controls) that are in place on the subject property or that have been filed or recorded in a registry under federal, tribal, state; or local law. Pennoni reviewed the current deed for the subject property as part of this Phase I ESA; based upon this review, Pennoni has concluded that the subject property' is not subject to enviromnental liens, institutional controls, oi] engineering conlrolsj
3.3 Specialized Knowledge and Interviews
(The Client does not have any specialized knowledjTe or experience related to the subject property or nearby properties]
According to Mr. Frank Coslello, representative ofthe subject properly ov\'ner, Philadelphia Suburban Development Corporalion, who was interviewed during the site inspection, the vacant warehouse space located on the first floor ofthe Tui'f Club building was formerly occupied by a tire.dealer and a hardware store. Mr. Coslello also informed Permoni that the Iriick garage on the subject property has been vacant for a while: however, a more specific estimate ofthe amount of time was not known.
3.4 Commonly Known or Reasonably Ascertainable Information
[The Client is not aware of commonly known or reasonably ascertainable infonnation about the propertVj that would help the Environmental Professional to identify conditions indicative of releases or threatened releases. The Client is not aware of specific chemicals that are present or once were present on the subject property; spills or other chemical releases that have taken place at the subject property, or an}', environmental cleanups that have taken place at the subject property]
3.5 Valuation Reduction for Environmental Issues
3n the Client's opinion, the purchase price being paid for subject property reasonably reflects tlie faiij market value ofthe subject property'.'
3.6 Presence or Likely Presence of Contamination at the Subject Propert>i
Based on their knowledge and experience related to the subject property, the Client is not aware of an>j obvious indicators that point lo the presence or likely presence of contamination at the subject property]

3.7 Previous Reports
Previous environmental reports pertaining lo the subject property were not provided by the User for review and inclusion in this report.

4.0 PHYSICAL SETTING
4.1 Topography/Regional Drainage
The subject property is localed on the Philadelphia, PA-NJ 7.5-minule USGS topographic quadrangle al an approximate elevation of 20 feel above mean sea level. Surface water on the subject propert>' is expected to runoff the impervious areas of the subject property via sheetflow and drain into the Philadelphia Water Department storm water inlets located throughout the asphalt-paved parking areas of the subject property. Storm water running offthe properl}' is expected lo ultimately discharge lo the east towards the Delware River, which is localed approximately 1.45 miles to the east ofthe subject property.
4.2 Soils
A review of the USDA-NRCS Web Soil Survey published by the United Stales Departmenl of Agriculture-Soil Conser\'ation Service (USDA-SCS) revealed that the soils present on the subject property consist primarily of Urban Land (UR) soils. This land type consists of cut and fill areas, most of which have been developed for residential, cormnercial,-or industrial use or for multilane highways. During development, the original soil horizon was destroyed in al leasl 70^percenl ofthe area. Areas of both cut and fill are moderately or rapidly permeable. Where the original soil was removed and the substratum exposed, the material remaining is rapidly permeable and extremely low in organic-matter content and fertilitj'.
4.3 Underlying Formation
Based on the Pennsylvania Departmenl of Conservation and Natural Resources (DCNR), Bureau of Topographic and Geological Sur\'ey's Physiographic Provinces of Pennsylvania (Map 13). 4' Edition, 2000, the subject property lies within the Atlantic Coastal Plain Physiographic Province, which'consists of unconsolidated to poorly consolidated sand and gravel, which are underlain by highly folded and faulted schist, gneiss and olher melamoiphic rock. The underlying formation, as determmed by DCNR's Atlas of Preliminary Geologic Quadrangles (Map 61), Fourth Series, 1981 and the Geologic Map of Penn.sylvania (Map 7), 3' '' edition, 1990, is the Quaternary-aged Trenton Gravel Formation (geologic symbol Qt).
According lo DCNR's Engineering Characteristics of the Rocks of Pennsylvania (Environmental Geology Reporl I), 2nd edition, 1982, the Trenton Gravel is approximately 30 feet thick and consists of gray to pale-reddish-brov\Ti, very gravelly sand, inter-bedded with cross-bedded sand and silt layers. The Trenton Gravel occurs at between 0 and 20 feet above mean sea level in the Delaware River Valley and was deposited by the alluvial processes ofthe Delaware River. Porosity and permeability are high and wells may have yields in excess of 1,000 gallons per minute.
4.4 Groundwater
Groundwater is expected lo flow to the east, parallel to the surface gradient. Groundwater would be expected to be located in the joints and fractures of the underiying formation. In order lo further detennine groundwater conditions on the subject property, however, a property-specific hydrogeologic investigation would be necessar\'.

4.5 Water Migrator}' Pathways
Potential migrator)' pathways for surface water and groundwater entering and exiting the subject property are important in establishing the'potenfial for surrounding areas to impact the subject propert>' or for the subject property to impact neighboring properties that are down gradient. Local topography slopes slightly lo the east. Surface water and groundwater, therefore, are expected'to migrate from the properties localed lo the west. Storm drainage and surface water flow drains into storm water inlets located on the subject property into the Philadelphia combined sanitar)' and storm water system. Regionally, the area is drained by the Delaware River, which is located approximately 1.45 miles to the easlof the subject propert>'.

5.0 HISTORICAL RECORDS
The purpose of consulting historical records is to develop a histor>' of the previous uses of the subject property and stirrounding area in order lo help idenfify the likelihood of past uses.having led'to RECs in connection with the subject property.
ASTM E 1527-05 requires idenlification ofall obvious uses of the subject property from the present, back tothe subject property's first developed use (including agricultural uses and placement-of fill dirt), of back to 1940, whichever is earlier. As such, Pennoni reviewed. as;many ofthe standard historical sources (i.e:, aerial photographs, fire insurance maps, property tax files,- recorded land title records, USGS topographic maps, local street directories, building,department-records, zoning/land use records, etc.) as were necessaiy and both reasonably ascertainable; and practically reviewable^ (i.e., publicly available, obtainable from its source within, reasonable time and cost constraints). In addition, the historical sources must be determined to, be sufficiently usefijj by the environmental,professional.
5.1 Aerial Photographs
Available aerial photographs were obtained from Environmental Data Resources, Inc. in an effort to detennine past uses and conditions of;the subject, property: Aerial photographs were reviewed for the years 1940, 1957' 1967, 1981, 19^9,(2005 and 20:10, with a,scal_e of one ;(l),inch to 500 feef Copies of the aerial photographs reviewed by Pennoni are included in Appendix A. The- following is a brief narraliveof the. aerial photographs reviewed-:
" 1940 - The subject property and surrounding properties to the south, east and west consist of vacant land. South 7 Streei is visible to the east offthe subject-propert}'. Railroad tracks are visible lo the north ofthe subject property.
• 1957 - N o significant changes tothe subject property. pi;.surroundingproperties to the south, east or west were observed frorn the 1940,photograph, 'fhe.railroad tracks formerly located to the north'of the subject property have been replacedby^heSchuyikill-Expressvvay.
•• 1967 - The current Turf Club and garage bliildings are visible on the' subject property: Packer .Avenue is visible to the north of the subject'property, .followed by a baseball, field and the Schuylkill-Expressway, andvlhe current Avarehouisebuilding'is visible to iKe south.. Darien Streei .now borders4he subject propert)' totlie west^ahdfan'iriduslrial,building is visible to the east ofthe subject property across South 7 ' Streei.
" 1981 - No significant changes to the subject property were^observed from the 1967 photograph. The ciiirenl hotel building is visible to.the west ofthe subject property and a new on-ramp to the Schuylkill Expressway has been constructed to the north ofthe subject property across'Packer Avenue.
• 1999 - No significant changes lo the subject properly or surrounding'area were observed from the 1981 photograph.
° .2005.- No significant changes to the subject properly or surtounding^ area were obsen'ed from the 1999 photograph, except that.Citizens Bank Park has.been cohstrucled lo the southwest ofthe subject property.

• 2010 - No significant changes lo the subject properly or surrounding area were obser\'ed from the 2005 photograph, except that a new industrial building has been constructed to the southeast ofthe subject property.
5.2 Historical Maps
Available Sanborn Fire Insurance Maps were obtained from FirstSearch Technology Corporation to determine past uses and conditions ofthe subject property. Sanborn Fire Insurance maps for the subject property and surrounding area were reviewed for the years 1922, 1951, 1976, and 1978. A copy ofthe Sanborn map reviewed by Pennoni is included in Appendix A. Historic property atlases and Land Use Maps obtained from the Greater Philadelphia GeoHistory Network website published by the Philadelphia Area Consortium of Special CollecUons Libraries, werealso reviewed in order to detennine the pasl uses and conditions ofthe subject properly. Historic Aliases were reviewed for the years 1862, 1895, and 1910; Land Use Maps were reviewed for the years 1942 and 1962. The following is a brief narrative ofthe historical map review:
• 1862 - No structures are depicted on the subject property'. Hollander Creek is identified ninning through the property. South 8*" Street is idenlified Ihrough the subject property; neilher Packer Avenue nor Darien Sireet are depicted on the map.
•" 1895 - No significant changes to the subject properly or surrounding area were observed from the 1862 map, except that the Hollander Creek is no longer depicted. The subject property is identified as part of Girard Estate.
• 1910 - No significant changes to the subject property were observed from the 1895 Atlas.
• 1922 - The subject property contains several dwellings and farm structures, idenlified as coops. Southwark Avenue, Geary Sireet, South 8 ^ Streei, and Curtin Avenue all run through the subject property. Southwark Place is idenlified on the southern portion of the subject property and a canal is depii^led along the southern border of the subject propert>'. Railroad tracks arid a car and power house are-depicted to the north ofthe subject property, across Packer Avenue. The car and power house contains two (2) lank structures which are identified as air compressors.
• 1942 - The subject property is identified as vacant land and farms. No significant changes to the surrounding properties were observed from the 1922 map.
• 1951 - The subject property contains two (2) structures, idenlified as dwellings and is labeled as City Dump/Public Dump. Southwark Avenue still runs through the subject property in addition to several unopened streets including Curtin Avenue, Gear)' Street, and South Franklin Sireet. Darien Street is identified lo the west ofthe subject property and is labeled as not opened. A canal is identified along the southern border of the subject properly, followed by residential dwellings localed along Soulh 7' Sireet. Railroad tracks are depicted to the north ofthe subject property, across Packer Avenue.
• 1962 - The use ofthe subject property and surrounding properties are not identified.
10

• 1976 - The subject property is improved with the current structures. The Turf Cliib building is identified as Abbott's Dairies a Division of Fairmont Foods Co.; the map indicates that the building was constructed in 1968. The use ofthe garage structure on the subject property is nol idenlified. The adjacent property to the west contains the cunent hotel structure identified as the Philadelphia Hilton Inn. The warehouse building to the south ofthe subject property is identified as Cason Packing Co. The adjacent properties lo the east across South 7'* Streei are identified as Perloff Bros. Inc. (wholesale grocery and produce), and the Cify of Philadelphia Streets Departmenl Maintenance Yard and Sanitation Department Southeast Service Building, which contains a filling station. The Schuylkill Expressway is depicted lo the north of the subject property.
• 1978 ~ No significant changes to the subject property or surrounding properties were obser\'ed from the 1976 map. •
5.3 Property Tax Files
Properly tax files including records of pasl ownership, appraisals, maps, sketches, photos, or other informaiion pertaining to the property were reviewed by Pennoni.
Pennoni obtained a current tax map for the subject propeily from Philadelphia Records Department; a copy of the tax map is included in Appendix Ar The: subject property is identified on the Cil)' of Philadelphia Tax Map 48-S-02 as Tax Parcel 0072.
5.4 Recorded Land Title Records
Recorded land title records including records of historical fee ownership, including leases, land contracts and AULs on or ofthe subject property were not provided to Permoni by the Client; however, Pennoni obtained a copy ofthe current deed for the subject properly from the Cily of Philadelphia Department of Licenses and Inspections (L&I). Philadelphia Suburban Developriient Corporation (PSDC) isithe current owner ofthe subject property. According lo the current deed, PSDC acquired the subject property from the Philadelphia Authority for Industrial Development on October 6, 1987, as recorded in Deed Book 0912, Page 502. The current deed also states that the Philadelphia Authority for Industrial Development acquired the subject property from Fairmount Foods Company on January 5, 1982. A copy ofthe current subject propert)' deed is included in Appendix C.
5.5 Historical Topographical Maps
Historical Topographical Maps were not determined to be reasonably ascertainable, practically reviewable, and/or sufficiently useful.
5.6 Local Street Directories
Local Street Directories were nol delennined lo be reasonably ascertainable, practically reviewable, and/or sufficiently useftil.
5.7 Building Department Records
Pennoni obtained available zoning records from L&I via electronic mail. Review ofthe subject property zoning files did not reveal informaiion regarding storage tanks or olher enviromnental issues. The. files
11

contained in the subject property zoning files indicate that the subject property has been occupied by the Turf Club since 1993. The permit applications contained in the files relate to interior renovations and signage for the Turf Club building; no infonnation regarding the vacant truck repair garage on the subject property was found in the files. Additionally, documentation prior to 1992 was not available from L&I for the subject propert)'. Copies of the documents obtained from L&I are included in Appendix C.
5.8 Zoning/Land Use Records
The subject property is zoned for use as a Food Distribution Center (FDC).
5.9 Previous Environmental Reports
Previous environmental reports pertaining to the subject property were not provided by the Client for review and inclusion in this report.
12

6.0 REGULATORY AGENCY RECORDS REVIEW
As part of the Phase 1 ESA for the subject property, Pennoni reviewed both standard and additional environmental record sources for the subject property and surrounding area. Our environmental records review consisted of a review ofthe following:
• the Environmental FirstSearch Report (FirstSearch Report) for the subject property provided by InfoMap Technologies Incorporated;
• information requested from the United States Environmental Protection Agency (USEPA), Region III;
o information requested from the Pennsylvania Department of Environmental Protection (PADEP); and,
• informafion requested from regional and local sources including, the City of Philadelphia.
6.1 Standard Environmental Record Sources, Federal and State
Pennoni contracted the services of InfoMap Technologies Corporation (InfoMap) to search both state and federal enviromnental databases in an attempt to identify potential concerns that may be associated wilh either the subject site and/or sunounding properties. The FirstSearch Report provided listings, accompanied by a map, of facilifies and operations with reported environmental concerns wilhin the ASTM E 1527-05 specified search radius around the subjectproperty.
The federal databases searched by the FirstSearch Report included the following: • Federal Nafional Priorities List (NI L) site list; • Federal Delisted NPL site list; • Federal Comprehensive Environmental Response, Compensalion, and Liability
Infomiation System (CERCLIS) list; • Federal CERCLIS No Further Remedial Action Planned (NFRAP) site list; • Federal Resource Conservation and Recover)' Act (RCRA) Corrective Action
(CORRACTS) facilifies list; • Federal Treatment, Storage, and Disposal (RCRA TSD) facilities list; o Federal RCRA (RCRA GEN) generators list; o Federal Institutional Control/Engineering Conlrol (IC/EC) registries; and • Federal Emergency Response Notification System (ERNS) list.
The FirstSearch Reporl also searched the following stale database files: • State Hazardous Waste Sites (SHWS) list; • State Solid Waste Facility/Landfill (SWF/LF) site list; • Stale Leaking Underground Storage Tank (LUST) site list; • Slate Registered Underground and Aboveground Storage Tank (REG UST/AST) site list; • State Institutional Control/Engineering Conlrol (IC/EC) registries; • State Voluntary Cleanup Program (VCP) sites list; and • State Brownfields sites list.
The FirstSearch Report is presented in Appendix B. Complete lisfings and descriptions ofthe each ofthe databases search are included in the FirstSearch Report.
13

6.1.1 Subiect Properts'
The subject property was not idenlified as a regulated site in the FirstSearch Report.
6.1.2 Vicinity Properties - Facilifies of Potential Concern
The FirstSearch Report identified the following facilities localed adjacent lo or in close proximity to the subject property.
• Sysco Food Svc Phila 600 Packer Ave Philadelphia, PA 19148
The Sysco Food Svc Phila UST and LUST site is located adjacent lo the east ofthe ofthe subject property across Soulh 7" Sireet. According lo the FirstSearch Report, the site contains two (2) lO.OOO-galion diesel ASTs which were installed in December 2010.and are currently in use. The LUST listing states that a release which occurred on Augiist 19, 1992 achieved a cleanup completed status on April 22, 2009. Based on-the locafion'of the Sysco Food UST and LUST site relative to the subject property, and the reported regulator)' status ofthe site, adverse impacts lo the subject property are not expected.
• Tartan Sysco Foods Inc. 666 Packer Ave Phiiadelphia, PA 19148
The Tartan Sysco Foods LUST site is located adjacent lo the east ofthe subject property across Soulh 7"* Streei. According lo the FirstSearch Report, a release of diesel fuel was cleaned up at the site pursuant to Act 32. Additional details regarding the listing were not provided in the FirstSearch Report. Based on the location ofthe Tartan Sysco Foods LUST site relative lo the subject property, and.the reported regulatory status of the site, adverse impacts to the subject propert)' are not expected.
• 2"** District Maintenance Building Seventh St and Hartranft Ave Philadelphia, PA 19148
The 2"'' District Maintenance Building UST site is located adjacent to the southeast ofthe subject property across Soulh T Sireet. No details regarding the tanks localed at the site were provided in the FirstSearch Report. Based on the locafion of the 2" District Maintenance Building UST site relative to the subject property, adverse impacts to the subject property are not expected.
• SE Transfer Station Room 840 Mun. Svc. Building Philadelphia, PA 19107
The SE Transfer Station SWL site is located adjacent to the south/southeast ofthe ofthe subject property. No details regarding the site were provided in the FirstSearch Report. Based on the
14

location of tlie-SE Transfer Station SWL site relative to the subject properly, adverse impacts to the subject property are not expected.
The remaining reported sites are not located on or adjacent lo the subject properly and are not expected to impact the subject property based on their location and/or reported regulator)' status. Complete details for all ofthe sites listed in the FirstSearch Report are included in Appendix B.
6.1.3 Orphan Sites
The unfiltered FirstSearch Report identified five (5) orphan sites, or sites which could not be mapped due lb inadequate address informafion. None of;lhe identified sites appear to be localed on or adjacent to the subject property based on the provided information.
6.2 Additional Enyironmental Records Sources - State and Federal
6.2.1 Pennsvlvania Department of Environmental Protection
Pennoni submitted an records request, via facsimile, on November 1, 2012, lo the Pennsylvania Department of Environmental Protection (PADEP), for infomiation regarding environmental concerns at the subject propert)', A copy of the letter is contained in Appendix C. PADEP responded to our request via telephone and indicated that no files were idenlified for the subject property.
6.2.2 United Stales Environmental Protection Agency
A request was submitted online to the United States Environmental Protection Agency (USEPA), (www.MyPropertyInfo.com) on October'29, 2012, to search federal files for any informafion regarding the subject property, and any instances of illegal waste discharges, Notices of Violafions, and the current regulatoiy status:of the subject property. No records pertaining to the subject property were identified. A copy of the search record is included in Appendix C.
6.3 Additional Environmental Records Sources — Regional and Local
6.3.1 Philadelphia Water Department
Peunoni submitted a written request, in a letter dated November 5, 2012,, to the Philadelphia Water Department for information regarding.cnvironmental concerns al the subject propert)'. No response to this request has been received to date. Information received, which changes the findings of this report, will be forwarded upon receipt. A copy of the request is included in Appendix C.
6.3.2 Philadelphia Department of Licenses and Inspections
Pennoni obtained available zoning records from L&I via electronic mail. Review of the subject property zoning files did not reveal information regarding storage tanks or other enviromnental issues. The files contained in the subject property zoning files indicate that the subject property has: been occupied by the Turf Club since 1993. The permit applicafions contained in the files relate to interior renovations and signage for the Turf Club building; no information regarding the vacant truck repair garage on the subject property was found in the files. Additionally,
15

documentation prior to 1992 was not available from L&I for the subject property. Copies ofthe documents obtained from L&l are included in Appendix C.

7.0 SITE RECONNAISSANCE
Pennoni personnel completed an inspection of the subject property oh October 31, 2012 in order to visually inspect the property for evidence of RECs. During the site visit Pennoni was escorted by Mr. Frank Coslello of Philadelphia Suburban Development Corporation (PSDC), which owns the subject property. Photographs ofthe significant features observed during the site visit are provided in Appendix D.
Methodology The propert)' was obser\'ed by visually walking the surveyed property line. Interior portions of the subject property were accessed as well. Interior,spaces of buildings located on the subject property were observed in a methodical means by accessing each room and space including the basement and penthouse levels, if any. Most individual rooms were physically entered and visual observations were made.
Limitafions Access to interior areas wilhin the buildings on thesubject properly was provided. The.subject property Visit and obser\'ations were not limited, with the exception of the Packer Avenue Foods tenant space due to the fact that the occupant was nol in al4he lime of the inspection.
7.1 General Observations - Exterior Areas
The subject property contains an approximately 120,218 square foot mixed use building (Turf Club) and an approximately 9,000 square foot vacant truck repair garage. Asphalt parking areas surround the subject property buildings. Three (3) vacant parking attendant booths were obser\'ed on the southwest comer of the subject propert)'. The southern portion of the Turf Club structure on the subject properly contains loading docks utilized by Packer Avenue Foods.
7.2 General Observations — Interior Areas
The northern portion of the Turf Club building is two (2) stories and contains the Turf Club on the second floor, and warehouse space and offices for the Pennsylvania Lottery, Catch Packer Recover)' Program, and PharmDoor on the first fioor. The first floor warehouse space is mostly vacant with a small portion utilized by the Turf Club for storage of building.maintenance materials. The northeastern comer ofthe Turf Club building contains a garage area occupied by Verifone. The garage is used by Verifone to install radios and meters.in taxi cabs; no vehicle maintenance, is perfomied in this space. Pennoni obsen'ed a small grease trap located beneath a sink in the kitchen ofthe Deli within the Turf Club. Mr. Coslello did not have infomiation regarding disposal of the.grease by the Turf Club. Pennoni also obser\'ed a waste oil healing unit wilhin the vacant truck repair garage on the subject property.
7.3 Hazardous Substances in Connection with Identified Uses
Pennoni observed storage of various building maintenance supplies, including paint, in the warehouse space localed on the first floor ofthe Turf Club building.on the subject property. Additionally, Pennoni observed three (3) 55-gallon drums containing hydraulic oil in this warehouse space. Mr. Coslello informed Pennoni that the hydraulic oil is stored on the subject property for use in elevators al olher properties o\\nied by PSDC. Staining or evidence of leaks was not observed on die concrete floor
17

surrounding the dmms.
7.4 Storage Tanks
No ASTs or evidence of USTs was observed on the subject property.
7.5 Floor Drains and/or Sumps
Pennoni observed floor drains throughout the vacanttruck repair garage on the subject property. Peiinoni also obsen'ed two (2) manhole covers which appear to be-access ways for an oil/water separator wilhin the building; however, the presence of an oil/water separalofcould not be verified. Notable staining was not observed in the vicinity ofthe drains and no chemical or petroleum odors were observed.
7.6 Other Observations
Based on the site reconnaissance, review of records, and historical usage of the subject property, Pennoni has idenlified the following conditions that may impact fiiture developmeni of this property or present the potenlial for future environmental liability.
Stains or Corrosion Pits, Ponds or Lagoons Stained Soil or Pavement Stressed Vegetation Fill Material Municipal Solid Waste
Regulated Waste Disposal Biomedical Waste Disposal Waste Water Wells Septic Systems Current/Past Agricultural Acfivity
Odors
Pools of Liquid Drums/Containers
Unidentified Chemicals
Not Observed Not Observed Not Observed Nol Observed Nol Obsen'ed Stored in dumpsters and disposed by private contractors Nol Observed Nol Observed Not Observed Nol Observed Nol Observed Not Observed No strong, pungent, or noxious odors were observed Nol Observed Three (3) dmms of hydraulic oil obsen'ed in warehouse area occupied by Turf Club. Not Obsen'ed
7.7 Polychlorinated Biphenyls (PCBs)
PCBs are a class of compounds that were developed in the 1930s and became widely used in industry from the mid-1900s lo the late 1970s. The flame resistance of PCBs made them ideal for use in electrical equipment and they did nol break down or react wilh other chemicals, even under extreme conditions of high temperature and pressure. PCBs were commonly used, therefore, in hydraulic fluids, lubricafing oils, and transformers, electric motors, switches, and capacitors (including fluorescent lighting ballasts), as well as in paints, plasfics, and other household items.
18
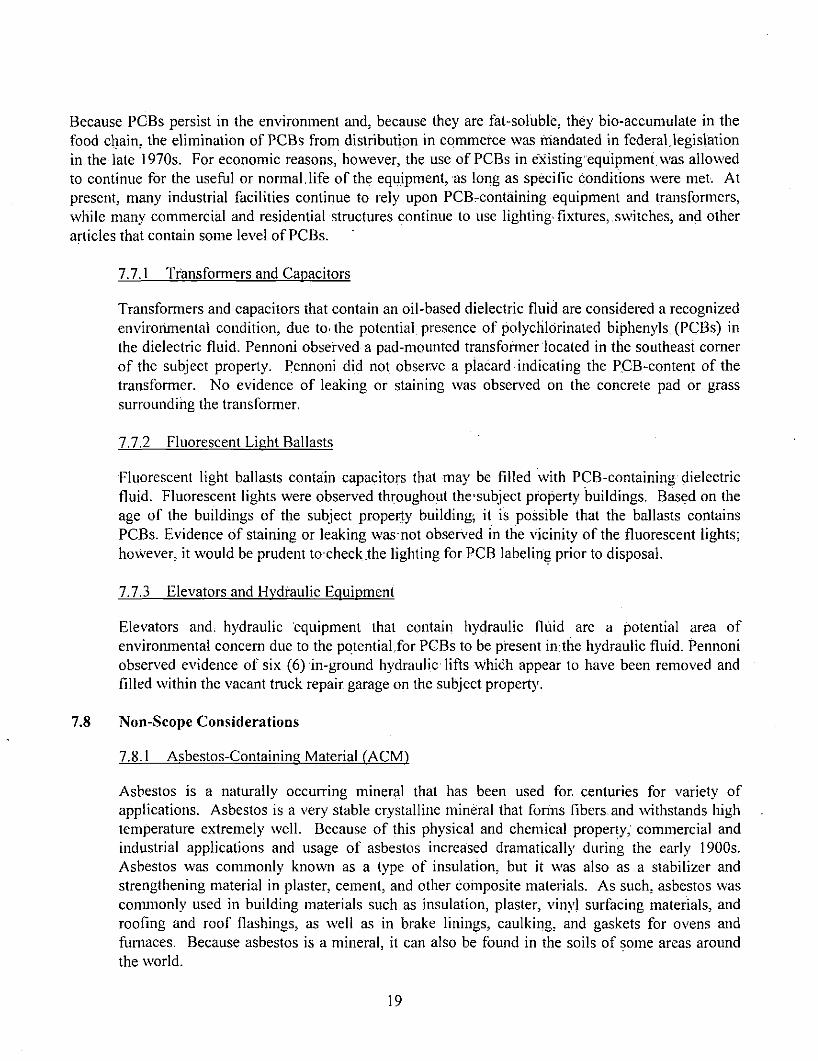
Because PCBs persist in the environment and, because they are fat-soluble, they bio-accumulate in the food chain, the elimination of PCBs from distribution in commerce was mandated in federaflegislation in the late 1970s. For economic reasons, however, the use of PCBs in existingequipment.was allowed to confinue for the useful or normal,life ofthe equipment, as long as specific conditions were met. Al present, many industrial facilities continue to rely upon PCBrContaining equipment and transformers, while many commercial and residential slmctures continue to use lighfing'fixtures,,switches, and other articles that contain some level of PCBs.
7.7.1 Transformers and Capacitors
Transformers and capacitors that contain an oil-based dielectric fluid are considered a recognized environmental condition, due to. the potenlial presence of polychlorinated biphenyls, (PCBs) in the dielectric fluid. Pennoni obsen'ed a pad-mounted transformer localed in the southeast comer ofthe subject property. Pemioni did not observe a placard indicafing the PCB-content ofthe transformer. No evidence of leaking or staining was obsen'ed on the concrete pad or grass sunounding the transformer.
7.7.2 Fluorescent Light Ballasts
Fluorescent light ballasts contain capacitors that may be filled with PCB-containing dielectric fluid. Fluorescent lights were observed throughout the=subject property buildings. Based on the age of the buildings of the subject property building; il is possible that the ballasts contains PCBs. Evidence of staining or leaking was not obsen'ed in the vicinity ofthe fluorescent lights; however, it would be prudent to cheek.the lighting for PCB labeling prior to disposal.
7.7.3 Elevators and Hydraulic Equipment
Elevators and. hydraulic equipment that contain hydraulic fluid are a potential area of environmental concem due to the pplenlial.forPGBs to be present in the hydraulic fluid. Pennoni obsen'ed evidence of six (6) in-ground hydraulic lifts which appear lo have been removed and filled wilhin the vacant tmck repair garage on the subject property.
7.8 Non-Scope Considerations
7.8.1 Asbestos-Containing Material (ACM1
Asbestos is a naturally occurring mineral that has been used for centuries for variety of applications. Asbestos is a very stable crystalline mineral that fonns fibers.and withstands high temperature extremely well. Because of this physical and chemical property, commercial and industrial applications and usage of asbestos increased dramatically during the early 1900s. Asbestos was commonly knov\Ti as a type of insulafion, but it was also as a stabilizer and strengthening material in plaster, cement, and other composite materials. As such, asbestos was commonly used in building materials such as insulation, plaster, vinyl surfacing materials, and roofing and roof flashings, as well as in brake linings, caulking, and gaskets for ovens and furnaces. Because asbestos is a mineral, il can also be found in the soils of some areas around the world.
19

Once commercially milled, asbestos fibers are typically found at sizes that are measured in microscopic, micron particle sizes. Uncontrolled releases of asbestos fibers can remain airbome for an extended time and the particles lend lo by-pass most ofthe defense mechanisms ofthe respiratory tract. As such, asbestos fibers have the ability to reach the inner portionsof the lungs where they can become lodged and cause significant scarring and damage on a cellular level. Diseases attributable to asbestos exposure include asbeslosis, mesothelioma, and lung cancer. Occupational exposure to asbestos is, therefore, highly regulated in the workplace.
The mere presence of ACM in a building is nol necessarily cause for significant concem. So long as asbestos is not disturbed or accessible to damage or contact and does not become airbome, it poses little health risk and management of ACM in-plaee is considered a safe and acceptable practice. The U.S. EPA and OSHAdiave issued substantial guidance regarding proper procedures for the operations and maintenance of asbestos in the workplace. The U.S. EPA has also issued guidelines for home and building owners who have ACM insulation and surfacing materials such as flooring and roofing in their houses. Consequently, while most commercial produclion and use of asbestos was discontinued in the late 1970s and early 1980s, ACM remain in-place and in use in many comniiercial, industrial, and residential slmctures.
Asbestos regulations govern issues such as asbestos exposure and materials handling, transportation, and disposal and they place obligations upon building owners and operators to make notification to building occupants, tenants, visitors, contractors, and employees who may come in contact with the ACM.
Building o\vners, in particular, are responsible to make notifications regarding the presence and location of ACM. Additionally, all suspect materials are required by law to be "presumed" lo be asbestos containing materials (PACM). PAGM must be handled and treated as ACM until proven othenvise lo be non-ACM.
Policies and procedures relaling to the on-going rnanagement of PACM and ACM in occupied buildings are typically presented in written asbestos Operations:and Maintenance (O&M) Plans. O&M Plans outline the various building owner responsibilities and procedures relafing to the asbestos and sen'e as a tool lo ensure consistent and proper management practices.
If a building containing ACM is to, be demolished, the asbestos is typically removed prior to the demolition activities. Pursuant to the federal EPA National Emissions Standards for Hazardous Air Pollutants (NESHAP) regulafions in ,40 CFR 61, subpart M, ACM and asbestos-containing wastes must be removed, handled, and disposed in a mamier that does nol allow visible and/or uncontrolled emissions of asbestos to the environment.
Also, pursuanl lo the OSHA General Industr)' Standards 29 CFR 1910.1001 and the Constmcfion Standards in 29 CFR 1926.1101, employers of employees who may encounter ACM are responsible lo ensure that the employees are not exposed to airborne concentrations in excess of permissible exposure limits (PELs) that are based upon a time-weighted average exposure. Additionally, the employees must be properly trained so that they can recognize hazards and avoid unacceptable exposure.
No ACM was definitively identified during this ESA and no sampling was performed. During the
20

site visit, however, some suspect materials were iobserved within the subject propert)' buildings. The materials include, but are not fimited to, 12 x 12 in. vinyl floor tile and 2 x 2 ft. ceiling file. The observed suspect materials appeared by.be in fair to good condition. Whether or not, these materials are asbestos containing can only be confirmed by manufacturer knowledge or by collecting samples ofthe materials and having them analyzed by an accredited laboralor)'. Prior to renovations or demotion, an ACM suryey-should be performed.
7.8.2 Lead-Based Paint
Lead is commonly added lo paints because of ils characteristic to resist corrosion. LBP was used substanUaily for industrial applicafions; it is also commonly encountered in older commercial and residential properties.
Oral ingestion may represent a major route of exposure in contaminated workplaces and houses. Lead poisoning can cause pemianent damage to the brain and many olher organs and causes reduced intelligence and behavioral problems. Lead can also cause abnormal fetal.development in pregnant women.
The U.S. EPA estimates that approximately three quarters of the nation's housing (i.e., roughly 64 million dwellings) contain some LBP. When properly maintained and managed, this paint poses little risk. However, 1.7 million children have blood-lead levels above safe limits, mostly due to exposure lo LBP hazards.
According to the Housing and Urban Developmeni (HUD) Authority, lead-based paint.LBP is defined as paint on surfaces with lead in excess of 1.0-milligrams per square centimeter (mg/cni^), as measured by a x-ray fluorescence (XRF) detector of 0.5 percent by weight.
Use of LBP in construction was banned in 1978 and Congress passed legislation in 1992 requiring the disclosure of knownjnfomiafionon LBP and LBP.hazards before the sale^or lease of most housing built before 1978. Consequenfiy, LBP was generally phased out in commercial buildings, as well.
Similar lo asbestos, OSHA has also established worker protection standards for exposure lo lead. Unlike the case with asbestos, however, LBP does nol need to be removed from a structure prior lo demolition so long as the issue of worker exposure and adequate protection can be addressed.
If waste materials from the demolition contain quantities sufficient quantities of LBI , il may meet the definifion of a hazardous waste under the U.S. EPA's Resources Conservation and Recovery Act (RCRA) found in 40 CFR 260 - 279. Therefore, the need for pre-demolition abatement of LBP musl be evaluated on a case-by-case basis to determine if the abatement is warranted.
Pursuant to applicable OSHA regulations, the party that is contracting for services to perfomi work in the strucmre is required lo provide noiice to the contractor or eniployer that LBP is likely present: Most contractors will likely need to know specific locations ofthe paint such that many owners and managers of buildings containing LBP opt to have a survey performed so that information that is more specific is available and the matter does not delay renovation and
21

construction projects.
No LBP was definitively idenlified during the ESA; however, the subject property buildings would be expected lo have one or more layer of LBP based on the dates of constmcfion. Testing ofthe paint can be performed to determine if any ofthe older layers are lead containing, or the materials can merely be presumed to be LBP and, subsequent to receiving proper notice of the potential presence of LBP on or in the slmctures, renovation or demolition contractors can take appropriate precautionary measures to prevent worker exposure arid proper handling during renovation or demolition activities.
7.8.3 Lead in Drinking Water
The subject property is cunenlly provided water by the Philadelphia Water Department. Public Water Suppliers are required lo monitor lead levels in supply water and maintain conosion conlrol programs to minimize the leaching of lead from plumbing, solder joints, and fixtures. Collection of a sample.of the water supplied lo this propert)' at point of use, and subsequent analysis, would be necessar)' to determine if drinking water lead concentrations are of concem.
7.8.4 Wetlands
No soils or vegetation characteristic ofvvetlands were visible on the subject propert)', although a formal survey was not performed during the ESA. The U.S. Fish & Wildlife Service National Wetlands Inventor)' database was reviewed to determine if wefiand areas have been mapped on the subject propert)'. According lo the U.S. Fish & Wildlife Sen'ice map, no wetlands are located on the subject property.
7.8.5 Radon Gas
Radon gas is a naturally occurring radioactive gas found iri soils and rocks. It is generated by the decay of naturally occurring uranium as a colorless arid odorless gas. Radon gas can accumulate once inside an enclosed space such as an office building or home. There is an increased risk of developing lung cancer when exposed to elevated levels of radon gas. In general, the risk increases as the concentration of radon gas and the length of exposure increases. The EPA has established 4 picoCuries per liter (pCi/lJ) of radon gas .in indoor air as a guidance level for residences, while readings above 20 pCi/L are considered an actionable level.
According lo the data obtained from the PADEP, the subject property lies within an area with an average indoor air radon concentration below 2 pCi/L. Based on the reported average concentration, and because the subject propert)' does nol contain sub-grade living or Working space, health risk due lo radon concentration is not a concem on the subject property. Actual radon concentration can only be determined by on-site measurement.
7.8.6 Mold
Pennoni conducted a limited visual inspection throughout the buildings to identify significant water damaged or moid-impacted building materials. The conditions of interior building components were inspected for evidence of mold, mildew, other visible contamination and/or
22

anomalies. Pennoni inspected the buildings for the presence of areas of significant microbial proliferation on walls, fabrics, carpets, and ceilings.
No visual evidence of significant microbial grov\ih was observed within the subject property buildings.
23

9.0 ENVIRONMENTAL PROFESSIONAL STATEMENT AND SIGNATURE
1 declare that, to the best of my professional knowledge and belief, I meet the definition of an "environmental professional" as defined at 40 C.F.R.§312.10. Iliave the specific qualifications based on education, training, and experience lo assess a property ofthe nature, history and setting ofthe subject property. I have developed and performed the all appropriate inquiries in conformance with the standards and pracfices sel forth in 40 C.F.R. Part 312.
William F. Schmidt PE Associate Vice President
25

10,0 REFERENCES
The following documents, publications, maps, etc. were used as source materials for this Phase I Environmental Site Assessment:
• ASTM Standards on Environmental Site Assessments for Commercial Real Estate (E 1527-05). Standard Practice for Environmental Site Assessments: Phase 1 Environmental Site Assessment Process. 2005.
" Philadelphia. PA-NJ. USGS, 7.5 minute topographic quadrangle, 1995.
' United Stales Departmenl of Agriculture, Natural Resource Conservation Service Web Soil Survey.
" Geologic Map of Pennsylvania. Commonwealth of Pennsylvania Departmenl of Environmental Resources Topographic and Geologic Sun'ey, with a scale of 1 inch equal lo 250,000 feet, 1990.
• Physiographic Provinces of Pennsylvania (Map 13), 4 Edition, Pennsylvania Departmenl of Consen'ation and Natural Resources Bureau of Topographic and Geological Survey, 2000.
• Engineering Characteristics ofthe Rocks of Pennsylvania (Environmental Geology Report I), 2"* edition, Pennsylvania Department of Consen'ation and Natural Resources Bureau of Topographic and Geological Survey, 1982.
• Envirorunental FirstSearch Report, dated October 29, 2012, obtained from InfoMap Technologies Incorporated, Inquiry Number'PNGI 1201.
• FirstSearch Aerial Photo Decade Package. Report No. PNGI 1201, obtained from InfoMap Technologies Incorporated.
• FirstSearch Fire Insurance Maps. FirstSearch Index No. 347199, obtained from InfoMap Technologies Incorporated.
" Wetlands Online Mapper websile published by the United States Fish and Wildlife Service. Available on-line at: hltp://wellandsfws.er.usgs.gov/wtlnds/launch.html
P:\Projecis\PNGI\l20I-Pemi National Gaming\DOCUMENTS\REPORTS\Pmi 1201 700 Packer Ave Phase I Reporl.doc
26

Tt—^ J-ENNS Y,Ly\Ni^^£^^^--i__ _: .• _ - [} ^ l^ AyW.
PHILADELPHIA, PA-NJ (1995) QUADRANGLE U.S.G.S. 7.5 MIN. TOPOGRAPHIC MAP
CONTOUR INTERVAL 20 FEET
PENNONI ASSOCIATES INC.
CONSULTING ENGINEERS,
JOB No.: PNGI 1201
PENNON! ASSOCIATliS INC. ONH DREXEL PLAZA
3001 MARKET STREET PHILADELPHIA. PA 191 (M
SCALE: NOT TO SCALE
PRELIMINARY ENVIRONMENTAL SITE SCREEN
The Turf Club 700 Packer Avenue
Philadelphia, PA 19148
FIGURE 1: SITE LOCATION MAP
NORTH

PENNONI ASSOCIATES INC.
CONSULTING ENGINEERS
JOB No.: PNGI 1201
PENNONI ASSOCIATES INC. ONE DREXEL PLAZA
3001 NtARKET STREET PHILADELPHIA, PA 1910-1
SCALE: NOT TO SCALE
PHASE I ENVIRONMENTAL SITE ASSESSMENT
The Turf Club 700 Packer Avenue
Philadelphia, Pennsylvania 19148
FIGURE 2: TAX MAP SOURCE: RealOucst.com
NORTH


Economic and Fiscal Impact of the Proposed Hollywrood Casino Philadelphia
in the City of Philadelphia, PA
(First Phase)
Submitted to:
Penn National Gaming, Inc.
Prepared by Urban Partners
829 Spruce Street, Suite 204 PhUadelphia, PA 19107
November 8, 2012

TABLE OF CONTENTS
0) EXECUTIVE SUMMARY 2
Impact ofHolhnvood Casino Piiilndelpiiin Construction 2 Recurring Iiuvact ofHollmvood Casino PliilndelpJiin 3
1) INTRODUCTION 4
2) METHODOLOGY 6
3) DEVELOPMENT PERIOD IMPACT ,..., 7
3.1) DEVELOPMENT PERIOD EMPLOYMENT IMPACT 8
3.2) DEVELOPMENT PERIOD TAX REVENUE IMPACT .• 9
4) ANNUAL ECONOMIC IMPACT 12
Direct Economic Impact 13 Indirect/Induced Economic Impact 15
4.1) EMPLOYMENT IMPACT FROM ON-GOING OPERATIONS 16
4.2) TAX REVENUE IMPACT .....17 Wage Tax Revenue Impact 17 Sales and Hotel Tax Impact ..; IS Business and Real Estate Tax Impact 19 Gaming Tax Impact... 20,
5) APPENDIX A: WHAT IS IMPLAN? , 21
Economic and Fiscal Impact of the Proposed Hollywood Casino PhUadelphia Page 1

0) EXECUTIVE SUMMARY
In responseto the Pennsylvania Gaming Control Board's call for applications for Philadelphia's second casino Ucense, Penn National Gaming, Inc. is proposing the HoIIyvyood Casino Philadelphia on tlie 700 block of Packer Avenue in South Philadelphia. The first phase of the planned casino facilit)^ will iriclude 102,000 SF of gaming floor with 2,050 slot machines, and 81 table games, multiple restaurants and bars, and a 180-seat entertainment lounge.
The proposed location is adjacent to the Philadelphia Sports Complex which is comprised of three world-class sports venues and the newly opened XFINITY Live! Philadelphia. Tlie addition of the Hollywood Casino Philadelphia in this area will result in significant economic impact for the Cit}' of Philadelphia and the Commonwealtli of Pennsylvania.
hi order to analyze the economic benefits of the HoII)^'ood Casino Philadelphia, Penn National retained Urban Partners to independently assess the economic impacts of the construction and operation of tlie proposed facility. Our analysis of the proposed casino's economic impact focuses on tliree primary factors:
1) The initial construction/development.period impacts; 2) The direct and indirect economic impact of tlie casino's on-going operations and the
employment generated by this activity; and 3) The tax benefits received by the Cit}' of Philadelphia and the Commonwealth of
Pennsylvania as a result of the casino.
Although additional phases of the casino are planned for the future, the economic impact analysis in this report is limited to the first phase only.
Impact ofHoIhfTvood Casino Ptiiladelytua Construction
The construction of tlie first phase of the Hollywood Casino Philadelphia, which is estimated to cost $232.9 million, directly and indirectly will.generate a one-time economic impact of $246.96 million for the Commonwealth of Pennsylvania, of which $194.44. million is theest imated portion for the City of Philadelphia. In addition, tiie construction of tiie casino will produce:
• 2,060 full time equivalent jobs in the Commonwealth of Pennsylvania 810 full-time equivalent jobs as a result of directimpact 1,250 full-time equivalent jobs as a result of indirect/induced impact
• 1,565 full time equivalent jobs in the City of Philadelphia 780 full-time equivalent jobs as a result of direct impact 785 full-time equivalent jobs as a result of indirect/induced impact
• $113.85 milHon in wages and salaries $96.77 million eamed within Philadelphia $72.58 million is estimated to be earned by Philadelphia residents
Bconomic and Fiscal Impact of ihe Proposed Hollywood Casino Philadelphia Page 2

• $7.2 miUion as income tax revenue $3.7 million as wage tax revenue for the City of Philadelphia $3.5 million as income tax revenue for the Commonwealth of Pennsylvania
• $4.34 million as sales tax revenue $1.08 million for City of Philadelphia $3.26 million for the Commonwealth'of Pennsylvania
• $5.05 million in business/corporate & real estate tax revenue $3.51 million for Cit}' of Philadelphia $1.54 million for the Commonwealth of Pennsylvania
Annual Operating Impact of Hollywood Casino Pltilndelptiia
In addition to the one-time benefits associated witli the development and construction of the casino, this project wiU result in an on-going spending associated with the operation of the facility. The operational expenditures of the casino and the significant out-of-facihty spending of casino visits wiU generate an estimated annual direct and indirec^induced economic impact of $596.7 million for the Comrnonwealth of Pennsylvania. In addition, casino operations will
produce:
• 4,390 full time equivalent jobs in the Commonwealth of Pennsylvania
3,500 full-time equivalent jobs as a result of direct impact 890 full-time equivalent jobs as a result of indirect/ induced impact
• 3,740 full time equivalent jobs in die City of Philadelphia 3,210 full-time equivalent jobs as a result of direct impact (2,410 residents) 530 full-time equivalentjobs as a result of indirect/induced impact (400 residents)
• $131.94 million in wages and salaries $108.05 milhon,earned within Philadelphia $81.04 rnillion is estimated to be earned by Philadelphia residents
• $8.18 niilUon as income tax revenue $4.13 million as wage tax reveriue for the City of Philadelphia
- $4.05 milUon as income tax revenue for the.Commonwealth of Pennsylvania
• $12.22 million as sales tax revenue $4.3 million for City of Philadelphia $7.92 million for tlie Commonwealth of Pennsylvania
• $10 million in business/corporate & real estate tax revenue $6.76 million for City of Philadelphia $3.24 million for the Commonwealth of Pennsylvania
• $155.12 million in gaming tax revenue $11.8 million for Cit)' of Philadelphia as host fees $143.32 million for the Commonwealth of Pemisvlvania
Economic and Fiscal Impact of the Proposed Hollywood Casino Philadelphia Page 3

1) INTRODUCTION
Perm National Gaming, Inc. owns, operates, or .has ownership interests in gaming and racing facilities with a fociis on slot machine entertainment. Tlie company presently operates 28 facihties in 19 jurisdictions, including Colorado, Florida, Illinois, Indicma, Iowa, Kansas, Louisiana, Maine, Maryland, Mississippi, Missouri, Nevada, Nevy Jersey, New Mexico, Ohio, Texas, West Virginia, and. Ontario. In Pennsylyania, Penn National operates the HoUjnvood Casino at Perm National.Race Course in Grantville, in addition to off-track wagering facilities located in Chambersburg, Lancaster, Reading, aiid.York.
In response to.the Pennsylvania Gaming Control Board's call for applications for Philadelphia's second casino license, Penn National is proposing the Hollyw-ood Casino Philadelphia on the 700 block of Packer Avenue in South Philadelphia (see Figure 1). The first phase of the planned casino facility will include:
• 102,000 SF of gaming floor with 2,050 slot machiiies and 81 table games; • Steakhouse restaurant/bar (125 seats) • Noodle bar (70 seats) • Three meal restaurant (140 seats) • Four food courts (200 seats) • Entertainment lounge (180 seats) • Casino bar (20 seats) • VLP lounge/bar (40 seats) • 2,500 SF pre-function room • 500 SF of retail space
The proposed location is adjacent to the Philadelphia Sports Complex which is comprised of three world-class sports venues (i.e. Lincoln Financial Field, Citizens Bank Park, and the Wells Fargo Center). According to the Sports Complex Special Services District, the Complex "hosts approximately 380 events, 8 million visitors, and 5.5 rriillion vehicle trips each year." Complementing these sports venues is the newly opened XFINITY Live! Philadelphia, which is a dining and entertainment district that's programmed to enliance tlie visitor experience before and after sports and concert events. The addition of the
Figure 1: Proposed Location
Economic and Fiscal Impact of the Proposed Hollywood Casino Philadelphia Page 4
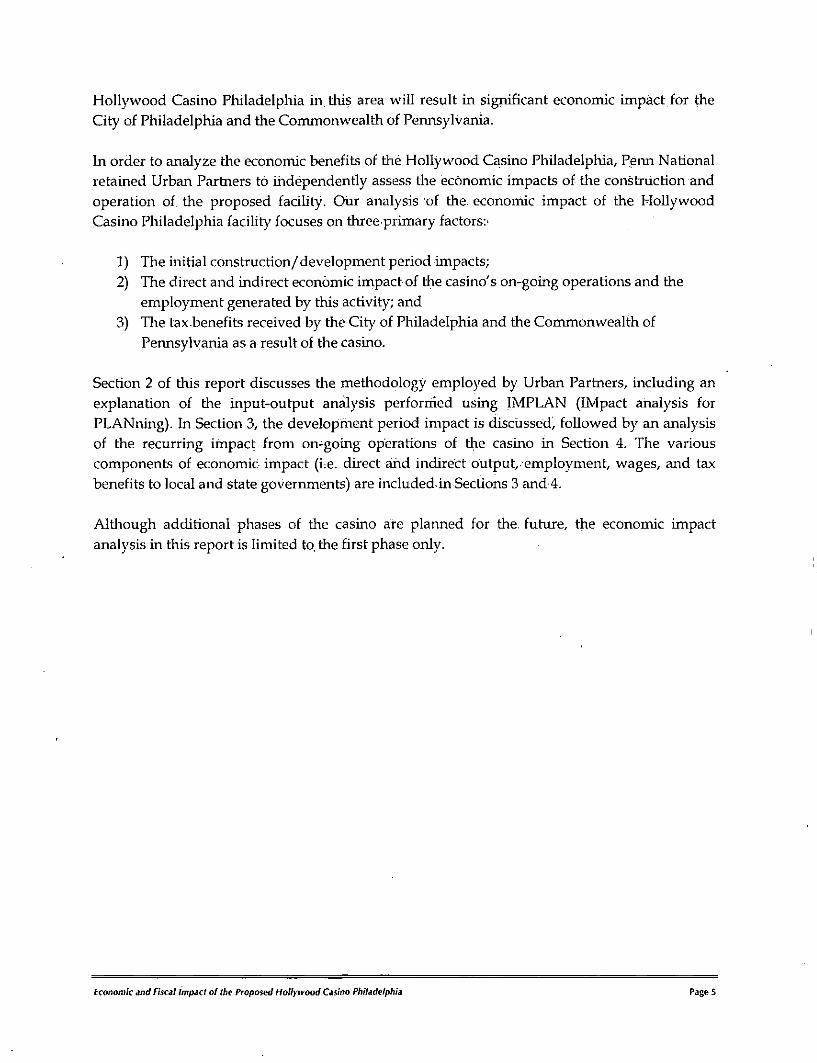
Hollywood Casino Philadelphia in. this area will result in significant economic impact for the City of Philadelphia and the Commonwealth of Pennsylvania.
In order to analyze the economic benefits of the Hollywood Casino Philadelpliia, Penn National retained Urban Partners to independently assess the economic impacts of the construction and operation of the proposed facility. Our analysis of the economic impact of the HoIl)'wood Casino Philadelphia facility focuses on threeprimary factors:-
1) The initial construction/development period impacts; 2) The direct and indirect economic impact of the casino's on-going operations and the
employment generated by this activity; and 3) The tax.benefits received by the Cit)' of Philadelphia and the Commonwealth of
Pennsylvania as a result of the casino.
Section 2 of this report discusses the methodolog}' employed by Urban Partners, including an explanation of the input-output analysis perforrried using IMPLAN (IMpact anatysis for PLANning). In Section 3, the development period impact is discussed, followed by an analysis of the recurring impact from on-going operations of the casino in Section 4. The various components of economic impact (i.e. direct and indirect output, employment, wages, and tax benefits to local and state governments) are included in Sections 3 £md 4.
Although additional phases of the casino are planned for the, future, the economic impact analysis in this report is hmited to. the first phase only.
Economic and Fiscal Impact of the Proposed Hollywood Casino Philadelphia Page 5

2) METHODOLOGY
In order to calculate the potential economic and fiscal impact df the proposed Hollywood Casino Philadelphia on the Cit)' of Philadelphia and the Commonwealth of Pennsylvania, Urban Partners employed the IMPLAN (IMpact.analysis for PLANning) model.i Developed by the U.S. Forest Service's Land Management Planning Unit and the Universit)' of Minnesota, IMPLAN utilizes the quantitative economic technique called the input-output model to track the way a dollar injected into one sector is spent and re-spent in otlier sectors of the economy. Through the use of IMPLAN, the economic impact of a new casino can be traced over multiple rounds of spending in the economy.
The initial round of spending is referred to as the direct impact. This figure is limited to the portion of economic activity that occurs within the local economy. In other words, the expenditures that leave the local economy (e.g. purchases from an out-of-state vendor) are excluded from the figure.
By inputting the initial round of spending into the IMPLAN model, additional effects can.be measured in a local economy in two forrns: indirect and induced. First, the changes in interindustry purchases as a result of the direct effect are referred to as' the indirect impact. For example, the Hollywood Casino Philadelphia will purchase goods and services from suppliers and vendors, who in tum make purchases of goods and services. Second, the induced effect refers to the impact generated by increaseti wages as a result of direct and indirect impacts. These wages in turn will pay for local goods, and services, creating another round of economic impact. This process continues until leakages eventually stop the cycle.
The magnitude or degree in which the direct impact triggers indirect and induced impacts is referred to as the "multiplier." IMPLAN calculates different multipliers depending on tiie t)'pes of spendirig that comprises the direct impact, as well as the geographic region thafs being studied. For the purposes of tliis analysis, the study areas are the Commonwealth of Pennsylvania and the City of Philadelphia.
^ Data and software (IMPLAN s)'stGin 3.0) furnished b)' Minnesota IMPLAN Group, Inc. The region data used in the model are for 2010, \vhich are the latest data available. See Appendix'A for a tcdmical explanation of the IMPLAN model.
Economic and Fiscal Impact of the Proposed Hollywood Casino Philadelphia Page 6

3) D E V E L O P M E N T P E R I O D IMPACT
The economic impact analyses in this section are limited to tiie construction/development period. As shou'n in Table 1 below, the total-development budget forthe Hollywood Casino Philadelphia is S232.9,million, of which $152.5 million is budgeted for hard costs, $62.1 million in furniture/fixtures/equipment, and S18.3 million in soft costs.
Table 1: Total Development Budget (First Phase)
Development Budget
Construction
Furniture, fixtures; and equipment
Soft Costs
Design & Engineering
Other Professional & Admin Costs
Total
Sl5_2,500,000
$62,100,000
$18,300,000
$12,800,000
$5,500,000
$232,900,000
Source: Penu Nationai
Of this amount, we estimate that $132,175 .riiillion can be counted as direct impact for tiie Commonwealth of Pennsylvania and $122,845 ihillioii for the City of Philadelphia:
Construction labor^: Materials^: Contractor profit*: FF&E purchases^: Design & engineering^: Professional and admin^:
Direct Impact Pennsylvania
$61.00 milhon S38.125 milhon $12.20 million $6.21 million
$10.24 million $4.4 million
Direct Impact Philadelphiia
$61.00 million $38,125 million $7,625 niiUion $3,105 milhon $10.24miUion $2.75 milhon
TOTAL $132,175 million $122,845 million
' We apply the industry standard for calculating the labor portion of construction costs (40% of overall construction costs). Alt economic activity associated with construclion labor will occur in the City of Phiiadelphia. ^ We apply the industr)' standard for calculating the materials portion of construction costs (50% of overall construction costs). We estimate that 50% of construction materials purchases will occur in the City of Philadelphia. • We apply the industr)'standard for calculating the contractor profit portion of construction costs (10% of overall construction costs). \Ve estimate that 80% of the construction contract.s will be awarded to Pennsylvania based companies and 50% of tlie contracts will be awarded to Philadelphia based companies. ^ The vast majoritj* of FF&E purchases are specialized gaming equipment that's manufactured predominantly in the Stale of Nevada. We estimate tliat 10% of FF&E purchases will bo made in tlic Commonwealtli of Pennsylvania and 5% will be made in the Cit}' of Philadelphia. ^ We estimate that 80% of the design & engineering contracts will be a\varded to Philadelphia based companies. ^ We estimate tliat 80% of the professional & adniin contracts will be awarded to Peru\sylvania based companies and 50% of the contracts will be awarded to Philadelphia based companies.
Economic and f iscal Impact of the Proposed Ho l l ywood Casino Philadelphia Page 7

According to IMPLAN, the multiplier for indirect and induced impacts of the development period economic activity is 0.8684 for the Commonwealth of Pennsylvania and 0.5828 for the City of Philadelphia. Applying these multipUers to the direct impact figures, the resulting indirect/induced impact for the Commonwealth of Pennsylvania is $114,781 - million, and $71.594 milhon for the City of Philadelphia.
In total, the development of the HoU)'wood Casino Philadelphia will result in $246.96 million in economic impact for the Commonwealth of Pennsylvania, of which S194.44 million is the estimated portion for the City of Philadelphia (Table 2).
Table 2: Development Period Economic Impact (First Phase) (All Estimates in Millioits)
Direct Economic Impact
Indirect/Induced Impact
TOTAL ECONOMIC IMPACT
Pennsylvania Philadelphia
$132,175 $122,845
$114,781 $71,594
$246,956 $194,439
Source: Vrlxm Partners
3.1) DEVELOPMENT PERIOD EMPLOYMENT IMPACT
The $246.96 miUion in total economic impact translates into 2,060 full time equivalentjobs - 810 full-time equivalentjobs as a result of direct economic impactand an additional 1,250 full-time equivalent jobs as a result of indirect/induced economic impact. Philadelphia's portion of the employment impact is estimated to be 1,565 fulltime equivalent jobs (see Table 3)
Table 3: Development Period Employment Impact
Development Period--Employment Impact
Direct Employment Impact Annualized Construction'Jobs (FTE)
Annualized Materials Jobs [FTE] Annualized FF&EJbbs{FTE)
Annualized Professional Jobs (FTE) ^
Total Direct Development Period Employment (Annualized h 11)
Indirect/Induced Employment Impact Total Employment Impact (Annualized FTE)
Pennsylvania
560
140 35
75
810
1,250
2,060
Philadelphia
560
140 15
65
780
785 1,565
Sourer: Urlnn Partners
Economic and Fiscal Impact of the Proposed Hollywood Casino Philadelphia Pages

3.2) DEVELOPMENT PERIOD TAX REVENUE IMPACT
Table 4 below shows the estimated amount of tax benefits during the development period. The Hollywood Casino Philadelphia will generate approximately $16.58 milhon in tax revenues during this period—$8.28 million in increased tax revenue for the City of Philadelphia and $8.29 million for the Commonwealth of Pennsylvania^.
Table 4: Summary of Development Period Tax Benefits
' Taxes on Wages & Salaries
Sales a Hotel Taxes
Business Privilege & Net Profits Taxes Real Estate Taxes Paid on Business Property
Use &,Occupancy Taxes Paid on Business Property
State Corporate & Other Business Taxes
Total Annual Tax Benefits
For a ty of Phila
$3,697,000 $1,080,000
$1,464,000
$1,353,000
$688,000
$8,282,000
For State of
PA
$3,495,000 $3,257,000
$1,541,000
$8,293,000 .
Total City a State
$7,192,000 $4,337,000
•$1,464,000 $1,353,000
$688,000
$1,541,000
$16,575,000
Sourer: Urlwn Pertnem
The 2,060 full-time equivalent jobs supported directly and indirectiy by the development of the HoII)'wood Casino Philadelphia are estimated to generate wages and salaries of approximately $113.9 milhon (see Table 5 on tiie following page). These estimates of wage. and.salary impact were derived using industrial sector factors developed as part of the IMPLAN analysis adjusted to 2012 dollars.
Of this $113.85 milUon in wages and salaries, $96.77million is estimated to be eamed within Philadelphia and $72:58 million is estimated to be earned by Philadelphia residents. In terms of tax revenue, this employment activity is estiniated to generate $3.7 million as wage tax revenue for the City of Philadelphia and another $3.5 million as income tax revenue for the Commonwealth of Pennsylvania.
^ The following are the current tax rates for tlie City of Philadelplua and the Commonwealth of Pennsylvania:
Cihf of Philadelphia Wage tax: 3.928% for city residents; 3.4985% for non-residents. Sales tax: 2%.
• Business privilege tax: 1.415 mills on gross receipts and 6.45% on taxable net income (we assume net income is 10% of gross receipts).
• Net profits tax: ivage tax rates on net income less 60% of net profits portion of the Business Privilege Tax. • Real estate tax: 9.432% on assessed value. • Use and occupanc)' tax: £5.51 per ajinum per SI 00 of assessed value.
CommomveahhofPenusMivama Income tax: 3.07% Sales tax: 6%
• Corporate net income tax: 9.9%
Economic and fiscal Impact of the Proposed Hollywood Casino Philadelphia Page 9

Table 5: Development Period Wage & Salary Impacts; Taxes on Wages and Salaries (All Estimates in Millions)
• Direct Wage & Salary Impacts
Direct Constnjction Wages & Salaries Direct MaterialJobs Wages & Salaries Direct FF&E Jobs Wages 81 Salaries Direct ProfessionaiySoft Cost Wages & Salaries
Indirect/Induced Wage St Salary Impacts
Total Wage 8t Salary Impacts
Wage Taxes Paid To City of Philadelphia , Income Taxes Paid To State of Pennsylyania
Within Pennsylvania
$6100 $4.77
$1:18 $4.44
$42:46
$113.85
$3.50
Within Philadelphia
$61.00 $4.77 $0.50 $3.83
$26.66
$96.77
$3.70
Philadelphia
Residents
$45.75 S3.58 $0.38 $2.88
$20.00
S72.58
$2.85
Non Phila Residents
$15.25 $1.19 $0.13 $0.96
$6.67
$24.19
$0.85
Smtrte: Urban Partners
Additionally, sales taxes resulting directly and indirectiy from construction of the Hollywood Casino Philadelphia are estimated to account for another $4.34 milhon in increased public revenue, including $1.08 million in revenue collected by the Cit}' of Philadelphia and ^.26 million in revenue collected-by the Commonwealtii of Pemisylvania (see Table 6).
Table 6: Development Period Sales Taxes
Direct Economic Activity
Sales Tax on Construction Materials Sales Tax on FF&E
Total Sales Taxes on Direct Economic Activity
Indirect/Induced Economic Activity
Sales Tax on Taxable Indirect/Induced Economic Activity Liquor Tax on Indirect/Induced Economic Activity
Hotel Tax
Total Sales Taxes on indirect/induced Economic Activity'
Total Sales Taxes
Total
$3,051,000
$435,000
$3,486,000
$717,000 $13,00,0
$121,000
$85"l,000
$4,337,000
Total Paid to City of Phila
$763,000 $62,000
$825,000
$121,000
$13,000 $121,000
$255,000
$1,080,000
Total Paid to State of PA
$2,288,000
$373,000
$2,661,000
$596,000
$596,000
$3,257,000
Source: Urban Parliiem
Economic and Fiscal Impact of the Proposed Hollywood Casino Philadelphia Page 10

The for-profit business activit)' generated by the development of the HolljTvood Casino Philadelphia will spur on an additional $3.51 million in.additional tax revenue for the City of Philadelphia and $1.54 million for the Commonwealth of Pennsylvania (see Table 7).
Table 7: Development Period Business Tax & Real Estate Tax Benefits
Direct For-profit Business Activity
Construction Activity
FF&E Activity Design, Professional & Administration Activity
Total Direct For-Profit Business Activity
Indirect/Induced For-Profit Business Activity
Total For-Profit Business Activity
Annual Business Privilege & Net Profits Taxes Paid Annual Real Estate Taxes Paid on Business Property
Annual Use'& Occupancy Taxes Paid on Business Property
State Corporate and'Other Business Tax Paid
within Pennsylvania
$132,175,000
$6,210,000 $14,640,000
$153,025,000
$99,286,000
$252311,000
$1,541,000
Within Philadelphia
$105;750,000
$3,105,000 $12,990,000
$122,845,000
$61,929,000
$184,774,000
$1,464,000
$1,353,000 $688,000
Source: Urban Pariner,
Economic and Fiscal Impact of the Proposed Ho l l ywood Casino Philadelphia Page 11

4) ANNUAL ECONOMIC IMPACT
In addition to the one-time benefits associated with the development and construction of the casino, this project will result in on-going spending associated with the operation of the facility. The benefit of the increased level of expenditures on the region's economy is multiplied by the fact that Pliiladelphia area vendors and service providers will supply a significant portion of tiie goods and services consiuned in the operation of the Hollywood Casino Philadelphia facility. The incremental income generated by these businesses as a result of the casino's existence will further extend the economic impact on the local economy by inducing these businesses and their employees to iiicrease their overall level of consumption.
The overall economic impact of tlie HoU)T\'ood Casino Philadelphia is derived from two interrelated components:
• The direct impact of the casino's econornic activit}', and • The significant out-of-facility spending of visitors to the casino.
These t\ 'o components of economic activity constitute the direct economic impact of tlie Hollywood Casino Philadelphia. An important third impact—the indirec^induced economic activity stimulated by this direct spending—can also be traced through the regionaleconomy.
According to the IMPLAN model, the multipUers for indirect and induced impacts of die ongoing operations of the casino are 0.73416 for non-payroll expenditures of the casino and 0.87521 for out-of-facility spending of casino visitors. Applying these multipliers to the direct impact figures^, the estimated annual direct and indirect/induced economic impact of the Hollywood Casino Philadelphia is $596.7 million (see Table 8).
T a b l e 8: A n n u a l Economic Impac t ( i n M i l l i o n s , '12
Direct Economic Impact
Casino Economic Activity'
Visitor Spending (Outside Venue}
Total Direct Economic Impact in Region
Indirect/Induced Economic Impact
' Indirect/lnduced'Impact of Casino Economic Activity Indirect/Induced Impact of Visitor Spending (Outside Venue)
Total Indirect/Induced Econonijc Impact
Total Econonriic Impact
Do l la rs )
S 351.00 $ 97.34
$448.34
$ 63.17
S 85.19
$ 148.36
$596.70
Source: Urtan Partners
The basis for calculadng the indirect/induced impact for casino economic achvitj' is S86.04 million, vhich is equivalent to casino's annua! operating budget less non-payroll expenses tlial will be spent outside of the Commonvveallh of Pennsylvania (10% of noji-payroll expenses).
Economic and Fiscal Impact of the Proposed Hollywood Casino Philadelphia Page 12

Direct Economic Impact
Urban Partners utilized the projected income and expense statements prepared by Penn National to estimate the direct economic impact generated by the Hollywood Casino Philadelphia. The projected gross revenue from casino operations is approximately $351 million'^ and outlays will total $95.6 million annually, which does not include taxes. These outlays include all payroll, management, security, maintenance, utihties, suppUes, and services required to operate the facihties over a one-year period. Approximately 50% of this spending is anticipated to flow in the. forni of payroll expenses (i.e. wages, salaries and fringe benefits), and 90% of the non-payroll expenses wiU be spent within the Commoriwealth of Pennsylvania.
In addition to tiie economic activity occurring within tiie confines of tiie facihty, the casino is anticipated to generate significant visitor spending at other area establishments—including hotels, restaurants, and retail establishments. In order to estimate the amount of visitor expenditures outside the casino, the estimated 4.4 million visitors are first categorized into three geographical designations: 1) Philadelphia residents; 2) out-of-town visitors within 1-hr driving distance; and 3) out-of-town visitors outside of the 1-hr driving radius. Then, the estiniated percentage of visitors staying overnight at hotels were calculated from survey data collected from previous economic impact studies performed by Urban Partners.^^
As shov^Tj in Table 9, we estimate that seven percent of the visitors (or 308,000) are "incidental" casino visitors who may be in town for other prirnar}^ reasons. For the purpose of calculating the out-of-facilit}' visitor spending, the total number of incidental visitors are excluded from the analysis since the casino is not their primary reason for coming to Philadelphia. Of the remaining 4.092 million visitors, 35% are estimated to be Philadelphia residents and 58% are out-of-town visitorsi2_
Table 9: Characteristics of Casino
Estimated Annual Visitors (Rrst Year)
Philadelphia Residents Non-Philadelphia.Residents
Incidentals (in tmvn far other primary reasons)
Visitni" Ch a rar( gristles
Estimated Annual Visitors
Visitors Staying Overnight @ Hotel
Da ytrip Visitors
Visitors
4,400,000
1,540,000
2,552,000 308,000
Phila
Residents
1,540,000
-1,540,000
35%
5S% 7%
Non-Phila Residents Within 1 Hr
1,914,000
114,840
1,799,160
Non-Phila Residents
Outside 1 Hr
638,000 146,740
491,260
Total
4,092,000
261,580
3,830,420
Source: Urban Pailim^
'** Annual revenue from table games; S62 million. Taxed at 16% (or S9.92 million). The lax rate vAtt decrease lo 14% after the first two years of operation. Annual revenue from slot machines: $264 million. Taxed at 55% (or $145.2 million). Food and alcohol sales: $24.85 million (50% will be food). Merchandise sales: $150,000. ^' The breakdown of the visitors by geography were estimated using the Report of Findings of llie PiiHadelphia Gaming Advisory Task Force (2005) and from sun-'ej' data collected by Urban Partners for previous econonuc impact studies of entertaiimient events in the PtiiJadelphia area. '^ Estimate from the Reporl of Findings of Ihe Philadelphia Gaming Adi>isory Tnsic Force (2005).
Economic and fiscal Impact of Ibe Proposed Hollywood Casino Philadelfyhia Page 13

The estimated percentage of out-of-town visitors who will stay overnight at hotels is extrapolated from survey data collected by Urban Partners for previous econornic impact studies of entertainment events in the Philadelphia area. For visitors within a 1-hr driving distance, we estimate that 6% will stay overnight at a hotel (114,800 visitors). For visitors who are outside of the 1-hr driving distance, we estimate that 23% will use hotel lodging (146,740 visitors).
The amount of out-of-facilit}' spending is greatiy influenced by a visitor's overnight lodging plans. Visitors who stay overnight spend significantiy more per person than daytrip visitors. The following is an estimated out-of-facihty spending per person based on geographic breakdown and hotel lodging status^^:
Daytrip Visitors • Philadelphia Residents: • Inside 1-hr Radius: • Outside 1-hr Radius:
Dining $12.98 S14.13 $9.33
Shopping $10.63 $5.45 $8.17
Hotel $0 $0 SO
Total S23.61 $19.57 $17.50
Hotel Stalling Visitors • Philadelphia Residents: • Inside 1-hr Radius: • Outside 1-hr Radius:
Dining SO
$22.92 $9.88
Shopping $0
$13.99 $9.00
Hotel $0
$55.43 S9.00
Total $0
$92.35 $42.52
As sho\^'n below in Table 10, the estimated total for hotel expenditures is $10.14 milhon, the estimated total dining expenditures $54.07 milhon, and the estiinated total shopping expenditures $33.13 milHon for a total out-of-facility expendittures of $97.34 million.
Table 10: Annual Out-of-Facil ity
visitor Characteristics
Estiniated Annual Visitors
Visitors Staying Overnight @ Hotel
Daytrip Visitors
Hotel Stavine Visitor ExppndjtyreS Hotel Expenditures
Dining Expenditures
Shopping Expenditures
Non-Hotel Stavine Visitor Expenditures
Dining Expenditures
Shopping Expenditures
Total Out-of-Fac1lity Expenditures
Commercial Demand
Phila
Residents
1,540,000
-1,540,000
---
$19,984,000
$16,377,000
Non-Phila Residents
Within 1 Hr
1,914,000 114,840
1,799,160
$6,365,000
$2,633,000 $1,607,000
$25,416,000 $9,801,000
Non-Phila Residents
Outside 1 Kr
638,000
146,740
491,260
$3,770,000
$1,576,000
$1,436,000
$4,462,000
$3,911,000
Total
4,092,000
261,580
3)830,4 20
$10,135,000
$4,209,000
$3,043,000
$49,862,000
$30,089,000
$97,338,000
Source: Urlvii Par!nen>
• From survey data collected by Urban Partners for previous economic impact studies of entertainment events in the Philadelphia area. Responses regarding expenditure pallcms were collected for 1,900 visitors {860 sur\'eys responses).
Economic and Fiscal Impact of the Proposed Hollywood Casino Philadelphia Page 14

As shown in Table 8, taken together, the calculated total direct economic impact of casino and visitor expenditures on the regional economy that are attributable to the Hollywood Casino Philadelphia is $448.34 million.
Indirect/Induced Economic biipact
Assessing the indirect/induced economic impact involves tracking the additional rounds of spending within the region induced by businesses and their employees as a result of these direct expenditures. Inputting various expenditures by industry categories into the IMPLAN model. Urban Partners calculated the appropriate multipHer for indirect/induced economic activity resulting from the Hollywood Casino Philadelphia. The indirect/induced multiplier for casino expenditures is 0.73416 and the appropriate multipher for indirect/induced economic activity resulting from out-of-facihty visitor expenditures is 0.87521.
Applying these multipHers to the casino and visitor expenditures of the Holl}^vood Casino Philadelphia, a total indirec^induced economic impact of $148.36 million results.
Economic and Fiscal Impact of the Proposed Hollywood Casino Philadelphia Page 15

4.1) EMPLOYMENT I M P A C T FROM O N - G O I N G O P E R A T I O N S
The Holl}'wood Casino Philadelphia will result in significant employment within the Commonwealth and within Philadelphia (see Table 11). The casino will employ 1,150 full-time equivalent positions and direct non-payroll expenditures by the casino will result in the support of an additional 490 fuU-time positions. Employment supported off-site by the out-of-facility spending of the casino visitors is estimated at 1,860 full-time equivalent positions.
Taken together, these direct employment impacts total 3,500.fiiII-time equivalent jobs. Due to the proposed location of the casino and the fact that much of the visitor spending will be localized, this direct employment impact will be significantly concentrated within Philadelphia. Based on likely Holl}'wood Casino Philadelphia's employment patterns, the locations of its coritractors/suppliers, and the employment patterns within the key mdustries in which visitor spending will be concentratecl, we estimate that 3,210 of tiie total 3,500 full-time equivalentjobs supported by the Hollywood Casino Philadelphia will be located within Philadelphia and 2,410 fuU-time equivalent positions will be filled by City residents.
The indirect employment impact of the casino will result in the creation of 890 full-time equivalent positions—270 as an indirect result of the,casino's expenditures, and 620 due to the indirect impact of visitor spending outside the casino. Because the indirect economic activit}' resulting from the HoIl}'wood Casino Philadelphia will be more diffuse—both in terms of industrial sectors and location of employment—this, employment is beUeved to be spread more broadly throughout the region. We estimate that approximately 530 of the 890 full-time equivalent positions supported by the indirect economic impact of the Holl}' vood Casino Philadelphia will be located within Philadelphia and that 400 will.be filled by City residents.
Table 11: Permanent Employment Impacts
Direct Employment Impact
Casino:Employees (Annualized FTE)
FTE Employment.Due lo Non-Payroli Casino Expenditures within the Region
, Employment Due to Visitor Spending (Outside Venuej-Annualized FTE
Total Direct FTE Employment impact in Region
Indirect/Induced Employment Impact
Indirect/Induced Impact of Casino Expenditures
Indirect/Induced Impact of Visitor Spending (Outside Venue)
Total Indirect/induced Employment Impact
Total Employment Impact
Wi th in
Pennsylvania
1,150
490
1,860
3,500
270
620
•890
4,390
Wi th in
Philadelphia
1,150
290
1,770
3,210
160
370
530
3,740
Philadelphia
Residents
860
220
1,330
2,410
120
280
400
2,810
Source: Urban Parliieri
In total, the direct and indirect/induced employment impacts of the Holl}^vood Casino Philadelphia will be 4,390 full-time equivalent positions, including 3,740 located within Philadelphia and 2,810 held by City residents.
Economic and Fiscal Impact of the Proposed Ho l l ywood Casino Philadelphia Page 16

4.2) TAX REVENUE IMPACT
The Hollywood Casino Philadelphia will generate approximately $185.52 milUon in tax, revenues-$26.99 miUion in increased tax revenue for the City of Philadelphia and $158.53 milhon for the Commonwealth of Pennsylvania (see Table 12).
Table 12: Siunmary of Annual Tax Benefits^^
Taxes oh Wages & Salaries
Sales a Hotel Taxes
. Business Privilege & Net Profits Taxes
Real EstateTaxes Paid on Business Property
Use & Occupancy Taxes-Pa id on BusinesSjProperty
State Corporate,& Other,Business Taxes
Gaming Tax - Table Games
' Gaming Tax - Slot Machines
Total Annual Tax Benefits
For a t y of
Phila
$4,130,000
$4,300,000
$2,780,000
$2,670,000
$1,310,000
$1,240,000
$10,560,000
$26,990,000
For State of
PA
$4,050,000
$7,920,000
$3,240,000
$8,680,000
$134,640,000
$158,530,000
Total a t y 8i
State
$8,180,000
$12,220,000
$2,780,000
$2,670,000
$1,310,000
$3,240,000
$"9,920';000
$145,200,000
$185,520,000
Source: Urban Partners
Wage Tax Revenue Impact
The 4,390 full-time equivalent jobs supported directly and indirectly by the Hollywood Casino Philadelphia are estimated to generate wages and.salaries of approxirnately $131.94 million (see Table 13). These estimates of wage and salary impact were derived using industrial sector factors developed as part of the IMPLAN analysis adjusted to 2012 dollars. Of this $131.94 milhon in wages and salaries, $108.05 million is estimated to be earned within Philadelphia and $81.04 milhon is estimated to be earnedby Philadelphia residents.
Table 13: Annual Wage & Salary Impacts (in Millions)
Direct Wage & Salary Impacts
Casino Payroil
Wages & Salaries Due to Non-Pa'yroll Casino Expenditures within the Region
Wages & Salaries Due to Visitor Spending (Outside Venue)
Total Direct Wage & Salary Impacts
Indirect/Induced Wage St Salary Impacts
Indirect/Induced Wage & Salary Impact of Casino Expenditures
Indirect/Induced Wage & Salary Impact of Visitor Spending (Outside Veriue)
, Total Indirect/Induced Wage;& Salary Impacts
: Total Wage & Salary Impacts
Wi th in
Pennsylvania
$40.63
$11.92
$36.04
$88.59
$13.66
$29.69
$43.35
$131.94
Wi th in
Philadelphia
$40.63
$7.16
$34.24
$82.03
$8.20
$17.82
$26.02
$108.05
Philadelphia
Residents
$30.47
$5.37
$25.68
$61.52
$6.15
$13:37*
$19.52
$81.04
Source: Urian Parli:ers
See tax rates referenced on page 9.
Economic and fiscal Impact of the Proposed Hollywood Casino Philadelphia Page 17

This employment activit}' is estimated-to generate $4.13 million in wage tax revenue for the City of Philadelphia and another $4.05 milUon in income tax revenue for the Coiriinonwealth of Pennsylvania (see Table 14).
Table 14: A imual Taxes on Wages
1
, Total pi.rectWages.&iSalaries
Total Indirect/Induced Wages'Si Salaries
, TotalWagesS.Salaries-
Wage Taxes Paid.to City of Philadelphia
ihcome.Taxes Paid to the Commonwealth
& Salaries
TotalPaid
within PA
$88;59D;000; $43;350,000
$13X940,000
.$4;050,000
TotalPaid
within Phita
$82,020,000
$26,020,000
$108,040,000
$4,130,000
Total Paid'to
Phila Residents
$61,520,000 $19;520,000
$8i;040,000
$3,180,000
to ta l Paid within Phila to Non-Resldents
$20,510,000
$6,510,000
S27,020;000
$940,000
Source: llrtntn Partners
Sales and Hotel Tax Impact
Additionally, sales and hotel taxes directly and mdirectiy resulting from tiie on-site spending of the.Holl}'wood Casino Philadelphia, as well as^the out-ofrfacihty spending of casino-visitors, is estimated to generate another $12,2 million in.increased public revenue, including $4.3 million in revenue collected by the City of Philadelphia and $7.9 miUion in revenue collected by die Commonwealth of Pennsylvania (see Table 15).
Table 15: Annual Sales Tax & Hotel Tax Benefits 1 ~
Direct Economic Activity
Sales tax on InTpacility Sales Sales Tax on Visitor Shoppmg (Outside Venue)
Sales Tax on Visitor Food,Spendirig'(Outside Venue) LiquorTax on Visitor Retarl.Spending {Outside A/e'nue) Sales Tax on Hotel.Rdbms'
Gasoline Tax
Hotel Tax
t Tdtal'Sales Taxes oniDii'ect-EconomIc Activity
' Indirect/Induced,Economic Activity
Sales;Tax on Taxable lndirect/lhduced€coriornic Activity^ Liquor Tax.onlndirectyinduced Economic Activity
• Hotel Tax
Total Sales'Taxes_oii Indirect/lriduced Economic.Activity
Total SalesTaxes
Total
$2,000,000
$2,650;000
$3,470,000 $i,o8d;ooo
$760,000
$720,000 $830,000
$11,510,000 ._
$580,000 $10,000
$120,000
$7io,db"d
$12,220,000
Total Paid to City of Phila
$500,000 $660,000
$870,000
$1,080,000 $200,000
$830,000
$41140,000
$30,000
$10,000 $120,000
,$160,000
$4; 300,000
Total Paid to state of PA
.$1,500,000 $1,990,000^ S2i600,000
$560,000'
.$720,000
$7,370,000
$550,000
'$550,000
$7,920,000
Source: Urban Par Uteri
Economic and Fiscal Impact of the f^oposed Hollywood Casino Philadelphia Page .18

Business and Real Estate Tax Inipnct Of the $596.7 milhon in total direct and indirect economic impact, $398.33 milhon is estimated to support private for-profit business activity, including $351.41miUionin business activity witiiin Philadelphia (see Table 16).
Table 16: For-Profit Business Activity Generated (in Millions)
'
)
Direct For-Profit Business Activity
For-Profit Business Activity Due to Non-Payroll Casino Expenditures
For-profit Business Activity Due to Visitor Spending (Outside Venue)
TotalDirect For-Profit Busiriess Activity
Indirect/Induced For-Profit Business Activity
Indirect/Induced For-Profit Business Activity Due to Casino Expenditures
Indirect/Induced For-Profit Business Activity Due to Visitor Spending
Total Iridirect/lnduced ForTPrbflt Business:Activity
1 Total For-profit Business Activity
(Outside Venue)
Within
Pennsylvania
$195.88
$97.34
$293.22
$31.42
$73.69
$105.11
$398.33
Within
Philadelphia
$195.88
$92.47
$28835
$18.85
$44.21
$63.06
$351.41
Source; Urban Partners
This for-profit business activit}' is estimated to generate $6.76 million in additional tax revenue for the Cit}' of Philadelphia and S3.24 for the Commonwealth of Pemisylvania (see Table 17).
Table 17: Annual Business Tax & Real Estate Tax Benefits
1
Direct For-Profit Business Activity
For-Profit Business Activity Due to Non-Payroll Organizational,Expenditures .For-profit Business Activity Dueito Audience Spending.
Total Direct For-Profit Business Activity
Indirect/Induced For-Profit Business'Activity
' indirect/Induced For-profit Business Activity Due to Organizational Expenditures Indirec^induced For-Profit Business Activity Due to Audience Spending
Total Iridire'ct/lnduced'For-Profit Business'Activity
Total Fbr-Profit Business Activity
Annual Blisiness Privilege & Net Profits Taxes Paid Annual Real Estate Taxes Patdon Business Property
' Annual Use & Occupancy Taxes Paid on Business Property
State Corporate and Other Business Tax Paid
Within Pennsylvania
$195,880,000 $97,340,000
$293,220,000
$31,420,000 $73,690,000
$105,110,000
$398,330,000
$3,240,000
Within Philadelphia
$195,880,000 $92,470,000
$288,350,000
$18,850,000 $44,210,000
$63,060,000
$351,410,000
$2,780,000 $2,670;000 $1,310,000
Source: Urban Parlitets
Economic and Fiscal Impact of the Proposed Hollywood Casino Philadelphia Page 19

Gaming Tax Impact
Tlie operations of the Hollywood Casino Philadelphia will, result in significant gaming tax revenue. Based on the proposed number of tables games and slot machines (81 and 2,050, respectively), the Hollywood Casino Philadelphia is estimated to generate $143.32*milhon in gaming tax revenue for the Commonwealth of Pennsylvania, and $11.8 million in host fees for the Cit}' of Philadelphia (see Table 18).
Table 18: Annual Gaming Tax Benefits
' TaxonTable^Games Tax on Slot IVlachines
State Share Local Siiare Economic Development and Tourism:Fund Horse Racing Fund
• Total Annual Gaming Tax Benefits
For a ty of Phila
$1,240,000
$10,560,000
..
$11,800,000 .
For State of PA
$8,680,000
$89,760,000
.$13)200,000 $31,680,000
$143,320,000
Total Gty & State
$9,920,000
$89/760,000 $10,560,000 $13,200,000 $31,680,000
$155,120,000
Source: Urixni Parfwrs
Economic and Fiscal Impact of the Proposed Hollywood Casino Philadelphia Page 20
5) A P P E N D I X A : W H A T IS I M P L A N ? (Adapted from the IMPLAN loebsite)
Created by the Minnesota IMPLAN Group, Inc, the IMPLAN software system helps analysts
address questions about economic study and analysis like these:
• How does the local economy function?
• What would the economic consequences of this project be?
• UTiat would the effect of this company/base closure be?
By constructing Social Accounts that describe the structure and function of a specific economy, IMPLAN creates a localized model to investigate the consequences of projected economic b'ansactions in a geographic region. Used by thousands of pubhc and private institutions, IMPLAN is the most widely employed and accepted regional economic analysis software for predicting economic impacts.
IMPLAN Analysis
To ensure accuracy, IMPLAN's data is compiled from a wide variety of sources, and each Social
Accounting Matrix is derived from unique local and census information. IMPLAN's data can be
modified to accommodate new technologies or specifications of local industries, and is reported
in a sectoring scheme roughly corresponding to NAICS.
With the IMPLAN modeling system, analysts can create an impact study which will track the effects of a modeled event on 440 unique sectors in the United States. The result is a detailed summary of economic impacts including changes m jobs, household incomes, tax impacts, and gross regional product. The summary can be used to show the effect of firms moving into an area, special events, introduction of new teclinologies, recreation and tourism, militar}' base closures, changes in government spending and other similar events.
Hoxo IMPLAN works
Social Accounting: IMPLAN's Social Accounting Matrices (SAMs) capture the actual dollar
amounts of all business transactions taking place in a regional economy as reported each year
by businesses and governmental agencies. SAM accounts are a better measure of economic flow
than traditional input-output accounts because they include "non-market" transactions.
Examples of these transactions would be taxes and unernployrhent benefits.
Multipliers: Social Accounting Matrices can be constructed to show the effects of a given change on the economy of interest. These are called Multiplier Models. Multipher Models study the impacts of a user-specified change in the chosen economy for 440 different industries. Because tiie Multipher Models are built directly from the region specific Social Accounting Matrices, tiiey will reflect the region's unique structure and trade situation.
Economic and Fiscal Impact of the Proposed Hollywood Casino Philadelphia Page 21

Multiplier Models are the framework for building impact analysis questions: Derived mathematically, these models estimate .the magnitude and distributipn: of: ecohoniic impacts, and measure three types of effects whichj are displayed in,tHe^final report' These are^the direct, indirect, and.induced changes'within the economy. Direct-effects are determined^'by the Event as defined by the user (i.e. a $10 milliori doUar order is a.$10;milhon dollar direct.effect). The "indirect effects are determined by the arnount oflhe direct:effect spent within^th'e study region on supphes, services,.labor and taxes. Finally'the induced effeGt-measiires:the=moneythat is re-spent in-tlie study area as aresidt of spending from the indirect effect. Each, of these steps recogriizes ari'important leakagejfrpm theiecononiicstudy region spent-on purchases outside of the defined area. Eventually these leakages will stop;the cycle.
Economic arid Fiscal Impact of the Proposed Hollywood Casino Philadelphia Page 22

Penn National Gaming, Inc. Hollywood Casino, Philadelphia
700 PackerAvenue
utility Availability and Feasibility Report
Prepared For:
• j -•..• * ' K . i . , . ^ / . . ( " f i _« . .vf i - . - : , - ' j - .^ . i - . i ' . -1 . - , • •1 ' . ~f.
" RENN:;NATI€>NAL
PENN NATIONAL GAMING, INC. 825 Berkshire Boulevard Wyomissing,.PA19610
Prepared By:
PENNONI ASSOCIATES, INC. Consulting Engineers
3001 Market Street Philadelphia, PA 19104
November 7, 2012

PFWj^l''?^Ji\TT(^fSJv^ PENN NATIONAL.GAIVIING, INC. *5'^.5'. i^ '&{^' iV.^>r>-i^ 700 PackerAvenue GAM I NCi. 0:NCA yjjij^y Availability & Feasibility Report - • • f ' . - — - - '
Table of Contents
Page No.
I. Executive Summary 1
II. Introduction and Background Information 2
III. Existing Site Utilities 4
IV. Utility Relocation Approval Process 9
V. Utility Availability & Service Connection Requirements 10
VI. Limitations and Conditions 14
Photographs 15
LIST OF FIGURES:
Figure 1 -Area Map 19
Figure 2 - Vicinity Map 20
Figure 3 - Conceptual Site Plan 21
Figure 4 - Conceptual Sewer Relocation Plan 22
Figure 5 - Conceptual Water Main Relay Plan 23
Figure 6 - Conceptual Gas Main Relocation Plan 24
Figure 7 -Cross Section View of Packer Avenue 25
Off-Site Utility Relocation Construction Cost Estimate 26
APPENDICES:
Philadelphia Water Department - Private Cost Contracts A
Philadelphia Water Department - Developer's Agreement B
PENNONI ASSOCIATES, INC. Consulting Engineers

P?Er>STS'-;NA^I0NA'L G'AMIN.G;-iN'cv..
PENN NATIONAL GAMING, INC. 700 Packer Ayenue
Utility Availability & Feasibility Report
I. Executive Summary
Penn National Gaming in an effort to acquire a gaming license has an option to purchase an approximately 13 acre property, located at 700 Packer Avenue, Philadelphia, PA 19148. Prior to purchase, an investigation into various aspects of the site is necessary to better determine the feasibility of developing a first class gaming and entertainment site. The nature of this study is to review and understand the existing utility facilities in order to preliminarily determine the extent of effort necessary to accommodate the proposed development and to determine the ability of existing utilities to provide service.
From a reyiew of available utility records, we have determined that the proposed development site will be in close proximity to existing water, sanitary sewer, natural gas, telephone, and electrical utility infrastructure facilities. Based on the available information, it is our option that the existing adjacent utility infrastructure is capable of adequately serving the scope and scale of the proposed development. As the project is advanced accurate utility demand projections will need to be made and the proposed utility service connections will need to be made coordinated with the appropriate utility company.
Presently, there is a 60' wide Right-of-Way (Former Geary Street) that bisects the site from Darien Street to 7** Street. This- Right-of-Way is reserved for use as a drainage right-of-way by the Philadelphia Water Department (PWD) and contains an existing, active 6'-0" (H) x 7'-0" (W) rectangular R.C. combined sewer that conveys both storm-water and sanitary sewage. According to PWD record plans this sewer as well as the sewers in Darien Street, 7* Street and Packer Avenue adjacent to the site are constructed on timber piles due to poor soil conditions. In addition, this Right-of-Way contains an existing, active 8" water main that connects the existing 12" water main in Darien Street to the existing 12" water main in 7' Street.
For sanitary and storm-water collection services, there are public combined flow sewers in and around the proposed site. In order to avoid the encumbrance of a utility easement traversing the site, it will be necessary to relocate this.existing R.C. combined sewer. We anticipate that the existing, active 8" water main that transverses the site within this Right-of-Way can,merely be abandoned since there are no active service connections from this main.and since it merely provides redundancy with the water distribution system.
In order to accommodate the proposed build out of the site, we have determined that it is feasible to re-route this existing R.C. combined sewer around the property via the public right-of-way of Darien Street and Packer Avenue. However as a result of
PENNONI ASSOCIATES, INC. Consulting Engineers
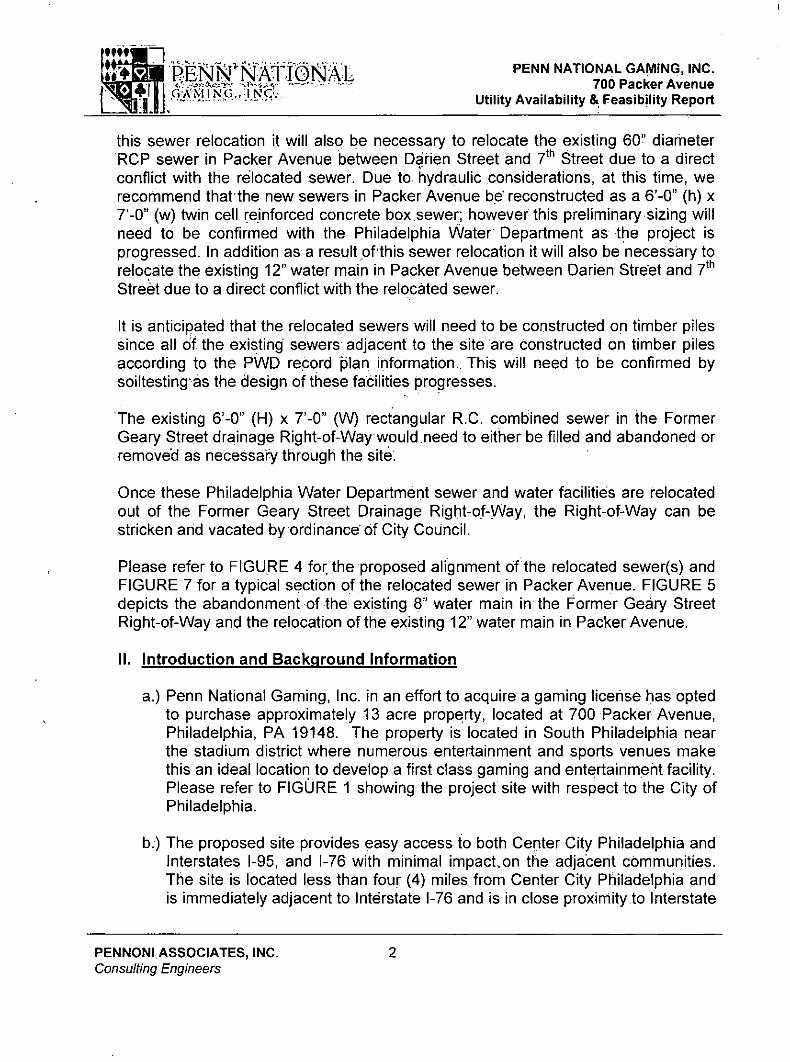
G A M I N G . . I N C V
PENN NATIONAL GAMING, INC. 700 PackerAvenue
Utility Availability & Feasibility Report
this sewer relocation it will also be necessary to relocate the existing 60" diameter RCP sewer in Packer Avenue between Darien Street and 7*' Street due to a direct conflict with the relocated sewer. Due to. hydraulic considerations, at this time, we recommend that the new sewers in Packer Avenue be' reconstructed as a 6'-0" (h) x 7'-0" (w) twin cell reinforced concrete box sewer; however this preliminary sizing will need to be confirmed with the Philadelphia Water Department as the project is progressed. In addition as a result of this sewer relocation it will also be necessary to relocate the existing 12" water main in Packer Avenue between Darien Street and 7*' Street due to a direct conflict with the relocated sewer.
It is anticipated that the relocated sewers will need to be constructed on timber piles since all df the existing sewers adjacent to the site are constructed on timber piles according to the PWD record plan information.. This will need to be confirmed by soiltesting'as the design of these facilities progresses.
The existing 6'-0" (H) x 7'-0" (W) rectangular R.C. combined sewer in the Former Geary Street drainage Right-of-Way would.need to either be filled and abandoned or removed as necessary through the site.
Once these Philadelphia Water Department sewer and water facilities are relocated out of the Former Geary Street Drainage Right-of-Way, the Right-of-Way can be stricken and vacated by ordinance of City Council.
Please refer to FIGURE 4 for the proposed alignment of the relocated sewer(s) and FIGURE 7 for a typical section of the relocated sewer in Packer Avenue. FIGURE 5 depicts the abandonment of the existing 8" water main in the Former Geary Street Right-of-Way and the relocation ofthe existing 12" water main in PackerAvenue.
II. Introduction and Background Information
a.) Penn National Gaming, Inc. in an effort to acquire a gaming license has opted to purchase approximately 13 acre property, located at 700 Packer Avenue, Philadelphia, PA 19148. The property is located in South Philadelphia near the stadium district where numerous entertainment and sports venues make this an ideal location to develop a first class gaming and entertainment facility. Please refer to FIGURE 1 showing the project site with respect to the City of Philadelphia.
b.) The proposed site provides easy access to both Center City Philadelphia and Interstates 1-95, and 1-76 with minimal impaction the adjacent communities. The site is located less than four (4) miles from Center City Philadelphia and is immediately adjacent to Interstate 1-76 and is in close proximity to Interstate
PENNONI ASSOCIATES, INC. Consulting Engineers

'.ri
RENN NATIONAL G-A"MlNG,..ilNO.
PENN NATIONAL GAMING, INC. 700 Packer Avenue
Utility Availability & Feasibility Report
1-95. The site is also located less than eight (8) miles from the Philadelphia International Airport. Generally the commercial / industrial areas of this community are bound by 1-76 to the north, 1-95 to the, south and east, and Broad Street (State Route 611) to the west. The proposed site and Its proximity to Center City Philadelphia and 1-76 /1-95 is shown on the attached Vicinity Map designated as FIGURE 2.
c.) It is our understanding that the optioned property includes the following parcel:
Address
700 Packer Avenue
TOTAL:
Total Lot Area
13.35+/-Acres
13.35+/-Acres
Please refer to FIGURE 3 showing the project site overlaid with a conceptual site plan.
d.) The site is located in the City's Second,Council District that is represented by Councilman Kenyatta Johnson. The site is located in the City's 39* ward, which is bound by Broad Street to the West, Mifflin Street to the North, and Delaware River to the East and South.
e.) Historically, the existing site was used, as an industrial type of facility. From our research of historical maps ofPhiladelphia, the site was developed after the 1960's. Prior to that, we believe the existing site was either used as farmland or undeveloped'. In addition, we believe the existing site is located directly above or near old creek beds, namely Hollanders and'Hay Creeks.
f.) The existing site is occupied by a' 120,218 +/- square foot mixed use commercial building which contains an off track betting facility, vacant warehouse space, warehouse space occupied by Packer avenue Foods, a garage used for the installation of taxi radios by Verifone, and office space occupied by Catch Packer Recovery Program and the Pennsylvania Lottery. Additionally, the subject parcel contains a 9,000+/- square foot vacant truck repair garage.
g.) According to elevation data obtained from City Plan #43S, the elevations of the public streets adjacent to the site vary from +9.00 to +12.00 City Datum while the 100-year flood elevation of the Delaware River in this vicinity is elevation +4.29+/- City Datum. (Elevation +0.00 City Datum = Elevation +5.71+/- National Geodetic Vertical Datum of 1929).
PENNONI ASSOCIATES, INC. Consulting Engineers

F?ENN;isJ^10IvJlL GvVl?fiN.G;,ji;NCv
PENN NATIONAL GAMING, INC. 700 PackerAvenue
Utility Availability & Feasibility Report
The site is located on published Federal Emergency Management Agency Flood Insurance Rate Map (FIRM) panel No. 35 of 45, Community Panel No. 4207570035C with an effective date of May 29, 1981. The FIRM designation for the proposed site is Zone C, defined as areas of minimal flooding.
h.) The site is-located in the proxinnity of the Delaware River. As such, below any fill materials that may have been placed, there is likely an alluvial soil layer that generally consists of fine sand, silt, clay and organic matter. Although no geotechnical investigation has yet been performed on the site in conjunction with this project, it is anticipated that the physical properties of this layer will make it highly compressible when loads are applied. Deposits of compact sands and gravels generally underlie the alluvial soil layer. This general information is confirmed by the available PWD record plans that indicate that the existing sewers in the area are supported by timber piles. Based on available historical information, it is anticipated that groundwater throughout the site will generaljy be^encountered at relatively shallow-depths at about 10 feet below the ground surface.
i.) The existing site conditions along Seventh Street, Packer Avenue, and Darien Street are shown in the attached Photographs numbered 1 through 7.
j.) The purpose of this Utility Availability and Feasibility Report is to review and understand the.existing utility facilities in order'to preliminarily determine the extent.of effort necessary to accommodate the proposed development and to determine the ability of existing utilities to provide service.
In order to maximize the .area available for proposed development, we have also verified the feasibility of relocating the existing Philadelphia Water Department sewer and water main facilities from the existing 60' wide Former Geary Street Drainage Right-offWay that bisects the site from Darien Street to 7" Street so that this right-of-way can be stricken and vacated. In addition to confirming the feasibility of relocating this existing sewer and water utility infrastructure; this report also identifies an order of magnitude construction costs for these utility relocations.
Existing Site Utilities
a.) We contacted the Pennsylvania One Call System on October 29, 2012 and requested existing underground utility record plan information for the project area from all involved utilities. Record Plans for the following locations were requested:
PENNONI ASSOCIATES, INC. Consulting Engineers

REBI?^1SJ#II0ML GvVMlN.G,,ilN.C-;
PENN NATIONAL GAMING, INC. 700 Packer Avenue
Utility Availability & Feasibility Report
LOCATION
Packer Ave. from 10** St. to Lawrence St. Darien St. from Pattison Ave. to Packer Ave. /•^ St. from Pattison Ave. to Packer Ave. Hartranft St. from Darien St. tb 11*^ St.
WARD
39 39 39 39
PAONEGALL SERIAL NO. 3030800 3030800 3030800 3030800
b.) Based on utility record plans that we have compiled, it is our understanding that following companies presently maintain utilities in proximity to the project site:
1. Philadelphia Water Department 2. Philadelphia Gas Works 3. PECO Energy 4. Verizon 5. Comcast Cable 6. Zayo Bandwidth 8. Philadelphia Streets Department
c.) As part of our utility records compilation, we also obtained the Highway Supervisors. Plans for the project area from the Philadelphia Department of Streets. These plans are maintained by the Philadelphia Department of Streets and are basically a compilation of the various utility record pjans showing the utilities in;a given :area. However, these plans may not be 100% accurate as they are not continuously updated.
d.) The Philadelphia Water 'Department owns and maintains the potable water distribution system as well as the sanitary and storm-water collection systems in the City of Philadelphia. Additional information concerning the Philadelphia Water Department is available via their website at vw\w.phila.aov/water. The following is a summary ofthe Philadelphia Water Department infrastructure within the project area:
1. Water Distribution System: The water distribution system in the pj-oject area is shown in tiie attached FIGURE 5. In addition to the mains themselves, there are numerous fire hydrants, valves and water service connections in the project area. The project site receives potable, water from the Department's Baxter Water Treatment Plant. The Baxter Plant pumps raw water from the Delaware River at a point just north of the Pennypack Creek. The treated water is then pumped from the Lardner's Point Pumping Station and is distributed to various parts of Philadelphia.
PENNONI ASSOCIATES, INC. Consulting Engineers

WNN'NAflONAL GvVNHNG;.ilNC'.-
PENN NATIONAL GAMING, INC. 700 PackerAvenue
Utility Availability & Feasibility Report
2. The project Is loiDated in what is known as the East Park District service area. The static water pressure in the water distribution system at this location is reportedly just under 50 PSI, although no pressure tests have yet been performed for this project. The following table summarizes the existing water mains in each of the streets adjacent to the project:
3.
LOCATION
Packer Avenue from Darien St. to 7*' St.
Drainage ROW from Darien St. to 7*'' St. Darien St. from Packer Ave. to Hartranft St.
S 7' St. from Hartranft St. to Packer Ave.
WATER MAIN FACILITIES
12" Distribution Main & 24" Transmission Main
8" Distribution Main 12" Distribution Main
12" Distribution Main& 20" Transmission Main
Generally all service connections are from the distribution water mains and the transmission water mains feed the distribution mains.
Sanitary and Storm-Water Collection System: In this section ofthe City, the sanitary sewerage sand storm-water runoff are combined in a single piping system, as is common in the older areas of the City. The combined sewers in and around the project site are shown on the attached Figure 4. Under nornnal conditions, intercepting, chambers and sewers divert the combined flow to the wastevyater treatment plant. However, during severe storm'events, there may be a. combined sewer overflow into the river via the outfall pipe since the intercepting chambers and sewers cannot accommodate all of the runoff from the larger storms.
Sanitary sewerage from the project site is treated at Philadelphia Water Department's Southeast plant.that is located at Pattison and Delaware Avenues in South Philadelphia. In addition to the sanitary sewers and storm-water conduits themselves, there are numerous inlets, manholes, and junction chambers in the project area as are indicated on attached Figure. The following table summarizes the existing sanitary and storm-water collection system facilities in each of the streets adjacent to the project:
LOCATION
th Packer Avenue from Darien St. to 7 St
SANITARY &STORIVI-WATER (SW) FACILITIES 60" RCP Combined Sewer
PENNONI ASSOCIATES, INC. Consulting Engineers

RENNINATIONAL G-AMlNG..i|NC';
PENN NATIONAL GAMING, INC. 700 Packer Avenue
Utility Availability & Feasibility Report
Drainage ROW from Darien St. to 7' St.
Darien St. from Packer Avenue to Hartranft St.
/ ^ St. from Hartranft St. to Packer Ave.
6'-0" (H) X 7'-0" (W) Rect. R.C. Combined Sewer 24"/30"/42" RCP Combined Sewers 6'-0" (H) X 8'-0" (W) Rect. R.C. Combined Sewer/42" RCP Combined Sewer
According to PWD record plans these sewers adjacent to the site are constructed on timber piles due to poor soil conditions.
e.) The Philadelphia Gas Works (PGW) owns and maintains the natural gas distribution system in the City of Philadelphia, fhe Philadelphia Gas Works is the largest municipally owned natural gas utility in the country. The gas mains that are owned and maintained by the Philadelphia Gas Works range in size from about 1-1/4" to 36" diameter and the pressure ranges from about 5 PSI to 150 PSI. Additional information concerning the Phiiadelphia.Gas Works is available via their website at www.pqworks.com. Based on information received from PGW in response to our PA-One Call request, PGW maintains the following gas main infrastructure adjacent to the project site:
LOCATION
Packer Ave. from Darien St. to 7* St.
Darien St. from Packer Ave. to Hartranft^St. 7* St. from Hartranft St. to Packer Ave.
GAS MAIN FACILITIES 24"SteelHPMain(150PSI);
6" Steel HP Main (35 PSI) 2" Steel HP Main (150 PSI) 12" Steel HP Main (35 PSI)
Please refer to FIGURE 6 showing the existing gas mains adjacent to the project site. It is noted that the existing 6" steel HP gas main (35 PSI) in Darien Street from Packer Avenue to Hartranft Street solely provides service to the existing building structure at 700 Packer Avenue and as such we believe that this section of main should be abandoned in conjunction with the project. The abandonment of this main will also facilitate the sewer reconstruction described in the sewer section of this report.
In addition, to the gas mains described above, there is also an existing 3" steel HP gas service (35 PSI) extending from the 12" gas main in 7* Street approximately ninety (90) feetsouth of the drainage ROW that traverses the site that provides gas service to the former truck maintenance building that is located on the southerly side of the site. It is anticipated that the new gas service to the casino will be located to the north of this existing gas service
PENNONI ASSOCIATES, INC. Consulting Engineers

RENNir>5!A^10NAL G'AA Ii\'S; 'tNC'.
PENN NATIONAL GAMING, INC. 700 Packer Avenue
Utility Availability & Feasibility Report
and will extend into the central plant of the new Hollywood Casino. The existing 3" steel HP gas service would then be abandoned.
In summary, we do not believe that any gas mains will need to be relocated to allow for the construction of the proposed HoIIyvyood Casino and that gas service to the Casino can readily be supplied via existing adjacent PGW infrastructure. Gas dehnand projections for the project and details of the required gas service connections will be coordinated with PGW as the project is advanced.
f.) The PECO Energy Company (PECO), a division of Exelon Energy Corporation owns and maintains the electrical distribution system in the City of Philadelphia. These facilities include both aerial and underground electrical distribution and transmission infrastructure. At this time, PECO Energy has not responded to our PA-One Call request. We have obtained the following PECO infrastructure information from past records near the.project site:
LOCATION
Packer Ave. from Darien St. to 7* St.
Darien St. from Packer Ave. to Hartranft St. 7 ^ St. from Hartranft St. to Packer Ave.
FACILITIES 20" X 21" Duct Bank; Aerial facilities. Unknown Unknown
g.) Verizon generally owns and maintains the telephone and communications system in the City of Philadelphia. These facilities include both aerial and underground telephone and communications system infrastructure. The following is a summary ofthe Verizon infrastructure within the project area:
LOCATION Packer Ave. from Darien St. to 7*-St.
FACILITIES 9"xT4"& 9" x-9" conduits
h.) Comcast Cable provides cable television and has not yet responded to our PA-One Call request. Therefore,, they have not been identified as either having or not having existing facilities within the area.
i.) Zayo Broadband has been identified by PA-One Call as having fiber lines within close proximity to the project site. At this time, Zayo Broadband has not sent us detailed plans of their infrastructure showing size and depth of their line in the area. However, we were able to determine the presence of their fiber line from their website. The following is a summary of the Zayo Broadband facility within the project area:
PENNONI ASSOCIATES, INC. Consulting Engineers

D..->... --..-. BENN'.NATIONAL GA'NI'ING. ^INC.
PENN NATIONAL GAMING, INC. 700 PackerAvenue
Utility Availability & Feasibility Report
LOCATION 7^ Street from Packer Ave. to Pattison Ave.
FACILITIES Size & Depth Unknown
j.) The Philadelphia Streets Department generally maintains underground and aerial traffic signal and street lighting infrastructure in the City of Philadelphia as well as the surface mounted street lights and traffic signal facilities. Based on our field view of the project site there are existing traffic signals and street lights facilities in the project area. In addition, we believe that there may be underground street lighting facilities along PackerAvenue, Darien Street, and Seventh Street since some of the existing street lights for those streets are mounted on lighting poles with no aenaf feeds. These facilities may need to be relocated or adjusted as necessary to allow for the proposed development.
IV. Utilltv Relocation Approval Process
a.) As mentioned above, it will be necessary to relocate the existing 6'-0" x 7'-0" R.C. combined sewer and the .8" water main that are located within the Former Geary Street Drainage Right-of-Way that bisects the site from Darien Street to Seventh Street. In,order to avoid the encumbrance of having a utility easement within the property, we have used public Right-of-Ways surrounding the property to relocate these lines. In order to reconstruct the 6'-0" X 7'-0" R.C. combined sewer in Packer Avenue, it will be necessary to shift the existing 60" R.C.P combined sewer further northward. This will provide the. necessary trench width to construct twin 6'-0" x 7'-0" R.C. combined sewers. Furthermore, the existing 12" water main, in south side of Packer Avenue will be affected by the relocation and so this water main will require relocation as well. We have prepared conceptual utility relocation sketches showing the approximate route of each line as shown in FIGURES 4 and 5.
b.) Although the utility demands from the proposed development are unknown at this time, based on the historic industrial use ofthe site and area and the size of the existing adjacent utility line particularly the water, sewer and gas facilities, we anticipate that the utilities as they presently exist will be able to meet the demands ofthe site without significant required improvements. This will be confirmed with each respective utility owner during the design process.
c.) The relocation of any Philadelphia Water Department facilities requires the approval of the Department. If the facility is located within a city street or Philadelphia Water Department Right-of-Way, the Developer is responsible for the design and construction of the relocated facilities. The Philadelphia
PENNONI ASSOCIATES, INC. Consulting Engineers

n\,__.,.. ,..., PENN NATIONAL G'A'MING, HIN'G .
PENN NATIONAL GAMING, INC. 700 Packer Avenue
Utility Availability & Feasibility Report
Water Department refers to these projects as "Private Cost Contracts". The design of the facilities must be in accordance with Philadelphia Water Department requirement and procedures and the design plans and specifications must be approved by the Department. The general procedure for developing "Private Cost Contracts" is outlined in the attached Philadelphia Water Department pijblication last revised January 13, 2010 which is included as APPENDiX A.
d.) Once the contract documents are approved, the. Developer must enter into a "Developer's Agreement" with the Department. A sample "Developer's Agreement" is included in APPENDIX B. The construction of the facilities must be performed by a contractor that, is prequalified by the Department in accordance with the approved plans and specifications. The work is subject to inspection and approval ofthe Department.
e.) Once the Philadelphia Water Departnrient sewer and water facilities are relocated out of the Former Geary Street Drainage Rightyof-Way, the Right-of-Way can be stricken and vacated by ordinance of City Council.
f.) The relocation of any utility within existing street Right-of-Way will require the approval of the Philadelphia Department of Streets. If the facility is located within a city street or Right-of-Way, the Developer is responsible for the design and construction of the relocated facilities. The design of the facilities must be in accordance with Philadelphia Streets Department requirements and procedures, as well as the design requirements and procedures of the respective utility company being relocated. Plans and specifications must be approved by the Department. Also, the Department of Highway Supervisors, a division of the Streets Department must approve the relocation. The Highway Supervisors will review the effect that the relocation will have on other City and utility company facilities in the vicinity. A Highway Occupancy Permit will be issued indicating approval of the new utility location and permitting it to occupy the Right-of-Way.
V. Utility Availability & Service Connection Reguirements:
a.) Storm Drainage:
1. As mentioned above, this section ofthe City has combined sewers which collect both sanitary and storm-water flows. The PWD is responsible for the operation and maintenance ofthe sewer lines in the vicinity ofthe site. These combined sewers capture and convey storm-water runoff from roadways and adjacent properties.
PENNONI ASSOCIATES, INC. Consulting Engineers
10

PFNM NIATTOKlAI PENN NATIONAL GAMING, INC. *^*^.^!:> l^r\* i ^ l ^ .^ .L 700 PackerAvenue • i ^ » .
C'.AMlNti. 1 NC. Utility Availability & Feasibility Report
2. It is anticipated that any new development at the site would discharge into the existing PWD drainage system to the extent possible. Service connections to the PWD drainage system is allowed via permit. Such connections must comply with PWD regulations as well as the Philadelphia Plumbing Code.
3. Since we anticipate a change to the on-site grading and impervious area coverage, there could be a significant change in the storm-water run-off within the project area as a result of this development. Based on current storm-water management requirements implemented by the PWD as of January 2006, it is anticipated that on site storm-water management will be required. Essentially the regulations require that storm-water management be provided in the form of Water Quality, Channel Protection, Flood Control, and Nonstructural Site Design. The Water Quality and Nonstructural requirements must be met; whereas the other requirements may be exempt, For Water Quality runoff from the site, volume equal to 1" of precipitation over all impervious area must be infiltrated into the ground. For Flood Control, the existing site must provide storm-water detention. The PWD will require, that measures be proposed to provide for Water Quality and Noristructural Site Design such as green roof systems, disconnected impervious surface areas, etc. as means of providing for these criteria. Any waiver from the requirements of these criteria would first require review and approval from the PWD in early design meetings.
4. We anticipate that it would be unlikely that any existing on-site drainage facilities will be able to be re-used and incorporated into the new facility. If such reuse is considered, the condition and hydraulic.capacity of these facilities should be investigatecl prior to any re-use. We suspect that the existing on site drainage systems may not be in optimal operating condition. It has been our experience that the inlets may be filled with debris and the current underground systems are usually silt laden and require cleaning and restoration to.bring the operations up to an acceptable level, Therefore, the_ client"should "plan fof-new storm .sewer inlets and piping within the site.
5. Any existing'on-site dfainagefacilitiesjhat.cannot be incorporated into the deve]6pm.ent plan will 'need to be. abandoned or removed. Any new drainage facilities .to, be.^constructed will need to be in accordance with PWD standards and/ or the Pliiladelphia Plumbing Code.
PENNONI ASSOCIATES, INC. 11 Consulting Engineers

PEM^INMIISNAL PENN NATIONAL GAMING. INC. 700 PackerAvenue
Utility Availability & Feasibility Report
3. Domestic and fire service connections to the. PWD potable water system are allowed via permit. Such connections must comply with PWD regulations as well as the Philadelphia Plumbing Code. Generally once the permit fee is paid, PWD forces will make the. connection to the PWD mains for the developer.
4. Proper water meters and backflow prevention facilities will also need to be installed in accordance with PWD regulations, including the Cross-Connection Control Manual. Due to the dose proximity of the proposed building structures to the existing mains, it is anticipated that the required meters and backfiow prevention facilities will be housed within the building envelop and not within separate meter pits and backflow prevention enclosures on fhe property.
5. At this time, the static pressure of the adjacent PWD vyater distribution system has not been confirmed through fire hydrant flow tests. The available flow and pressure would need to be confirmed with PWD prior to determining which' main can best supply water for both the domestic and fire suppression needs ofthe site. Also, the system demands incurred by the site would need to be estimated to help in that determination. The PWD does not guarantee specific water pressures.
d.) Gas Service:
1. The current gas provider at the" site is Philadelphia Gas Works (PGW).
2. As o.utiined above, PGW maintains high pressure 150 PSI and 35 PSI gas mains adjacent to the site. Most likely, gas service for the proposed development-would be via the existing 12" steel, 35 PSI HP gas main in 7* Street and would extend into the proposed Central Plant on the site.
3. Presently, when determining reimbursable costs to provide service to a new development, PGW compares the initial construction cost to provide the service against the projected revenue based on the anticipated gas load (i.e. usage) in accordance with Rule 10. The initial cost to the developer to provide the gas service is then determined based on a, pre-established formula.
4. If the pressure of the gas service will need to be reduced to approximately 5 psi, then flow through a new pressure regulation station will be necessary.
PENNONI ASSOCIATES, INC. Consulting Engineers
13
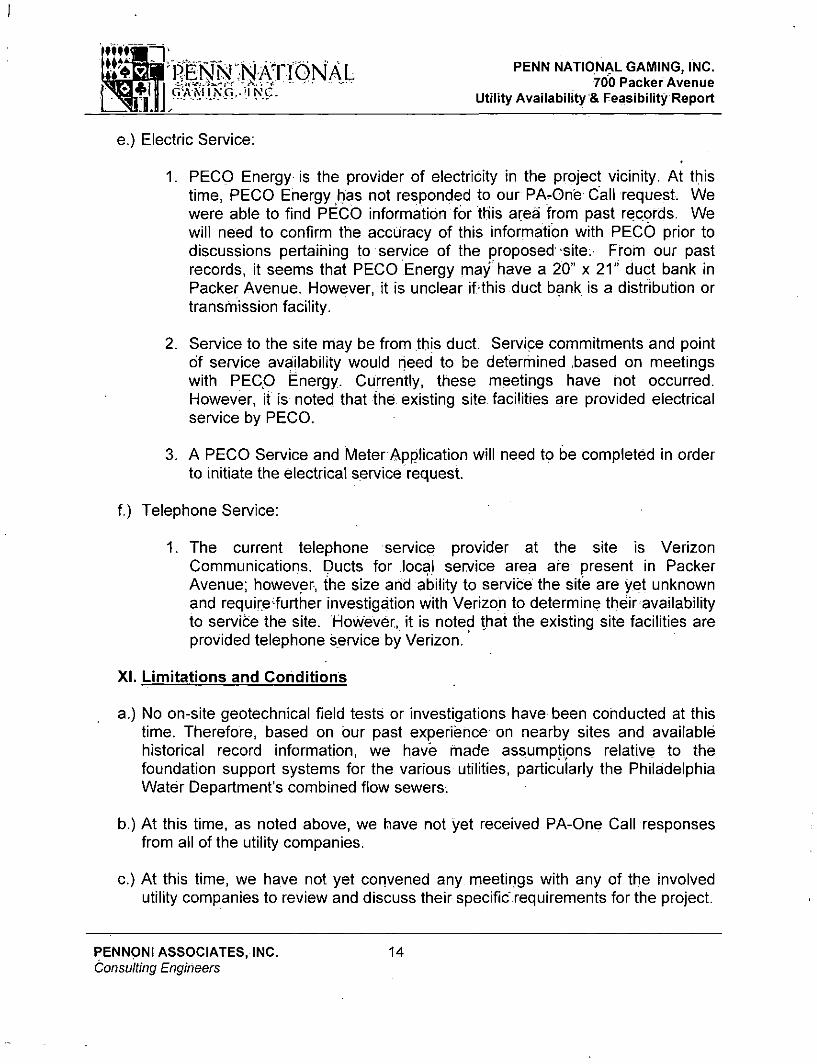
t M ^ r a a ' D F K j K I ; N . A T T ( 1 K ! A I ^^^^ NATIONAL GAMING, INC. ^ g. f-V. ^ ^ 700 PackerAvenue
r'.A.¥.l^li'. •" '. '• Utility Availability & Feasibility Report
e.) Electric Service:
1. PECO Energy' is the provider of electricity in the project vicinity. At this time, PECO Energy has not responded to our PA-One Call request. We were able to find PECO information for this area from past records. We will need to confirm the accuracy of this information with PECO prior to discussions pertaining to service of the proposed site. From our past records, it seems that PECO Energy may have a 20" x 21" duct bank in Packer Avenue. However, it is unclear if^this duct bank is a distribution or transmission facility.
2. Service to the site may be from this duct. Service commitments and point df service availability would need to be determined .based on meetings with PEGp Energy. Currently, these meetings have not occurred. However, it is noted that the, existing site, facilities are provided electrical service by PECO.
3. A PECO Service and Meter Application will need to be completed in order to initiate the electrical service request.
f.) Telephone Service:
1. The current telephone service provider at the site is Verizon Communications. Ducts for local service area are present in Packer Avenue; however, the size and ability to service the site are yet unknown and requireTurther investigation with Verizon to determine their availability to service the site. Hovyever,. it is noted that the existing site facilities are provided telephone service by Verizon.'
XI. Limitations and Conditions
a.) No on-site geotechnical field tests or investigations have been conducted at this time. Therefore, based on our past experience on nearby sites and available historical record information, we have made assumptions relative to the foundation support systems for the various utilities, particularly the Philadelphia Water Department's combined fiow sewers.
b.) At this time, as noted above, we have not yet received PA-One Call responses from all ofthe utility companies.
c.) At this time, we have not yet convened any meetings with any of the involved utility companies to review and discuss their specific requirements forthe project.
PENNONI ASSOCIATES, INC. 14 Consulting Engineers


PA Gaming Ventures, LLC - Categon' 2 Application - Hollywood Casino Philadelphia
Appendix 35
Provide details of land acquisition cosls.
REDACTKD

PA Gaming Ventures, LLC - Category 2 Application - Hollywood Casino Philadelphia
Appendix 36
Provide details of a compulsive or problem gambling plan.
PA Gaming Ventures. LLC will develop and implement a comprehensive Responsible Gaming Plan that meets or exceeds all requirements of Pennsylvania law. An affiliate ofthe applicant. Mountainview Thoroughbred Racing Association, currently owns and manages a Categor>' 1 casino facilit)' iri Grantville, PA. That facility has a comprehensive responsible gaming Plan in place that was most recently approved by the Pennsylvania Gaming Control Board on April 26. 2012 and is atiached for your reference. PA Gaming Ventures, Inc. will develop a similar plan for the Holiywood Casino Philadelphia facility modified as necessary to account for differences in the facilities, layout, organization andamenities.

Hollywood Casino Philadelphia
Compulsive & Problem Gambling Plan
Prepared December 14, 2012
REDACTED

Table of Contents
INTRODUCTION Page Goals ofthe Program 5 Timetable to Implement 5 Individuals Responsible for Implementation and Maintenance of thePlan 5
POLICIES AND PROCEDURES Page Commitrnent to Train Appropriate Employees.. 6 Duties & Responsibilities of Employees Designated to
Implement or Participatein the Plan...., 6 Responsibility of Patrons Regarding R.esponsible Gaming 8 Procedures to Identify Patrons/Employees.withiSuspecled or
Known Compulsive or Problem Gamblers Behavior 8 Procediires to Report Suspected orKnown Compulsiveor Problem
Gamblers to Designated Management-Level Employees 8 Procedures for Providing Infomiation to Individiials.with.Suspected
Known Compulsive or Problem Gambling Behavior 9 Procedures to Respond to Patron Requests fof Information Related
Compulsive and Problem Gambling Behavior :.: 10 Confidentiality of Identit)' of a Problem Gambler : 10 Provision of printed materials educating Patrons about Cornpulsive and Problem Gambling
And to Inform them about treatment services available to Such Gamblers and their families ..I I Description of Employee Training Program, Including Materials used and
Plan for Annual Periodic Reinforcement Training" 11 Certification of Employee Training in Format Approved bythe Board 12 Recordation ofthe Date of Annual Refresher Training for each Employee 12 Estimation ofthe Cost of Development, Implernentatipn and Administration ofthe Plan..:........ 12 Identification of Treatment and Support Resources for Compulsive and Problem
Gambling 13 Procedures to Prevent Underage Gambling 13 Procedures to Prevent an Excluded Person from Gambling 17 Procedures to Prevent a Self-Excluded Person from Gambling 22 Self Exclusion-General ; .24 Procedures to Prevent an Intoxicated Patron from Gambling General 27 Details of Outreach Program 29 Posting of Board-Approved signs 29 Other Policies and Procedures to Encourage Responsible Gambling 29

EMPLO\TEE TRAINING PROGRAM Page Tier I , :.....,.30 Tier II & III ;; ., ....; .....30 Training on Required Notifications 31 Training on the refusal of wagers and the denial of gaming privileges, including check
cashing privileges and comps, to self-excluded individuals 32 Training on the prevention of targeted mailings and advertising to self-excluded
individuals 32 Training on the dissemination of materials to patrons explaining self-exclusion options 32 Training on the responsibility to maintain an updated copy ofthe self-exclusion list and
to distribute the list in a timely fashion 32 Confidentiality of self-exclusion list and individuals with suspected or known compulsive
or problem gambling 32
SIGNAGE REQUIREMENTS Page Signage Requirements 33
CHECK CASHING ; Page Check Cashing :..... '. 34
AMENDMENTS TO THE PLAN Page Amendments 34
NOTIFICATION TO THE DIRECTOR OF THE OCPG Page Notification to the Director ofthe OCPG 34
REPORTS - ANNUAL SUMMARY Page Annual Summary 34
UNDERAGE GAMBLING/UNATTENDED MINORS Page Access , , '. 35 Wagering Prohibitions 35 Forfeiture of Winnings 35 Procedures to Prevent Underage Gambling Including Signage 35 Unattended Minors : 35
EXCLUDED PERSONS Page Procedures to Prevent an Excluded Person frorii Gambling Including Distribution of
and Updates to the Exclusion List 36 Individuals believed to meet the criteria for exclusion 37

ADVERTISING & PROMOTIONS Page Advertising .v .....37 Promotions . 38 Required Notifications 38 Prohibited Activities 38
VOLUNTARY CREDIT SUSPENSION Page
Procedures to ensure that certain individuals may not obtain credit , 38
Financial Restriction List Page 39
EXHIBITS Exhibit # Responsible Gaming Training Manuals
Tier I A-l Tier II A-2 Tier III A-3 REDACTED User Guide-Self Exclusion A-4 CV ., ,..'. A-5
Responsible Alcohol Ser\'ice Training Programs TiPS Training Manual B-l RAMP Training Manual B-2
Responsible Gaming Brochures (Displayed on the'Casino Floor): CCGPs '"A Message on Responsible Gaming" Brochure C-l PGCBs "Self-Exclusion Program" Brochure C-2 HCP''Self-Exclusion" Brochure C-3 HCP "Keeping It Fun -A Guide to Responsible Gaming" Brochure C-4
Self Exclusion and Responsible Gaming Assistance Infomiation: Your First Step to Change D-1 PA Department of Health's Gambling Responsibly - Guidelines to the Game D-2 N.E.F.E. Personal Financial Strategies for the Loved Ones of Problem Gamblers D-3 PGCB Request for Voluntar)' Self-Exclusion form D-4 AGA's Guide to Understanding the Odds D-5 PA Department of Health's treatment provider list D-6 Gamblers Anonymous Pennsylvania Directory D-7 GAM-ANON Pennsylvania Directory..., D-8
Responsible Gaming Message Player Cards and Ticket Vouchers E Required Signage F Responsible Gaming Training Certificates of Completion G HCP Self Exclusion Forms H

COMPULSIVE & PROBLEM GAMBLING PLAN INTRODUCTION
Goals of the program
The program's goal is: (1) To enhance the employees' and patrons' awareness of problem/compulsive gambling,
Intoxicated gambling and gambling by underage, excluded and self-excluded individuals, (2) To facilitate access to information regarding compulsive/problem gambling and treatment;
intoxicated gambling; and gambling by underage', excluded and self-excluded individuals including information regarding the placement of an individual on a seif-exclusion list,
(3) To establish procedures designed to reduce the chance that an individual with a gambling problem will wager atthe facility,
(4) To establish procedures designed to prevent underage, visibly intoxicated, excluded and self-excluded individuals from wagering at the facility,
(5) To establish procedures to ensure.that:uhderage, excluded and self-excluded individuals do not receive check cashing privileges; are not rated ias^a player; do not receive any service, item or discount; and do not collect any winnings or recover any losses as a result of any gaming activity at HCP and
(6) To establish.procedures designed to .ensure the safety of unattended children within the facility or otherwise on the grounds of HCP.
Timetable to implement
A responsible gaming program has been in place prior to the start of gaming operations. The responsible gaming committee has continued to refine the program^ and will submit all amendments to the approved compulsive and problem gambling plan for board approval prior to implementation.
Identify individual responsible for implementation and maintenance of plan
As the chairman of Holiywood Casino Philadelphia's responsible, gaming committee, the General Manager Is responsible for the implementation and maintenance pf the plan. The Compliance Manager will be the primary contact person for the Pennsylvariia Gaming Control Board for issues related to problem gambling.
Hollywood Casino Philadelphia {"HCP") has established a responsible gaming committee. The committee is comprised ofthe following permanent members:
General Manager (Chairman) VP of Casino Operations VP of Human Resources Director of Security Director of Food & Beverage VP/Chief Financial Officer Compliance Manager
Any other personnel the GM believes are necessary to accomplish the goals of the program will be included on the Committee on an ad-hoc basis. In addition to developing and implementing the program, the committee monitors compliance with and the effectiveness ofthe program.

POLICIES AND PROCEDURES
Commitment to train appropnate employees
As described below, all employees are trained at orientation and receive annual retraining. The orientation training for responsible gaming is a video, based program. The annual retraining will either be live or video based. Front of the house'employees.receive additional training focused on responsible gaming policies and procedures. Security supervisors also receive training regarding hpw to provide and/or respond to patron requests for information regarding compulsive/problem gambling and treatment and: the PGCB' and HCP self-exclusion programs and processes and the proper manner to discuss the programs and processes with a patron^ Procedural training will be provided within specific departments;as is necessary to accomplish the goals of the plan. A copy of the Tier 1 training as well as outlines for the second andthird-tier training are attached as Exhibit A.
All employees of HCP are expected to be knowledgeable of, and follow approved procedures consistent with, the approved plan. This includes reporting suspected or identified compulsive or problem gamblers to their supervisor or the Security Department ("Security"). Employees are required to keep the identity of an individual suspected of compulsive or problem gambling confidential.
Duties and responsibilities of employees designated to implement or participate in the plan
As noted above, HCP's responsible gaming committee'develops, implements and monitors the program and plan. Specific departmental responsibilities are-set forth below and throughout this Pian. Employees must be aware of the location of responsible ganiing brochures, problem gambling brochures, information on treatment servtcesand self-exclusion information for patrons who request information regarding problem gambling or are suspecte'd of known compulsive or problem gambling, know the toll-free hotline for problem gambling related assistance, and understand reporting procedures. Samples of these brochures are attached as Exhibit C and samples of the self-exclusion information and assistance information are attached as ExhibitD.
Moreover, employees must refer a patron to a Security supen/isor should the patron indicate he/she has a gambling problem. Employees also must contact their supervisor or a Security supervisor should they suspect a patron has a gambling problem based on the signs and symptoms exhibited by the patron. Security ;superyisors are responsible for knowing how to provide and/or respond to patron request's for information regarding compulsive/problem gambling and treatment and explaining the self-exclusion programs and process to a patron for facilitating the patron's placement on that list.
Specific departmental responsibilities are as follows:
a. Security Department Security is responsible for the enforcement and reporting of operational efforts which relate to the prevention of underage gambling, intoxicated gambling and gambling by excluded and self-excluded individuals. This includes identifying and removing intoxicated, underage, excluded and self-excluded individuals. Procedures for the Security Department are set forth In this plan.
b. Surveillance Department Surveillance is responsible for the eiectronic monitoring of all gaming areas, areas off the gaming floor where slot machine, banking table game or poker contests or tournaments are conducted, and limited portions of the food and beverage areas in the facility. The Director of Surveillance and all surveillance personnel are responsible for monitoring these areas for intoxicated individuals, Individuals

appearing under the age of 21 who are on the ganiing floor and/or are engaged in gaming activities, and attempting to visually identify excluded and self-excluded individuals. The Surveillance Supervisor or his designee is responsible for ensuring that excluded individuals are entered REDACTED , within 2 business days of HCP's receipt of the list from the PGCB and self-excluded individuals are entered into the REDACTED, and flagged, within 5 business days of HCP's receipt of the list from the PGCB. Procedures for the Surveillance Departnient are set forth in this plan.
c. Slots Department The Slots Department is responsible for attempting to recognize suspected compulsive or problem gambling behaviorand Identification of underage and intoxicated individuals and the prevention of underage and intoxicated gaming. Slot attendants are also responsible for verifying identification of individuals prior to payment of a hand paid jackpot exceeding $1,199, issuing a comp or issuing a players card to ensure that the Individual is not underage or on a self-exclusion or exclusion list Procedures'for the Slots Department are set forth in this plan.
d. Table Games Department The Table Games Department is responsible for attempting to recognize suspected compulsive or problem gambling behavior and identification of underage and intoxicated individuals and the pVevention of underage and intoxicated gaming. Table Games supervisors are also responsible for verifying identification of individuals to ensure that an individual is not underage, and also prior to issuing a comp or players card to ensure that the individual is not on a self-exclusion or exclusion list Procedures for the Table Games department are set forth in this plan.
e. Cashier's Cage/Credit Department/Player Services The Cashier's Cage/Credit/Player Services Department is responsible for preventing intoxicated persons and individuals who are underage or who are on the exclusion and self-exclusion lists from cashing checks and conducting transactions at the cage. The Cashier's Cage/Credit/Player Services Department is responsible for ensuring thatindividualswho are underage„ior on the self-exclusion, exclusion, or voluntary credit suspension lists do not receive credit. Moreover, the Cashier's Cage/Credit/Player Services Department is responsible for not allowing a transaction to proceed where an Individual cannot produce identification as required herein. The Cashier's Cage/Credit/Player Services Department is also responsible for ensuring underage, excluded, and self-excluded individuals do not receive player cards or player club privileges. Procedures for verification, identification and reporting are set forth in this plan.
f. MarketinQ The Marketing Department is responsible for ensuring that no Individuals who are underage or who are on the excluded or self-excluded lists receive direct mail marketing materials or participate in marketing promotions. Procedures for Marketing are set forth in this plan.
g. Food and Beverage The Food and Beverage Department is responsible for preventing the serving of alcohol to visibly intoxicated and underage individuals and for notifying security to prevent persons from gaming after having been determined to be visibly intoxicated. Procedures for Food and Beverage are set forth in this plan.
Additionally, HCP has designated that certain positions must participate in responsible alcohol service training. These positions are:
a. All F&B personnel who serve alcohol or manage those who do b. All Valet personnel c. All Security personnel d. Slot supervisors e. Table Games supervisors

f. Any position authorized to approve or increase credit lines per HCP's credit policy
Administrative personnel are not included in the above listing. The company' will use either RAMP or TIPS for responsible alcohol service training, the determination of which to use will be based on the availability of trainers and the number to be trained for any particular class. A copy ofthe TIPS training is attached as Exhibit B-1, RAMP training materials are attached as Exhibit B-2.
Responsibility ofthe patrons regarding responsible gaming
All patrons are responsible for ensuring that they gamble responsibly. Some strategies that patrons can use to assist themselves in gambling responsibly include:
Gambling for entertainment purposes only. Treating the money Ipst as the cost of entertainment Setting a dollar limit and sticking to it. Setting a time limit and sticking to it Expecting to lose. Create balance in your life. Avoiding "chasing" lost money. Not gambling as a way to cope with emotional or physical pain. Becoming educated about the warnlngsigns of problem gambling.
Procedures to identify patrons/employees with suspected or known compulsive and problem gambling behavior
Employees are advised through orientation and annual refresher training of significant behavioral characteristics that may be indicative of a gambling problem. Training materials used to identify patrons/employees with suspected or known compulsive and problem behavior are attached as Exhibit A-1
This training seeks to educate employees to be able to recognize some of the potential behavioral, verbal, social, legal, economic and emotional-characteristics that may indicate that a patron may have a gambling problem, such as:
Sudden increase in frequency or amount of play Unusual lack of care on maintaining personal appearance and hygiene Seeking loans from employees or other patrons Begins making irrational wagers, starts chasing losses Remains in the casino for very long periods of time Becomes emotionally upset Becomes self destructive or makes comments that could be in interpreted as suicidal
Compulsive gambling is often referred to as a hidden addiction and therefore, identification of compulsive and problem gambling behavior may be difficult for non-mental health personnel. The inaccurate identification of computisive and problem gambling can lead to faulty assumptions, violations of privacy, or possibly the assignment of an inaccurate stigmatizing label by a nonprofessional so employees should not diagnose an individual as having a garnbling problem. Employees should,-however, be on the lookout for the; outward signs of a potential gambling problem and should report any concerns to their supervisor or security personnel.
Procedures to report suspected or known compulsive or problem gamblers to designated management-level employees

If an HCP employee has identified a compulsive.or problem gambler (the individual is on a self-exclusion list as verified through the REDACTED) he/she must contact Security immediately. Security will proceed pursuant to the procedures set forth in this plan.
Employees must refer a patron to a Security supervisor should the patron indicate he/she has a gambling problem.
Employees must contact their supervisor or Security immediately should they suspect a patron has a gambling problem. They should describe'their specific concerns regarding the behavior exhibited or oral statements made. The report of concern should include (if possible) the patron's name. The concern should never be entered into the REDACTED. The supervisor or Security shall notify a Security supervisor of the matter who shall evaluate the facts and circumstances presented and make a determination if the patron needs tb be approached based upon the factors discussed above and in Exhibit A-1.
If the Security supervisor believes that an approach is warranted, he shall personally and discreetly approach the patron to suggest a conversation in a private setting. This conversation shall be conducted in a manner that protects the privacy and dignity df the individual. Once in a discreet location, the Security supervisor will articulate the concern and offer alternatives for assistance such as written materials explaining setf-exclusion (Exhibit C)and problem gambling treatment and assistance resources (Exhibit D). The Security Supervisor also is responsible for explaining the self-exclusion programs and processes to,a patron and for referring the patron to a Casino Compliance Representative if the patron desires to be placed on the PGCB self-exclusion list. Such ehcounters will be documented on a security Incident Report.
Procedures for providing information to individuals with suspected or known compulsive or problem gambling behavior
HCP will display the following information at the Security Podium, and at Cashier Cage/Credit/Player Services:
a. CCGPs "A Message on Responsible Gamlng"°Brochure"(Exhibit C-1) (These brochures will also be located at all automated teller machines on property)
b. PGCB Self-Exclijsion Program Brochure (Exhibit C-2) c. HCP Self-Exclusion brochure (Exhibit C-3) d. Keeping It Fun - A guide to Responsible Gaming (Exhibit C-4) e. Voluntary Credit Suspension Brochure (ExhibitD- )
In addition to the materials displayed at the above locations, HCP will provide the following information at the Security Podium, Cashier Cage/Credit/Players Services:
a. Your First Step to Change (Exhibit D-1) b. PA Department of Health's Gambling Responsibly - Guidelines to the Game (Exhibit D-
2) c. National Endowment for Financial Education's Personal Financial Strategies for ttie
Loved Ones of Problem Gamblers (Exhibit D-3) d. PGCB Request for Voluntary Self-Exclusionform (Exhibit D-4) e. AGA's Guide to Understanding the Odds (Exhibit D-5) f. PADepartment of Health's treatment provider list (Exhibit D-6) g. Gamblers Anonymous Pennsylvania Directory'(Exhibit b-7) h. GAM-ANON Pennsylvania Directory (Exhibit D-8)
Voluntary Credit Suspension Brochure (Exhibit D- ) /. All employees will be familiar with the location of the information and will be able to direct
patrons to the information.
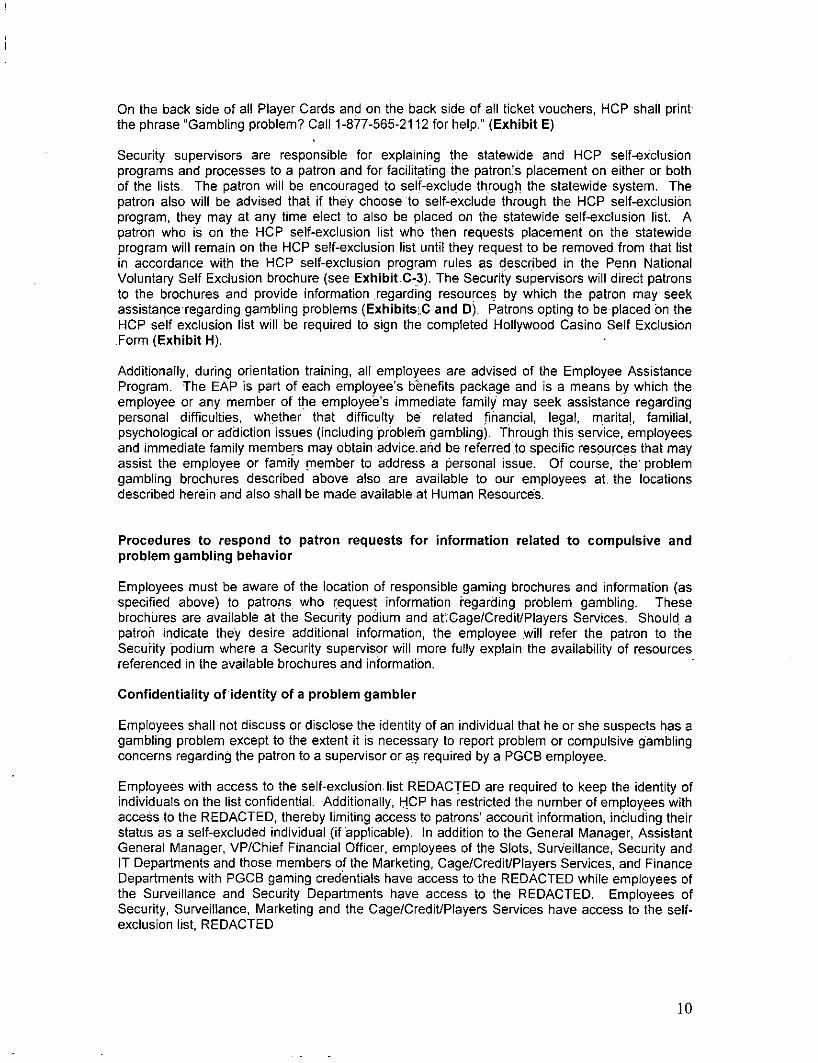
On the back side of al! Player Cards and on the back side of all ticket vouchers, HCP shall print the phrase "Gambling problem? Call 1-877-565-2112 for help." (Exhibit E)
Security supervisors are responsible for explaining the statewide and HCP self-exclusion programs and processes to a patron and for facilitating the patron's placement on either or both of the lists. The patron will be encouraged to self-exclude through the statewide system. The patron also will be advised that if they choose to self-exclude through the HCP self-exclusion program, they may at any time elect to also be placed on the statewide self-exclusion list. A patron who is on the HCP self-exclusion list who then requests placement on the statewide program will remain on the HCP self-exclusion list until they request to be removed from that list in accordance with the HCP self-exclusion program rules as described in the Penn National Voluntary Self Exclusion brochure (see Exhibit.C-3). The Security supervisors will direct patrons to the brochures and provide information regarding resources by which the patron may seek assistanceregarding gambling problems (Exhibits:^C and Dj. Patrons opting to be placed on the HCP self exclusion list will be required to sign the completed Hollywood Casino Self Exclusion Form (Exhibit H).
Additionally, during orientation training, all employees are advised of the Employee Assistance Program. The EAP is part of each employee's benefits package and is a means by which the employee or any member of the employee's immediate family may seek assistance regarding personal difficulties, whether that difficulty be related financial, legal, maritaj, familial, psychological or addiction issues (including problerh gambling). Through this service, employees and immediate family members may obtain advice,arid be referred to specific resources that may assist the employee or family member to address a personal issue. Of course, the' problem gambling brochures described above also are available to our employees at. the locations described herein and also shall be made available at Human Resources.
Procedures to respond to patron requests for information related to compulsive and problem gambling behavior
Employees must be aware of the location of responsible gaming brochures and information (as specified above) to patrons who request information regarding problem gambling. These brochures are available at the Security podium and at'Cage/Credit/Players Services. Should a patron indicate they desire additional information, the employee will refer the patron to the Security podium where a Security supervisor will more fully explain the availability of resources referenced in the available brochures and information.
Confidentiality of identity of a problem gambler
Employees shall not discuss or disclose the identity of an individual that he or she suspects has a gambling problem except to the extent it is necessary to report problem or compulsive gambling concerns regarding the patron to a supervisor or as required by a PGCB employee.
Employees with access to the self-exclusion list REDACTED are required to keep the identity of individuals on the list confidential. Additionally, HCP has restricted the number of employees with access to the REDACTED, thereby limiting access to patrons' accourit information, including their status as a self-excluded individual (if applicable). In addition to the General Manager, Assistant General Manager, VP/Chief Financial Officer, employees of the Slots, Surveillance, Security and IT Departments and those members ofthe Marketing, Cage/Credit/Players Services, and Finance Departments with PGCB gaming credentials have access to the REDACTED while employees of the Surveillance and Security Departments have access to the REDACTED. Employees of Security, Surveillance, Marketing and the Cage/Credit/Players Services have access to the self-exclusion list, REDACTED
10

Moreover, our employees are specifically trained regarding the need to. handle ali such matters with courtesy and discretion and are directed fpjkeep information related to a problem gambler as confidential.
Provision of pnnted matenals educating patrons about compulsive and problem gambling and to inform them about treatment services available to such gamblers and their families.
As noted above, HCP will make available throughout the; facility'brochuresrejated to problem and compulsive gambling. HCP will display the following information at the Security Podium and Cashier Cage/Credit/Players Services:
a. Keeping it Fun brochure (Exhibit C-1) b. PGCB Self-Exclusion Program Br6chure,(Exhibit C-2) c. HCP (property only) Self-Exclusion brochure;(Exhibit C-3) d. Keeping It Fun - A guide to Respdnsible,Gamirig (Exhibit:C-4) e. Voluntary Credit SuspensionBrbchur''e.(ExhibitD- )
In addition td the materials displayed at the: above locations, HCP will provide the following information at the Security Podium, CashierCage/Gredit/PlayersiServices:
a. Your First Step to Change: (ExhibitD-l) b. PA Department of Health!s Gambling Res'ponsibly-Guidelines to the Game (Exhibit D-2) c. National Endowment for Financial Education's Personal Financial Strategies for the
Loved Ones of Problem Gamblers (Exhibit'Dr3) d. PGCB Request for Voluntary: SelfrExclusion"formi(Exhibit D-4) e. AGA's Guide to Understanding" th"e:Odds (ExhibitD-5) f. PA Department of Health's treatrnentiDrovider list (Exhibit.D-6) g. Gamblers Anonymous:Pennsylvariia=Directory (Exhibit D-7) h. GAM-ANON-Pennsylvania Directory (ExhibitD-S). i. Voluntary Credit Suspension"Brochure'(Exhibit D- )
Employees must be aware of the location of the'inforrriatipn,and',will be able to direct patrons who request information regarding problem gambling to the infomiatipn. The brochures contain information regarding problem gambling; available resources and self-exclusion options.
On the back side of all Player Cards and on the backside of ail ticket vouchers, HCP shall print the phrase "Gambling problem? Call 1-877-565-21-12 "forhelp," printed on the bacJ5j(Exhibit E). HCP will also post signage consistent with PGCB regulations and as approved^ in this Plan (Exhibit F).
Descnption of employee training program, including matenals used and plan for annual penodic reinforcement training
As identified above and provided as an attachment hereto (Exhibit A-1), HCP, in conjunction with the Counsel on Compulsive Gambling in Pennsylvania (CCGP), has developed a Tier I responsible gaming training program for,all newly hired employees. This training will beTaught in person by a CCGP trainer or will be taught through the viewing of a previously recorded video tape of a live CCGP training program. This training protocol js tracked manually througfi sign-in sheets and electronically through a system called PoficyTech. Through Policyjech, the date and type of training are recorded by the Manager of Training & Developrrient or his or her,designee. A signed copy of the certificate of completion is.kept in a Responsible Gaming Certificate binder in Human Resources and the information recorded through Policy Tech Is maintained.within the system.
11

HCP conducts annual responsible gaming refresher training for all employees. The refresher training program will be thesame prbgram)as'is taught.to newly hired employees in orientation. A sighed copy of the certificate of completion for the annual refresher training -is kept In a Responsible Gaming Certificate binder in Human Resources and the information recorded through Policy Tech is maintained within the system.
TIPS and/or RAMP training verification is placed in the employee-files by the Manager of Training and Development
Certification of employee training in format approved by the Board
A signed certificate reflecting successful completion of all responsible gaming training programs is placed in a Responsible Gaming Certificate binderby the.Huhnan Resources Departmentwhen the employee completes tlie. training session. The certificates in the binder are in alphabetical order, and each year has a different binder; this allows-for easy auditing of records. A sample of the certificate for each training tier (Tier'1, 2 & 3) is attached,as Exhibit G.
Recordation of the date of annual refresher training for each employee The annual refresher trainirig will be delivered either in person by a CCGP trainer or through the viewing of a video tape of a previously recorded live CCGP training program. This training protocol is tracked manually through sign-in sheets and electronically through a system called PolicyTech. Through Policy Tech, the date and type of training are recorded by the Manager of Training & Development or his or her designee. A-sigried copy of the certificate of completion is placed in the above described Responsible'Ganning Certificate binder by the Human Resources Department and the information is also recorded in Policy Tech
The Human Resources Training Department will monitor the system at least quarterly to ensure that all personnel have successfully completed the annual training.
Estimation ofthe cost of development, implementation and administration of the plan As this property is just in the early devefopment'Stage, total costs to develop, implement and administer the plan is not known for certain, however,: based on: experience in other jurisdictions we would expect such costs to'beibetween $751000 and:$lbO'dC)0.
Identification of treatment and support resources for compulsive and problem gambling
The signage posted and the brochures provided to patrons will contain many of the resources available to problem gamblers^and their families. Tlie primary resource will be the hotline number (1-877-565-2112), as well aS'contact information for the Council on Compulsive Gambling of Pennsylvania and the PGCB's website. .Additionally, our website (TBD) the Penn National Gaming Inc. website (www.pngaming.c9m) have responsible gaming links that provide the links to national associations related to problem gambling. F-urther, the list of comnnunity, public and private treatment services, gamblers anonymous programs and similartreatment or addiction therapy programs designed to prevent, treat or monitor compulsive and problem gamblers and to counsel family members is attached as Exhibit D. the Compliance Manager will update these lists within two weeks of the start of each quarter if there have been any changes to the lists. Providing this list does not create a duty for HCP or its employees to refer compulsive and problem gamblers to qualified treatment professionals.
Procedures to prevent underage gambling
12

All personnel are responsible for identifying individuals-who are on the gaming floor,, e'ngaging in gaming-related. activities or consuming alcohol but appear to be under 21 years of age. All Individuals win be carded by security prior to entering'the^gaming floor if they appear to be under the age of thirty and must produce valid, legally acceptable government issued identification, Security will be the first and,primary source for identifying-underage individuals, entering onto the gaming floor. Security personnel will be at each of the entrances to the gaming floor and also will be assigned as rovers to specific'sections of the fjoor,; If patrons do not wish to be repeatedly asked to produce verification of tlielrage/identificationi they may elect to have a.wristbapd placed on them by a-security officer who has verified their age/identification; Rotating colored bands will be offered to patrons who are of legal age to gamble on the gaming floor and consume alcohol in the Commonwealth of Pennsylvania. JHCP reserves the right to verify the ID of a patron even if they are wearing such a wristband.
Persons under the age of twenty-one are prohibited from playing or attempting to play a slot machine or table game at HCP. Iri addition, persons underthe age of twenty-one are prohibited from entering any area of the gaming floor or areas offthe gaming floor where slot machine; banking table game or poker contests or tournaments are,conducted.
However, an individual 18 years of age or older employed by a slot machine licensee, a gaming service, provider, the board or any other regulatpry or emergency response agency may enter and remain in any such area while engaged in^the^performance'ofthe.individual's employment duties.
Legally acceptable identification must be government issued and include a photograph and date of birth. The following is a list of legally acceptable:idehtiffcation:
a. A valid photo driver's license issued by thePennsylvania Department of Transportation or any other state,
b. A valid photo identification issued by the Pennsylvania Department of Transportation or any other state.
c. A valid Armed Forces identification.card that contains the holder's photograph. d. A valid passport or visa which contains theholder's photograph. e. Any other form of valid: governmentrissued identification containing a photograph of the
holder that the Security Department deem sufficient to validate the age and identity of the holder.
Security will not permit an individual who appears to.be under the age oMhirty to enter or traverse the gaming floor without having presented a valid, legally acceptable form of identification showing that the individual is at least 21 years of age.
Any employee who suspects that an individual who is on the gaming "floor, engaging in gaming-related activities or consuming alcohol is under 21 years of age will immediately notify their supervisor or Security. If a supervisor is notified,-that person is responsible for immediately notifying Security, Security will enact the security procedures related to underage gambling as set forth below.
Specific departments have duties and responsibilities as set forth below:
a. Security Department Secunty is responsible for the enforcement and reporting of operational efforts which relate to the prevention of underage gambling.
1) Prior to entering the gaming floor or areas off the gaming floor where slotmachine, banking table game or poker contests or tournaments are conducted, all patrons who appear under the age bf 30 will be asked, by security officers, to produce valid and legally acceptable verification of.their age/identification.
13