Embed Size (px)
Citation preview
TWO WAY ANOVA WITH REPLICATION
Also called a Factorial Experiment.Factorial Experiment is used to evaluate 2 or more factors simultaneously. Replication means an independent repeat of each factor combination. The purpose of factorial experiment is to examine:
1. The effect of factor A on the dependent variable, y.2. The effect of factor B on the dependent variable, y along with3. The effects of the interactions between different levels of the factors on the dependent variable, y. Interaction exists when the effect of a level for one factor depends on which level of the other factor is present. Advantages of Factorial Experiment over one factor at a time (one-way ANOVA) – more efficient & allow interactions to be detected.
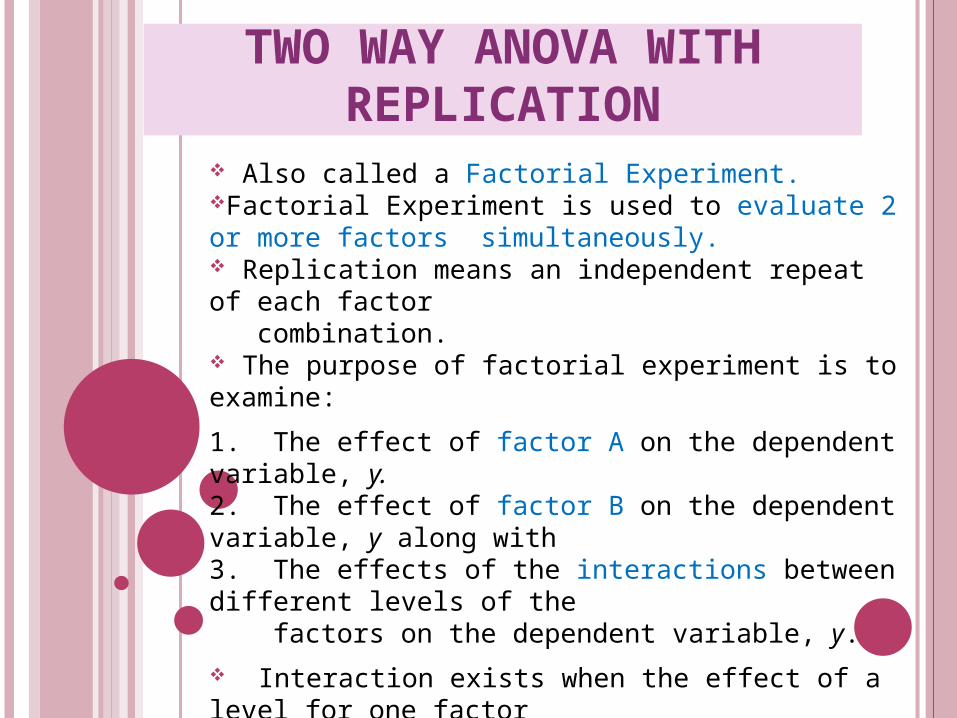
The effect model for a factorial experiment can be written as:
: The response from the kth experimental unit receiving the
th level of factor and the th level of factor
: Overall mean
: An effect due to the th level of factor
ijk
i
j
y
i A j B
i A
: An effect due to the th level of factor
: An interaction effect of the th level of factor with jth level of factor
: A random error associated with the response from the th e
ij
ijk
j B
i A B
k
xperimental
unit receiving the th level of factor combined with jth level of factor
i A B
1
1
1ijk i j ijkij
i ,...,a
y j ,...,b
k ,...,r

There are three sets of hypothesis:
1. Factor A effect:
2. Factor B effect:
3. Interaction effect:
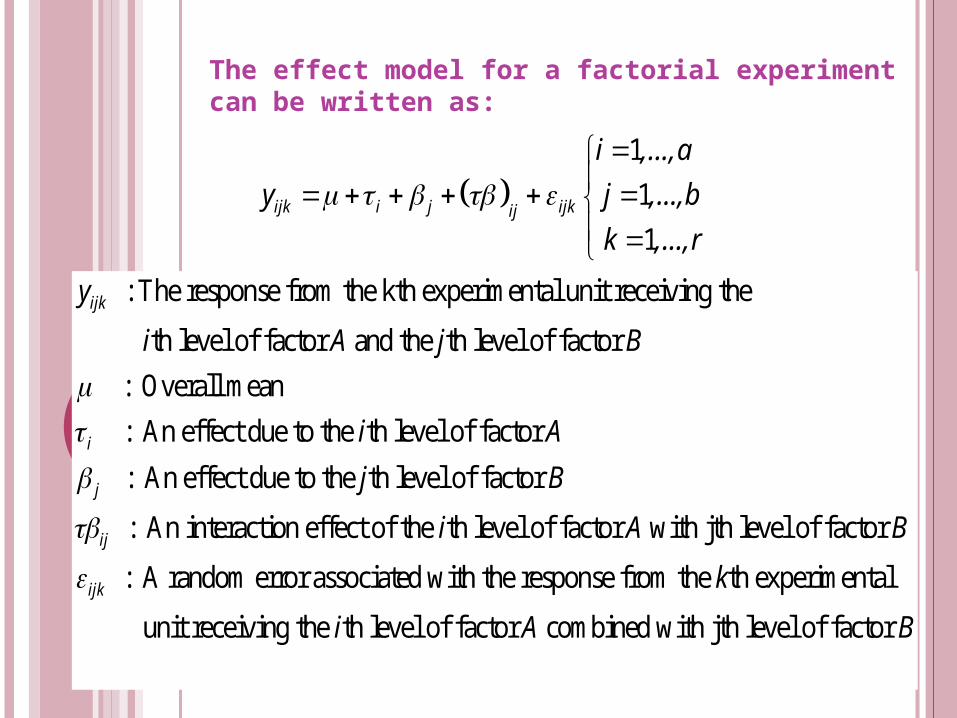
The results obtained in this analysis are summarized in the following ANOVA table:
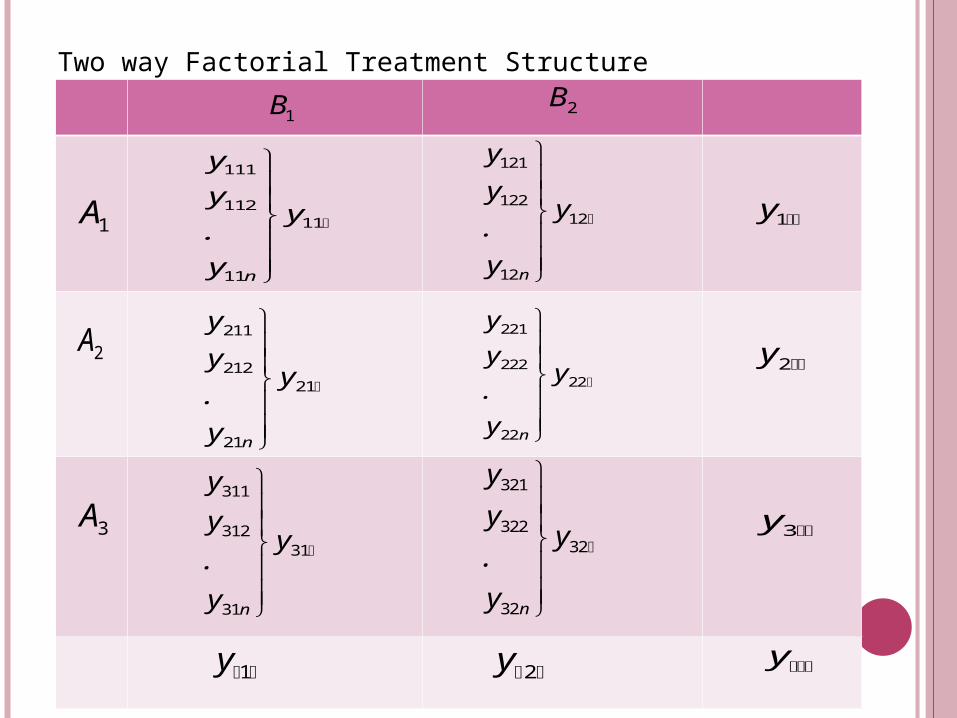
Two way Factorial Treatment Structure
1A
2A
3A
1B 2B
111
11211
11n
y
yy
.
y
121
12212
12n
y
yy
.
y
211
21221
21n
y
yy
.
y
311
31231
31n
y
yy
.
y
221
22222
22n
y
yy
.
y
321
32232
32n
y
yy
.
y
1y 2y
1y
2y
3y
y
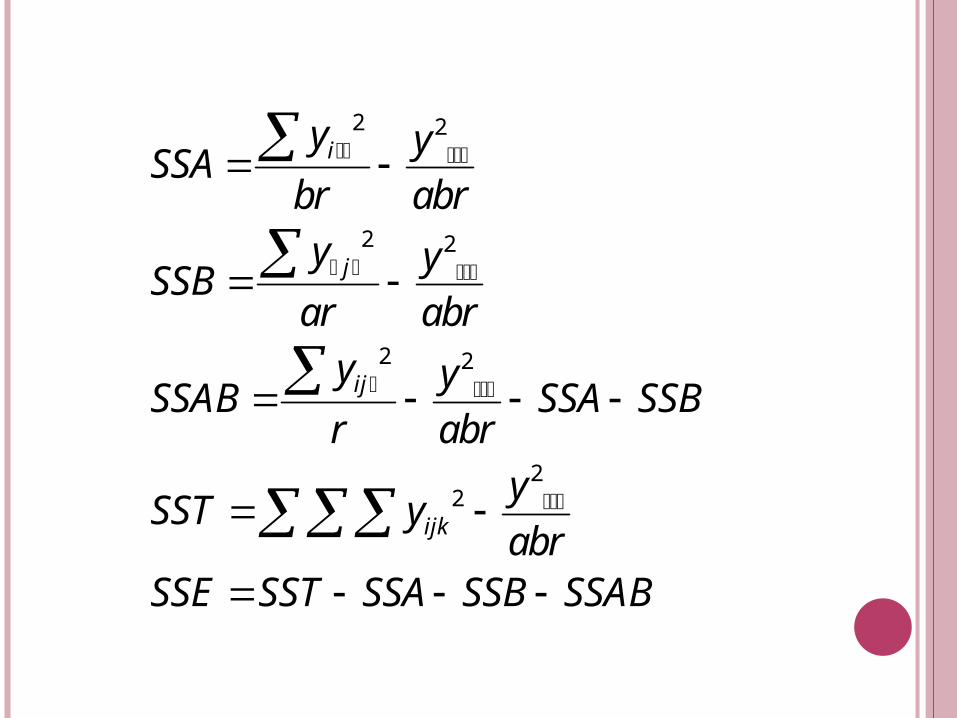
where
2 2
2 2
2 2
22
i
j
ij
ijk
y ySSA
br abr
y ySSB
ar abr
y ySSAB SSA SSB
r abr
ySST y
abrSSE SST SSA SSB SSAB
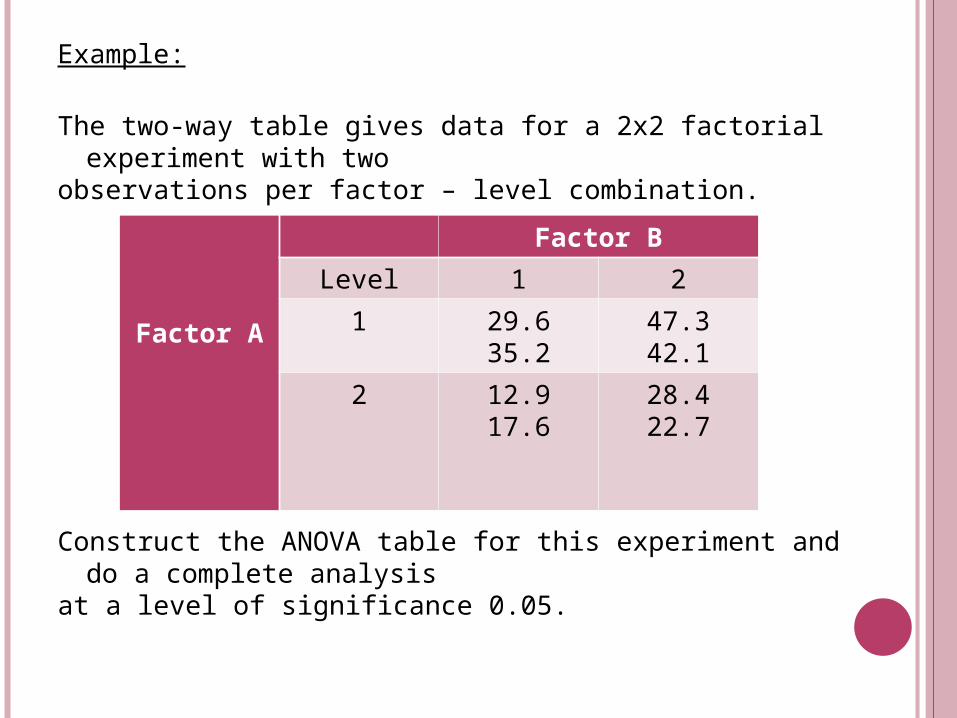
Example:
The two-way table gives data for a 2x2 factorial experiment with two
observations per factor – level combination.
Construct the ANOVA table for this experiment and do a complete analysis
at a level of significance 0.05.
Factor A
Factor B
Level 1 2
1 29.635.2
47.342.1
2 12.917.6
28.422.7
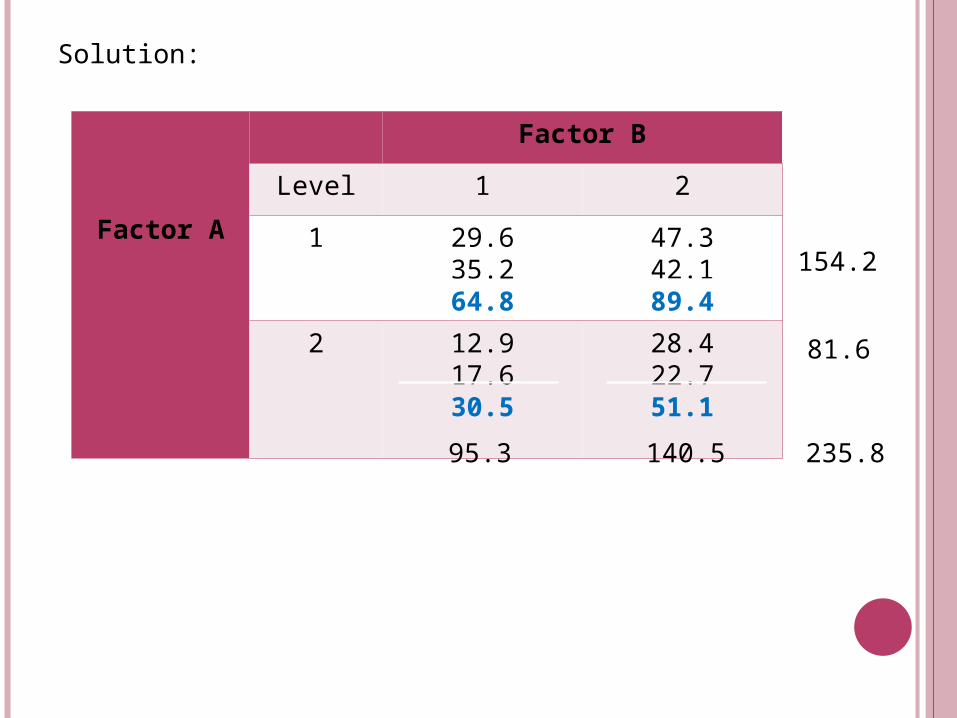
Solution:
Factor A
Factor B
Level 1 2
1 29.635.264.8
47.342.189.4
2 12.917.630.5
28.422.751.1
154.2
81.6
95.3 140.5 235.8
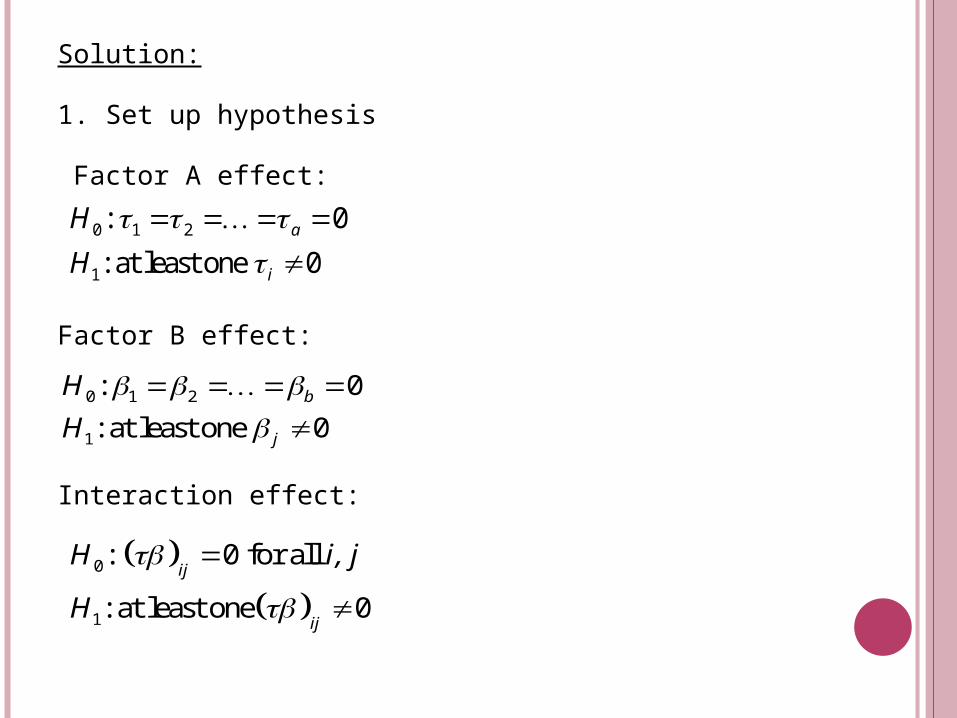
Solution:
1. Set up hypothesis
Factor A effect:
Factor B effect:
Interaction effect:
0 1 2
1
: 0
: at least one 0a
i
H
H
0 1 2
1
: 0
: at least one 0b
j
H
H
0
1
: 0 for all
: at least one 0
ij
ij
H i, j
H
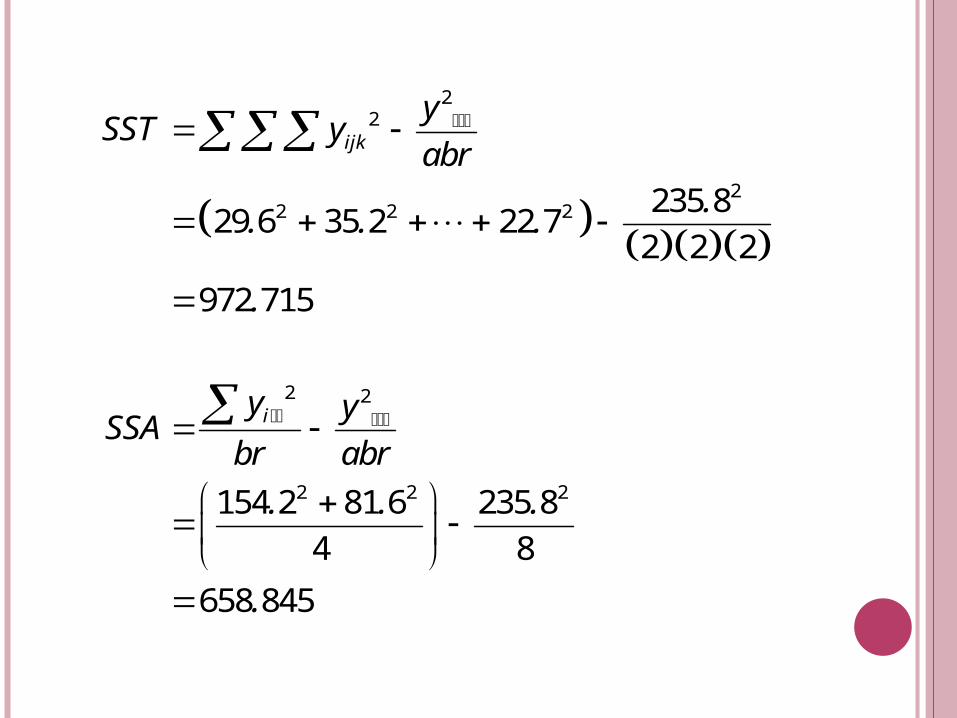
22
22 2 2
2 2
2 2 2
235 829 6 35 2 22 7
2 2 2
972 715
154 2 81 6 235 8
4 8
658 845
ijk
i
ySST y
abr
.. . .
.
y ySSA
br abr
. . .
.
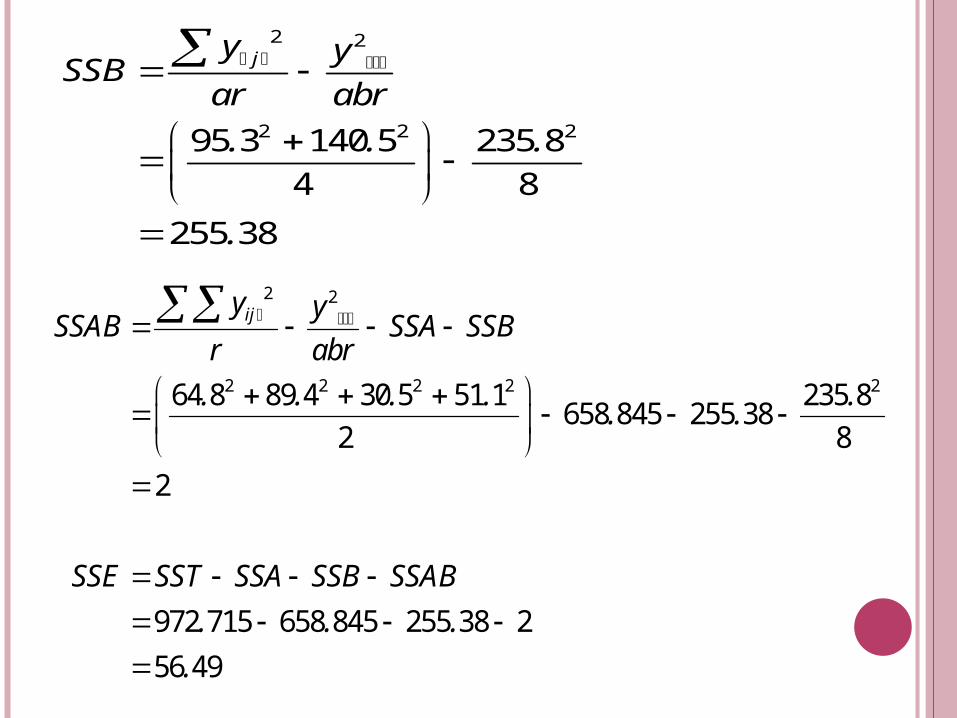
2 2
2 2 295 3 140 5 235 8
4 8
255 38
jy ySSB
ar abr
. . .
.
2 2
2 2 2 2 264 8 89 4 30 5 51 1 235 8 658 845 255 38
2 8
2
972 715 658 845 255 38 2
56 49
ijy ySSAB SSA SSB
r abr
. . . . .. .
SSE SST SSA SSB SSAB
. . .
.

2. Calculation (given the ANOVA table is as follows):
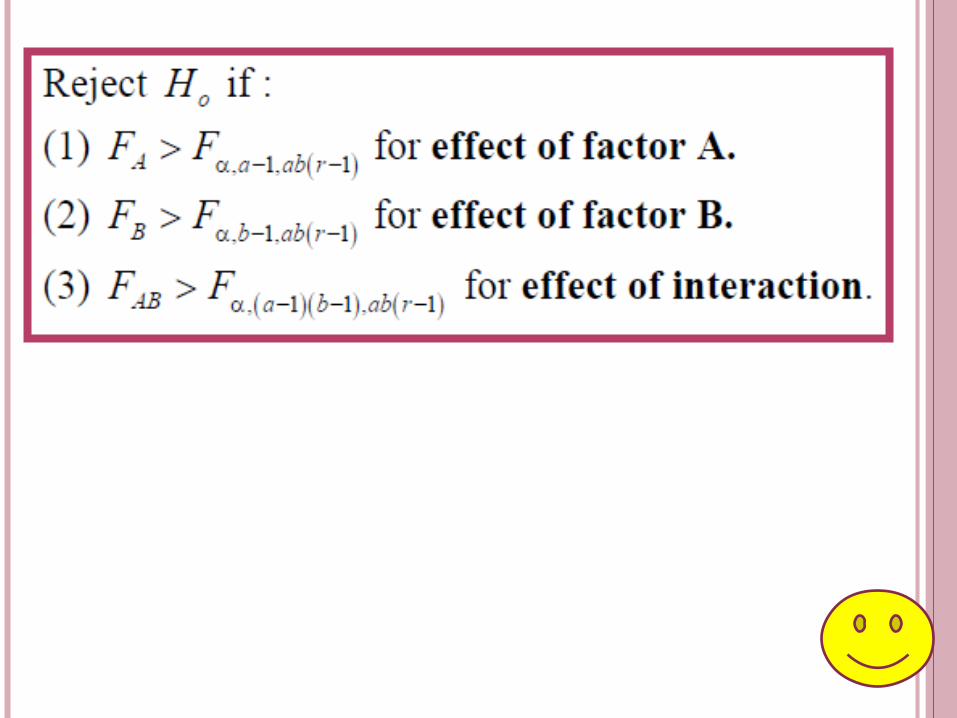
3. With = 0.05 we reject if :
Source of
Variation
SS df MS F
A 658.845 1 658.845 46.652
B 255.38 1 255.38 18.083
AB 2 1 2 0.1416
Error 56.49 4 14.1225
Total 972.715 7
0H
1 1
1 1
1 1 1
for effect of factor A
for effect of factor B
for effect of interaction
A ,a ,ab r
B ,b ,ab r
AB , a b ,ab r
F F
F F
F F
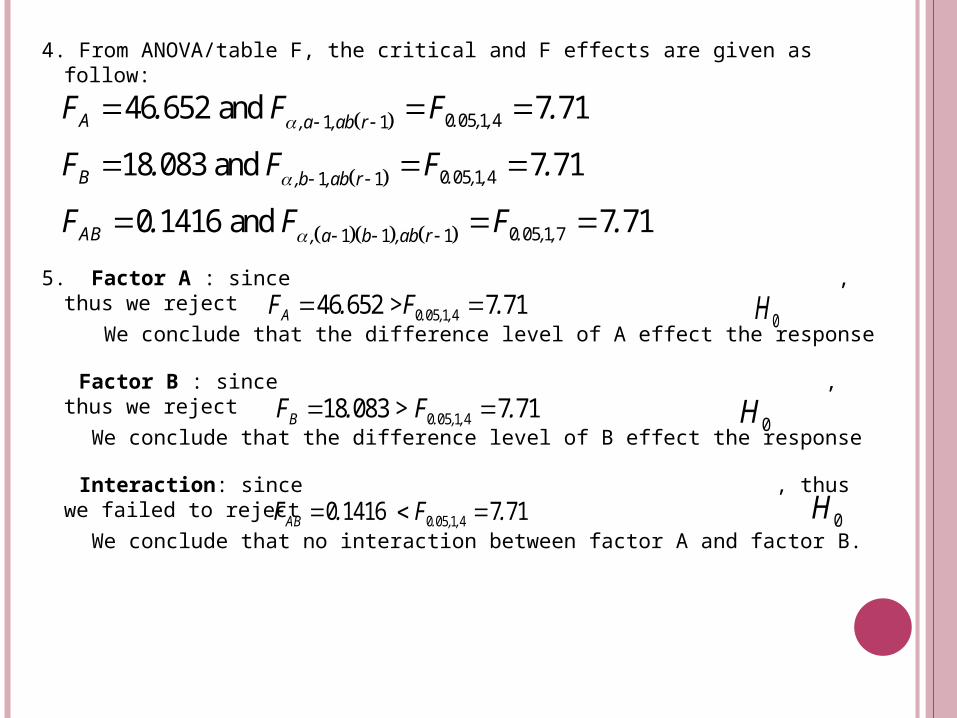
4. From ANOVA/table F, the critical and F effects are given as follow:
5. Factor A : since , thus we reject
We conclude that the difference level of A effect the response
Factor B : since , thus we reject
We conclude that the difference level of B effect the response
Interaction: since , thus we failed to reject
We conclude that no interaction between factor A and factor B.
0 05 1 41 1
0 05 1 41 1
0 05 1 71 1 1
46 652 and 7 71
18 083 and 7 71
0 1416 and 7 71
A . , ,,a ,ab r
B . , ,,b ,ab r
AB . , ,, a b ,ab r
F . F F .
F . F F .
F . F F .
0 05 1 446 652 > 7 71A . , ,F . F . 0H
0 05 1 418 083 > 7 71B . , ,F . F .
0 05 1 40 1416 7 71AB . , ,F . F .
0H
0H
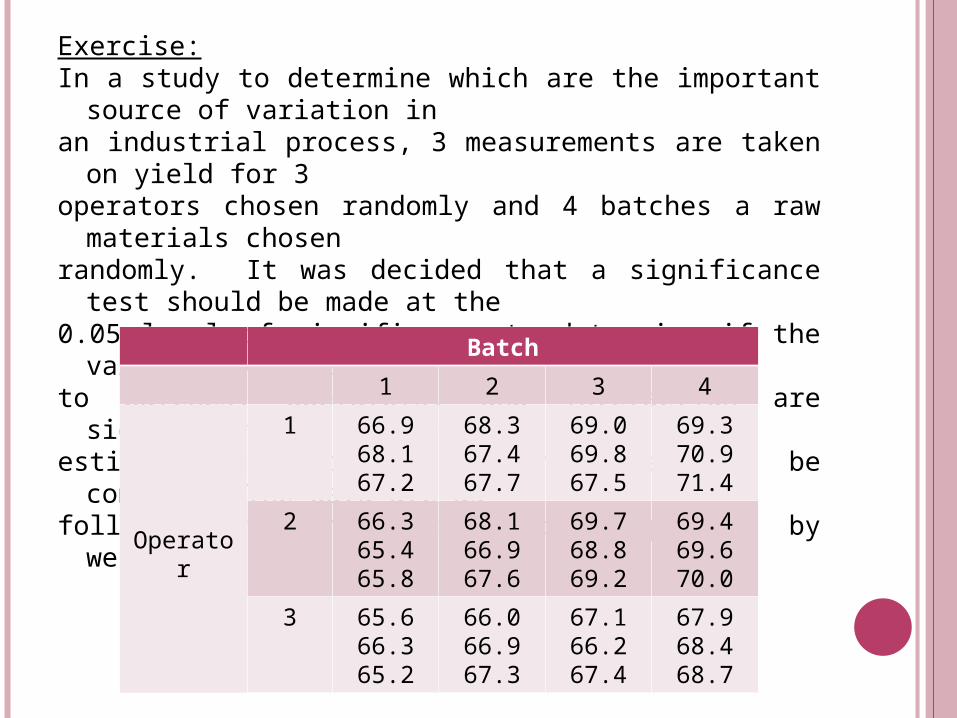
Exercise:In a study to determine which are the important source
of variation in an industrial process, 3 measurements are taken on
yield for 3 operators chosen randomly and 4 batches a raw
materials chosen randomly. It was decided that a significance test should
be made at the 0.05 level of significance to determine if the variance
components due to batches, operators, and interaction are significant. In
addition, estimates of variance components are to be computed.
The data are as follows, with the response being percent by weight.
Batch
1 2 3 4
Operator
1 66.968.167.2
68.367.467.7
69.069.867.5
69.370.971.4
2 66.365.465.8
68.166.967.6
69.768.869.2
69.469.670.0
3 65.666.365.2
66.066.967.3
67.166.267.4
67.968.468.7

Perform the analysis of variance of this experiment at level of significance
0.05. State your conclusion