Embed Size (px)
Citation preview
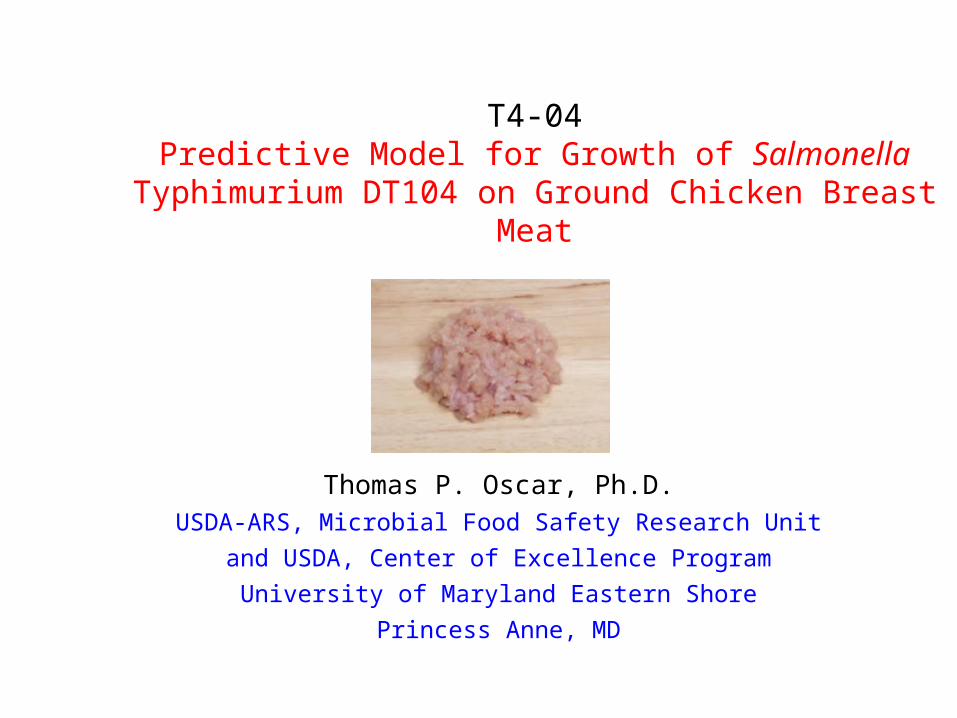
T4-04Predictive Model for Growth of Salmonella Typhimurium
DT104 on Ground Chicken Breast Meat
Thomas P. Oscar, Ph.D.USDA-ARS, Microbial Food Safety Research Unit
and USDA, Center of Excellence Program
University of Maryland Eastern Shore
Princess Anne, MD
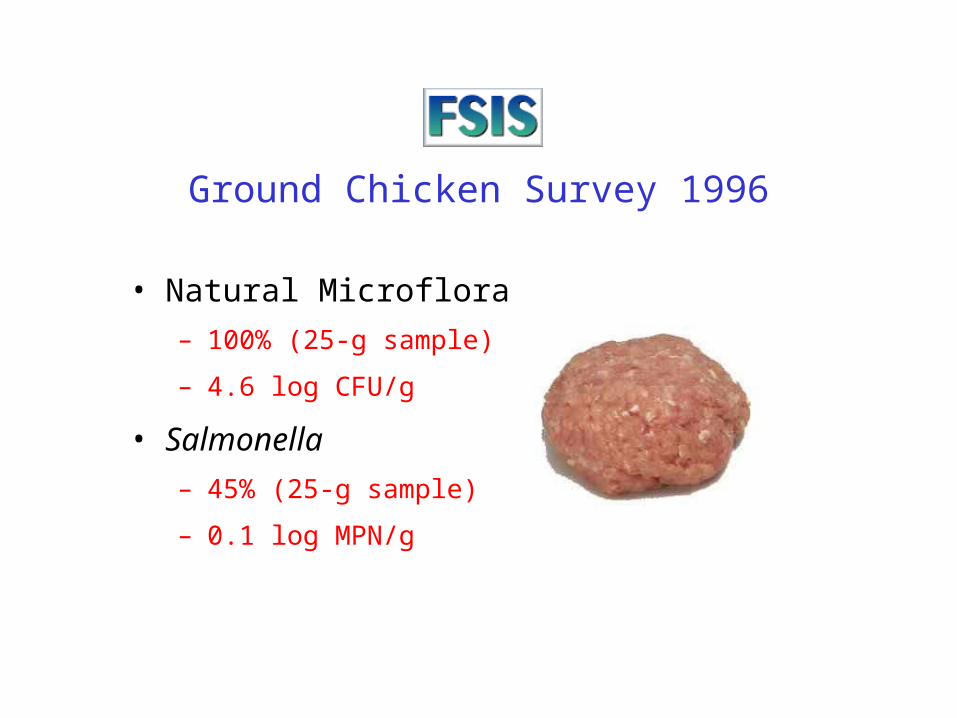
Ground Chicken Survey 1996
• Natural Microflora
– 100% (25-g sample)
– 4.6 log CFU/g
• Salmonella
– 45% (25-g sample)
– 0.1 log MPN/g
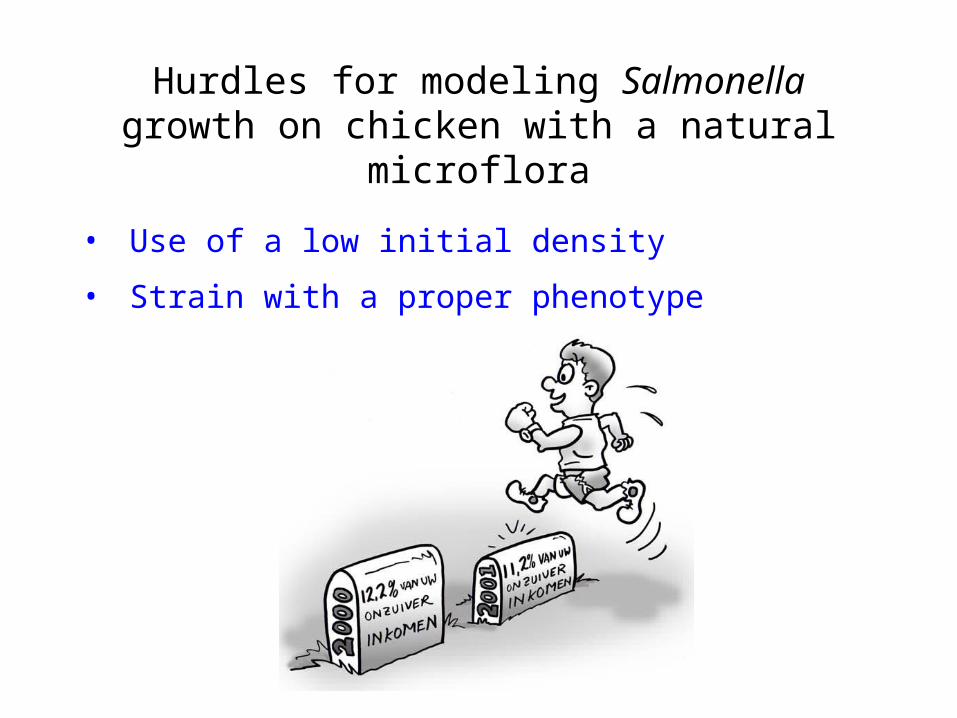
Hurdles for modeling Salmonella growth on chicken with a natural microflora
• Use of a low initial density
• Strain with a proper phenotype
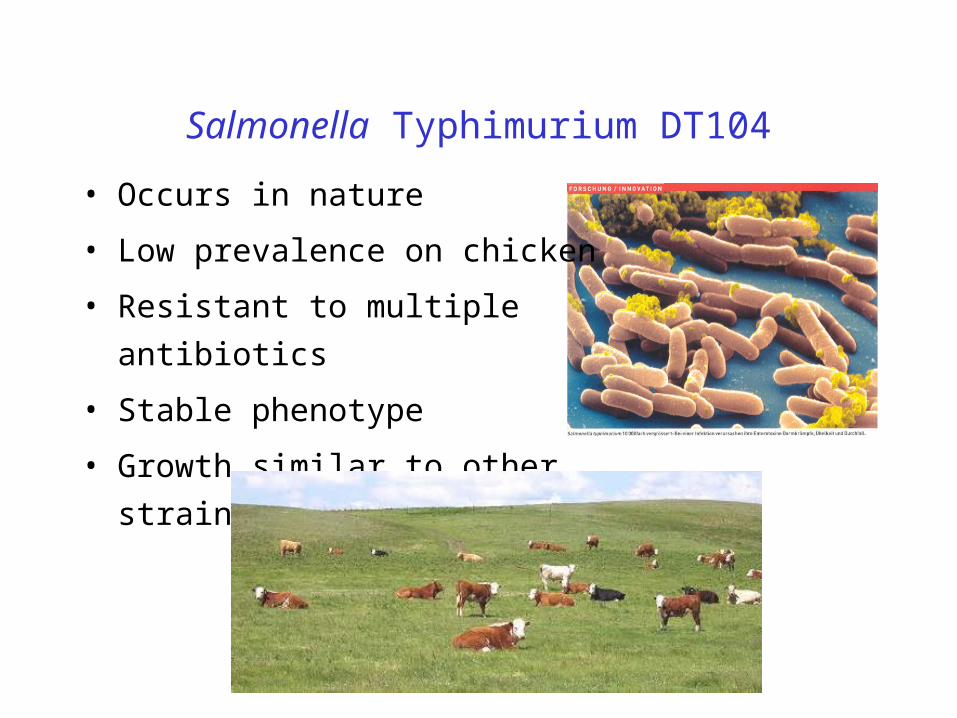
Salmonella Typhimurium DT104
• Occurs in nature
• Low prevalence on chicken
• Resistant to multiple antibiotics
• Stable phenotype
• Growth similar to other strains
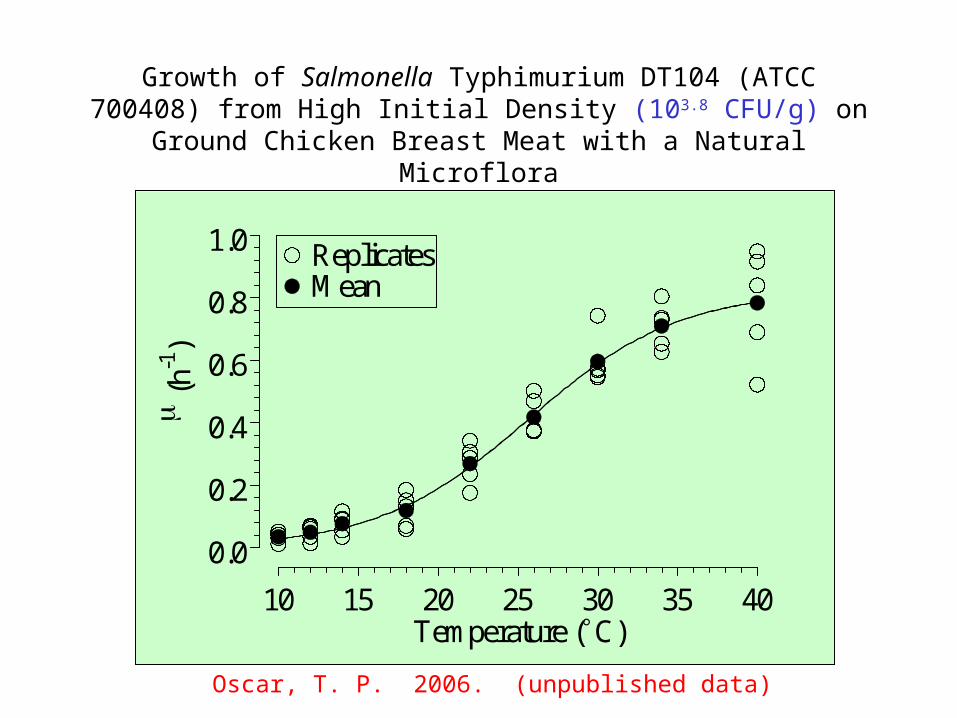
Growth of Salmonella Typhimurium DT104 (ATCC 700408) from High Initial Density (103.8 CFU/g) on Ground Chicken Breast Meat
with a Natural Microflora
Oscar, T. P. 2006. (unpublished data)
10 15 20 25 30 35 40
0.0
0.2
0.4
0.6
0.8
1.0ReplicatesMean
Temperature (C)
(h
-1)

Objective
• To overcome the hurdles for developing and
validating a predictive model for growth of
Salmonella on ground chicken with a natural
microflora.
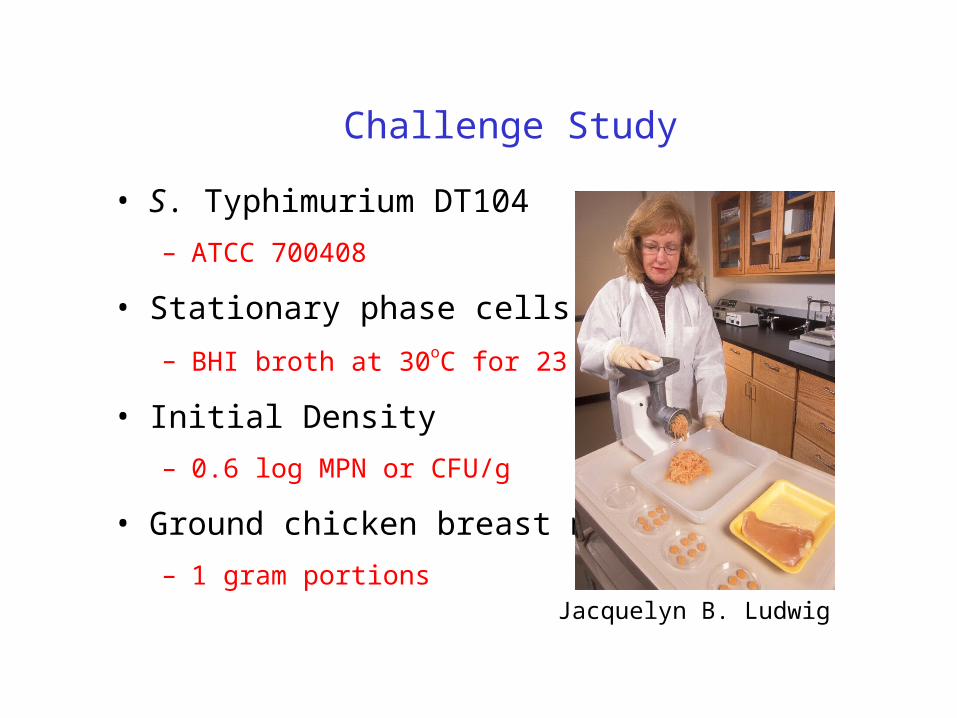
Challenge Study
• S. Typhimurium DT104
– ATCC 700408
• Stationary phase cells
– BHI broth at 30oC for 23 h
• Initial Density
– 0.6 log MPN or CFU/g
• Ground chicken breast meat
– 1 gram portionsJacquelyn B. Ludwig
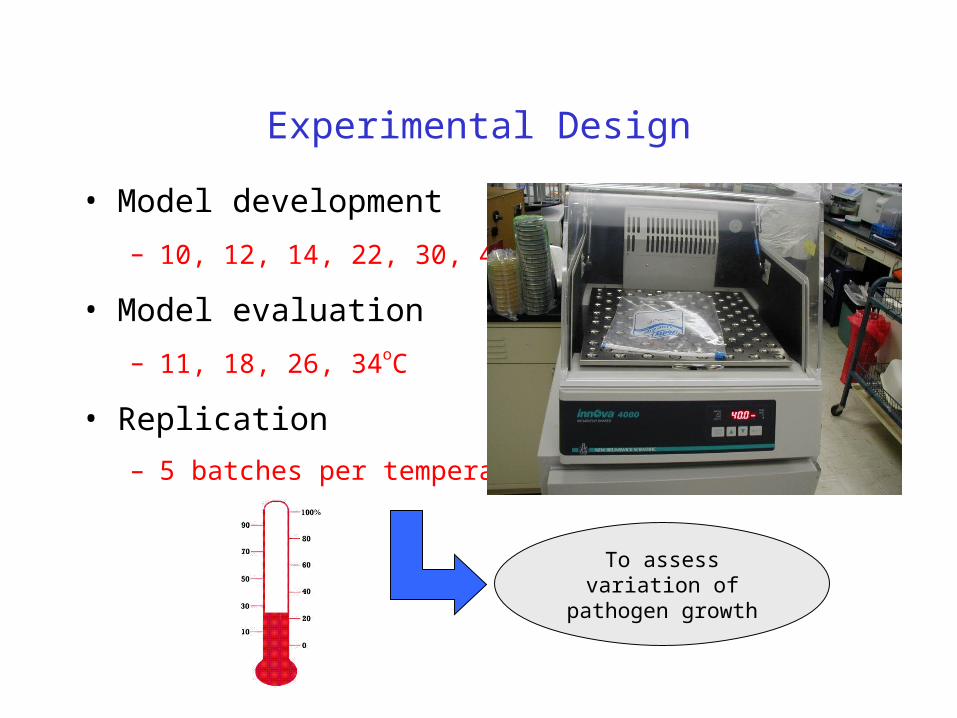
Experimental Design
• Model development
– 10, 12, 14, 22, 30, 40oC
• Model evaluation
– 11, 18, 26, 34oC
• Replication
– 5 batches per temperature
To assess variation of pathogen growth
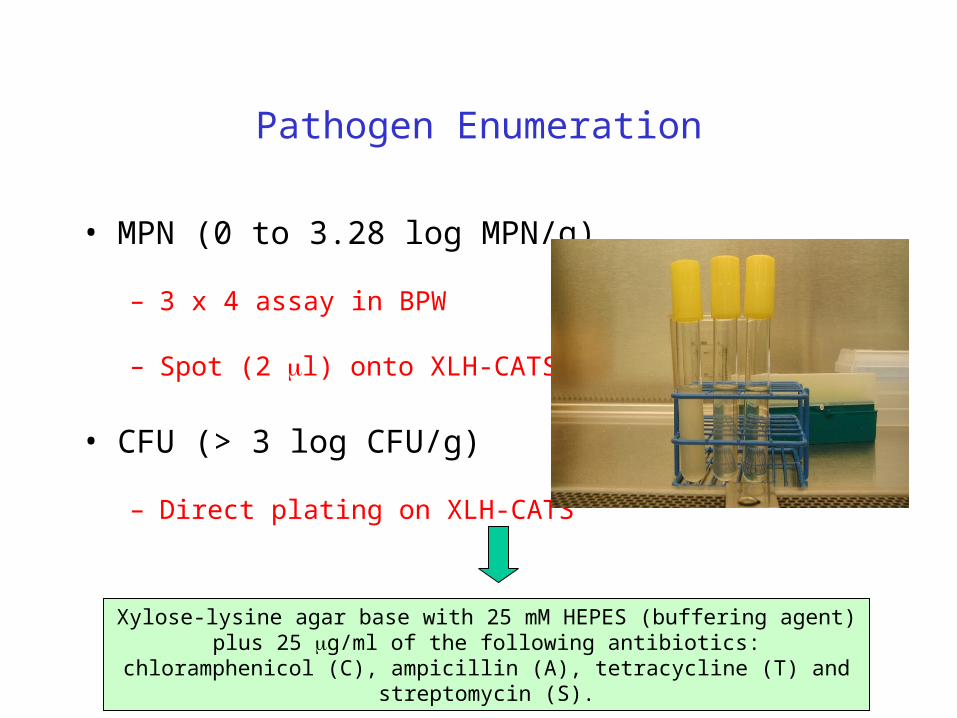
Pathogen Enumeration
• MPN (0 to 3.28 log MPN/g)
– 3 x 4 assay in BPW
– Spot (2 l) onto XLH-CATS
• CFU (> 3 log CFU/g)
– Direct plating on XLH-CATS
Xylose-lysine agar base with 25 mM HEPES (buffering agent) plus 25 g/ml of the following antibiotics: chloramphenicol (C), ampicillin (A), tetracycline (T)
and streptomycin (S).
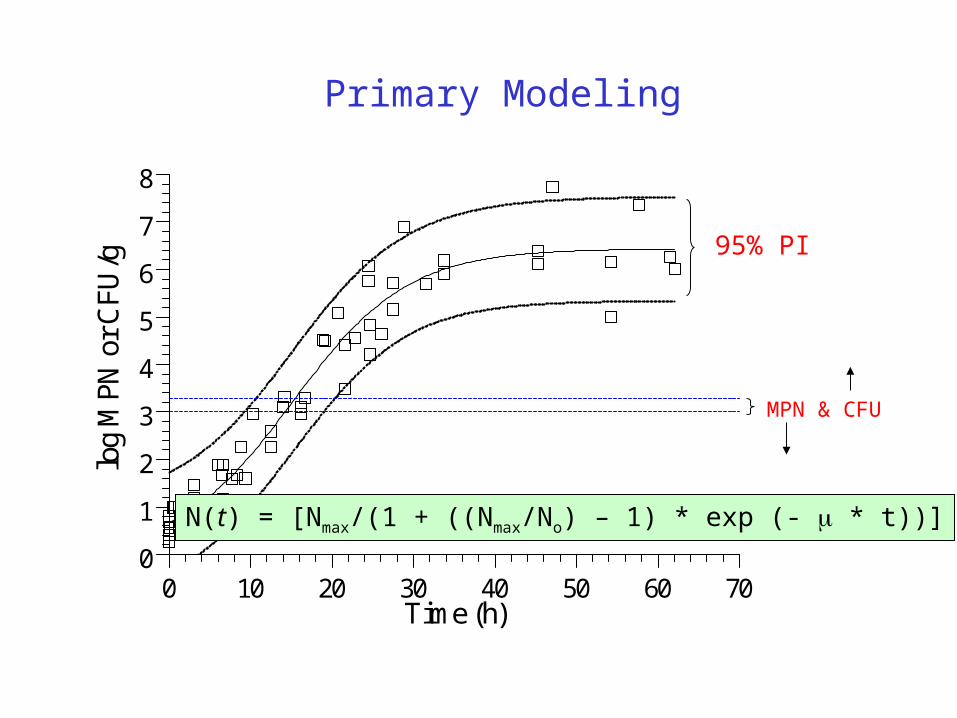
Primary Modeling
95% PI
MPN & CFU
0 10 20 30 40 50 60 700
1
2
3
4
5
6
7
8
Time (h)
log
MPN
or
CFU
/g
N(t) = [Nmax/(1 + ((Nmax/No) – 1) * exp (- * t))]
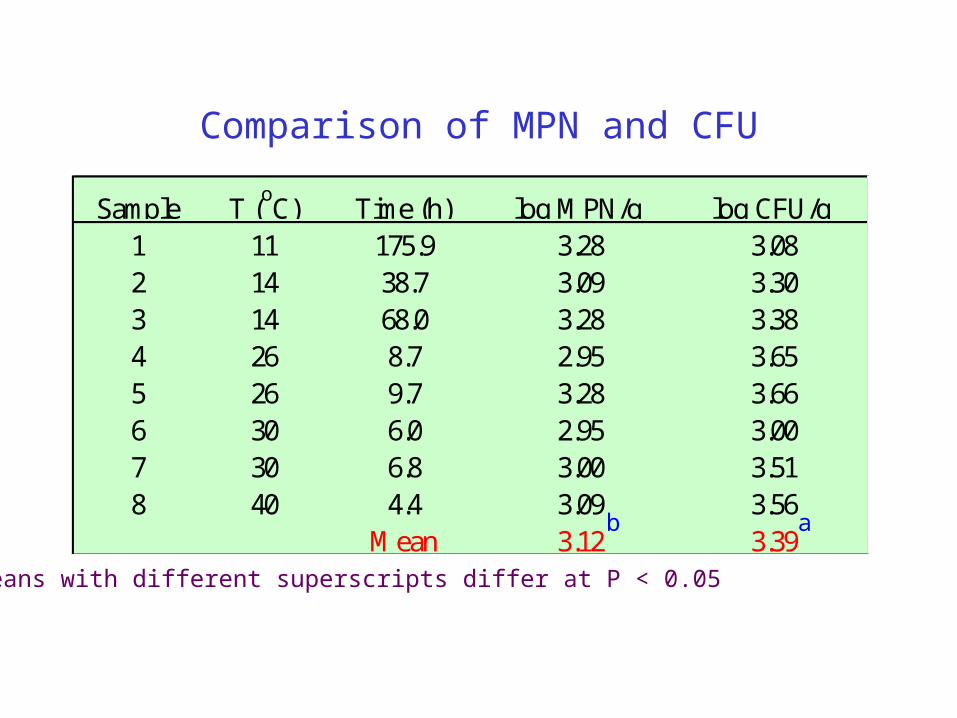
Comparison of MPN and CFU
Sample T (oC) Time (h) log MPN/g log CFU/g
1 11 175.9 3.28 3.082 14 38.7 3.09 3.303 14 68.0 3.28 3.384 26 8.7 2.95 3.655 26 9.7 3.28 3.666 30 6.0 2.95 3.007 30 6.8 3.00 3.518 40 4.4 3.09 3.56
Mean 3.12 3.39ab
Means with different superscripts differ at P < 0.05
0 100 200 3000
2
4
6
8
10
12 10C
Time (h)
log
MPN
or
CFU
/g
0 50 100 150 2000
2
4
6
8
10
12 12C
Time (h)
log
MPN
or
CFU
/g
0 50 100 150 2000
2
4
6
8
10
12 14C
Time (h)
log
MPN
or
CFU
/g
0 10 20 30 40 50 60 700
2
4
6
8
10
12 22C
Time (h)
log
MPN
or
CFU
/g
0 10 20 30 40 500
2
4
6
8
10
12 30C
Time (h)
log
MPN
or
CFU
/g
0 10 20 30 40 500
2
4
6
8
10
12 40 C
Time (h)
log
MPN
or
CFU
/g
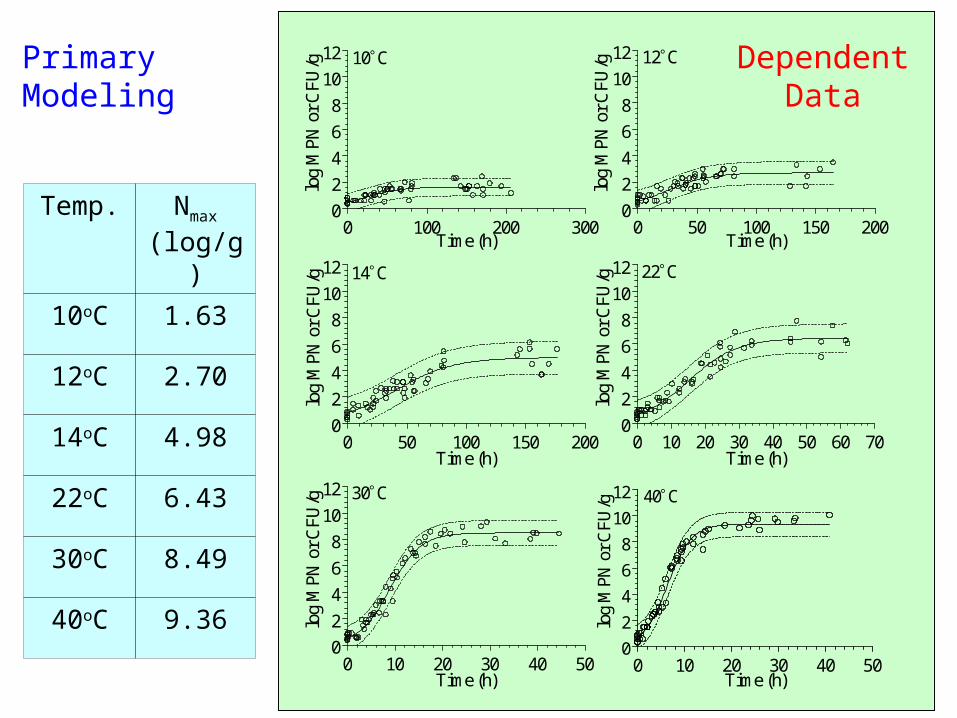
PrimaryModeling
DependentData
Temp. Nmax (log/g)
10oC 1.63
12oC 2.70
14oC 4.98
22oC 6.43
30oC 8.49
40oC 9.36
0 50 100 150 2000
2
4
6
8
10
12 11C
Time (h)
log
MP
N o
r C
FU
/g
0 25 50 75 100 125 1500
2
4
6
8
10
12 18C
Time (h)
log
MPN
or
CFU
/g0 25 50 75 100
0
2
4
6
8
10
12 26C
Time (h)
log
MPN
or
CFU
/g
0 10 20 30 400
2
4
6
8
10
12 34C
Time (h)lo
g M
PN o
r C
FU/g
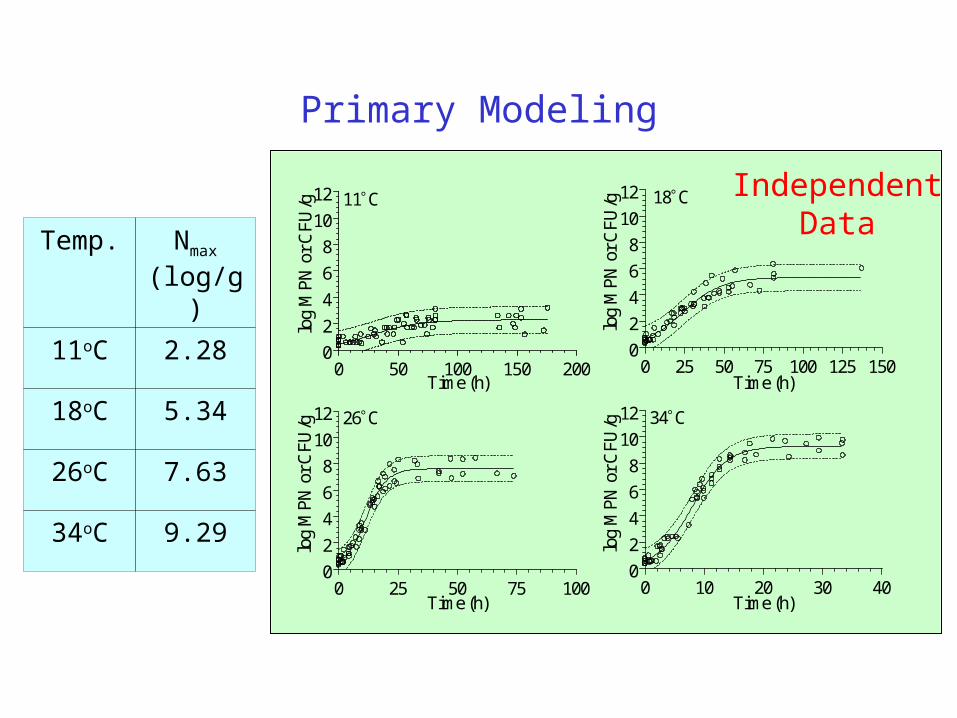
Primary Modeling
IndependentData
Temp. Nmax (log/g)
11oC 2.28
18oC 5.34
26oC 7.63
34oC 9.29
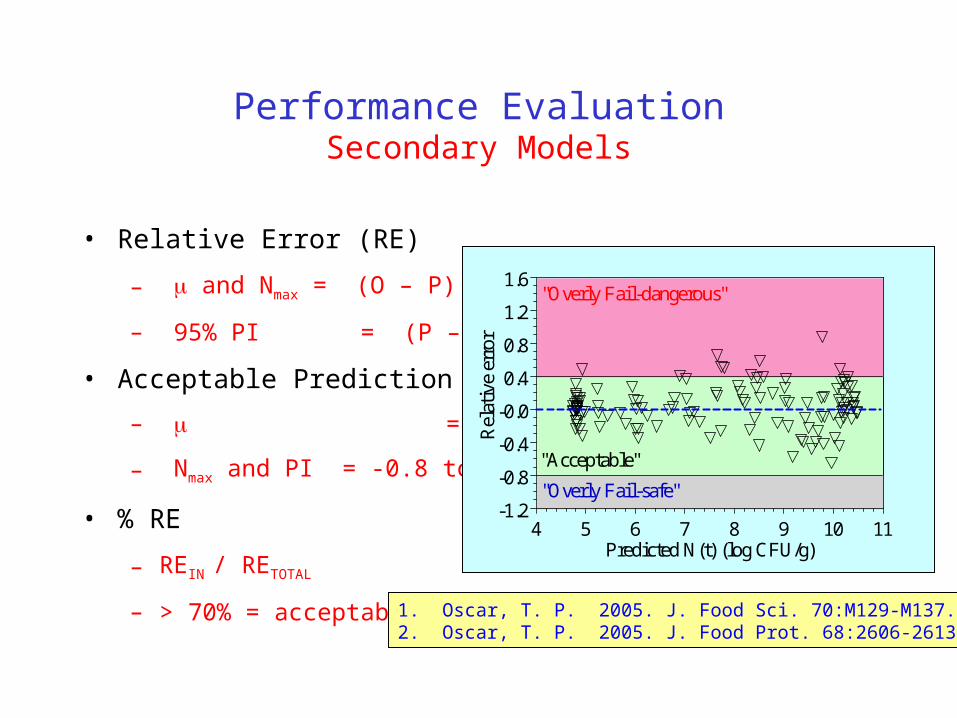
Performance EvaluationSecondary Models
• Relative Error (RE)
– and Nmax = (O – P) / P
– 95% PI = (P – O) / P
• Acceptable Prediction Zone
– = -0.3 to 0.15
– Nmax and PI = -0.8 to 0.40
• % RE
– REIN / RETOTAL
– > 70% = acceptable
"Acceptable"
"Overly Fail-safe"
"Overly Fail-dangerous"
4 5 6 7 8 9 10 11-1.2
-0.8
-0.4
-0.0
0.4
0.8
1.2
1.6
Predicted N(t) (log CFU/g)
Rel
ativ
e er
ror
1. Oscar, T. P. 2005. J. Food Sci. 70:M129-M137. 2. Oscar, T. P. 2005. J. Food Prot. 68:2606-2613.
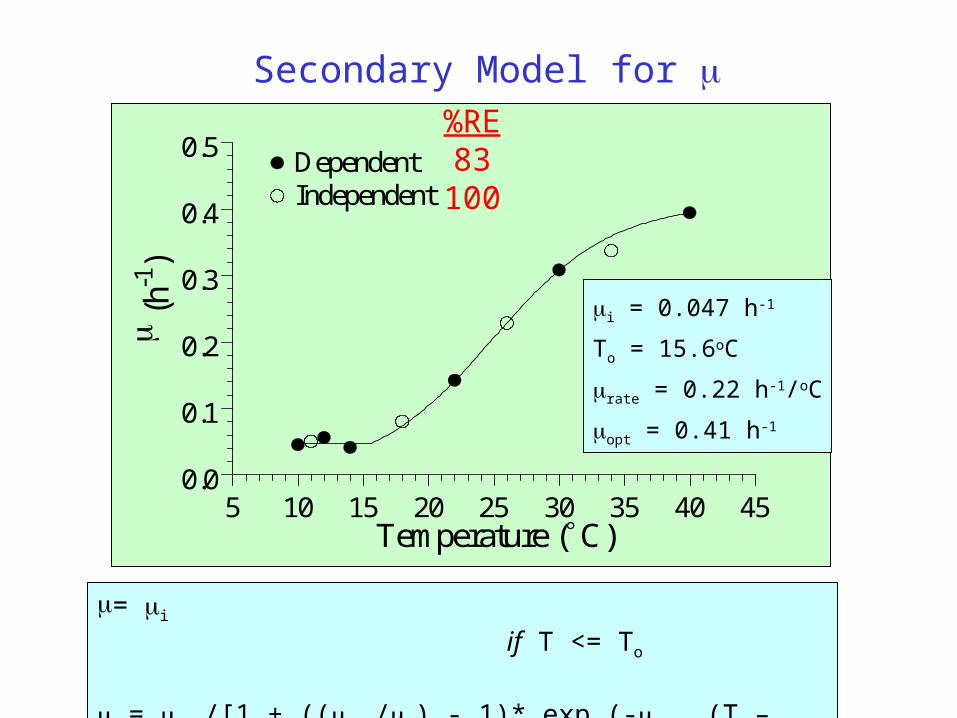
Secondary Model for
5 10 15 20 25 30 35 40 450.0
0.1
0.2
0.3
0.4
0.5
IndependentDependent
Temperature (C)
(h
-1)
%RE83
100
= i if T <= To
= opt/[1 + ((opt/i) - 1)* exp (-rate (T – To)] if T > To
i = 0.047 h-1
To = 15.6oC
rate = 0.22 h-1/oC
opt = 0.41 h-1
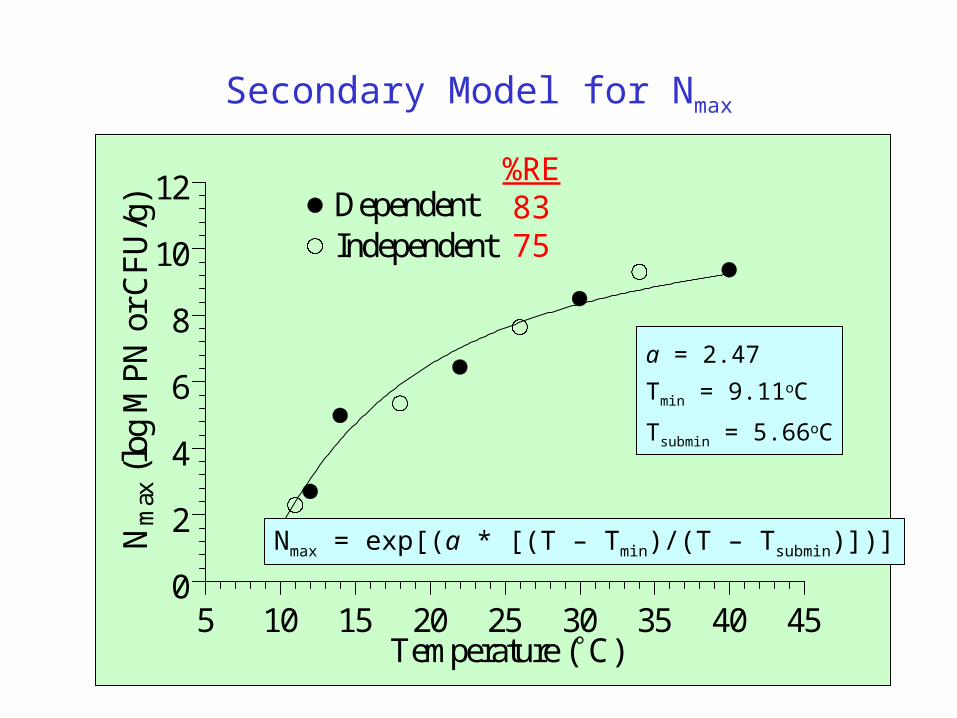
Secondary Model for Nmax
5 10 15 20 25 30 35 40 450
2
4
6
8
10
12
IndependentDependent
Temperature (C)
Nm
ax (
log
MP
N o
r C
FU
/g)
%RE8375
Nmax = exp[(a * [(T – Tmin)/(T – Tsubmin)])]
a = 2.47
Tmin = 9.11oC
Tsubmin = 5.66oC
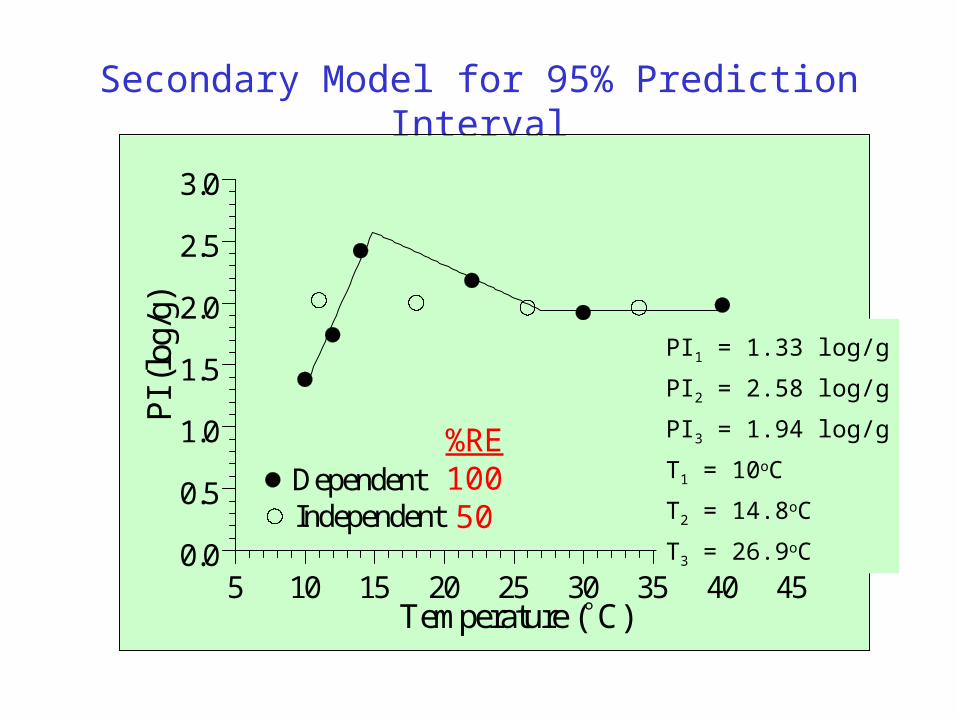
Secondary Model for 95% Prediction Interval
5 10 15 20 25 30 35 40 450.0
0.5
1.0
1.5
2.0
2.5
3.0
IndependentDependent
Temperature (C)
PI
(log
/g)
%RE10050
PI1 = 1.33 log/g
PI2 = 2.58 log/g
PI3 = 1.94 log/g
T1 = 10oC
T2 = 14.8oC
T3 = 26.9oC
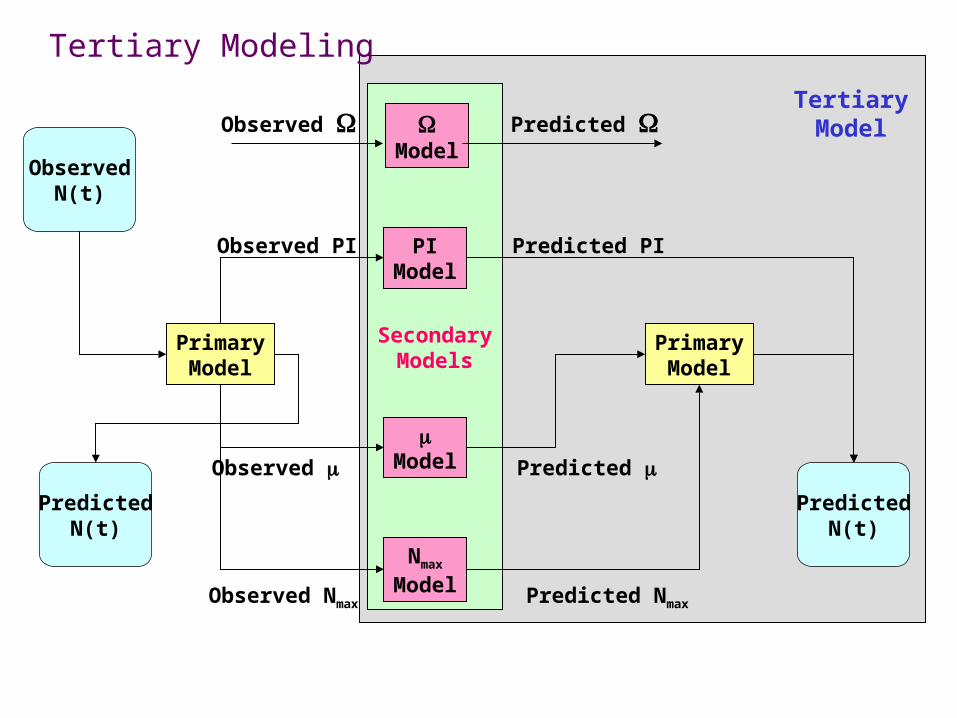
Secondary Models
PrimaryModel
PrimaryModel
Nmax
Model
Model
PIModel
Model
Observed Predicted
Observed PI Predicted PI
Observed Predicted
Observed Nmax Predicted Nmax
PredictedN(t)
ObservedN(t)
TertiaryModel
PredictedN(t)
Tertiary Modeling
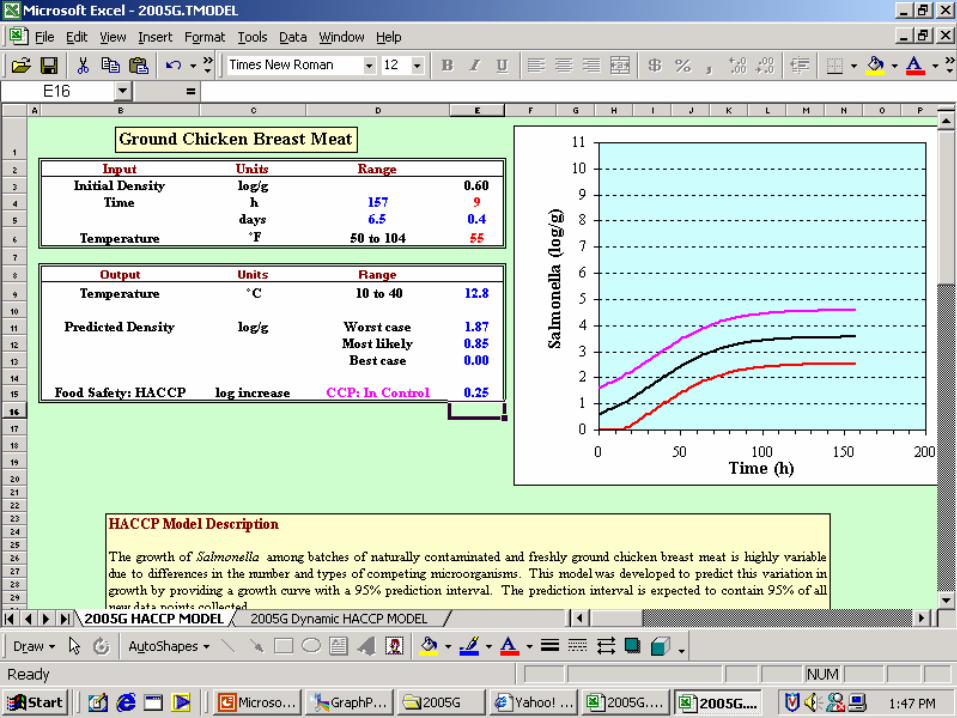
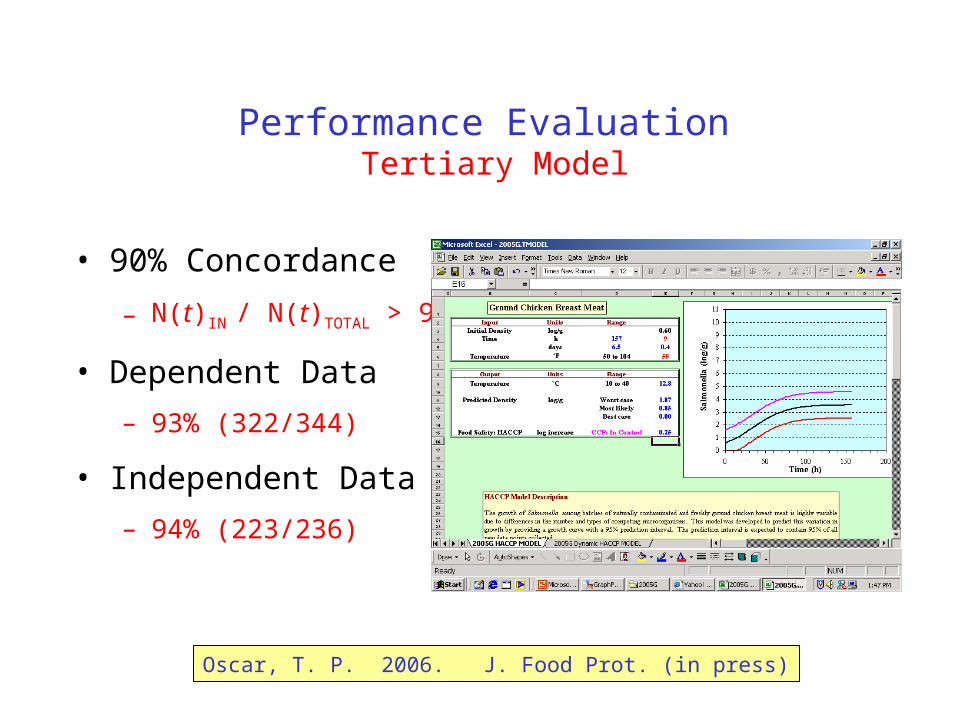
Performance Evaluation Tertiary Model
• 90% Concordance
– N(t)IN / N(t)TOTAL > 90%
• Dependent Data
– 93% (322/344)
• Independent Data
– 94% (223/236)
Oscar, T. P. 2006. J. Food Prot. (in press)
Summary
• MPN and CFU data can be used in tandem to model pathogen growth from a low initial density.
• 95% PI provides a simple stochastic method for modeling variation of pathogen growth among batches of food with natural microflora.
• 90% concordance is a simple method for validating stochastic models.