Embed Size (px)
Citation preview
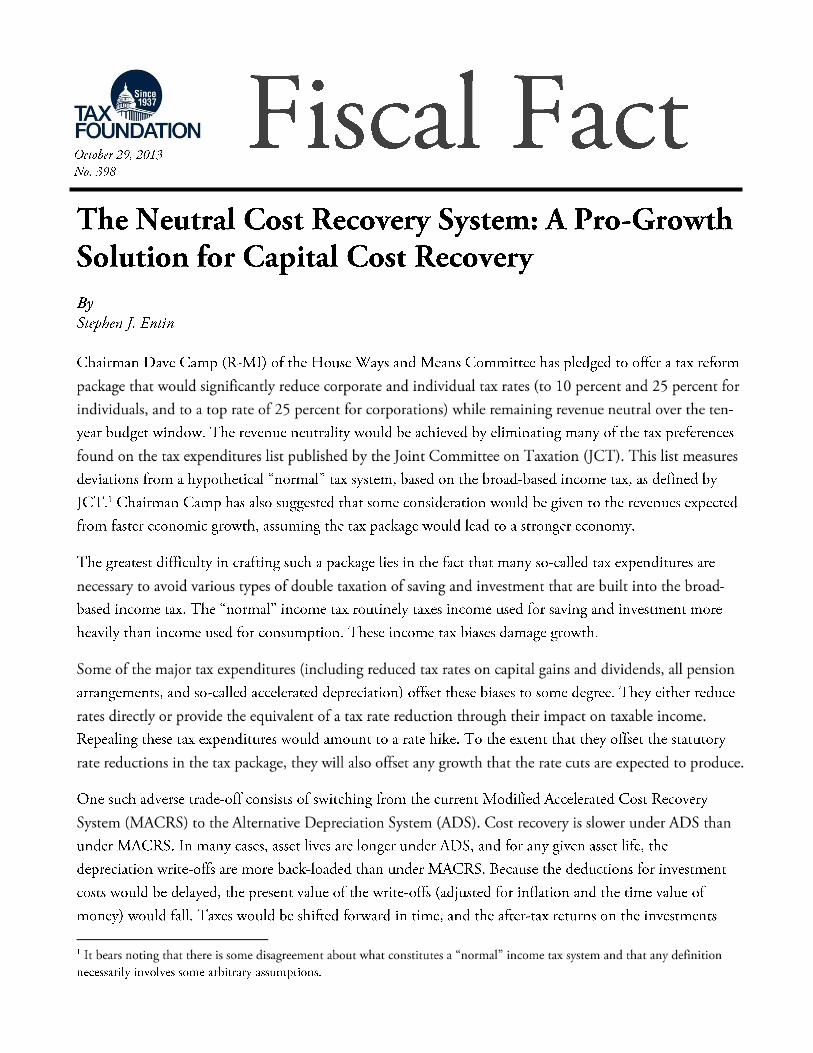


Table 1. Annual Write-Offs under Expensing, MACRS, ADS, and Various Adjustments to ADS,
Sum over Life, and Present Value
5-Year Asset Costing $100 Inflation = 2.2% Real Discount Rate = 3.25%
Year: 1 2 3 4 5 6 SUM P.V.
Expensing 100.00 0.00 0.00 0.00 0.00 0.00 100.00 100.00
MACRS 20.00 32.00 19.20 11.52 11.52 5.76 100.00 91.17
ADS 10.00 20.00 20.00 20.00 20.00 10.00 100.00 87.85
ADS & Inflation (=2.2%) 10.00 20.44 20.89 21.35 21.82 11.15 105.65 92.57
ADS & T-bond Rate (=2.86%) 10.00 20.57 21.16 21.77 22.39 11.51 107.40 94.04
ADS, Inflation + 1.5% (=3.7%) 10.00 20.74 21.51 22.30 23.13 11.99 109.67 95.93
ADS, Inflation + 3.25% (=5.45%) 10.00 21.09 22.24 23.45 24.73 13.04 114.55 100.00
Notes: Expensing is immediate write-off of the full cost of the asset. MACRS is the current modified accelerated cost
recovery system. ADS is the Alternative Depreciation System, also in current law use.
Inflation is the average inflation rate forecast by the Congressional Budget Office over the ten year budget window.
The T-bond rate is the current ten-year Treasury bond rate. The 1.5 percent adjustment is equal to a more normal
level of interest rates.
The 3.25 percent adjustment is the long term real return on capital. This is full neutral cost recovery.


Table 2. Static Revenue over the Ten Year Budget Window Switching from MACRS to ADS or to
Variations Building toward Full Neutral Cost Recovery
*Dollar figures in billions Static
Revenue
from
ADS
Lives
Static
Revenue from
ADS Lives &
2.2% Inflation
Adjustment
Static Revenue
fromADS Lives
& 10-year T-
bond Rate
Adjustment
Static Revenue from
ADS Lives & 2.2%
Inflation &
1.5% Real Return
Static Revenue from
ADS Lives &
2.2% Inflation &
3.25% Real Return
Corporate switch to ADS $388 $349 $337 $320 $285
Individual switch to ADS $253 $224 $215 $203 $178
Both switch to ADS $641 $573 $552 $524 $462
Static 10-year loss vs. ADS $0 -$68 -$89 -$118 -$179
Potential static revenue savings from phasing in the corporate tax rate reduction:
3-year
phase-in
$88 5-year phase-in $210
Notes: Augmenting ADS to avoid an investment drop can be paid for in a static sense by reducing the rate reduction by the
decrease in static revenues or by reducing the cost of the rate reductions by phasing in the rate cuts.
A 3-year phase-in of the corporate tax rate reduction would cover the cost of adjusting the ADS write-offs for 2.2 percent
forecasted inflation or enlarging them each year by the ten-year Treasury bond rate for both the corporate and individual
ADS.
A 5-year phase-in of the corporate tax rate cut would more-than-cover individual and corporate ADS adjustments for
inflation plus a 1.5 percent real return or a more generous 3.25 percent real return equal to the long run return on
capital—a “neutral cost recovery.” A 5-year phase-in would cut the static cost of moving to a 25 percent corporate rate
from $1.3 trillion to $1.09 trillion.
The static corporate gain ($285 billion) from the neutral cost (3.25 percent real return) version of ADS would cover
26 percent of the cost of the $1.09 trillion phased-in corporate rate cut. That is nearly the same share of the cost of an
immediate rate cut (30 percent of $1.3 trillion) that could be covered by an unadjusted ADS ($388 billion).
But the neutral cost option would yield a 4 percent gain in GDP instead of a nearly 1 percent loss (see Table 3).

Table 3. Alternative Cost Recovery and Rate Cut Scenarios—Long Run GDP and Budget Outcomes
*Dollar figures in billions of 2012 dollars; figures are annual amounts
Long Run
Economic
and Budget
Changes
vs. 2013 Law,
Annual Steady
State Outcome
Rate
Cuts
Only, No
"Pay-For"
Rate Cuts
Offset by
ADS
Rate Cuts
with ADS
Lives &
2.2% Inflation
Adjustment
Rate Cuts with
ADS Lives &
10-year T-bond
Rate
Adjustment
Rate Cuts with
ADS Lives &
2.2% Inflation
& 1.5% Real
Return
Rate Cuts with
ADS Lives &
2.2% Inflation &
3.25% Real
Return
GDP 0.83% -0.95% 0.41% 0.97% 1.81% 4.07%
Private business
stocks
2.21% -2.87% 1.02% 2.66% 5.11% 11.94%
Wage rate 0.62% -0.90% 0.27% 0.75% 1.46% 3.39%
Private business
hours of work
0.25% -0.08% 0.16% 0.26% 0.41% 0.81%
Static revenue -$32.80 -$4.30 -$25.50 -$33.40 -$44.60 -$73.60
Dynamic revenue -$5.20 -$36.50 -$11.70 -$0.80 $15.20 $57.70
$GDP $129.20 -$149.00 $63.70 $152.10 $282.00 $634.80
Corporate rate
(now 35%)
32.19% = 32.19% 32.48% 32.57% 32.69% 32.94%
Individual Tax Rates
Current
10.00% 10.00% = 10.00% 10.00% 10.00% 10.00% 10.00%
15.00% 14.63% = 14.63% 14.67% 14.68% 14.70% 14.74%
25.00% 25.00% = 25.00% 25.00% 25.00% 25.00% 25.00%
28.00% 27.78% = 27.78% 27.80% 27.81% 27.82% 27.84%
33.00% 32.40% = 32.40% 32.47% 32.49% 32.52% 32.58%
35.00% 34.25% = 34.25% 34.34% 34.36% 34.40% 34.47%
39.60% 38.51% = 38.51% 38.63% 38.67% 38.72% 38.83%
Note: Phasing in the rate cuts over three or five years would permit the rate reductions in the first two columns to be
kept throughout, increasing GDP gains in the other cases.

0.83%
-0.95%
0.41%
1.81%
4.07%
-2%
-1%
0%
1%
2%
3%
4%
5%
Rate Cuts
Only
ADS ADS Indexed at
2.2% Inflation
ADS Indexed for
Inflation Plus
1.5% Return
ADS Indexed for
Inflation Plus
3.25% Return
Perc
enta
ge C
han
ge in G
DP
GDP Benefits of Neutral Cost Recovery Compared To ADS
Revenue Neutral Options