Embed Size (px)
Citation preview
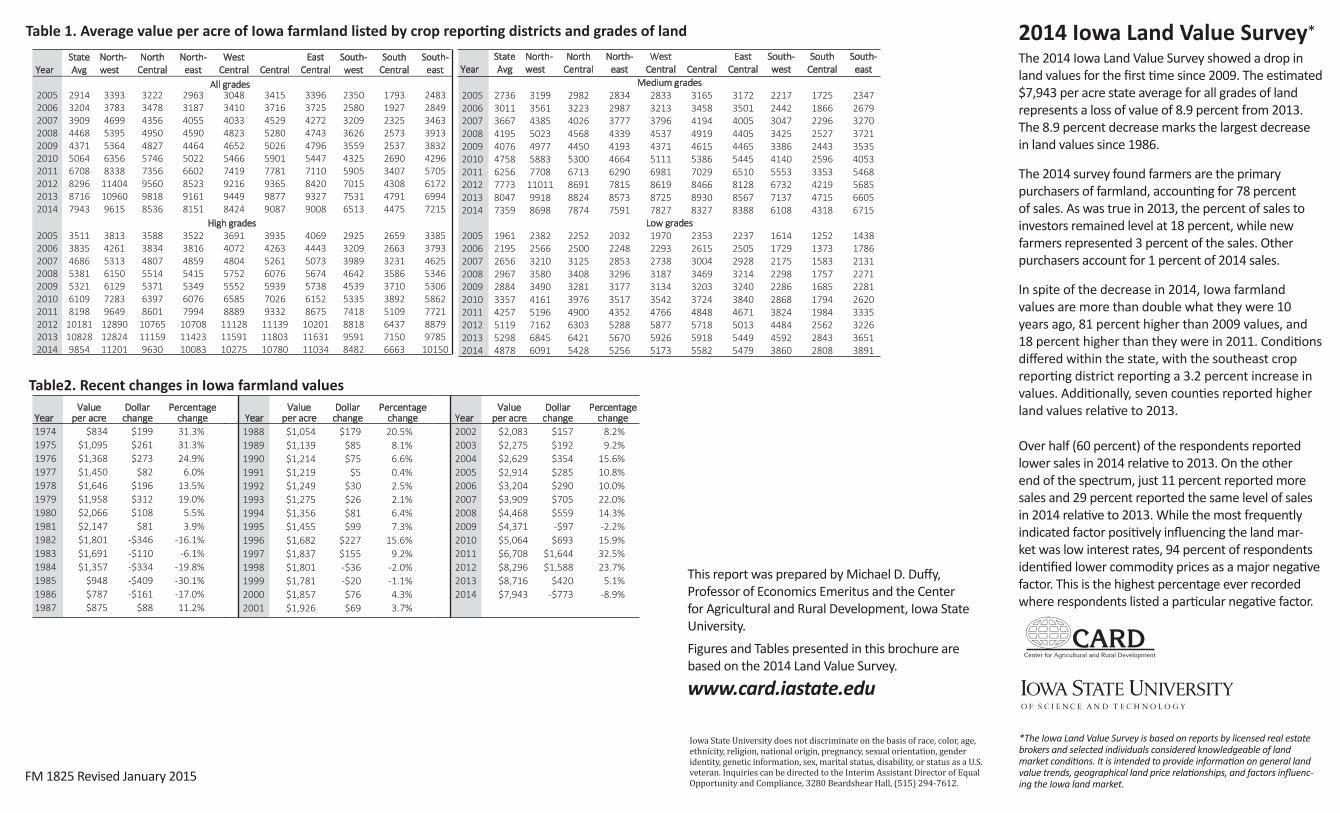
2014 Iowa Land Value Survey*
The 2014 Iowa Land Value Survey showed a drop in land values for the fi rst me since 2009. The es mated $7,943 per acre state average for all grades of land represents a loss of value of 8.9 percent from 2013. The 8.9 percent decrease marks the largest decrease in land values since 1986.
The 2014 survey found farmers are the primary purchasers of farmland, accoun ng for 78 percent of sales. As was true in 2013, the percent of sales to investors remained level at 18 percent, while new farmers represented 3 percent of the sales. Other purchasers account for 1 percent of 2014 sales.
In spite of the decrease in 2014, Iowa farmland values are more than double what they were 10 years ago, 81 percent higher than 2009 values, and 18 percent higher than they were in 2011. Condi ons diff ered within the state, with the southeast crop repor ng district repor ng a 3.2 percent increase in values. Addi onally, seven coun es reported higher land values rela ve to 2013.
Over half (60 percent) of the respondents reported lower sales in 2014 rela ve to 2013. On the other end of the spectrum, just 11 percent reported more sales and 29 percent reported the same level of sales in 2014 rela ve to 2013. While the most frequently indicated factor posi vely infl uencing the land mar-ket was low interest rates, 94 percent of respondents iden fi ed lower commodity prices as a major nega ve factor. This is the highest percentage ever recorded where respondents listed a par cular nega ve factor.
*The Iowa Land Value Survey is based on reports by licensed real estate brokers and selected individuals considered knowledgeable of land market condi ons. It is intended to provide informa on on general land value trends, geographical land price rela onships, and factors infl uenc-ing the Iowa land market.
Table 1. Average value per acre of Iowa farmland listed by crop repor ng districts and grades of land
Year State Avg
North-west
North Central
North-east
West Central Central
East Central
South-west
South Central
South-east
All grades 2005 2914 3393 3222 2963 3048 3415 3396 2350 1793 2483 2006 3204 3783 3478 3187 3410 3716 3725 2580 1927 2849 2007 3909 4699 4356 4055 4033 4529 4272 3209 2325 3463 2008 4468 5395 4950 4590 4823 5280 4743 3626 2573 3913 2009 4371 5364 4827 4464 4652 5026 4796 3559 2537 3832 2010 5064 6356 5746 5022 5466 5901 5447 4325 2690 4296 2011 6708 8338 7356 6602 7419 7781 7110 5905 3407 5705 2012 8296 11404 9560 8523 9216 9365 8420 7015 4308 6172 2013 8716 10960 9818 9161 9449 9877 9327 7531 4791 6994 2014 7943 9615 8536 8151 8424 9087 9008 6513 4475 7215 High grades 2005 3511 3813 3588 3522 3691 3935 4069 2925 2659 3385 2006 3835 4261 3834 3816 4072 4263 4443 3209 2663 3793 2007 4686 5313 4807 4859 4804 5261 5073 3989 3231 4625 2008 5381 6150 5514 5415 5752 6076 5674 4642 3586 5346 2009 5321 6129 5371 5349 5552 5939 5738 4539 3710 5306 2010 6109 7283 6397 6076 6585 7026 6152 5335 3892 5862 2011 8198 9649 8601 7994 8889 9332 8675 7418 5109 7721 2012 10181 12890 10765 10708 11128 11139 10201 8818 6437 8879 2013 10828 12824 11159 11423 11591 11803 11631 9591 7150 9785 2014 9854 11201 9630 10083 10275 10780 11034 8482 6663 10150
Year State Avg
North-west
North Central
North-east
West Central Central
East Central
South-west
South Central
South-east
Medium grades 2005 2736 3199 2982 2834 2833 3165 3172 2217 1725 2347 2006 3011 3561 3223 2987 3213 3458 3501 2442 1866 2679 2007 3667 4385 4026 3777 3796 4194 4005 3047 2296 3270 2008 4195 5023 4568 4339 4537 4919 4405 3425 2527 3721 2009 4076 4977 4450 4193 4371 4615 4465 3386 2443 3535 2010 4758 5883 5300 4664 5111 5386 5445 4140 2596 4053 2011 6256 7708 6713 6290 6981 7029 6510 5553 3353 5468 2012 7773 11011 8691 7815 8619 8466 8128 6732 4219 5685 2013 8047 9918 8824 8573 8725 8930 8567 7137 4715 6605 2014 7359 8698 7874 7591 7827 8327 8388 6108 4318 6715
Low grades 2005 1961 2382 2252 2032 1970 2353 2237 1614 1252 1438 2006 2195 2566 2500 2248 2293 2615 2505 1729 1373 1786 2007 2656 3210 3125 2853 2738 3004 2928 2175 1583 2131 2008 2967 3580 3408 3296 3187 3469 3214 2298 1757 2271 2009 2884 3490 3281 3177 3134 3203 3240 2286 1685 2281 2010 3357 4161 3976 3517 3542 3724 3840 2868 1794 2620 2011 4257 5196 4900 4352 4766 4848 4671 3824 1984 3335 2012 5119 7162 6303 5288 5877 5718 5013 4484 2562 3226 2013 5298 6845 6421 5670 5926 5918 5449 4592 2843 3651 2014 4878 6091 5428 5256 5173 5582 5479 3860 2808 3891
Table2. Recent changes in Iowa farmland values
Center for Agricultural and Rural Development
CARD
Iowa State University does not discriminate on the basis of race, color, age, ethnicity, religion, national origin, pregnancy, sexual orientation, gender identity, genetic information, sex, marital status, disability, or status as a U.S. veteran. Inquiries can be directed to the Interim Assistant Director of Equal Opportunity and Compliance, 3280 Beardshear Hall, (515) 294-7612.
This report was prepared by Michael D. Duff y, Professor of Economics Emeritus and the Center for Agricultural and Rural Development, Iowa State University.Figures and Tables presented in this brochure are based on the 2014 Land Value Survey.
www.card.iastate.edu
FM 1825 Revised January 2015

Analysis by countyThe 2014 state average for all grades of land, es -mated at $7,943 per acre, was a decrease of $773 per acre (8.9 percent) from 2013. Sco County again reported the highest value at $11,618 per acre. Keokuk County had the highest percentage increase (2.4 percent), and Washington County had the highest dollar increase ($199 per acre).
The lowest value per acre in the state was again reported by Decatur County, at $3,587 per acre. The largest dollar decrease ($1,684 per acre) was reported by O’Brien County. O’Brien County also showed the highest dollar decrease in 2013. The highest percentage decrease (15.2 percent) was reported by Worth County.
Analysis by quality of landLow grade land in the state averaged $4,878 per acre and showed a 7.9 percent ($420) decrease compared to 2013 values. Medium grade land av-eraged $7,359 per acre and showed an 8.5 percent ($688) decrease. High grade land averaged $9,854
per acre and showed a decrease of 9 percent ($974) per acre when compared to 2013 values.
Analysis by crop repor ng districtThe northwest district again reported the highest land value average, $9,615 per acre, a decrease of 12 percent from 2013 values. The southwest district reported the largest percentage decrease
in values, down 14 percent. The eastern district reported the smallest percentage decrease in values, down 3 percent. The southeastern district was the only district to report an overall increase in values with a 3 percent gain.
Land buyersThe 2014 survey asked respondents what percent of the land was sold to four categories of buy-ers: exis ng farmers, investors, new farmers, or other. The majority of farmland sales, 78 percent, we to exis ng farmers. Investors represented 18 percent of the sales. New farmers represented 3 percent of sales. Other purchasers represented 1 percent of sales.
Over half (60 percent) of the respondents re-ported lower sales in 2014 rela ve to 2013. On the other end of the spectrum, just 11 percent reported more sales and 29 percent reported the same level of sales in 2014 rela ve to 2013.
Future land valuesThe results of the 2014 survey are not surprising. Land values are determined by the income and the interest rate used. Net farm income has been has been at record high levels the past few years and interest rates have been at record low levels, combining to produce record high farm values.
The Iowa farmland market appears to have peaked for the foreseeable future, and com-modity prices appear to have moved to a new plateau. Iowa farmland values increased rapidly as net farm income increased and interest rates remained low. It appears the level of net farm income was over es mated and farmland values are adjus ng to these new expecta ons.
For addi onal informa on on the survey and on surveys from prior years, visit the Center for Agri-cultural and Rural Development website at www.card.iastate.edu
Figure 2. 2014 and 2013 Land values by county
Figure 1. Average value per acre of Iowa farmland
Figure 3. 2014 land values by crop repor ng district