Embed Size (px)
Citation preview
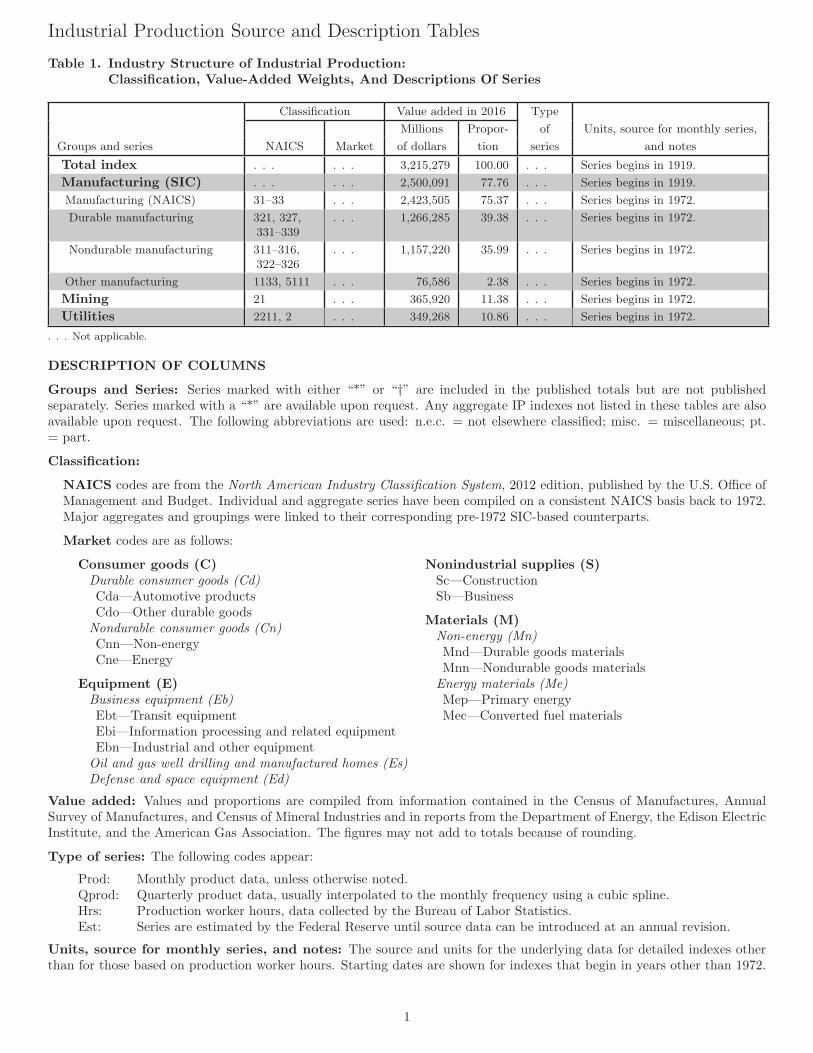
Industrial Production Source and Description Tables
Table 1. Industry Structure of Industrial Production:Classification, Value-Added Weights, And Descriptions Of Series
Classification Value added in 2016 Type
Millions Propor- of Units, source for monthly series,
Groups and series NAICS Market of dollars tion series and notes
Total index . . . . . . 3,215,279 100.00 . . . Series begins in 1919.
Manufacturing (SIC) . . . . . . 2,500,091 77.76 . . . Series begins in 1919.
Manufacturing (NAICS) 31–33 . . . 2,423,505 75.37 . . . Series begins in 1972.
Durable manufacturing 321, 327,331–339
. . . 1,266,285 39.38 . . . Series begins in 1972.
Nondurable manufacturing 311–316,322–326
. . . 1,157,220 35.99 . . . Series begins in 1972.
Other manufacturing 1133, 5111 . . . 76,586 2.38 . . . Series begins in 1972.
Mining 21 . . . 365,920 11.38 . . . Series begins in 1972.
Utilities 2211, 2 . . . 349,268 10.86 . . . Series begins in 1972.
. . . Not applicable.
DESCRIPTION OF COLUMNS
Groups and Series: Series marked with either “*” or “†” are included in the published totals but are not published
separately. Series marked with a “*” are available upon request. Any aggregate IP indexes not listed in these tables are also
available upon request. The following abbreviations are used: n.e.c. = not elsewhere classified; misc. = miscellaneous; pt.
= part.
Classification:
NAICS codes are from the North American Industry Classification System, 2012 edition, published by the U.S. Office of
Management and Budget. Individual and aggregate series have been compiled on a consistent NAICS basis back to 1972.
Major aggregates and groupings were linked to their corresponding pre-1972 SIC-based counterparts.
Market codes are as follows:
Consumer goods (C)Durable consumer goods (Cd)Cda—Automotive products
Cdo—Other durable goods
Nondurable consumer goods (Cn)Cnn—Non-energy
Cne—Energy
Equipment (E)Business equipment (Eb)Ebt—Transit equipment
Ebi—Information processing and related equipment
Ebn—Industrial and other equipment
Oil and gas well drilling and manufactured homes (Es)Defense and space equipment (Ed)
Nonindustrial supplies (S)Sc—Construction
Sb—Business
Materials (M)Non-energy (Mn)Mnd—Durable goods materials
Mnn—Nondurable goods materials
Energy materials (Me)Mep—Primary energy
Mec—Converted fuel materials
Value added: Values and proportions are compiled from information contained in the Census of Manufactures, Annual
Survey of Manufactures, and Census of Mineral Industries and in reports from the Department of Energy, the Edison Electric
Institute, and the American Gas Association. The figures may not add to totals because of rounding.
Type of series: The following codes appear:
Prod: Monthly product data, unless otherwise noted.
Qprod: Quarterly product data, usually interpolated to the monthly frequency using a cubic spline.
Hrs: Production worker hours, data collected by the Bureau of Labor Statistics.
Est: Series are estimated by the Federal Reserve until source data can be introduced at an annual revision.
Units, source for monthly series, and notes: The source and units for the underlying data for detailed indexes other
than for those based on production worker hours. Starting dates are shown for indexes that begin in years other than 1972.
1

COVERAGE INFORMATION
The individual series that comprise the total index include those industries in mining, utilities, and manufacturing.
Manufacturing comprises those industries included in the North American Industry Classification System, or NAICS,
definition of manufacturing plus the logging and newspaper, periodical, book, and directory publishing industries that
have traditionally been considered manufacturing. Durable manufacturing includes three-digit NAICS groups 321,
327, 331–337, and 339. Nondurable manufacturing includes three-digit NAICS groups 311–316 and 322–326. Othermanufacturing includes NAICS 1133 and 5111.
Mining includes three-digit NAICS groups 211–213.
Utilities include electric utilities and natural gas distribution, NAICS 2211 and 2212.
2
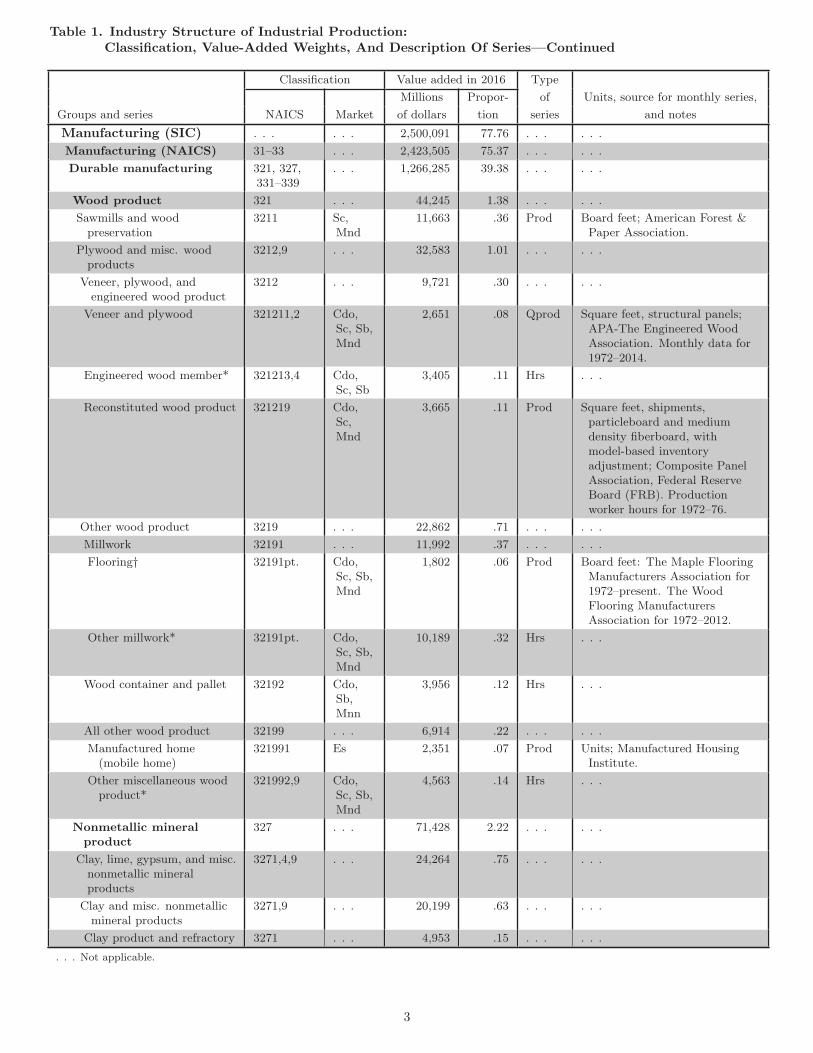
Table 1. Industry Structure of Industrial Production:Classification, Value-Added Weights, And Description Of Series—Continued
Classification Value added in 2016 Type
Millions Propor- of Units, source for monthly series,
Groups and series NAICS Market of dollars tion series and notes
Manufacturing (SIC) . . . . . . 2,500,091 77.76 . . . . . .
Manufacturing (NAICS) 31–33 . . . 2,423,505 75.37 . . . . . .
Durable manufacturing 321, 327,331–339
. . . 1,266,285 39.38 . . . . . .
Wood product 321 . . . 44,245 1.38 . . . . . .
Sawmills and woodpreservation
3211 Sc,Mnd
11,663 .36 Prod Board feet; American Forest &Paper Association.
Plywood and misc. woodproducts
3212,9 . . . 32,583 1.01 . . . . . .
Veneer, plywood, andengineered wood product
3212 . . . 9,721 .30 . . . . . .
Veneer and plywood 321211,2 Cdo,Sc, Sb,Mnd
2,651 .08 Qprod Square feet, structural panels;APA-The Engineered WoodAssociation. Monthly data for1972–2014.
Engineered wood member* 321213,4 Cdo,Sc, Sb
3,405 .11 Hrs . . .
Reconstituted wood product 321219 Cdo,Sc,Mnd
3,665 .11 Prod Square feet, shipments,particleboard and mediumdensity fiberboard, withmodel-based inventoryadjustment; Composite PanelAssociation, Federal ReserveBoard (FRB). Productionworker hours for 1972–76.
Other wood product 3219 . . . 22,862 .71 . . . . . .
Millwork 32191 . . . 11,992 .37 . . . . . .
Flooring† 32191pt. Cdo,Sc, Sb,Mnd
1,802 .06 Prod Board feet: The Maple FlooringManufacturers Association for1972–present. The WoodFlooring ManufacturersAssociation for 1972–2012.
Other millwork* 32191pt. Cdo,Sc, Sb,Mnd
10,189 .32 Hrs . . .
Wood container and pallet 32192 Cdo,Sb,Mnn
3,956 .12 Hrs . . .
All other wood product 32199 . . . 6,914 .22 . . . . . .
Manufactured home(mobile home)
321991 Es 2,351 .07 Prod Units; Manufactured HousingInstitute.
Other miscellaneous woodproduct*
321992,9 Cdo,Sc, Sb,Mnd
4,563 .14 Hrs . . .
Nonmetallic mineralproduct
327 . . . 71,428 2.22 . . . . . .
Clay, lime, gypsum, and misc.nonmetallic mineralproducts
3271,4,9 . . . 24,264 .75 . . . . . .
Clay and misc. nonmetallicmineral products
3271,9 . . . 20,199 .63 . . . . . .
Clay product and refractory 3271 . . . 4,953 .15 . . . . . .
. . . Not applicable.
3
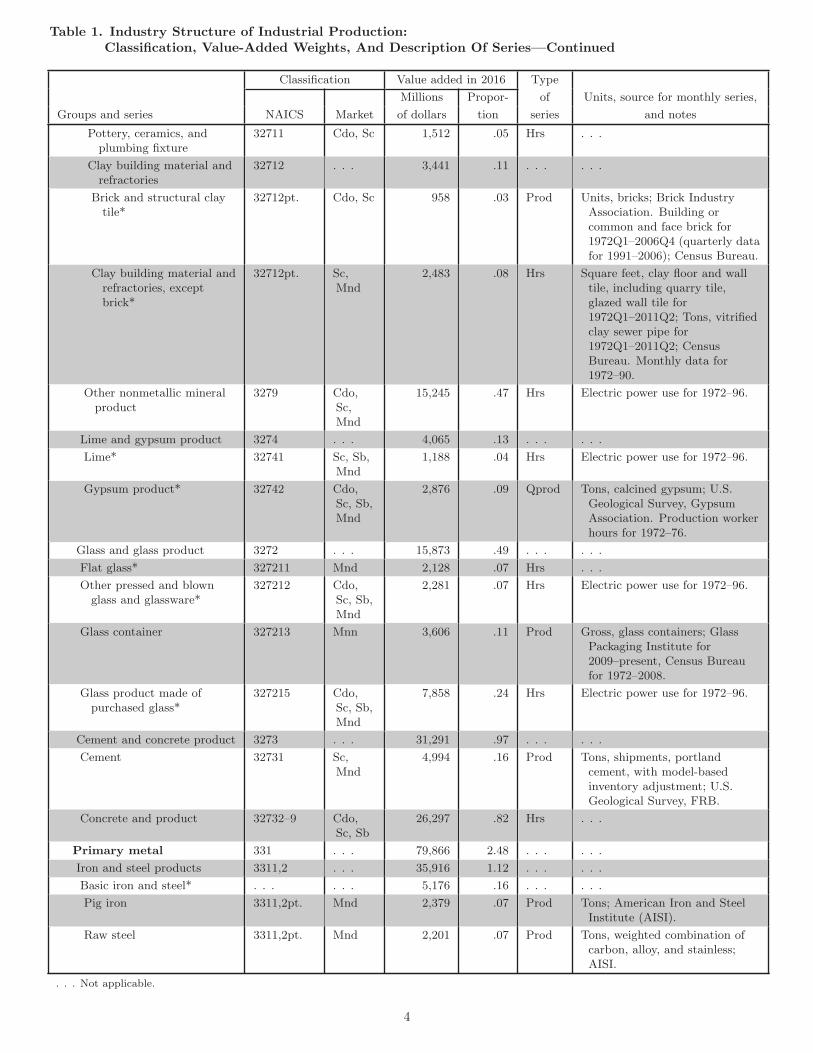
Table 1. Industry Structure of Industrial Production:Classification, Value-Added Weights, And Description Of Series—Continued
Classification Value added in 2016 Type
Millions Propor- of Units, source for monthly series,
Groups and series NAICS Market of dollars tion series and notes
Pottery, ceramics, andplumbing fixture
32711 Cdo, Sc 1,512 .05 Hrs . . .
Clay building material andrefractories
32712 . . . 3,441 .11 . . . . . .
Brick and structural claytile*
32712pt. Cdo, Sc 958 .03 Prod Units, bricks; Brick IndustryAssociation. Building orcommon and face brick for1972Q1–2006Q4 (quarterly datafor 1991–2006); Census Bureau.
Clay building material andrefractories, exceptbrick*
32712pt. Sc,Mnd
2,483 .08 Hrs Square feet, clay floor and walltile, including quarry tile,glazed wall tile for1972Q1–2011Q2; Tons, vitrifiedclay sewer pipe for1972Q1–2011Q2; CensusBureau. Monthly data for1972–90.
Other nonmetallic mineralproduct
3279 Cdo,Sc,Mnd
15,245 .47 Hrs Electric power use for 1972–96.
Lime and gypsum product 3274 . . . 4,065 .13 . . . . . .
Lime* 32741 Sc, Sb,Mnd
1,188 .04 Hrs Electric power use for 1972–96.
Gypsum product* 32742 Cdo,Sc, Sb,Mnd
2,876 .09 Qprod Tons, calcined gypsum; U.S.Geological Survey, GypsumAssociation. Production workerhours for 1972–76.
Glass and glass product 3272 . . . 15,873 .49 . . . . . .
Flat glass* 327211 Mnd 2,128 .07 Hrs . . .
Other pressed and blownglass and glassware*
327212 Cdo,Sc, Sb,Mnd
2,281 .07 Hrs Electric power use for 1972–96.
Glass container 327213 Mnn 3,606 .11 Prod Gross, glass containers; GlassPackaging Institute for2009–present, Census Bureaufor 1972–2008.
Glass product made ofpurchased glass*
327215 Cdo,Sc, Sb,Mnd
7,858 .24 Hrs Electric power use for 1972–96.
Cement and concrete product 3273 . . . 31,291 .97 . . . . . .
Cement 32731 Sc,Mnd
4,994 .16 Prod Tons, shipments, portlandcement, with model-basedinventory adjustment; U.S.Geological Survey, FRB.
Concrete and product 32732–9 Cdo,Sc, Sb
26,297 .82 Hrs . . .
Primary metal 331 . . . 79,866 2.48 . . . . . .
Iron and steel products 3311,2 . . . 35,916 1.12 . . . . . .
Basic iron and steel* . . . . . . 5,176 .16 . . . . . .
Pig iron 3311,2pt. Mnd 2,379 .07 Prod Tons; American Iron and SteelInstitute (AISI).
Raw steel 3311,2pt. Mnd 2,201 .07 Prod Tons, weighted combination ofcarbon, alloy, and stainless;AISI.
. . . Not applicable.
4
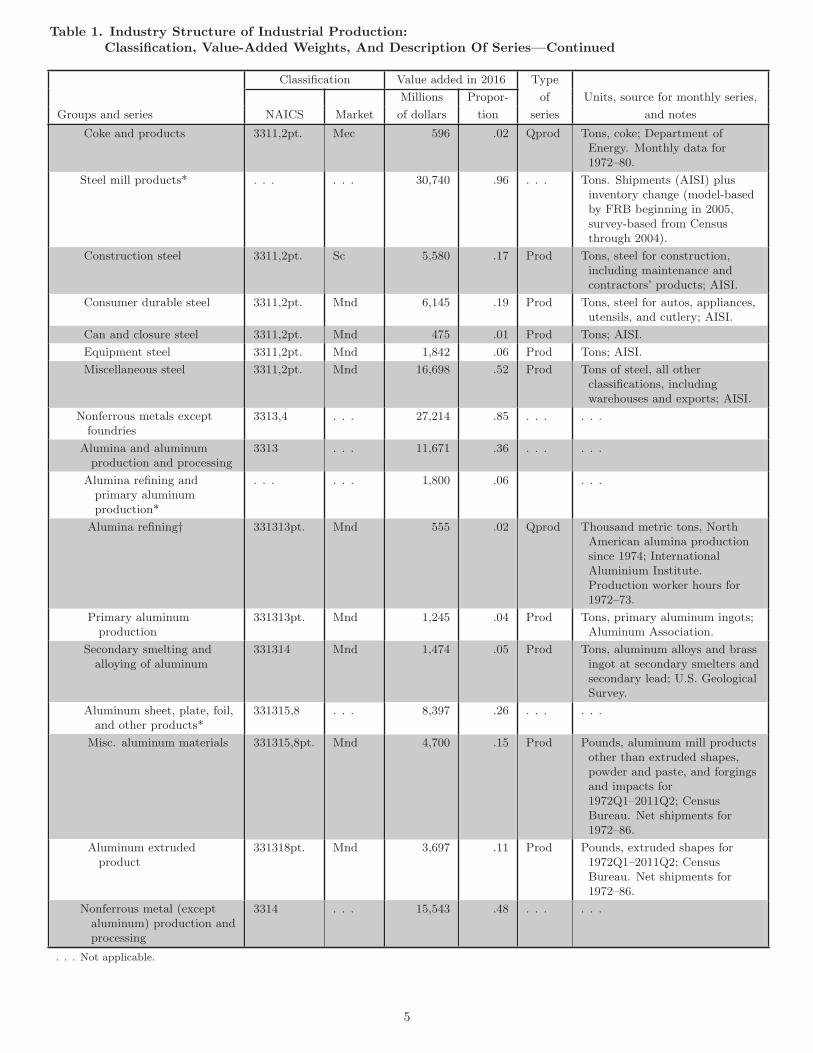
Table 1. Industry Structure of Industrial Production:Classification, Value-Added Weights, And Description Of Series—Continued
Classification Value added in 2016 Type
Millions Propor- of Units, source for monthly series,
Groups and series NAICS Market of dollars tion series and notes
Coke and products 3311,2pt. Mec 596 .02 Qprod Tons, coke; Department ofEnergy. Monthly data for1972–80.
Steel mill products* . . . . . . 30,740 .96 . . . Tons. Shipments (AISI) plusinventory change (model-basedby FRB beginning in 2005,survey-based from Censusthrough 2004).
Construction steel 3311,2pt. Sc 5,580 .17 Prod Tons, steel for construction,including maintenance andcontractors’ products; AISI.
Consumer durable steel 3311,2pt. Mnd 6,145 .19 Prod Tons, steel for autos, appliances,utensils, and cutlery; AISI.
Can and closure steel 3311,2pt. Mnd 475 .01 Prod Tons; AISI.
Equipment steel 3311,2pt. Mnd 1,842 .06 Prod Tons; AISI.
Miscellaneous steel 3311,2pt. Mnd 16,698 .52 Prod Tons of steel, all otherclassifications, includingwarehouses and exports; AISI.
Nonferrous metals exceptfoundries
3313,4 . . . 27,214 .85 . . . . . .
Alumina and aluminumproduction and processing
3313 . . . 11,671 .36 . . . . . .
Alumina refining andprimary aluminumproduction*
. . . . . . 1,800 .06 . . .
Alumina refining† 331313pt. Mnd 555 .02 Qprod Thousand metric tons, NorthAmerican alumina productionsince 1974; InternationalAluminium Institute.Production worker hours for1972–73.
Primary aluminumproduction
331313pt. Mnd 1,245 .04 Prod Tons, primary aluminum ingots;Aluminum Association.
Secondary smelting andalloying of aluminum
331314 Mnd 1,474 .05 Prod Tons, aluminum alloys and brassingot at secondary smelters andsecondary lead; U.S. GeologicalSurvey.
Aluminum sheet, plate, foil,and other products*
331315,8 . . . 8,397 .26 . . . . . .
Misc. aluminum materials 331315,8pt. Mnd 4,700 .15 Prod Pounds, aluminum mill productsother than extruded shapes,powder and paste, and forgingsand impacts for1972Q1–2011Q2; CensusBureau. Net shipments for1972–86.
Aluminum extrudedproduct
331318pt. Mnd 3,697 .11 Prod Pounds, extruded shapes for1972Q1–2011Q2; CensusBureau. Net shipments for1972–86.
Nonferrous metal (exceptaluminum) production andprocessing
3314 . . . 15,543 .48 . . . . . .
. . . Not applicable.
5
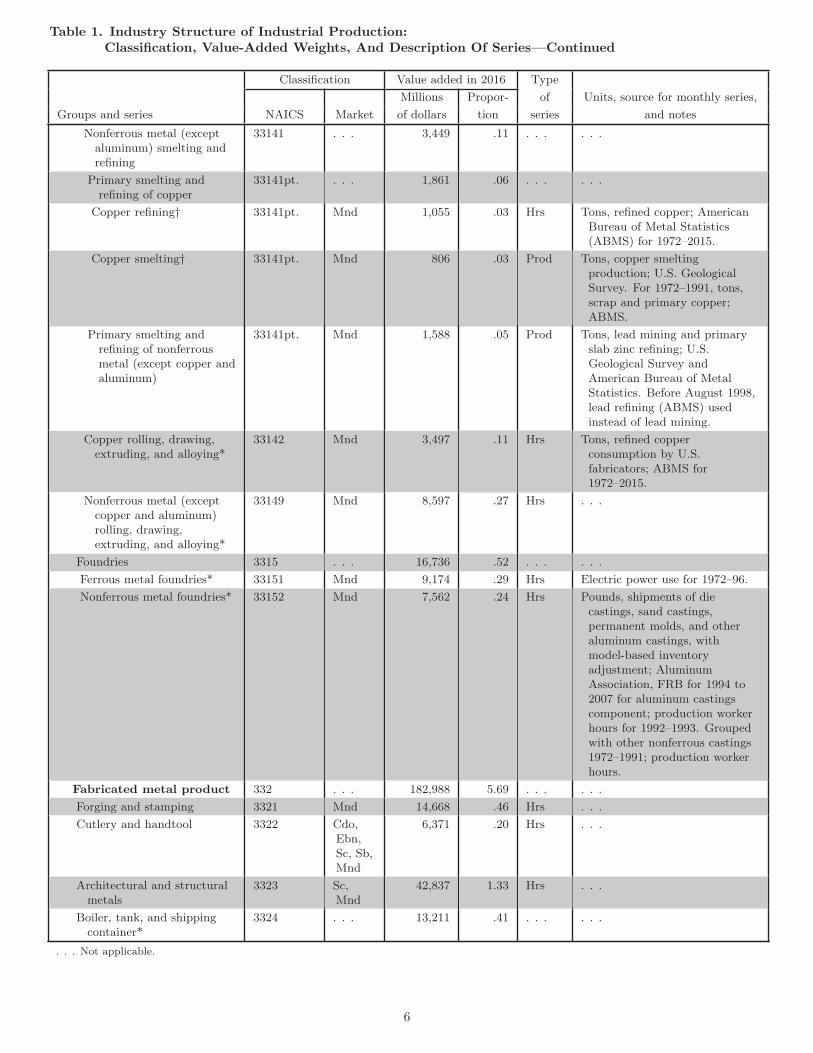
Table 1. Industry Structure of Industrial Production:Classification, Value-Added Weights, And Description Of Series—Continued
Classification Value added in 2016 Type
Millions Propor- of Units, source for monthly series,
Groups and series NAICS Market of dollars tion series and notes
Nonferrous metal (exceptaluminum) smelting andrefining
33141 . . . 3,449 .11 . . . . . .
Primary smelting andrefining of copper
33141pt. . . . 1,861 .06 . . . . . .
Copper refining† 33141pt. Mnd 1,055 .03 Hrs Tons, refined copper; AmericanBureau of Metal Statistics(ABMS) for 1972–2015.
Copper smelting† 33141pt. Mnd 806 .03 Prod Tons, copper smeltingproduction; U.S. GeologicalSurvey. For 1972–1991, tons,scrap and primary copper;ABMS.
Primary smelting andrefining of nonferrousmetal (except copper andaluminum)
33141pt. Mnd 1,588 .05 Prod Tons, lead mining and primaryslab zinc refining; U.S.Geological Survey andAmerican Bureau of MetalStatistics. Before August 1998,lead refining (ABMS) usedinstead of lead mining.
Copper rolling, drawing,extruding, and alloying*
33142 Mnd 3,497 .11 Hrs Tons, refined copperconsumption by U.S.fabricators; ABMS for1972–2015.
Nonferrous metal (exceptcopper and aluminum)rolling, drawing,extruding, and alloying*
33149 Mnd 8,597 .27 Hrs . . .
Foundries 3315 . . . 16,736 .52 . . . . . .
Ferrous metal foundries* 33151 Mnd 9,174 .29 Hrs Electric power use for 1972–96.
Nonferrous metal foundries* 33152 Mnd 7,562 .24 Hrs Pounds, shipments of diecastings, sand castings,permanent molds, and otheraluminum castings, withmodel-based inventoryadjustment; AluminumAssociation, FRB for 1994 to2007 for aluminum castingscomponent; production workerhours for 1992–1993. Groupedwith other nonferrous castings1972–1991; production workerhours.
Fabricated metal product 332 . . . 182,988 5.69 . . . . . .
Forging and stamping 3321 Mnd 14,668 .46 Hrs . . .
Cutlery and handtool 3322 Cdo,Ebn,Sc, Sb,Mnd
6,371 .20 Hrs . . .
Architectural and structuralmetals
3323 Sc,Mnd
42,837 1.33 Hrs . . .
Boiler, tank, and shippingcontainer*
3324 . . . 13,211 .41 . . . . . .
. . . Not applicable.
6
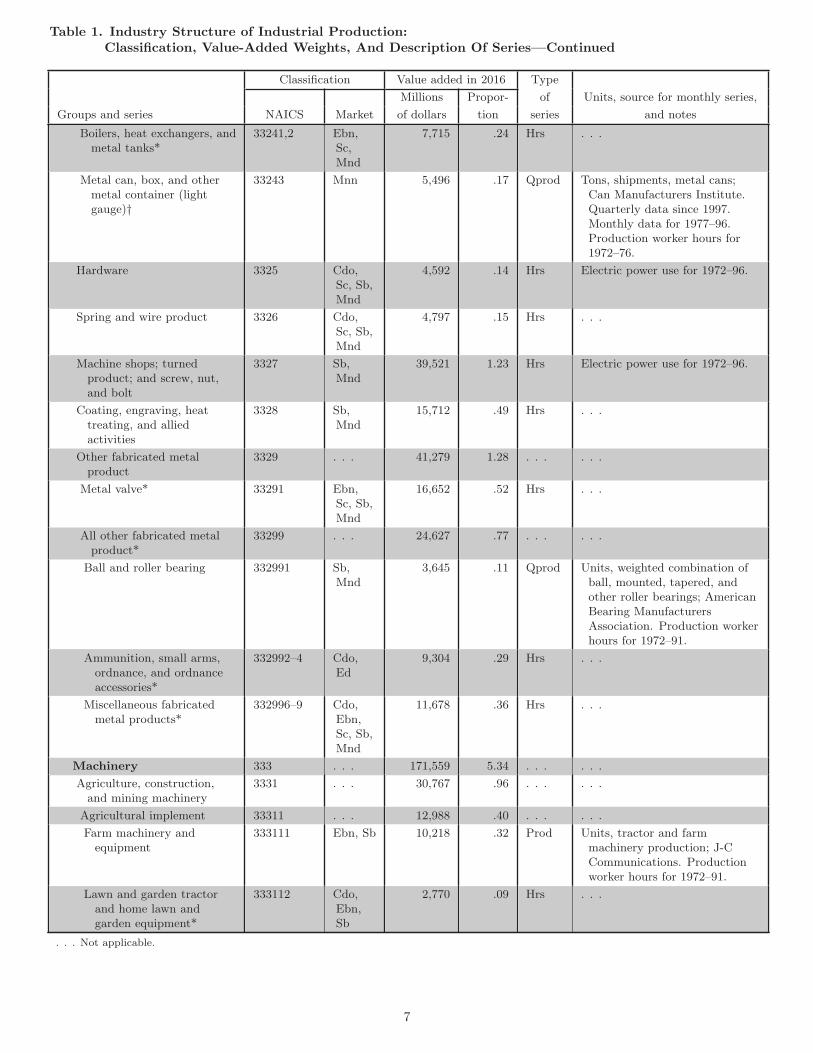
Table 1. Industry Structure of Industrial Production:Classification, Value-Added Weights, And Description Of Series—Continued
Classification Value added in 2016 Type
Millions Propor- of Units, source for monthly series,
Groups and series NAICS Market of dollars tion series and notes
Boilers, heat exchangers, andmetal tanks*
33241,2 Ebn,Sc,Mnd
7,715 .24 Hrs . . .
Metal can, box, and othermetal container (lightgauge)†
33243 Mnn 5,496 .17 Qprod Tons, shipments, metal cans;Can Manufacturers Institute.Quarterly data since 1997.Monthly data for 1977–96.Production worker hours for1972–76.
Hardware 3325 Cdo,Sc, Sb,Mnd
4,592 .14 Hrs Electric power use for 1972–96.
Spring and wire product 3326 Cdo,Sc, Sb,Mnd
4,797 .15 Hrs . . .
Machine shops; turnedproduct; and screw, nut,and bolt
3327 Sb,Mnd
39,521 1.23 Hrs Electric power use for 1972–96.
Coating, engraving, heattreating, and alliedactivities
3328 Sb,Mnd
15,712 .49 Hrs . . .
Other fabricated metalproduct
3329 . . . 41,279 1.28 . . . . . .
Metal valve* 33291 Ebn,Sc, Sb,Mnd
16,652 .52 Hrs . . .
All other fabricated metalproduct*
33299 . . . 24,627 .77 . . . . . .
Ball and roller bearing 332991 Sb,Mnd
3,645 .11 Qprod Units, weighted combination ofball, mounted, tapered, andother roller bearings; AmericanBearing ManufacturersAssociation. Production workerhours for 1972–91.
Ammunition, small arms,ordnance, and ordnanceaccessories*
332992–4 Cdo,Ed
9,304 .29 Hrs . . .
Miscellaneous fabricatedmetal products*
332996–9 Cdo,Ebn,Sc, Sb,Mnd
11,678 .36 Hrs . . .
Machinery 333 . . . 171,559 5.34 . . . . . .
Agriculture, construction,and mining machinery
3331 . . . 30,767 .96 . . . . . .
Agricultural implement 33311 . . . 12,988 .40 . . . . . .
Farm machinery andequipment
333111 Ebn, Sb 10,218 .32 Prod Units, tractor and farmmachinery production; J-CCommunications. Productionworker hours for 1972–91.
Lawn and garden tractorand home lawn andgarden equipment*
333112 Cdo,Ebn,Sb
2,770 .09 Hrs . . .
. . . Not applicable.
7
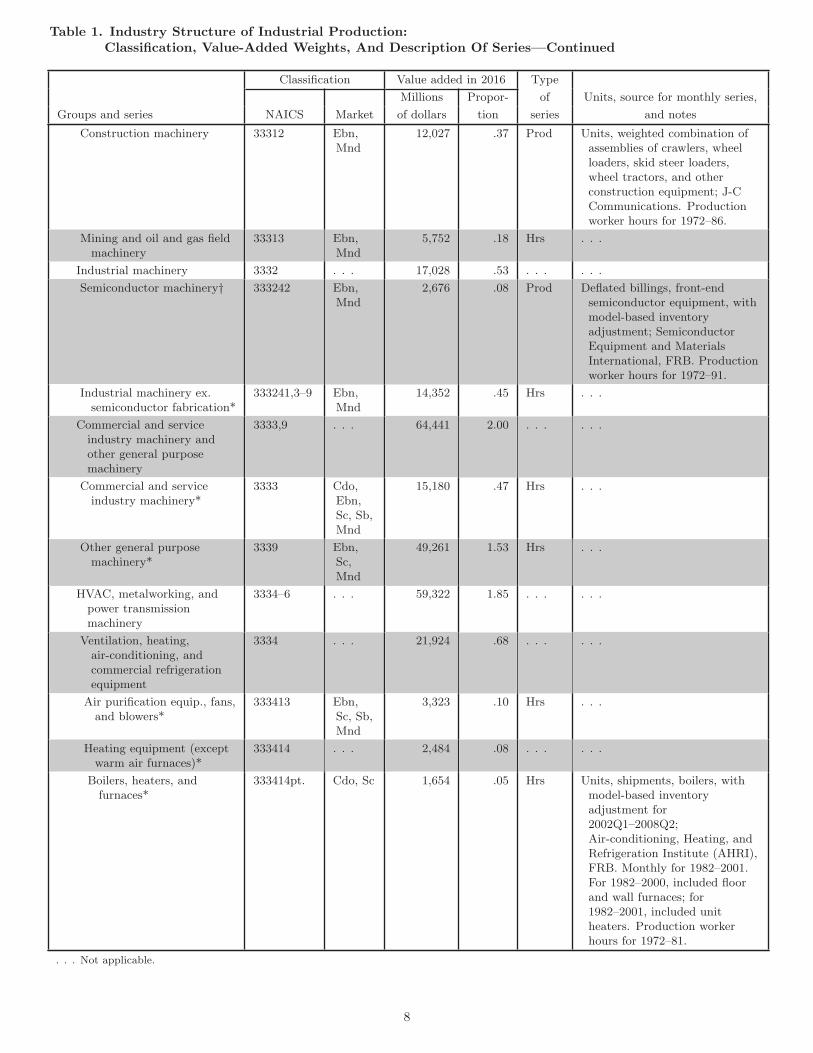
Table 1. Industry Structure of Industrial Production:Classification, Value-Added Weights, And Description Of Series—Continued
Classification Value added in 2016 Type
Millions Propor- of Units, source for monthly series,
Groups and series NAICS Market of dollars tion series and notes
Construction machinery 33312 Ebn,Mnd
12,027 .37 Prod Units, weighted combination ofassemblies of crawlers, wheelloaders, skid steer loaders,wheel tractors, and otherconstruction equipment; J-CCommunications. Productionworker hours for 1972–86.
Mining and oil and gas fieldmachinery
33313 Ebn,Mnd
5,752 .18 Hrs . . .
Industrial machinery 3332 . . . 17,028 .53 . . . . . .
Semiconductor machinery† 333242 Ebn,Mnd
2,676 .08 Prod Deflated billings, front-endsemiconductor equipment, withmodel-based inventoryadjustment; SemiconductorEquipment and MaterialsInternational, FRB. Productionworker hours for 1972–91.
Industrial machinery ex.semiconductor fabrication*
333241,3–9 Ebn,Mnd
14,352 .45 Hrs . . .
Commercial and serviceindustry machinery andother general purposemachinery
3333,9 . . . 64,441 2.00 . . . . . .
Commercial and serviceindustry machinery*
3333 Cdo,Ebn,Sc, Sb,Mnd
15,180 .47 Hrs . . .
Other general purposemachinery*
3339 Ebn,Sc,Mnd
49,261 1.53 Hrs . . .
HVAC, metalworking, andpower transmissionmachinery
3334–6 . . . 59,322 1.85 . . . . . .
Ventilation, heating,air-conditioning, andcommercial refrigerationequipment
3334 . . . 21,924 .68 . . . . . .
Air purification equip., fans,and blowers*
333413 Ebn,Sc, Sb,Mnd
3,323 .10 Hrs . . .
Heating equipment (exceptwarm air furnaces)*
333414 . . . 2,484 .08 . . . . . .
Boilers, heaters, andfurnaces*
333414pt. Cdo, Sc 1,654 .05 Hrs Units, shipments, boilers, withmodel-based inventoryadjustment for2002Q1–2008Q2;Air-conditioning, Heating, andRefrigeration Institute (AHRI),FRB. Monthly for 1982–2001.For 1982–2000, included floorand wall furnaces; for1982–2001, included unitheaters. Production workerhours for 1972–81.
. . . Not applicable.
8
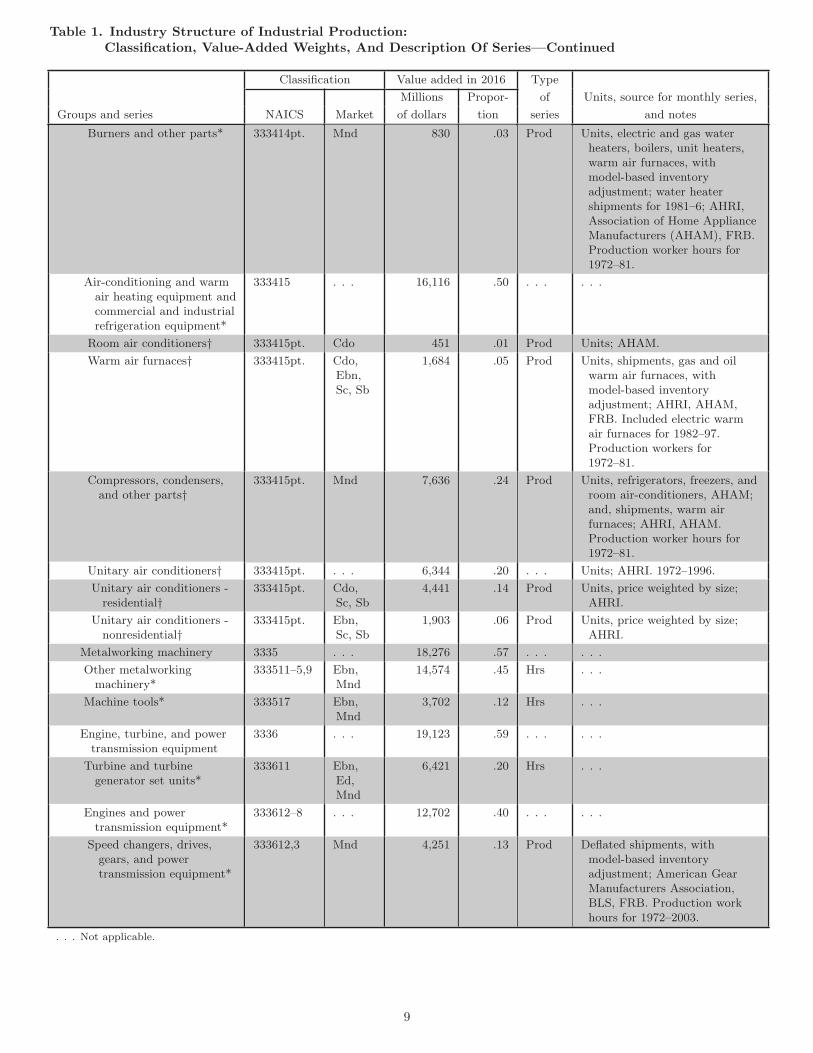
Table 1. Industry Structure of Industrial Production:Classification, Value-Added Weights, And Description Of Series—Continued
Classification Value added in 2016 Type
Millions Propor- of Units, source for monthly series,
Groups and series NAICS Market of dollars tion series and notes
Burners and other parts* 333414pt. Mnd 830 .03 Prod Units, electric and gas waterheaters, boilers, unit heaters,warm air furnaces, withmodel-based inventoryadjustment; water heatershipments for 1981–6; AHRI,Association of Home ApplianceManufacturers (AHAM), FRB.Production worker hours for1972–81.
Air-conditioning and warmair heating equipment andcommercial and industrialrefrigeration equipment*
333415 . . . 16,116 .50 . . . . . .
Room air conditioners† 333415pt. Cdo 451 .01 Prod Units; AHAM.
Warm air furnaces† 333415pt. Cdo,Ebn,Sc, Sb
1,684 .05 Prod Units, shipments, gas and oilwarm air furnaces, withmodel-based inventoryadjustment; AHRI, AHAM,FRB. Included electric warmair furnaces for 1982–97.Production workers for1972–81.
Compressors, condensers,and other parts†
333415pt. Mnd 7,636 .24 Prod Units, refrigerators, freezers, androom air-conditioners, AHAM;and, shipments, warm airfurnaces; AHRI, AHAM.Production worker hours for1972–81.
Unitary air conditioners† 333415pt. . . . 6,344 .20 . . . Units; AHRI. 1972–1996.
Unitary air conditioners -residential†
333415pt. Cdo,Sc, Sb
4,441 .14 Prod Units, price weighted by size;AHRI.
Unitary air conditioners -nonresidential†
333415pt. Ebn,Sc, Sb
1,903 .06 Prod Units, price weighted by size;AHRI.
Metalworking machinery 3335 . . . 18,276 .57 . . . . . .
Other metalworkingmachinery*
333511–5,9 Ebn,Mnd
14,574 .45 Hrs . . .
Machine tools* 333517 Ebn,Mnd
3,702 .12 Hrs . . .
Engine, turbine, and powertransmission equipment
3336 . . . 19,123 .59 . . . . . .
Turbine and turbinegenerator set units*
333611 Ebn,Ed,Mnd
6,421 .20 Hrs . . .
Engines and powertransmission equipment*
333612–8 . . . 12,702 .40 . . . . . .
Speed changers, drives,gears, and powertransmission equipment*
333612,3 Mnd 4,251 .13 Prod Deflated shipments, withmodel-based inventoryadjustment; American GearManufacturers Association,BLS, FRB. Production workhours for 1972–2003.
. . . Not applicable.
9
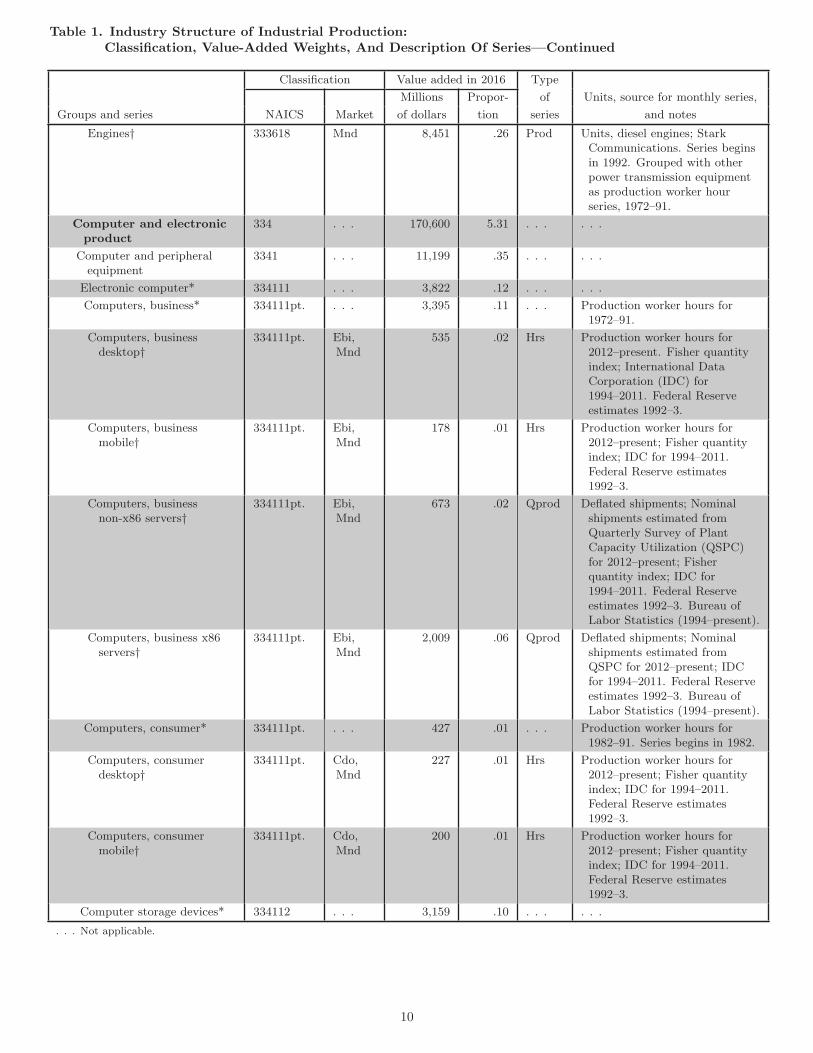
Table 1. Industry Structure of Industrial Production:Classification, Value-Added Weights, And Description Of Series—Continued
Classification Value added in 2016 Type
Millions Propor- of Units, source for monthly series,
Groups and series NAICS Market of dollars tion series and notes
Engines† 333618 Mnd 8,451 .26 Prod Units, diesel engines; StarkCommunications. Series beginsin 1992. Grouped with otherpower transmission equipmentas production worker hourseries, 1972–91.
Computer and electronicproduct
334 . . . 170,600 5.31 . . . . . .
Computer and peripheralequipment
3341 . . . 11,199 .35 . . . . . .
Electronic computer* 334111 . . . 3,822 .12 . . . . . .
Computers, business* 334111pt. . . . 3,395 .11 . . . Production worker hours for1972–91.
Computers, businessdesktop†
334111pt. Ebi,Mnd
535 .02 Hrs Production worker hours for2012–present. Fisher quantityindex; International DataCorporation (IDC) for1994–2011. Federal Reserveestimates 1992–3.
Computers, businessmobile†
334111pt. Ebi,Mnd
178 .01 Hrs Production worker hours for2012–present; Fisher quantityindex; IDC for 1994–2011.Federal Reserve estimates1992–3.
Computers, businessnon-x86 servers†
334111pt. Ebi,Mnd
673 .02 Qprod Deflated shipments; Nominalshipments estimated fromQuarterly Survey of PlantCapacity Utilization (QSPC)for 2012–present; Fisherquantity index; IDC for1994–2011. Federal Reserveestimates 1992–3. Bureau ofLabor Statistics (1994–present).
Computers, business x86servers†
334111pt. Ebi,Mnd
2,009 .06 Qprod Deflated shipments; Nominalshipments estimated fromQSPC for 2012–present; IDCfor 1994–2011. Federal Reserveestimates 1992–3. Bureau ofLabor Statistics (1994–present).
Computers, consumer* 334111pt. . . . 427 .01 . . . Production worker hours for1982–91. Series begins in 1982.
Computers, consumerdesktop†
334111pt. Cdo,Mnd
227 .01 Hrs Production worker hours for2012–present; Fisher quantityindex; IDC for 1994–2011.Federal Reserve estimates1992–3.
Computers, consumermobile†
334111pt. Cdo,Mnd
200 .01 Hrs Production worker hours for2012–present; Fisher quantityindex; IDC for 1994–2011.Federal Reserve estimates1992–3.
Computer storage devices* 334112 . . . 3,159 .10 . . . . . .
. . . Not applicable.
10
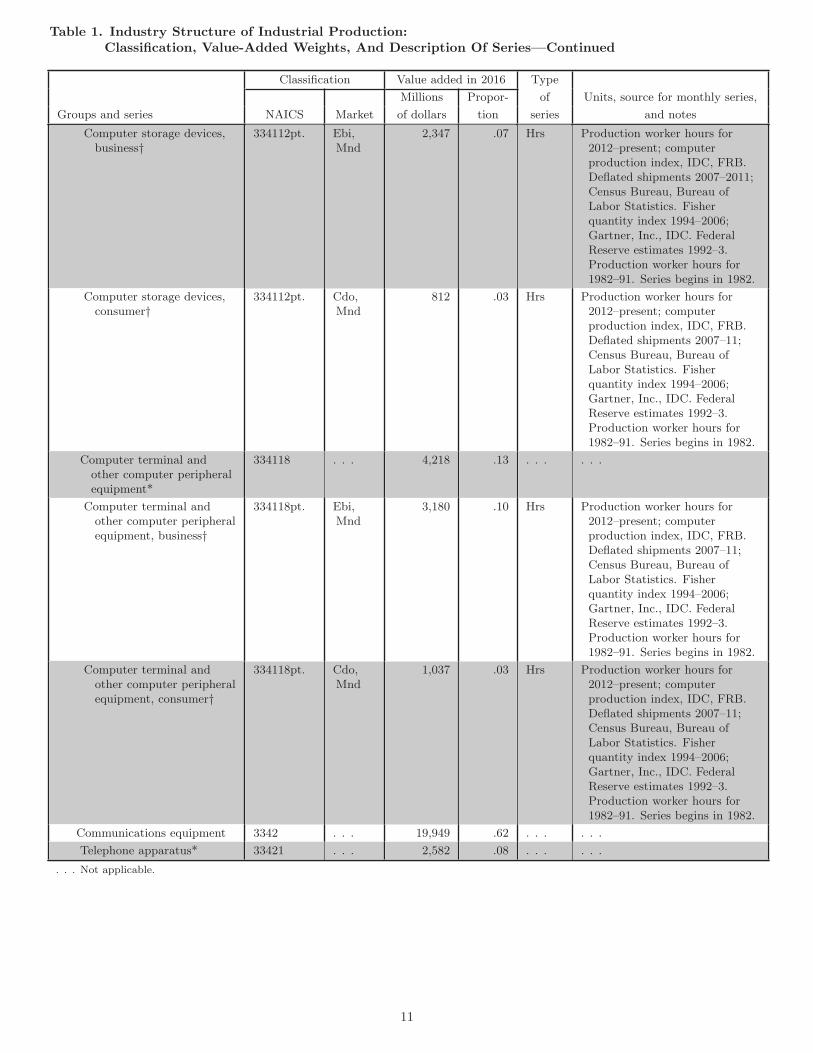
Table 1. Industry Structure of Industrial Production:Classification, Value-Added Weights, And Description Of Series—Continued
Classification Value added in 2016 Type
Millions Propor- of Units, source for monthly series,
Groups and series NAICS Market of dollars tion series and notes
Computer storage devices,business†
334112pt. Ebi,Mnd
2,347 .07 Hrs Production worker hours for2012–present; computerproduction index, IDC, FRB.Deflated shipments 2007–2011;Census Bureau, Bureau ofLabor Statistics. Fisherquantity index 1994–2006;Gartner, Inc., IDC. FederalReserve estimates 1992–3.Production worker hours for1982–91. Series begins in 1982.
Computer storage devices,consumer†
334112pt. Cdo,Mnd
812 .03 Hrs Production worker hours for2012–present; computerproduction index, IDC, FRB.Deflated shipments 2007–11;Census Bureau, Bureau ofLabor Statistics. Fisherquantity index 1994–2006;Gartner, Inc., IDC. FederalReserve estimates 1992–3.Production worker hours for1982–91. Series begins in 1982.
Computer terminal andother computer peripheralequipment*
334118 . . . 4,218 .13 . . . . . .
Computer terminal andother computer peripheralequipment, business†
334118pt. Ebi,Mnd
3,180 .10 Hrs Production worker hours for2012–present; computerproduction index, IDC, FRB.Deflated shipments 2007–11;Census Bureau, Bureau ofLabor Statistics. Fisherquantity index 1994–2006;Gartner, Inc., IDC. FederalReserve estimates 1992–3.Production worker hours for1982–91. Series begins in 1982.
Computer terminal andother computer peripheralequipment, consumer†
334118pt. Cdo,Mnd
1,037 .03 Hrs Production worker hours for2012–present; computerproduction index, IDC, FRB.Deflated shipments 2007–11;Census Bureau, Bureau ofLabor Statistics. Fisherquantity index 1994–2006;Gartner, Inc., IDC. FederalReserve estimates 1992–3.Production worker hours for1982–91. Series begins in 1982.
Communications equipment 3342 . . . 19,949 .62 . . . . . .
Telephone apparatus* 33421 . . . 2,582 .08 . . . . . .
. . . Not applicable.
11
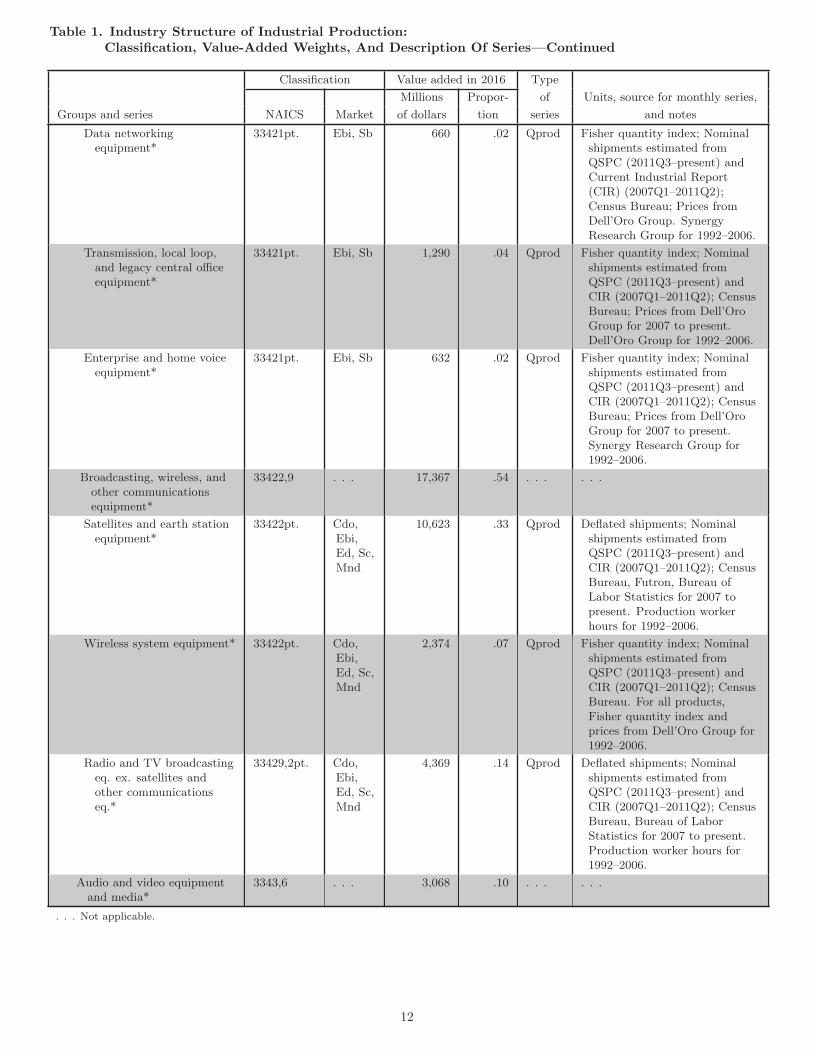
Table 1. Industry Structure of Industrial Production:Classification, Value-Added Weights, And Description Of Series—Continued
Classification Value added in 2016 Type
Millions Propor- of Units, source for monthly series,
Groups and series NAICS Market of dollars tion series and notes
Data networkingequipment*
33421pt. Ebi, Sb 660 .02 Qprod Fisher quantity index; Nominalshipments estimated fromQSPC (2011Q3–present) andCurrent Industrial Report(CIR) (2007Q1–2011Q2);Census Bureau; Prices fromDell’Oro Group. SynergyResearch Group for 1992–2006.
Transmission, local loop,and legacy central officeequipment*
33421pt. Ebi, Sb 1,290 .04 Qprod Fisher quantity index; Nominalshipments estimated fromQSPC (2011Q3–present) andCIR (2007Q1–2011Q2); CensusBureau; Prices from Dell’OroGroup for 2007 to present.Dell’Oro Group for 1992–2006.
Enterprise and home voiceequipment*
33421pt. Ebi, Sb 632 .02 Qprod Fisher quantity index; Nominalshipments estimated fromQSPC (2011Q3–present) andCIR (2007Q1–2011Q2); CensusBureau; Prices from Dell’OroGroup for 2007 to present.Synergy Research Group for1992–2006.
Broadcasting, wireless, andother communicationsequipment*
33422,9 . . . 17,367 .54 . . . . . .
Satellites and earth stationequipment*
33422pt. Cdo,Ebi,Ed, Sc,Mnd
10,623 .33 Qprod Deflated shipments; Nominalshipments estimated fromQSPC (2011Q3–present) andCIR (2007Q1–2011Q2); CensusBureau, Futron, Bureau ofLabor Statistics for 2007 topresent. Production workerhours for 1992–2006.
Wireless system equipment* 33422pt. Cdo,Ebi,Ed, Sc,Mnd
2,374 .07 Qprod Fisher quantity index; Nominalshipments estimated fromQSPC (2011Q3–present) andCIR (2007Q1–2011Q2); CensusBureau. For all products,Fisher quantity index andprices from Dell’Oro Group for1992–2006.
Radio and TV broadcastingeq. ex. satellites andother communicationseq.*
33429,2pt. Cdo,Ebi,Ed, Sc,Mnd
4,369 .14 Qprod Deflated shipments; Nominalshipments estimated fromQSPC (2011Q3–present) andCIR (2007Q1–2011Q2); CensusBureau, Bureau of LaborStatistics for 2007 to present.Production worker hours for1992–2006.
Audio and video equipmentand media*
3343,6 . . . 3,068 .10 . . . . . .
. . . Not applicable.
12
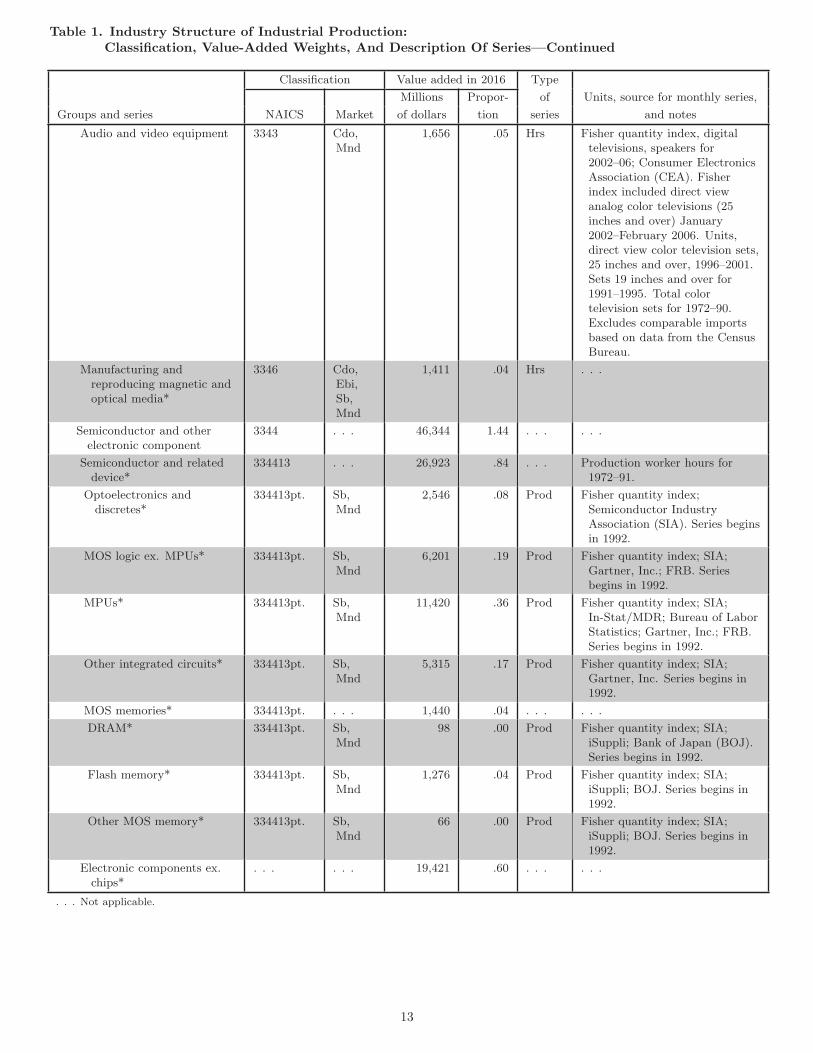
Table 1. Industry Structure of Industrial Production:Classification, Value-Added Weights, And Description Of Series—Continued
Classification Value added in 2016 Type
Millions Propor- of Units, source for monthly series,
Groups and series NAICS Market of dollars tion series and notes
Audio and video equipment 3343 Cdo,Mnd
1,656 .05 Hrs Fisher quantity index, digitaltelevisions, speakers for2002–06; Consumer ElectronicsAssociation (CEA). Fisherindex included direct viewanalog color televisions (25inches and over) January2002–February 2006. Units,direct view color television sets,25 inches and over, 1996–2001.Sets 19 inches and over for1991–1995. Total colortelevision sets for 1972–90.Excludes comparable importsbased on data from the CensusBureau.
Manufacturing andreproducing magnetic andoptical media*
3346 Cdo,Ebi,Sb,Mnd
1,411 .04 Hrs . . .
Semiconductor and otherelectronic component
3344 . . . 46,344 1.44 . . . . . .
Semiconductor and relateddevice*
334413 . . . 26,923 .84 . . . Production worker hours for1972–91.
Optoelectronics anddiscretes*
334413pt. Sb,Mnd
2,546 .08 Prod Fisher quantity index;Semiconductor IndustryAssociation (SIA). Series beginsin 1992.
MOS logic ex. MPUs* 334413pt. Sb,Mnd
6,201 .19 Prod Fisher quantity index; SIA;Gartner, Inc.; FRB. Seriesbegins in 1992.
MPUs* 334413pt. Sb,Mnd
11,420 .36 Prod Fisher quantity index; SIA;In-Stat/MDR; Bureau of LaborStatistics; Gartner, Inc.; FRB.Series begins in 1992.
Other integrated circuits* 334413pt. Sb,Mnd
5,315 .17 Prod Fisher quantity index; SIA;Gartner, Inc. Series begins in1992.
MOS memories* 334413pt. . . . 1,440 .04 . . . . . .
DRAM* 334413pt. Sb,Mnd
98 .00 Prod Fisher quantity index; SIA;iSuppli; Bank of Japan (BOJ).Series begins in 1992.
Flash memory* 334413pt. Sb,Mnd
1,276 .04 Prod Fisher quantity index; SIA;iSuppli; BOJ. Series begins in1992.
Other MOS memory* 334413pt. Sb,Mnd
66 .00 Prod Fisher quantity index; SIA;iSuppli; BOJ. Series begins in1992.
Electronic components ex.chips*
. . . . . . 19,421 .60 . . . . . .
. . . Not applicable.
13
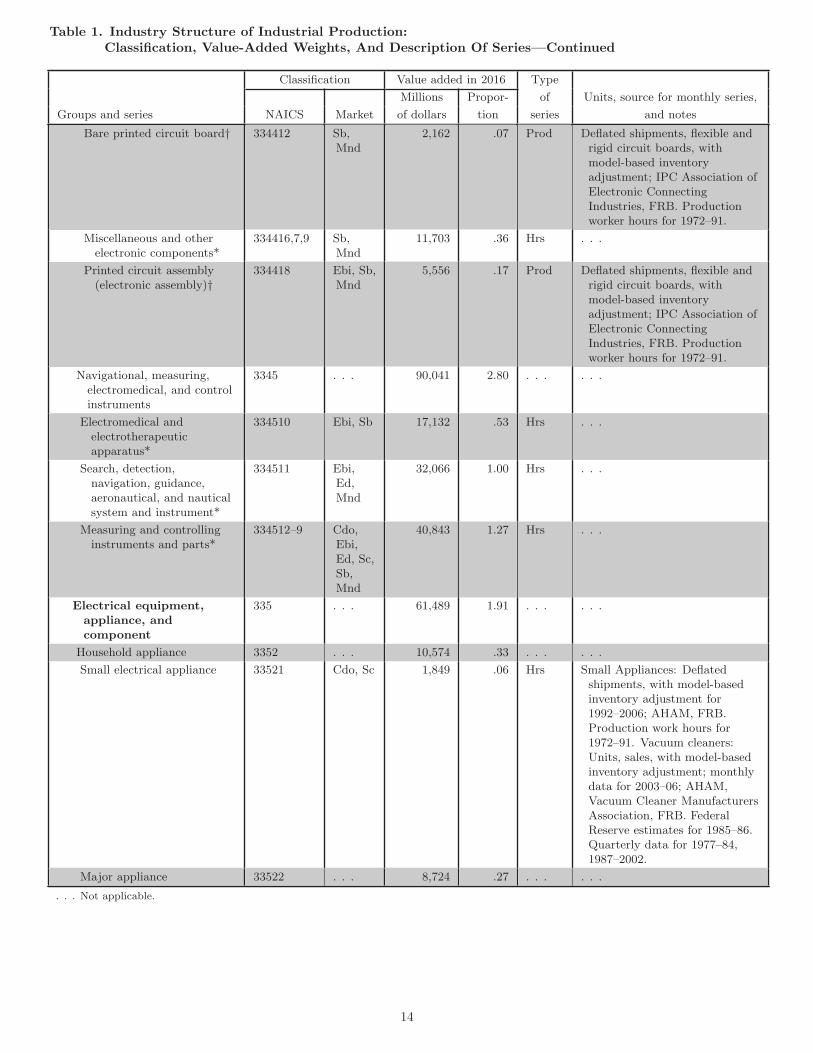
Table 1. Industry Structure of Industrial Production:Classification, Value-Added Weights, And Description Of Series—Continued
Classification Value added in 2016 Type
Millions Propor- of Units, source for monthly series,
Groups and series NAICS Market of dollars tion series and notes
Bare printed circuit board† 334412 Sb,Mnd
2,162 .07 Prod Deflated shipments, flexible andrigid circuit boards, withmodel-based inventoryadjustment; IPC Association ofElectronic ConnectingIndustries, FRB. Productionworker hours for 1972–91.
Miscellaneous and otherelectronic components*
334416,7,9 Sb,Mnd
11,703 .36 Hrs . . .
Printed circuit assembly(electronic assembly)†
334418 Ebi, Sb,Mnd
5,556 .17 Prod Deflated shipments, flexible andrigid circuit boards, withmodel-based inventoryadjustment; IPC Association ofElectronic ConnectingIndustries, FRB. Productionworker hours for 1972–91.
Navigational, measuring,electromedical, and controlinstruments
3345 . . . 90,041 2.80 . . . . . .
Electromedical andelectrotherapeuticapparatus*
334510 Ebi, Sb 17,132 .53 Hrs . . .
Search, detection,navigation, guidance,aeronautical, and nauticalsystem and instrument*
334511 Ebi,Ed,Mnd
32,066 1.00 Hrs . . .
Measuring and controllinginstruments and parts*
334512–9 Cdo,Ebi,Ed, Sc,Sb,Mnd
40,843 1.27 Hrs . . .
Electrical equipment,appliance, andcomponent
335 . . . 61,489 1.91 . . . . . .
Household appliance 3352 . . . 10,574 .33 . . . . . .
Small electrical appliance 33521 Cdo, Sc 1,849 .06 Hrs Small Appliances: Deflatedshipments, with model-basedinventory adjustment for1992–2006; AHAM, FRB.Production work hours for1972–91. Vacuum cleaners:Units, sales, with model-basedinventory adjustment; monthlydata for 2003–06; AHAM,Vacuum Cleaner ManufacturersAssociation, FRB. FederalReserve estimates for 1985–86.Quarterly data for 1977–84,1987–2002.
Major appliance 33522 . . . 8,724 .27 . . . . . .
. . . Not applicable.
14
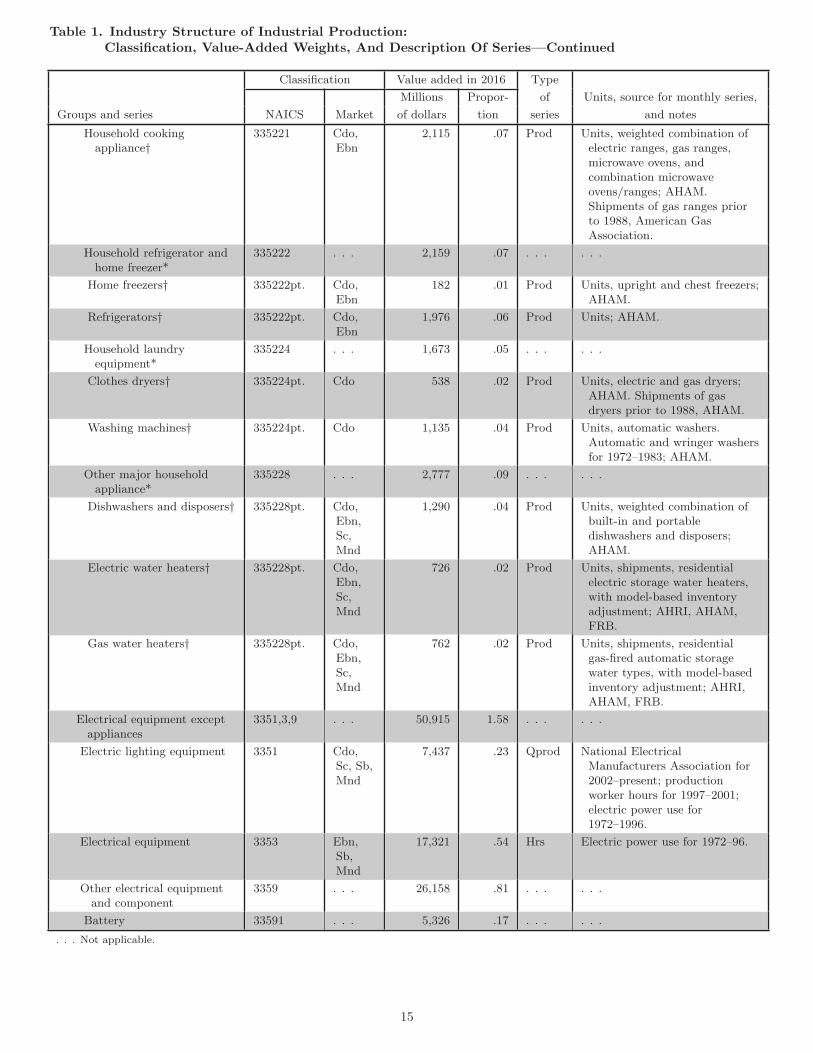
Table 1. Industry Structure of Industrial Production:Classification, Value-Added Weights, And Description Of Series—Continued
Classification Value added in 2016 Type
Millions Propor- of Units, source for monthly series,
Groups and series NAICS Market of dollars tion series and notes
Household cookingappliance†
335221 Cdo,Ebn
2,115 .07 Prod Units, weighted combination ofelectric ranges, gas ranges,microwave ovens, andcombination microwaveovens/ranges; AHAM.Shipments of gas ranges priorto 1988, American GasAssociation.
Household refrigerator andhome freezer*
335222 . . . 2,159 .07 . . . . . .
Home freezers† 335222pt. Cdo,Ebn
182 .01 Prod Units, upright and chest freezers;AHAM.
Refrigerators† 335222pt. Cdo,Ebn
1,976 .06 Prod Units; AHAM.
Household laundryequipment*
335224 . . . 1,673 .05 . . . . . .
Clothes dryers† 335224pt. Cdo 538 .02 Prod Units, electric and gas dryers;AHAM. Shipments of gasdryers prior to 1988, AHAM.
Washing machines† 335224pt. Cdo 1,135 .04 Prod Units, automatic washers.Automatic and wringer washersfor 1972–1983; AHAM.
Other major householdappliance*
335228 . . . 2,777 .09 . . . . . .
Dishwashers and disposers† 335228pt. Cdo,Ebn,Sc,Mnd
1,290 .04 Prod Units, weighted combination ofbuilt-in and portabledishwashers and disposers;AHAM.
Electric water heaters† 335228pt. Cdo,Ebn,Sc,Mnd
726 .02 Prod Units, shipments, residentialelectric storage water heaters,with model-based inventoryadjustment; AHRI, AHAM,FRB.
Gas water heaters† 335228pt. Cdo,Ebn,Sc,Mnd
762 .02 Prod Units, shipments, residentialgas-fired automatic storagewater types, with model-basedinventory adjustment; AHRI,AHAM, FRB.
Electrical equipment exceptappliances
3351,3,9 . . . 50,915 1.58 . . . . . .
Electric lighting equipment 3351 Cdo,Sc, Sb,Mnd
7,437 .23 Qprod National ElectricalManufacturers Association for2002–present; productionworker hours for 1997–2001;electric power use for1972–1996.
Electrical equipment 3353 Ebn,Sb,Mnd
17,321 .54 Hrs Electric power use for 1972–96.
Other electrical equipmentand component
3359 . . . 26,158 .81 . . . . . .
Battery 33591 . . . 5,326 .17 . . . . . .
. . . Not applicable.
15
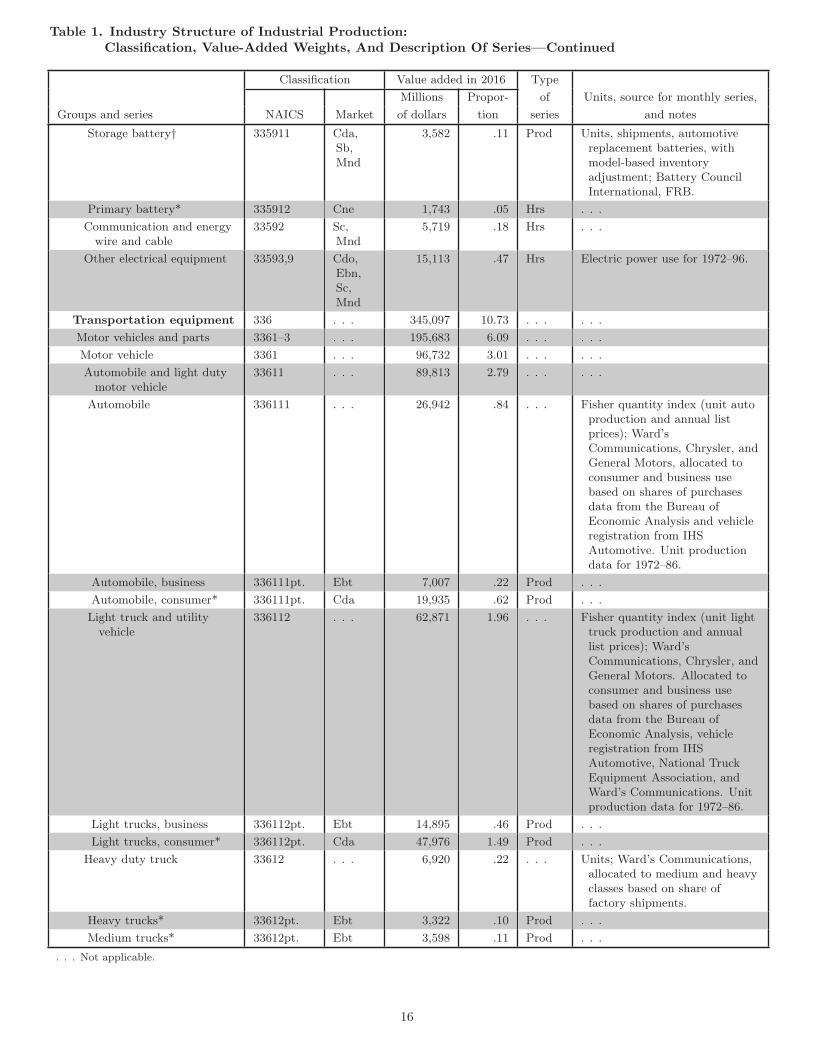
Table 1. Industry Structure of Industrial Production:Classification, Value-Added Weights, And Description Of Series—Continued
Classification Value added in 2016 Type
Millions Propor- of Units, source for monthly series,
Groups and series NAICS Market of dollars tion series and notes
Storage battery† 335911 Cda,Sb,Mnd
3,582 .11 Prod Units, shipments, automotivereplacement batteries, withmodel-based inventoryadjustment; Battery CouncilInternational, FRB.
Primary battery* 335912 Cne 1,743 .05 Hrs . . .
Communication and energywire and cable
33592 Sc,Mnd
5,719 .18 Hrs . . .
Other electrical equipment 33593,9 Cdo,Ebn,Sc,Mnd
15,113 .47 Hrs Electric power use for 1972–96.
Transportation equipment 336 . . . 345,097 10.73 . . . . . .
Motor vehicles and parts 3361–3 . . . 195,683 6.09 . . . . . .
Motor vehicle 3361 . . . 96,732 3.01 . . . . . .
Automobile and light dutymotor vehicle
33611 . . . 89,813 2.79 . . . . . .
Automobile 336111 . . . 26,942 .84 . . . Fisher quantity index (unit autoproduction and annual listprices); Ward’sCommunications, Chrysler, andGeneral Motors, allocated toconsumer and business usebased on shares of purchasesdata from the Bureau ofEconomic Analysis and vehicleregistration from IHSAutomotive. Unit productiondata for 1972–86.
Automobile, business 336111pt. Ebt 7,007 .22 Prod . . .
Automobile, consumer* 336111pt. Cda 19,935 .62 Prod . . .
Light truck and utilityvehicle
336112 . . . 62,871 1.96 . . . Fisher quantity index (unit lighttruck production and annuallist prices); Ward’sCommunications, Chrysler, andGeneral Motors. Allocated toconsumer and business usebased on shares of purchasesdata from the Bureau ofEconomic Analysis, vehicleregistration from IHSAutomotive, National TruckEquipment Association, andWard’s Communications. Unitproduction data for 1972–86.
Light trucks, business 336112pt. Ebt 14,895 .46 Prod . . .
Light trucks, consumer* 336112pt. Cda 47,976 1.49 Prod . . .
Heavy duty truck 33612 . . . 6,920 .22 . . . Units; Ward’s Communications,allocated to medium and heavyclasses based on share offactory shipments.
Heavy trucks* 33612pt. Ebt 3,322 .10 Prod . . .
Medium trucks* 33612pt. Ebt 3,598 .11 Prod . . .
. . . Not applicable.
16
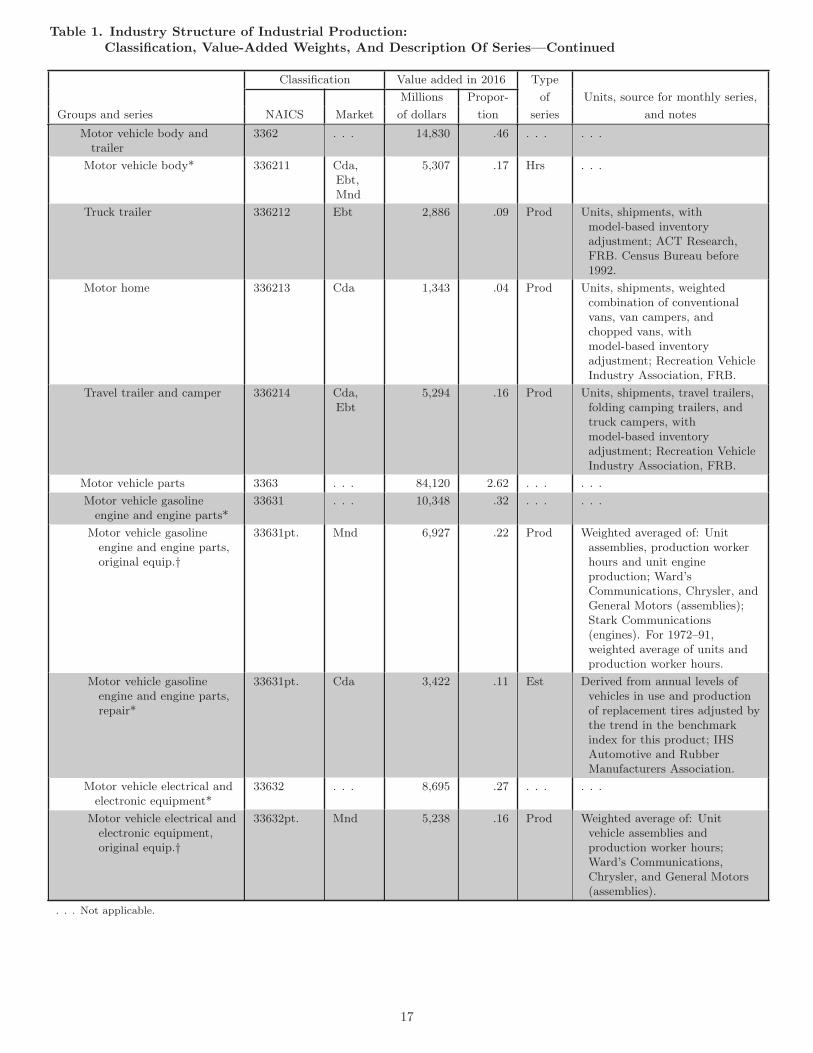
Table 1. Industry Structure of Industrial Production:Classification, Value-Added Weights, And Description Of Series—Continued
Classification Value added in 2016 Type
Millions Propor- of Units, source for monthly series,
Groups and series NAICS Market of dollars tion series and notes
Motor vehicle body andtrailer
3362 . . . 14,830 .46 . . . . . .
Motor vehicle body* 336211 Cda,Ebt,Mnd
5,307 .17 Hrs . . .
Truck trailer 336212 Ebt 2,886 .09 Prod Units, shipments, withmodel-based inventoryadjustment; ACT Research,FRB. Census Bureau before1992.
Motor home 336213 Cda 1,343 .04 Prod Units, shipments, weightedcombination of conventionalvans, van campers, andchopped vans, withmodel-based inventoryadjustment; Recreation VehicleIndustry Association, FRB.
Travel trailer and camper 336214 Cda,Ebt
5,294 .16 Prod Units, shipments, travel trailers,folding camping trailers, andtruck campers, withmodel-based inventoryadjustment; Recreation VehicleIndustry Association, FRB.
Motor vehicle parts 3363 . . . 84,120 2.62 . . . . . .
Motor vehicle gasolineengine and engine parts*
33631 . . . 10,348 .32 . . . . . .
Motor vehicle gasolineengine and engine parts,original equip.†
33631pt. Mnd 6,927 .22 Prod Weighted averaged of: Unitassemblies, production workerhours and unit engineproduction; Ward’sCommunications, Chrysler, andGeneral Motors (assemblies);Stark Communications(engines). For 1972–91,weighted average of units andproduction worker hours.
Motor vehicle gasolineengine and engine parts,repair*
33631pt. Cda 3,422 .11 Est Derived from annual levels ofvehicles in use and productionof replacement tires adjusted bythe trend in the benchmarkindex for this product; IHSAutomotive and RubberManufacturers Association.
Motor vehicle electrical andelectronic equipment*
33632 . . . 8,695 .27 . . . . . .
Motor vehicle electrical andelectronic equipment,original equip.†
33632pt. Mnd 5,238 .16 Prod Weighted average of: Unitvehicle assemblies andproduction worker hours;Ward’s Communications,Chrysler, and General Motors(assemblies).
. . . Not applicable.
17
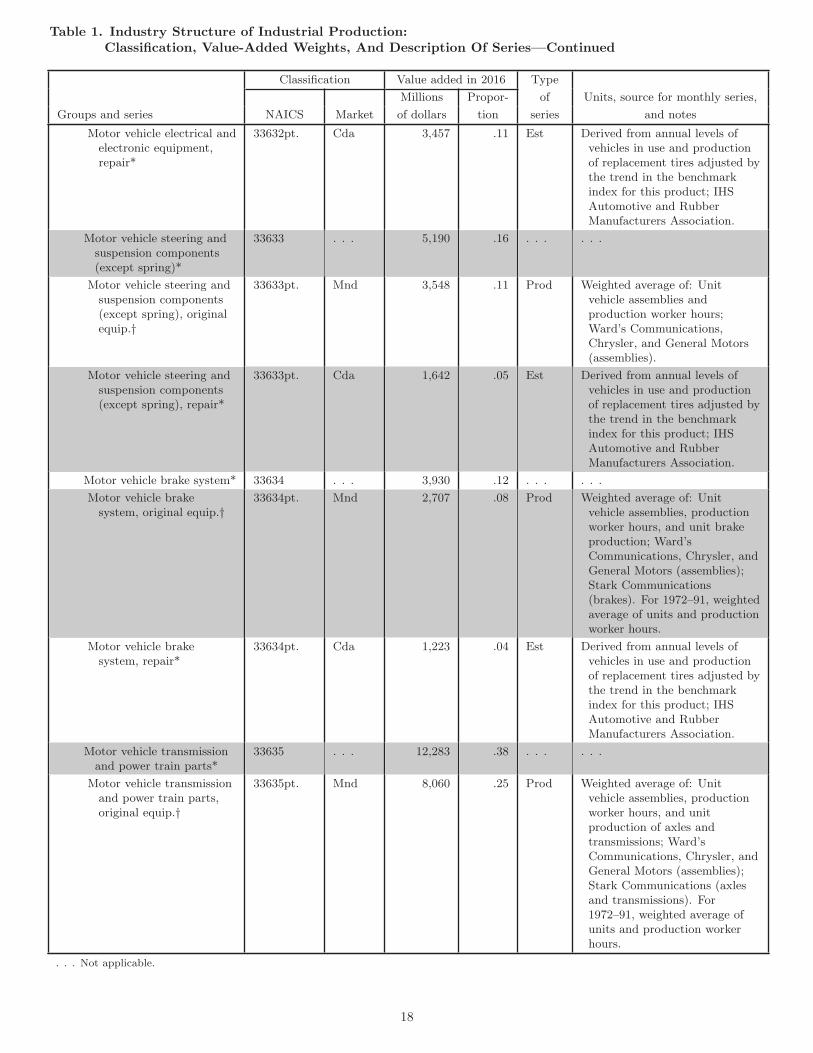
Table 1. Industry Structure of Industrial Production:Classification, Value-Added Weights, And Description Of Series—Continued
Classification Value added in 2016 Type
Millions Propor- of Units, source for monthly series,
Groups and series NAICS Market of dollars tion series and notes
Motor vehicle electrical andelectronic equipment,repair*
33632pt. Cda 3,457 .11 Est Derived from annual levels ofvehicles in use and productionof replacement tires adjusted bythe trend in the benchmarkindex for this product; IHSAutomotive and RubberManufacturers Association.
Motor vehicle steering andsuspension components(except spring)*
33633 . . . 5,190 .16 . . . . . .
Motor vehicle steering andsuspension components(except spring), originalequip.†
33633pt. Mnd 3,548 .11 Prod Weighted average of: Unitvehicle assemblies andproduction worker hours;Ward’s Communications,Chrysler, and General Motors(assemblies).
Motor vehicle steering andsuspension components(except spring), repair*
33633pt. Cda 1,642 .05 Est Derived from annual levels ofvehicles in use and productionof replacement tires adjusted bythe trend in the benchmarkindex for this product; IHSAutomotive and RubberManufacturers Association.
Motor vehicle brake system* 33634 . . . 3,930 .12 . . . . . .
Motor vehicle brakesystem, original equip.†
33634pt. Mnd 2,707 .08 Prod Weighted average of: Unitvehicle assemblies, productionworker hours, and unit brakeproduction; Ward’sCommunications, Chrysler, andGeneral Motors (assemblies);Stark Communications(brakes). For 1972–91, weightedaverage of units and productionworker hours.
Motor vehicle brakesystem, repair*
33634pt. Cda 1,223 .04 Est Derived from annual levels ofvehicles in use and productionof replacement tires adjusted bythe trend in the benchmarkindex for this product; IHSAutomotive and RubberManufacturers Association.
Motor vehicle transmissionand power train parts*
33635 . . . 12,283 .38 . . . . . .
Motor vehicle transmissionand power train parts,original equip.†
33635pt. Mnd 8,060 .25 Prod Weighted average of: Unitvehicle assemblies, productionworker hours, and unitproduction of axles andtransmissions; Ward’sCommunications, Chrysler, andGeneral Motors (assemblies);Stark Communications (axlesand transmissions). For1972–91, weighted average ofunits and production workerhours.
. . . Not applicable.
18
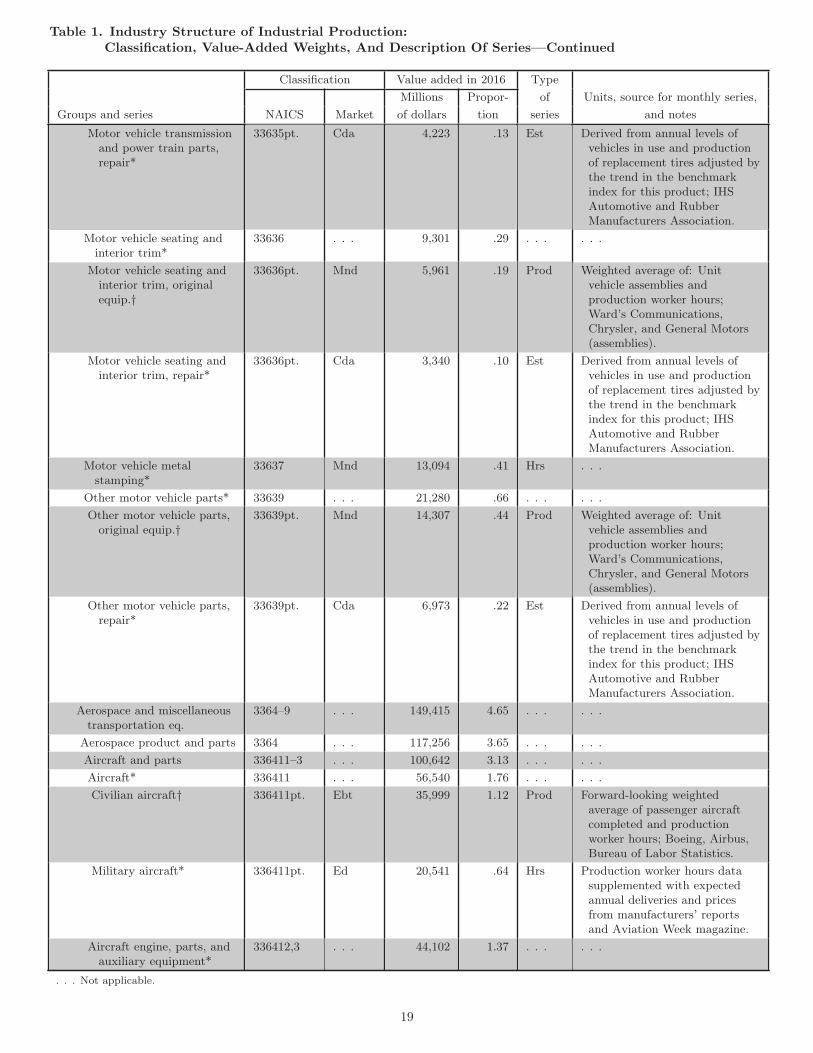
Table 1. Industry Structure of Industrial Production:Classification, Value-Added Weights, And Description Of Series—Continued
Classification Value added in 2016 Type
Millions Propor- of Units, source for monthly series,
Groups and series NAICS Market of dollars tion series and notes
Motor vehicle transmissionand power train parts,repair*
33635pt. Cda 4,223 .13 Est Derived from annual levels ofvehicles in use and productionof replacement tires adjusted bythe trend in the benchmarkindex for this product; IHSAutomotive and RubberManufacturers Association.
Motor vehicle seating andinterior trim*
33636 . . . 9,301 .29 . . . . . .
Motor vehicle seating andinterior trim, originalequip.†
33636pt. Mnd 5,961 .19 Prod Weighted average of: Unitvehicle assemblies andproduction worker hours;Ward’s Communications,Chrysler, and General Motors(assemblies).
Motor vehicle seating andinterior trim, repair*
33636pt. Cda 3,340 .10 Est Derived from annual levels ofvehicles in use and productionof replacement tires adjusted bythe trend in the benchmarkindex for this product; IHSAutomotive and RubberManufacturers Association.
Motor vehicle metalstamping*
33637 Mnd 13,094 .41 Hrs . . .
Other motor vehicle parts* 33639 . . . 21,280 .66 . . . . . .
Other motor vehicle parts,original equip.†
33639pt. Mnd 14,307 .44 Prod Weighted average of: Unitvehicle assemblies andproduction worker hours;Ward’s Communications,Chrysler, and General Motors(assemblies).
Other motor vehicle parts,repair*
33639pt. Cda 6,973 .22 Est Derived from annual levels ofvehicles in use and productionof replacement tires adjusted bythe trend in the benchmarkindex for this product; IHSAutomotive and RubberManufacturers Association.
Aerospace and miscellaneoustransportation eq.
3364–9 . . . 149,415 4.65 . . . . . .
Aerospace product and parts 3364 . . . 117,256 3.65 . . . . . .
Aircraft and parts 336411–3 . . . 100,642 3.13 . . . . . .
Aircraft* 336411 . . . 56,540 1.76 . . . . . .
Civilian aircraft† 336411pt. Ebt 35,999 1.12 Prod Forward-looking weightedaverage of passenger aircraftcompleted and productionworker hours; Boeing, Airbus,Bureau of Labor Statistics.
Military aircraft* 336411pt. Ed 20,541 .64 Hrs Production worker hours datasupplemented with expectedannual deliveries and pricesfrom manufacturers’ reportsand Aviation Week magazine.
Aircraft engine, parts, andauxiliary equipment*
336412,3 . . . 44,102 1.37 . . . . . .
. . . Not applicable.
19
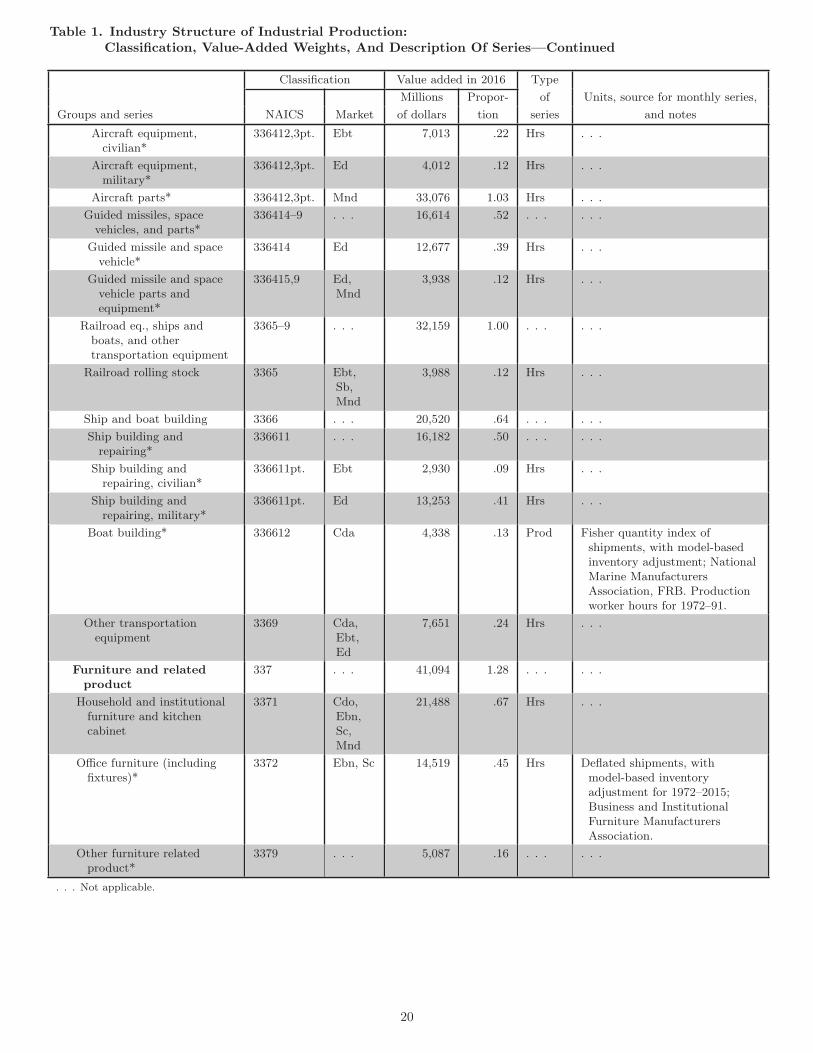
Table 1. Industry Structure of Industrial Production:Classification, Value-Added Weights, And Description Of Series—Continued
Classification Value added in 2016 Type
Millions Propor- of Units, source for monthly series,
Groups and series NAICS Market of dollars tion series and notes
Aircraft equipment,civilian*
336412,3pt. Ebt 7,013 .22 Hrs . . .
Aircraft equipment,military*
336412,3pt. Ed 4,012 .12 Hrs . . .
Aircraft parts* 336412,3pt. Mnd 33,076 1.03 Hrs . . .
Guided missiles, spacevehicles, and parts*
336414–9 . . . 16,614 .52 . . . . . .
Guided missile and spacevehicle*
336414 Ed 12,677 .39 Hrs . . .
Guided missile and spacevehicle parts andequipment*
336415,9 Ed,Mnd
3,938 .12 Hrs . . .
Railroad eq., ships andboats, and othertransportation equipment
3365–9 . . . 32,159 1.00 . . . . . .
Railroad rolling stock 3365 Ebt,Sb,Mnd
3,988 .12 Hrs . . .
Ship and boat building 3366 . . . 20,520 .64 . . . . . .
Ship building andrepairing*
336611 . . . 16,182 .50 . . . . . .
Ship building andrepairing, civilian*
336611pt. Ebt 2,930 .09 Hrs . . .
Ship building andrepairing, military*
336611pt. Ed 13,253 .41 Hrs . . .
Boat building* 336612 Cda 4,338 .13 Prod Fisher quantity index ofshipments, with model-basedinventory adjustment; NationalMarine ManufacturersAssociation, FRB. Productionworker hours for 1972–91.
Other transportationequipment
3369 Cda,Ebt,Ed
7,651 .24 Hrs . . .
Furniture and relatedproduct
337 . . . 41,094 1.28 . . . . . .
Household and institutionalfurniture and kitchencabinet
3371 Cdo,Ebn,Sc,Mnd
21,488 .67 Hrs . . .
Office furniture (includingfixtures)*
3372 Ebn, Sc 14,519 .45 Hrs Deflated shipments, withmodel-based inventoryadjustment for 1972–2015;Business and InstitutionalFurniture ManufacturersAssociation.
Other furniture relatedproduct*
3379 . . . 5,087 .16 . . . . . .
. . . Not applicable.
20
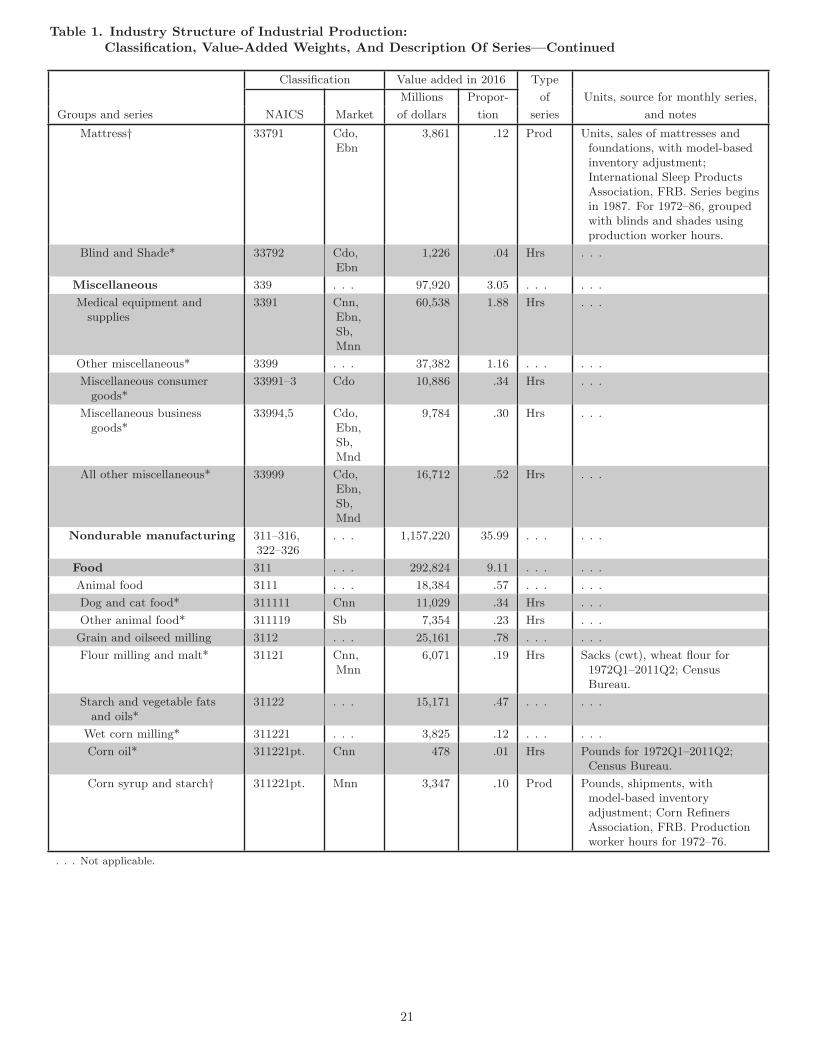
Table 1. Industry Structure of Industrial Production:Classification, Value-Added Weights, And Description Of Series—Continued
Classification Value added in 2016 Type
Millions Propor- of Units, source for monthly series,
Groups and series NAICS Market of dollars tion series and notes
Mattress† 33791 Cdo,Ebn
3,861 .12 Prod Units, sales of mattresses andfoundations, with model-basedinventory adjustment;International Sleep ProductsAssociation, FRB. Series beginsin 1987. For 1972–86, groupedwith blinds and shades usingproduction worker hours.
Blind and Shade* 33792 Cdo,Ebn
1,226 .04 Hrs . . .
Miscellaneous 339 . . . 97,920 3.05 . . . . . .
Medical equipment andsupplies
3391 Cnn,Ebn,Sb,Mnn
60,538 1.88 Hrs . . .
Other miscellaneous* 3399 . . . 37,382 1.16 . . . . . .
Miscellaneous consumergoods*
33991–3 Cdo 10,886 .34 Hrs . . .
Miscellaneous businessgoods*
33994,5 Cdo,Ebn,Sb,Mnd
9,784 .30 Hrs . . .
All other miscellaneous* 33999 Cdo,Ebn,Sb,Mnd
16,712 .52 Hrs . . .
Nondurable manufacturing 311–316,322–326
. . . 1,157,220 35.99 . . . . . .
Food 311 . . . 292,824 9.11 . . . . . .
Animal food 3111 . . . 18,384 .57 . . . . . .
Dog and cat food* 311111 Cnn 11,029 .34 Hrs . . .
Other animal food* 311119 Sb 7,354 .23 Hrs . . .
Grain and oilseed milling 3112 . . . 25,161 .78 . . . . . .
Flour milling and malt* 31121 Cnn,Mnn
6,071 .19 Hrs Sacks (cwt), wheat flour for1972Q1–2011Q2; CensusBureau.
Starch and vegetable fatsand oils*
31122 . . . 15,171 .47 . . . . . .
Wet corn milling* 311221 . . . 3,825 .12 . . . . . .
Corn oil* 311221pt. Cnn 478 .01 Hrs Pounds for 1972Q1–2011Q2;Census Bureau.
Corn syrup and starch† 311221pt. Mnn 3,347 .10 Prod Pounds, shipments, withmodel-based inventoryadjustment; Corn RefinersAssociation, FRB. Productionworker hours for 1972–76.
. . . Not applicable.
21
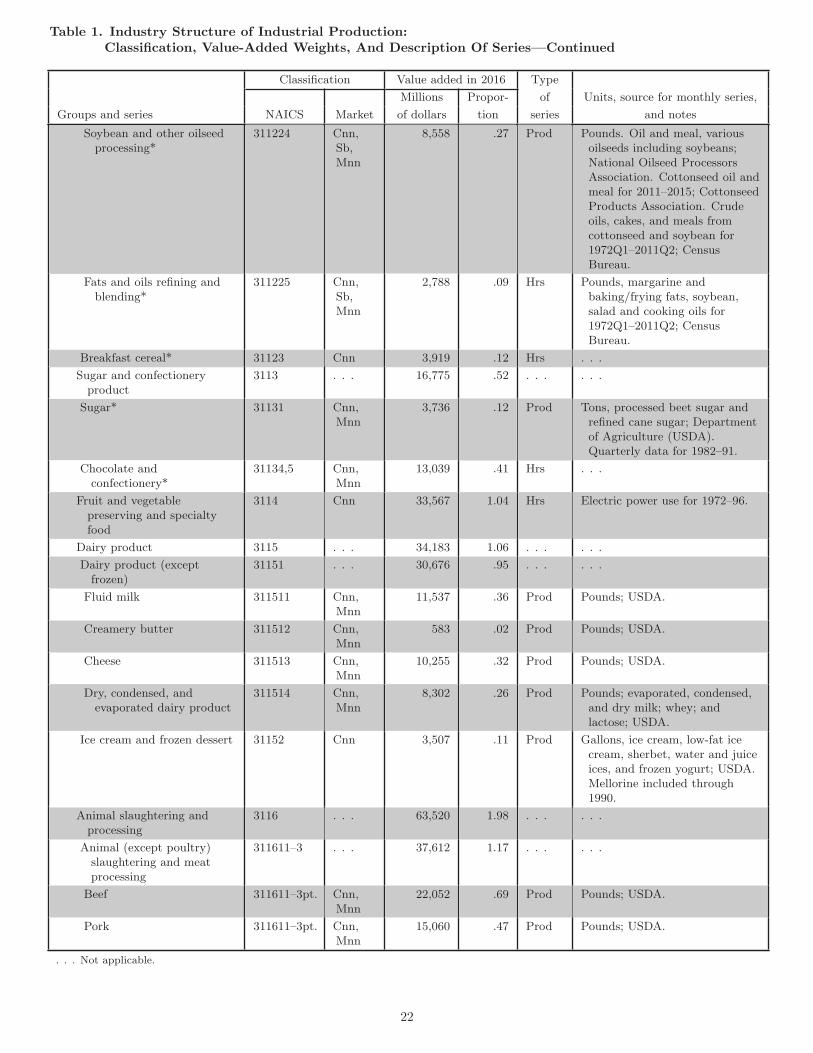
Table 1. Industry Structure of Industrial Production:Classification, Value-Added Weights, And Description Of Series—Continued
Classification Value added in 2016 Type
Millions Propor- of Units, source for monthly series,
Groups and series NAICS Market of dollars tion series and notes
Soybean and other oilseedprocessing*
311224 Cnn,Sb,Mnn
8,558 .27 Prod Pounds. Oil and meal, variousoilseeds including soybeans;National Oilseed ProcessorsAssociation. Cottonseed oil andmeal for 2011–2015; CottonseedProducts Association. Crudeoils, cakes, and meals fromcottonseed and soybean for1972Q1–2011Q2; CensusBureau.
Fats and oils refining andblending*
311225 Cnn,Sb,Mnn
2,788 .09 Hrs Pounds, margarine andbaking/frying fats, soybean,salad and cooking oils for1972Q1–2011Q2; CensusBureau.
Breakfast cereal* 31123 Cnn 3,919 .12 Hrs . . .
Sugar and confectioneryproduct
3113 . . . 16,775 .52 . . . . . .
Sugar* 31131 Cnn,Mnn
3,736 .12 Prod Tons, processed beet sugar andrefined cane sugar; Departmentof Agriculture (USDA).Quarterly data for 1982–91.
Chocolate andconfectionery*
31134,5 Cnn,Mnn
13,039 .41 Hrs . . .
Fruit and vegetablepreserving and specialtyfood
3114 Cnn 33,567 1.04 Hrs Electric power use for 1972–96.
Dairy product 3115 . . . 34,183 1.06 . . . . . .
Dairy product (exceptfrozen)
31151 . . . 30,676 .95 . . . . . .
Fluid milk 311511 Cnn,Mnn
11,537 .36 Prod Pounds; USDA.
Creamery butter 311512 Cnn,Mnn
583 .02 Prod Pounds; USDA.
Cheese 311513 Cnn,Mnn
10,255 .32 Prod Pounds; USDA.
Dry, condensed, andevaporated dairy product
311514 Cnn,Mnn
8,302 .26 Prod Pounds; evaporated, condensed,and dry milk; whey; andlactose; USDA.
Ice cream and frozen dessert 31152 Cnn 3,507 .11 Prod Gallons, ice cream, low-fat icecream, sherbet, water and juiceices, and frozen yogurt; USDA.Mellorine included through1990.
Animal slaughtering andprocessing
3116 . . . 63,520 1.98 . . . . . .
Animal (except poultry)slaughtering and meatprocessing
311611–3 . . . 37,612 1.17 . . . . . .
Beef 311611–3pt. Cnn,Mnn
22,052 .69 Prod Pounds; USDA.
Pork 311611–3pt. Cnn,Mnn
15,060 .47 Prod Pounds; USDA.
. . . Not applicable.
22
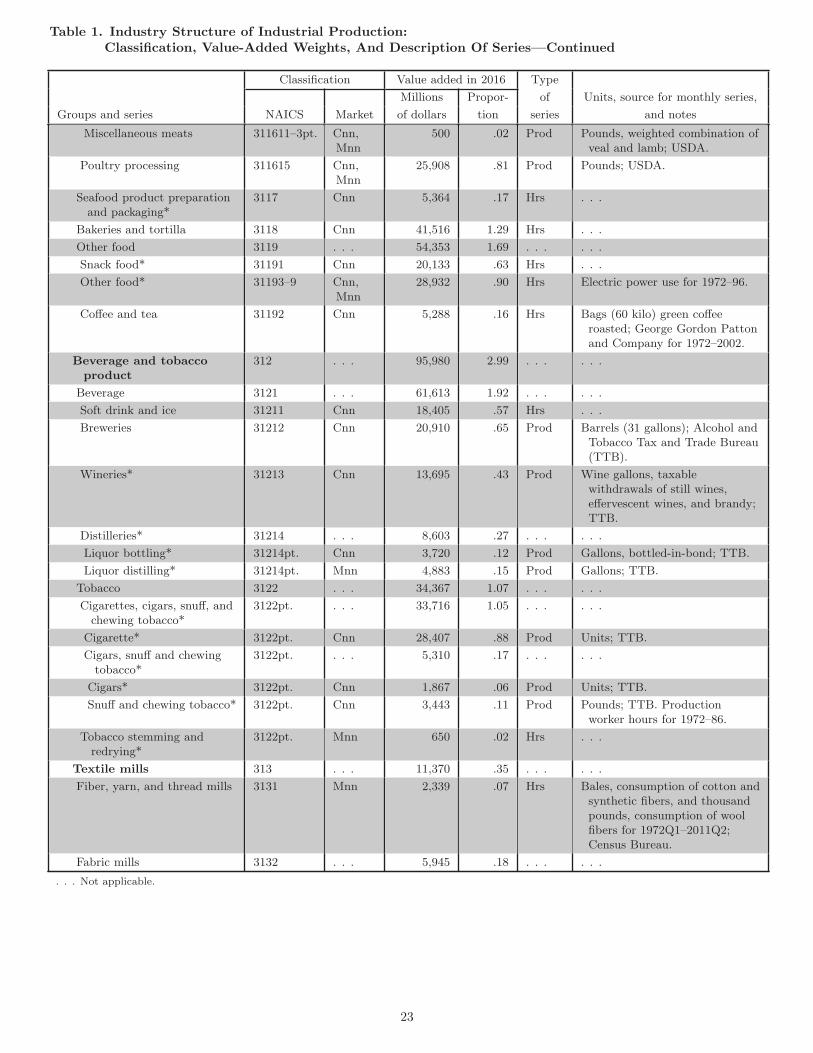
Table 1. Industry Structure of Industrial Production:Classification, Value-Added Weights, And Description Of Series—Continued
Classification Value added in 2016 Type
Millions Propor- of Units, source for monthly series,
Groups and series NAICS Market of dollars tion series and notes
Miscellaneous meats 311611–3pt. Cnn,Mnn
500 .02 Prod Pounds, weighted combination ofveal and lamb; USDA.
Poultry processing 311615 Cnn,Mnn
25,908 .81 Prod Pounds; USDA.
Seafood product preparationand packaging*
3117 Cnn 5,364 .17 Hrs . . .
Bakeries and tortilla 3118 Cnn 41,516 1.29 Hrs . . .
Other food 3119 . . . 54,353 1.69 . . . . . .
Snack food* 31191 Cnn 20,133 .63 Hrs . . .
Other food* 31193–9 Cnn,Mnn
28,932 .90 Hrs Electric power use for 1972–96.
Coffee and tea 31192 Cnn 5,288 .16 Hrs Bags (60 kilo) green coffeeroasted; George Gordon Pattonand Company for 1972–2002.
Beverage and tobaccoproduct
312 . . . 95,980 2.99 . . . . . .
Beverage 3121 . . . 61,613 1.92 . . . . . .
Soft drink and ice 31211 Cnn 18,405 .57 Hrs . . .
Breweries 31212 Cnn 20,910 .65 Prod Barrels (31 gallons); Alcohol andTobacco Tax and Trade Bureau(TTB).
Wineries* 31213 Cnn 13,695 .43 Prod Wine gallons, taxablewithdrawals of still wines,effervescent wines, and brandy;TTB.
Distilleries* 31214 . . . 8,603 .27 . . . . . .
Liquor bottling* 31214pt. Cnn 3,720 .12 Prod Gallons, bottled-in-bond; TTB.
Liquor distilling* 31214pt. Mnn 4,883 .15 Prod Gallons; TTB.
Tobacco 3122 . . . 34,367 1.07 . . . . . .
Cigarettes, cigars, snuff, andchewing tobacco*
3122pt. . . . 33,716 1.05 . . . . . .
Cigarette* 3122pt. Cnn 28,407 .88 Prod Units; TTB.
Cigars, snuff and chewingtobacco*
3122pt. . . . 5,310 .17 . . . . . .
Cigars* 3122pt. Cnn 1,867 .06 Prod Units; TTB.
Snuff and chewing tobacco* 3122pt. Cnn 3,443 .11 Prod Pounds; TTB. Productionworker hours for 1972–86.
Tobacco stemming andredrying*
3122pt. Mnn 650 .02 Hrs . . .
Textile mills 313 . . . 11,370 .35 . . . . . .
Fiber, yarn, and thread mills 3131 Mnn 2,339 .07 Hrs Bales, consumption of cotton andsynthetic fibers, and thousandpounds, consumption of woolfibers for 1972Q1–2011Q2;Census Bureau.
Fabric mills 3132 . . . 5,945 .18 . . . . . .
. . . Not applicable.
23
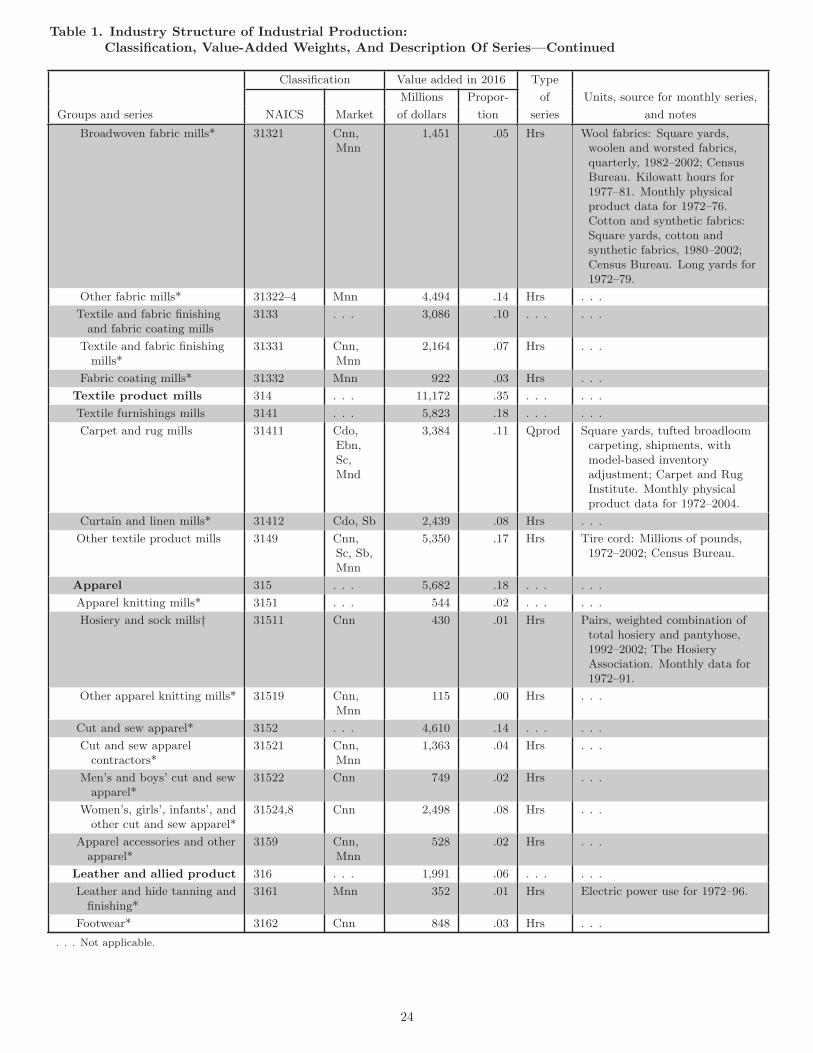
Table 1. Industry Structure of Industrial Production:Classification, Value-Added Weights, And Description Of Series—Continued
Classification Value added in 2016 Type
Millions Propor- of Units, source for monthly series,
Groups and series NAICS Market of dollars tion series and notes
Broadwoven fabric mills* 31321 Cnn,Mnn
1,451 .05 Hrs Wool fabrics: Square yards,woolen and worsted fabrics,quarterly, 1982–2002; CensusBureau. Kilowatt hours for1977–81. Monthly physicalproduct data for 1972–76.Cotton and synthetic fabrics:Square yards, cotton andsynthetic fabrics, 1980–2002;Census Bureau. Long yards for1972–79.
Other fabric mills* 31322–4 Mnn 4,494 .14 Hrs . . .
Textile and fabric finishingand fabric coating mills
3133 . . . 3,086 .10 . . . . . .
Textile and fabric finishingmills*
31331 Cnn,Mnn
2,164 .07 Hrs . . .
Fabric coating mills* 31332 Mnn 922 .03 Hrs . . .
Textile product mills 314 . . . 11,172 .35 . . . . . .
Textile furnishings mills 3141 . . . 5,823 .18 . . . . . .
Carpet and rug mills 31411 Cdo,Ebn,Sc,Mnd
3,384 .11 Qprod Square yards, tufted broadloomcarpeting, shipments, withmodel-based inventoryadjustment; Carpet and RugInstitute. Monthly physicalproduct data for 1972–2004.
Curtain and linen mills* 31412 Cdo, Sb 2,439 .08 Hrs . . .
Other textile product mills 3149 Cnn,Sc, Sb,Mnn
5,350 .17 Hrs Tire cord: Millions of pounds,1972–2002; Census Bureau.
Apparel 315 . . . 5,682 .18 . . . . . .
Apparel knitting mills* 3151 . . . 544 .02 . . . . . .
Hosiery and sock mills† 31511 Cnn 430 .01 Hrs Pairs, weighted combination oftotal hosiery and pantyhose,1992–2002; The HosieryAssociation. Monthly data for1972–91.
Other apparel knitting mills* 31519 Cnn,Mnn
115 .00 Hrs . . .
Cut and sew apparel* 3152 . . . 4,610 .14 . . . . . .
Cut and sew apparelcontractors*
31521 Cnn,Mnn
1,363 .04 Hrs . . .
Men’s and boys’ cut and sewapparel*
31522 Cnn 749 .02 Hrs . . .
Women’s, girls’, infants’, andother cut and sew apparel*
31524,8 Cnn 2,498 .08 Hrs . . .
Apparel accessories and otherapparel*
3159 Cnn,Mnn
528 .02 Hrs . . .
Leather and allied product 316 . . . 1,991 .06 . . . . . .
Leather and hide tanning andfinishing*
3161 Mnn 352 .01 Hrs Electric power use for 1972–96.
Footwear* 3162 Cnn 848 .03 Hrs . . .
. . . Not applicable.
24
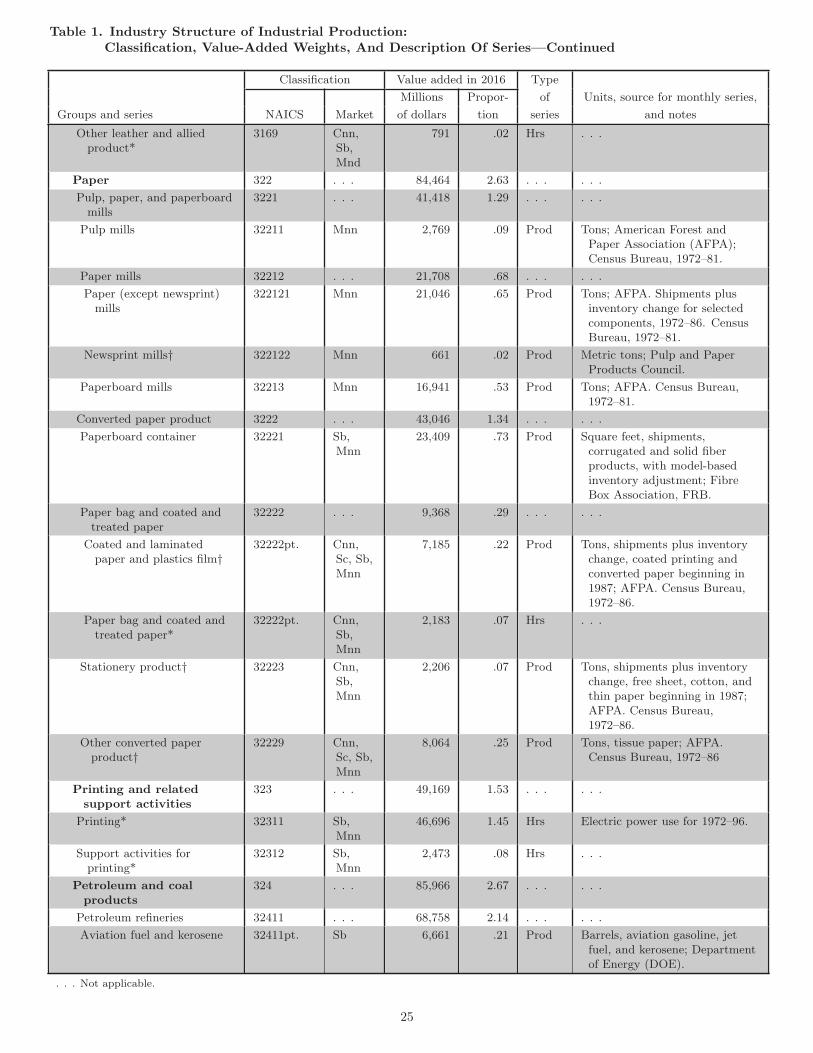
Table 1. Industry Structure of Industrial Production:Classification, Value-Added Weights, And Description Of Series—Continued
Classification Value added in 2016 Type
Millions Propor- of Units, source for monthly series,
Groups and series NAICS Market of dollars tion series and notes
Other leather and alliedproduct*
3169 Cnn,Sb,Mnd
791 .02 Hrs . . .
Paper 322 . . . 84,464 2.63 . . . . . .
Pulp, paper, and paperboardmills
3221 . . . 41,418 1.29 . . . . . .
Pulp mills 32211 Mnn 2,769 .09 Prod Tons; American Forest andPaper Association (AFPA);Census Bureau, 1972–81.
Paper mills 32212 . . . 21,708 .68 . . . . . .
Paper (except newsprint)mills
322121 Mnn 21,046 .65 Prod Tons; AFPA. Shipments plusinventory change for selectedcomponents, 1972–86. CensusBureau, 1972–81.
Newsprint mills† 322122 Mnn 661 .02 Prod Metric tons; Pulp and PaperProducts Council.
Paperboard mills 32213 Mnn 16,941 .53 Prod Tons; AFPA. Census Bureau,1972–81.
Converted paper product 3222 . . . 43,046 1.34 . . . . . .
Paperboard container 32221 Sb,Mnn
23,409 .73 Prod Square feet, shipments,corrugated and solid fiberproducts, with model-basedinventory adjustment; FibreBox Association, FRB.
Paper bag and coated andtreated paper
32222 . . . 9,368 .29 . . . . . .
Coated and laminatedpaper and plastics film†
32222pt. Cnn,Sc, Sb,Mnn
7,185 .22 Prod Tons, shipments plus inventorychange, coated printing andconverted paper beginning in1987; AFPA. Census Bureau,1972–86.
Paper bag and coated andtreated paper*
32222pt. Cnn,Sb,Mnn
2,183 .07 Hrs . . .
Stationery product† 32223 Cnn,Sb,Mnn
2,206 .07 Prod Tons, shipments plus inventorychange, free sheet, cotton, andthin paper beginning in 1987;AFPA. Census Bureau,1972–86.
Other converted paperproduct†
32229 Cnn,Sc, Sb,Mnn
8,064 .25 Prod Tons, tissue paper; AFPA.Census Bureau, 1972–86
Printing and relatedsupport activities
323 . . . 49,169 1.53 . . . . . .
Printing* 32311 Sb,Mnn
46,696 1.45 Hrs Electric power use for 1972–96.
Support activities forprinting*
32312 Sb,Mnn
2,473 .08 Hrs . . .
Petroleum and coalproducts
324 . . . 85,966 2.67 . . . . . .
Petroleum refineries 32411 . . . 68,758 2.14 . . . . . .
Aviation fuel and kerosene 32411pt. Sb 6,661 .21 Prod Barrels, aviation gasoline, jetfuel, and kerosene; Departmentof Energy (DOE).
. . . Not applicable.
25
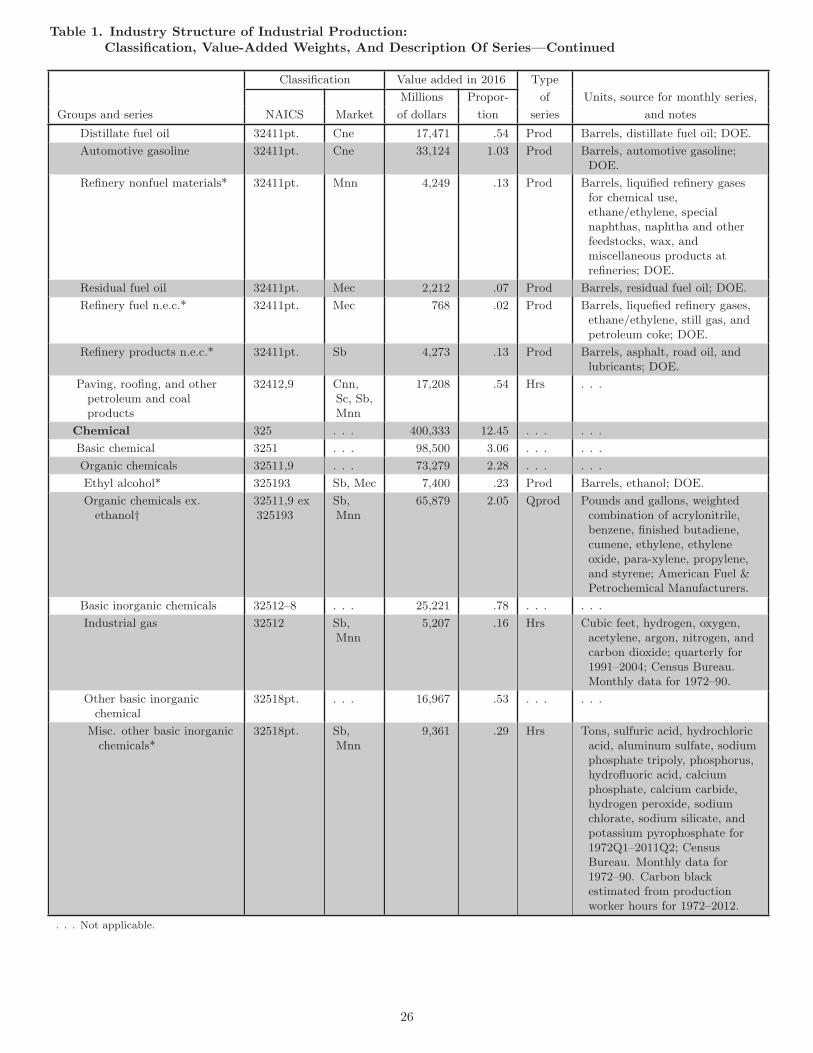
Table 1. Industry Structure of Industrial Production:Classification, Value-Added Weights, And Description Of Series—Continued
Classification Value added in 2016 Type
Millions Propor- of Units, source for monthly series,
Groups and series NAICS Market of dollars tion series and notes
Distillate fuel oil 32411pt. Cne 17,471 .54 Prod Barrels, distillate fuel oil; DOE.
Automotive gasoline 32411pt. Cne 33,124 1.03 Prod Barrels, automotive gasoline;DOE.
Refinery nonfuel materials* 32411pt. Mnn 4,249 .13 Prod Barrels, liquified refinery gasesfor chemical use,ethane/ethylene, specialnaphthas, naphtha and otherfeedstocks, wax, andmiscellaneous products atrefineries; DOE.
Residual fuel oil 32411pt. Mec 2,212 .07 Prod Barrels, residual fuel oil; DOE.
Refinery fuel n.e.c.* 32411pt. Mec 768 .02 Prod Barrels, liquefied refinery gases,ethane/ethylene, still gas, andpetroleum coke; DOE.
Refinery products n.e.c.* 32411pt. Sb 4,273 .13 Prod Barrels, asphalt, road oil, andlubricants; DOE.
Paving, roofing, and otherpetroleum and coalproducts
32412,9 Cnn,Sc, Sb,Mnn
17,208 .54 Hrs . . .
Chemical 325 . . . 400,333 12.45 . . . . . .
Basic chemical 3251 . . . 98,500 3.06 . . . . . .
Organic chemicals 32511,9 . . . 73,279 2.28 . . . . . .
Ethyl alcohol* 325193 Sb, Mec 7,400 .23 Prod Barrels, ethanol; DOE.
Organic chemicals ex.ethanol†
32511,9 ex325193
Sb,Mnn
65,879 2.05 Qprod Pounds and gallons, weightedcombination of acrylonitrile,benzene, finished butadiene,cumene, ethylene, ethyleneoxide, para-xylene, propylene,and styrene; American Fuel &Petrochemical Manufacturers.
Basic inorganic chemicals 32512–8 . . . 25,221 .78 . . . . . .
Industrial gas 32512 Sb,Mnn
5,207 .16 Hrs Cubic feet, hydrogen, oxygen,acetylene, argon, nitrogen, andcarbon dioxide; quarterly for1991–2004; Census Bureau.Monthly data for 1972–90.
Other basic inorganicchemical
32518pt. . . . 16,967 .53 . . . . . .
Misc. other basic inorganicchemicals*
32518pt. Sb,Mnn
9,361 .29 Hrs Tons, sulfuric acid, hydrochloricacid, aluminum sulfate, sodiumphosphate tripoly, phosphorus,hydrofluoric acid, calciumphosphate, calcium carbide,hydrogen peroxide, sodiumchlorate, sodium silicate, andpotassium pyrophosphate for1972Q1–2011Q2; CensusBureau. Monthly data for1972–90. Carbon blackestimated from productionworker hours for 1972–2012.
. . . Not applicable.
26
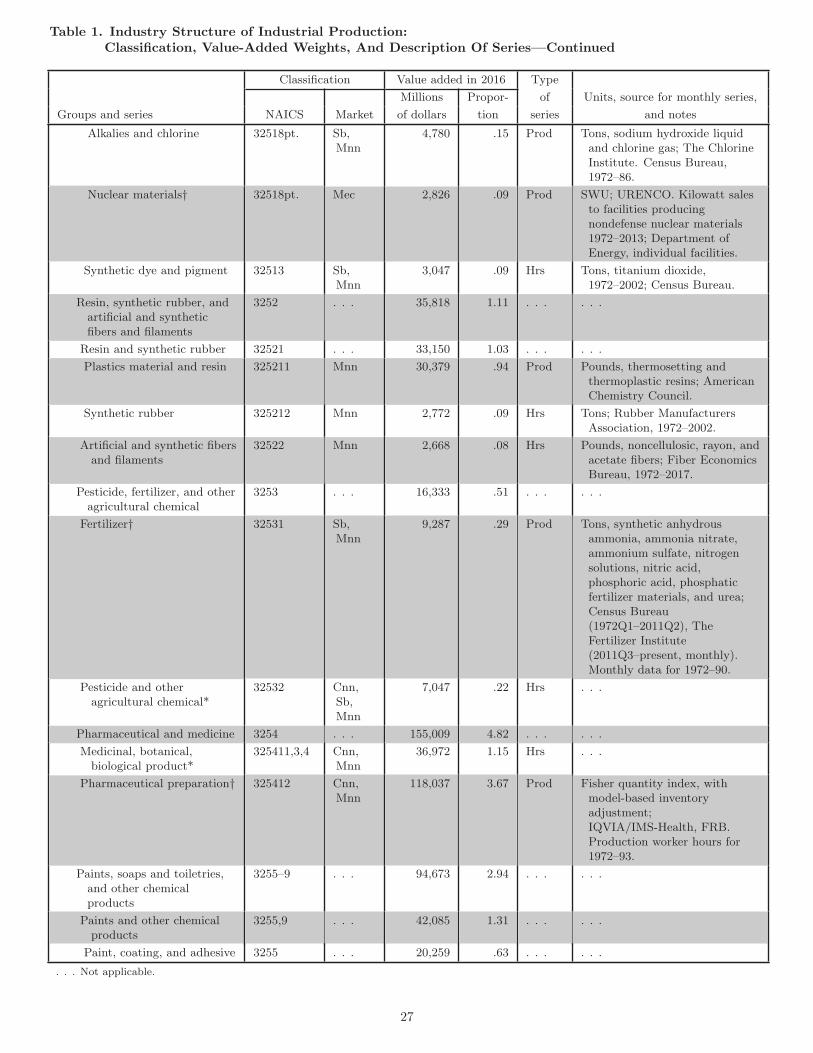
Table 1. Industry Structure of Industrial Production:Classification, Value-Added Weights, And Description Of Series—Continued
Classification Value added in 2016 Type
Millions Propor- of Units, source for monthly series,
Groups and series NAICS Market of dollars tion series and notes
Alkalies and chlorine 32518pt. Sb,Mnn
4,780 .15 Prod Tons, sodium hydroxide liquidand chlorine gas; The ChlorineInstitute. Census Bureau,1972–86.
Nuclear materials† 32518pt. Mec 2,826 .09 Prod SWU; URENCO. Kilowatt salesto facilities producingnondefense nuclear materials1972–2013; Department ofEnergy, individual facilities.
Synthetic dye and pigment 32513 Sb,Mnn
3,047 .09 Hrs Tons, titanium dioxide,1972–2002; Census Bureau.
Resin, synthetic rubber, andartificial and syntheticfibers and filaments
3252 . . . 35,818 1.11 . . . . . .
Resin and synthetic rubber 32521 . . . 33,150 1.03 . . . . . .
Plastics material and resin 325211 Mnn 30,379 .94 Prod Pounds, thermosetting andthermoplastic resins; AmericanChemistry Council.
Synthetic rubber 325212 Mnn 2,772 .09 Hrs Tons; Rubber ManufacturersAssociation, 1972–2002.
Artificial and synthetic fibersand filaments
32522 Mnn 2,668 .08 Hrs Pounds, noncellulosic, rayon, andacetate fibers; Fiber EconomicsBureau, 1972–2017.
Pesticide, fertilizer, and otheragricultural chemical
3253 . . . 16,333 .51 . . . . . .
Fertilizer† 32531 Sb,Mnn
9,287 .29 Prod Tons, synthetic anhydrousammonia, ammonia nitrate,ammonium sulfate, nitrogensolutions, nitric acid,phosphoric acid, phosphaticfertilizer materials, and urea;Census Bureau(1972Q1–2011Q2), TheFertilizer Institute(2011Q3–present, monthly).Monthly data for 1972–90.
Pesticide and otheragricultural chemical*
32532 Cnn,Sb,Mnn
7,047 .22 Hrs . . .
Pharmaceutical and medicine 3254 . . . 155,009 4.82 . . . . . .
Medicinal, botanical,biological product*
325411,3,4 Cnn,Mnn
36,972 1.15 Hrs . . .
Pharmaceutical preparation† 325412 Cnn,Mnn
118,037 3.67 Prod Fisher quantity index, withmodel-based inventoryadjustment;IQVIA/IMS-Health, FRB.Production worker hours for1972–93.
Paints, soaps and toiletries,and other chemicalproducts
3255–9 . . . 94,673 2.94 . . . . . .
Paints and other chemicalproducts
3255,9 . . . 42,085 1.31 . . . . . .
Paint, coating, and adhesive 3255 . . . 20,259 .63 . . . . . .
. . . Not applicable.
27
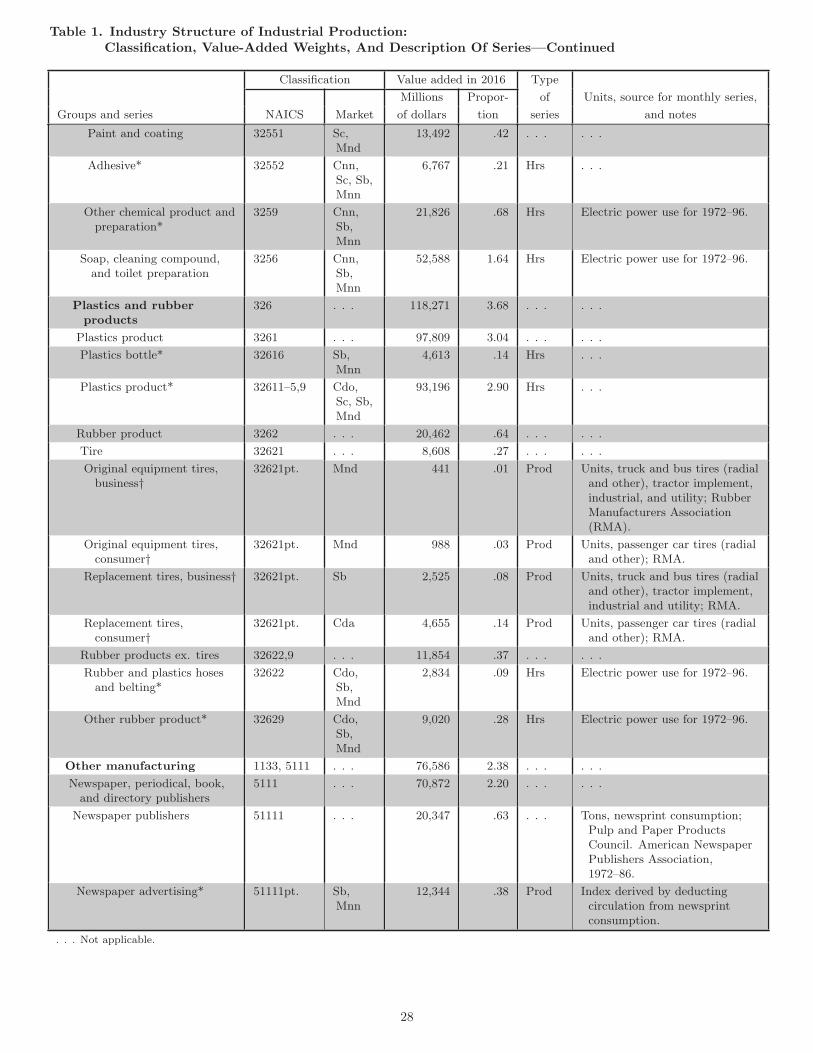
Table 1. Industry Structure of Industrial Production:Classification, Value-Added Weights, And Description Of Series—Continued
Classification Value added in 2016 Type
Millions Propor- of Units, source for monthly series,
Groups and series NAICS Market of dollars tion series and notes
Paint and coating 32551 Sc,Mnd
13,492 .42 . . . . . .
Adhesive* 32552 Cnn,Sc, Sb,Mnn
6,767 .21 Hrs . . .
Other chemical product andpreparation*
3259 Cnn,Sb,Mnn
21,826 .68 Hrs Electric power use for 1972–96.
Soap, cleaning compound,and toilet preparation
3256 Cnn,Sb,Mnn
52,588 1.64 Hrs Electric power use for 1972–96.
Plastics and rubberproducts
326 . . . 118,271 3.68 . . . . . .
Plastics product 3261 . . . 97,809 3.04 . . . . . .
Plastics bottle* 32616 Sb,Mnn
4,613 .14 Hrs . . .
Plastics product* 32611–5,9 Cdo,Sc, Sb,Mnd
93,196 2.90 Hrs . . .
Rubber product 3262 . . . 20,462 .64 . . . . . .
Tire 32621 . . . 8,608 .27 . . . . . .
Original equipment tires,business†
32621pt. Mnd 441 .01 Prod Units, truck and bus tires (radialand other), tractor implement,industrial, and utility; RubberManufacturers Association(RMA).
Original equipment tires,consumer†
32621pt. Mnd 988 .03 Prod Units, passenger car tires (radialand other); RMA.
Replacement tires, business† 32621pt. Sb 2,525 .08 Prod Units, truck and bus tires (radialand other), tractor implement,industrial and utility; RMA.
Replacement tires,consumer†
32621pt. Cda 4,655 .14 Prod Units, passenger car tires (radialand other); RMA.
Rubber products ex. tires 32622,9 . . . 11,854 .37 . . . . . .
Rubber and plastics hosesand belting*
32622 Cdo,Sb,Mnd
2,834 .09 Hrs Electric power use for 1972–96.
Other rubber product* 32629 Cdo,Sb,Mnd
9,020 .28 Hrs Electric power use for 1972–96.
Other manufacturing 1133, 5111 . . . 76,586 2.38 . . . . . .
Newspaper, periodical, book,and directory publishers
5111 . . . 70,872 2.20 . . . . . .
Newspaper publishers 51111 . . . 20,347 .63 . . . Tons, newsprint consumption;Pulp and Paper ProductsCouncil. American NewspaperPublishers Association,1972–86.
Newspaper advertising* 51111pt. Sb,Mnn
12,344 .38 Prod Index derived by deductingcirculation from newsprintconsumption.
. . . Not applicable.
28
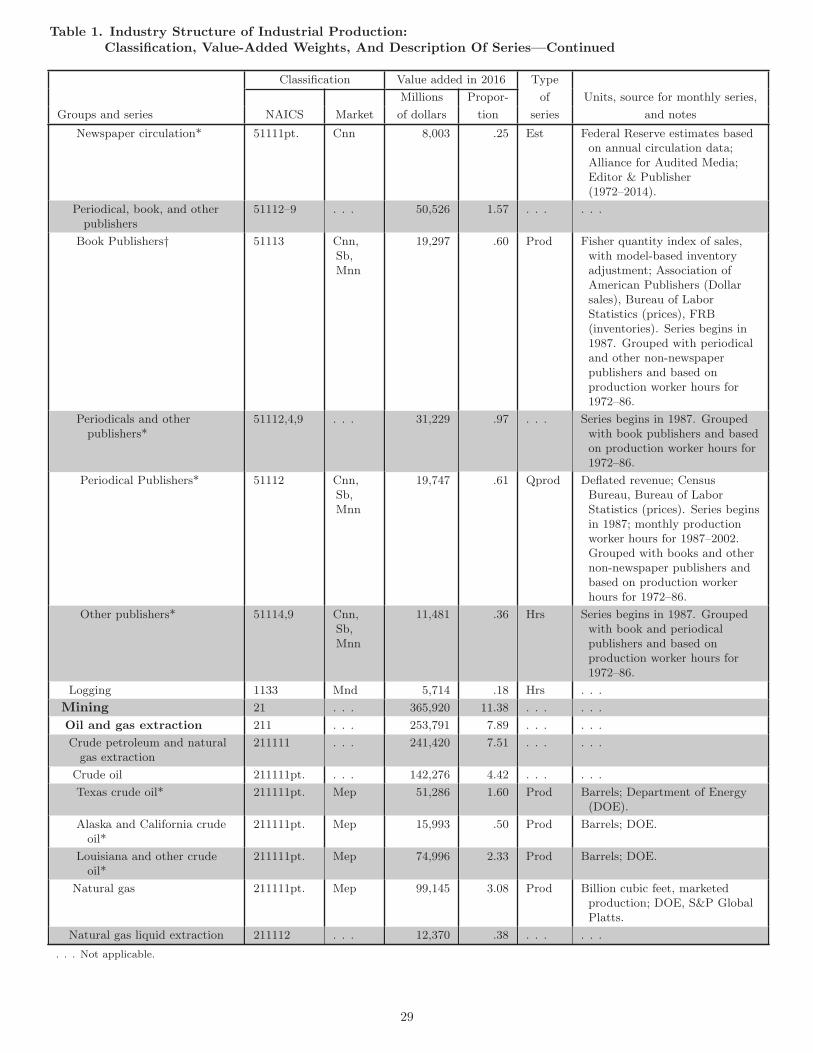
Table 1. Industry Structure of Industrial Production:Classification, Value-Added Weights, And Description Of Series—Continued
Classification Value added in 2016 Type
Millions Propor- of Units, source for monthly series,
Groups and series NAICS Market of dollars tion series and notes
Newspaper circulation* 51111pt. Cnn 8,003 .25 Est Federal Reserve estimates basedon annual circulation data;Alliance for Audited Media;Editor & Publisher(1972–2014).
Periodical, book, and otherpublishers
51112–9 . . . 50,526 1.57 . . . . . .
Book Publishers† 51113 Cnn,Sb,Mnn
19,297 .60 Prod Fisher quantity index of sales,with model-based inventoryadjustment; Association ofAmerican Publishers (Dollarsales), Bureau of LaborStatistics (prices), FRB(inventories). Series begins in1987. Grouped with periodicaland other non-newspaperpublishers and based onproduction worker hours for1972–86.
Periodicals and otherpublishers*
51112,4,9 . . . 31,229 .97 . . . Series begins in 1987. Groupedwith book publishers and basedon production worker hours for1972–86.
Periodical Publishers* 51112 Cnn,Sb,Mnn
19,747 .61 Qprod Deflated revenue; CensusBureau, Bureau of LaborStatistics (prices). Series beginsin 1987; monthly productionworker hours for 1987–2002.Grouped with books and othernon-newspaper publishers andbased on production workerhours for 1972–86.
Other publishers* 51114,9 Cnn,Sb,Mnn
11,481 .36 Hrs Series begins in 1987. Groupedwith book and periodicalpublishers and based onproduction worker hours for1972–86.
Logging 1133 Mnd 5,714 .18 Hrs . . .
Mining 21 . . . 365,920 11.38 . . . . . .
Oil and gas extraction 211 . . . 253,791 7.89 . . . . . .
Crude petroleum and naturalgas extraction
211111 . . . 241,420 7.51 . . . . . .
Crude oil 211111pt. . . . 142,276 4.42 . . . . . .
Texas crude oil* 211111pt. Mep 51,286 1.60 Prod Barrels; Department of Energy(DOE).
Alaska and California crudeoil*
211111pt. Mep 15,993 .50 Prod Barrels; DOE.
Louisiana and other crudeoil*
211111pt. Mep 74,996 2.33 Prod Barrels; DOE.
Natural gas 211111pt. Mep 99,145 3.08 Prod Billion cubic feet, marketedproduction; DOE, S&P GlobalPlatts.
Natural gas liquid extraction 211112 . . . 12,370 .38 . . . . . .
. . . Not applicable.
29
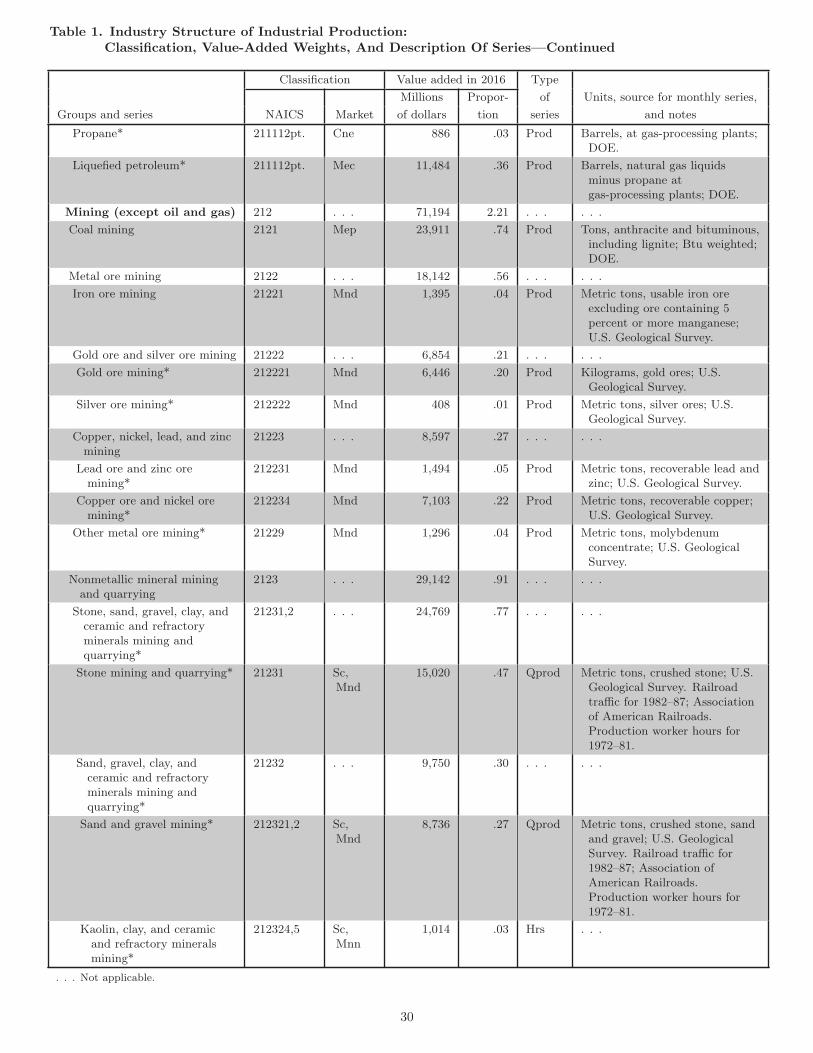
Table 1. Industry Structure of Industrial Production:Classification, Value-Added Weights, And Description Of Series—Continued
Classification Value added in 2016 Type
Millions Propor- of Units, source for monthly series,
Groups and series NAICS Market of dollars tion series and notes
Propane* 211112pt. Cne 886 .03 Prod Barrels, at gas-processing plants;DOE.
Liquefied petroleum* 211112pt. Mec 11,484 .36 Prod Barrels, natural gas liquidsminus propane atgas-processing plants; DOE.
Mining (except oil and gas) 212 . . . 71,194 2.21 . . . . . .
Coal mining 2121 Mep 23,911 .74 Prod Tons, anthracite and bituminous,including lignite; Btu weighted;DOE.
Metal ore mining 2122 . . . 18,142 .56 . . . . . .
Iron ore mining 21221 Mnd 1,395 .04 Prod Metric tons, usable iron oreexcluding ore containing 5percent or more manganese;U.S. Geological Survey.
Gold ore and silver ore mining 21222 . . . 6,854 .21 . . . . . .
Gold ore mining* 212221 Mnd 6,446 .20 Prod Kilograms, gold ores; U.S.Geological Survey.
Silver ore mining* 212222 Mnd 408 .01 Prod Metric tons, silver ores; U.S.Geological Survey.
Copper, nickel, lead, and zincmining
21223 . . . 8,597 .27 . . . . . .
Lead ore and zinc oremining*
212231 Mnd 1,494 .05 Prod Metric tons, recoverable lead andzinc; U.S. Geological Survey.
Copper ore and nickel oremining*
212234 Mnd 7,103 .22 Prod Metric tons, recoverable copper;U.S. Geological Survey.
Other metal ore mining* 21229 Mnd 1,296 .04 Prod Metric tons, molybdenumconcentrate; U.S. GeologicalSurvey.
Nonmetallic mineral miningand quarrying
2123 . . . 29,142 .91 . . . . . .
Stone, sand, gravel, clay, andceramic and refractoryminerals mining andquarrying*
21231,2 . . . 24,769 .77 . . . . . .
Stone mining and quarrying* 21231 Sc,Mnd
15,020 .47 Qprod Metric tons, crushed stone; U.S.Geological Survey. Railroadtraffic for 1982–87; Associationof American Railroads.Production worker hours for1972–81.
Sand, gravel, clay, andceramic and refractoryminerals mining andquarrying*
21232 . . . 9,750 .30 . . . . . .
Sand and gravel mining* 212321,2 Sc,Mnd
8,736 .27 Qprod Metric tons, crushed stone, sandand gravel; U.S. GeologicalSurvey. Railroad traffic for1982–87; Association ofAmerican Railroads.Production worker hours for1972–81.
Kaolin, clay, and ceramicand refractory mineralsmining*
212324,5 Sc,Mnn
1,014 .03 Hrs . . .
. . . Not applicable.
30
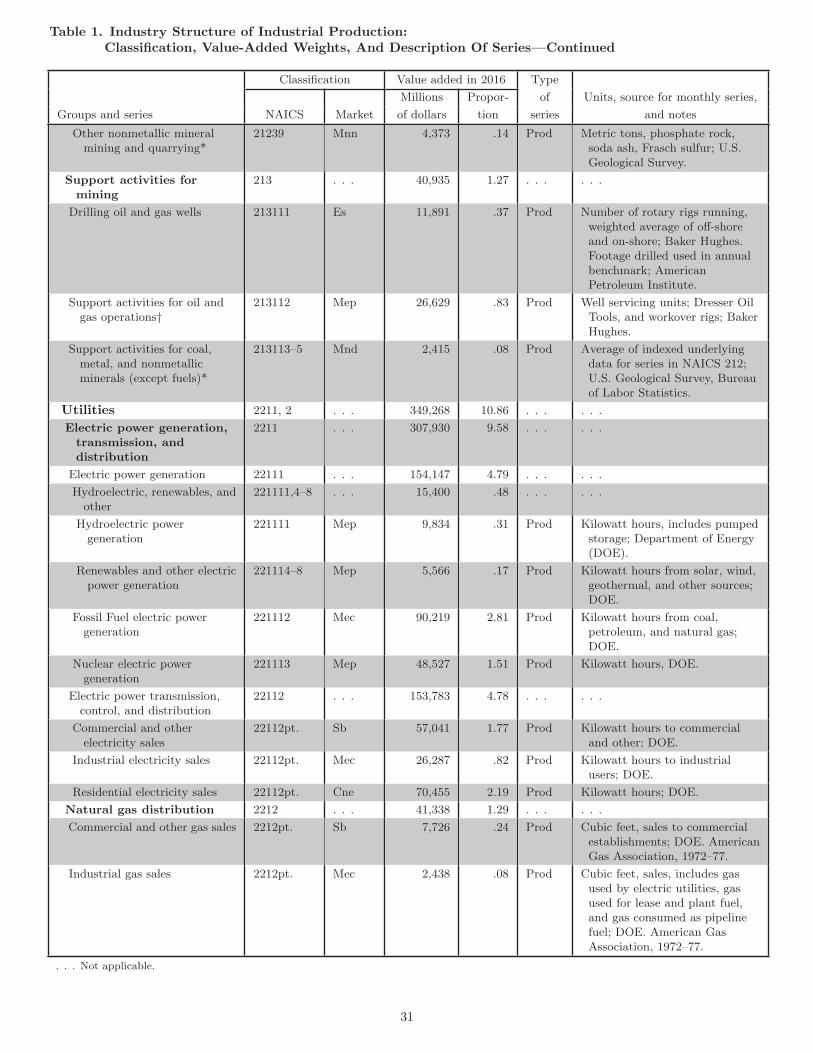
Table 1. Industry Structure of Industrial Production:Classification, Value-Added Weights, And Description Of Series—Continued
Classification Value added in 2016 Type
Millions Propor- of Units, source for monthly series,
Groups and series NAICS Market of dollars tion series and notes
Other nonmetallic mineralmining and quarrying*
21239 Mnn 4,373 .14 Prod Metric tons, phosphate rock,soda ash, Frasch sulfur; U.S.Geological Survey.
Support activities formining
213 . . . 40,935 1.27 . . . . . .
Drilling oil and gas wells 213111 Es 11,891 .37 Prod Number of rotary rigs running,weighted average of off-shoreand on-shore; Baker Hughes.Footage drilled used in annualbenchmark; AmericanPetroleum Institute.
Support activities for oil andgas operations†
213112 Mep 26,629 .83 Prod Well servicing units; Dresser OilTools, and workover rigs; BakerHughes.
Support activities for coal,metal, and nonmetallicminerals (except fuels)*
213113–5 Mnd 2,415 .08 Prod Average of indexed underlyingdata for series in NAICS 212;U.S. Geological Survey, Bureauof Labor Statistics.
Utilities 2211, 2 . . . 349,268 10.86 . . . . . .
Electric power generation,transmission, anddistribution
2211 . . . 307,930 9.58 . . . . . .
Electric power generation 22111 . . . 154,147 4.79 . . . . . .
Hydroelectric, renewables, andother
221111,4–8 . . . 15,400 .48 . . . . . .
Hydroelectric powergeneration
221111 Mep 9,834 .31 Prod Kilowatt hours, includes pumpedstorage; Department of Energy(DOE).
Renewables and other electricpower generation
221114–8 Mep 5,566 .17 Prod Kilowatt hours from solar, wind,geothermal, and other sources;DOE.
Fossil Fuel electric powergeneration
221112 Mec 90,219 2.81 Prod Kilowatt hours from coal,petroleum, and natural gas;DOE.
Nuclear electric powergeneration
221113 Mep 48,527 1.51 Prod Kilowatt hours, DOE.
Electric power transmission,control, and distribution
22112 . . . 153,783 4.78 . . . . . .
Commercial and otherelectricity sales
22112pt. Sb 57,041 1.77 Prod Kilowatt hours to commercialand other; DOE.
Industrial electricity sales 22112pt. Mec 26,287 .82 Prod Kilowatt hours to industrialusers; DOE.
Residential electricity sales 22112pt. Cne 70,455 2.19 Prod Kilowatt hours; DOE.
Natural gas distribution 2212 . . . 41,338 1.29 . . . . . .
Commercial and other gas sales 2212pt. Sb 7,726 .24 Prod Cubic feet, sales to commercialestablishments; DOE. AmericanGas Association, 1972–77.
Industrial gas sales 2212pt. Mec 2,438 .08 Prod Cubic feet, sales, includes gasused by electric utilities, gasused for lease and plant fuel,and gas consumed as pipelinefuel; DOE. American GasAssociation, 1972–77.
. . . Not applicable.
31
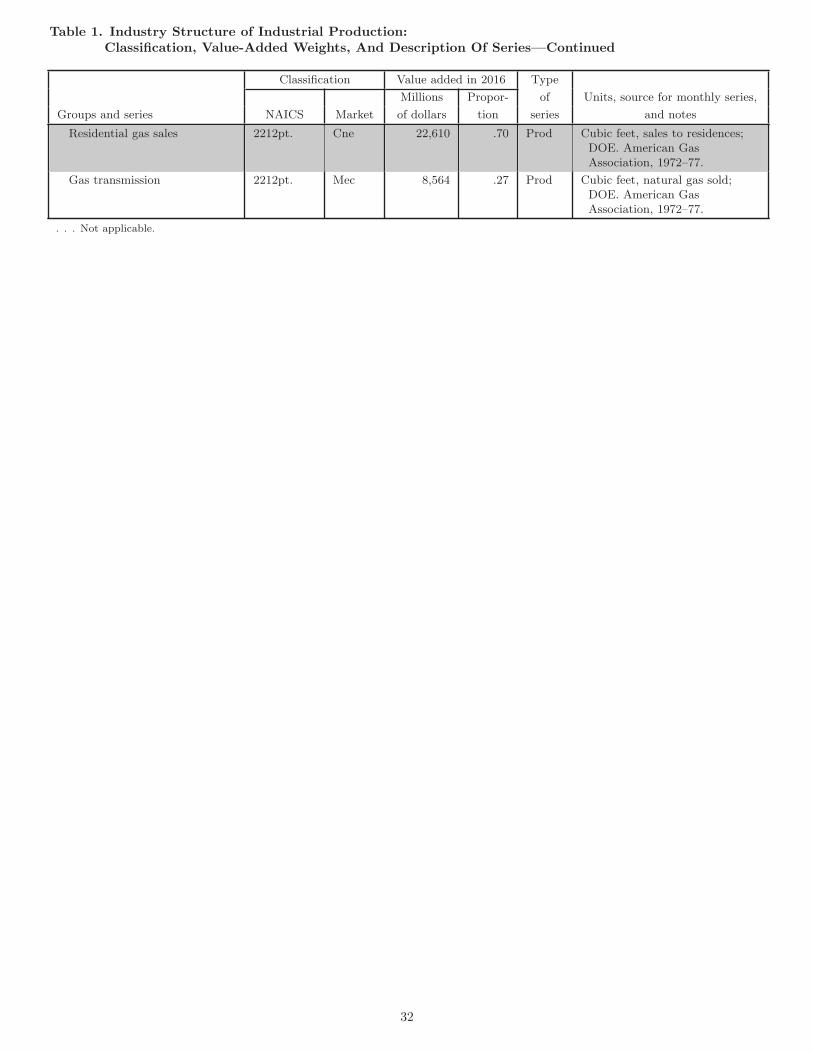
Table 1. Industry Structure of Industrial Production:Classification, Value-Added Weights, And Description Of Series—Continued
Classification Value added in 2016 Type
Millions Propor- of Units, source for monthly series,
Groups and series NAICS Market of dollars tion series and notes
Residential gas sales 2212pt. Cne 22,610 .70 Prod Cubic feet, sales to residences;DOE. American GasAssociation, 1972–77.
Gas transmission 2212pt. Mec 8,564 .27 Prod Cubic feet, natural gas sold;DOE. American GasAssociation, 1972–77.
. . . Not applicable.
32