Embed Size (px)
Citation preview

CREATS: Phase II Final Report, Vol. III: CTA Transport Improvement Project in East Sector of Cairo Chapter 3: A NEW ROLE FOR THE HELIOPOLIS METRO
3 - 25
Table 3.2.5 Comparison of Supertram Depot Locations
Site Depot location Advantage Disadvantage 1 ENR grounds by
Ramses station Supertram bypass
needed to cross Metro line 1
high hand cost higher operation
costs 2 Heliopolis Metro
grounds by Almaza tram line
preservation of minimum service in event of track obstructions
more efficient construction works more efficient implementation train breakdowns easier to
retrieve lower operation costs
construction of new Supertram link to HM grounds required
off-service running increased
3 Military ground by Khedr El Toony St.
4 Military ground by Azhar University
off-service running reduced preservation of minimum service
in event of track obstructions more efficient construction
works, more efficient implementation train breakdowns easier to
retrieve lower operation costs
High land cost
5 Zahraa Madinet Nasr
6 Ring road
Low land cost
Higher operation
costs
3.2.4 Supertram Line 1 Alignment Alternatives
For this feasibility study, two types of alignment alternatives are studied:
• partially segregated, • fully segregated.
These alternatives will influence the operational characteristics of the Supertram line as well as the expected demand.
The implementation of the Supertram system involves a combination of three types of cross-sections :
• At grade on the existing line 4 of Heliopolis Metro, which is a central or lateral right-of-way alignment on the road.

CREATS: Phase II Final Report, Vol. III: CTA Transport Improvement Project in East Sector of Cairo Chapter 3: A NEW ROLE FOR THE HELIOPOLIS METRO
3 - 26
• On viaduct or cut and cover which is suitable when major conflicts at road crossings do not offer good conditions for operating the Supertram system at grade. On secondary road intersections, a system for managing absolute priorities at traffic lights at intersections will be implemented; it will detect the Supertram's position and command the traffic lights so that green light for the Supertram can be prolonged or triggered in advance, as required.
• At grade within the median of the existing road between Madinet Nasr and the ring road (New Cairo).
The major road crossings interfering with Supertram line 1 are shown in Figure 3.2.15.
Source: JICA Study Team
Figure 3.2.15 Major Road Crossings Along Supertram 1 Alignment
(5) Partial Segregation Alternative
In order to limit the infrastructure cost, the alignment of a partially segregated Supertram is considered.
The success of a tramway service, particularly in terms of its ability to attract car drivers and to reduce road traffic, depends entirely on the level and suitability of the priority measures bestowed to it. A local council, which is genuinely interested in road traffic reduction, will ensure that optimum tramway priority measures are applied wherever necessary. Altogether, the Supertram alignment involves 11 main junctions, which will require either priority signaling or viaducts. The latter are preferred from tunnels in order to reduce costs.

CREATS: Phase II Final Report, Vol. III: CTA Transport Improvement Project in East Sector of Cairo Chapter 3: A NEW ROLE FOR THE HELIOPOLIS METRO
3 - 27
Building fully segregated tracks will involve heavy construction works for viaducts at the main road junctions. These construction works can be avoided by providing Supertram priority signaling at the main junctions instead when possible. A description of the most common priority signaling systems is provided in the following.
1) Supertram Priority Signaling Principles
To achieve a regular 3-4 minute headway requires Supertram priority signals at all road junctions in addition to the reserved route. To provide such headways with absolute priority at all road junctions will involve an important traffic management scheme for the area and will also mean closing crossings for a significant number of side roads.
Supertram detectors should be installed at all the traffic signals throughout the alignment, so that when the Supertram approaches a junction, the lights will automatically give it priority over other traffic. Traffic lights at a crossing point can be activated by the approach of the Supertram. In conjunction with 'box junction' markings, this ensures the Supertram can cross a road unimpeded.
The Supertram vehicles can be detected using selective tram detectors (inductance loops) on each approach in the segregated tracks. Up to four loop detectors can be provided for each approach. The first loop a tram crosses is the Prepare detector. This may be used to initiate pre-emptive control actions at the junction prior to the arrival of the Supertram. The second loop is the Demand detector. This is mainly used to send the priority demand to the signal controller. The third loop is the Stopline detector, which can be used to terminate phase extension or initiate a priority phase demand if the tram is stopped at the signals. The final loop is the Exit detector. This is normally used to curtail the intergreen early once the tram has left the junction.
2) Viaducts or Road Underpasses
In this alternative, they will be constructed at only the most critically loaded and dense traffic junctions. Early reviews suggest these will be needed at Khalifa El Maamoon/Merghany and Merghany / Ahmed Tayseer, which have seven and three crossing roads, respectively. All secondary road crossings will be cancelled, thus deviating some of the cars to primary junctions. Car traffic will be rearranged - and to a certain extent disfavored with this type of alignment - to the benefit of public transport, pedestrians and urban conviviality. In fact, the implementation of the Supertram in the dense urban tissue is an exceptional opportunity to rethink and to transform the urban landscape along the alignment (please refer to urban integration chapter). In this context, the main assets of the Supertram will be its convivial, secure and modern features compared to those of cars and buses.
An overview of all the junctions and proposed measure for the partial segregation alternative are included in Table 3.2.6. This alternative is based on ensuring the 3-4

CREATS: Phase II Final Report, Vol. III: CTA Transport Improvement Project in East Sector of Cairo Chapter 3: A NEW ROLE FOR THE HELIOPOLIS METRO
3 - 28
minutes headways of the Supertram at a minimum cost. However, the Supertram priority signaling, which will be proposed at junctions, which do not absolutely require viaducts, will call for special law enforcement and urban designs schemes for the junctions. These additional costs will be taken into account later in the study.
Table 3.2.6 Partial Segregation Alternative : Preliminary Identification of Priority Measures
Junction Type Priority measure 1 Khalifa El Maamoon/Merghany 7 cross roads Viaduct 2 Merghany / Ahmed Tayseer 3 cross roads Road underpass 3 Khedr El Toony / Ahmed Tayseer 3 cross roads Signaling 4 Khedr El Toony / Yoosef Abbas 3 cross roads Signaling 5 Nasr Road / Yoosef Abbas 4 cross roads Signaling 6 Yoosef Abbas / Khalifa El Qaher 3 cross roads Signaling 7 Aly Ameen / Sheikh Mahmoud Shaltoot 4 cross roads Signaling 8 Aly Ameen / Abbas El Aqqad 4 cross roads Signaling 9 Mostafa El Nahhas / Makram Ebeid 4 cross roads Signaling
10 Mostafa El Nahhas / Hassan Maamoon 4 cross roads Signaling 11 Intersection with arterial roads linking new Cairo 3 cross roads Signaling Source: JICA Study Team
In order to ensure the success of the tramway priority signaling in Cairo, local by-laws need to be carefully drafted and enforced, which can make obstruction of the Supertram tracks an offence, or permit the Supertram company to claim for lost revenue from the obstructer.
Another important measure is to clearly mark the Supertram crossings with signposts and a different type of pavement and junction design in the frame of a significant urban landscaping.
In the next phase, the compatibility of the partial segregation option with the ongoing project of Cairo Governorate to test a new signaling system in Mostafa El Nahhas street, will be investigated if appropriate to the selected concept.
Technical specifications together with innovative traffic management techniques are required for the installation and management of the route of the Supertram in the urban areas with a high-level traffic flow. This involves :
• planning and development of intersections, • studies related to the impact of the tram on the road infrastructure and traffic, • analysis of the compatibility of intersections when the Supertram is traveling at
top speed (this work is to be completed in collaboration with the town planners and architects), and,

CREATS: Phase II Final Report, Vol. III: CTA Transport Improvement Project in East Sector of Cairo Chapter 3: A NEW ROLE FOR THE HELIOPOLIS METRO
3 - 29
• drawing up new route strategies taking into account urban integration and pedestrians.
(6) Full Segregation Alternative
A full segregation of the Supertram based on viaducts or road underpasses at all crossings (please refer to the previous table) is the best solution in terms of speed, headways, safety, reliability and overall attractiveness of the service.
In spite of this solution being relatively costly, it should be remembered that it remains the best solution among transport systems in terms of demand and cost efficiency at a long term. Please refer to the CREATS Master Plan for additional detail.
Furthermore, it is a solution that does not disfavor car traffic and can be viewed as politically the safest. This does however have an important cost, which are determined in a later section.
3.2.5 Supertram Line 1 Alternatives Considerations
(1) Speed
The acceleration and deceleration characteristics of the rolling stock help determine the running times that can be achieved. Generally speaking, the braking capability of the Supertram rolling stock is limited only by the available wheel/rail adhesion and the ability of riders (especially standees) to tolerate high deceleration rates. Acceleration, on the other hand, is a variable that can enhance the performance of the system. It should be mentioned that a high acceleration rate requires a strong power supply, which in return, leads to an increased power consumption and investment and operating cost. Operation speed is essential for satisfying the demand and for diverting passengers from other transport modes. It is not necessary that the maximum speeds be very high : 70 km/h is sufficient for a modern tramway system. The average commercial speed rather depends upon the alignment features such as the distance between stations, curves, and entry and exit movements within stations.
The speed (V) is calculated using software which considers various parameters, among them acceleration capability (a), deceleration capability (d) and time (t) data which are inter-station link sensitive :
V= a x t during acceleration phases
V = Vmax when maximum speed is reached
V = Vmax – d x t during deceleration phases
To calculate the average speed on the line, it is necessary calculate first the travel time between each terminal stations with the following formula :

CREATS: Phase II Final Report, Vol. III: CTA Transport Improvement Project in East Sector of Cairo Chapter 3: A NEW ROLE FOR THE HELIOPOLIS METRO
3 - 30
T = t(during acceleration phase)+ t(during max speed phase) + t(during deceleration phase) + t(stop time at station).
Max speed (around 70 km/h for tramway) would be reduced on sharp curve section or non-protected road crossings for safety reasons (speed curbs). When the cumulative time is calculated, the line length is divided by it to have the average commercial speed.
The full enforcement of the Supertram's priority at road junctions is a vital for ensuring a sufficiently attractive speed and reliability of the Supertram. Obstacles on the operating speed should therefore be avoided by all means in order to provide the service level, which is required in this corridor of Cairo. Unnecessary stops should be avoided, and ultimately, the point-to-point operating time should be minimized to the greatest extent possible in order to increase the attractiveness of the service.
The proposed station spacing of 1.2 km and protected right-of-way of the Supertram will allow for a very good average commercial speed. The latter has been simulated for the two alternatives based on the following technical characteristics of the Supertram system :
• Step 1: acceleration : 0.8 m/s², and intermediate speed : Vintermediate (km/h) • Step 2: acceleration : 0.3 m/s², and maximum speed : Vmax (km/h) • Deceleration : 0.5 m/s² • Stopping time at stations : 30 s at main interchange stations (Ramses, Ghamra,
Girl's College, Ring Road) and 20 s at other stations
Under optimal alignment conditions, the Supertram reaches the maximum speed of 70 km/h in two steps: a take-off acceleration of 0.8 m/s² until it reaches an intermediate speed of 40 km/h. The acceleration is then reduced to 0.3 m/s² in order to avoid an uncomfortable jolt when the maximum speed is reached. The maximum speed is maintained until the required the deceleration range is reached. An example of the running speed profile calculation is shown in Table 3.2.7.
Table 3.2.7 Calculation of Speed for Running between Ramses and Ghamra Stations (1720 m) excluding Stopping Time at Stations
Speed (km/h) Speed (m/s) Cumulative time (s) Cumulative distance (m) 0 0 0 0
40 11 14 77 70 19 42 502 70 19 85 1,342 0 0 124 1,720
Source: JICA Study Team
The running time between Ramses and Ghamra stations is thus 124 seconds excluding the stopping time (Figure 3.2.16). The speed levels will vary depending on the alignment section. In sections with curbs the speed is, for example, lower.

CREATS: Phase II Final Report, Vol. III: CTA Transport Improvement Project in East Sector of Cairo Chapter 3: A NEW ROLE FOR THE HELIOPOLIS METRO
3 - 31
0
14
124
85
42
0
20
40
60
80
100
0 20 40 60 80 100 120 140
Running time (s)
Spee
d (k
m/h
)
Source: JICA Study Team
Figure 3.2.16 Speed Profile for Running between Ramses and Ghamra Stations (1720 m) excluding Stopping Time at Stations
For each section of the Supertram alignment, the speed values used for the simulation of the running time have been adjusted with regard to the segregation type, junctions, curbs, population density in order to provide a sufficient safety margin and to reflect normal operating conditions.
1) Partial segregation alternative
As seen in Table 3.2.8, curbs that do not coincide with stations, have also been taken into account. They are as follows :
• curb 1 : Yoosef Abbas / Khalifa El Qaher junction • curb 2 : the end of Mostafa El Nahhas st.
In the first curb, the Supertram is considered to run at 15 km/h and in the second curb, 20 km/h. The speed in the first curb is relatively low in order to account for the junction.
In this alternative, the Supertram will operate under optimal conditions on the fully segregated stretch from Ramses station to Teacher's College, with a maximum speed of 70 km/h. On the remaining alignment, which is protected at grade and equipped with priority signaling, the maximum speed is limited at 35 km/h for safety reasons.
The simulation leads to a total trip time of 48 minutes from the Ring Road to Ramses Station (22 km) and an average commercial speed of 28 km/h. In spite of the conservative assumptions for the speed profile, the result is very good thanks to the relatively high station spacing proposed. The Supertram line 1 will thus operate twice as fast as the current tramlines.

CREATS: Phase II Final Report, Vol. III: CTA Transport Improvement Project in East Sector of Cairo Chapter 3: A NEW ROLE FOR THE HELIOPOLIS METRO
3 - 32
Table 3.2.8 Running Time and Speed Simulation of the Partial Segregation Alternative
Station Distance (km)
Stop time (s)
Running time (s)
Cumulative time (min)
Commercial speed (km/h)
Step speeds (km/h)
Ramses (Terminal) 0.00 30 Ghamra 1.72 30 124 2.56 40.3 40, 70
Demerdash 1.09 20 91 4.59 32.3 40, 70 Mansheyet El Sadr 1.21 20 98 6.54 37.1 40, 70
Mansheyet El Bakry 2.32 20 155 9.46 47.8 40, 70 Teacher's College 0.87 20 80 11.12 31.3 40, 70 Heliopolis Club 0.58 20 77 12.75 21.5 20, 35 Girl's College 1.12 30 133 15.29 26.4 20, 35 Marwa City 0.77 20 97 17.41 21.9 20, 35
Cairo Stadium 1.14 20 177 20.68 20.9 15, 25 Nasr Cinema 1.19 20 140 23.35 26.8 20, 35
Azhar University 0.68 20 88 25.14 22.8 20, 35, 15Curb 1 0.64 77 26.76 23.8 15, 25
Osman Building 0.64 20 101 28.44 22.8 15, 25 Ebeid Street 1.05 20 164 31.50 20.6 15, 25
Darayeb 1.31 20 201 35.19 21.3 15, 25 Madinet Nasr 1.29 20 157 38.14 26.2 20, 35, 20
Curb 2 0.80 92 40.01 25.7 20, 35 Zumor 0.80 20 95 41.59 30.3 20, 35
Hay El Aasher 1.39 20 161 44.60 27.7 20, 35 Ring Road Terminal 1.39 161 47.61 27.7 20, 35
Source: JICA Study Team
2) Full segregation alternative
As before, curbs that do not coincide with stations, have also been taken into account. In both curbs, the Supertram will run at 20 km/h. In general, the speeds are higher for this alternative thanks to the full protection of the alignment from traffic and pedestrians.
In this alternative, the Supertram will operate under optimal conditions on the fully segregated stretch from Ramses station to Teacher's College, with a maximum speed of 70 km/h. On the remaining alignment, which is protected at grade and equipped with viaducts or tunnel bypasses for cars at the junctions, the maximum speed is limited at 45 km/h for safety reasons.
The simulation leads to a total trip time of 41 minutes from the Ring Road to Ramses Station (22 km) and an average commercial speed of 32 km/h. As before, in spite of the conservative assumptions for the speed profile, the result is very good thanks to the relatively high station spacing proposed. The Supertram line 1 will thus operate almost as fast as Metro Lines 1 and 2 (Table 3.2.9).

CREATS: Phase II Final Report, Vol. III: CTA Transport Improvement Project in East Sector of Cairo Chapter 3: A NEW ROLE FOR THE HELIOPOLIS METRO
3 - 33
Table 3.2.9 Running Time and Speed Simulation of the Full Segregation Alternative
Station Distance (km)
Stop time (s)
Running time (s)
Cumulative time (min)
Commercial speed (km/h)
Step speeds (km/h)
Ramses (Terminal) 0.00 30 Ghamra 1.72 30 124 2.56 40.3 40, 70
Demerdash 1.09 20 91 4.59 32.3 40, 70 Mansheyet El Sadr 1.21 20 98 6.54 37.1 40, 70
Mansheyet El Bakry 2.32 20 155 9.46 47.8 40, 70 Teacher's College 0.87 20 80 11.12 31.3 40, 70 Heliopolis Club 0.58 20 69 12.61 23.4 25, 45 Girl's College 1.12 30 112 14.82 30.4 25, 45 Marwa City 0.77 20 84 16.73 24.2 25, 45
Cairo Stadium 1.14 20 114 18.96 30.6 25, 45 Nasr Cinema 1.19 20 118 21.26 31.0 25, 45
Azhar University 0.68 20 77 22.88 25.2 25, 45 Curb 1 0.64 65 24.31 27.0 25, 45, 20
Osman Building 0.64 20 69 25.45 33.5 25, 45 Ebeid Street 1.05 20 107 27.57 29.8 25, 45
Darayeb 1.31 20 128 30.03 31.9 25, 45 Madinet Nasr 1.29 20 157 32.98 26.2 25, 45, 20
Curb 2 0.80 78 34.62 29.3 25, 45 Zumor 0.80 20 81 35.98 35.3 25, 45
Hay El Aasher 1.39 20 134 38.54 32.5 25, 45 Ring Road Terminal 1.39 134 41.11 32.5 25, 45
Source: JICA Study Team
(2) Headway
The service headways that may be achieved in the different alternatives, priority signaling and full segregation, are very decisive for the Supertram's ability to satisfy the demand during peak hours.
The shorter the headways, the higher the offered capacity. There are however constraints as to minimum headway depending on (a) minimum safety distance between trains for both alternatives, (b) cost and complexity of the Supertram's signaling system, and, (c) phase of the priority signaling for the partial segregation alternative.
1) Partial segregation alternative
Priority signaling systems allow for a minimum headway of 3 minutes. With a safety margin of 20 seconds before and after the passage of the Supertram, the car and pedestrian traffic will have no more than 2 minutes and 20 seconds to cross the junction. Going below this time would create a considerable impediment to general

CREATS: Phase II Final Report, Vol. III: CTA Transport Improvement Project in East Sector of Cairo Chapter 3: A NEW ROLE FOR THE HELIOPOLIS METRO
3 - 34
traffic and would significantly increase the number of intrusions on the tracks. With the 3-minute headway, enforcement of the priority will however be crucial.
The ridership forecast for 2012 and 2022 will require headways of 4 minutes 40 seconds and 2 minutes, 40 seconds, respectively.
2) Full segregation alternative
This alternative can ideally operate with a 2-minute headway. This would however require a complex and costly signaling system for the Supertram so as to ensure the safety distance between the trains.
The ridership forecast for 2012 and 2022 will require headways of 3 minutes, 40 seconds and 2 minutes, 20 seconds, respectively.
The conventional steel wheel on steel rail type of technology has a great advantage as the train sets can be coupled together to increase the capacity. A prerequisite for this is that platforms are built long enough to handle the longer train sets. Conversely, train sets can be shortened in off-peak periods to reduce operating costs. Alternatively, headways can be lengthened appropriately; the decision as to which approach to use will be based upon the operator's service and operating philosophies.
(3) Fare Level
In order to foster the financial sustainability of the Supertram system, the utmost has been done to :
• reduce the capital and operating cost via the alignment and system choice, and, • increase the revenue with adequate fare policies, service type, and auxiliary
services.
In 2001, the average fare of the tram in Cairo was 0.29 LE (Table 3.2.10). This figure has been determined on the basis of the annual number of CTA Tram and Heliopolis Metro passengers divided by the annual fare receipts. The average trip length was between five and six kilometers, thus yielding about 0.06 LE per passenger kilometer.
Table 3.2.10 Tram Operating Revenue, Fiscal Year 2001
Annual operating revenue (million LE)
Annual passengers (million)
Average revenue per passenger (LE)
14.3 49.3 0.29 Source: CTA. Data are combined values for Heliopolis Metro and CTA Tram.
The fare of the Supertram should reflect the important service improvement compared to other transport modes in Cairo. In fact, the Supertram may well become the most attractive service in general for the following reasons :

CREATS: Phase II Final Report, Vol. III: CTA Transport Improvement Project in East Sector of Cairo Chapter 3: A NEW ROLE FOR THE HELIOPOLIS METRO
3 - 35
• the Supertram is almost as fast as the Metro Lines 1 and 2 : 28 km/h or 32 km/h, depending on segregation alternative, compared to 35 km/h and 32 km/h of lines 1 and 2 respectively (during peak hours);
• the comfort is better: the supertram is above ground and provides views of the city;
• it is more accessible: all supertram platforms are at grade; • it has a better image : modern tramway systems include more stylish designs of
rolling stock, in addition to customized designs adjusted to the city, its policy and culture; and,
• Supertram Line 1 operates at headways similar to those of the metros.
The capabilities of the CREATS transport model were applied to estimate an optimum fare structure in terms of financial efficiency. In general, as fares are increased by a public transport operator, ridership will decrease. Obviously, fare revenue will vary in line with ridership and fare level. A series of fare levels were tested on Supertram Line 1 to ascertain impacts upon ridership and, ipso facto, revenue. Findings suggest that, under year 2007 status, that the optimum fare would be on the order of 60-65 Piasters (Figure 3.2.17). Fare levels for future-year public transport simulations are changed in line with forecast real growth of constant year 2001 household income. Thus, a year 2007 supertram fare of, say 65 Piasters, is increased to 75 Piasters and one LE, in constant year 2001 terms, by years 2012 and 2022, respectively. In comparison, the present full fare of the Metro is 75 Piasters.
0
50,000
100,000
150,000
200,000
250,000
300,000
350,000
400,000
450,000
500,000
20 30 40 50 60 70 80 90 100 110
Year 2007 Fare (Constant Year 2001 Piasters)
Num
ber
of D
aily
Pas
seng
ers
0
50,000
100,000
150,000
200,000
250,000
Rev
enue
(Con
stan
t Yea
r 20
01 L
E)
Daily Revenue (Right Axis)
Daily Passengers
Data source: JICA Study Team.
Region of Optimum Fare
Figure 3.2.17 Optimum Fare Level Analysis
As the fare level increases, low-income citizens will be excluded from using the Supertram, which is contrary to one of the main objectives of the Master Plan. Furthermore, there will be a discrepancy between the fares of the Supertram and the those applied on the CTA buses. How do we then obtain a profitable Supertram

CREATS: Phase II Final Report, Vol. III: CTA Transport Improvement Project in East Sector of Cairo Chapter 3: A NEW ROLE FOR THE HELIOPOLIS METRO
3 - 36
system, while ensuring the affordability for the poor, and integration with the lower fares of the CTA bus ? There are two ways to achieve this :
• put into effect a unique fare (not necessarily flat) for all public transport modes in Cairo, at a level which is optimal in terms of revenue while ensuring a subsidy for the poor,
• put into effect a first and second class on the Supertram with different fare levels.
The first way is without doubt the hardest to achieve due to the political and institutional implications, as well as the huge service level disparities of the CTA bus vs. the Supertram and the metro. Furthermore, it will incur losses in revenues and in service levels for the operators and passengers respectively, as neither fares nor service levels of the different modes can be adjusted effectively to the demand.
In political terms, the main issue that arises is whether the Government of Egypt wishes to subsidize public transport travel for a targeted group of society, and how this may be achieved most efficiently. As noted in the CREATS Master Plan, one of the most effective means of providing a subsidy to low-income citizens, while maintaining the incentive for operator efficiency, is to provide the subsidy directly to the person - not the enterprise. In that way, fares can be set at a commercially viable level, and operators would continue to pursue efficiency measures as built into the performance agreement.
• Reduced prices for the poor and socially disadvantaged can be achieved by the Ministry of Social Affairs (or another governmental body) issuing free of charge, or at a reduced cost, unit tickets or a periodic vouchers of the Supertram. The Ministry would purchase these tickets or vouchers from the operator at commercial prices. Thus, it is at the discretion of the Ministry as to how much discount is given to qualifying persons.
• Alternatively, persons with proper identification can directly pay a reduced rate to the operator, with differential reimbursement for each fare guaranteed to the operator from the government as part of the performance agreement. The main disadvantage of this second approach is that the operator incurs additional expenses associated with ticket collection and processing.
The second way, the differential classes of service, is possibly a viable solution. The introduction of first and second class services among the three or four vehicles of the Supertram could be considered.
Second class ensures the affordability for the poor, and allows for integrating fares with CTA buses. In this case, the Supertram operator should however receive a subsidy in compensation for the loss in revenues.
First class, allows for compensating for the lack in revenues on the second class, and ultimately, for ensuring the profitability of the Supertram service.
A first class vehicle can attract people that are willing to pay a higher fare for a good comfort and auxiliary services, which make their commuting more attractive. It should be noted that commuting from Nasr city and New Cairo to the CBD by

CREATS: Phase II Final Report, Vol. III: CTA Transport Improvement Project in East Sector of Cairo Chapter 3: A NEW ROLE FOR THE HELIOPOLIS METRO
3 - 37
Ramses Station on the Supertram, will amount to a round trip time of approximately 1.5 hours every day. The comfort of the service will therefore have a considerable impact on the modal choice of many people, especially car drivers. This is very interesting for the operator as it allows for generating a benefit based on services that are relatively cheap to procure compared to the functional service of the system. The comfort of travel is just as important as the time and cost for many people, and during peak hours, where space is scarce, it becomes even more important. The Supertram operator can adjust the first class level and fares accordingly. The first class vehicle could for example offer a guaranteed seat for specific hours of the day. This service could be sold via a voucher on a periodic basis, and could become very valuable as people would obtain their own reserved seat (price dependent on the hour of the day) on a mode which offers the best speed, comfort and reliability in Cairo.
In this way, the first class service could be contrived to generate the main source of revenue on the Supertram, similar to the practice on airline and inter-city train transport. In the context of the first class yielding the main profit, the fares on the second-class service can be reduced to minimal levels with the objective of integrating fares with CTA buses, and of filling up the remaining vehicles.
People from Madinet Nasr and New Cairo that are relatively wealthy, would be interested in using the Supertram, provided that the comfort level is sufficient. In this regard, a park-and-ride facility is planned at the Ring Road Station in order to accommodate the population from New Cairo, and other eastern urban precincts.
Transport conditions have changed considerably during the last decade, which calls for a complete reconsideration of earlier policies in urban transport. First of all, car traffic is no longer a privilege of the rich and the "only enjoyable way" due to increasing traffic congestion. Now car drivers are looking for an alternative mode and should be offered a service in public transport adapted to their needs. Else, they will remain in the traffic jams as it is presently the case, and thus worsen the overall transport conditions. Secondly, the present policy is to make public transport operators financially independent. Privatization attempts have been made in UK and Japan among others, which have been interesting financially. The overall outcome must however be considered negative as the tendency has been for the operators to reduce costs and services to inadmissible levels in a sector where people are captive (commuters).
The solution is therefore not to reduce costs but to improve the management of the public sector though commercialization, in order to increase revenues. In brief, urban public transport is no longer any different from airline and inter-city train operations except that they must remain under strict state control not to exploit the captivity of the market. Minimal service levels must be imposed regarding safety, regularity, speed etc. Introduction of first-class high capacity vehicles is an impending solution for urban public transport where there should be room for everyone.

CREATS: Phase II Final Report, Vol. III: CTA Transport Improvement Project in East Sector of Cairo Chapter 3: A NEW ROLE FOR THE HELIOPOLIS METRO
3 - 38
The fare policy and levels should be the subject matter of a more detailed analysis in the frame of a business plan for the Supertram operator.
3.2.6 Preliminary Demand Forecast
Traffic forecasts for the year 2022 indicate that the peak passenger counts for the Supertram line 1 will range from about 13,400 to 15,400 directional passengers on the busiest section during the peak hour, for the partial and full segregation alternatives, respectively. The technology that is chosen for the alternatives should have an optimum capacity near the high end of this range.
Further discussion regarding selection of technology, loading patterns and analytical approaches is contained in sections 3.9.1 and 3.9.2 of this report.
(1) Daily Trips Forecast on the Whole Line
The trip demand forecast was carried out for the years 2007, 2012 and 2022 in due consideration of the implementation staging assumptions of the overall transport network of the CREATS Master Plan. The forecasts utilize flat fares of 65, 75 and 100 Piasters in years 2007, 2012 and 2022, respectively (all being in constant terms).
Findings of the demand forecasting process confirm that the full segregation alternative will catalyze higher patronage than the partial segregation alternative. This differential decreases sharply from one third in year 2007 to 14 percent in year 2022. In absolute terms, daily ridership for the full segregation alternative is estimated at some 263,800 persons during year 2007, gradually increasing to 413,800 persons in year 2022 (Table 3.2.11).
Table 3.2.11 Supertram Line 1 Forecast Daily Passengers
Length Daily Total Riders by Alternative Year (km) Partial segregation Full segregation 2007 22 197,800 263,800 2012 22 217,900 272,600 2022 22 363,200 413,800
Source: JICA Study Team
In order to sufficiently cater the important future demand in Greater Cairo, the Supertram line 1 has been considered as a Light Rail Transit (LRT) system, based on tramway type rolling stock, with lower width and speed and a more attractive design.
(2) Passenger Flow during the Peak Period
The passenger flow during the peak period on the busiest section (one direction) is necessary to determine the required capacity of the Supertram system. Peak hour

CREATS: Phase II Final Report, Vol. III: CTA Transport Improvement Project in East Sector of Cairo Chapter 3: A NEW ROLE FOR THE HELIOPOLIS METRO
3 - 39
ridership for the fully segregated alternative is estimated at some 10,200 persons per direction during year 2007, gradually increasing to 15,400 persons in year 2022 (Table 3.2.12).
Table 3.2.12 Supertram Line 1 Forecast Peak Hour Passengers
Length Peak Hour Directional Riders by Alternative Year (km) Partial segregation Full segregation
2007 22 7,600 10,200 2012 22 7,400 9,400 2022 22 13,400 15,400
Source: JICA Study Team. Loadings are per direction. Composite directional activity in reasonable balance. Refer following page for discussion of temporal demand validation.
The relative year 2022 full segregation demand profile is typical to that of the other alternatives and years. In the inbound (Ring Road to Ramses) direction, the highest boarding total is noted at Ring Road Station, with an hourly boarding total of some 5,400 passengers. The highest alighting total is at Ramses Station, near 4,400 passengers per hour (Figure 3.2.18). In the outbound (Ramses to Ring Road), Ramses Station and Ring Road Station again emerge as highest activity points, with 4,800 and 6,900 movements, respectively (Figure 3.2.19).
-6,000
-5,000
-4,000
-3,000
-2,000
-1,000
0
1,000
2,000
3,000
4,000
5,000
6,000
Station
Num
ber
of P
eak
Hou
r Pa
ssen
gers
Boarding Passengers
Alighting Passengers
Data source: JICA Study Team
Maximum Alighting Volume: 4,400 Passengers
Maximum Boarding Volume: 5,400 Passengers
Total Directional Boardings:Peak Hour: 17,600Total Day: 195,000
Figure 3.2.18 Year 2022 Forecast Supertram Line 1 Ridership Peak Hour, Inbound Direction

CREATS: Phase II Final Report, Vol. III: CTA Transport Improvement Project in East Sector of Cairo Chapter 3: A NEW ROLE FOR THE HELIOPOLIS METRO
3 - 40
-7,000
-6,000
-5,000
-4,000
-3,000
-2,000
-1,000
0
1,000
2,000
3,000
4,000
5,000
6,000
7,000
Station
Num
ber
of P
eak
Hou
r Pa
ssen
gers
Boarding Passengers
Alighting Passengers
Data source: JICA Study Team
Maximum Alighting Volume: 6,900 Passengers
Maximum Boarding Volume: 4,800 Passengers
Total Directional Boardings:Peak Hour: 19,700Total Day: 218,800
Figure 3.2.19 Year 2022 Forecast Supertram Line 1 Ridership
Peak Hour, Outbound Direction
The station activity pattern is considerably different in year 2007. In case of the segregated alternative, outbound peak hour, Ramses Station emerges as the highest volume station with a boarding total of some 6,200 passengers per hour. Ebeid Street is seen as the highest volume alighting station with an hourly total of 2,200 persons (Figure 3.2.20).
There is also a differential noticeable between 2007 and 2012 forecast volumes. On a daily basis, volumes are very similar, whereas considerably more robust growth is noted to year 2022 (refer Table 3.2.11). On a peak basis, highest hourly directional volumes in year 2007 are shown to exceed those in year 2012 (refer Table 3.2.12). This pattern reflects the evolution of both socio-economic and transport infrastructure included within the framework of the master plan. One important point is the status of Metro Line 3. The master plan public transport network in year 2007 includes the initial stage of Line 3 from Ataba to Abbaseya, whereas the year 2012 network includes basically all of Line 3. Thus, over the 2007-2012 period, Supertram Line 1 exhibits considerable potential as a substitute for Metro Line 3 along their largely common alignment within the Ramses - Roxy/Heliopolis axis. The opening of additional segments of Metro Line 3 in 2012 catalyzes a shift to that mode for longer trips whose trip end lies within the eastern precinct of Line 3.
These changes in ridership lead to several conclusions:

CREATS: Phase II Final Report, Vol. III: CTA Transport Improvement Project in East Sector of Cairo Chapter 3: A NEW ROLE FOR THE HELIOPOLIS METRO
3 - 41
-4,000
-3,000
-2,000
-1,000
0
1,000
2,000
3,000
4,000
5,000
6,000
7,000
Station
Num
ber
of P
eak
Hou
r Pa
ssen
gers
Boarding Passengers
Alighting Passengers
Data source: JICA Study Team
Maximum Alighting Volume: 2,200 Passengers
Maximum Boarding Volume: 6,200 Passengers
Total Directional Boardings:Peak Hour: 12,000Total Day: 133,300
Figure 3.2.20 Year 2007 Forecast Supertram Line 1 Ridership Peak Hour, Outbound Direction
• In the near term, Supertram ridership patterns are likely to very much mirror the existing condition, that is, a heavy reliance on Ramses Station.
• Forecast ridership is sensitive to evolving socio-economic patterns and transport infrastructure within the Supertram catchment area.
• The Ring Road park-and-ride intermodal station has the potential to emerge as an important Supertram load point.
• New Cairo will assume increasing importance in terms of Supertram ridership as its population continues to expand from 160,000 in year 2007 to 272,000 in year 2012 and near three-quarters of a million persons by year 2022.
• The potential for extending Supertram Line 1 to New Cairo, under the proposed sponsorship of the MHUUC, appears, based on demand forecasts, to have considerable merit, particularly so during the second half of the planning period.
3.2.7 System Capacity Requirement
(1) Capacity
Conventional tramway rolling stock trains are generally made of articulated vehicles featuring one articulation (2 bodies) or two (3 bodies). They are in most cases fitted with driving cabs at both ends, which allows for reversible operation. Tramway vehicles can be coupled in order to vary the capacity of the whole train.
An LRT system such as the proposed Supertram line 1 is made of one or two trainsets. The train set composition during the peak period depends on (a) the required lines capacity and the operating headway, from which is calculated the number of cars per train, (b) the characteristics of the line in terms of distance
CREATS: Phase II Final Report, Vol. III: CTA Transport Improvement Project in East Sector of Cairo Chapter 3: A NEW ROLE FOR THE HELIOPOLIS METRO
3 - 42
between stations and longitudinal profile, which determine the total power to supply to the train, and (c) vehicle capacity.
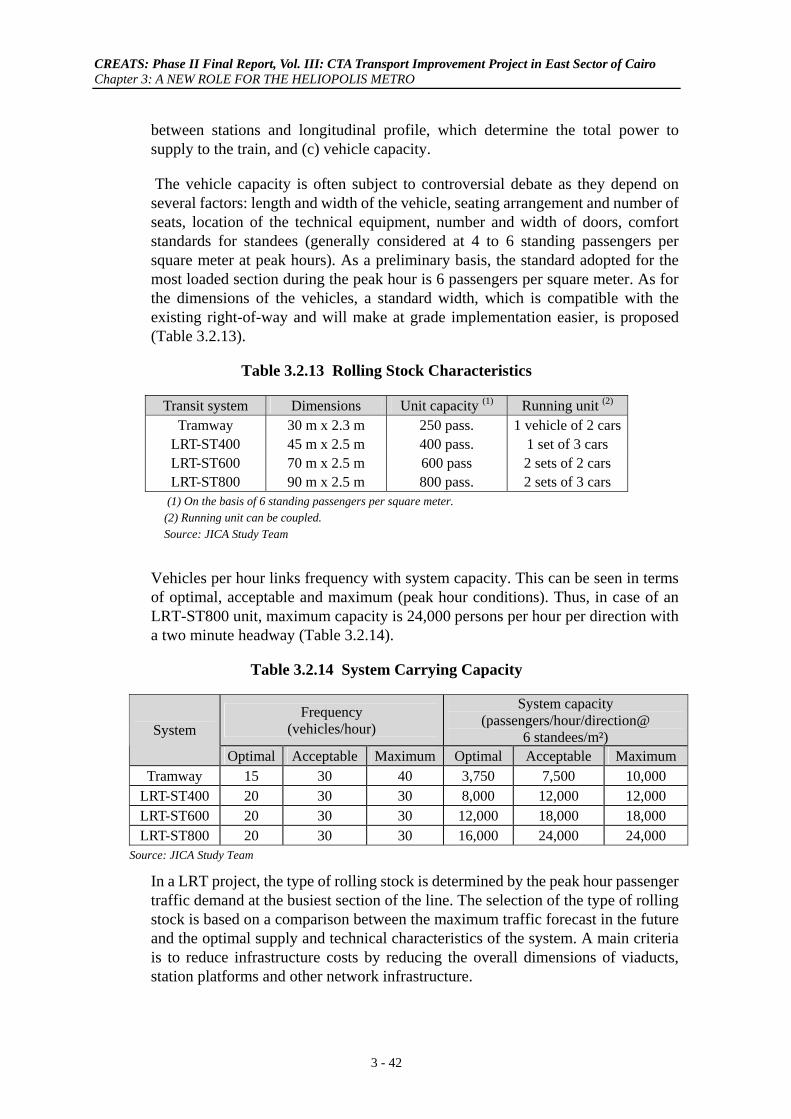
The vehicle capacity is often subject to controversial debate as they depend on several factors: length and width of the vehicle, seating arrangement and number of seats, location of the technical equipment, number and width of doors, comfort standards for standees (generally considered at 4 to 6 standing passengers per square meter at peak hours). As a preliminary basis, the standard adopted for the most loaded section during the peak hour is 6 passengers per square meter. As for the dimensions of the vehicles, a standard width, which is compatible with the existing right-of-way and will make at grade implementation easier, is proposed (Table 3.2.13).
Table 3.2.13 Rolling Stock Characteristics
Transit system Dimensions Unit capacity (1) Running unit (2)
Tramway 30 m x 2.3 m 250 pass. 1 vehicle of 2 cars LRT-ST400 45 m x 2.5 m 400 pass. 1 set of 3 cars LRT-ST600 70 m x 2.5 m 600 pass 2 sets of 2 cars LRT-ST800 90 m x 2.5 m 800 pass. 2 sets of 3 cars
(1) On the basis of 6 standing passengers per square meter. (2) Running unit can be coupled. Source: JICA Study Team
Vehicles per hour links frequency with system capacity. This can be seen in terms of optimal, acceptable and maximum (peak hour conditions). Thus, in case of an LRT-ST800 unit, maximum capacity is 24,000 persons per hour per direction with a two minute headway (Table 3.2.14).
Table 3.2.14 System Carrying Capacity
Frequency (vehicles/hour)
System capacity (passengers/hour/direction@
6 standees/m²) System
Optimal Acceptable Maximum Optimal Acceptable MaximumTramway 15 30 40 3,750 7,500 10,000
LRT-ST400 20 30 30 8,000 12,000 12,000 LRT-ST600 20 30 30 12,000 18,000 18,000 LRT-ST800 20 30 30 16,000 24,000 24,000
Source: JICA Study Team
In a LRT project, the type of rolling stock is determined by the peak hour passenger traffic demand at the busiest section of the line. The selection of the type of rolling stock is based on a comparison between the maximum traffic forecast in the future and the optimal supply and technical characteristics of the system. A main criteria is to reduce infrastructure costs by reducing the overall dimensions of viaducts, station platforms and other network infrastructure.

CREATS: Phase II Final Report, Vol. III: CTA Transport Improvement Project in East Sector of Cairo Chapter 3: A NEW ROLE FOR THE HELIOPOLIS METRO
3 - 43
As to the Supertram line 1, the estimated passengers flows suggest the most suitable type of rolling stock is the light rail vehicle with a capacity of 400 passengers for the partial segregation alternative (LRT-ST400) in 2012, extended to 600 passengers for both segregation alternatives in 2022 (LRT-ST600) (Figure 3.2.21 and Figure 3.2.22). This means also that the station platform length will vary from 45 to 60-70 meters.
The LRT-ST600 is selected in order to limit the volume of the rolling stock fleet and to be consistent with the long term expected demand.
0
2,000
4,000
6,000
8,000
10,000
12,000
14,000
16,000
18,000
20,000
Station
Num
ber
of P
eak
Hou
r Pa
ssen
gers
Data source: JICA Study Team
Maximum Capacity: LRT-ST 600
Maximum Capacity: LRT-ST 400
Figure 3.2.21 Year 2022 Forecast Supertram Line 1 Ridership
Line Loading, Peak Hour, Outbound Direction, Partial Segregation
0
2,000
4,000
6,000
8,000
10,000
12,000
14,000
16,000
18,000
20,000
Station
Num
ber
of P
eak
Hou
r Pa
ssen
gers
Data source: JICA Study Team
Maximum Capacity: LRT-ST 600
Maximum Capacity: LRT-ST 400
Figure 3.2.22 Year 2022 Forecast Supertram Line 1 Ridership
Line Loading, Peak Hour, Outbound Direction, Full Segregation

CREATS: Phase II Final Report, Vol. III: CTA Transport Improvement Project in East Sector of Cairo Chapter 3: A NEW ROLE FOR THE HELIOPOLIS METRO
3 - 44
(2) Commercial Fleet Calculation and Supply Characteristics
The required fleet for the Supertram line 1 is calculated on the basis of :
• the peak hour passenger flow on the busiest sections, • route length, • end-to-end travel time, • shunting time in terminals, • dwell time at stations, • and time at terminals reserved for possible delays.
In the previous section the following choices of rolling stock categories were identified:
• ST400 : Supertram with an average capacity of 400 passengers (assuming a peak load of 6 passengers/m2) and composed of 1 train set of 3 coaches with a catenary traction system.
• ST600 : Supertram with an average capacity of 600 passengers (assuming a peak load of 6 passengers/m2) and composed of 2 trains set of 2 coaches with a catenary traction system.
The Supertram's commercial average speed for the partial and full segregation alternatives is assumed to reach 28 km/h and 32 km/h respectively when considering :
• an average distance between stations of 1,200 meters, • a maximum speed of 70 km/h between stations, limited to 35 km/h and 45 km/h
in dense urbanized areas for the partial and full segregation alternatives respectively.
• good traffic management at crossings (partial segregation alternative) and the implementation of road bypasses under the Supertram line (full segregation alternative).
The basic operating characteristics and LRT ST-600 fleet requirements of the Supertram line 1 are shown in Table 3.2.15 for the years 2007, 2012 and 2022.
Table 3.2.15 Supertram Operating Characteristics
Year Supertram
Segregation Alternative
System Length (km)
Rolling Stock
(trains)
Minimum Headway (min/sec)
Annual Train Km (million)
Annual Car Km (million)
2007 Partial Full
22 km
25 28
4mn 40s 3mn 40s
2.55 2.90
10.20 11.60
2012 Partial Full
22 km
25 28
4mn 40s 3mn 40s
2.55 2.90
10.20 11.60
2022 Partial Full
22 km
43 43
2mn 40s 2mn 20s
4.12 4.80
16.48 19.20
Source: JICA Study Team

CREATS: Phase II Final Report, Vol. III: CTA Transport Improvement Project in East Sector of Cairo Chapter 3: A NEW ROLE FOR THE HELIOPOLIS METRO
3 - 45
The higher the operating speed the lower the number of trains required. The full segregation alternative, which is characterized by a higher ridership and higher operating speeds, requires a number of rolling stock close to that of the partial segregation alternatives.
3.3 FINANCIAL INDICATORS OF THE SUPERTRAM LINE 1 ALTERNATIVES
3.3.1 Operating Cost
The estimated annual operating cost of the Supertram line 1 is based on the current operating costs available for Cairo Metro lines 1 and 2, and similar foreign projects.
Available records confirm that recent operating cost of Cairo's tram network varies from roughly 1.4 to 1.7 LE per car kilometer (Table 3.3.1).
Table 3.3.1 Operating Cost of the Tram Network
Annual operating cost (million LE)
Annual cars x km (million)
Annual operating cost LE / car x km
CTA Tram 35.1 24.4 1.44
Heliopolis Metro 37.0 21.3 1.73 Source CTA Fiscal Year 2001 (Without interest and depreciation costs)
In case of Cairo's metro network, annual operating costs (excluding interest and depreciation) aggregated to some 125 million LE (Table 3.3.2).
Table 3.3.2 Operating Cost of the Cairo Metro Network
Operating cost Million LE Percent Wages 31.62 25
Operational Consumption 49.38 39 Maintenance Expenses 33.87 27 General Consumption 2.20 2
Miscellaneous 8.29 7 Total 125.36 100
Source CMO Fiscal Year 2001 (Without interest and depreciation costs)
On this basis, the metro's operating cost reached 1.58 LE per car-kilometer and 6.35 LE per train-km. These costs are low compared to the international costs observed on similar systems. The Paris subway RER- Line A operating cost is, for example, about 2 Euros per car-kilometer. In the United States, costs per train-kilometer for five major systems ranged from $7.28 to $9.69. The nature of the cost structure is also different, with wages and salaries accounting for 70 % of the Paris RER- Line A operating cost compared to 25 % of Cairo metro costs (excluding interest and depreciation). This differential is due to a higher European salary structure.

CREATS: Phase II Final Report, Vol. III: CTA Transport Improvement Project in East Sector of Cairo Chapter 3: A NEW ROLE FOR THE HELIOPOLIS METRO
3 - 46
Table 3.3.3 provides a detailed breakdown of typical European tram-LRT system operating costs in terms of constant year 2002 Euros per train kilometer. Major components are separated in order to synthesize European experience with expected Egyptian operating cost, using a series of factors which differentiate between domestic and foreign content. The result is an estimated operating cost for a ST-600 Supertram of about 2.84 year 2002 Euro per train kilometer, or 0.71 Euro per car kilometer.
Table 3.3.3 Estimated Operating Cost of Supertram ST-600 (Constant 2002 Euro)
Type of Rolling Stock ST-250 ST-600
Cost Item European
Cost
European Share
(Percent)
Local Factor
Egyptian Cost
Egyptian Cost
Egyptian Share
(Percent)Operating cost per veh-km
Staff 3.46 65.1 0.58 0.81 28.4 Operating 1.94 0.18 0.35 0.42 Maintenance 1.06 0.15 0.16 0.32 Structure 0.46 0.15 0.07 0.08 Energy 0.46 8.6 0.23 0.45 15.6 Vehicles 0.43 0.50 0.21 0.43 Building 0.03 0.50 0.02 0.02 Maintenance 0.47 8.8 0.24 0.35 12.2 Rolling stock 0.09 0.80 0.07 0.15 Track 0.14 0.50 0.07 0.08 Stations 0.11 0.20 0.02 0.03 Aerial cables 0.02 0.50 0.01 0.01 Sub-station 0.02 0.70 0.01 0.01 Systems 0.05 0.80 0.04 0.05 Green spaces 0.03 0.20 0.01 0.01 Other expenditures 0.24 4.6 0.05 0.05 1.9 Insurance 0.03 0.20 0.01 0.01 Marketing 0.08 0.10 0.01 0.01 Security-guard 0.05 0.15 0.01 0.01 Clothes 0.03 0.30 0.01 0.01 Other charges 0.06 0.30 0.02 0.02 Spare part 0.68 12.9 0.62 1.20 41.9 Rolling stocks 0.56 1.00 0.56 1.13 Fixed installation 0.12 0.50 0.06 0.07 Total 5.32 100.0 0.32 1.72 2.84 100.0 Source: JICA Study Team, also please refer section 3.9.3.
The estimated operating cost, which reaches about 14.3 LE per train kilometer and 3.58 LE per car kilometer, lies considerably above totals currently realized by the Metro. It is important to reinforce at this juncture that the approach to Supertram
CREATS: Phase II Final Report, Vol. III: CTA Transport Improvement Project in East Sector of Cairo Chapter 3: A NEW ROLE FOR THE HELIOPOLIS METRO
3 - 47
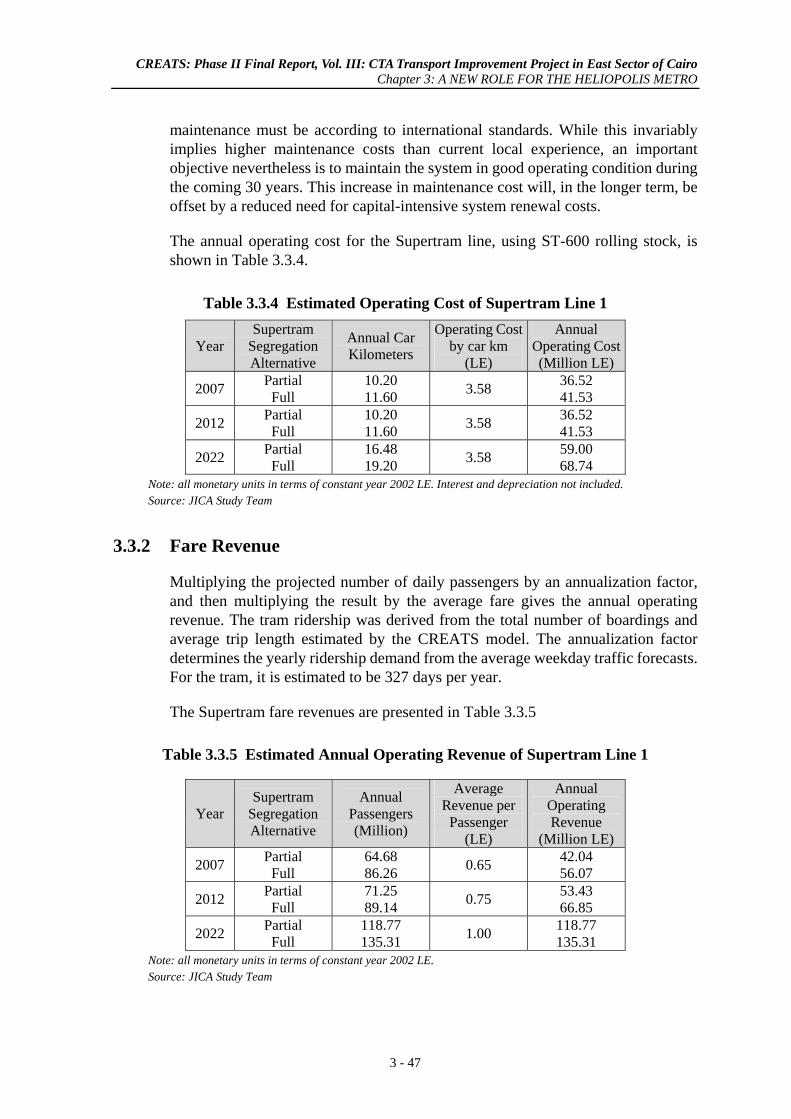
maintenance must be according to international standards. While this invariably implies higher maintenance costs than current local experience, an important objective nevertheless is to maintain the system in good operating condition during the coming 30 years. This increase in maintenance cost will, in the longer term, be offset by a reduced need for capital-intensive system renewal costs.
The annual operating cost for the Supertram line, using ST-600 rolling stock, is shown in Table 3.3.4.
Table 3.3.4 Estimated Operating Cost of Supertram Line 1
Year Supertram
Segregation Alternative
Annual Car Kilometers
Operating Cost by car km
(LE)
Annual Operating Cost (Million LE)
2007 Partial Full
10.20 11.60 3.58 36.52
41.53
2012 Partial Full
10.20 11.60 3.58 36.52
41.53
2022 Partial Full
16.48 19.20 3.58 59.00
68.74 Note: all monetary units in terms of constant year 2002 LE. Interest and depreciation not included. Source: JICA Study Team
3.3.2 Fare Revenue
Multiplying the projected number of daily passengers by an annualization factor, and then multiplying the result by the average fare gives the annual operating revenue. The tram ridership was derived from the total number of boardings and average trip length estimated by the CREATS model. The annualization factor determines the yearly ridership demand from the average weekday traffic forecasts. For the tram, it is estimated to be 327 days per year.
The Supertram fare revenues are presented in Table 3.3.5
Table 3.3.5 Estimated Annual Operating Revenue of Supertram Line 1
Year Supertram
Segregation Alternative
Annual Passengers (Million)
Average Revenue per
Passenger (LE)
Annual Operating Revenue
(Million LE)
2007 Partial Full
64.68 86.26 0.65 42.04
56.07
2012 Partial Full
71.25 89.14 0.75 53.43
66.85
2022 Partial Full
118.77 135.31 1.00 118.77
135.31 Note: all monetary units in terms of constant year 2002 LE. Source: JICA Study Team

CREATS: Phase II Final Report, Vol. III: CTA Transport Improvement Project in East Sector of Cairo Chapter 3: A NEW ROLE FOR THE HELIOPOLIS METRO
3 - 48
A comparison of operating costs with operating revenue suggests that the cost recovery of Supertram line 1 will reach the level observed on Cairo's metro network in the medium term, and exceed it in the longer term (Table 3.3.6). It is also of interest to note the gradual convergence of the recovery ratio in the post-2012 period; that is, following the opening of Metro Line 3.
Table 3.3.6 Estimated Supertram Line 1 Coverage
Year Supertram
Segregation Alternative
Annual Operating Revenue
(Million LE)
Annual Operating
Cost (Million LE)
Cost Recovery
Ratio
2007 Partial Full
42.04 56.07
36.52 41.53
1.15 1.35
2012 Partial Full
53.43 66.85
36.52 41.53
1.46 1.61
2022 Partial Full
118.77 135.31
59.00 68.74
2.01 1.97
Note: all monetary units in terms of constant year 2002 LE. Interest and depreciation not included. Source: JICA Study Team
3.3.3 Investment Cost
For the Supertram line 1, considered as a LRT system, the construction cost estimates include a variety of considerations.
• Land acquisition. No land acquisition is anticipated along the Supertram tracks as the right-of-way is already existing or the tracks are located within arterial roads. Only the new depot will require a land acquisition estimated to be 65,000 m².
• Civil engineering works. Cut-and-cover structures, preparation of guide way bed, street and highway modification. Generally, the primary costs associated with utilities relocation, site modification are the costs of site preparation, which includes embankments, cutting, cut and cover, preparation of guide way bed, street and crossing modification. In Cairo, these costs will be reduced due to the existence of the right-of-way from Ramses station to Madinet Nasr station, and within road right-of-way beyond. Nevertheless, the existing tram equipment and systems need to be removed (catenary, ballast, rail, substation) and replaced by new ones. Moreover, LRT/road intersections have to be reshaped or completely protected for the Supertram through the implementation of specific civil infrastructures, such as LRT/road elevated structures, road underpasses or equipped with specific traffic management signals. Infrastructure requirements for the partial and full segregation alternatives are presented in Tables 3.3.7 and 3.3.8, respectively.

CREATS: Phase II Final Report, Vol. III: CTA Transport Improvement Project in East Sector of Cairo Chapter 3: A NEW ROLE FOR THE HELIOPOLIS METRO
3 - 49
Table 3.3.7 Main Infrastructure Requirements for the Partial Segregation Alternative
Supertram Line Sections Road intersection Modification or infrastructure type
Ramses station to Heliopolis sporting
Club
Khalifa El Maamoon/Merghany Water infiltration
One road underpass or LRT elevated structure Draining utilities
Heliopolis sporting Club to Cairo
Stadium
Merghany / Khedr El Toony Khedr El Toony / Tayaran Khedr El Toony / Yoosef Abbas
One road underpass or LRT elevated structure Two grade intersection modification equipped with LRT traffic signals
Cairo Stadium to Madinet Nasr
Nasr Road / Yoosef Abbas Yoosef Abbas / Khalifa El Qaher Aly Ameen / Sheikh Mahmoud
Shaltoot Aly Ameen / Abbas El Aqqad Mostafa El Nahhas / Makram
Ebeid Major utility located under the
right-of-way between Makram Ebeid and Madinet Nasr Terminal
Six grade intersection modification equipped with LRT traffic signals One utilities relocation
Madinet Nasr to Ring Road.
Intersection with arterial roads
One grade intersection modification equipped with LRT traffic signals Site preparation and street refurbishing
Source: JICA Study Team
Table 3.3.8 Main Infrastructure Requirements for the Full Segregation Alternative
Supertram line Sections Road intersection Modification or infrastructure type
Ramses station to Heliopolis sporting
Club
Khalifa El Maamoon/Merghany Water infiltration
One road underpass or LRT elevated structure Draining utilities
Heliopolis sporting Club to Cairo
Stadium
Merghany / Khedr El Toony Khedr El Toony / Tayaran Khedr El Toony / Yoosef Abbas
Three road underpass or LRT elevated structures
Cairo Stadium to Madinet Nasr
Nasr Road / Yoosef Abbas Yoosef Abbas / Khalifa El Qaher Aly Ameen / Sheikh Mahmoud
Shaltoot Aly Ameen / Abbas El Aqqad Mostafa El Nahhas / Makram
Ebeid Major utility located under the
right-of-way between Makram Ebeid and Madinet Nasr Terminal
Five Road underpass or LRT elevated structures One utilities relocation
Madinet Nasr to Ring Road
Intersection with arterial roads
One road underpass or LRT elevated structure Site preparation and street refurbishing
Source: JICA Study Team

CREATS: Phase II Final Report, Vol. III: CTA Transport Improvement Project in East Sector of Cairo Chapter 3: A NEW ROLE FOR THE HELIOPOLIS METRO
3 - 50
• Guide way renovation and equipment. At-grade double track work, traction power, signaling, communication, ticketing, and stations. The cost of traction power is based on recent construction experiences with catenary systems. The new rail is assumed to be a welded rail embedded in pavement and laid on asphalt layer and concrete slab base in sections crossing pedestrian areas (Roxy, Madinet Nasr center). The remaining sections welded rail is laid on concrete ties and fastened by spring clips, with ballast, sub-ballast and other track materials.
• Stations are assumed to be relatively simple and economical in function and design. A platform length of 70 meters has been considered in order to accommodate up to six-car trains.
• Depot and workshop : capital cost of rehabilitation of tracks, maintenance, repair, energy and systems equipment.
• Rolling stock cost of the train units required to ensure service on each line. • Contingency and other costs : insurance, engineering and construction
management.
Investment costs for the partial and the full segregation alternatives of Supertram Line 1 are detailed in Table 3.3.9 for year 2007. As shown, the capital cost reaches 311 million US Dollars (2002 prices) for the partial segregation alternative and 404 million US Dollars for the full segregation alternative.
This cost will be re-estimated in more detail for the selected alternative and is presented in Section 3.5.

CREATS: Phase II Final Report, Vol. III: CTA Transport Improvement Project in East Sector of Cairo Chapter 3: A NEW ROLE FOR THE HELIOPOLIS METRO
3 - 51
Table 3.3.9 Supertram Line 1 Alternatives Investment Cost (Million Year 2002 US$)
Unit Partial segregation Full segregation Scale Cost Units Cost Units Cost
Site preparation 10.72 6.22 Utility works km 0.25 4 1.00 4 1.00 At grade intersection Unit 0.50 9 4.50 0 0.00 Removing of existing equipment km 0.12 17.62 2.11 17.62 2.11 Preparation of ST1 extension bed km 0.46 4.38 2.01 4.38 2.01 Street rebuilding km 0.25 4.38 1.10 4.38 1.10 Infrastructure km 23.07 93.07 Elevated structures or road underpass
km8.75 2 17.50 10 87.50
Station Unit 0.21 17 3.57 17 3.57 Terminal station Unit 1.00 2 2.00 2 2.00 LRT equipment work km 83.02 83.02 Rail equipment on ballast km 2.10 17 35.70 17 35.70 Rail equipment on concrete slab km 2.60 5 13.00 5 13.00 Catenary. electrification km 0.64 22 14.08 22 14.08 Energy km 0.60 22 13.20 22 13.20 Signaling km 0.32 22 7.04 22 7.04 Systems 28.38 28.38 Telecommunication km 0.52 22 11.44 22 11.44 Supervisory control km 0.49 22 10.78 22 10.78 Ticketing km 0.28 22 6.16 22 6.16 Depot and workshop 14.56 14.56 Building Unit 0.56 1 0.56 1 0.56 Workshop Unit 14.00 1 14.00 1 14.00 Rolling stock Unit 4 25 100.00 28 112.00 Subtotal 259.75 337.25 Engineering and construction management 11%
% 28.57 37.10
Contingency 8 % % 23.07 29.95 Grand Total 311.39 404.30
Source: JICA Study Team

CREATS: Phase II Final Report, Vol. III: CTA Transport Improvement Project in East Sector of Cairo Chapter 3: A NEW ROLE FOR THE HELIOPOLIS METRO
3 - 52
3.4 SUPERTRAM LINE 1 ALTERNATIVES COMPARISON
The comparison of the “bookend” technology alternatives involves two key steps. In the first instance, technical analyses provided key performance and cost indicators. These are presented in previous parts of this chapter, and summarized in Section 3.4.1 below. Secondly, a series of PowerPoint presentations were made to the Technical Working Group for Program B, the Steering Committee, the Higher Committee, key Ministerial representatives and providers of public transport services (in particular the CTA). A series of response guidelines emerged from these presentations, which provided a consensus approach to further progress. These guidelines are summarized in Section 3.4.2.
3.4.1 Summary of Technical Investigations
Activity streams for the two alternatives may be compared by interpolating between target years and summing over the entire 2007-2022 period (Table 3.4.1).
Table 3.4.1 Supertram Alternatives Comparison Composite period 2007-2022
Item Partial
Segregation Alternative
Full Segregation Alternative
Full Minus Partial
Million Passengers 1,381.65 1,671.54 289.89 Operating Cost (Million LE)(1) 707.96 814.14 106.18
Fare Revenue (Million LE) 1,180.08 1,413.79 233.71 Operating Cash Flow (Million LE) 472.12 599.66 127.54
Coverage Ratio 1.67 1.74 0.07 2007 Investment Cost (Million US$) 311.39 404.30 92.91 2022 Investment Cost (Mill US$)(2) 72.00 60.00 -12.00
Commercial Speed (km/hr) 28 32 4 Internal Rate of Return 2007-2037 6.5% 6.8% 0.3%
Construction Period (Years) 2 3 1
Visual Impact 2 elevated structures
10 elevated structures 8
Enforcement Vital Minimal * Road Traffic and Pedestrian Safety Higher Risk Less Risk *
Note: all monetary amounts in terms of constant year 2002 units. (1) Excluding depreciation and interest. (2) Additional rolling stock to absorb forecast year 2022 demand. Source: JICA Study Team
Preliminary assessments of the internal rates of return of the two alternatives are included in the table above. The results for various 2007 discount rates are shown in Figure 3.4.1. A public transport project should be viewed at a long term, so a project life of 30 years has been considered in order to account for the cash flows after 2022, where the benefits are at a maximum. As it can be seen, the full segregation option represents a slightly better investment in 2007 net present values. The curves show that the Supertram has a good financial basis compared to most other public transport projects, although the IRR is below the general level of the Egyptian
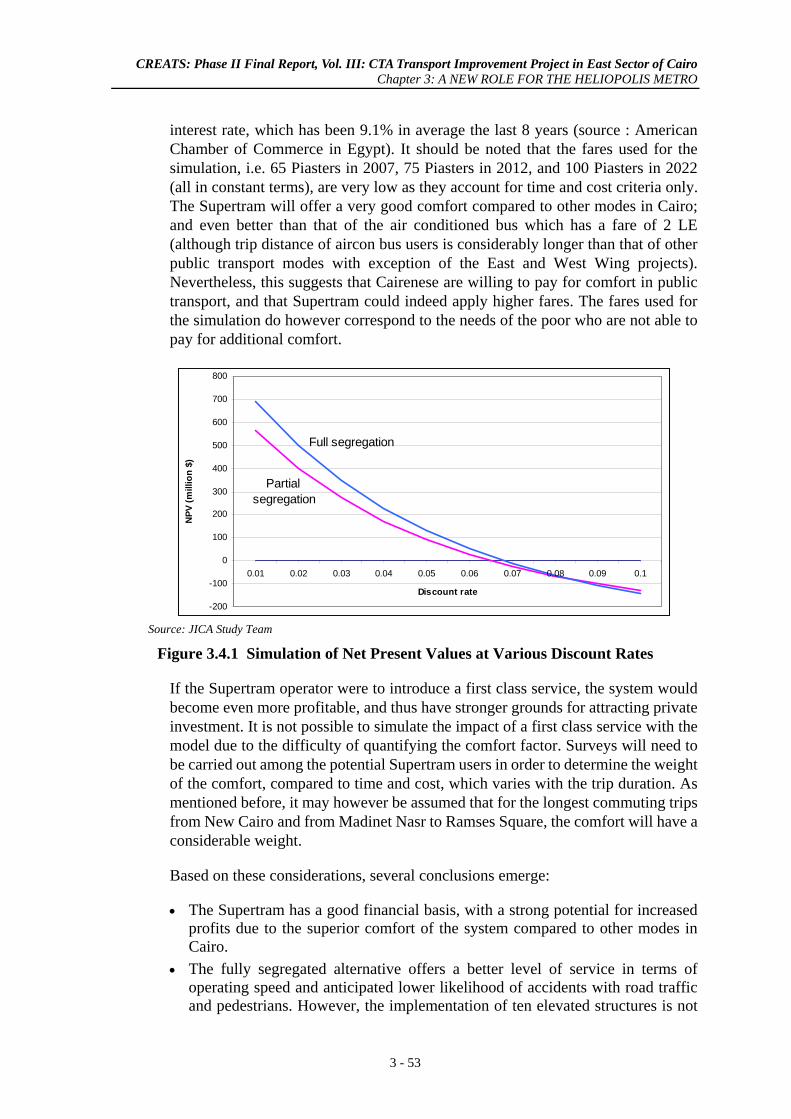
CREATS: Phase II Final Report, Vol. III: CTA Transport Improvement Project in East Sector of Cairo Chapter 3: A NEW ROLE FOR THE HELIOPOLIS METRO
3 - 53
interest rate, which has been 9.1% in average the last 8 years (source : American Chamber of Commerce in Egypt). It should be noted that the fares used for the simulation, i.e. 65 Piasters in 2007, 75 Piasters in 2012, and 100 Piasters in 2022 (all in constant terms), are very low as they account for time and cost criteria only. The Supertram will offer a very good comfort compared to other modes in Cairo; and even better than that of the air conditioned bus which has a fare of 2 LE (although trip distance of aircon bus users is considerably longer than that of other public transport modes with exception of the East and West Wing projects). Nevertheless, this suggests that Cairenese are willing to pay for comfort in public transport, and that Supertram could indeed apply higher fares. The fares used for the simulation do however correspond to the needs of the poor who are not able to pay for additional comfort.
-200
-100
0
100
200
300
400
500
600
700
800
0.01 0.02 0.03 0.04 0.05 0.06 0.07 0.08 0.09 0.1
Discount rate
NPV
(mill
ion
$)
Partial segregation
Full segregation
Source: JICA Study Team
Figure 3.4.1 Simulation of Net Present Values at Various Discount Rates
If the Supertram operator were to introduce a first class service, the system would become even more profitable, and thus have stronger grounds for attracting private investment. It is not possible to simulate the impact of a first class service with the model due to the difficulty of quantifying the comfort factor. Surveys will need to be carried out among the potential Supertram users in order to determine the weight of the comfort, compared to time and cost, which varies with the trip duration. As mentioned before, it may however be assumed that for the longest commuting trips from New Cairo and from Madinet Nasr to Ramses Square, the comfort will have a considerable weight.
Based on these considerations, several conclusions emerge:
• The Supertram has a good financial basis, with a strong potential for increased profits due to the superior comfort of the system compared to other modes in Cairo.
• The fully segregated alternative offers a better level of service in terms of operating speed and anticipated lower likelihood of accidents with road traffic and pedestrians. However, the implementation of ten elevated structures is not

CREATS: Phase II Final Report, Vol. III: CTA Transport Improvement Project in East Sector of Cairo Chapter 3: A NEW ROLE FOR THE HELIOPOLIS METRO
3 - 54
an absolute requirement for successful Supertram operation as confirmed in other cities in which urban LRT systems are operational.
• The partially segregated option is estimated to cost US$ 311 million, and the fully segregated option US$ 404 million, in terms of establishing the year 2007 system. The partially segregated option is therefore 93 million US dollars cheaper than the fully segregated option. A further outlay of US$ 72 million and $60 million is estimated for the partially and fully segregated options, respectively, to acquire sufficient rolling stock to meet anticipated year 2022 demand. The partially segregated option is therefore a composite 81 million US Dollars cheaper than the fully segregated option.
• The partially segregated option is expected to require less construction time. • The fully segregated option incurs higher aggregate operating costs (106.18
million LE) but also realizes higher aggregate fare revenue (233.71 million LE). Over the composite period the summed coverage ratio (income divided by cost) is nevertheless very similar in both cases: 1.67 and 1.74 for partial and full segregation, respectively. In 2007 net present values, the full segregation option represents a slightly better investment.
• The segregated alternative will generate higher ridership than the partially segregated alternative; forecasts suggest that while this differential will be higher during the early years of operations when usage is more modest, it will quickly decrease to some 14 percent by year 2022. The period average is 21 percent. However, investment costs to achieve the segregated alternative are some 30 percent above partial segregated alternative implementation cost. This casts doubt on the marginal efficiency of additional capital investment.
• The construction of the fully segregated alignment in an upscale urban area such as Heliopolis or Madinet Nasr will be visually intrusive, and likely to meet with environmental and social objections.
• It is absolutely essential that, under a partial segregated alternative, effective urban landscaping and on-going enforcement be applied at all signalized intersection to ensure that tram priority signalization is indeed respected and allowed to function to its full capabilities. In this regard, the compatibility of this option with the project of the Cairo Governorate to test new signaling systems in Mostafa El Nahhas street, will need to be investigated.
• While Supertram Line 1 is seen as an attractive option in terms of enhancing the mobility of Cairenes, it must be noted that Metro Line 3, as a critical project in terms of the CREATS Master Plan, is allocated a higher implementation priority than Supertram Line 1. The CREATS Master Plan considers Metro Line 3 a committed project, with completion of the Ataba-Abbaseya section by year 2007, an extension to Heliopolis by year 2012 and full completion thereafter. This staged implementation of Metro Line 3 is reflected in all Supertram Line 1 simulations involving the CREATS transport model.
From a broader perspective, it is logical to surmise at this early stage that government is likely to provide funding for infrastructure, using both domestic and foreign financing resources, while some form of franchise (either public or private) will emerge to actually operate the Supertram.

CREATS: Phase II Final Report, Vol. III: CTA Transport Improvement Project in East Sector of Cairo Chapter 3: A NEW ROLE FOR THE HELIOPOLIS METRO
3 - 55
In case of infrastructure provision, the government may choose to implement the fully segregated system if it feels that (a) the additional year 2007 system cost of US$ 93 million, or 539 million LE at the April, 2003 rate of exchange (plus accrued interest), are readily affordable, and (b) the best system from an operational point of view is desired. The system cost should not be ignored, as domestic funds for capital-intensive projects will likely be limited for the foreseeable future.
In case of the operating entity, forecasts suggest that positive cash flow can be achieved and will thus be an attractive option for private sector participation. However, the government, as owner, will likely insist on some form of concession fee. It may further be surmised that the government, if it were to choose to build the fully segregated option, may decide to recoup the differential cost in terms of a higher concession fee. However, while the operating cash flow is positive, it is not sufficient to offset this additional 539 million LE outlay required to realize the year 2007 system.
The main pros and cons of the segregation alternatives are summarized in Table 3.4.2.
Table 3.4.2 Summarized Preliminary Supertram Alternatives Comparison
Segregation Option Advantage Disadvantage
Partial
- Lower investment required - Provides incentive for creating
pedestrian zones within urban landscaping scheme
- Less car traffic - At grade stations provide good
access and interchange possibilities
- High risk for ensuring priority and safety at road intersections
- High impact on car traffic
Full
- Higher ridership and overall time gain for the cairenese
- Better return on investment - Better operations - Safer and more reliable service - Low impact on the car traffic
- Strong visual intrusion - Higher investment required - Elevated platforms make
interchanges and access more difficult, high construction cost
- Future road viaducts crossing the alignment not possible
Source: JICA Study Team
3.4.2 Consensus Guidelines for Further Action
A series of PowerPoint presentations containing results of technical investigations (as specified in Sections 3.1 through 3.3) were made to the Technical Working Group for Program B, the Steering Committee, the Higher Committee, key Ministerial representatives and providers of public transport services (in particular the CTA). These presentations were followed by robust, technical and productive discussions. Many valuable questions, clarifications and insights were exchanged.

CREATS: Phase II Final Report, Vol. III: CTA Transport Improvement Project in East Sector of Cairo Chapter 3: A NEW ROLE FOR THE HELIOPOLIS METRO
3 - 56
In summary, consensus was reached regarding several key strategic guidelines in terms of Supertram Line 1 hardware, software and humanware considerations. These are:
• While Supertram Line 1 is seen as an attractive option in terms of enhancing the mobility of Cairenes, it must be noted that Metro Line 3, as a critical project in terms of the CREATS Master Plan, is allocated a higher implementation priority than Supertram Line 1. The CREATS Master Plan considers Metro Line 3 a committed project, with completion of the Ataba-Abbaseya section by year 2007, an extension to Heliopolis by year 2012 and full completion thereafter.
• Public transport solutions must be derived on an intermodal basis. • A pronounced and strong preference for pursuing the segregated option; that is,
that the supertram should rely on maximized segregation from road traffic at major intersections along its alignment (hence, by implication, a minimum of reliance on enforcement).
• Supertram capital costs should be reasonable and sensitive to the current state of the Egyptian economy.
• Realistic financing options and sustainable operation of Supertram Line 1 are of crucial importance.
• The depot location for Supertram Line 1 should be sited near the eastern end of the line, in an area roughly between the terminus of the existing Madinet Nasr line and the Ring Road.
• Bus route restructuring in East Cairo must be viewed through the prism of existing realities. Bus feeder services should be compatible with the premium public transport status of the supertram; this implies new/expanded premium air conditioned bus services rather than adjustment of existing 25 Piaster routes.
• CTA restructuring must be cognizant of, and sensitive to, local norms and practices and likely be implemented in a step-wise manner.
• The involvement of international lending agencies or donors will likely require linked improvement of infrastructure, organization and personnel.
• The thrust and focus of feasibility reviews, as per the intent of Phase II, confirm that the supertram fulfills tangible needs and mobility requirements established within the framework of the CREATS Master Plan. It is, in addition, noted that Egypt is actively pursuing the hosting of the year 2010 football World Cup. Supertram Line 1 can thus also be seen as a strategic asset to assist Egypt in its World Cup bid and, of course, to provide transport to the flagship hosting site, Cairo Stadium, which sits adjacent to the alignment of Supertram Line 1.
These guidelines have been fully integrated into follow-on work tasks, including detailing of the preferred supertram concept contained in Sections 3.5 through 3.9 of this chapter.

CREATS: Phase II Final Report, Vol. III: CTA Transport Improvement Project in East Sector of Cairo Chapter 3: A NEW ROLE FOR THE HELIOPOLIS METRO
3 - 57
3.5 DETAILED ANALYSIS OF SUPERTRAM LINE 1
3.5.1 Alignment and Station Characteristics
(1) Alignment
The implementation of the Supertram system involves a combination of three route types :
• At grade on the existing tram axial or lateral right of way and on the new section between Madinet Nasr and the Ring Road (representative profile shown in Figure 3.5.1);
Source: JICA Study Team
Figure 3.5.1 Representative At-grade Cross Section
• On open cut on existing section between Demerdash and Heliopolis; and,
• On viaduct or cut and cover which are suitable when major conflicts at road intersections do not offer good conditions for operating the Supertram system at grade (representative section shown in Figure 3.5.2).
A modern tram formation or reserve generally requires a 5.9m to 6.8m guide way width in an open public area. In curves, the vehicles will require extra width for the overhang. A 6.0m to 6.5m guide way width includes space on both sides of the reserve for evacuating passengers in case of incidences.
A footpath of at least 0.9m is required for evacuations in fenced off areas, on viaducts, or in tunnels. This leads to a total width of 6.7m to 7.5m of the guide way on straight track sections. On the existing Supertram alignment, the guide way width is determined by two types of cross sections, at grade and cut, as shown in figure 3.5.3.

CREATS: Phase II Final Report, Vol. III: CTA Transport Improvement Project in East Sector of Cairo Chapter 3: A NEW ROLE FOR THE HELIOPOLIS METRO
3 - 58
Source: JICA Study Team
Figure 3.5.2 Representative Grade Separated Cross Sections
Source: JICA Study Team
Figure 3.5.3 Typical Existing Cross Sections along Supertram line 1
As it can be seen, the total space available for the guide way, excluding station platforms of 2m, is 6.3m and 7.1m for the at grade and cut sections respectively.
Thus means that the width of the rolling stock cannot exceed 2.40 m as the following rules have to be respected (Figures 3.5.4 and 3.5.5):
• Minimum of 20 cm space between the vehicles; • Minimum of 15cm overhang space on both sides of the vehicles; and, • Minimum of 35cm in total between the vehicles and the guide way limit.
6.3m2.0m 2.0m6.3m2.0m 2.0m
7.1m7.1m

CREATS: Phase II Final Report, Vol. III: CTA Transport Improvement Project in East Sector of Cairo Chapter 3: A NEW ROLE FOR THE HELIOPOLIS METRO
3 - 59
0,35 0,15 2,4 0,15 0,2 0,15 2,4 0,15 0,35
6,30
Car body Car body
Source: JICA Study Team
Figure 3.5.4 Typical Guide Way Width at Grade
0,75 0,15 2,4 0,15 0,2 0,15 2,4 0,15 0,757,10
Car body Car body
Source: JICA Study Team
Figure 3.5.5 Typical Guide Way Width at Cut
An underground Supertram has the advantage of not disrupting the car traffic in contrast to an at grade system. However, the construction cost of the underground system is four to five times higher, and the construction period during which the traffic is disturbed, is much longer. Further disadvantages of an underground system is that it takes about one year to construct each station, and along the entire route, piping and conduits for electricity water and other utilities will have to be rerouted.
In order to reduce the capital costs of the Supertram, the system has been designed at grade on the existing valuable right-of-way, while taking the appropriate measures to ensure a full segregation at road intersections so as to reach a target speed of 32km/h and to ensure the reliability and efficient operation of the system. It should be noted that the at-grade alignment can allow for complementary street beautifications as well as improved pedestrian and traffic management provisions.
Due to the higher acceptable slope of the car infrastructures of 8 percent compared to the 4 percent slope of the Supertram, road underpasses and flyovers can be designed half as long at the intersections. This will allow for an important further reduction of the capital cost, still maintaining the speed and reliability objectives of the Supertram. The weight of the Supertram rolling stock would also require reinforced infrastructures, in addition to a more powerful propulsion of the Supertram system in order to deal with the many slopes.
In the same time, the car traffic will be considerably improved at the most important intersections thanks to the new infrastructures which will allow for a free crossing

CREATS: Phase II Final Report, Vol. III: CTA Transport Improvement Project in East Sector of Cairo Chapter 3: A NEW ROLE FOR THE HELIOPOLIS METRO
3 - 60
with no traffic lights. Only the traffic at secondary intersections will be disrupted by the at-grade Supertram, however to a limited extent as presented in the following subsection.
(2) Intersections
Previous investigations have identified eleven major intersections within the Supertram alignment (Figure 3.5.6). Configurations for these intersections are listed in Table 3.5.1.
Source: JICA Study Team and CTA Figure 3.5.6 Primary Road Intersections within the Supertram Alignment

CREATS: Phase II Final Report, Vol. III: CTA Transport Improvement Project in East Sector of Cairo Chapter 3: A NEW ROLE FOR THE HELIOPOLIS METRO
3 - 61
Table 3.5.1 Configurations at Major Conflicting Intersections
Road intersection Road intersection type
Khalifa El Maamoon / Merghany
EL Margani / Khedr El Toony
Khedr El Toony / Tayaran
Khedr El Toony / Yoosef Abbas
Nasr Road / Yoosef Abbas
Yoosef Abbas / Khalifa El Qaher
Aly Ameen / Sheikh Mahmoud Shaltoot

CREATS: Phase II Final Report, Vol. III: CTA Transport Improvement Project in East Sector of Cairo Chapter 3: A NEW ROLE FOR THE HELIOPOLIS METRO
3 - 62
Road intersection Road intersection type
Aly Ameen / Abbas El Aqqad
Mostafa El Nahhas / Makram Ebeid
Mostafa El Nahhas / Hassan Maamoon
One major intersection with arterial road linking new Cairo
Source: JICA Study Team, refer Table 3.5.3 for Supertram alignment.
As mentioned, the primary road intersections will need provisions for new road infrastructures passing under or above the Supertram.
Secondary road intersections will need to be equipped with a traffic light system which gives absolute priority to the Supertram. A such system is feasible considering the limited traffic at the secondary intersections. Detectors should be installed at these traffic signals, so that when the Supertram approaches, the lights will automatically give it priority over other traffic. Traffic lights at a crossing point can be activated by the approach of the Supertram. In conjunction with 'box junction' markings, this ensures the Supertram can cross a road unimpeded.
The major conflicting intersections can be divided into three types as shown in Figure 3.5.7.

CREATS: Phase II Final Report, Vol. III: CTA Transport Improvement Project in East Sector of Cairo Chapter 3: A NEW ROLE FOR THE HELIOPOLIS METRO
3 - 63
Type 1 Type 2 Type 3
LRTLRTLRT
Source: JICA Study Team Figure 3.5.7 Classification of Conflicting Intersections
• Type 1 : the Supertram (shaded) crosses a multi-legged intersection;
• Type 2 : the Supertram turns in a multi-legged intersection; and,
• Type 3 : the Supertram turns in a T-intersection.
For each type of conflicting intersections, solutions are proposed as shown in Figure 3.5.8.
• Type 1 : one road artery goes under the intersection (with a 2 x 2-lane underpass); the left turn traffic on the other road artery is rerouted to u-turns on adjacent intersections.
• Type 2 : a single 2-lane underpass is sufficient for both road arteries; however in order to avoid costly superimposed underpasses, a 2-lane viaduct is proposed for one of the arteries. The left turn traffic of one road arteries is rerouted to an adjacent u-turn.
• Type 3 : for this type of crossing the configuration is identical to type 2.
In each case, the Supertram alignment remains at grade. These recommended solutions allow for :
• improving the Supertram’s commercial speed (no slope),
• implementing at grade stations at intersections, thus improving the access to the system,
• decreasing the project cost; while solving traffic problems at intersection which needed to be addressed in any case. These related costs should be deduced from the Supertram’s capital cost and ascribed to road projects.

CREATS: Phase II Final Report, Vol. III: CTA Transport Improvement Project in East Sector of Cairo Chapter 3: A NEW ROLE FOR THE HELIOPOLIS METRO
3 - 64
U - Turn
Type 1 Type 2 Type 3
LRT LRT LRT
Road on viaductRoad underground
Source: JICA Study Team
Figure 3.5.8 Recommended Solutions at the Conflicting Intersections
The primary intersections are classified in the following table 3.5.2 according the three identified intersection types.
In order to reduce the cost, road infrastructures are recommended only if the vehicle traffic flow justifies a such investment. The road amendments types are classified according to the traffic volumes as shown on table 3.5.3.
Table 3.5.2 Proposed Intersection Amendment by Volume of Vehicles
Vehicle flow / peak hour / direction Proposed road amendment Remarks
> 2800 Supertram infrastructure Flyover
1500 - 2800 Road infrastructure Underpass or flyover
300 - 1500 Traffic light management At grade with barrier
< 300 Intersection closed Traffic flow diverted to main intersections
Source: JICA Study Team
For the largest car traffic volumes, a Supertram viaduct is recommended as the rerouting of too many cars will lead to congestion by the adjacent u-turns.
The road infrastructure implementations are staged during the 2007-2022 period according to the road transit increase and Supertram headway decrease, as shown in Table 3.5.4.

CREATS: Phase II Final Report, Vol. III: CTA Transport Improvement Project in East Sector of Cairo Chapter 3: A NEW ROLE FOR THE HELIOPOLIS METRO
3 - 65
Table 3.5.3 Intersection Types along the Supertram Alignment
Supertram line Sections
Road intersection Road intersection type
Ramses station to Heliopolis sporting Club
Khalifa El Maamoon/Merghany
Heliopolis sporting Club to Cairo Stadium
Merghany / Ahmed Tayseer
Type 3
LRT
Khedr El Toony / Tayaran
LRT
Khedr El Toony / Yoosef Abbas Type 3
LRT
Cairo Stadium to Madinet Nasr
Nasr Road / Yoosef Abbas LRT
Yoosef Abbas / Khalifa El Qaher Type 3
LRT
Aly Ameen / Sheikh Mahmoud Shaltoot
LRT
Aly Ameen / Abbas El Aqqad
LRT
Mostafa El Nahhas / Makram Ebeid LRT
Mostafa El Nahhas / Hassan
Maamoon
LRT
Type 2
Madinet Nasr to Ring road.
One major intersection with arterial road linking new Cairo
LRT
Type 2
Source: JICA Study Team. Please refer Table 3.5.4 for enlarged view of intersections.
LRT
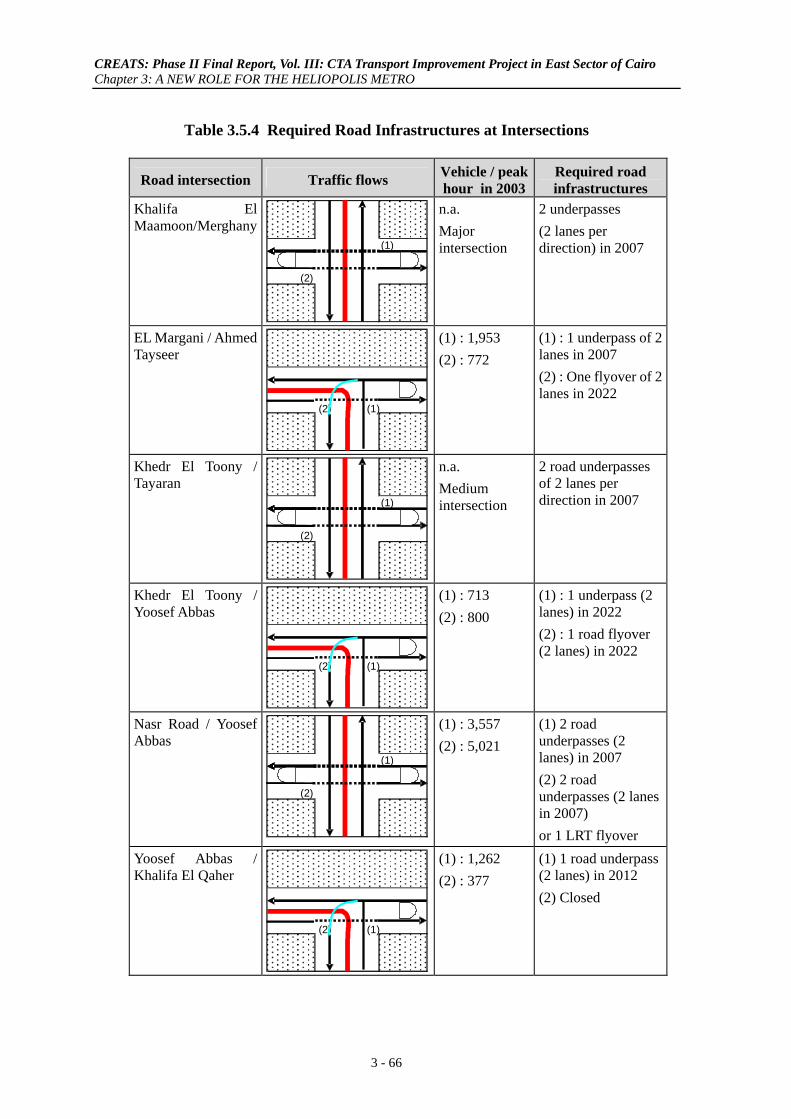
CREATS: Phase II Final Report, Vol. III: CTA Transport Improvement Project in East Sector of Cairo Chapter 3: A NEW ROLE FOR THE HELIOPOLIS METRO
3 - 66
Table 3.5.4 Required Road Infrastructures at Intersections
Road intersection Traffic flows Vehicle / peak hour in 2003
Required road infrastructures
Khalifa El Maamoon/Merghany
(2)
(1)
n.a. Major intersection
2 underpasses (2 lanes per direction) in 2007
EL Margani / Ahmed Tayseer
(2) (1)
(1) : 1,953 (2) : 772
(1) : 1 underpass of 2 lanes in 2007 (2) : One flyover of 2 lanes in 2022
Khedr El Toony / Tayaran
(2)
(1)
n.a. Medium intersection
2 road underpasses of 2 lanes per direction in 2007
Khedr El Toony / Yoosef Abbas
(2) (1)
(1) : 713 (2) : 800
(1) : 1 underpass (2 lanes) in 2022 (2) : 1 road flyover (2 lanes) in 2022
Nasr Road / Yoosef Abbas
(2)
(1)
(1) : 3,557 (2) : 5,021
(1) 2 road underpasses (2 lanes) in 2007 (2) 2 road underpasses (2 lanes in 2007) or 1 LRT flyover
Yoosef Abbas / Khalifa El Qaher
(2) (1)
(1) : 1,262 (2) : 377
(1) 1 road underpass (2 lanes) in 2012 (2) Closed

CREATS: Phase II Final Report, Vol. III: CTA Transport Improvement Project in East Sector of Cairo Chapter 3: A NEW ROLE FOR THE HELIOPOLIS METRO
3 - 67
Road intersection Traffic flows Vehicle / peak hour in 2003
Required road infrastructures
Aly Ameen / Sheikh Mahmoud Shaltoot
(2)
(1)
(1) : 1,830 (2) : 0 (closed)
(1) : 1 road underpass (2 lanes in 2007) (2) : remains closed
Aly Ameen / Abbas El Aqqad
(2)
(1)
(1) : 1,905 (2) : 1,287
(1) 1 road underpass (3 lanes) in 2007 (2) 1 road underpasses (2 lanes) in 2012
Mostafa El Nahhas / Makram Ebeid
(2)
(1)
(1) :1,211 (2) : 835
(1) 1 road underpass (2 lanes) in 2012 (2) 1 road underpasses (2 lanes) in 2022
Mostafa El Nahhas / Hassan Maamoon
(2)
(1)
(1) : 1,294 (2) : 1,666
(1) 1 road underpass (2 lanes) in 2012 (2) 1 road underpass (2 lanes) in 2007
One major intersection with arterial road to Ring Road
(2)
(1)
(1) : 1,649 (2) : 1,074
(1) 1 road underpass (2 lanes) in 2007 (2) 1 road underpass (2 lanes) in 2012
Access to the Depot
(1)
n.a.
(1) 1 road underpass (2 lanes) in 2007
Source: JICA Study Team

CREATS: Phase II Final Report, Vol. III: CTA Transport Improvement Project in East Sector of Cairo Chapter 3: A NEW ROLE FOR THE HELIOPOLIS METRO
3 - 68
On this basis, it is necessary to implement the following road infrastructures :
• 18 road underpasses (1 direction) • 2 road flyovers (1 direction) • 1 LRT flyover at Nasr Road / Yoosef Abbas intersection.
Table 3.5.5 Required Road Infrastructures from 2007 to 2022
Infrastructure type 2007 2012 2022
Road underpasses (2 lane, 1 direction) 10 5 3
Road Flyovers (2 lanes, 1 direction) - - 2
LRT flyover 2 - - Source: JICA Study Team
Traffic signal systems are proposed at secondary intersections as shown in figure 3.5.9. The total number of the secondary intersections is 13.
Source: JICA Study Team Figure 3.5.9 Road Intersection Points
(3) Stations
The Supertram line 1 alignment will include 19 stations and 1 major depot with a stabling yard.

CREATS: Phase II Final Report, Vol. III: CTA Transport Improvement Project in East Sector of Cairo Chapter 3: A NEW ROLE FOR THE HELIOPOLIS METRO
3 - 69
The stations will be spaced at distances between 0.58 and 2.32km and will be at-grade in order to reduce costs. The station locations are discussed in subsection 3.2.3, and were based on intermodal points and ensuring an optimal combination of speed and catchment of the system. The CREATS model has been used to verify the optimal station number in this regard and reveals that the number should lie within the range 18-22 stations. It should be noted that the recommended stations, excluding the intermodal points, are adaptable and that any change which does not make the station number fall out of the optimal 18-22 range, will not influence the ridership notably. Their final location should be fine-tuned according to local needs during the subsequent basic design stage of the project.
The construction of the Supertram stations, excluding Ramses and Ring Road Stations, can be extremely simple and cheap. A section of pavement about 70 to 90 meters long, raised to about 34 cm (one foot) above road level, is all that is required to give level access to a Supertram. The length of the platform will depend on the selected Supertram rolling stock. The platform could be central or lateral as shown in Figure 3.5.10.
Source: JICA Study Team
Figure 3.5.10 Typical Cross Sections of At-grade Station
The platform in central position has the advantage to consume less space, but its accessibility is constrained by the track intersection. Moreover the right of way width is more important at the entry and exit of the station.
An underslung station type is proposed for the Ring Road in order to maximize the access as well intermodal and commercial facilities at this important entrance to the system. The elevation will also allow for extending the line beyond the Ring Road to eventually serve New Cairo. A conceptual design for Ring Road stations is presented in Section 4.5 of this volume.

CREATS: Phase II Final Report, Vol. III: CTA Transport Improvement Project in East Sector of Cairo Chapter 3: A NEW ROLE FOR THE HELIOPOLIS METRO
3 - 70
Platforms will be between inbound and outbound tracks, which are called island platforms. These should be 6m wide and some 70 meters long to accommodate the equivalent of two 33m trains in the future. The central area of the platform will be covered with a roof, and the area of the concourse on the mezzanine f1oor should be 500-1,000m2 to accommodate various station facilities.
Source: JICA Study Team
Figure 3.5.11 Example of Underslung Station
The station will have escalators and stairs, and lifts for the handicapped or infirm, to provide access between ground and platform levels.
All stations will have facilities to provide access to disabled people. With the exception of the Ring Road and Ramses, the stations are planned to be purely functional and to serve as entry and exit points to the Supertram system.
Each station should be designed according to its function. They are divided into three functional types in relation to neighboring areas.
• CBD/Commercial Stations located where there are large numbers of commercial, business and governmental facilities. People will walk to such facilities from the stations. Parking lots are not necessary.
• Community Stations in medium-sized commercial and business areas or residential districts. Passengers use buses, minibuses, shared taxis, so bus stops or parking lots are required.
• Suburban Stations which function independently and serve as area transportation hubs. Surrounding areas normally have development potential, which should also be taken into consideration.
Due to the land availability and important ridership at the Ring Road station, the latter should be planned in the context of a suburban joint development scheme. The case for joint development in Cairo is presented in Section 3.5.7.

CREATS: Phase II Final Report, Vol. III: CTA Transport Improvement Project in East Sector of Cairo Chapter 3: A NEW ROLE FOR THE HELIOPOLIS METRO
3 - 71
(4) Urban integration of the At-grade Alignment
The at-grade alignments should include an urban design and landscaping which is convivial for pedestrian and inhabitants living in the corridor. Moreover, Cairo Governorate should draw advantage from the features of the Supertram in order to protect central business centers (Ramses, Roxy, Madinet Nasr) and historical areas from noise and air pollution, develop pedestrian areas, and make the areas more convivial, accessible and attractive for the local population and tourists. In this regard, with high-quality urban integration schemes, the Supertram could considerably boost the image of Cairo, and result in popular approval and an increase in tourism. The implementation of the at grade Supertram system is a red herring for obtaining new goals within urban landscaping schemes and traffic management which else would not have been possible.
Access to the stations should be pedestrian friendly. There is no need for the pedestrians to use an underpass or an overpass, except on the arterial road where the road traffic is not interrupted by pedestrian intersections.
Figure 3.5.12 Examples of Convivial Alignments

CREATS: Phase II Final Report, Vol. III: CTA Transport Improvement Project in East Sector of Cairo Chapter 3: A NEW ROLE FOR THE HELIOPOLIS METRO
3 - 72
Figure 3.5.13 illustrates how an urban corridor can take advantage of the at-grade Supertram to intensify, in the frame of joint development schemes, and to render the neighborhood more convivial thanks to urban landscaping.
Figure 3.5.13 Example of urban landscaping, before and after
(5) Hydrological Issues
The only hydrological concern along the alignment is the groundwater flooding on the section between Ain Shams and Mansheyet El Bakry stations. The fluctuation of ground water here corresponds to the water table of the Nile. The water is frequent and where this occurs, the stability of the soil during the construction period and operation must be ensured.
A good solution is to introduce a water pump system, which drains the water into the main sewage system. The water pump system should be equipped with one operational and two standby pumps. Operation of the pump system should be automatic, and the operational status should at all times be indicated on the service posts of the stations.

CREATS: Phase II Final Report, Vol. III: CTA Transport Improvement Project in East Sector of Cairo Chapter 3: A NEW ROLE FOR THE HELIOPOLIS METRO
3 - 73
3.5.2 Finalized Demand Forecast for Supertram Line 1
Preliminary forecasts previously presented in this chapter (please refer Section 3.2.6) were utilized during early stages (April, 2003) of Phase II investigations to evaluate differences between Supertram alternatives. The full capabilities of the CREATS transport model, which subdivides the Study Area into 525 traffic zones, were again applied following designation of a preferred alternative to refine the demand forecasting procedure (July, 2003). Model enhancements include (a) fine-tuning of the Supertram concept and technology as described in Section 3.5 of this chapter; (b) refinement of approximately 210 bus routes in East Cairo, to update route alignment and operating profiles to a mid-2003 condition, as described in Section 4.2 of Chapter 4; (c) refinement of the East Wing and West Wing concepts, as detailed in Volume II of this Final Report; (d) designation of a feeder bus network for Supertram Line 1, as described in Section 4.2 of Chapter 4; and, (e) inclusion of a shared taxi area licensing system as described in Section 4.3 of Chapter 4. The interested reader is urged to refer to the Phase I reporting series for further detail regarding the transport model, and to Attachment A, Volume IV, of this final report which describes enhancements of the model based on the requirements of Phase II investigations.
It is considered appropriate at this juncture to again present a synopsis of which elements of the CREATS networks are included in the forecasting procedure for Supertram Line 1 (Table 3.5.6). Also noted in that table are references to further detail for indicated modal content.
Metro Line 3 is considered the most critical element of the forecasting process given that Supertram Line 1 and Metro Line 3 essentially “compete” for ridership beginning modeling year 2012 within the Ramses-Roxy/Heliopolis corridor. In this regard, it is emphasized that Metro Line 3 is seen as a critical project in terms of the CREATS Master Plan, and is, within that plan, allocated a higher implementation priority than Supertram Line 1. The CREATS Master Plan considers Metro Line 3 a committed project, with completion of the Ataba-Abbaseya section by year 2007, an extension to Heliopolis by year 2012 and full line thereafter. This staged implementation of Metro Line 3 is reflected in all Supertram Line 1 simulations involving the CREATS transport model.
The network content depicted in Table 3.5.6 also includes strategic objectives such as shared taxi area licensing and designation of feeder buses. A series of demand forecasts were therefore developed to ascertain sensitivity of the major modes (including Supertram) to such concepts. Findings are presented in Subsection 1 below. A conservative approach was subsequently adopted in selecting the upper ranges of forecast demand for Supertram Line 1, as detailed in Subsections 2 through 4 below. The adopted modeling fares for Supertram Line 1 are 65, 75 and 100 Piaster flat fares for years 2007, 2012 and 2022, respectively, all in constant year terms. Further sensitivity tests were executed to ascertain the impact of alternative fare levels, fare systems and joint ticketing between Supertram and its

CREATS: Phase II Final Report, Vol. III: CTA Transport Improvement Project in East Sector of Cairo Chapter 3: A NEW ROLE FOR THE HELIOPOLIS METRO
3 - 74
feeder bus network. These are described in Section 4.4 of Chapter 4, Intermodal Issues (refer also Figure 3.2.17).
Table 3.5.6 Principal Network Elements of the Phase II CREATS Transport Model Forecasting of Years 2007, 2012 and 2022 Finalized Supertram Line 1 Demand
Description Implementation Status by Modeling Year
System Mode 2007 2012 2022
Public Transport
Urban Bus (refer this report,
Section 4.2)
Existing plus modified routes
in East Cairo
Existing plus modified routes
in East Cairo
Existing plus modified routes
in East Cairo
Shared Taxi
(refer this report, Section 4.3)
Area licensing Area licensing Area licensing
Supertram (LRT) (refer this report,
Section 3.5) Full line 1 Full line 1 Full line 1
Tram
(refer this report, Section 4.1)
Refined net Refined net Refined net
Metro Line 1 (refer
Phase I Final Report, Vol III, Section 4.8)
Extension to Ring Road
Extension to Ring Road
Extension to Ring Road
Metro Line 2 (refer
Phase I Final Report, Vol III, Section 4.8)
Extensions to Qalyob and
Moneeb
Extensions to Qalyob and
Moneeb
Extensions to Qalyob and
Moneeb
Metro Line 3 (refer
Phase I Final Report, Vol III, Section 4.8)
Ataba - Abbaseya Extension to Heliopolis Full line
Metro Line 4 (refer
Phase I Final Report, Vol III, Section 4.8)
None None Full line
Wings
(refer Volume II, Phase II Final Report)
East Wing and West Wing
East Wing and West Wing
East Wing and West Wing
Road Expressway (refer Phase I Final Report,
Vol III, Chapter 5) None
Partial (Expressways 3
and 4) Full network
Urban Roads (refer
Phase I Final Report, Vol III, Chapter 5)
As per CREATS Master Plan
As per CREATS Master Plan
As per CREATS Master Plan
Source: JICA Study Team. Refer also Attachment A, Volume IV for additional modeling detail.
(1) Modal Implications
The initial examination focuses on the impact of shared taxi area licensing. Forecasts for years 2007, 2012 and 2022 were developed with underlying networks

CREATS: Phase II Final Report, Vol. III: CTA Transport Improvement Project in East Sector of Cairo Chapter 3: A NEW ROLE FOR THE HELIOPOLIS METRO
3 - 75
including either the proposed shared taxi area licensing system, or the year 2001 shared taxi routes as included in the Phase I CREATS model. Several conclusions emerge (Table 3.5.7):
Table 3.5.7 Forecast Modal Demand Under Alternative Shared Taxi Systems
• The impact of area licensing upon the global relative public transport modal split is positive, if modest, ranging from two to six percent of ridership depending on year. In absolute terms, area licensing will increase public transport ridership by some 600,000 boardings per day in year 2007, and 400,000 boardings per day in year 2022. Thus, the issue of shared taxi area licensing largely involves a re-distribution of activity among the public transport modes as opposed to catalyzing major impact upon usage of private road vs. public transport modes. It is noted that, under all scenarios, forecast composite growth in public transport demand is maintained expanding from some 12.4 million daily boardings in year 2001 (the CREATS base year) to roughly 14, 18 and 20 million boardings per day in years 2007, 2012 and 2022, respectively. This confirms that, regardless of shared taxi strategy, the focus of urban transport improvements must remain the public modes which account for roughly two-thirds of all motorized trips within the study area.
• The least impacted system is the Wings, where ridership fluctuation due to shared taxi area licensing is minimal. This is expected, as Wings services represent longer-distance operations, where head-to-head competition with the predominately short-distance shared taxi mode is minimal. The metro also exhibits relatively modest impact due to the shared taxi strategies, largely due to the inherent speed and frequency advantages of this mode.
Year
Mode(1) 2001 Option 1(2) Option 2(2) Ratio 1/2 Option 1(2) Option 2(2) Ratio 1/2 Option 1(2) Option 2(2) Ratio 1/2Million Daily Boardings
Public Bus 3.484 6.410 3.928 1.63 5.825 3.532 1.65 4.456 2.309 1.93Tram, Supertram 0.175 0.400 0.343 1.17 0.439 0.368 1.19 0.651 0.553 1.18
Metro 2.061 3.552 3.401 1.04 5.709 5.302 1.08 9.449 8.989 1.05ENR 0.078 0.195 0.138 1.41 0.222 0.185 1.20 0.272 0.228 1.19
Wings * 0.117 0.112 1.04 0.294 0.293 1.00 0.919 0.910 1.01Subtotal Public 5.798 10.674 7.922 1.35 12.489 9.680 1.29 15.747 12.989 1.21
Private 6.627 3.981 6.104 0.65 4.323 6.228 0.69 4.655 7.018 0.66Total 12.425 14.655 14.026 1.04 16.812 15.908 1.06 20.402 20.007 1.02
Percent Boardings by ModePublic Bus 28.0 43.7 28.0 34.6 22.2 21.8 11.5
Tram, Supertram 1.4 2.7 2.4 2.6 2.3 3.2 2.8Metro 16.6 24.2 24.2 34.0 33.3 46.3 44.9ENR 0.6 1.3 1.0 1.3 1.2 1.3 1.1
Wings * 0.8 0.8 1.7 1.8 4.5 4.5Subtotal Public 46.7 72.8 56.5 74.3 60.8 77.2 64.9
Private 53.3 27.2 43.5 25.7 39.2 22.8 35.1Total 100.0 100.0 100.0 100.0 100.0 100.0 100.0
(1) Public bus includes CTA bus, CTA minibus, GCBC bus and airconditioned services. Nile ferry not included due to small ridership vis-à-vis other modes. Tram includes remaining portions of Heliopolis Metro not upgraded as part of Supertram Line 1, as well as CTA Tram. ENR includes suburban services. Wings includes East Wing and West Wing. Private includes shared taxi and cooperative minibuses. (2) Option 1: with area licensing for shared taxi, with optimized East Cairo bus services. Option 2: Without shared taxi area licensing, with optimized bus services. Source: JICA Study Team
Year 2007 Year 2012 Year 2022
Private refers to public transport operated by the private sector (shared taxi and cooperative minibuses).

CREATS: Phase II Final Report, Vol. III: CTA Transport Improvement Project in East Sector of Cairo Chapter 3: A NEW ROLE FOR THE HELIOPOLIS METRO
3 - 76
• The issue of shared taxi area licensing exerts its most dominant impact upon the public bus mode (all forms of services by CTA and GCBC). Whether or not licensing is implement exerts a tremendous impact upon public bus ridership. This is logical as, at present, shared taxis and bus directly compete in many corridors. As pointed out in Section 4.3, much of the shared taxi and bus route structures are duplicative. Thus, any major change in service provided by one mode can be expected to impact the other. At present (year 2001), shared taxis (and cooperative minibuses) recorded some 6.6 million boardings per day, while public buses accounted for a further 3.5 million boardings. If the shared taxi area licensing scheme is not implemented, the domination of the shared taxi is expected to continue accounting for some six to seven million boardings per day over the planning horizon. This is seen, for example, in the year 2007 case. Without area licensing, shared taxi and public bus activities account for 6.1 million and 3.9 million daily boardings, respectively. However, if shared taxi area licensing is implemented, the situation will largely reverse: shared taxi and public bus boardings total 6.4 million and 4.0 million persons, respectively. The main transformation has been longer distance trips, that is, those crossing a shared taxi area border, will divert to bus (or other modes).
• In terms of percent boardings, without area licensing, shared taxis will maintain a dominant position ranging from 53.3 percent in 2001 to 44, 39 and 35 percent in years 2007, 2012 and 2022, respectively. Only the metro gradually exceeds this modal total as Lines 3 and 4 come on-line during later stages of the planning horizon.
• As noted previously, under all scenarios, public transport demand shows continuing increase in future in absolute terms. In relative terms, this represents roughly a 15 percent increase from years 2001 to 2007, for example (Table 3.5.8). A further general trend can also be noted, regardless of shared taxi strategy. That is, strongest growth is recorded for the Wings (although, in absolute terms, ridership is more modest vis-à-vis the other major modes) beginning year 2007. One of the most consistent increases is recorded for the metro as Lines 3 and 4 are placed into service. Tram and Supertram also exhibit consistent expansion in demand. Only public bus activity is gradually eroded as higher-order systems are placed into operation.
• The impact upon tram and Supertram represents some 15 percent of modal ridership. Thus, while some longer shared taxi trips can be expected to divert to the Supertram subject to fare and time constraints, this diversion can be seen in a contributory rather than deterministic light in terms of the Supertram concept. The core issue for the shared taxi area licensing system is, instead, relationships with urban bus services.

CREATS: Phase II Final Report, Vol. III: CTA Transport Improvement Project in East Sector of Cairo Chapter 3: A NEW ROLE FOR THE HELIOPOLIS METRO
3 - 77
Table 3.5.8 Ratio of Forecast Modal Demand Under Alternative Shared Taxi Systems
The subsequent sensitivity analysis focused upon the actual impact of the potential feeder bus system for Supertram Line 1, as described in Section 4.2. Given the immediacy of any feeder bus concept, demand forecasting procedures addressed year 2007 conditions; that is, the potential opening year of Supertram Line 1. Several conclusions emerge (Table 3.5.9):
• The overall impact upon public transport ridership within the study area is negligible.
• In a more focused sense, tram and Supertram are (as expected) the main beneficiaries with ridership increasing from 389 thousand to 400 thousand boardings per day.
• The public bus system, in total, will decrease patronage by some 39,000 persons per day.
Mode(1) Option 1(2) Option 2(2) Option 1(2) Option 2(2) Option 1(2) Option 2(2)
Public Bus 1.840 1.127 0.909 0.899 0.765 0.654Tram, Supertram 2.286 1.960 1.098 1.073 1.483 1.503
Metro 1.723 1.650 1.607 1.559 1.655 1.695ENR 2.500 1.769 1.138 1.341 1.225 1.232
Wings * * 2.513 2.616 3.126 3.106Subtotal Public 1.841 1.366 1.170 1.222 1.261 1.342
Private 0.601 0.921 1.086 1.020 1.077 1.127Total 1.179 1.129 1.147 1.134 1.214 1.258
(1) Public bus includes CTA bus, CTA minibus, GCBC bus and airconditioned services. Nile ferry not included
due to small ridership vis-à-vis other modes. Tram includes remaining portions of Heliopolis Metro not upgraded
as part of Supertram Line 1, as well as CTA Tram. ENR includes suburban services. Wings include East Wing
and West Wing. Private includes shared taxi and cooperative minibuses.
(2) Option 1: with area licensing for shared taxi, with optimized East Cairo bus services. Option 2: Without shared
taxi area licensing, with optimized East Cairo bus services.
Source: JICA Study Team
Year 2007 to Year 2012 Year 2012 to Year 2022Year 2001 to Year 2007
and West Wing. Private refers to public transport operated by the private sector (shared taxi and cooperative minibus)

CREATS: Phase II Final Report, Vol. III: CTA Transport Improvement Project in East Sector of Cairo Chapter 3: A NEW ROLE FOR THE HELIOPOLIS METRO
3 - 78
Table 3.5.9 Forecast 2007 Modal Demand Under Alternative Feeder Bus Systems
Million Daily Boardings Mode(1) Option 1(2) Option 3(2)
Public Bus 6.410 6.449 Tram, Supertram 0.400 0.389
Metro 3.552 3.515 Other 0.312 0.295
Subtotal Public 10.674 10.648 Private 3.981 3.981 Total 14.655 14.629
(1) Please refer Tables 3.5.6 and 3.5.7 for modal clarifications. (2) Option 1 : with area licensing for shared taxis, with optimized bus services in East Cairo. Option 3 : with area licensing for shared taxis, without optimized bus services in East Cairo. Private refers to modes of public transport operated by the private sector (shared taxi, coop minibuses). Source: JICA Study Team.
Within East Cairo the implementation of a feeder bus concept appears to yield positive results (Table 3.5.10).
• Following implementation of proposed route changes, ridership on the potential feeder bus network increases by some two percent, from 555,500 to 564,100 boardings per day.
• Likewise, for the Supertram, ridership increases by some five percent due to optimization of the feeder bus network.
Table 3.5.10 Forecast 2007 Demand Under Alternative Feeder Bus Systems CTA East Cairo Systems
Daily Boardings Ratio CTA Mode
Option 1(1) Option 3(1) Opt 1/ Opt 3 Feeder Bus(2) 564,103 555,478 1.02
Supertram Line 1 283,645 271,415 1.05 Heliopolis Metro 42,646 43,769 0.97
Total 890,394 870,662 1.02 (1) Option 1 : with area licensing for shared taxis, with optimized bus services in East Cairo. Option 3 : with area licensing for shared taxis, without optimized bus services in East Cairo. (2) Please refer Section 4.2 for more detailed discussion of alternative feeder bus options. Source: JICA Study Team.
Thus, in summary, the implementation of a shared taxi licensing system and feeder bus network in East Cairo is seen as positive developments in terms of Supertram Line 1 patronage, and demand forecasts for years 2007, 2012 and 2022 developed accordingly.

CREATS: Phase II Final Report, Vol. III: CTA Transport Improvement Project in East Sector of Cairo Chapter 3: A NEW ROLE FOR THE HELIOPOLIS METRO
3 - 79
(2) Daily Trips Forecast on the Whole Line
Findings of the demand forecasting process confirm that the proposed configuration will catalyze strong future patronage. Daily ridership is estimated at some 283,600 persons during year 2007, gradually increasing to 430,300 persons in year 2022 (Table 3.5.11).
Table 3.5.11 Supertram Line 1 Forecast Daily Demand
Year Daily Passengers 2007 283,600 2012 292,100 2022 430,300
Source: JICA Study Team
In order to sufficiently cater for this important future demand, Supertram Line 1 has been considered as a Light Rail Transit (LRT) system, based on tramway type rolling stock, with lower width and speed and an attractive design.
(3) Passenger Flow during the Peak Period
The passenger flow during the peak period on the busiest section (one direction) is necessary to determine the required capacity of the Supertram system. Peak hour ridership is estimated at some 9,500 persons per direction during year 2007, gradually increasing to 15,500 persons in year 2022 (Table 3.5.12).
Table 3.5.12 Supertram Line 1 Forecast Hourly Demand
Year Peak Hour Directional Passengers 2007 9,500 2012 9,400 2022 15,500
Source: JICA Study Team. Loadings are per direction. Composite directional demand in reasonable balance.
Volumes in years 2007 and 2012 are very similar, whereas considerably more robust growth is noted to year 2022. This pattern reflects the evolution of both socio-economic and transport infrastructure included within the framework of the master plan. One important point is the status of Metro Line 3. The master plan public transport network in year 2007 includes the initial stage of Line 3 from Ataba to Abbaseya, whereas the year 2012 network includes an extension to Heliopolis. Thus, over the 2007-2012 period, Supertram Line 1 exhibits considerable potential as a substitute for Metro Line 3 along their largely common alignment within the Ramses - Roxy/Heliopolis axis. Conversely, beginning year 2012, Metro Line 3 and Supertram Line 1 will essentially “compete” for ridership within the same corridor. This, in 2012, catalyzes a shift to the Metro for longer journeys whose trip end lies within the eastern precinct of Line 3.

CREATS: Phase II Final Report, Vol. III: CTA Transport Improvement Project in East Sector of Cairo Chapter 3: A NEW ROLE FOR THE HELIOPOLIS METRO
3 - 80
The years 2007, 2012 and 2022 directional (inbound, outbound) demand, stratified by passengers boarding and alighting at each supertram station, is depicted in Figures 3.5.14 through 3.5.19. These depictions illustrate both the changing levels of demand, plus a gradual reorientation of demand. As an example, in year 2007, Ramses Station emerges as the highest volume station. In the outbound (Ramses to Ring Road) direction, for example, some 8,200 passengers board and alight at this location. Ghamra, Marwa City and Cairo Stadium stations emerge as strong demand contributors (refer Figures 3.5.14 and 3.5.15). The year 2022 demand profile has changed considerably. Ramses and Ring Road Stations, the supertram terminus points, have emerged as the heaviest load points. In the inbound direction, 8,800 hourly passengers board at Ring Road Stations, while 6,900 passengers alight at Ramses Station. The patterns is largely reversed in the outbound direction (refer Figures 3.5.18 and 3.5.19). Thus, year 2007 Supertram activity largely mirrors existing conditions being pronounced in the central and western precincts, whereas in the longer-term future, as Madinet Nasr and New Cairo matures, activity will clearly shift to the eastern precincts, in particular Ring Road station.
These changes in ridership lead to several conclusions:
• In the near term, Supertram ridership patterns are likely to very much mirror the existing condition, that is, a heavy reliance on Ramses Station.
• Forecast ridership is sensitive to evolving socio-economic patterns and transport infrastructure within the Supertram catchment area, with Metro Line 3 playing a particular role in this regard.
• The Ring Road park-and-ride intermodal station has the potential to emerge as an important Supertram load point.
• New Cairo will assume increasing importance in terms of Supertram ridership as its population continues to expand from 160,000 in year 2007 to 272,000 in year 2012 and near three-quarters of a million persons by year 2022.
• The potential for extending Supertram Line 1 to New Cairo, under the proposed sponsorship of the MHUUC, appears, based on demand forecasts, to have considerable merit, particularly so during the second half of the planning period.

CREATS: Phase II Final Report, Vol. III: CTA Transport Improvement Project in East Sector of Cairo Chapter 3: A NEW ROLE FOR THE HELIOPOLIS METRO
3 - 81
-4,000
-3,000
-2,000
-1,000
0
1,000
2,000
3,000
4,000
5,000
6,000
7,000
8,000
9,000
Station
Num
ber
of P
eak
Hou
r Pa
ssen
gers
Boarding Passengers
Alighting Passengers
Data source: JICA Study Team
Maximum Alighting Volume: 1,300 Passengers
Maximum Boarding Volume: 8,200 Passengers
Total Directional Boardings:Peak Hour: 12,700Total Day: 140,900
Figure 3.5.14 Year 2007 Forecast Supertram Line 1 Ridership
Peak Hour, Outbound Direction
-9,000
-8,000
-7,000
-6,000
-5,000
-4,000
-3,000
-2,000
-1,000
0
1,000
2,000
3,000
4,000
Station
Num
ber
of P
eak
Hou
r Pa
ssen
gers
Boarding Passengers
Alighting Passengers
Data source: JICA Study Team
Maximum Alighting Volume: 8,200 Passengers
Maximum Boarding Volume: 1,300 Passengers
Total Directional Boardings:Peak Hour: 12,900Total Day: 142,800
Figure 3.5.15 Year 2007 Forecast Supertram Line 1 Ridership Peak Hour, Inbound Direction

CREATS: Phase II Final Report, Vol. III: CTA Transport Improvement Project in East Sector of Cairo Chapter 3: A NEW ROLE FOR THE HELIOPOLIS METRO
3 - 82
-4,000
-3,000
-2,000
-1,000
0
1,000
2,000
3,000
4,000
5,000
6,000
7,000
8,000
Station
Num
ber
of P
eak
Hou
r Pa
ssen
gers
Boarding Passengers
Alighting Passengers
Data source: JICA Study Team
Maximum Alighting Volume: 2,800 Passengers
Maximum Boarding Volume: 6,600 Passengers
Total Directional Boardings:Peak Hour: 12,400Total Day: 138,100
Figure 3.5.16 Year 2012 Forecast Supertram Line 1 Ridership
Peak Hour, Outbound Direction
-9,000
-8,000
-7,000
-6,000
-5,000
-4,000
-3,000
-2,000
-1,000
0
1,000
2,000
3,000
4,000
Station
Num
ber
of P
eak
Hou
r Pa
ssen
gers
Boarding Passengers
Alighting Passengers
Data source: JICA Study Team
Maximum Alighting Volume: 7,500 Passengers
Maximum Boarding Volume: 2,800 Passengers
Total Directional Boardings:Peak Hour: 13,900Total Day: 154,100
Figure 3.5.17 Year 2012 Forecast Supertram Line 1 Ridership Peak Hour, Inbound Direction

CREATS: Phase II Final Report, Vol. III: CTA Transport Improvement Project in East Sector of Cairo Chapter 3: A NEW ROLE FOR THE HELIOPOLIS METRO
3 - 83
-9,000-8,000-7,000-6,000-5,000-4,000-3,000-2,000-1,000
01,0002,0003,0004,0005,0006,0007,0008,000
Station
Num
ber
of P
eak
Hou
r Pa
ssen
gers
Boarding Passengers
Alighting Passengers
Data source: JICA Study Team
Maximum Alighting Volume: 8,300 Passengers
Maximum Boarding Volume: 6,700 Passengers
Total Directional Boardings:Peak Hour: 19,300Total Day: 214,400
Figure 3.5.18 Year 2022 Forecast Supertram Line 1 Ridership
Peak Hour, Outbound Direction
-8,000-7,000-6,000-5,000-4,000-3,000
-2,000-1,000
01,0002,0003,0004,0005,0006,0007,0008,0009,000
Station
Num
ber
of P
eak
Hou
r Pa
ssen
gers
Boarding Passengers
Alighting Passengers
Data source: JICA Study Team
Maximum Alighting Volume: 6,900 Passengers
Maximum Boarding Volume: 8,800 Passengers
Total Directional Boardings:Peak Hour: 19,500Total Day: 216,000
Figure 3.5.19 Year 2022 Forecast Supertram Line 1 Ridership Peak Hour, Inbound Direction

CREATS: Phase II Final Report, Vol. III: CTA Transport Improvement Project in East Sector of Cairo Chapter 3: A NEW ROLE FOR THE HELIOPOLIS METRO
3 - 84
(4) Cumulative Line Loadings
The cumulative summation of boarding and alighting directional demand yields a use profile and identifies points of maximum passenger accumulation. In year 2007, peak line accumulation approaches 10,000 passengers per hour per direction, which, in accordance with station activity, is focused on the western precinct of the line (Figure 3.5.20). In year 2012, maximum cumulative demand is similar to year 2007 (with Metro Line 3 being a strong contributor to this pattern), however, the overall profile has begun to migrate toward the western parts of Supertram Line 1 due to shifts in boarding and alighting activities (Figure 3.5.21). Conversely, during year 2022, activity is more balanced and now approaches 16,000 passengers per hour per direction in the central part of the system (Figure 3.5.22).
Supertram system and capacity considerations are presented in subsequent sections of this chapter. As a preliminary indicator, it is of interest to relate forecast demand to likely required LRT capacity. Peak hour directional peak ridership for years 2007, 2012 and 2022 was therefore extrapolated to intermediate years and compared to generic LRT capacities (Figure 3.5.23). Findings confirm:
• An LRT capable of carrying near 600 persons will be required for the system.
• The demand (peak directional accumulation) between 2007 and 2012 is shown as being very similar. As previously noted, this is due to the implementation schedule of Metro Line 3 slated to open within the Ramses-Roxy/Heliopolis area in 2012. Thus, during intermediate years prior to 2012, demand on Supertram Line 1 may actually already approach a need for full 600 capacity units. This will particularly be so if Metro Line 3 realization is delayed.
• Given that rolling stock is anticipated to be used, with proper maintenance, over the next two to three decades, LRT units with a capacity of near 600 persons (ST-600) should be the initial choice, with modular flexibility preferable during early years. The exact rolling stock capacity is fine-tuned in the subsequent section.

CREATS: Phase II Final Report, Vol. III: CTA Transport Improvement Project in East Sector of Cairo Chapter 3: A NEW ROLE FOR THE HELIOPOLIS METRO
3 - 85
0
2,000
4,000
6,000
8,000
10,000
12,000
14,000
Station
Num
ber
of P
eak
Hou
r Pa
ssen
gers
Inbound
Outbound
Data source: JICA Study Team
Figure 3.5.20 Year 2007 Forecast Supertram Line 1 Peak Hour Line Loading
0
2,000
4,000
6,000
8,000
10,000
12,000
14,000
Station
Num
ber
of P
eak
Hou
r Pa
ssen
gers
Inbound
Oubound
Data source: JICA Study Team
Figure 3.5.21 Year 2012 Forecast Supertram Line 1 Peak Hour Line Loading

CREATS: Phase II Final Report, Vol. III: CTA Transport Improvement Project in East Sector of Cairo Chapter 3: A NEW ROLE FOR THE HELIOPOLIS METRO
3 - 86
0
2,000
4,000
6,000
8,000
10,000
12,000
14,000
16,000
18,000
20,000
Station
Num
ber
of P
eak
Hou
r Pa
ssen
gers
Inbound
Oubound
Data source: JICA Study Team
Figure 3.5.22 Year 2022 Forecast Supertram Line 1 Peak Hour Line Loading
0
2,000
4,000
6,000
8,000
10,000
12,000
14,000
16,000
18,000
20,000
Year
Num
ber
of D
irec
tiona
l Pea
k H
our
Pass
enge
rs
Data source: JICA Study Team
Maximum Capacity: LRT-ST 600
Maximum Capacity: LRT-ST 400 and Optimal Capacity: LRT-ST 600
Optimal Capacity: LRT-ST 400
Figure 3.5.23 Supertram Peak Hour Directional Demand And LRT Capacities

CREATS: Phase II Final Report, Vol. III: CTA Transport Improvement Project in East Sector of Cairo Chapter 3: A NEW ROLE FOR THE HELIOPOLIS METRO
3 - 87
3.5.3 System Selection
(1) Rolling stock
Vehicles could be twin-carriage, single articulated, three-bogie, steel-wheeled, air-conditioned, manually-controlled light rail vehicles (LRVs), each with a carrying capacity of 144 passengers (normal load) and 216 passengers (peak load). The maximum length of the train in 2022 could comprise two train sets of 30m or four cars, though a smaller number can be used to suit traffic conditions (Table 3.5.13).
Table 3.5.13 Example of Supertram Train Set Data
Item Data Length 30,000 mm Width 2,400 mm Max. Speed 70 km/h Minimum curve radius 18 m Maximum gradient 7% % low floor 70% Seated Passengers 64 Standees 144 (4 pass/m²)
One vehicle can run by itself but the trains are composed of 2-4 vehicles. Traction motors are 3 phase asynchronous AC motor and are controlled by the inverter system with regenerative braking system.Vehicle manufacturers may deliver low-price standard modular type vehicles as well as more expensive fully customized vehicles.
The size of the Supertram vehicles is the prime factor for determining the overall dimensions of right-of-way width, station platforms lengths, and other network infrastructure. The vehicle size is determined according to the type and configuration of the cars selected for the network, and is based on the projected peak capacity requirements of the system.
(2) Vehicle Capacity
Modern LRT systems are generally consist of one, two or three articulated train sets. They are in most cases fitted with driving cabs at both ends, which allows for reversible operation.
The train set composition at the peak period depends on the capacity to be provided, from which is calculated the number of cars per train, and the characteristics of the line in terms of distance between stations and longitudinal profile which dictate the

CREATS: Phase II Final Report, Vol. III: CTA Transport Improvement Project in East Sector of Cairo Chapter 3: A NEW ROLE FOR THE HELIOPOLIS METRO
3 - 88
total power to implement on the train. A train-set can be extended by adding car elements or coupled to match the growing demand.
A new type of rolling stock has emerged on the market consisting of “modules” instead of the traditional cars. The modules are smaller and can be coupled to form one single body. This increases the flexibility of the rolling stock, makes it lighter and thus cheaper (Figure 3.5.24).
Figure 3.5.24 Example of LRV Extended from 5 to 7 Modules
The capacity of the rolling stock is often subject to controversial debate as many parameters are involved: length and width of the vehicle, seating arrangement and number of seats, number of driver cabs, location of the technical equipment, number and width of doors, comfort standards for standees (generally considered between 4 and 6 standing passengers per square meters during peak hours).
• Train Composition. It is reasonable to adjust the length of a train by increasing or decreasing the number of articulated cars. To do this, however cars shall be coupled or decoupled which involves the risk of accident or injury and man-power. Trains therefore could be composed of two articulated cars as a fixed unit for the first phase, and fixed units coupled when the transport demand requires it.
• Driver's Cabin. It is planned that each train be equipped with two driver's cabins. If possible, however one-cab cars would be desirable because it would reduce manufacturing and maintenance costs and reduce the amount of devices subject to failure.
• Car Width. To increase the transport capacity, either passenger capacity per train or train frequency per hour must be raised. To increase passenger capacity per train, either passenger capacity per car or the number of cars must be raised. Increasing car width can increase passenger capacity per car. Increasing car width presents no difficult problems from the viewpoint of car structure and manufacturing costs. Therefore, it is advantageous to increase the passenger capacity by increasing car width, except when constraints such as tunnel width are present as in the case of subways.
• Car Directionality. As the track layout of vehicle depot allows reversal of car direction, cars shall be able to run on the main line in either direction. Systems

CREATS: Phase II Final Report, Vol. III: CTA Transport Improvement Project in East Sector of Cairo Chapter 3: A NEW ROLE FOR THE HELIOPOLIS METRO
3 - 89
for security, telecommunication and information transmission shall be designed accordingly.
• Crowding. As a basis in this study, the standard adopted for the most loaded interstation segment during the peak hour is 6 passengers per square meter.
The type of rolling stock is determined by the peak hour passenger traffic demand on the most loaded section of the line. The selection of the type of rolling stock is a comparison between the maximum traffic forecast in the future and the optimal possibility offered by the system. The selection is also based on reducing the overall dimensions of viaducts, station platforms and other network infrastructure.
As shown previously, the maximum passengers flow for the Supertram is 15,500 pax/hour/direction during the peak hour. The train width is limited by the open cut structure on the section between Ain Shams and Mansheyet El Bakry stations, and cannot exceed 2.40 meters.
The capacity of a transit mode depends on both the unit capacity of the vehicles and the rate at which they follow each other on the infrastructure. For a good operation of the system, the minimum headway cannot be less than 2 minutes.
A type of rolling stock which offers low station platform lengths combined with a reasonable headway, consists of two train units of 33m length, each 2.4 m wide. The corresponding capacity is 560 persons, and the platform length is 64 to 66 meters (Table 3.5.14).
Table 3.5.14 LRV Characteristics Dimensions (1 train set)
(m)
Unit capacity(1)
Offered Capacity(1)
Running unit(2)
Platform length (m)
Headway (peak period)(3)
(min, sec) 43 x 2.40 374 374 1 train sets 43 m 1,27 44 x 2.40 374 748 2 train sets 88 m 2,55 33 x 2.40 281 561 2 train sets 66 m 2,11 30 x 2.40 255 510 2 train sets 60 m 1,59 33 x 2.20 232 696 3 train sets 66 m 2,43 30 x 2.20 211 633 3 train sets 90 m 2,28 (1) On the basis of 6 standing passengers per square meters. (2) Running unit can be coupled (3) Calculated on the base of 15 500 passengers per hour in 2022.

CREATS: Phase II Final Report, Vol. III: CTA Transport Improvement Project in East Sector of Cairo Chapter 3: A NEW ROLE FOR THE HELIOPOLIS METRO
3 - 90
(3) Fleet Requirements
The estimated commercial speed depends on both the system’s characteristics (maximum speed, acceleration, deceleration) and the alignment features (curves, spacing between the stations, dwelling time in stations). Furthermore, the estimated speed takes into account the slowdown caused by the pedestrian at-grade intersections, even if the Supertram has priority. This is done for safety reasons, and experience shows that people quickly become familiar with the silent and frequent passing vehicles. Generally speaking, the commercial speed of urban transit systems are lower than speeds of regional modes (heavy rail) since the former perform services in a continuous urban fabric, whereas the latter perform point-to-point services. The Supertram's average speed will reach 32km/h when considering :
• an average distance between stations of 1,200 meters, • a maximum speed of 70km/h between stations, limited to 35km/h and 45km/h in
dense urbanized precincts. • good traffic management at secondary intersections and the implementation of
road infrastructures at primary intersections.
The required fleet for the Supertram line 1 is calculated on the basis of :
• the system speed, • the peak hour passenger flow on the busiest sections, • route length, • end-to-end travel time, • shunting time in terminals, • dwell time at stations • and time at terminals reserved for possible delays. • fleet reserve based on 10% of the whole fleet, and • the capacity of 560 passengers (assuming a peak load of 6 passengers/m2).
The operating headway is determined by the passenger demand. The forecast hourly passenger demand must be lower than the proposed hourly capacity offered. As a preliminary basis, the standard adopted in order to determine the train frequency is, for the peak hour, based on 6 standing passengers per square meters. For the off-peak hours a basis of 4 standing passengers per square meters is taken into consideration.
A maximum headway of 10 minutes is adopted for the off-peak hours.
Based on the above assumptions a daily timetable operation plan has been made, as shown in Table 3.5.15, in order to determine the required configuration of the system.

CREATS: Phase II Final Report, Vol. III: CTA Transport Improvement Project in East Sector of Cairo Chapter 3: A NEW ROLE FOR THE HELIOPOLIS METRO
3 - 91
Table 3.5.15 Supertram Daily Time Table
Headway by year of operation
Period 2007 2012 2022
5 h 00 to 6 h 00 10 mn 00 s 10 mn 00 s 8 mn 00 s 6 h 00 to 7 h 00 5 mn 00 s 5 mn 00 s 3 mn 30 s 7 h 00 to 9 h 30 3 mn 35 s 3 mn 35 s 2 mn 10 s 9 h 30 to 13 h 00 5 mn 00 s 5 mn 00 s 3 mn 30 s
13 h 00 to 17 h 00 4 mn 40 s 4 mn 40 s 4 mn 00 s 17 h 00 to 19 h 00 5 mn 20 s 5 mn 20 s 4 mn 30 s 19 h 00 to 21 h 30 8 mn 00 s 8 mn 00 s 6 mn 30 s 21 h 30 to 22 h 00 10 mn 00 s 10 mn 00 s 8 mn 00 s 22 h 00 to 23 h 00 10 mn 00 s 10 mn 00 s 9 mn 00 s 23 h 00 to 24 h 00 10 mn 00 s 10 mn 00 s 10 mn 00 s
Source: JICA Study Team
The corresponding basic operating characteristics and fleet requirements of the Supertram are shown in Table 3.5.16 for the years 2007, 2012 and 2022.
Table 3.5.16 Supertram Operating Characteristics
Year System Length (km)
Train requirement
Minimum headway (sec)
Annual train km (mill)
2007 22km 29 215 3.03 2012 22km 29 215 3.03 2022 22km 46 130 4.05
Source: JICA Study Team
(4) Operational Considerations
Train siding facilities are to be constructed as part of the Supertram system. These will serve a number of functions including storage, inspection and maintenance of vehicles. It is proposed to build a central storage and maintenance site near the eastern extreme of the alignment.
The proposed central storage and maintenance yard will have the capability to perform major repair and maintenance in addition to vehicle testing, inspection and storage. A site will be forecast for the vehicle washing inside of the central storage and maintenance yard.
Operational flexibility dictates that the rolling stock be double-ended. When service interruptions occur on fixed guide way systems (and it should be noted that interruptions may be caused by extraneous events such as fires, water main breaks, police activity, as well as train failures, power problems, etc.), it is often necessary

CREATS: Phase II Final Report, Vol. III: CTA Transport Improvement Project in East Sector of Cairo Chapter 3: A NEW ROLE FOR THE HELIOPOLIS METRO
3 - 92
to short-turn trains at intermediate points so that some semblance of service can be continued.
The acceleration and deceleration characteristics of the rolling stock help determine the running times that can be achieved. Generally speaking, the braking capability of the rail rolling stock is limited only by the available wheel/rail adhesion and the ability of passengers (especially standees) to tolerate high deceleration rates. Acceleration, on the other hand, is a variable that can enhance performance of the system. It should be mentioned that a high acceleration rate requires a high installed power output which, in turn, entails increased energy consumption and cost (both capital and operating). High acceleration rates and, especially, high jerk rates (i.e., rapid changes in the acceleration or deceleration rate) can also produce passenger discomfort.
The service headway (theoretical and scheduled) that may be achieved with the control system associated with a technology type, are important criteria for the system's capacity. Spacing trains closer than the scheduled headway may result in a degradation in reliability (i.e., an increase in delays) while spacing trains closer than the theoretical minimum headway of the signal system will definitely degrade reliability and slow the service down. The conventional steel wheel on steel rail type of technology has a tremendous advantage inasmuch that train sets can be coupled together to increase capacity, assuming that platforms are built long enough to handle the longer trains. Conversely, trains can be shortened in off-peak periods to reduce operating costs. Alternatively, headways can be lengthened appropriately; the decision as to which approach to use will be based upon the operator's service and operating philosophies.
Another important policy issue is that of the number of hours of the day during which service is to be provided (at present, it is assumed that service is to be operated 19 hours per day, from 5 a.m. to midnight).
The ability to easily vary train consists to match capacity with demand is an important feature of conventional steel wheel on steel rail modes. This ability is also useful in removing failed trains from service. Another train can be coupled to the train that has failed and then tow or push the latter clear of the main track so that normal service can be restored.
(5) Reliability and Maintainability
High reliability is an important characteristic of any transportation system. The more reliable the service is, the more likely people are to use it. When system components are easily maintained, then reliability will be enhanced. Also, high reliability and maintainability can permit a reduction in the size of the rolling stock fleet, thus reducing capital costs. In the same way, highly-reliable ticket vending and collection machines can help reduce costs as well as speed up the movement of passengers and reduce the number of machines required. Two issues are important in this regard.

CREATS: Phase II Final Report, Vol. III: CTA Transport Improvement Project in East Sector of Cairo Chapter 3: A NEW ROLE FOR THE HELIOPOLIS METRO
3 - 93
• Components and technology with a reputable service history should be chosen. Service-proven technology is a key in developing standards for reliability and maintainability of a transit system. Mean times between failures for specific items should be a matter of record. Repair and overhaul cycles should have been demonstrated in actual revenue service. When possible, unit replacement of parts and subsystems should be used to reduce the down time experienced by major system components.
• Standardization of systems can help improve reliability. If only one type of rolling stock is used, if just one type of ticket vending machine is in service, etc., maintenance personnel will become more familiar with them and will be better able to make repairs. Training requirements will also be simpler and there will not be as great a need for specialized parts and tools to be kept in inventory.
(6) Training
A high standard of training is mandatory for all personnel who deal with the maintenance and servicing of rolling stock, signal and communications equipment, track components, the electric traction system, etc. There is no substitute for training in enhancing system reliability and safety. Please refer Chapter 5 for more detail.
(7) Fare Collection System
The type and complexity of the fare equipment required for the Supertram system will depend on the fare policies that are adopted. Refer Section 4.4 for more detail.
In essence, there are three options which need to be considered.
1) Complete Barrier System
This system is the most efficient in terms of reducing the fare evasion, and the cost of controls, thanks to automatic ticket barriers which control the access to the Supertram platforms. The disadvantage of the system is that it has an important cost, and is difficult to implement on most of the Supertram stations due to scarcity of cross-platform space. As the platform widths of the stations limited within a 2-3m range, it will be necessary to secure the access to them with a thin barricade construction with barrier-controlled entrances (please refer item (1) in Figure 3.5.25). In the same time, access to the trains must be limited to automatic sliding doors (please refer item (2) in Figure 3.5.25), which open when the Supertram arrives and stops with its entrances exactly in front of the doors. In this way, fraudulent access from the tracks can be avoided.

CREATS: Phase II Final Report, Vol. III: CTA Transport Improvement Project in East Sector of Cairo Chapter 3: A NEW ROLE FOR THE HELIOPOLIS METRO
3 - 94
Source: JICA Study Team
Figure 3.5.25 Platform Enclosure
2) Barrier System with Police Supervision
The Supertram station could be equipped with automatic ticket barriers as is the case with the previous example. However, in order to limit the use of barricades around the stations, the access to the platform could be supervised by a policeman who patrols the platform, as it is currently the practice on the metro lines in Cairo (Figure 3.5.26).
3) Barrier-free Honor System
This option reduces the complexity of the fare collection system, and thus the capital cost, but is very inefficient in terms of avoiding fare evasion. It also leads to an increased operational costs due to the manpower required for controlling the tickets on board the trains as well as retrieving fines. It should be noted that the opinions expressed to the Study Team strongly suggest that such an “honor system” is not appropriate for Cairo.
As to the ticket purchasing method, there are various ways :
• automatic vending machines based on coin Piasters, • sales personnel at the entrance of each station • distribution in newsstands and kiosks.
The driving motivation should be to make the purchase of tickets as easy and convenient for potential patrons of the supertram.
1
2

CREATS: Phase II Final Report, Vol. III: CTA Transport Improvement Project in East Sector of Cairo Chapter 3: A NEW ROLE FOR THE HELIOPOLIS METRO
3 - 95
Source: JICA Study Team
Figure 3.5.26 Platform Enclosure with Police Supervision
(8) Comparing Standard and Customized Rolling Stock
When choosing a modern LRT rolling stock, manufacturers generally allow the client to choose between an already made rolling stock available in the factory, called standard rolling stock or an “off the shelf” unit, versus a customized rolling stock, that is, a solution which is adapted to the specific needs of the clients, in terms of design and dimensions.
In addition to modular type rolling stock described previously, manufacturers are now also offering standard solutions with customized front-end for the same cost.
The advantages and inconveniences of standard and customized rolling stock must considering the life cycle of the Supertram project taking into account the related costs. The life cycle is consists of five phases :
• Definition phase, refers to the political and public consensus for the urban restructuring and choice of the Supertram concept. During this phase the time factor is essential in view of obtaining swift results and of reducing costs.
• Conception phase, involves the transport studies (among others this feasibility study) that determine the final concept of the Supertram line and the technical specifications of the rolling stock. The characteristics of the Supertram concept affect the extent of the studies by the level of innovation required and therefore also affect the overall cost.
• Fabrication phase, relies on the characteristics of the Supertram concept and is more decisive for the cost than the conception phase. The technical requirements and level of difficulty for the construction of the right-of-way, track, installations and stations rely to a certain extent on the Supertram concept and

CREATS: Phase II Final Report, Vol. III: CTA Transport Improvement Project in East Sector of Cairo Chapter 3: A NEW ROLE FOR THE HELIOPOLIS METRO
3 - 96
can be very decisive for the cost. Moreover, the fabrication cost of the rolling stock wholly depends on the choice of Supertram concept.
• Operation and maintenance phase, is the most costly for the Supertram project due to its duration. The manpower needed to operate and to maintain the Supertram throughout its lifetime is of key importance to the cost estimation.
• Extensions, of the Supertram line included in subsequent projects add up to the entire life cycle cost of the project.
An understanding of importance of the choice of rolling stock on the life cycle cost can be obtained with table 3.5.17, as typified by recent experience in Strasbourg.
(9) A Selection of Modern Tramway Rolling Stock and Manufacturers
Main tramway manufactures are Adtranz, Kinki Sharyo, Alstom, VAE AG, Bombardier Ansaldo, CKD Tatra, Koros, Alna Koki, Niigata Engineering, Nippon Sharyo, and Tokyu Car Corporation. Some relevant examples of LRT projects are depicted in Table 3.5.18. As further examples, turnkey solutions employed in the realization of LRT systems are provided in Table 3.5.19.
Table 3.5.17 Rolling Stock vs. Life Cycle Cost
Particularities for the life cycle cost Phases Standard rolling stock Customized rolling stock
Definition
The choice of a standard rolling stock can strongly help the
decision process as it represents a certified technology
More difficult decision process
Conception Technology tested and certified
When choosing a new technology, every aspect of the realization and alignment must be studied
to the utmost detail, always with the risk of unforeseen elements. Example: in Strasbourg,
the choice of large width of the doors to improve access has lead to relatively long
closing times of the doors
Fabrication
In the year of implementation of the EuroTram in Strasbourg the
fabrication cost of a standard rolling stock was approximately 13 million francs (1.98 million
€)
The fabrication cost of the EuroTram of Strasbourg was approximately 17 million
francs. There was an additional cost connected to the mechanical equipment, with longer
realization and testing times. There is invariably an extra risk attached to the technical guarantee
of the untested rolling stock
Operation and
maintenance None
There has not been identified any flaws in the fabrication of the EuroTram of Strasbourg. A
new adjusted rolling stock is however subject to unforeseen operation costs. The efficiency of
the maintenance tasks tends to be lower Extensions None None

CREATS: Phase II Final Report, Vol. III: CTA Transport Improvement Project in East Sector of Cairo Chapter 3: A NEW ROLE FOR THE HELIOPOLIS METRO
3 - 97
Table 3.5.18 LRT System Descriptions
LRT SYSTEM DESCRIPTIONS
Dallas Customer : DART In service : 1996 Manufactured : Kinki Sharyo - number of vehicles : 55 - max. speed : 100 km/h - vehicle type : full low floor - bi-directional - capacity : 160 (72 seated) - length : 28 m - width : 3.3 m - full air-conditioning
The Dallas Area Rapid Transit system first opened its light-rail line in 1996 - with forty light-rail vehicles from Kinkisharyo. DART ordered 55 more cars from Kinkisharyo and they are expanding construction years ahead of schedule. The reconfigured vehicle provides the benefit of low floor boarding and additional passenger hauling capacity.
Boston Customer : Massachusetts Bay Transport Authority (MBTA) In service : 1983 Manufactured : Kinki Sharyo - number of vehicles : 120 - max. speed : 88 km/h - vehicle type : full low floor - bi-directional - capacity : 166 (46 seated) - length : 24.4 m - width : 2.6 m - full air-conditioning
In 1983, 120 new vehicles were delivered by Kinkisharyo to the MBTA, which could work seamlessly with the existing fleet of vehicles on the Green Line Service.
Barcelona Customer : ATM In service : 2004 Manufactured : ALSTOM Spain - number of vehicles : 19 + 18 - vehicle type : full low floor - bi-directional - capacity : 221 (56 seated) - length : 32.3 m - width : 2.65 m - full air-conditioning
CITADIS vehicles will run on the new 17 km line which will have 35 stops and is expected to carry more than 19 million passengers per year.

CREATS: Phase II Final Report, Vol. III: CTA Transport Improvement Project in East Sector of Cairo Chapter 3: A NEW ROLE FOR THE HELIOPOLIS METRO
3 - 98
LRT SYSTEM DESCRIPTIONS
Paris Customer : RATP In service : 2003 Manufactured : ALSTOM France - number of vehicles : 13 - vehicle type : full low floor - bi-directional - capacity : 231 (48 seated) - length : 32.2 m - width : 2.40 m - full air-conditioning
These vehicles are destined for use on new or projected lines in the Paris area. They are designed to be able to operate as multiple units, meaning that two trams can be connected to form a 64 m long vehicle run a single driver.
Montpellier Customer : TAM In service : since July 2000 Manufactured : ALSTOM France & Spain - number of vehicles : 30 + 30 extensions of 10 m - vehicle type : Partial low floor - bi-directional - capacity : 200 (58 seated) - length : 40.97 m - width : 2.65 m - full air-conditioning
Montpellier has a population of over 400,000 inhabitants. By mid August, 2000 CITADIS had already transported one million passengers on the new 15 km line. The livery matches the Mediterranean sky, with the swallow motif symbolizing youth, fidelity and reaching for the future.
Rome Customer: ATAC In service: 2000 / 2001 Manufactured: ALSTOM Italy - number of vehicles: 78 - vehicle type: partial and full low floor - bi-directional - capacity: 240 / 320 (54/64 seated)- length: 33 / 41.45 m - width: 2.40 m - full air conditioning
In 1996 and 1998, the Rome Transport Company, Azienda dei Trasporti di Roma (ATAC) ordered 78 CITYWAY trams. These trams, designed by Giugiaro Design, provide a comfortable, bright and functional interior with easy access and circulation.

CREATS: Phase II Final Report, Vol. III: CTA Transport Improvement Project in East Sector of Cairo Chapter 3: A NEW ROLE FOR THE HELIOPOLIS METRO
3 - 99
LRT SYSTEM DESCRIPTIONS
Nancy Customer : Communauté urbaine du Grand Nancy Manufactured by Bombardier - Length 24,500 mm - Width 2,500 mm - Max. Speed 70 km/h - Minimum curve radius 12 m - Maximum gradient 13% - low floor - Seated Passengers 40 - Standees 103 (4 pass/m2) The Tram-on-Tires' main benefit is its rail and road bi-modality: it can be operated on a segregated electrified lane with a single central guiding rail or operated as a road vehicle on tires, driven independently and powered by a diesel-electric system.
In 1998, the Greater Nancy Urban Community (CUGN) of France ordered 25 Trams-on-Tires from Bombardier Transportation, with the objective of equipping its segregated-lane transit system. The Greater Nancy urban area operates the new Tram-on-Tires units on its existing trolleybus network. High comfort standards for passengers are met with 100% low-floor and air-conditioned accommodations, along with wide panoramic windows that allow unobstructed viewing of the city landscape. These units offer exceptional urban insertion capability, with the ability to take 12 meter radius curves and 13% gradients during normal operation. Tram-on-Tires are brightening the City of Nancy with their innovative modern and environmentally-friendly features.
Strasbourg Customer : Compagnie des Transports Strasbourgeois (CTS) Manufactured by Bombardier - Length : 33,100 mm (7-car unit) 44,500 mm (9-car unit) - Width : 2,400 mm - Max. Speed : 70 km/h - Minimum curve radius : 25 m - Maximum gradient : 8.5% - 100 % low floor - Seated Passengers : 66 (7-car unit) 92 (9-car unit)- Standees : 134 (7-car unit) 178 (9-car unit)
The sleek, low-floor Eurotram owes much of its success to its user-friendly design, including wide doors and generous aisles that benefit shoppers with carts, parents with carriages and strollers, and passengers in wheelchairs. The trams have no obstructions below the passenger seats and ramps descend automatically at some doorways to facilitate the free movement of passengers. The three-phase traction equipment gives significant savings over traditional DC traction equipment through the Eurotram's lower maintenance costs and energy consumption.

CREATS: Phase II Final Report, Vol. III: CTA Transport Improvement Project in East Sector of Cairo Chapter 3: A NEW ROLE FOR THE HELIOPOLIS METRO
3 - 100
LRT SYSTEM DESCRIPTIONS
Sydney Customer : CityRail Manufactured by Bombardier - Length : 28,280 mm - Width : 2,650 mm - Max. Speed 80 km/h - Minimum curve radius : 16.4 m - Maximum gradient : 8.5% - 100 % low floor - Seated Passengers : 74 - Standees : 103
The Sydney Variotram is the first LRV to be developed with a totally modular design. It is composed of five articulated sections, and this configuration - despite the 2.65 width - provides the tram with greater maneuverability. The Variotram, as it is called, has been in operation since 1997 and consists of a fleet of seven 100 percent low-floor trams. These low-floor trams, with their excellent visibility and wide aisles, are exceptionally customer-friendly.
Nantes Customer : Semitan Manufactured by Bombardier - Length : 36,400 mm - Width : 2,400 mm - Max. Speed : 70 km/h - Minimum curve radius : 18 m - Maximum gradient : 6% - 100% low floor - Seated Passengers : 76 - Standees : 184
The Incentro light rail vehicle for the city of Nantes, France is an articulated low-floor tramway for bidirectional service. It is equipped with six double doors on each side as well as an air conditioning system. The order of 23 vehicles is the first order for the new modular product, Incentro.
Linz Customer : Linzer Verkehrsbetriebe (ESG) Manufactured by Bombardier - Length : 40,000 mm - Width : 2,300 mm - Max. Speed : 70 km/h - Minimum curve radius : 17 m - Maximum gradient : 6% - 100% low floor - Seated Passengers : 80 - Standees : 162 (4 pass/m2) - Track Gauge : 900 mm
The Linz transport authority (ESG) in Austria commissioned Bombardier Transportation to develop and manufacture 21 low-floor trams Cityrunner. Designed with conventional rigid axle bogies, the vehicle offers even at a gauge of 900 mm a comfortable interior without any steps. In close cooperation with the customer, the Cityrunner concept was optimized for mobility impaired persons. A 40 t buffer load ensures passive passenger security requested by the Linz transport authority.

CREATS: Phase II Final Report, Vol. III: CTA Transport Improvement Project in East Sector of Cairo Chapter 3: A NEW ROLE FOR THE HELIOPOLIS METRO
3 - 101
LRT SYSTEM DESCRIPTIONS
Berlin Customer : Berliner Verkehrsbetriebe Manufactured by Bombardier - Length : 28,270 mm - Width : 2,300 mm - Max. Speed : 70 km/h - Minimum curve radius : 18 m - Maximum gradient : 10% - 100 % low floor - Seated Passengers : 47 - Standees : 103
The three-car, low-floor, articulated vehicles have been optimized to meet passenger requirements. With a low floor throughout the vehicle and wide sliding plug doors, easy passenger access is guaranteed. Furthermore, journey times are reduced by fast, smooth acceleration. The tram is equipped with three-phase technology. Compared to DC technology, this means that - due to the reduced number of wearing parts - less maintenance is required. In addition, a vehicle diagnostic system assures low maintenance and repair.
Table 3.5.19 Urban Turnkey Solutions for LRT
URBAN TURNKEY SOLUTIONS Rouen A full Light Rail Transit system on a concession basis m-é-t-r-o-b-u-s is defined as a transport network integrating 'metro' and 'bus' lines, part of the line being underground and part at street level. ALSTOM supplied 28 vehicles and ensured the project management and the co-ordination of a consortium of 12 companies providing Civil works and all fixed installations including: electrification, tracks, station utilities, overhead facilities, workshops, communications including road traffic interface signaling.
16.1 km of route in 2 lines with a common section and 1.8-km underground. 31 stations, 5 of them underground for a system capacity of 5,000 passengers per hour per direction with an average headway of 3.5 minute in the common section.

CREATS: Phase II Final Report, Vol. III: CTA Transport Improvement Project in East Sector of Cairo Chapter 3: A NEW ROLE FOR THE HELIOPOLIS METRO
3 - 102
URBAN TURNKEY SOLUTIONS Manchester Private financing for a turnkey system The GMA consortium, grouping ALSTOM with the civil contractor companies Mowlem & Amec, was awarded the contract at the end of 1989 on a D.B.O.M. basis (Design-Built-Operate-Maintain). ALSTOM was the majority shareholder within GMA. Completion of construction was achieved in July 1992. In 1984, GMPTE (Greater Manchester Passenger Transport Executive) secured a Parliamentary Bill for the implementation of Phase 1 of the Metrolink project, involving the transformation of existing suburban track and additional alignment in the City centre for the creation of a Light Rail system, the first such system to be implemented in the UK since the old tramways were dismantled in the early 1960's.
ALSTOM supplied 26 articulated vehicles for this Light Rapid Transit system powered at 750 V dc by overhead contact wire. ALSTOM coordinated the supply of all fixed E & M installations, including : the electrification, signaling and centralized control, communications and workshops, taking them from the definition Phase, through integration to full commercial operation of the overall system. This project, this first urban transit project in modern times to be undertaken on a private concession basis.
Bordeaux Customer : The Greater Urban Community of Bordeaux (CUB) Manufactured : France The Greater Urban Community of Bordeaux selected an ALSTOM-led Consortium for the construction of three tramway lines serving the Bordeaux area. The Bordeaux Municipality has chosen the ground based power supply for these tramway lines. This system will be installed on about 10 km of the tramway in the city's historical center. In addition to the supply of 70 CITADIS tram sets, ALSTOM has supplied the tracks, the track surfacing works, the ground-based electrical supply system and has an option for the total maintenance of the supplied equipment. In its role as consortium leader, ALSTOM is responsible for the project management and systems integration as well as the interface with the civil contractors.
There are 2 types of CITADIS: 'short' tram sets, which measure 33 m, and 'long' tram sets, measuring 43 m. Both types are full low floor. Two construction phases: Phase 1: 2000 to 2003: 32 'long' and 6 'short' tram sets and the construction of 24.5 km of tracks to serve 53 stations in and around Bordeaux. Phase 2: 2004 to 2007: completion of 6 'long' tram sets from the first phase and the construction of 18 'long' and 8 'short' tram sets. This phase will extend the lines to 43.3 km and 84 stations in and around Bordeaux.

CREATS: Phase II Final Report, Vol. III: CTA Transport Improvement Project in East Sector of Cairo Chapter 3: A NEW ROLE FOR THE HELIOPOLIS METRO
3 - 103
URBAN TURNKEY SOLUTIONS Barcelona Autoritat del Transport Metropolita (ATM), the local transportation authority acting on behalf of the Regional Government of Catalunya, the Municipality of Barcelona and other local Municipalities and Authorities, has chosen the TRAMmet consortium, comprising ALSTOM, for the concession of the two new Barcelona’s tramway lines. The complete tram network will be over 15 km long, with 30 stations. For both Trambaix and Trambesos, ALSTOM will supply a total of 37 CITADISTM tram sets, and is responsible for the systems integration, engineering, power supply, telecommunications, CCTV, ticketing, road and rail signaling, workshop equipment and project management.
The tram sets will be built in the ALSTOM factory in Santa Perpetua (Barcelona). The concession is to last 27 years. Members of the TRAMmet consortium are: ALSTOM, FCC Construcción, Marfina, Arande, COMSA, ACCIONA NESCO Group, Entrecanales Cubiertas, ACCIONA, Soler i Sauret, CGT Corporación General de Transportes, CONNEX, GUIVIA, Bansabadell Inversió Desenvolupament, and Société Générale.
London London Transport acted at first as general consultant for the Docklands Light Rail, which, however, became wholly independent. The detailed design and construction was done, exceptionally on a 'turnkey' or 'design, build and equip' contract. Apart from the 4 foot 8½ inch track gauge, the designs owed nothing to current London Underground practice and make any future through working impossible: current supply at 750V DC is by an outside third rail with underside contact; trains are automatically controlled with no line side signals; curves are sharp, and trains are limited to two tow-car articulated units; platforms are 30 foot long, normally approached by stairs from ground level.
Built and equipped on Light Rapid Transit principles as a hybrid of railway and developed street tramway practices, was authorized in 1984-5 to run from Tower Gateway, Minories, at the eastern edge of the City of London, to island Gardens (North Greenwich) and from Poplar to Stratford, 7½ miles, largely occupying existing railway locations. It was opened in 1987.

CREATS: Phase II Final Report, Vol. III: CTA Transport Improvement Project in East Sector of Cairo Chapter 3: A NEW ROLE FOR THE HELIOPOLIS METRO
3 - 104
3.5.4 Functional Specifications
(1) Rolling Stock
This section describes the main features of the Supertram vehicles and their design and equipment. The specification of an existing vehicle design, or the adoption of such a design, is recommended for the Supertram system. However, the following performance specifications are written in general terms that would allow either approach.
For this project the necessity to use the at-grade existing right-of-way and the wish to keep the installations at station’s simple, results in the Supertram differing from the conventional metros in the following manner:
• power collection by light catenary instead of 3rd rail, • adapted platform, avoiding steps and giving direct access to cars from the
platform, • reduced train set length and width, • reinforced braking giving a deceleration of around 2.9 m/s² in emergency.
1) Basic Description
A unit LRT type is generally made up of several articulated car bodies supported by bogies, one motor bogie at each end, and one common bogie (or carrying bogie) located beneath the intercommunication. A train is composed of 1, 2 or 3 vehicles according to the line ridership.
This bi-directional train set is equipped with one driver's cab at each end.
In order to match with the line ridership, the necessary passenger capacity of one Supertram train set, must be the following:
• Seated passengers (fixed seats): 60 minimum • Standing passengers (4 p/m²) + seated passengers: 204 minimum • Standing passengers (6 p/m²) + seated passengers: 280 minimum
2) Dimensional Characteristics
• Total length of a train set (2 LRT) : 70 m (maximum) • Overall car body width: 2,400 mm • Total height of car body: 3,500 mm
(current collector device not included), • Minimal height of current collection: 3,600 mm, • Maximal height of current collection: 6,500 mm • Maximum slope of headway supply device: 3%

CREATS: Phase II Final Report, Vol. III: CTA Transport Improvement Project in East Sector of Cairo Chapter 3: A NEW ROLE FOR THE HELIOPOLIS METRO
3 - 105
Height (floor to ceiling):
• Passenger compartment (low floor system): 2,110 mm • Driver's cab: 2,000 mm • Maximal height of low floor car body: 340 mm
(under tare weight, car body camber not included).
3) Performance
Under full load, the expected performance of the rolling stock supplied by 750 V DC traction current:
• Average acceleration from 0 to 40 km/h: 1.2 m/s² • Average acceleration from 0 to 60 km/h: 0.75 m/s² • Average acceleration from 0 to 70 km/h: 0.6 m/s² • Maximum speed: 70 km/h • Maximum service deceleration: 1.5 m/s² • Emergency deceleration (maximum): 2.9 m/s² • Maximum response time after an emergency brake control: 0.5 s • Maximum jerk: 1 m/s3;
shall be adjustable by maintenance workers.
An anti-slide system shall avoid wheel blocking while the Supertram is at a standstill, and anti slip system shall avoid wheel slipping while the Supertram is in motion.
Performances shall remain within predetermined limits when operations in degraded conditions occur, such as:
• loss of a part of brake efficiency (electrical or mechanical brake), • loss of a part of traction efficiency
(for example one power inverter out of service).
4) Weight
Maximum weight by axle (about): 10,000 kg
5) Car body
Car bodies are supported by one motor bogie, on the one hand, and by the intercommunication on the other. The central car body is supported by a carrying bogie.
Due to the strong heat in Cairo during summer, the car body shall be thermally isolated in order to limit the thermal transmission ratio to 2.5 W/m²/°C.

CREATS: Phase II Final Report, Vol. III: CTA Transport Improvement Project in East Sector of Cairo Chapter 3: A NEW ROLE FOR THE HELIOPOLIS METRO
3 - 106
Windscreens shall be compliant with the contents of NF F 31250 standards, or equivalent, and lateral windows with the contents of NF F 31129 standards, or equivalent. The thermal transmission ratio of the glazed parts shall be defined in order to remain in the limit concerning the whole car body.
The car body structure shall be studied for an extra load of 8 passengers/m². This structure shall allow the lifting of the Supertram either for maintenance inspections or for lifting after derailing. This extra load shall be used for the calculation of parking brake.
Each end of the Supertram is equipped with a coupler allowing the hauling of a failing train. This coupling device shall allow the hauling of a fully loaded failing train.
The car body shall be painted and this paint shall resist to the frequent external washings in the washing machine.
6) Bogies
Each power bogie includes the following equipment:
• one steel bogie frame supporting the motor (s), • three phase asynchronous AC motor(s) type, • two axles, • one gear box per axle, • primary suspension, secondary suspension, • brakes (hydraulic and electromagnetic). • wheel profile shall be adapted to rail profile.
The car body to bogie connection is ensured through a secondary suspension, a bogie bolster and a central ring.
The bogie is completed with the following equipment:
• wheel flange lubricator, • one speed sensor, • sand boxes, • one ground brush per axle.
Each trailer bogie includes the main following equipment:
• one steel bogie frame, • two axles, • primary suspension, secondary suspension, • brakes (hydraulic and electromagnetic).

CREATS: Phase II Final Report, Vol. III: CTA Transport Improvement Project in East Sector of Cairo Chapter 3: A NEW ROLE FOR THE HELIOPOLIS METRO
3 - 107
The car body to bogie running assembly connection is ensured through the secondary suspension.
The bogie is completed with the following equipment:
• "Load sensors". • "Speed sensors".
7) Intercommunication
The intercommunication must ensure the following functions:
• Articulation between the car bodies allowing the train to follow curves, either horizontal curves or vertical curves.
• Passenger flow between two car bodies through a clearance of 850mm approximately.
The intercommunication complies with the following requirements:
• Allows for the train set to easily follow curves, • simplicity of construction, • allows for easy separation of one or the other cars, • tightness to water and dust.
8) Doors
Four access doors per sidewall per car ensure ease of access to the Supertram and allow for rapid passenger boarding. The doors shall be compliant with the contents of NF F 31052 and NF F 31054 standards or equivalent.
The clearance of the doors is approximately 1,300mm and the height at least 1,950m.
The vehicle must be designed so as to permit easy accessibility to physically handicapped passengers. It could be a low floor at 340mm above the rail, equipped with a removable access ramp allowing the linking of the lower floor to the platform, or a conventional system with high platforms.
9) Ventilation, Air Conditioning
Ventilation air for the vehicle shall be provided by the air conditioning system which shall use inside air with a proportion of additional outside air. The outside air flow shall be at least 12m3 by hour and by passenger. The air flow speed is up to 2m/s on leaving the piping and up to 1m/s at 1.75 m height.

CREATS: Phase II Final Report, Vol. III: CTA Transport Improvement Project in East Sector of Cairo Chapter 3: A NEW ROLE FOR THE HELIOPOLIS METRO
3 - 108
An air conditioning system shall be provided on each vehicle with a minimum of two independent cooling units per train. The inside temperature shall be 28°C with 40°C outside.
10) Lighting
The lighting of the passenger vehicle shall be at least 250 lux at 1.2m above the floor level. External lighting shall be compliant with the contents of Highway Code (parking lights, dipped headlights, main beam, sidelights, brake lights, etc).
11) Public Address System
The passenger salon shall be equipped with a public address system. This system allows communication between passengers and operation staff (driver, control center, etc).
The public address system shall also contain visual information such as direction, name of stations, and critical information for passengers. This visual system is situated inside the car body and shall be easily visible by the most part of the passengers.
12) Energy Supply System
• Main energy. Supply voltage is 750 V DC with admissible variations from 500 V to 900 V. 750 V DC power supply shall be compliant with the contents of EN 50163 European standard or equivalent. The HV current is collected by means of an electrically controlled pantograph installed above the intercommunication. The current return is ensured on running rails by means of the motor truck current return devices. The HV current guarantees the power supply to the traction equipment, the air cooling auxiliaries and a static converter.
• Auxiliary energy distribution. The auxiliary energy supply equipment is designed to supply the electrical and electronic LV apparatus with electrical energy. The equipment is made of a 750 V DC/48 V DC converter and a "buffer" battery. A storage battery delivers the current peaks exceeding the nominal value of the converter dimensioning (case of the magnetic brake pads for instance). The battery capacity is defined so as to ensure, (a) in the event of converter failure, passenger service to the next terminal and one return journey, and (b) in the event of loss of HV, train parking during half an hour with reduced lighting and air conditioning cut down.
The Supertram might appear as shown in Figure 3.5.27 along Yoosef Abbas Street.

CREATS: Phase II Final Report, Vol. III: CTA Transport Improvement Project in East Sector of Cairo Chapter 3: A NEW ROLE FOR THE HELIOPOLIS METRO
3 - 109
Figure 3.5.27 Possible Configuration of the Supertram
(2) Track Characteristics
• Minimum horizontal curve radius : 25 m (20 m at reduced speed in workshop and sidings).
• Minimum vertical curve radius : 350 m • Maximum slope : 7 % on straight alignment, • Recommended track gauge : as usual with a standard LRT.
(3) Maintenance Policy
Maintenance can be defined as "a set of operations” to be carried out to keep an item in a specified state of efficiency or in a state enabling it to provide a specific service or to restore it to this state" (AFNOR standards) (Figure 3.5.28).
To maintain is therefore to carry out all failure finding, lubrication, inspection, repair and improvement operations required to retain the potential of the item of equipment concerned.
The general objectives of the maintenance operations aim toward maintaining or restoring the technical level of the Supertram system, to meet the requirements of safety, availability and comfort expected by the passengers.
Maintenance is a service for the operation of the Supertram system. However, the operation needs have a direct impact on maintenance costs. Therefore, both activities have common goal: provide the best quality and safety for passenger service with an acceptable cost.

CREATS: Phase II Final Report, Vol. III: CTA Transport Improvement Project in East Sector of Cairo Chapter 3: A NEW ROLE FOR THE HELIOPOLIS METRO
3 - 110
1) Preventive Maintenance Program
The maintenance carried out at pre-determined intervals or according to prescribed criteria and intending to reduce the probability of failure or the degradation of the performance of an item of equipment.
Preventive maintenance is a predetermined program where properly functioning equipment is either inspected and serviced and allowed to remain in service, or the equipment is withdrawn from service to allow maintenance activities to be performed on it.
Preventive maintenance activities follow a pre-set cycle, based on hours of operation, kilometers of operation, number of cycles of operation, etc., depending on the specific equipment involved. The frequency of the preventive maintenance activity is governed by life cycle cost data, which has been developed based on the experience of LRT systems. The schedule of regular intervals for preventive maintenance activities must be strictly adhered to in order to ensure that all equipment is in top operating condition.
2) Corrective Maintenance Program
Corrective maintenance activities are those actions required to repair deficiencies caused by failures, accidents or vandalism, or to organize required modifications done by the manufacturers. The need for corrective maintenance action is usually identified by a failure which occurs while the vehicle/equipment is being operated, during the course of preventive maintenance actions, or as a result of a manufacturer's alert/warning bulletin.
PREVENTIVEMaintenance
Preventive
MAINTENANCE
CORRECTIVEMaintenance
CONDITIONNALPreventive
Maintenance
SYSTEMATIC
Maintenance
Current maintenanceLevel 1-2-3
OverhaulsLevel 4-5
Source: JICA Study Team
Figure 3.5.28 Maintenance Procedures

CREATS: Phase II Final Report, Vol. III: CTA Transport Improvement Project in East Sector of Cairo Chapter 3: A NEW ROLE FOR THE HELIOPOLIS METRO
3 - 111
3) Maintenance of Rolling Stock
• Phase 1, year 2012 29 Supertram trains, • Phase 2, year 2022 46 Supertram trains.
Before any study of maintenance it is imperative to know what kind of maintenance would be applicable for the rolling stock.
They are always two activities physically independent that are the inspection and the overhaul.
4) Inspection
a. Preventive Maintenance
Inspections operations are done on a complete train, the minimum of dismantling is to be done, checking of safety components and wearing parts exchange, the shorter time for inspection activity is the best way to reach the objective for maximum availability for commercial operation.
The preventive maintenance program is based on hours of operation, calendar time or kilometers of operation. It will be established in order to inspect, clean or maintain the system.
b. Corrective Maintenance
This activity consists of all unscheduled operations and is mainly dependent on the train’s behavior. It is applicable to most electronic equipment.
Reactivity of the maintenance organization is essential for minimizing trains immobilization.
Corrective maintenance will be based on a three-shift, seven-day-per-week basis. Failures which affect passenger service will receive immediate attention in order to restore normal operation as quickly as possible. Failures or defects which do not immediately affect the passenger service will be corrected as quickly as possible in order to prevent future interruption of the operation.
Preventive or corrective maintenance work will be carried out at the depot. Maintenance staff will travel to the specific site with the necessary tools, equipment, spare parts,.. .
Cleaning should be performed under a service contract.
5) Overhaul
Overhaul maintenance periodicity is high and work contents very important. This type of maintenance necessitates high immobilization time, special tools and infrastructures and skilled workmen.

CREATS: Phase II Final Report, Vol. III: CTA Transport Improvement Project in East Sector of Cairo Chapter 3: A NEW ROLE FOR THE HELIOPOLIS METRO
3 - 112
Overhaul is done on dismantled components as well as on isolated cars. It consists in the re-conditioning of the component to a state reaching the criteria of its origin.
The components exchange overhaul consists in considering all elementary part of the train or of the car as a component, even the car body itself, and to know its life cycle. Such approach can be followed up by a computer system.
Exchange of components is done in the light repair workshop during inspections or by means of a bogie-changing installation (bogies and some underbody elements) and repair is done where foreseen, generally in overhaul workshop. To proceed with this kind of maintenance allows to work for example on compressor during one year, and to liberate the area for repair of braking blocks on a second year, etc., only unscheduled repair areas are to be let free for repairs.
With this maintenance principle, the trains are only to be sent for car body checking and painting at half-life, after about 15 years.
The area of the overhaul workshop is a little bit smaller for components exchange overhaul. Lifting facilities are not required in quantity, only mobile lifting jacks can be used.
The repair of certain equipment will be performed under a service contract. Service contracts will be used primarily for components repairs and overhauls which are not time-critical to passenger operation.
6) The Levels of Maintenance
According to modern rolling stock, and experience of maintenance to be applied, the following schedule is foreseen for the Supertram’s' maintenance.
It is based on five levels of maintenance and on component exchange overhaul.
a. Level 1
The basic definition of the first level is:
• simple actions necessary for train operation, • performed on elements easy to access, • no specific tools required.
Level 1activities include:
• Car exterior washing: a 4-day frequency is sufficient. • Manual cleaning: About 10-day frequency constitutes an average value. • Sweeping: the Supertram must be swept once a day when coming back from
operation. • Daily visual checking in service station.

CREATS: Phase II Final Report, Vol. III: CTA Transport Improvement Project in East Sector of Cairo Chapter 3: A NEW ROLE FOR THE HELIOPOLIS METRO
3 - 113
b. Level 2
Two main items are in the level two:
• actions that require simple procedures and/or simple to use support equipment, • actions limited to less than 3 hours.
The maintenance program concerns:
• Safety checking, handled by a qualified technician, or the exchange of simple components such as lighting equipment, handled by non qualified workers, are part of this level.
• Safety visit (2 hours maximum) consists in safety controls and visual checking. It is done at least each month or every 8,000 km.
• Inspection (8 hours) consists in safety visit, controls and wearing parts exchange. It is done at least every two months or every 25,000 km.
c. Level 3
For the level three, there is one main item, namely, operations that require complex procedures and/or complex to use support equipment.
Level three tasks can be done either in a light repair workshop or overhaul workshop, and are handled either by one qualified technician or by a team directed by one qualified manager.
Major inspections (5 days) consist in measure and test, exchange of some components and general checking of all train circuits. It is done at least once a year or every 120,000 km.
d. Level 4
The level four is defined by operations that require the use of a specific technique or technology and/or specific support equipment
Level four concerns all the overhaul works; all workmanship is involved in this activity.
Components exchange overhaul (from less than 1 day to 20 days) consists in exchange and repairs of components, depending on the reliability of components. It is done every 1-15 years or more (or running kilometers).
Car body Overhauling (1 month) consists mainly in the structural checking of the car body, and in the painting of it. This is done at a half lifetime of the car, which is about 15 years.

CREATS: Phase II Final Report, Vol. III: CTA Transport Improvement Project in East Sector of Cairo Chapter 3: A NEW ROLE FOR THE HELIOPOLIS METRO
3 - 114
e. Level 5:
Level five is independent and includes operations that require know-how, based on particular techniques or technologies, process and/or support equipment
All the modifications aimed at upgrading the availability of the train, car or components are included in this level. It can be achieved either in light repair workshop or overhaul workshop or allocated to sub-contractors. The workmanship is defined according to the works.
(4) Maintenance Installations
It is necessary to have the installations required for application of the maintenance schedule in order to ensure the following activities:
• safety visit to yearly maintenance programs, • unscheduled maintenance, • some specialized works, • machining of wheels, • bogie exchanges, • components exchange.
Cyclical maintenance operations : cleaning of bogies equipped with flange lubricating device, lubrication of axle-boxes each year, wheel machining each 80,000 to 120,000km, bogie exchange or train overhauling each 750,000 to 800,000km.
The major activities regarding overhaul shall be done in the overhaul workshop.
1) Depot
Depot facilities have to be constructed as part of the Supertram system. This will serve a number of functions including the storage, inspection and maintenance of vehicles. The minimum required area is 60,000 m² (preferred is 70,000 to 75,000 m²) in the final stage, including the full maintenance of a 46 LRT fleet and an overhaul workshop with possible capacity for future new Supertram lines.
The proposed central storage and maintenance yard will have the capability to perform major repair and maintenance in addition to vehicle testing, inspection and storage. The central yard will also house the main maintenance office and part stores, the administrative office, the operating staff facilities and the line Central Control Room. A vehicle washing machine will be located on the train storage zone.

CREATS: Phase II Final Report, Vol. III: CTA Transport Improvement Project in East Sector of Cairo Chapter 3: A NEW ROLE FOR THE HELIOPOLIS METRO
3 - 115
2) Storage and Inspection Facilities
Storage and inspection yards will be used to store trains during off-peak hours and at the end of each service day. In addition vehicles will be cleaned and routine maintenance performed at facilities within the yard. To support these activities, appropriate maintenance personnel, equipment and spare parts should be housed in various facilities in the yard.
This part contains the service station which deals with the daily inspection.
3) Administrative Offices and Staff Facilities
It is recommended to locate the administration personnel of the Supertram organization and the operating facilities in a common building on the yard zone. All the line activities will be controlled from this central point, thus providing the possibility to co-ordinate maintenance and operation in a rational manner in order to obtain a good quality of service.
4) Centralized Control of Operation
The Line Control Centre room will be located in the administrative building.
The supervision of network operation and the quest for objectives of availability, safety and maintenance of quality of service require that monitoring and control operations be centralized in a rational manner.
It is only through such centralization that the following can be achieved:
• instantaneous, overall view of events, through having all useful information of all kinds gathered in a single location,
• immediate and judicious decision-making, through permanent presence of personnel who, though small in number, are highly qualified,
• rapid execution of the measures to be taken through direct remote control of certain equipment units and a full telecommunication network providing links with the operational and technical personnel concerned, as well as outside links (with the police or firemen for instance).
5) Vehicle Maintenance Workshops
The vehicle maintenance workshops should contain a multiple track car house, a parts storage house, and mechanical and electrical workshops. Any repairs that cannot be completed at the storage and inspection yards would be carried out at this facility.
The car house should be equipped with hydraulic car lifts and inspection pits for accessing the underside of the vehicles. It will contain lifting devices and the necessary tools for car maintenance.

CREATS: Phase II Final Report, Vol. III: CTA Transport Improvement Project in East Sector of Cairo Chapter 3: A NEW ROLE FOR THE HELIOPOLIS METRO
3 - 116
A special hall shall be used for wheel machining.
6) Vehicle Washing Facilities
The daily inspection will be realized in a service station that will be situated near the washing machine. It is expected that a single vehicle washing facility will be adequate for the maintenance yard. This facility will be located on the train storage zone, at the entrance of the yard. This washing machine will be in the same hall.
7) Auxiliary Maintenance Zones
Various maintenance zones and auxiliary workshops will be planned in the yard zone for the different technical groups:
• track department, • power supply department, • catenary, • signaling, • telecommunications, • fare equipment.
A possible depot layout for Supertram Line 1 is shown in figure 3.5.29.
(5) Power Supply
The traction electrification system will consist of connections to the Egyptian electrical utility company by a series of traction power rectifier substations, dc positive feeders, an overhead contact system, and a negative return system consisting of the steel running rail and negative feeders' cables.
The system should provide a nominal 750 V dc power to the vehicles in a safe, efficient, reliable manner and should be capable of operating safely within a voltage fluctuation between 500 V to 900 V dc.
(6) Traction Power Substation
The traction power substation provides the equipment for rectifying the utility furnished ac power to the dc power to power vehicles. The substation shall consist of suitable enclosures designed for the environment of Cairo and sized for the following equipment:
• ac switch gear, • rectifier transformer, • rectifier, • dc switch gear,

CREATS: Phase II Final Report, Vol. III: CTA Transport Improvement Project in East Sector of Cairo Chapter 3: A NEW ROLE FOR THE HELIOPOLIS METRO
3 - 117
• supervisory control equipment, • battery and charger, • ventilation equipment and auxiliary power equipment.
Figure 3.5.29 Representative Depot Layout

CREATS: Phase II Final Report, Vol. III: CTA Transport Improvement Project in East Sector of Cairo Chapter 3: A NEW ROLE FOR THE HELIOPOLIS METRO
3 - 118
The number of substations is estimated equal to 12, with a unit power of 1,200 kW in the first phase. According to the future increase in ridership by 2022, some substations will need to be reinforced, reaching a power of 2,400 kW.
The overhead contact system for the main line will be a simple catenary auto-tensioned system consisting of a messenger wire supporting a contact wire by means of hangers. A counterweight system will be employed as the means of providing auto tensioning. In the yard, a single wire fixed termination system will be installed.
3.5.5 Operating Cost and Revenue Estimation
(1) Operating Cost
The derivation of estimated annual operating cost of the Supertram was previously presented in Section 3.3.1. Table 3.5.20 fine-tunes the previously detailed Egyptian and European operating costs for ST-280 and ST-560 type rolling stock, in terms of constant year 2003 currency per train kilometer. Major components are separated in order to synthesize European experience with the expected Egyptian operating cost, using a series of factors with differentiate between domestic and foreign content.
The estimated operating cost, which reaches $2.57 per train kilometer or 15.4 L.E at the mid-2003 exchange rate of US$1.00 = 6.00 LE (3.85 LE per unit car of 150 passengers capacity). It is important to underline at this stage that the Supertram maintenance must be based on international standards. While this invariably implies higher maintenance costs than current local experience, the important objective is nevertheless is to maintain the system in good operating conditions for 30 years. This increase in maintenance cost will, in the longer term, be offset by a reduced need for capital-intensive system renewal costs. The annual operating cost for the ST-560 Supertram is shown in Table 3.5.21.
Table 3.5.21 Estimated Operating Cost of the Supertram
Year Annual Train Kilometers (million)
Operating Cost per train-km
(LE)
Annual operating cost (Million LE)
2007 3.03 15.4 47 2012 3.03 15.4 47 2022 4.05 15.4 63
Note: all monetary units in terms of constant year 2003 LE. Interest and depreciation not included. Source: JICA Study Team Calculations

CREATS: Phase II Final Report, Vol. III: CTA Transport Improvement Project in East Sector of Cairo Chapter 3: A NEW ROLE FOR THE HELIOPOLIS METRO
3 - 119
Table 3.5.20 Estimated Operating Cost of ST-280 and ST-560 Rolling Stock per Train kilometer (Constant 2003 US $)
Type of Rolling Stock ST-280 ST-560 Cost Item
European Cost
European Share
Local Factor
Egyptian Cost
Egyptian Cost
Egyptian Share
Staff 3.47 65.10% 0.48 0.67 25.96% Operating 1.95 15% 0.29 0.35 Maintenance 1.06 12% 0.13 0.26 Structure 0.46 12% 0.06 0.06 Energy 0.46 8.60% 0.28 0.54 20.91% Vehicles 0.43 60% 0.26 0.51 Building 0.03 60% 0.02 0.02 Maintenance 0.47 8.80% 0.23 0.38 14.96% Rolling stock 0.09 85% 0.08 0.16 Track 0.14 50% 0.07 0.12 Stations 0.11 18% 0.02 0.03 Aerial cables 0.02 20% 0.00 0.01 Sub-station 0.02 50% 0.01 0.01 Systems 0.05 80% 0.04 0.05 Green spaces 0.03 10% 0.00 0.00 Other expenditures 0.25 4.60% 0.06 0.07 2.66% Insurance 0.03 45% 0.01 0.02 Marketing 0.08 10% 0.01 0.01 Security-guard 0.05 15% 0.01 0.01 Clothes 0.03 40% 0.01 0.01 Other charges 0.06 30% 0.02 0.02 Spare part 0.68 12.90% 0.48 0.91 35.51% Rolling stocks 0.56 75% 0.42 0.84 Fixed installation 0.12 50% 0.06 0.07 Total 5.34 100% 0.28 1.52 2.57 100.00%Source: JICA Study Team
(2) Refined Fare Revenue Estimation
Multiplying the projected number of daily passengers by an annualization factor, and then multiplying the result by the average fare gives the annual operating revenue. The tram ridership was derived from the total number of boardings and average trip length estimated by the CREATS model. The annualization factor determines the yearly ridership demand from the average weekday traffic forecasts. For the Supertram, it is estimated to be 327 days per year. The refined Supertram fare revenue is presented in table 3.5.22.

CREATS: Phase II Final Report, Vol. III: CTA Transport Improvement Project in East Sector of Cairo Chapter 3: A NEW ROLE FOR THE HELIOPOLIS METRO
3 - 120
Table 3.5.22 Estimated Annual Operating Revenue of Supertram Line 1
Year Annual Passengers (Million)
Average Revenue per
Passenger (LE)
Other revenues
(% of fare revenue)
Annual Operating Revenue
(Million LE)
2007 93 0.65 6% 64 2012 96 0.75 6% 76 2022 141 1.00 6% 149
Note: all monetary units in terms of constant year 2003 LE. Source: JICA Study Team
(3) Coverage Ratio
A comparison of operating costs with operating revenue suggests that the cost recovery of Supertram line 1 will clearly exceed unity (Table 3.3.23). Cost recovery is forecast to reach by year 2012 roughly the same level as observed during the CREATS base year on the Cairo metro network.
Table 3.5.23 Estimated Supertram Line 1 Coverage
Year Annual Operating
Revenue (Million LE)
Annual Operating Cost
(Million LE)
Cost Recovery Ratio
2007 64 47 1.36 2012 76 47 1.62 2022 149 63 2.37
Note: all monetary units in terms of constant year 2003 LE. Interest and depreciation not included. Source: JICA Study Team Calculations
3.5.6 Capital Cost Estimation
Capital cost estimation has proceeded along a number of fronts. Unit costs, for example, have been derived from a variety of sources among them previous urban rail experience in Cairo, discussions with local experts, international norms and expectations (primarily from Europe and Japan) as well as on-going LRT projects in other cities. Supertram costs have also been refined in terms of domestic and foreign content, with the implicit goal of maximizing local content whenever possible. Toward that end, the Study Team has examined major project subcomponents from three perspectives: material, labor and machines/equipment, with a view to refining domestic and foreign components for each. Costing for the supertram project is presented in the six following subsections. Parts (1) through (5) relate to major supertram components; to wit, infrastructure, systems, rolling stock, depot/control center and road/traffic improvements, respectively. Subsection (6) then recapitulates cost by both project total and in terms of domestic and foreign content.

CREATS: Phase II Final Report, Vol. III: CTA Transport Improvement Project in East Sector of Cairo Chapter 3: A NEW ROLE FOR THE HELIOPOLIS METRO
3 - 121
While costs for all elements of the supertram have been calculated, it is necessary to formulate a new approach such as a public-private partnership or intergovernmental cost sharing system. Under this approach, a governmental entity, or the private sector, contributes toward some of these Supertram Line 1 joint-use costs, rather than attempting to obtain full financing of all possible costs via project resources. An estimate of such partnership costs is presented in Subsection (7).
It is again noted at this juncture that all costs are expressed in terms of constant year 2003 LE; thus, any foreign costs have been converted at the mid-2003 exchange rate of US$ 1.00 = 6 LE.
(1) Infrastructure
1) Land Acquisition
Except for the depot as well as park-and-ride facility at Ring Road Station, no land acquisition is required along the Supertram alignment as the existing right-of-way of Heliopolis Metro already exists until Madinet Nasr Terminal. From that point onward the alignment is located within arterial roads.
The land acquisition cost for the depot as well as park-and-ride facility is considered a partnership cost and accounted for in Part (7) below.
2) Removal of Existing Equipment
This concerns Heliopolis Metro equipment and systems: catenary, ballast, rail and substations on the entire line length of 17.62km. Total cost: 720 LE/m x 17,620m = 12.7 million LE.
3) Utilities Relocation
Piping and cables for electricity, water and other utilities will be rerouted on the section from Madinet Nasr terminal to Ring Road station. Total cost : 1,140 LE/m x 4,380m = 5 million LE.
4) Track Laying on Ballast
Track laying cost per track meter is estimated based on international experience with local labor rates. Rail welding of 15m rail to LWR is estimated by assuming the adoption of gas pressure welding machine. Expansion joints are assumed to be installed every 1km.
The track cost includes the following components :
• Rail UIC 54 • PC sleeper, • Rail fastening,

CREATS: Phase II Final Report, Vol. III: CTA Transport Improvement Project in East Sector of Cairo Chapter 3: A NEW ROLE FOR THE HELIOPOLIS METRO
3 - 122
• Ballast, • Labor, • Track laying machines.
The cost of ballast will be reduced thanks to the track bed of the existing Heliopolis Metro. The ballast will thus require some upgrading with local aggregates. The total cost of ballast is thus evaluated at 20% the normal cost. The estimated cost is 1,800 LE/m x 2 x 21,600m = 77.8 million LE. A section of 400m is deduced from the total line length of 22km for track on concrete slab.
5) Track Laying on Concrete Slab
This type of track is convenient for pedestrian intersections, which is needed at all stations ( width 4m) and primary road intersections (30m) where the Supertram travels at a lower speed. This amounts to a total of 400m, thus leading to a total cost of 2,400 LE/m x 2 x 400m = 1.9 million LE.
6) Street Beautification
In order to assess the unit cost, overseas examples and cases of new line construction in foreign countries are referred to. It is expected that a comprehensive beautification from Mansheyet El Bakry to the Ring Road (including the sections under viaduct), involving street rebuilding, pedestrianization, markings, signaling and greenery, is undertaken. For this, the estimated cost is 2,880 LE/m x 15,220m = 43.8 million LE.
7) Station at Grade
In order to determine the station cost, examples in Japan, France and cases of other foreign projects have been studied. For a simple station construction including 2 x 70m length fence protected platforms, and a building or simple enclosure for the fare collection system and passenger control, the cost will be around $250,000, based on a local labor cost of 15% of international experience. The total cost will be 17 stations x 1.5 million LE/station = 25.5 million LE.
8) Ramses Terminal
Due to the important loadings at Ramses terminal, bigger platforms and a building for passenger controls are required, as are modifications in the traffic and pedestrian circulation systems adjacent to Ramses terminal. The total cost is estimated at 9 million LE.
9) Groundwater Drainage System
The problem of high groundwater between Ain Shams and Mansheyet El Bakry stations, will be addressed with the construction of a pump drainage system with

CREATS: Phase II Final Report, Vol. III: CTA Transport Improvement Project in East Sector of Cairo Chapter 3: A NEW ROLE FOR THE HELIOPOLIS METRO
3 - 123
discharge lines to the main sewage, and power lines to wells. Estimated total cost: 3 million LE.
10) Viaducts
Ensuring the segregation of the Supertram is achieved with road underpasses and viaducts at primary road intersections in order to avoid the higher cost of elevated structures of the Supertram. However, due to the important car traffic (more than 3,000 vehicle during the peak hour per direction) at the intersection between Tareeq El Nasr and Yoosef Abbas streets, which is difficult to deviate with underpasses, a Supertram viaduct is proposed instead. A viaduct and elevated station are planned at the Ring Road Station (refer Section 4.5 for conceptual design) in order to ensure sufficient access for the large passenger flows predicted at this station, plus taking into account proposed joint development. Based on CREATS Phase I calculations for rail viaducts with a height of 8-10m and a slope of 4%, a total cost of 33.7 Million LE is programmed.
11) Elevated Station at Ring Road
The cost of an elevated station has been based on examples in Japan, France and cases of other foreign projects. It is noted costs reflect only the LRT facility, and not joint development potentials noted in Section 4.5.
The total cost of the underslung station is estimated at 9 million LE.
The composite cost for supertram infrastructure therefore aggregates to 221.34 million constant year 2003 LE.
(2) System
Substations shall be constructed along the route to supply power for train operation. A switch house shall be placed at the branch to the rolling stock depot.
Signal equipment shall be installed to ensure the safety of train operation.
Telecommunications equipment shall be installed to transmit the necessary information to the control center, stations, the rolling stock depot, trains, etc.
Stations shall be equipped with a fare collection system.
The rolling stock depot shall have the equipment to inspect, repair and wash trains. A control center will be established at the rolling stock depot to control and monitor train operation and power supply.
The costs of traction power supply and signal and telecommunications systems for Cairo were estimated by converting the corresponding international costs. These costs do not include the cost of land, buildings or transmission lines for receiving power.

CREATS: Phase II Final Report, Vol. III: CTA Transport Improvement Project in East Sector of Cairo Chapter 3: A NEW ROLE FOR THE HELIOPOLIS METRO
3 - 124
1) Traction Power Supply
a. Catenary, Substations and Other
The Supertram will be supplied with power from overhead catenaries as it is presently the case with the Heliopolis Metro network. The existing power supply system will be completely replaced by modern components. The standard distance between substations shall be about 2km. The maximum range of power supply in one direction shall be about 1km. The Supertram system requires twelve substations and a switch house.
Each substation shall have two sets of 2400 kW rectifiers including one as backup and shall be designed to accept one additional set in the future.
Two 6 kV cable lines of power distribution system shall be laid along the entire route to supply power to i1lumination and electrical facilities at stations and the rolling stock depot.
b. Power Supply Costs
The unit costs of constructing catenaries, substations, switching house and power distribution lines are based on international values for equipment and materials, with adjustment for Egyptian labor cost.
The costs are as follows :
• catenary : 2.69 million LE/km x 22km = 59.1million LE; • substations : 12 x 7 million LE = 84 million LE; • switching house : 15.4 million LE; and, • distribution lines : 230 LE/m x 22,000m x 2 = 10.3 million LE.
c. Comments
In order to obtain electricity for motive power, Heliopolis Metro has to select one measure from two alternatives: utilization of electric power supplied by the existing power network and private power generation. In the latter case, it is difficult to enhance the reliability of power generation because the scale of the private power generation is small and also because there are same difficulties in installing reserve machines and establishing a new network of power generation. Furthermore, the amount of investment will be large against the capacity of the power generation facilities. In the former case, although a large amount of investment is necessary to reinforce and expand the existing power network, the reliability of power supply is enhanced and other benefits including social contribution can be expected.
In view of the above, it is advisable for Heliopolis Metro to utilize, for its power source, the existing power network and promote the reinforcement and expansion of the network at the same time.

CREATS: Phase II Final Report, Vol. III: CTA Transport Improvement Project in East Sector of Cairo Chapter 3: A NEW ROLE FOR THE HELIOPOLIS METRO
3 - 125
2) Signaling and Telecommunications Equipment
a. Signaling
To ensure the safety of train operation at a minimum headway of 120 seconds, a centralized train control (CTC) system shall be installed to control trains on the entire route from the operation control center. Trains shall be equipped with cab signals according to which drivers operate trains. If a driver mistakenly interprets a signal or the train speed exceeds the limit an automatic train protection (ATP) system shall automatically halt the train to ensure safety.
A system shall be installed to maintain the safety of train operations by means of wayside signals and an ATP system, even if the ability to monitor and control trains through the CTC system fails. The cost of information transmission lines between the CTC equipment at the operation control center and stations arc included in the cost of telecommunications equipment.
When necessary, trains shall be able to run in the opposite directions by a command from the train dispatcher or the station with interlock system. Even in this case, the ATP system shal1 be able to protect trains in the same way as when trains are operated in the normal direction.
Trains on the track shall be detected by means of track circuit. The Study Team assumes the use of transponders for transmitting information between trains and stationary sites. The cost of monitoring train operations and stationary elements of the ATP system are included in the cost of signal equipment.
The central processing equipment at the operation control center shall be designed to permit future expansion of the system. The system can be expanded at little additional cost for central processing equipment, and for other equipments if the manufacturer of the new equipment is the same as the manufacturer of the initial equipment or if the manufacturer of the initial equipment provides the new manufacturer with data and information on the initial equipment.
b. Telecommunication
Telecommunications equipment shall be installed to transmit information between divisions of Heliopolis Metro, between signal equipment and central and station equipment of SCADA systems devices, for public address to passengers, and to monitor passenger movements at stations and train-sets at the rail vehicle depot. The equipment shall have an uninterruptible power system which functions even in the event of power failure.
The telecommunications equipment at the train operation control center shall be designed to permit system expansion in the future, in the same way as signal equipment, at minimum costs for additional equipment, data and software.
The cost of the public address system on trains and cabin equipment for radio transmissions between train crew and the dispatcher at the train operation control

CREATS: Phase II Final Report, Vol. III: CTA Transport Improvement Project in East Sector of Cairo Chapter 3: A NEW ROLE FOR THE HELIOPOLIS METRO
3 - 126
center are included in the costs of telecommunications equipment. The cost of telecommunications equipment for telephone communication among crew members on a train is included in the cost of rail vehicle accommodations.
c. Cost
The total cost of the signaling and telecommunications equipment is, on average, 5.14 million LE per station, thus 97.7 million LE in total for the whole of Supertram Line 1.
3) Fare Collection System
The Study Team proposes a state-of-the-art fare collection system consisting of :
• Automatic ticket barriers : 4 sets x 19 stations = 76 sets • Fare adjustment machine : 1 set x 19 stations = 19 sets • Ticket vending machines : 2 set x 19 stations = 38 sets • Data processors : 1 set x 19 stations = 19 sets • Card processors : 1 set x 19 stations = 19 sets.
The main advantage of this type of fare collection system based on barriers is that it reduces the fare evasion on the Supertram system. In this regard, the station platforms need to be secluded either with walls and fences with openings in front of the automatic Supertram doors (refer Section 3.5.3).
The total cost of the fare collection system, based on international costs with adjusted local labor rates, is 3.73 million LE per station, resulting in a total cost of 70.8 million LE for the whole line.
The composite cost for supertram systems therefore aggregates to 337.33 million constant year 2003 LE.
(3) Rolling Stock
An review of international prices for rolling stock compatible with the needs of Supertram Line 1 confirms that a wide range of possibilities exist. For a train on the order of 30-35 meters in length (note: supertram will consist of the equivalent of two such joined units) prices can range from one to 3.5 million US dollars (Figure 3.5.30). Thus, the cost of the Supertram vehicles must be considered with some caution as it is necessary to specify what the prices cover. It is also of interest to review some of the major parameters which impact prices on today’s market.

CREATS: Phase II Final Report, Vol. III: CTA Transport Improvement Project in East Sector of Cairo Chapter 3: A NEW ROLE FOR THE HELIOPOLIS METRO
3 - 127
100
150
200
250
300
350
400
450
1.0 1.5 2.0 2.5 3.0 3.5 4.0
Million US Dollars
Cap
acity
(Per
sons
)
Source: JICA Study Team based on recent international experience. Capacity based on maximum occupancy of 4 persons per sq. meter.
Figure 3.5.30 Recent Representative International LRT Rolling Stock Prices
• Vehicle configuration, including floor type, tractive power, speed, furnishings, etc. Supertram Line 1 will require the equivalent of a four car train set and a capacity of some 600 persons. The comparison between purchase costs is delicate as different types of deliveries and equipment must be considered. A Supertram train set measuring 30m with complete motorization will be more expensive than a Supertram of 20m with a motorization of 50 percent. As an alternative to linked car units (and possible over-motorization) the modular type rolling stock described in Section 3.5.3 offers a flexible and cost-effective transport solution for Cairo. It is fully flexible in vehicle length, width, number of cars, and floor design. It is easy to upgrade, and also keeps maintenance and repair costs low. As a result of its flexibility, reduced delivery times and lower operating costs are part of this type of rolling stock’s increased competitiveness. A further issue relates to degree of low floor design. Recent prices suggest that mixed floor units can cost on order of $21,000 to $25,000 per square meter, with costs for low-floor trains some one-third higher. However, recent trends in the marketplace suggest this differential is narrowing. In any case, Supertram Line 1 does not require low-floor design.
• Vehicle size. It has been determined (refer Section 3.5.1) that supertram vehicles must, due to restrictions in the corridor envelope, be of 2.4 meters width, whereas recent-vintage LRT systems tend to use cars of some 2.6 to 2.7 meters width. There is no industrial difficulty for obtaining such a vehicle. The more pertinent question is whether the bidding manufacturer has the assembly line for this product. In practice, manufacturers tend to offer two or three typical vehicle widths to which the customer must adapt the system. It has to be noted that some manufacturers propose customized rolling stock for which the width is adjusted to the purchaser's specification at no extra cost.

CREATS: Phase II Final Report, Vol. III: CTA Transport Improvement Project in East Sector of Cairo Chapter 3: A NEW ROLE FOR THE HELIOPOLIS METRO
3 - 128
• Vehicle specifications. This is closely allied with the two previous points noted. In general, any purchaser will likely encounter savings when choosing an “off of the shelf” model rather than submitting unique specifications. The Study Team is of the opinion that adequate options exist suitable for Cairo in today’s market. The imposition of unique specifications will invariably increase cost due to integration in design and product testing. A sub-issue in this regard is track gauge. In terms of system operation, it is noted that the track gauge is not the critical determining factor, but the vehicle size: in terms of Supertram Line 1, a maximum car width of 2.4 meters. This width car will operate on either standard gauge or meter gauge (the Heliopolis Metro system is meter gauge, but the international trend is clearly toward standard gauge). While it is likely that supertram will also be standard gauge, it is not an absolute requirement. The Study Team recommends that the potential manufacturer take gauge option into account when preparing system bids.
• Shipping and taxes. The Study Team, based on various consultations, has concluded that a complex system such as supertram rolling stock will be imported in toto, with a resultant 10 percent increase in price due to shipping. At present, whether or not import duties are levied is dependent on the abilities of the organization in question to obtain appropriate exemptions from the central Government. It is concluded that the CTA will obtain such an exclusion for tax-free import of all supertram elements, including rolling stock.
• Transparent bidding process with reputable providers. It goes without saying that a any purchase for the supertram, in particular rolling stock, must be with the long-term vision that rolling stock purchased now will be in productive service for some three decades (with proper maintenance). This demands that a quality product be chosen, and that bidding procedures be transparent. A related note is that the initial supertram order will involve some 29 trains (the equivalent of more than 100 cars); it is likely that some form of bulk purchase discount will be made available.
In consideration LRT rolling stock available on the market which has a 2.4 m width (as determined in Section 3.5.1), and which can meet forecast demand, following supply is required:
• 29 train sets to initiate year 2007 operation; and, • an additional 17 train sets which can be purchased periodically beginning
approximately year 2015 to gradually meet forecast year 2022 demand.
The cost of a modular rolling stock, as previously illustrated in Figure 3.5.22, including shipping, is some $3.55 million, or 21.4 million LE. The total investment cost for rolling stock is therefore 618.22 million LE in the initial stage, followed by an additional 362.41 million LE during later stages.
Staging of purchases is further discussed in Section 3.7, Implementation Plan.

CREATS: Phase II Final Report, Vol. III: CTA Transport Improvement Project in East Sector of Cairo Chapter 3: A NEW ROLE FOR THE HELIOPOLIS METRO
3 - 129
(4) Depot and Operation Control Center
Several depot locations have been considered along the supertram alignment, as previously presented in Section 3.2.3. Advice received in response to various presentations from the Technical Working Group for Program B, the Steering Committee and the Higher Committee, clearly suggest that the depot should be sited near the eastern end of the line, in an area roughly between the terminus of the existing Madinet Nasr line and the Ring Road. Several potential depot locations, based on field reviews by the Study Team, are shown in Figure 3.5.31. The land for the depot (and Ring Road intermodal center) should be reserved as early as possible, as the depot is a part of the first phase construction works. In response, the Study Team acting on behalf of the Higher Committee approached Cairo Governorate during July, 2003, with a view to reserving one of the designated three locations for depot functions or, if deemed more appropriate, an alternative site of similar size in the general vicinity.
Source: JICA Study Team
Figure 3.5.31 Potential Depot Locations
The existing vehicles of Heliopolis Metro will continue to use the existing depot by the HM grounds.
The supertram vehicle depot shall keep dead-end trains and perform a wide range of activities to maintain safe and comfortable vehicles for the main line service. It’s also the basis for the maintenance of the main line electrical and track facilities.
Until about 2015, the depot should allow for a storage of 29 trains. After that time, a storage space for 46 trains composed of 2 x 33m. modules is necessary. The

CREATS: Phase II Final Report, Vol. III: CTA Transport Improvement Project in East Sector of Cairo Chapter 3: A NEW ROLE FOR THE HELIOPOLIS METRO
3 - 130
corresponding track length required is 2 x 3km for the storage and 8km in total for the depot.
The minimum surface required for the Supertram depot will thus be 30,000 square meters during the initial period, and an additional 20,000 square meters reserved for after that period. These surfaces include office space and maintenance facilities: interior and exterior vehicle cleaning tracks, daily, scheduled and unscheduled inspection tracks, heavy maintenance tracks, overhaul tracks, wheel turning tracks, and storage of maintenance of way equipment, e.g. track inspection equipment and ballast equipment.
In calculating the depot construction cost, examples in Japan and cases of new line construction in foreign countries are referred to. The costs of the various depot components are as follows.
• Track : 1,733 LE/m x 8,000m = 13.9 million LE. • Turnouts (from the main line to the depot) : 111,600 LE / set x 6 sets = 669,600
LE. • Catenary, power supply : 2.69 million /km x 4km = 10.75 million LE. • Signal & Telecommunication : 5.14 million LE as determined previously per
station. • Track maintenance machines : they principally include multiple tie tamper
(placer), rail-cum-road motor car, ballast hopper car, rail transporting vehicle, track master (irregularity measuring equipment), hand tie tamper, electric generator. Total cost : 15.3 million LE.
• Rail vehicle maintenance machines / equipment : they principally include cranes, wheel lathe, fork lifts, shunting locomotives, air brake valve tester, assembly equipment, turntable, compressors, bogie washing and painting machines, air blow booth, parts cleaning equipment, circuit testing apparatus. Total cost : 57 million LE.
• Construction costs. Building construction cost is obtained by calculating the unit cost per square meter on the basis of experiences of depot construction in overseas locations. The train storage takes up approximately half of the depot surface. The total building area for offices, control centre, storage and other facilities will be approximately 15,000 m2. Total cost : 4,200 LE/m2 x 15,000m2 = 63 million LE.
• Civil engineering works cost : assuming a labor cost of 60% and machine cost of 40%, the civil engineering cost for the whole are is 570 LE/m2 x 50,000m2 = 28.8 million LE.
• Land cost : land cost is included in partnership costs.
The total cost of the depot is summarized in the Table 3.5.24.

CREATS: Phase II Final Report, Vol. III: CTA Transport Improvement Project in East Sector of Cairo Chapter 3: A NEW ROLE FOR THE HELIOPOLIS METRO
3 - 131
Table 3.5.24 Estimated Depot Costs (Million LE)
Item Amount
Track 13.86
Turnout 0.66
Catenary, power supply 10.75
Signaling & Telecom 5.14
Track maintenance machine 15.30
Rail vehicle maintenance machine 57.00
Building and control center 63.01
Civil engineering work 28.80
Total 194.52 Source: JICA Study Team
The total investment cost for depot and control facilities is therefore 122.63 million LE in the initial stage required for year 2007 operation, followed by an additional 71.89 million LE during later stages, all expressed in constant year 2003 terms.
(5) Segregation : Road and Traffic Improvements
The complete segregation of the Supertram from car traffic is best achieved with construction of road underpasses or flyovers at the most important intersections, as described in Section 3.5.1. Based on the CREATS Master Plan Phase I calculations, the cost of a road underpass and a flyover (10m clearance and 8% slope) in Cairo is similar: some 25,000 LE/m. The road construction works and corresponding costs are as follows :
• 10 underpasses, 2-lane and 1 direction by 2007 : 25,000 LE/m x 10 x 270m = 67.5 million LE.
• 5 underpasses, 2-lane and 1 direction by 2012 : 25,000 LE/m x 5 x 270m = 33.75 million LE.
• 3 underpasses, 2-lane and 1 direction by 2022 : 25,000 LE/m x 3 x 270m = 20.25 million LE.
• 2 flyovers, 2-lane and 1 direction by 2022 : 25,000 LE/m x 2 x 270m = 13.5 million LE.
The total road works amounts to 135.01 million LE.
At secondary intersections with 300-1,500 veh/hour/direction, traffic lights and a barrier system are proposed in order to manage the cars at the intersection of the Supertram tracks. The total number of these intersections is 13, and their unit cost is estimated at 600,000 LE, thus leading to a total cost of 7.8 million LE.

CREATS: Phase II Final Report, Vol. III: CTA Transport Improvement Project in East Sector of Cairo Chapter 3: A NEW ROLE FOR THE HELIOPOLIS METRO
3 - 132
The composite cost for supertram road system improvements therefore aggregates to 142.81 million constant year 2003 LE.
(6) Cost Summary
The previous Items (1) through (5) present composite unit costs associated with supertram, and resulting costs by item. Supertram costs were concurrently refined in terms of domestic and foreign content, with the implicit goal of maximizing local content whenever possible. Toward that end, the Study Team has examined major project subcomponents from three perspectives: material, labor and machines/equipment, with a view to refining domestic and foreign components for each (Table 3.5.25). In case of tracks, for example, material includes both ballast (which is local) and steel rails, which are imported. Labor includes personnel to install the rail, while materials includes equipment such a track laying machines. As a general rule, all local labor will include a minimum of 5 percent foreign content in order to cover foreign supervision of the works. It is however an objective of the Study Team to maximize the local component in order to reduce overall project costs.
The resulting cost-breakdowns (Table 3.5.26) lead to several conclusions:
• The total project cost is 2,332.64 million constant year 2003 LE. Local content comprises 807.09 million LE (35 percent to total), while foreign content comprises 1,526.55 million LE (65 percent of total).
• Of the total 2,332.64 million LE project cost, 1,876.62 million LE (80 percent) consist of actual works, with the remainder being estimated outlay for engineering, construction supervision, local administration and contingencies.
• The single highest cost category is represented by rolling stock, a total of 980.63 million LE. This represents approximately 42 percent of total project cost (Figure 3.5.32).
• Rolling stock outlay is also the single highest cost category in terms of foreign content. More than 60 percent of total project foreign component cost is consumed by rolling stock, in comparison to about seven percent of local component cost, or the previously noted 42 percent total project cost (Figure 3.5.33).
• If rolling stock is excluded from the calculation of component content, the ratio almost reverses. That is, local component now represents some 60 percent of total project cost, while foreign component reduces to 40 percent of total project cost.

CREATS: Phase II Final Report, Vol. III: CTA Transport Improvement Project in East Sector of Cairo Chapter 3: A NEW ROLE FOR THE HELIOPOLIS METRO
3 - 133
Table 3.5.25 Sample Cost Breakdown by Material, Labor and Machine Item Breakdown
category Percent by Category
%Domestic Content
%Foreign Content
Workshop / depot Material Labor Machine Weighted Avg
40 35 25
70 95 20 66
30 5
80 34
Track Material Labor Machine Weighted Avg
45 30 25
50 95 60 66
50 5
40 34
Station Material Labor Machine Weighted Avg
45 45 10
75 95 20 79
25 5
80 21
Viaduct / underpass Material Labor Machine Weighted Avg
35 30 35
95 95 95 95
5 5 5 5
Power supply Material Labor Machine Weighted Avg
45 45 10
35 95 20 61
65 5
80 39
Rolling Stock Material Labor Machine Weighted Avg
90 5 5
0 50 50 5
100 50 50 95
Source: JICA Study Team
The final element of the costing process is a temporal allocation of expenditures. This is contained in Section 3.9, Implementation Plan.
The depreciation cost of the supertram project is calculated based on a straight line depreciation approach, with annual depreciation based on anticipated component life. The average annual depreciation (excluding road and traffic improvements) is estimated at some 55.1 million constant year 2003 LE, with total depreciation through year 2022 valued at 825.9 million LE (Table 3.5.27).

CREATS: Phase II Final Report, Vol. III: CTA Transport Improvement Project in East Sector of Cairo Chapter 3: A NEW ROLE FOR THE HELIOPOLIS METRO
3 - 134
Table 3.5.26 Supertram Project Cost by Local, Foreign and Total Components (Year 2003 Constant LE)
TotalCost Local Foreign Local Foreign
(Mill LE) (Percent) (Percent) (Mill LE) (Mill LE)A INFRASTRUCTUREA1 Removal of existing equipment 12.69 95.0% 5.0% 12.05 0.63A2 Track laying on ballast 77.76 66.0% 34.0% 51.32 26.44A3 Track laying on concrete slab 1.92 66.0% 34.0% 1.27 0.65A4 Street beautification 43.79 95.0% 5.0% 41.60 2.19A5 Utilities Relocation 4.99 95.0% 5.0% 4.74 0.25A6 Station at grade level 25.50 78.5% 21.5% 20.02 5.48A7 Ramses Terminal 9.00 78.5% 21.5% 7.07 1.94A8 Groundwater drainage system 3.00 60.0% 40.0% 1.80 1.20A9 Viaducts 33.70 95.0% 5.0% 32.01 1.68
A10 Elevated station at ring road 9.00 78.5% 21.5% 7.07 1.94Total A 221.34 178.93 42.40
B SYSTEMSB1 Catenary 59.14 60.5% 39.5% 35.78 23.36B2 Substation 84.00 60.5% 39.5% 50.82 33.18B3 Switching house 15.36 60.5% 39.5% 9.29 6.07B4 Distribution lines 10.30 60.5% 39.5% 6.23 4.07B5 Signalling & Telecom 97.70 25.0% 75.0% 24.42 73.27B6 Fare collection 70.84 10.0% 90.0% 7.08 63.76
Total B 337.33 133.63 203.70C ROLLING STOCKC1 Initial fleet 29 trains 618.22 5.0% 95.0% 30.91 587.31C2 2022 fleet + 17 trains 362.41 5.0% 95.0% 18.12 344.29
Total C 980.63 49.03 931.60D DEPOT AND CONTROL CENTER
D1 Initial Depot & Control Centre (29 trains) 122.63 66.3% 33.8% 81.24 41.39D2 2022 Depot & Control Centre (17 trains) 71.89 66.3% 33.8% 47.63 24.26
Total D 194.52 128.87 65.65E ROAD AND TRAFFIC IMPROVEMENTSE1 10 Road Underpass 2-lane 1 direction 2007 67.51 95.0% 5.0% 64.13 3.38E2 5 Road Underpass 2-lane 1 direction 2012 33.75 95.0% 5.0% 32.07 1.69E3 3 Road Underpass 2-lane 1 direction 2022 20.25 95.0% 5.0% 19.24 1.01E4 2 Road flyovers 2-lane 1 direction 2022 13.50 95.0% 5.0% 12.83 0.68E5 Traffic signaling and management 7.80 75.0% 25.0% 5.85 1.95
Total E 142.81 134.11 8.70Subtotal A through E 1,876.62 624.57 1,252.05
F ENGINEERING AND CONTINGENCIES 0.33 0.67F1 Engineering and construction management 150.13 10.0% 90.0% 15.01 135.12F2 Local administration 93.83 100.0% 0.0% 93.83 0.00F3 Contingency 212.06 73.34 138.72
Subtotal F 456.02 182.19 273.83GRAND TOTAL 2,332.64 807.09 1,526.55
Component Share Component CostCosting Item and Category
Source: JICA Study Team

CREATS: Phase II Final Report, Vol. III: CTA Transport Improvement Project in East Sector of Cairo Chapter 3: A NEW ROLE FOR THE HELIOPOLIS METRO
3 - 135
0
100
200
300
400
500
600
700
800
900
1,000
1,100
Infrastructure Systems Rolling stock Depot Road and TrafficImprovements
Engineering,Construction,Local Admin.
Contingency
Supertram Project Costing Category
Mill
ion
Con
stan
t LE
Foreign Content
Local Content
Source: JICA Study Team. All cost in terms of constant year 2003 LE at exchange rate of US$ 1.00 = 6 LE.
Figure 3.5.32 Absolute Supertram Project Outlay by Costing Category
0
5
10
15
20
25
30
35
40
45
50
55
60
65
Infrastructure Systems Rolling stock Depot Road and TrafficImprovements
Engineering,Construction, Local
Admin.
Contingency
Supertram Project Costing Category
Perc
ent o
f Loc
al, F
orei
gn a
nd T
otal
Pro
ject
Com
pone
nts
Local ContentForeign ContentTotal Project
Source: JICA Study Team. All cost in terms of constant year 2003 LE at exchange rate of US$ 1.00 = 6 LE.
Figure 3.5.33 Relative Supertram Project Outlay by Category Content

CREATS: Phase II Final Report, Vol. III: CTA Transport Improvement Project in East Sector of Cairo Chapter 3: A NEW ROLE FOR THE HELIOPOLIS METRO
3 - 136
Table 3.5.27 Depreciation for Supertram Project (Constant Year 2003 LE)
Costing Category Effective Life (Years)
Category Cost
(Million LE)
Annual Depreciation (Million LE)
Infrastructure 60 221.34 3.69 Systems 20 337.33 16.87
Rolling Stock 35 980.63 28.02 Deport/Control Center 30 194.52 6.48
Total 1,733.81 55.06 Depreciation over composite 2007-2022 period (Mill LE) 825.86
Source: JICA Study Team
(7) Partnership Costs
As noted previously, to enhance the potential for actual implementation of Supertram Line 1, it is necessary to formulate a new approach such as a public-private partnership or intergovernmental cost sharing system. Under this approach, a governmental entity, or the private sector, contributes toward some of these Supertram Line 1 joint-use costs, rather than attempting to obtain full financing of all possible costs via project resources. Such partnership costs, which are in addition to the 2,332.64 million LE supertram project cost, are presented in this subsection.
• Ring Road station is seen as a crucial intermodal center, and heavy load point, for Supertram Line 1. Ridership forecasts suggest that a sizable park-and-ride facility, on the order of 5,000 spaces, should be provided at this location. Due to the strategic location of this station, ample opportunity for joint development activities exist (please refer to Section 3.5.7, and conceptual design presented in Section 4.5). While supertram project costing takes into account outlay for the LRT station proper, partnership costs are expected to include land for the park-and-ride as well as public transport terminal. An estimated 125,000 square meters will be required; an estimated unit cost of 500 LE results in land cost of 63.75 million LE. However, land cost is very difficult to quantify until final arrangements are complete; it could, in principal, also be zero if the Governorate were to donate this land as part of a joint development project. Parking and public transport facilities are expected to add an additional 14.3 million LE, resulting in a package cost of some 78 million LE.
• Simple feeder bus facilities should be planned at all stations, consisting of a sign post , cover, map and bench. The average cost for a such facility is estimated at 15,000 LE, resulting in a total of 285,000 LE at all stations.
• One of the key contribution of partnership funding is land for the supertram depot. As is the case with Ring Road station, unit costing is very difficult given the vagaries of local procedures. Using the same unit value of 500 LE per square meter results in depot land costs of 25.5 million LE, assuming a 50,000 square meter minimum size plot is reserved.

CREATS: Phase II Final Report, Vol. III: CTA Transport Improvement Project in East Sector of Cairo Chapter 3: A NEW ROLE FOR THE HELIOPOLIS METRO
3 - 137
• The need to optimize bus services within the supertram catchment area is discussed in Section 4.2. A key conclusion in this regard is the provision of some 175 air conditioned buses to provide various feeder functions to supertram, and enhanced bus services within East Cairo. The total cost of 62.5 million LE is based on 125 full-sized buses at a unit price of 400,000 LE, and 50 mini-buses at a unit price of 250,000 LE.
• The need to upgrade remaining portions of the Heliopolis Metro on an interim basis prior to undertaking feasibility reviews for Supertram Lines 2 and 3 is discussed in Section 4.1. Budget has been allocated for modernizing rolling stock (22 trains at a unit cost of 3 million LE), reshaping of rail (22.2 km at a unit cost of 300,000 LE per kilometer) and refurbishing stations (lump sum estimate of 12 million LE). Total Heliopolis Metro partnership costs are noted at 84.66 million LE.
The inclusion of allowances for engineering and construction management (only for the Heliopolis Metro upgrading), local administration and contingency boosts total partnership costs to 297.33 million constant year 2003 LE. The partnership costs are seen as overwhelmingly of local content; only 14 percent would be a foreign component (Table 3.5.28).
Table 3.5.28 Partnership Cost by Local, Foreign and Total Components (Year 2003 Constant LE)
TotalCost Local Foreign Local Foreign
(Mill LE) (Percent) (Percent) (Mill LE) (Mill LE)P1 Parking for 5000 cars, Ring Road Station 14.28 95.0% 5.0% 13.57 0.71P2 Parking land acquisition 63.75 95.0% 5.0% 60.56 3.19P3 Feeder Bus Facility at stations 0.28 95.0% 5.0% 0.27 0.01P4 Depot land acquisition 25.50 95.0% 5.0% 24.23 1.28P5 Airconditioned Feeder buses 62.50 60.0% 40.0% 37.50 25.00P6 Heliopolis Metro Upgrading
Renew rolling stock 66.00 95.0% 5.0% 62.70 3.30 Track shaping 6.66 75.0% 25.0% 5.00 1.67 Stations 12.00 95.0% 5.0% 11.40 0.60Subtotal 250.97 215.22 35.76
P7 Engineering and construction management 6.77 80.0% 20.0% 5.42 1.35P8 Local administration 12.55 100.0% 0.0% 12.55 0.00P9 Contingency 27.03 0.0% 0.0% 23.32 3.71
Subtotal 46.35 41.29 5.07GRAND TOTAL 297.33 256.50 40.82
Costing Item and CategoryComponent Share Component Cost
Source: JICA Study Team

CREATS: Phase II Final Report, Vol. III: CTA Transport Improvement Project in East Sector of Cairo Chapter 3: A NEW ROLE FOR THE HELIOPOLIS METRO
3 - 138
3.5.7 A Case for Joint Development
Joint development projects focus on removing the obstacles to partnerships between the Supertram system and private sector developers in order to foster more effective use of the Supertram owned property. The benefits of joint development include: securing an additional revenue stream for the Supertram; increasing its ridership; and shaping land use patterns by partnering with the private sector to develop real estate and other agency-owned assets adjacent to the stations.
(1) The Economic Reasons
Development near the Supertram will help to maximize public investment in the system. To make the Supertram economically viable, a sufficient number of potential riders must live and work near transit stations. To get the most economic benefit from the Supertram, residential and office development should by focused near stations. Station locations have been identified by the Study Team on this basis, by ensuring the highest number of population, employment and students are served within 800 meters.
Building near a station is not only good for the Supertram; it is good for the developer and property owner. Residential and commercial projects near LRT systems typically appreciate in value more rapidly than other projects. As demand for scarce properties near transit stations increases, this trend will continue. A report by Economics Research Associates (ERA) in 1995, documents significant increases in property values for medium density apartments and condominiums and commercial and retail properties located near rapid transit stations.
Similar findings have been made in the case of commercial properties. The 1995 ERA study analyzed a sample of commercial buildings in San Francisco and Oakland and found that "walking distance to a BART station and office rent per square foot are linearly related." A similar trend was found by the ERA study for retail rents. In this case, retail rents close to transit were almost three times higher than in other areas. An article by Berkeley Professor Robert Cervero in the Journal of the American Planning Association concludes that: "Average office rents near stations rose with system wide ridership; joint development projects added more than three dollars per square foot to annual office rents. Office vacancy rates were lower, average building densities higher, and shares of regional growth larger in station areas with joint development projects... Combining transit investments with private real estate projects appears to strengthen these effects."
Development near rail transit also increases tax revenues for cash-strapped local governments. As the value of property near transit appreciates, property taxes collected by local government also increase. In fact, some cities take advantage of this by using tax-increment financing to help fund expansion of their LRT.
A 1987 study prepared by the Joint Center for Urban Mobility Research at Rice University analyzed property values in transit areas in ten cities and found that in

CREATS: Phase II Final Report, Vol. III: CTA Transport Improvement Project in East Sector of Cairo Chapter 3: A NEW ROLE FOR THE HELIOPOLIS METRO
3 - 139
many cases the increase in land value due to the introduction of a LRT was more than 100 percent of the total construction costs of the investment.
In Portland, Oregon a 1993 study found that the assessed value of different station area properties had increased by 112% to 491% from 1980 to 1991, compared to a national average increase of 67.5%. Portland's transit agency, Tri-Met, estimates that its light rail line has generated over $1.2 billion dollars in development exceeding ten million square feet, immediately adjacent to MAX, its light rail line. Another $440 million worth of improvements are being planned and in Washington, D.C., during the first three years of operation the Metrorail system attracted $970 million in new development to locations near transit stops. This new investment yielded an increase of $50 million dollars in local tax revenues in 1985 alone. The value of land was estimated to be $6 to $8 per square foot greater within the impact areas of the LRT station than in a non-station location.
The DART system in downtown Dallas sparked a nearly 33 percent jump in retail sales between mid-1997 and mid- 1998, as opposed to only a 3 percent rise citywide over the same period.
Similar positive effects have been found in relation to the Toronto and San Diego LRT systems.
(2) The Social Reasons
Smaller cities have been able to revitalize their downtowns and main streets through transit oriented development. The City of Denver pumped new life into its downtown by putting in a light rail line and creating a bus transit mall. Free bus service along the mall, together with the preservation and re-use of historic buildings along the mall and in the Lower Downtown district have reversed the area's decline and turned it into an inviting location in which to live, shop, work and play.
By attracting new development, transit can be a catalyst for revitalizing deteriorating neighborhoods. Several cities in the San Francisco Bay Area have replaced blighted sections of their community with new residential and commercial development close to transit. For example, the City of Richmond transformed a deteriorated park in its downtown, just one block from a BART station, into a retail and residential centre. Anchored by a supermarket and drug store, the 78,000 square-foot centre includes several neighborhood-serving shops that combine to create 200 new permanent jobs. Memorial Park also features 64 low-income family apartments, 34 town homes for first-time buyers and a one-acre park.
Housing near transit can create more affordable places for people to live in, especially since it gives them the option of not having to own a car. This can be a heavy burden for most people, but especially for low-income families who may be forced to live in substandard housing to make ends meet. In some regions it may also force middle-income families to move to distant suburban locations that are

CREATS: Phase II Final Report, Vol. III: CTA Transport Improvement Project in East Sector of Cairo Chapter 3: A NEW ROLE FOR THE HELIOPOLIS METRO
3 - 140
more affordable. The end result: more money spent on cars and fuel, and more time wasted in long commutes.
Housing near transit can provide more accessible transportation, especially for children, the elderly and disabled. Dependence on automobiles in many communities has severely limited the ability of many people - especially the young and the elderly - to get around. Development near transit not only allows people without cars to get where they want to go, but provides more pedestrian destinations close by because of its more compact, mixed-use nature.
(3) Organizing Transit Oriented Development (TOD) in Cairo
The mission of the TOD section in Cairo should be to create and facilitate opportunities to preserve or expand the city’s transit and property investments through private development, capital expenditures or joint development for land use that encourages transit ridership through its design, operation and use across the city. Stations that have a strong potential for joint development along the Supertram are as previously mentioned the Ring Road.
Transit Oriented Development, also known as joint development, includes land uses whether residential, commercial or both, whose form and function are strategically designed and constructed to utilize nearby transit infrastructure as a significant component of the development’s sustainability.
TOD, spans:
• concepts of using land owned by the mass transit agency for dense private sector development that generates transit ridership and revenue from sale or leasing of the land,
• to purely private development on private land near a mass transit station but with some positive impact on transit ridership.
Joint development is a real property asset development and management program designed to secure the most appropriate private and/or public sector development on Transit Agency-owned property at and adjacent to transit stations and corridors. Joint Development also includes coordination with local jurisdictions in station area land use planning in the interest of establishing development patterns that enhance transit use.
The missions of the four main institutions that can ensure TOD in Cairo, are outlined hereafter :
1) Transit Agency Role (Cooperation between Supertram operator and Cairo Governorate) :
• Project advocate. Directs the Authority's station area joint development and transit oriented development program. Assists with the management and

CREATS: Phase II Final Report, Vol. III: CTA Transport Improvement Project in East Sector of Cairo Chapter 3: A NEW ROLE FOR THE HELIOPOLIS METRO
3 - 141
disposal of real estate. Develops and distributes requests for proposals to potential developers.
• Planning partner. Prepares preliminary studies to identify land use and development opportunities that support the business community and Cairo City.
• Will sell or lease land for right project. • Park & Ride landowner.
2) Public Sector Role :
• Facilitate community process. • Authority in planning, zoning and building permits. • Leads/splits station area planning cost. • Realizes site tax revenues. • May subsidize project.
3) Community Role :
• Must live with resulting development. • Assist in the designing and land zoning process. • Become the first market to absorb products. • Ensure usability.
4) Developer Role :
• Finalizes conceptual TOD plan. • Obtains zoning and other approvals. • Secures financing for project. • Completes necessary land assemblages. • Manages development. • Builds final project.
Formulas for public funding vary. Portland's regional government, for example, uses federal funds to purchase station sites, reselling them to developers at discounts based on projected ridership and extraordinary costs. Maryland's transportation department draws on state funds to award grants to developers for transit-related improvements, while a San Mateo County, Calif., government association gives its money to cities: as much as $2,000 per bedroom for high-density housing around stations.
The San Francisco Bay Area Rapid Transit District (BART) is custodian of a large-scale public investment which includes important real property assets. In many cases, these properties can sustain additional profitable uses supportive of the District's main transit function. By encouraging high quality and more intensive development on and near BART-owned properties, the District can promote the use
CREATS: Phase II Final Report, Vol. III: CTA Transport Improvement Project in East Sector of Cairo Chapter 3: A NEW ROLE FOR THE HELIOPOLIS METRO
3 - 142
of public transit and generate new revenues for transit while also creating attractive investment opportunities for the private sector and facilitating local economic development goals.
In 1984, the BART Board of Directors adopted the following property development goal: To generate new sources of income (and/or capital offsets) and to increase transit ridership through cooperative public/private sector development projects on or near District-owned properties.
In summary, the benefits of a TOD in Cairo could include :
• Increased property and sales tax revenues. • Affordable housing (in some cases). • Reduced air pollution, traffic congestion and energy consumption. • Creation of development opportunities. • More effective development patterns (i.e., concentrated development around
existing infrastructure).

CREATS: Phase II Final Report, Vol. III: CTA Transport Improvement Project in East Sector of Cairo Chapter 3: A NEW ROLE FOR THE HELIOPOLIS METRO
3 - 143
3.6 ENVIRONMENTAL IMPACT ASSESSMENT
This section sets forth background, methodology and findings of the Environmental Impact Assessment (EIA) for the Supertram Line 1 project.
3.6.1 Introduction
Transport improvement projects are implemented to improve the mobility of goods and persons, which should result in improved economic development. Consequently, it will improve the social environment of the people involved. However, almost every project has also negative impacts on the environment, being slight or severe.
An EIA is an integral part of the process of project selection, design and implementation. It should be a tool for decision makers to consider the impacts of proposed activities on the (physical and social) environment, in order to seek for alternatives, to prepare steps to mitigate the negative impacts and to enhance the positive impacts. If necessary a proposed activity should be rejected.
To ensure sustainability for the Supertram Project, one of the selected transport improvement projects for Greater Cairo (CREATS Phase II), a scoped Environmental Impact Assessment (EIA) has been carried out as part of the feasibility study. The EIA indicates the potential negative as well as the positive environmental impacts to be expected from the selected transport development project. Also mitigation measures, required to alleviate the identified adverse environmental impacts, are provided. The EIA has been carried out by Egyptian consultants (MB Consultants; Ref. 3) according to the Egyptian, JICA, and international guidelines and regulations.
Part of the Environmental Impact Assessment were Environmental Surveys. An Air Quality and Noise Level Survey, and a Social Survey (Social Impact Assessment), were carried out. Their results revealed the present environmental condition of the Project Area, as well as the opinion of the residents on the proposed project.
The following definitions have been applied:
• Initial Environmental Examination (IEE): the examination/assessment to determine the environmental impacts that may be created by a proposed transport development project, based on existing information and data, easily accessible information, and professional judgement.
• Screening: the evaluation/judgement on the necessity of an Environmental Impact Assessment.
• Scoping: the identification of important/significant environmental impacts, resulting from a proposed transport development project, and the formulation of items to be studied in an EIA.
• Significant environmental impact: a fundamental change to the physical, biological, or social environment, resulting from a proposed transport development project.
CREATS: Phase II Final Report, Vol. III: CTA Transport Improvement Project in East Sector of Cairo Chapter 3: A NEW ROLE FOR THE HELIOPOLIS METRO
3 - 144
• Environmental Impact Assessment (EIA): a detailed and in-depth research study on significant environmental impacts to be expected from a proposed transport development project.
• Environmental Management Plan: a document presenting those efforts that will be made to manage adverse environmental impacts resulting from a proposed transport development project.
• Environmental Monitoring Plan: a document presenting those efforts that will be made to monitor the environmental components, which may be affected by a proposed transport development project.
3.6.2 Egyptian Guidelines and Legislation related to Environmental Impact Assessment
(1) Governmental Agencies
Environmental guidelines to be followed in the Study are in principle the guidelines and regulations of Egypt, as well JICA and other international environmental guidelines. In general, it can be stated that Egyptian environmental regulations, as well as other international guidelines (like World Bank and EC guidelines), prescribe that transport development projects should be designed and constructed along environmentally sound principles to ensure sustainability.
The State Ministry of Environmental Affairs, established in 1982, is the final body in Egypt for all matters relating to national environmental policy and regulatory actions. Apart from overseeing the activities of the implementing agency, the Egyptian Environmental Affairs Agency (EEAA), the ministry has major inputs on the setting of the environmental policy and public investment projects. The EEAA has a broad mandate and regulatory power for enforcing Law No 4 for Environment (1994) and various environmental regulations. The EEAA is also responsible for environmental guidelines and setting of standards for industries, surveillance of environmental quality and sampling, and stipulation of corrective measures for polluters. It reviews EIA’s for development projects and provides environmental clearance. The Agency has the mandate to develop public awareness, environmental training and undertake research on environmental resource management.
Through its regional branch offices the EEAA oversees all activities in the field of environment in Egypt. In undertaking its duties, the EEAA cooperates with several multilateral and bilateral donors, as well as a large number of Egyptian bodies. The latter include research institutes, universities, and central and local government agencies. As far back as 1992, Egypt developed a National Environmental Action Plan (Environmental Action Plan of Egypt), which addressed all major issues related to Egypt's environment. The Plan provides the basis for environmental action and the framework for foreign funding of environmental projects in Egypt.

CREATS: Phase II Final Report, Vol. III: CTA Transport Improvement Project in East Sector of Cairo Chapter 3: A NEW ROLE FOR THE HELIOPOLIS METRO
3 - 145
(2) Environmental Laws and Regulations in Egypt
Major enacted presidential decrees on the protection of environment in Egypt include:
• The Presidential Decree No. 631 of 1982 for setting up an Environment Affairs Agency affiliated to the Cabinet.
• The Presidential Decree No. 54 of 1983 on the protocol for the protection of the Mediterranean Sea from pollution.
• The Presidential Decree No. 478 of 1988 on the Civil Obligation Agreement Against Oil Spills signed in Brussels in 1969.
• Enacted laws regulating the protection of natural resources and environmental quality are:
• Law No. 27 of 1981 for employing mine and quarry workers.
• Law No. 48 of 1982 for protecting the River Nile and waterways against pollution.
• Law No. 102 of 1983 for nature reserves.
• Law No. 3 of 1982 for urban planning.
• Law No. 116 of 1983 / Law No. 2 of 1985 for agricultural land scooping.
• Law No. 117 of 1983 for archaeological protection.
The most important legal framework with reference to environmental protection is the “Law No. 4 of 1994”. This law explains the objectives and policies advocated by the EEAA, and their means of realization. The Law called upon the formation of an Environmental Protection Fund to support environmental protection projects and studies. The law also outlines the legal requirements and procedures for Environmental Impact Assessment for different categories of development projects, including the construction of infrastructure for the transport sector.
The EEAA published in 1996 the “Guidelines for Environmental Impact Assessment”. These guidelines complement the above mentioned rules and protective measures stipulated in the Environmental Law 4/1994. For the CREATS Study, the sections dealing with the categories of projects and the sector guidelines are of special relevance.
Similar EIA guidelines have been developed in the Ministry of Housing, Utilities and Urban Communities, as well as the Ministry of Transport, reflected in the “Egyptian Code for Urban and Rural Highway Works”. A special circulation letter has been circulated by the EEAA which regulates the Implementation of Infrastructure Development Projects in the Transport Sector.
It can be concluded that the Egyptian Environmental laws and regulations are well developed and do not lack behind - for the major environmental problems - compared to international environmental laws, regulations and guidelines.

CREATS: Phase II Final Report, Vol. III: CTA Transport Improvement Project in East Sector of Cairo Chapter 3: A NEW ROLE FOR THE HELIOPOLIS METRO
3 - 146
3.6.3 Environmental Impact Assessment for the Supertram Project
(1) Introduction
Potential adverse and positive environmental impacts have been identified for the proposed Supertram Project. Also, the existing situation in the Project Area has been evaluated for its environmental condition.1
In the following sub-chapters the major results of the Air Quality Survey, the Noise Level Survey and the Social Survey are presented. A description of the sites is depicted in Table 3.6.1.
Table 3.6.1 Description of Measurement Locations, Supertram Line 1
No. Location Location Name and Description 1. 01ST7 Madinet Nasr Metro Station 8th District 2. 02ST7 Crossing of Mostafa El Nahhas with Hassan El Shereef St. (Manhal Schools) 3. 03ST1 Crossing of Mostafa El Nahhas with Makram Ebeid St. (Tawheed Wel Nour) 4. 04ST7 Crossing of Mostafa El Nahhas with Abbas El Aqqad St. (Osman Buildings) 5. 05ST1 Crossing of Mostafa El Nahhas with Abbas El Aqqad St. (International Garden) 6. 06ST7 Crossing of Mostafa El Nahhas with Tayaran Steet (Madinet Nasr) 7. 07ST1 Crossing of Yoosef Abbas St. with Autostrad (Zohoor Club) 8. 08ST1 Crossing of Khedr El Toony St. with Tayaran St.( Back ground )
9. 09ST7 Crossing of Ahmed Tayseer St. With Merghany St. Next to the Mosque and Ezaby Pharmacy
10. 10ST1 Crossing of Ahmed Tayseer St. With Merghany St. Next to Koleyet El Banat.( Back ground
11. 11ST7 Roxy Square in front of Heliopolis Club 12. 12ST1 Ebn Sandar Square 13. 13ST7 EL Khalifa el Ma'moun St. at Abdel Naser Mosque under the bridge 14. 14ST1 Next to Mansheyet El Sadr Metro Station.( Back ground ) 15. 15ST1 Ghamra Square 16. 16ST7 Ramses Square 17. 17STN Between Location 1 and 2 18. 18STN Between Location 2 and 3 19. 19STN Between Location 3 and 4 20. 20STN Between Location 5 and 6 21. 21STN Between Location 6 and 7 22. 22STN Between Location 7 and 8 at Yoosef Abbas Street before Khedr El Toony Street 23. 23STN Between Location 8 and 10 24. 24STN Between Location 9 and 11 25. 25STN Between Location 11 and 12
1 For full detail the interested reader is referred to “The Environmental Impact Assessment Supertram, CREATS
Phase 2, Cairo, October 2003” which was carried out by MB Consultants under a subcontract with JICA Study Team.

CREATS: Phase II Final Report, Vol. III: CTA Transport Improvement Project in East Sector of Cairo Chapter 3: A NEW ROLE FOR THE HELIOPOLIS METRO
3 - 147
No. Location Location Name and Description 26. 26STN Between Location 12 and 13 27. 27SRN Between Location 13 and 14 28. 28STN Between Location 14 and 15 29. 29STN Between Location 15 and16
Note: Key for Location ID; example 06 ST7/N: 06: location number; ST: Supertram; 7: measuring days; N: if used, only noise measurement.
(2) Air Quality Survey
The measured concentrations of air pollutants were compared with the Air Quality Standards of Egypt (Executive Regulations to Environmental Law No.4 of 1994) for air quality in terms of NO2, SO2, CO, PM10 and O3, as summarized in Table 3.6.2, which presents the measured air quality on “Wednesdays” for the parameters for the comarison. Wednesdays are thought to be the bussiest days in Cairo, and consequently have the heaviest air pollution in the week.
Table 3.6.2 Summary Results of Air Quality Survey for Superram Line 1
NO2 Nitrogen Dioxide
SO2 Sulphur Dioxide
CO Carbon
Monoxide
PM10 Particulate
matter 10 µm
O3 Ozone
Measured Egypt Standad
Meas’d Egypt Std.
Meas’d Egypt Std.
Meas’d Egypt Std.
Meas’d Egypt Std.
Location
(µg/m3 ) (µg/m3 ) (mg/m3 ) (µg/m3 ) (µg/m3 ) 14ST1 58 150 45 150 6.2 10 60 70 76 120 16ST7 123 150 68 150 14,4 10 211 70 55 120 11ST7 72 150 12 150 9.2 10 119 70 63 120 13ST7 59 150 73 150 4.1 10 147 70 82 120 05ST1 39 150 12 150 6.4 10 65 70 130 120 09ST7 78 150 9 150 8.1 10 126 70 60 120 02ST7 65 150 17 150 9.3 10 121 70 95 120 06ST7 69 150 11 150 10.6 10 155 70 86 120 01ST7 39 150 21 150 2.6 10 119 70 79 120 04ST7 65 150 8 150 9.9 10 107 70 60 120
Notes: 1) Measured: 24 hours average concenration of air pollutants for NO2, SO2 and PM10; and 8 hours average for CO and O3.
2) Egyptian Standard: Environemntal Law 4, 1994 3) Shaded cells are those with exceeding limits.
From the comparion between all the air quality measurements and the Egyptian Standards, the following conclusions can be derived:
• Fine dust (PM10 :Particulate Matter, les than 10µm) levels exceed heavily the Egyptian standard (70 µg/m3) at most measuring locations almost continuously;

CREATS: Phase II Final Report, Vol. III: CTA Transport Improvement Project in East Sector of Cairo Chapter 3: A NEW ROLE FOR THE HELIOPOLIS METRO
3 - 148
• The Carbon Monoxide (CO) and Ozone (O3) levels exceeded the Egyptian standards (10 mg/m3 for CO and 120 µg/m3 for O3) at several locations occasionally;
• Sulphur Dioxide (SO2) concentrations are at a considerable level, however below the Egyptian Standards; and,
• The Nitrogen Dioxide (NO2) concentration is at considerable level, however still below the Egyptian Standard.
As seen above, the measured concentrations of PM10 appeared to be high. Generally, this type of very fine suspended particles comprises of: coal; oil fly ash; metals; metal oxides; and tire wear debris; street dust; and Carbon, Sulphate and Nitrate particles.
The sources of particles of 10 µm or less (PM 10) are generally:
• combustion of oil, diesel, gasoline, coal, and wood; • traffic, and industrial and agricultural operations; • construction and demolition operations; and, • transformations from NOx and SO2.
(3) Noise Level Survey
The noise levels stipulated by the Egyptian Standards are:
• during the day (>55 dB); • during the evening (>50 dB); and • during the night (>45 dB). The Noise Level measurements at 29 locations in the Project Area for the Supertram Project are summarized in Table 3.6.3. As seen in this table, at the all the .locations, the noise levels significantly exceeded the Egyptian Standards. This results confirms the outcome of earlier Noise Level measurements, which were carried out during Phase I of CREATS.
Traffic produces noise that can cause considerable annoyance. It can interfere with daily life, like: work, sleep, study, communication and recreation. Long term exposure to noise can generate undesirable physical and psychological effects. In calm environments, generally sound levels of 30 - 50 dB(A) are measured. Disruptive sounds have noise levels higher than about 70 dB(A). Generally, negative impacts on health are attributed to high noise levels in many symptoms such as fatigue; headache; lack of concentration; sleep disturbance; delayed reaction; mood and behavioural changes; high blood pressure; hearing impairment; and neurological ailments.

CREATS: Phase II Final Report, Vol. III: CTA Transport Improvement Project in East Sector of Cairo Chapter 3: A NEW ROLE FOR THE HELIOPOLIS METRO
3 - 149
Table 3.6.3 Summary of Noise Levels for All Sites, Supertram Line 1
Day Evening Night
7 am – 6 pm 6 pm – 10 pm 10 pm – 7 am
Egyptian Standard (Environmental Law 4, 1994) : Maximum Permissible Noise
Level (dB) in Residential Area 45 – 55 40 – 50 35 - 45
Survey Location Measured Noise Levels (dB) Location 1 68.33 67.55 67.54 Location 2 72.95 73.43 71.52 Location 3 69.44 71.40 66.34 Location 4 75.65 75.45 68.92 Location 5 65.57 64.85 66.52 Location 6 71.07 70.18 67.24 Location 7 76.97 75.68 73.44 Location 8 74.11 72.83 66.87 Location 9 66.84 69.13 64.39
Location 10 72.76 73.83 69.38 Location 11 73.52 71.88 67.90 Location 12 75.68 76.50 70.62 Location 13 67.42 66.28 65.59 Location 14 64.23 67.15 62.81 Location 15 79.28 73.78 77.17 Location 16 81.55 82.88 80.92 Location 17 68.71 67.95 67.17 Location 18 72.91 73.10 69.84 Location 19 69.17 70.78 66.31 Location 20 65.52 66.40 64.02 Location 21 76.49 75.38 72.64 Location 22 73.47 73.93 67.84 Location 23 73.35 72.03 70.97 Location 24 73.09 72.53 71.59 Location 25 73.49 71.65 67.51 Location 26 67.96 67.23 65.06 Location 27 67.81 66.93 65.37 Location 28 79.23 74.48 77.10 Location 29 79.26 69.68 70.44
Source: JICA Study Team
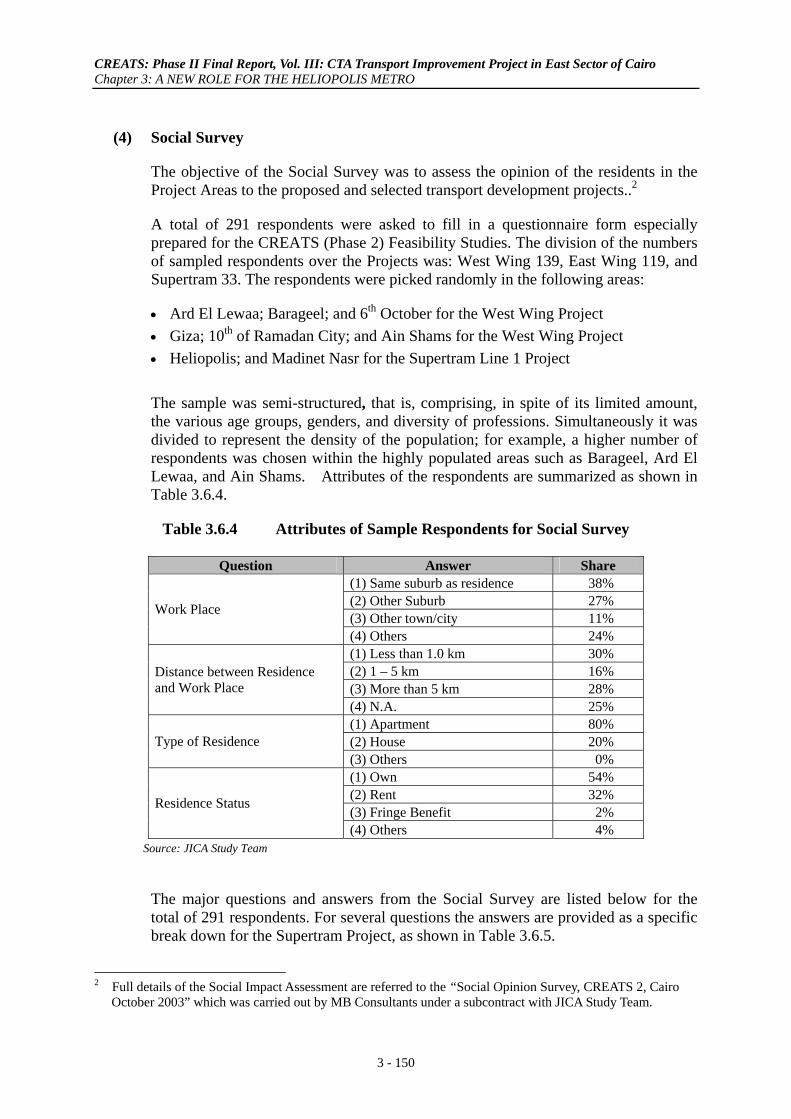
CREATS: Phase II Final Report, Vol. III: CTA Transport Improvement Project in East Sector of Cairo Chapter 3: A NEW ROLE FOR THE HELIOPOLIS METRO
3 - 150
(4) Social Survey
The objective of the Social Survey was to assess the opinion of the residents in the Project Areas to the proposed and selected transport development projects..2
A total of 291 respondents were asked to fill in a questionnaire form especially prepared for the CREATS (Phase 2) Feasibility Studies. The division of the numbers of sampled respondents over the Projects was: West Wing 139, East Wing 119, and Supertram 33. The respondents were picked randomly in the following areas:
• Ard El Lewaa; Barageel; and 6th October for the West Wing Project • Giza; 10th of Ramadan City; and Ain Shams for the West Wing Project • Heliopolis; and Madinet Nasr for the Supertram Line 1 Project The sample was semi-structured, that is, comprising, in spite of its limited amount, the various age groups, genders, and diversity of professions. Simultaneously it was divided to represent the density of the population; for example, a higher number of respondents was chosen within the highly populated areas such as Barageel, Ard El Lewaa, and Ain Shams. Attributes of the respondents are summarized as shown in Table 3.6.4.
Table 3.6.4 Attributes of Sample Respondents for Social Survey
Question Answer Share (1) Same suburb as residence 38% (2) Other Suburb 27% (3) Other town/city 11% Work Place
(4) Others 24% (1) Less than 1.0 km 30% (2) 1 – 5 km 16% (3) More than 5 km 28%
Distance between Residence and Work Place
(4) N.A. 25% (1) Apartment 80% (2) House 20% Type of Residence (3) Others 0% (1) Own 54% (2) Rent 32% (3) Fringe Benefit 2%
Residence Status
(4) Others 4% Source: JICA Study Team
The major questions and answers from the Social Survey are listed below for the total of 291 respondents. For several questions the answers are provided as a specific break down for the Supertram Project, as shown in Table 3.6.5.
2 Full details of the Social Impact Assessment are referred to the “Social Opinion Survey, CREATS 2, Cairo
October 2003” which was carried out by MB Consultants under a subcontract with JICA Study Team.

CREATS: Phase II Final Report, Vol. III: CTA Transport Improvement Project in East Sector of Cairo Chapter 3: A NEW ROLE FOR THE HELIOPOLIS METRO
3 - 151
Table 3.6.5 Summary of Answers of Social Surveys Related to the Projects
Question Answering Item Supertram Project
West Wing Busway Project
East Wing Railway Project
(1) Yes 27% 39% 59% 1. Do you know about the planned Projects ? (2) No 73% 61% 41%
(1) Agree 97% 89% 92% (2) Not Agree 0% 6% 4% 2. What is your opinion about
the Projects ? (3) Unknown 3% 4% 3% (1) Frequently 42% 65% 73% (2) Not Frequently 9% 14% 8% (3) Occasionally 42% 17% 15%
3. Would you use the New Transport System?
(4) No use 6% 4% 3% (1) Positive 97% 83% 92% (2) Negative 3% 16% 6%
4. How do you think about the Environmental Impact of the Project? (3) Others 0% 1% 2%
(1) Positive 100% 93% 95% (2) Negative 0% 6% 4%
5. How do you think about Socio-cultural Impact of the Projects ? (3) Others 0% 1% 1%
Source: JICA Study Team
As for Question 1, it is not a surprising result that the basic perception level on the Project is significantly low among residents, as only 27% of interviewees know the Supertram Project, because this project is a new idea proposed by the CREATS Master Plan. After this question, however, all interviewees were briefly informed of the Project, and then, the next questions on their opinion were made. Therefore, their expectation and acceptance of the Project are based on their knowledge on the Project to some extent.
Major conclusions of the Social Survey can be summarized as follows:
• There is evident agreement with the projects, including the Supertram Project.
• Most of the residents concerned would use the new facilities.
• The residents concerned regard the selected projects as highly positive for the physical as well as for the socio-cultural environment.
(5) Expected Negative Environmental Impacts from the Supertram Project
Activities and processes, related to transport development projects, may result in significant negative as well as positive impacts on the environment. Potential adverse impacts on the physical/biological as well as on the socio-cultural environment have been identified for the Supertram Project as summarized in Table 3.6.6. Only potential realistic impacts are presented for the proposed transport development project.
The core reasons why the environmental impacts of the proposed Supertram Project are minor include:
• The Supertram Project is a public transport project (versus projects promoting use of private cars);

CREATS: Phase II Final Report, Vol. III: CTA Transport Improvement Project in East Sector of Cairo Chapter 3: A NEW ROLE FOR THE HELIOPOLIS METRO
3 - 152
• Electrified LRT system: less energy consumption and less emissions compared to the use of cars;
• The Project is situated in an urban environment: there will be no impact on fragile ecology;
• The right of way is mainly owned by the government, and free of houses and other structures; and,
• The impacts can be mitigated.
Table 3.6.6 Expected Adverse Environmental Impacts from the Supertram Project in the Pre-Construction, Construction and O & M Phases
Project Activities Expected Adverse Impacts (Socio-economic and physical/biological aspects)
Pre-construction/Design Phase Survey and site investigations. Land acquisition: area to be acquired for the "right of way" (total 275,000 m2).
Pre-construction Phase Fragmentation/split up of areas; increased physical barriers. Impact on aesthetics.
Construction Phase 1. Earthworks:
- haulage of fill and construction material - shaping, finishing of embankment
2. Construction of 2 fly-overs and 18 underpasses:
- excavation works - foundation works - construction of piers - construction of beams - erection of beams and casting deck slabs
3. Asphalt plant 4. Sign posting, traffic control
Construction Phase 1,2,3,4: Disposal of waste, waste spills (oil), interruption of water flows, erosion/ sedimentation, air pollution, spills of waste, vibrations, noise, safety risks for workers, damage to existing roads, traffic congestion, disposal of earth material/spoils, impact on aesthetics.
Operation & Maintenance Phase Trams in operation Maintenance and repairs of tracks Maintenance and repairs of signposts Cleaning up of debris Maintenance of planted trees, grass and berms
Operation & Maintenance Phase Noise and vibrations. Risk of accidents (public health). Impact on aesthetics by fly-overs.
Source: JICA Study Team
(6) Expected Positive Impacts of the Supertram Project
Often the existing transport situation is unsatisfactory in several aspects; this is the reason why transportation improvement projects are initiated and developed. Table 3.6.7 presents the Adverse impacts on the socio-economic environment in the existing situation and the Expected positive impacts after project implementation for the proposed Supertram Project.

CREATS: Phase II Final Report, Vol. III: CTA Transport Improvement Project in East Sector of Cairo Chapter 3: A NEW ROLE FOR THE HELIOPOLIS METRO
3 - 153
Table 3.6.7 Adverse Environmental Impacts in Existing Situation and Expected Positive Impacts from the Supertram Project
Adverse socioeconomic environmental impacts in existing situation
Expected positive socioeconomic environmental impacts after project
implementation • Bad performance of existing facility • Long travel time for passengers • Nuisance • High operation costs • Poor accessibility.
• Reduction of travel time for passengers • Increased economic development • Improved mobility, facilitating the urban
function of the city Increased safety
Source: JICA Study Team
Further positive impacts expected from the proposed Supertram Project on the social and physical environment are:A number of car users will start using the Supertram
(less emission, less energy consumption).
• There will be less air pollution compared to the situation of not carrying out the proposed public transport Project (Zero Option) (less emission, less energy consumption)There will be no significant increase of noise levels.
• There will be realized a more free flowing traffic pattern, with as result a reduced number of accidents.
• Safety for pedestrians will be increased by the construction of pedestrian grade separations and other amenities.
• There are new possibilities for planting of trees and landscaping.Recommended Mitigation Measures
The overall effect of the proposed Supertram Project on the region of Greater Cairo is expected to be positive and should result in progressing economic development.
Several negative impacts can be avoided or minimized when appropriate mitigation measures are incorporated in the Design, the Construction, and the Operation & Maintenance Phases of the Project.
It is emphasised that especially during the Pre-Construction/Design Phase as many mitigation measures as possible (like bridges for pedestrians) should be incorporated to minimise adverse environmental impacts in the next project phases, as shown in Table 3.6.8.

CREATS: Phase II Final Report, Vol. III: CTA Transport Improvement Project in East Sector of Cairo Chapter 3: A NEW ROLE FOR THE HELIOPOLIS METRO
3 - 154
Table 3.6.8 Mitigation Measures for the Supertram Project in the Pre-Construction, Construction and O & M Phases
Expected Adverse Impacts Socio-economic and physical/biological aspects
Mitigation Measures
Pre-construction Phase - Fragmentation/split up of areas; increased
physical barriers. - Impact on aesthetics.
Pre-construction Phase - Proper design of fly-overs and underpasses. - Landscaping, planting trees. - Preparation of Environmental Management and
Monitoring Plans and Transport Management Plan.
Construction Phase Disposal of waste, waste spills (oil), interruption of water flows, erosion/ sedimentation, air pollution, spills of waste, vibrations, noise, safety risks for workers, damage to existing roads, traffic congestion, disposal of earth material/spoils, impact on aesthetics.
Construction Phase - Enforcement of laws and regulations. - Proper Environmental Management and
Monitoring during all works. - Execution of Transport Management Plan. - Proper disposal of waste. - Proper drainage. - Safety precautions. - Planting of trees, landscaping, re-establishing
situation. Operation & Maintenance Phase - Noise and vibrations. - Risk of accidents (public health).
Operation & Maintenance Phase. - Landscaping, trees, plantations. - Proper Operation & Maintenance and repairs. - Proper Environmental Management and
Monitoring. - Safety precautions. - Noise control. - Strict enforcement of (environmental) laws and
regulations. - Sound barriers if required.
Source: JICA Study Team
3.6.4 Environmental Implications of the Zero Option (No Projects Option)
(1) Mitigation of Environmental Burden by the Public Transport System
It is important to indicate what the environmental situation would be, if the Supertram Project would not be carried out. If the Supertram Project would not materialize, as a consequence the growing traffic demand would be shifted to users of private cars, the fuel consumption as well as the emissions will be much larger than is the case if the traffic demand is fulfilled by public transport facilities.
Figures 3.6.1 shows an evidently general form of fuel efficiency by transport mode in terms of kilometers a person can be carried by a 1 kg fuel. As seen in this figure, the metro system is 2.5 times as fuel-efficient as private car. Alike, a suburban tram, similar to the Supertram, is 2 times as fuel-efficient as a private car.

CREATS: Phase II Final Report, Vol. III: CTA Transport Improvement Project in East Sector of Cairo Chapter 3: A NEW ROLE FOR THE HELIOPOLIS METRO
3 - 155
Kilometers a person can be carried by 1 kg fuel
0 10 20 30 40 50
Private car
Suburban Train
Regional Bus
Metro
kilometer
Source: International Association of Public Transport, Brussels, May 2001
Figure 3.6.1 Fuel Efficiency of Different Modes
From the viewpoint of environmental emission factors, a comparison between bus and car can be depicted in a general form, as shown in Figure 3.6.2, showing an evidence of emissions per unit transport load (one passenger multiplies by a kilometer). There exists a great difference in CO2 emission between both.
Comparison of specific average emissions (grams/passengerxkm) of bus and car (all fuel)
0 1 2 3
CO/10
CO2/100
NOx
VOC
Particles x 10
SO2
g/pass x km
buscar
Source: International Association of Public Transport, Brussels, May 2001
Figure 3.6.2 Comparison of Emissions between Cars and Buses
A general comparison of CO2 emission by transport mode is as shown in Figure 3.6.3 quoted from a different source. This chart indicates CO2 emission (grams) per an unit transport load (passenger-km). The railway system generates only 10% of private car for a passenger-km.

CREATS: Phase II Final Report, Vol. III: CTA Transport Improvement Project in East Sector of Cairo Chapter 3: A NEW ROLE FOR THE HELIOPOLIS METRO
3 - 156
172
99
110
18
15
0 50 100 150 200
P rivate C ar
B us
A ir P lan
R ailw ay
M etro/Tram
g-C O 2/person*km
Source: Annual Environmental Report, Japan (2000)
Figure 3.6.3 CO2 Emission from Passenger-km by Transport Mode
Thus, the extension of public transport (metro, bus and train) is the best choice to meet growing traffic demand from an environmental point of view. This is certainly the case in an area like Greater Cairo, where the burden of air pollution and noise is already high.
(2) A Quantitative Impact to A Global Issue of CO2 Mitigation
A quantitative environmental impact by the Project was examined in terms of deduction of CO2
emission. Due to a lack of proven data for emission factors and meteorological conditions in Greater Cairo, the other quantitative and tangible environmental factors related to air quality other than CO2 are difficult to be rationally projected.
The analysis is based on the following assumptions:
• The total reduction of CO2 Emission by the execution of the Project was projected in the Study Area as a whole, not in a limited service catchment area of the Project. This means that the analysis is based on a change in the transport pattern in the entire Study Area, given the Project. The traffic speeds and traffic volumes by vehicle type were computed by the CREATS Model in both “With” and “Without” cases.
• The analysis is also based on a CO2 emission function with respect to the vehicle speed by vehicle type is employed for the quantitative
0
1,000
2,000
3,000
4,000
5,000
6,000
2.5 12.5
22.5
32.5
42.5 52.5
62.5
72.5
Speed (km/h)
CO2 E
miss
ion (K
g/Day
)
M-cycleCarBus/Hvy TruckMini-bus/Truck
Figure 3.6.4 Relations between Vehicle’s Speed and CO2 Emission

CREATS: Phase II Final Report, Vol. III: CTA Transport Improvement Project in East Sector of Cairo Chapter 3: A NEW ROLE FOR THE HELIOPOLIS METRO
3 - 157
projection, as shown in Figure 3.6.4 which is a Japanese function developed in 1990, because of two reasons: a) neither reliable nor proven emission-speed functions exist for the local condition in Cairo; and b) this 1990 Japanese function seems close to the present Cairo condition.
• The impact on reduction of CO2 is represented by annual volumes in 2022 when each project will fully be operated in service.
• Since the Projects is the public transport improvement projects, the implementation of the Project will significantly affect road traffic conditions, which tends to induce the more vehicle traffic at higher speed. A special attention should be given to large vehicles such as trucks and buses which generate more CO2 emission at higher speed over 30-40 km/h, as seen in Figure 3.6.3. The increased volume of CO2 emission by such higher speed trucks are so large that all the reduction by the project could be offset. Therefore, an environmental control policy to enforce a speed limit of 30-40km/h to trucks is assumed to be applied.
A summary of the results is shown in Table 3.6.9, where environmental impacts of the other projects are compared.
As seen in this table, the total CO2 emission “Without” case accounts for approximately 16.62 million tons per year in the whole GCR in 2022. The Supertram Line 1 Project will provide a significant CO2 reduction of around 16,000 tons/year in 2022. For a comparison, it is found that given the East Wing Railway Project, the annual CO2 emission will be 16.58 million tons over GCR, thereby reducing approximately 42,000 tons in 2022 due to the project. With the West Wing Project, the reduction of CO2 emission can be expected at around 632,000 tons in 2022, which is interestingly the most largest impact among the three projects.
Thus, the positive environmental impact by each project in terms of CO2 emission is significantly great. For a reference, it is said that one litter of gasoline generates 2.30 kg of CO2. 3 Based on this, the reduction of 16,000 ton/year of CO2 is equivalent to the reduction of about 7.0 million litters/year, or 43,800 bbl./year of gasoline.
Table 3.6.9 A Summary of Environmental Impact in CO2 Emission
Reduction of CO2 Emission (tons/year) Case CO2 Emission in
2022 (tons/year) East Wing West Wing Supertram 1 Without the Project (Committed Only) 16,623,904 - - -
With the East Wing 16,581,752 42,152 - -
With the West Wing 15,992,197 - 631,706 -
With the Supertram Line 1 16,607,848 - - 16,056 Source: JICA Study Team
3 For another reference, it is said that one human being generates about 1.0kg CO2 per day, or approximately
0.36 ton per year.

CREATS: Phase II Final Report, Vol. III: CTA Transport Improvement Project in East Sector of Cairo Chapter 3: A NEW ROLE FOR THE HELIOPOLIS METRO
3 - 158
3.6.5 Environmental Management and Monitoring
After assessing the environmental sensitivities, analyzing the potential impacts and their effects, and suggesting mitigation options, the following measures should be assured for the Environmental Management and Monitoring for the Supertram Project. These measures should be considered as commitment actions to control the impacts on the environment and provide the framework for the future environmental management of the area in order to minimize the negative impacts of the project activities during the construction as well as the operation & maintenance phases.
1. Inform MHUUC, Cairo Governorate, local authorities and other operators in the region of the scheduled construction activities, location and route of the project, the exact starting date of execution and the environmental measures taken to avoid damages.
2. Plan the excavation/construction programs to optimize the required equipment and site installations. A base camp should be at least 200m from any residential areas. Reinstate used land to their original state by the end of the activities.
3. Optimize the layout of access roads. Unnecessary roads and tracks use land and generate visual discomfort.
4. Detailed design and layout of road flyovers and underpasses needed for supertram operation must be discussed and consulted with the concerned authorities and affected people. All materials will be chosen in such a way to provide the greatest chance of operational success, and have the lowest practicable impact on the environment.
5. Make available on site temporary waste disposal facilities and dispose off wastes from the site as much as possible. Burial on site is not suggested. The operating contractor would be required to provide indication of how, where, and when waste will be disposed. Bills of quantities, times, and dates of disposal, should be kept.
6. Dispose off all scrap metal, plastic bottles, old drums, batteries and others in compliance with EEAA guidelines.
7. Set up an emergency/contingency plan at least 30 days before the start of the project operations.
8. Keep pictorial and illustration records from before and after operations to monitor and control restoration of sites.
9. Prepare a checklist as part of the Environmental Management Plan that will constitute Environmental Performance Indicators (EPI) to monitor the environmental performance of all parties involved in the project activities.
The following authorities should be responsible - each in it’s own jurisdiction area - for Environmental Monitoring of the project performance during the construction phase and the operation phase of the Supertram Project:
• Ministry of Transportation and Communication; • Ministry of Housing, Utilities and Urban Communities; • Cairo Governorate; and,

CREATS: Phase II Final Report, Vol. III: CTA Transport Improvement Project in East Sector of Cairo Chapter 3: A NEW ROLE FOR THE HELIOPOLIS METRO
3 - 159
• Egyptian Environmental Agency Affairs (EEAA).
3.6.6 Conclusions
The negative environmental impacts to be expected from the proposed Supertram Project are:
• Split up of neighborhoods by tram tracks (increased physical barriers), although this largely reinforces an already existing pattern of use.
• Impact on aesthetics by two road flyovers, blocking the views for residents.
The negative environmental impacts can be mitigated by the following measures:
• Construction of grade separations especially for pedestrians; and
• Compensation by landscaping, planting of trees and parks.
While, positive impacts are expected from the proposed Supertram Project on the social and physical environment:There will be less air pollution compared to the
situation of not carrying out the proposed public transport Project (Zero Option) (less emission, less energy consumption, thereby leading to mitigation of air contaminations, pollutants and CO2 emission that would otherwise be generated;There will be no significant increase of noise levels;
• There will be resulted in a reduced number of accidents;
• Safety for pedestrians will be increased by the construction of pedestrian bridges and underpasses; and
• There are new possibilities for planting of trees and landscaping.The following positive economic impacts are also expected from the proposed Supertram Project on the economy:
• Improved mobility and access for the residents of Greater Cairo;
• Reduced travel time and costs; and
• Improved conditions for economic development and enhanced development of tourism.
The overall conclusions of the environmental studies for the selected Supertram Project are:
• Major positive environmental impacts are expected.
• Minor negative environmental impacts are expected, which can be mitigated.
• The Supertram Project is sustainable and is environmentally feasible.

CREATS: Phase II Final Report, Vol. III: CTA Transport Improvement Project in East Sector of Cairo Chapter 3: A NEW ROLE FOR THE HELIOPOLIS METRO
3 - 160
3.7 ECONOMIC AND FINANCIAL ANALYSIS
3.7.1 Procedure of Economic and Financial Evaluation
An economic evaluation provides a useful criterion for the public sector to make a rational decision of allocation of its limited budget to a certain project from the viewpoint of the national economy as a whole. For an economic evaluation, various benefits which are expected to arise by the project and costs to be spent for the operation and maintenance as well as the implementation of the project are considered and calculated in an economic term on an annual basis within a project life to be defined (20~30 years), depending upon the nature of the project. The costs estimated at market prices are converted to the “economic costs” which denotes the project cost to the national economy, excluding transfer items and employing an opportunity cost concept for goods/services to be procured at a distorted market.
While, a financial evaluation shall provide useful implications for the project owner, including the public sector, to predict anticipated returns on the investment, thereby supporting him/her to make a rational decision on the investment of funds, or “do or not”, compared to the “cost of money” at a financial market and the returns from other investment opportunities. Furthermore, the financial viability implies a vital indicator on how much the government sector needs to involve in the project through provision of government subsidies.
3.7.2 Major Premises
(1) A Conceptual Setting of “With and Without the Project”
The costs and benefits are calculated as differences between “with” and “without” the Project. The “with” case denotes a situation of how the transport conditions could be in the entire Study Area, given the Project. While, the “without” case does not stands for nothing happened on the current situation, but represents a situation of how the transport conditions would be in the entire Study Area, given only the committed projects completed as scheduled.
Table 3.7.1 shows a list of project components and their status to be considered in the transport network in the Study Area in the case of “without”, while Table 3.7.2, in the case of “with the Project”. It is noted that the time framework proposed hereby is based on the CREATS Master Plan.

CREATS: Phase II Final Report, Vol. III: CTA Transport Improvement Project in East Sector of Cairo Chapter 3: A NEW ROLE FOR THE HELIOPOLIS METRO
3 - 161
Table 3.7.1 Projects Components and Their State in the “Without” Case
Without Major Components 2007 2012 2022
Transport System Improvement in the Master Plan Bus Restructuring As existing As existing As existing Shared Taxi Franchising As existing As existing As existing Metro 1 Existing+ Committed Existing+ Committed Existing+ CommittedMetro 2 Existing+ Committed Existing+ Committed Existing+ CommittedMetro 3 Committed Committed Committed Metro 4 None None None Toll Expressway System None None None Local Roads Improvement Existing+ Committed Existing+ Committed Existing+ CommittedOther Trams Rehabilitation As existing As existing As existing
Focused Projects The Supertram 1 Project None None None The East Wing Project None None None The West Wing Project None None None
Source: JICA Study Team
Table 3.7.2 Projects Components and Their State in the “With” Case
With the Supertram Major Components 2007 2012 2022
Transport System Improvement in the Master Plan Bus Restructuring As existing As existing As existing Shared Taxi Franchising As existing As existing As existing Metro 1 Existing+ Committed Existing+ Committed Existing+ Committed
Metro 2 Existing+ Committed Existing+ Committed Existing+ CommittedMetro 3 Committed Committed Committed Metro 4 None None None Toll Expressway System None None None Local Roads Improvement Existing+ Committed Existing+ Committed Existing+ CommittedOther Trams Rehabilitation As existing As existing As existing
Focused Projects The Supertram 1 Project As planned As planned As planned The East Wing Project None None None The West Wing Project None None None
Source: JICA Study Team
(2) Price Indices and Project Life
For the economic and financial evaluation, the following assumptions are held.
Pricing data: as of the mid-2003 Foreign Exchanges: 1 US Dollar = 6.0 LE Project Life: 27 years from 2004 through 2030

CREATS: Phase II Final Report, Vol. III: CTA Transport Improvement Project in East Sector of Cairo Chapter 3: A NEW ROLE FOR THE HELIOPOLIS METRO
3 - 162
(3) Investment Costs
Although the project cost was estimated in Section 3.5.6, the cost estimates are summarized here for the economic and financial evaluation purposes. The Project requires two-categorized costs: one is the costs for the Supertram system development itself; and the other, for partnership costs for the Supertram-related projects which should be undertaken to improve the corridor development, maximizing benefits of the Supertram.
A total of approximately 1.78 billion LE at 2003 prices will be needed for the initial investment cost for the Supertram system, while a total of approximately 224 million LE at 2003 prices for the partnership costs. According to a planned construction schedule, this initial capital cost are allocated in a time framework, as shown in Table 3.7.3. The construction will take 4 years including engineering services.
Along with an anticipated increasing passenger demand, additional investment will be necessary for procurement of rolling stocks and expansion of the depot, which accounts for about 624 million LE at 2003 prices, as shown in Table 3.7.4. This additional investment will be needed in around 3 years after the commencement of the Project.
As for the partnership cost, the upgrading of the existing Heliopolis Metro are estimated soon after the Supertram is operated to enhance the inter-modality in the total system.
Table 3.7.3 Initial Financial Investment Costs for the Supertram Project (LE Million, at 2003 prices)
TotalLocal Foreign Local Foreign Local Foreign Local Foreign Local Foreign Total
0.0 0.0 0.0 0.0 118.1 28.0 60.8 14.4 178.9 42.4 221.30.0 0.0 33.4 50.9 66.8 101.9 33.4 50.9 133.6 203.7 337.30.0 0.0 7.7 146.8 18.5 352.4 4.6 88.1 30.9 587.3 618.20.0 0.0 12.2 6.2 40.6 20.7 28.4 14.5 81.2 41.4 122.6
Road and Traffic Improvements 0.0 0.0 0.0 0.0 46.2 3.5 23.8 1.8 70.0 5.3 75.30.0 0.0 0.0 0.0 0.0 0.0 0.0 0.0 0.0 0.0 0.0
27.2 33.8 54.4 67.6 16.3 20.3 10.9 13.5 108.8 135.1 244.02.7 3.4 10.8 27.2 30.7 52.7 16.2 18.3 60.4 101.5 161.9
29.9 37.2 118.5 298.7 337.3 579.4 178.2 201.6 663.9 1,116.8 1,780.7
Partnership Cost (LE Million, at 2003 prices)Total
Local Foreign Local Foreign Local Foreign Local Foreign Local Foreign TotalRing Road Park-and-Ride 0.0 0.0 0.0 0.0 3.4 0.2 3.4 0.2 6.8 0.4 7.1Land, Ring Road Park-and-Ride 60.6 3.2 0.0 0.0 0.0 0.0 0.0 0.0 60.6 3.2 63.8Feeder Bus Improvements 0.0 0.0 0.0 0.0 0.0 0.0 0.3 0.0 0.3 0.0 0.3Land, Supertram Depot 24.2 1.3 0.0 0.0 0.0 0.0 0.0 0.0 24.2 1.3 25.5Feeder Bus Fleet 0.0 0.0 0.0 0.0 18.8 12.5 18.8 12.5 37.5 25.0 62.5Heliopolis Metro Upgrading 0.0 0.0 0.0 0.0 0.0 0.0 19.8 1.4 19.8 1.4 21.2Engineering & Local Adm. 5.2 6.4 0.0 0.0 2.0 2.5 3.3 4.1 10.5 13.0 23.4Contingency 9.0 1.1 0.0 0.0 2.4 1.5 4.5 1.8 16.0 4.4 20.4
99.0 12.0 0.0 0.0 26.6 16.7 50.0 19.9 175.5 48.6 224.2Total Cost
Supertram: Intitial Investment
Financial Cost
Financial Cost
SystemsRolling stockDepot
LandEngineering & Local Adm.Contingency
Total Cost
Infrastructure
2007
2004 2005 2006 2007
2004 2005 2006
Source: JICA Study Team

CREATS: Phase II Final Report, Vol. III: CTA Transport Improvement Project in East Sector of Cairo Chapter 3: A NEW ROLE FOR THE HELIOPOLIS METRO
3 - 163
Table 3.7.4 Additional Financial Investment for the Supertram Project Supertram 1 Additional Investment (LE Million, at 2003 prices)
Local Foreign Local Foreign Local Foreign Local ForeignInfrastructure 0.0 0.0 0.0 0.0 0.0 0.0 0.0 0.0Systems 0.0 0.0 0.0 0.0 0.0 0.0 0.0 0.0Rolling stock 0.0 0.0 0.0 0.0 0.0 0.0 4.5 86.1Depot 0.0 0.0 0.0 0.0 19.1 9.7 28.6 14.6Road and Traffic Improvements 16.0 0.8 16.0 0.8 0.0 0.0 0.0 0.0Land 0.0 0.0 0.0 0.0 0.0 0.0 0.0 0.0Engineering & Local Adm. 1.0 1.2 1.0 1.2 1.7 2.1 7.8 9.6Contingency 1.7 0.2 1.7 0.2 2.1 1.2 4.1 11.0
18.7 2.3 18.7 2.3 22.8 13.0 44.9 121.3
Local Foreign Local Foreign Local Foreign Local ForeignInfrastructure 0.0 0.0 0.0 0.0 0.0 0.0 0.0 0.0Systems 0.0 0.0 0.0 0.0 0.0 0.0 0.0 0.0Rolling stock 4.5 86.1 4.5 86.1 4.5 86.1 0.0 0.0Depot 0.0 0.0 0.0 0.0 0.0 0.0 0.0 0.0Road and Traffic Improvements 0.0 0.0 0.0 0.0 0.0 0.0 16.0 0.8Land 0.0 0.0 0.0 0.0 0.0 0.0 0.0 0.0Engineering & Local Adm. 5.3 6.5 5.3 6.5 5.3 6.5 1.0 1.2Contingency 1.0 9.3 1.0 9.3 1.0 9.3 1.7 0.2
10.8 101.9 10.8 101.9 10.8 101.9 18.7 2.3
Local Foreign Local Foreign TotalInfrastructure 0.0 0.0 0.0 0.0 0.0Systems 0.0 0.0 0.0 0.0 0.0Rolling stock 0.0 0.0 18.1 344.3 362.4Depot 0.0 0.0 47.6 24.3 71.9Road and Traffic Improvements 16.0 0.8 64.1 3.4 67.5Land 0.0 0.0 0.0 0.0 0.0Engineering & Local Adm. 1.0 1.2 29.1 36.1 65.2Contingency 1.7 0.2 15.9 40.8 56.7
18.7 2.3 174.9 448.9 623.7
Additional Investment for Partnership Costs (LE Million, at 2003 price)
Local Foreign Local Foreign Local Foreign Local ForeignRing Road Park-and-Ride 0.0 0.0 0.0 0.0 3.4 0.2 3.4 0.2Land, Ring Road Park-and-Ride 0.0 0.0 0.0 0.0 0.0 0.0 0.0 0.0Feeder Bus Improvements 0.0 0.0 0.0 0.0 0.0 0.0 0.0 0.0Land, Supertram Depot 0.0 0.0 0.0 0.0 0.0 0.0 0.0 0.0Feeder Bus Fleet 0.0 0.0 0.0 0.0 0.0 0.0 0.0 0.0Heliopolis Metro Upgrading 39.5 2.8 19.8 1.4 0.0 0.0 0.0 0.0Engineering & Local Adm. 2.5 3.0 1.2 1.5 0.2 0.3 0.2 0.3Contingency 4.2 0.6 2.1 0.3 0.4 0.0 0.4 0.0
46.2 6.4 23.1 3.2 4.0 0.5 4.0 0.5Total
Local Foreign TotalRing Road Park-and-Ride 6.8 0.4 7.1Land, Ring Road Park-and-Ride 0.0 0.0 0.0Feeder Bus Improvements 0.0 0.0 0.0Land, Supertram Depot 0.0 0.0 0.0Feeder Bus Fleet 0.0 0.0 0.0Heliopolis Metro Upgrading 59.3 4.2 63.5Engineering & Local Adm. 4.1 5.1 9.2Contingency 7.0 1.0 8.0
77.2 10.6 87.8
Total Cost
Financial Cost
Financial Cost
Total Cost
2008 2009 2011 2012
Financial Cost
Financial Cost
Financial Cost
Total Cost
Total Cost
Total Cost
2015
2021
2016 2017 2018 2020
Total
2010 2011 2014
Source: JICA Study Team

CREATS: Phase II Final Report, Vol. III: CTA Transport Improvement Project in East Sector of Cairo Chapter 3: A NEW ROLE FOR THE HELIOPOLIS METRO
3 - 164
(4) Residual Value
Residual values are appropriated in the last year of the project life, as some investment items have longer useful lives than the project life. Assets invested for the Project still have value till its useful life expires (See Table 3.7.5). Thus, the residual value is computed according to years left for the rest of useful life by each investment item.
Table 3.7.5 Useful Life of Depreciation Assets
Assets Years Infrastructure 50 System 20 Rolling Stock 25 Bus Fleet 10 Dept/Control Center 30
Source: JICA Study Team
(5) Reinvestment Cost
Reinvestment costs are appropriated for betterment, replacement and/or improvement of the system to keep it in a proper condition. This reinvestment will take place in 20 years after the operation starts. Table 3.7.6 shows a summary of such reinvestment costs as well as residual value as discussed above.
(6) Operation and Maintenance Cost
Based on discussions in Section 3.5.6, the operation and maintenance cost for the Supertram service operation is estimated at 47.0 million LE annually in the starting year and 63.0 million LE in 2022. This financial cost for the operation and maintenance is assumed to be identical to the economic cost.

CREATS: Phase II Final Report, Vol. III: CTA Transport Improvement Project in East Sector of Cairo Chapter 3: A NEW ROLE FOR THE HELIOPOLIS METRO
3 - 165
Table 3.7.6 Re-investment Costs and Residual Value for the Supertram Project Re-investment & Residual Value of Supertram (LE Million, at 2003 prices)
2027 Residual Value Financial Cost Local Foreign Local Foreign
Infrastructure 96.6 22.9
Systems 133.6 203.7 113.6 173.1
Rolling stock 10.8 205.4
Depot 42.1 21.5
Road and Traffic Improvements 83.3 5.3
Land 0.0 0.0
Engineering & Local Adm. 19.6 24.3 44.9 55.8
Contingency 15.3 22.8 39.1 48.4
Total Cost 168.5 250.8 430.5 532.3
Re-investment & Residual Value for Partnership Cost (LE Million, at 2003 prices)2017 2027 Residual Value Financial Cost
Local Foreign Local Foreign Local ForeignRing Road Park-and-Ride 6.3 0.3 Land, Ring Road Park-and-Ride 0.0 0.0 Feeder Bus Improvements 0.1 0.0 Land, Supertram Depot 24.2 1.3 Feeder Bus Fleet 37.5 25.0 37.5 25.0 26.3 17.5 Heliopolis Metro Upgrading 26.1 1.8 Engineering & Local Adm. 3.6 4.5 3.6 4.5 6.0 7.5 Contingency 4.1 3.0 4.1 3.0 8.9 2.8
Total Cost 45.2 32.5 45.2 32.5 98.0 31.3 Note: 80% of the cost for the Ring Road Park-and-Ride Facility was appropriated.
Source: JICA Study Team
3.7.3 Economic Evaluation
The economic evaluation is carried out from a view of whether or not the investment for the Supertram Railway Project will be feasible in terms of the national economy, employing a cost-benefit analysis.
(1) A Special Note on “With” and “Without the Project”
As mentioned in Section 3.7.2, economic benefits are calculated as differences between “With the Project” and “Without the Project”. For the calculation of economic benefits, the situation of the “Without” case is defined identical to the “Do Nothing Scenario” as examined in the CREATS Master Plan. However, this scenario is not the same situation as the current condition, but depicts such a situation that all committed projects, including Metro Line 3, capacity enhancement of Metro Line 1 and a number of flyover projects, have materialized in a planned time framework (see the CREATS Master Plan). Metro Line 3 is supposed to be fully operated in 2017. Thus, it should be noted that even the “Without the Project” case hold inclusion of the Metro Line 3 which is very influential to changes in the transport pattern.

CREATS: Phase II Final Report, Vol. III: CTA Transport Improvement Project in East Sector of Cairo Chapter 3: A NEW ROLE FOR THE HELIOPOLIS METRO
3 - 166
(2) Economic Costs
Economic costs of the Project includes the initial investment cost, additional investment cost, reinvestment cost and residual value cost. These economic costs were derived from the financial costs as described above, after adjusting transfer elements. In order to convert from financial costs to economic costs, conversion rates are assumed to be 81% for local currency items as well as 87% for foreign currency (or imported) items. taking into account the Egyptian taxation and labor market conditions (refer to the detailed methodology discussed in Section 13.2.2, Volume 3, the CREATS Master Plan).
1) Economic Costs of Initial Investment
The converted economic costs for the initial investment are summarized in Table 3.7.7. The total economic cost of the initial investment for the Supertram development is approximately 1.51 billion LE, 64% of which, 0.97 billion LE, is of a foreign currency portion. It is noted that the local currency of the partnership cost shares 77% of the total. The land acquisition cost is valuated zero at the economic cost, because the land to be acquired is inherently desert land, of which the opportunity value is none.
Table 3.7.7 Economic Costs of Initial Investment for the Supertram Project
Source: JICA Study Team
Supertram 1 Initial Investment Cost (LE Million, 2003 price)
Local Foreign Local Foreign Local Foreign Local Foreign Local Foreign TotalInfrastructure 0.0 0.0 0.0 0.0 95.7 24.3 49.3 12.5 144.9 36.9 181.8Systems 0.0 0.0 27.1 44.3 54.1 88.6 27.1 44.3 108.2 177.2 285.5Rolling stock 0.0 0.0 6.3 127.7 15.0 306.6 3.8 76.6 25.0 511.0 536.0Depot 0.0 0.0 9.9 5.4 32.9 18.0 23.0 12.6 65.8 36.0 101.8Road and Traffic Improvements 0.0 0.0 0.0 0.0 0.0 0.0 0.0 0.0 0.0 0.0 0.0Land 0.0 0.0 0.0 0.0 0.0 0.0 0.0 0.0 0.0 0.0 0.0Engineering & Local Adm. 22.0 29.4 44.1 58.8 13.2 17.6 8.8 11.8 88.2 117.6 205.7Contingency 2.2 2.9 8.7 23.6 24.8 45.8 13.1 15.9 48.9 88.3 137.2
Total Cost 24.2 32.3 96.0 259.8 235.8 501.0 125.1 173.8 481.1 967.0 1,448.0Note: Land cost in economic price was evaluated as zero. However, necessary cost for engineering cost, local adiministration cost and contingency is included.
Supertram 1 Intitial Investment (Partnership Cost) (LE Million, 2003 price)
Local Foreign Local Foreign Local Foreign Local Foreign Local Foreign TotalRing Road Park-and-Ride 0.0 0.0 0.0 0.0 2.7 0.2 2.7 0.2 5.5 0.3 5.8Land, Ring Road Park-and-Ride 49.1 2.8 0.0 0.0 0.0 0.0 0.0 0.0 49.1 2.8 51.8Feeder Bus Improvements 0.0 0.0 0.0 0.0 0.0 0.0 0.2 0.0 0.2 0.0 0.2Land, Supertram Depot 19.6 1.1 0.0 0.0 0.0 0.0 0.0 0.0 19.6 1.1 20.7Feeder Bus Fleet 0.0 0.0 0.0 0.0 15.2 10.9 15.2 10.9 30.4 21.8 52.1Heliopolis Metro Upgrading 0.0 0.0 0.0 0.0 0.0 0.0 16.0 1.2 16.0 1.2 17.2Engineering & Local Adm. 4.2 5.6 0.0 0.0 1.6 2.2 2.6 3.5 8.6 10.7 19.2Contingency 7.3 0.9 0.0 0.0 2.0 1.3 3.7 1.6 12.9 3.8 16.8
Total Cost 80.2 10.4 0.0 0.0 21.5 14.5 40.5 17.4 142.3 41.7 184.0
Economic Cost
Economic CostTotal
Total
2007
2007
2004 2005 2006
2004 2005 2006

CREATS: Phase II Final Report, Vol. III: CTA Transport Improvement Project in East Sector of Cairo Chapter 3: A NEW ROLE FOR THE HELIOPOLIS METRO
3 - 167
2) Economic Cost of Additional Investments
Additional investment cost was converted in the same manner and the result is summarized in Table 3.7.8.
Table 3.7.8 Economic Cost of Additional Investment for the Supertram Project Additional Investment for Supertram (LE Million, 2003 price)
Local Foreign Local Foreign Local Foreign Local ForeignInfrastructure 0.0 0.0 0.0 0.0 0.0 0.0 0.0 0.0Systems 0.0 0.0 0.0 0.0 0.0 0.0 0.0 0.0Rolling stock 0.0 0.0 0.0 0.0 0.0 0.0 3.7 74.9Depot 0.0 0.0 0.0 0.0 15.4 8.4 23.1 12.7Road and Traffic Improvements 0.0 0.0 0.0 0.0 0.0 0.0 0.0 0.0Land 0.0 0.0 0.0 0.0 0.0 0.0 0.0 0.0Engineering & Local Adm. 0.0 0.0 0.0 0.0 1.4 1.8 6.3 8.4Contingency 0.0 0.0 0.0 0.0 1.7 1.0 3.3 9.6Total Cost 0.0 0.0 0.0 0.0 18.5 11.3 36.4 105.5
Local Foreign Local Foreign Local Foreign Local ForeignInfrastructure 0.0 0.0 0.0 0.0 0.0 0.0 0.0 0.0Systems 0.0 0.0 0.0 0.0 0.0 0.0 0.0 0.0Rolling stock 3.7 74.9 3.7 74.9 3.7 74.9 0.0 0.0Depot 0.0 0.0 0.0 0.0 0.0 0.0 0.0 0.0Road and Traffic Improvements 0.0 0.0 0.0 0.0 0.0 0.0 0.0 0.0Land 0.0 0.0 0.0 0.0 0.0 0.0 0.0 0.0Engineering & Local Adm. 4.3 5.7 4.3 5.7 4.3 5.7 0.0 0.0Contingency 0.8 8.1 0.8 8.1 0.8 8.1 0.0 0.0
Total Cost 8.7 88.6 8.7 88.6 8.7 88.6 0.0 0.0
Local Foreign Local Foreign Local Foreign TotalInfrastructure 0.0 0.0 0.0 0.0 0.0 0.0 0.0Systems 0.0 0.0 0.0 0.0 0.0 0.0 0.0Rolling stock 0.0 0.0 0.0 0.0 14.7 299.5 314.2Depot 0.0 0.0 0.0 0.0 38.6 21.1 59.7Road and Traffic Improvements 0.0 0.0 0.0 0.0 0.0 0.0 0.0Land 0.0 0.0 0.0 0.0 0.0 0.0 0.0Engineering & Local Adm. 0.0 0.0 0.0 0.0 20.4 27.2 47.6Contingency 0.0 0.0 0.0 0.0 7.4 34.8 42.1
Total Cost 0.0 0.0 0.0 0.0 81.0 382.6 463.6
Additional Investment for Partnership Cost (LE Million, 2003 price)
Local Foreign Local Foreign Local Foreign Local ForeignRing Road Park-and-Ride 0.0 0.0 0.0 0.0 2.7 0.2 2.7 0.2Land, Ring Road Park-and-Ride 0.0 0.0 0.0 0.0 0.0 0.0 0.0 0.0Feeder Bus Improvements 0.0 0.0 0.0 0.0 0.0 0.0 0.0 0.0Land, Supertram Depot 0.0 0.0 0.0 0.0 0.0 0.0 0.0 0.0Feeder Bus Fleet 0.0 0.0 0.0 0.0 0.0 0.0 0.0 0.0Heliopolis Metro Upgrading 32.0 2.4 16.0 1.2 0.0 0.0 0.0 0.0Engineering & Local Adm. 2.0 2.7 1.0 1.3 0.2 0.2 0.2 0.2Contingency 3.4 0.5 1.7 0.3 0.3 0.0 0.3 0.0
Total Cost 37.4 5.6 18.7 2.8 3.2 0.4 3.2 0.4Total
Local Foreign TotalRing Road Park-and-Ride 5.5 0.3 5.8Land, Ring Road Park-and-Ride 0.0 0.0 0.0Feeder Bus Improvements 0.0 0.0 0.0Land, Supertram Depot 0.0 0.0 0.0Feeder Bus Fleet 0.0 0.0 0.0Heliopolis Metro Upgrading 48.1 3.6 51.7Engineering & Local Adm. 3.3 4.4 7.7Contingency 5.7 0.8 6.5
Total Cost 62.5 9.2 71.8
Economic Cost
Economic Cost
Economic Cost
Economic Cost
2020 2021
2011
Total
Economic Cost
2011 2014 2015
2016 2017 2018 2019
20122008 2009
2010
Source: JICA Study Team

CREATS: Phase II Final Report, Vol. III: CTA Transport Improvement Project in East Sector of Cairo Chapter 3: A NEW ROLE FOR THE HELIOPOLIS METRO
3 - 168
3) Economic Cost of Reinvestment and Residual Value
Reinvestment and residual value are also converted from the financial to the economic costs, the results of which are shown in Table 3.7.9. The economic residual value is appropriated in the last year of the project life, or the year 2030, as a negative investment.
Table 3.7.9 Economic Costs of Reinvestment and Residual Value Re-investment & Residual Value (LE Million, 2003 price)
Local Foreign Local ForeignInfrastructure 78.3 19.9Systems 108.2 177.2 92.0 150.6Rolling stock 8.8 178.7Depot 34.1 18.7Road and Traffic Improvements 0.0 0.0Land 0.0 0.0Engineering & Local Adm. 15.8 21.1 32.2 43.0Contingency 12.4 19.8 24.5 41.1
Total Cost 136.5 218.2 269.9 452.0
Re-investment & Residual Value for Partnership Cost (LE Million, 2003 price)
Local Foreign Local Foreign Local ForeignRing Road Park-and-Ride 5.1 0.3Land, Ring Road Park-and-Ride 0.0 0.0Feeder Bus Improvements 0.1 0.0Land, Supertram Depot 19.6 1.1Feeder Bus Fleet 30.4 21.8 30.4 21.8 21.3 15.2Heliopolis Metro Upgrading 21.1 1.6Engineering & Local Adm. 2.9 3.9 2.9 3.9 4.9 6.5Contingency 3.3 2.6 3.3 2.6 7.2 2.5
Total Cost 36.6 28.2 36.6 28.2 79.4 27.2Note: Eighty per cent of Ring Road Park-and-Ride cost was appropriaed.
Economic Cost
Eocnomic Cost
2017 2027 Residual Value
2027 Residual Value
Source: JICA Study Team
(3) Economic Benefits
Economic benefits were estimated by comparing “without the project” in which the Supertram does not exist and “with the project” in which the Supertram exists and is utilized by residents in the Study Area who select the new public transport service by diverting from their previous modes in the “without the project” case. Economic benefits by the implementation of the Supertram Project was estimated, based on this change in the residents’ choice of transport modes.
Economic benefits in this economic analysis are assumed to be two: savings in time cost and maintenance & operation costs. Both benefits are considered as an additional surplus to the national economy to be accrued from the implementation of the Project. Time saving benefit is derived from the total travel time saving in the new transport network with the Supertram. Alike, the saving of operation and maintenance costs appear for the other transport modes in the new transport network with the Supertram, however, the operation and maintenance cost for the Supertram

CREATS: Phase II Final Report, Vol. III: CTA Transport Improvement Project in East Sector of Cairo Chapter 3: A NEW ROLE FOR THE HELIOPOLIS METRO
3 - 169
itself will newly be generated, and the increased costs are considered as “cost” to the national economy.
1) Time Saving Benefits
First, the time saving in the entire Study Area is estimated as difference between the “without project” and “with project” in terms of the total travel time which is spent to travel activities of residents in the Study Area. Then, the travel time saving is converted into the economic benefits in the national economy in monetary term, using unit economic time value by transport mode.
The Study Team adopted a conventional methodology for travel time saving estimation, based on a comprehensive transport network model approach, which is explained as follows:
Methodology of Time Saving Computation
For an explanation purpose, a simplified hypothetical setting is herein supposed, that is, two existing transport modes and one new mode, which be introduced in the Study Area. The existing modes are supposed to be the CTA bus service (denoted by CTA) and the Cairo Metro (denoted by Metro) service. The new mode is the new Supertram service (NM). In the “without” case, only two modes of CTA and Metro exist, while NM will be available in the “with” case.
Under the above setting, six (6) types of public transport passengers are conceivable with the number of passengers (Tij) between i-origin and j-destination (i-j zone pairs) by mode and by case as follows:
In the “without” case (denoted by WO):
TijCTA
WO : Number of CTA passengers, and
TijMetro
WO : Number of Metro passengers..
In the “with” case (denoted by WT):
TijCTA
NM : Number of NM passengers diverted from CTA;
TijMetro
NM : Number of NM passengers diverted from Metro;
TijCTA
WT : Remaining number of CTA passengers; and,
TijMetro
WT : Remaining number of Metro passengers.
While, travel time between i-j zone pairs can be expressed as below:
tijCTA
WO : Travel time by CTA in “without” case;

CREATS: Phase II Final Report, Vol. III: CTA Transport Improvement Project in East Sector of Cairo Chapter 3: A NEW ROLE FOR THE HELIOPOLIS METRO
3 - 170
tijMetro
WO : Travel time by Metro in “without” case;
tijCTA
NM : Travel time by NM in “with” case;
tijMetro
NM : Travel time by NM in “with” case (same as above)
tijCTA
WT : Travel time by CTA in “with” case; and,
tijMETRO
WT : Travel time by Metro in “with” case.
Since the CREATS model assumed no newly induced demands in the “with” case, the total number of i-j trips in both “with” and “without” cases are the same. Therefore, the number of CTA passengers in “without” case is the same as the sum of the diverted CTA passengers to the NM and the remaining CTA passengers, which can be expressed by:
TijCTA
WO = TijCTA
NM + TijCTA
WT (1)
While, since the number of NM passengers in the “with” case consists of two types of passengers diverted from CTA and Metro services, which can be expressed by:
TijNM
WT = TijCTA
NM + TijMetro
NM (2)
The time saving consists of two: time savings of diverted passengers and the remaining passengers. The savings are expressed as a total travel time in the “without” case minus a total travel time in the “with” case. Looking into CTA passengers for instance, these are expressed by the following two equations of (3) for diverted passengers and (4) for remaining passengers:
TSijCTA
NM = (tijCTA
WO - tijCTA
WT ) * TijCTA
NM (3)
TSijCTA
WT = (tijCTA
WO - tijCTA
WT ) * TijCTA
WT (4)
where, TSij: Time saving of passengers between i-j zone pairs
The time saving of diverted passengers is clear, because the NM service is usually faster than that by CTA. While, as for the remaining CTA passengers, they could get time saving only if the travel speed of CTA in the “with” case is faster than that in the “without” case. This may happen when the travel speed of CTA buses increases due to eased traffic congestion, affected by the introduction of the new mode in the “with” case.
The total time saving of CTA passengers, which means a total of the diverted and remaining passengers, are calculated by summing up the formula (3) and (4):

CREATS: Phase II Final Report, Vol. III: CTA Transport Improvement Project in East Sector of Cairo Chapter 3: A NEW ROLE FOR THE HELIOPOLIS METRO
3 - 171
TSijCTA
WTNM + = TSijCTA
NM + TSijCTA
WT
= (tijCTA
WO- tijCTA
WT) *TijCTA
NM + (tijCTA
WO- tijCTA
WT) *TijCTA
WT
= tijCTA
WO*(TijCTA
NM+TijCTA
WT) - tijCTA
WO* TijCTA
NM- tijCTA
WT*TijCTA
WT (5)
The formula (5) can be converted into (6) due to the equation (1) as follows:
TSijCTA
WTNM + = tijCTA
WO*TijCTA
WO - tijCTA
WT*TijCTA
WT- tijCTA
NM*TijCTA
NM (6)
The first term of the right side of the formula (6) means the travel time of CTA passengers in the “without” case. The second term means the travel time of the remaining CTA passengers in the “with” case, and the third term, the travel time of the diverted passengers from CTA to NM in the “with” case.
Thus, the second and third terms show the total travel time of passengers by mode in the “with” case. It should be noted that the travel time of NM passengers, which is represented as the third term in (6), indicates a negative value in this time saving calculation.
The formula (6) as represented for CTA passengers is common for all other modes in the CREATS model. The summation of travel time saving of the total i-j zone pair traffic by all modes indicates the total travel time saving which is generated by the introduction of the new mode.
Meanwhile, regarding time saving of the private modes such as car, motorcycle and taxi, the same methodology was employed. It is the basic logic that diverted private mode users have to spend travel time for the new mode, while no travel time be spent for their travels by the previous private mode under the “with” condition.
It is also noted that some public transport modes usually increase passengers in the “with” case, compared to the “without” case, when many passengers divert from the private modes to the new public mode. This is likely to happen because some public transport modes are used as access/egress modes of the new public transport mode. Given more passengers use the new modes, it would increase the access/egress modes, thus some public transport modes users would increase.
For a computing convenience, the travel time saving are categorized into two groups: one is the time saving that public transport mode passengers will gain; and the other, that private transport modes such as motorcycle, car and taxi will gain.
The result of the computation of the time saving by mode, which be generated by the introduction of the Supertram Project, is tabulated as shown in Table 3.7.10.
It should be noted that since the Supertram is assumed to be operated from the beginning of 2008 after the 4 years construction of the entire system, the benefits were computed from 2008, which was adjusted based on the 2007 demand forecast.

CREATS: Phase II Final Report, Vol. III: CTA Transport Improvement Project in East Sector of Cairo Chapter 3: A NEW ROLE FOR THE HELIOPOLIS METRO
3 - 172
Table 3.7.10 Time Saving by Transport Mode Generated by the Supertram Project
With Without Saving With Without Saving With Without SavingTravel Time of Passengers by Public Transport Mode (Million Passenger-hour/day )
CTA Bus 0.859 0.845 -0.014 0.607 0.604 -0.003 0.632 0.699 0.067GCBC Bus 0.202 0.199 -0.003 0.219 0.216 -0.004 0.075 0.077 0.002A/C Bus 0.343 0.346 0.003 0.411 0.412 0.001 2.446 2.499 0.053Ferry 0.000 0.000 0.000 0.000 0.000 0.000 0.000 0.000 0.000Tram 0.033 0.164 0.131 0.031 0.121 0.090 0.088 0.249 0.161Metro 0.816 0.817 0.001 1.118 1.122 0.003 1.817 1.824 0.007ENR 0.109 0.109 0.000 0.132 0.132 0.001 0.181 0.180 -0.001Shared-Taxi 2.110 2.132 0.022 2.853 2.891 0.038 4.078 4.231 0.154Minibus CTA 0.226 0.225 -0.001 0.155 0.153 -0.002 0.174 0.190 0.016Mini Coop Bus 0.045 0.045 0.000 0.024 0.023 0.000 0.050 0.050 0.000Supertram 1 0.077 0.000 -0.077 0.073 0.000 -0.073 0.209 0.000 -0.209
Sub-total 4.821 4.882 0.060 5.623 5.674 0.050 9.750 10.000 0.249Travel Time of Private Transport Modes (Million Vehicle-hour/day )
Motorcycle 0.114 0.113 -0.001 0.171 0.170 -0.001 0.608 0.609 0.001Car 1.494 1.479 -0.014 2.236 2.224 -0.012 7.945 7.957 0.012Taxi 0.677 0.670 -0.007 1.013 1.008 -0.005 3.600 3.605 0.005
Sub-total 2.285 2.263 -0.022 3.420 3.402 -0.018 12.153 12.171 0.0187.106 7.144 0.038 9.043 9.076 0.032 21.903 22.171 0.267Total
2008 2012 2022
Source: JICA Study Team
Assumptions on Time Value
The time value to convert the saved travel time into monetary term was estimated. Table 3.7.11 shows the estimated time value at the year 2003 prices by each mode, which was computed, based on the income levels of different transport users (refer to Section 13. 2, Volume 3, the CREATS Master Plan for the detailed methodology). The hourly time value for public transport users is computed at 2.40 LE per person, while that of car users, 3.88 LE per person. The car time value per vehicle can be computed to be 7.3 LE, by multiplying the average number of persons in one vehicle, 1.9, by this hourly time value for a car use. Along with the economic growth, the time value must inherently increase in the future. Hence, the future time values were estimated at a proportional rate to the GRDP per capita in Cairo.
Table 3.7.11 Time Value Estimates by Transport Mode (1) Time Value of Public Transport Mode User (LE/hour/person)
Economic Prices 2001 2008 2012 2022 Time Value 2.4 2.7 3.1 4.1
(2) Time Value of Private Mode (LE per hour per vehicle) Economic Prices 2001 2008 2012 2022
Motor Cycle (1.1) 4.3 5.0 5.6 7.4 Car (1.9) 7.3 8.6 9.7 12.9 Taxi (2.5) 9.7 11.3 12.7 17.0
Notes: The number in parentheses denotes the average number of persons in one vehicles, and that in taxi stands for the average passengers.
Source: JICA Study Team

CREATS: Phase II Final Report, Vol. III: CTA Transport Improvement Project in East Sector of Cairo Chapter 3: A NEW ROLE FOR THE HELIOPOLIS METRO
3 - 173
Time Saving Benefit
As mentioned earlier, the time saving benefit generated by the introduction of the Supertram was calculated, simply multiplying the calculated total travel time of passengers in the Study Area by time value by mode, comparing the “with” and “without” cases. The result is summarized Table 3.7.12.
This table indicate the time saving benefits of passengers by transport mode. Looking into the computed results in 2022, a great amount of the time saving benefit is expected for CTA tram passengers, because the travel time of passengers who divert from the exiting CTA trams to the Supertram will be substantially reduced. Alike, those passengers who divert from shared-taxi and air-conditioned bus to the Supertram will gain increasingly greater benefits along with increasing passengers who would divert to the Supertram. In this way, the total time savings to be generated by the Supertram Project was calculated by mode. The summation denotes the total economic time savings by the introduction of the Supertram.
Table 3.7.12 Time Saving Benefit by the Supertram Project (Unit: Million LE, at2003 prices)
Economic Cost 2008 2012 2022 Public Transport Mode Passengers
CTA bus Passengers -13.3 -3.5 100.5 GCBC bus Passengers -3.5 -4.3 2.6 A/C bus Passengers 3.2 1.5 80.0 Ferry Passengers 0.0 0.0 0.0 Tram Passengers 128.8 101.3 242.5 Metro Passengers 0.0 3.7 10.6 ENR Passengers -0.1 0.6 -1.1 Shared Taxi Passengers 22.1 42.2 230.9 Minibus CTA Passengers -0.8 -2.4 24.4 Mini Coop Passengers -0.4 -0.5 -0.2 Supertram 1 Passengers -76.7 -82.0 -315.1
Sub-total 59.9 56.5 375.2 Private Transport Modes
Motorcycle -1.9 -2.1 2.7 Car -45.0 -42.4 56.7 Taxi -27.0 -23.2 31.0
Sub-total -75.8 -67.7 90.5 Total -13.8 -11.2 465.7
Source: JICA Study Team
It is noted that in this calculation as seen in this table, the time saving of the Supertram passengers was presented negative. This is the logical result derived from this approach, as discussed above. This can be explained by a simple example as follows:
Suppose that a CTA tram passenger from A-origin to B-destination takes 30 minuets in the “without” case. Since the Supertram is available in the “with” case, he/she diverts to the new transport mode and spend 20 minutes for it, instead of using the CTA tram. In comparison between both cases, he/she gains the time saving of 10 minuets (= 30–20). This CREATS Model, however, indicates a different manner of

CREATS: Phase II Final Report, Vol. III: CTA Transport Improvement Project in East Sector of Cairo Chapter 3: A NEW ROLE FOR THE HELIOPOLIS METRO
3 - 174
expressions of the time saving by mode in such a way that the time saving of the Supertram accounts for negative figure, - 20 minuets, in a comparison between the “With” and “Without” cases, because zero travel time would be taken in the “without” case. At the same time, the time saving of the CTA tram accounts for a positive figure, 30 minutes in comparison between both cases. Consequently, the time saving of the Project can be computed, summing up both the negative and positive numerical value, thereby resulting in 10 minutes (= -20+30). Thus, the result is the same.
In this way, the total time savings to be generated by the Supertram service was calculated by mode. The summation denotes the total economic time savings by the introduction of the new transport service.
2) Cost Saving Benefit
The operating costs of the private transport modes are calculated on vehicle-km basis by using the estimated unit vehicle operating cost (VOC) per vehicle-km by speed range. While, as for public transport modes, the operating costs are calculated on passenger-km basis, by multiplying the estimated unit operating cost per passenger-km by the passenger-km obtained as the traffic assignment results in the process of transport demand forecast. The detailed methodologies for the calculation have been mentioned in Section 13.2.4, Volume 3, the CREATS Master Plan.
a. Unit Operating Cost for Public Transport Mode
The unit operating cost by public transport mode was estimated, based on an analysis on actual performance indicators collected from different transport operators such as CTA and Shared-taxi companies and automobile dealers, as shown in Table 3.7.13.
Table 3.7.13 Unit Vehicle Operation Cost of Public Transport Mode (Unit: LE/ passenger-km at 2003 Economic Prices)
Economic Cost 2008 2012 2022 CTA bus Passengers 0.0518 0.0518 0.0518 GCBC bus *1 0.0518 0.0518 0.0518 A/C bus *1 0.0518 0.0518 0.0518 Ferry boat 0.2196 0.2196 0.2196 Tram 0.3342 0.3342 0.3342 Metro 0.0531 0.0531 0.0531 ENR 0.0474 0.0474 0.0474 Shared Taxi 0.0708 0.0708 0.0708 Minibus CTA *2 0.0708 0.0708 0.0708 Mini Coop *2 0.0708 0.0708 0.0708
Notes: *1: CTA cost was used; and *2: Shared taxi cost was used Source: JICA Study Team
b. Unit VOC by Speed Range
The unit VOC in accordance with speed ranges was examined as shown in Table 3.7.14.

CREATS: Phase II Final Report, Vol. III: CTA Transport Improvement Project in East Sector of Cairo Chapter 3: A NEW ROLE FOR THE HELIOPOLIS METRO
3 - 175
Table 3.7.14 Unit VOC Indices by Speed Range for Private Transport Modes (Unit: LE/Vehicle-km at 2003 Economic Prices)
Speed (km/h) MC Car Taxi Truck Heavy TRK S<5 0.2616 0.6498 0.6498 1.5505 2.4702
5<S<10 0.2616 0.6498 0.6498 1.5505 2.4702 10<S<15 0.2398 0.6306 0.6306 1.3955 2.3866 15<S<20 0.1962 0.5814 0.5814 1.1629 2.2101 20<S<25 0.1744 0.5301 0.5301 1.0466 2.0801 25<S<30 0.1744 0.4938 0.4938 0.9691 2.0058 30<S<35 0.1744 0.4638 0.4638 0.8916 1.9316 35<S<40 0.1744 0.4435 0.4435 0.8334 1.8851 40<S<45 0.1744 0.4329 0.4329 0.7947 1.8665
45<S 0.1744 0.4275 0.4275 0.7753 1.8573 Source: JICA Study Team
c. Estimated Cost Saving Benefits
Under an assumption that the Supertram service starts in 2008, the total economic cost saving benefits were computed for 2008, 2012 and 2022, including cost savings of public transport and private transport modes. The result is as shown in Table 3.7.15.
Table 3.7.15 Cost Saving Benefit of the Supertram Project (Unit: Million LE, at 2003 prices)
Economic Cost 2008 2012 2022 Public Transport CTA bus Passengers -6.0 -3.4 16.7 GCBC bus Passengers -1.6 -1.6 0.3 A/C bus Passengers 2.1 0.3 21.0 Ferry Passengers 0.0 0.0 0.0 Tram Passengers 182.8 123.3 207.5 Metro Passengers 0.5 2.4 4.7 ENR Passengers -0.1 0.4 -0.5 Shared Taxi Passengers 20.9 27.8 42.5 Minibus CTA Passengers 1.6 0.6 4.8 Mini Coop Passengers 0.0 0.0 0.0
Sub-total 200.2 149.9 297.0 Private Transport and Trucks Motorcycle -0.5 -0.8 0.8 Car -16.8 -22.7 15.7 Taxi -7.6 -10.2 7.0 Truck 1.3 5.1 -3.5 Heavy Truck -0.7 1.2 -0.4
Sub-total -24.3 -27.4 19.6 Total 175.9 122.5 316.6
Note: Cost for the Supertram 1 is appropriated as O&M Cost. Source: JICA Study Team It should be noted that although a considerable amount of cost saving benefits will accrue from changes in the traffic flow impacted by the Project in the entire Study Area as a whole, no cost saving for Supertram passengers is counted in this table. As

CREATS: Phase II Final Report, Vol. III: CTA Transport Improvement Project in East Sector of Cairo Chapter 3: A NEW ROLE FOR THE HELIOPOLIS METRO
3 - 176
mentioned earlier, the newly introduced transport mode itself requires its operation and maintenance costs, therefore, no savings appear on it. Such costs are regarded as the additional cost in terms of “Operation and Maintenance Cost” in the economic evaluation procedure.
(4) Cost-Benefit Analysis
A cost-benefit analysis was made, based on all properties derived above. As mentioned earlier, the service operation of the Supertram is assumed to start in 2008. The partnership costs are also considered for the economic costs, because direct benefits are thought to be derived from the combined investments with the partnership projects.
The analysis yields economic evaluation indicators such as EIRR (Economic Internal Rate of Return), NPV (Net Present Value) and B/C (Benefit-cost Ratio). It is assumed that the social discount rate in the Egyptian economy is 12% p.a. An economically feasible project should satisfy the following conditions:
• EIRR > the social discount rate (12%) • NPV = positive • B/C > 1.0
A summary of the computed evaluation indices is shown in Table 3.7.16, and the annual balance sheet of the economic costs and benefits are depicted in Table 3.7.17.
Table 3.7.16 A Summary of Economic Evaluation of the Supertram Project
Indicators Viability
Economic Internal Rate of Return (EIRR) 12.2%
Net Present Value (NPV) * at mid-2003 prices LE 32.9 million
Benefit/Cost (B/C) Ratio * 1.02 Notes: * at 12% discount rate. Source: JICA Study Team
The EIRR accounts for 12.2%, which is slightly higher than the social discount rate of 12%. As the result, the NPV totals 32.9 LE million and the B/C ratio is 1.02, given a 12% discount rare, meaning that the total benefit exceeds the cost in the long-term. This result advocates that the Project will bring a considerable amount of economic benefits to the national economy as a whole. It can be assessed that the Project is economically feasible, or worth being implemented from the national economic point of view.

CREATS: Phase II Final Report, Vol. III: CTA Transport Improvement Project in East Sector of Cairo Chapter 3: A NEW ROLE FOR THE HELIOPOLIS METRO
3 - 177
Table 3.7.17 Economic Analysis for Supertram Project
EIRR= 12.2% NPV= 32.9 B/C= 1.02 (Unit: Million LE)
O&M Investment Cost Cost
Cost TotalTime
SavingCost Saving Benefit Total Net Benefit NPV 2003
*1) Year (a) (b) (c)=(a)+(b) (d) (e) (f)=(d)+(e) (g)=(f)-(c) (h)
2004 147.1 0.0 147.1 0.0 0.0 0.0 -147.1 -131.4 2005 355.8 0.0 355.8 0.0 0.0 0.0 -355.8 -283.7 2006 772.8 0.0 772.8 0.0 0.0 0.0 -772.8 -550.1 2007 356.7 0.0 356.7 0.0 0.0 0.0 -356.7 -226.7 2008 43.0 47.0 90.0 -13.8 175.9 162.1 72.1 40.9 2009 21.5 47.0 68.5 -13.2 162.6 149.4 80.9 41.0 2010 0.0 47.0 47.0 -12.5 149.2 136.7 89.7 40.6 2011 3.6 47.0 50.6 -11.8 135.9 124.0 73.4 29.6 2012 3.6 47.0 50.6 -11.2 122.5 111.3 60.7 21.9 2013 0.0 48.6 48.6 36.5 141.9 178.4 129.8 41.8 2014 29.7 50.2 79.9 84.2 161.3 245.5 165.6 47.6 2015 141.9 51.8 193.7 131.9 180.7 312.6 118.9 30.5 2016 97.3 53.4 150.7 179.6 200.1 379.7 229.0 52.5 2017 162.2 55.0 217.2 227.2 219.5 446.8 229.6 47.0 2018 97.3 56.6 153.9 274.9 239.0 513.9 360.0 65.8 2019 0.0 58.2 58.2 322.6 258.4 581.0 522.8 85.3 2020 0.0 59.8 59.8 370.3 277.8 648.1 588.3 85.7 2021 0.0 61.4 61.4 418.0 297.2 715.2 653.8 85.0 2022 0.0 63.0 63.0 465.7 316.6 782.3 719.3 83.5 2023 0.0 63.0 63.0 465.7 316.6 782.3 719.3 74.6 2024 0.0 63.0 63.0 465.7 316.6 782.3 719.3 66.6 2025 0.0 63.0 63.0 465.7 316.6 782.3 719.3 59.4 2026 0.0 63.0 63.0 465.7 316.6 782.3 719.3 53.1 2027 419.6 63.0 482.6 465.7 316.6 782.3 299.7 19.7 2028 0.0 63.0 63.0 465.7 316.6 782.3 719.3 42.3 2029 0.0 63.0 63.0 465.7 316.6 782.3 719.3 37.8 2030 -828.5 63.0 -765.5 465.7 316.6 782.3 1,547.8 72.6 Total 1,823.9 1,297.0 3,120.9 6,173.7 5,571.5 11,745.2 8,624.3 32.9
Notes: *1) Discounted at 12% Source: JICA Study Team
CREATS: Phase II Final Report, Vol. III: CTA Transport Improvement Project in East Sector of Cairo Chapter 3: A NEW ROLE FOR THE HELIOPOLIS METRO
3 - 178
3.7.4 Financial Evaluation
The Supertram Project is evaluated from the financial viewpoint. The following are a summary of the findings.
(1) Assumptions
A number of assumptions are employed for the financial analysis as follows:
• The financial costs are estimated at mid-2003 constant prices, as shown in Section 3.7.2 in this volume;
• The estimated financial capital costs are allocated in the scheduled time framework up to the year 2030 in such a way that the service will be operated in 2008 and will generate the operating revenues from 2008;
• The evaluation period is assumed to be a period between 2004 and 2030, and the depreciation of depreciable assets are appropriated with a straight line method under an assumed useful life by asset (as show in Table 3.7.5) and the residual value of the invested capitals is considered in 2030 as a negative cost.
• For the operating revenue, the fare level is assumed to be initially 0.65 LE per passenger with a flat fare system, and adjusted in accordance with real economic growth, that is, 0.75 LE per passenger in 2012 and 1.00 LE per passenger in 2022, all expressed in mid-2003 constant units; and
• Additional incomes accruing from ancillary sources related to the Supertram service operation, such as advertisement charges and commercial activities can be considered to be 6% - 30% of the operating revenue. This revenue is a key to make the Project financially viable. As a base case, 6% is initially assumed, taking into account experiences being performed in other countries, and its variation is examined in the sensitivity test.
(2) Evaluation Indicators for Financial Feasibility
The Project will be evaluated in terms of the following four (4) indices:
• FIRR (Financial Internal Rate of Return) • The first year when the Project generates a positive annual operating profit; • The first year when the annual net profit becomes positive (after reduction of
interest and depreciation); and • The year when the accumulated net profit becomes positive.
The FIRR is an indicator to judge the financial robustness of the Project. Given a higher FIRR than any interest rate of a commercial loan, the Project could be financially viable. In other words, the investment capital for the Project, which is procured through a commercial bank, will be able to yield a higher rate of return than the interest rate of the loan. A higher FIRR is favorable, however, it is not necessarily the case, depending upon the availability of loans with a lower interest

CREATS: Phase II Final Report, Vol. III: CTA Transport Improvement Project in East Sector of Cairo Chapter 3: A NEW ROLE FOR THE HELIOPOLIS METRO
3 - 179
rate. Thus, the FIRR implies a feasible level of financial costs of the investment capital to be procured through some financial institutions.
Another important judgment from this analysis is whether or not the Project will have a risk for the bankruptcy, or how much risky the investment on the Project is against a complete loss. This will be examined by identifying some indicators in projected financial statements, that is, 1) how many years will take for the Project to generate a positive profit at annual basis?; 2) how many years will take till the annual net profit becomes positive?; and 3) how many years will take till the accumulated net profit will be positive? Needless to say, the Project is expected to yield a positive net profit within an acceptable timeframe, even if some losses annually take place in the initial stage.
(3) Summary Result of the Financial Analysis
The results of the financial analysis are summarized in Table 3.7.18.
Table 3.7.18 A Summary of Financial Analysis for the Supertram Project
Evaluation Indices Result
FIRR (Financial Internal Rate of Return) Negative
The First Year of Positive Operation Profit at Annual Basis Year 2019
The First Year of Positive Net Profit at Annual Basis (after Interest and Depreciation) Year 2024
The First Year of Positive Accumulated Net Profit Beyond 2030 Source: JICA Study Team
The FIRR for the Supertram Project is computed to be negative under the assumptions above, which implies that the Project will hardly be viable from the financial point of view, or that the investment funds should be procured at a significantly low interest rate or that government subsidies should be injected in order to make the Project financially feasible.
However, it should be noted that although the FIRR seems hardly favorable, the Project will not be bankrupted. A positive operating profit will occur at an annual basis in the year 2019, or 11 years after the commencement of the service operation; and in the next 5 years, or 2024, the net profit after reduction of the interest payment and depreciation will be positive. In the accumulated balance, the Project will recover all the investments in the long-term beyond 2030.
(4) Sensitivity Tests
Under the assumed conditions, the Project would hardly be feasible in terms of the FIRR. This will make the project financing considerably difficult. Therefore, some financing measures to make the Project more viable need to be considered. The following results of “Sensitivity Tests” indicate useful implications for this purpose:

CREATS: Phase II Final Report, Vol. III: CTA Transport Improvement Project in East Sector of Cairo Chapter 3: A NEW ROLE FOR THE HELIOPOLIS METRO
3 - 180
a. Should only the depreciation of rolling stocks be considered, the FIRR turns to be positive and accounts for 3.6 %. This means that if the capital investments for the infrastructure, other than rolling stocks, could be financed by a government subsidy, the Project would be financially feasible.
b. Given additional revenues from off-rail business activities equivalent to 20% of the operation revenue, instead of 6%, the FIRR would be 1.3%, which shows somewhat improvement of its financial feasibility.
c. Given a unit system of 1.0 LE per passenger from the initial year 2008, instead of 0.65 LE per passenger, the financial state would be improved to push up the FIRR at 3.1%.
d. Given a 20% reduction in the initial investment cost, the FIRR is improved to be 1.0%.
e. Given a composite condition with (b), (c) and (d), the FIRR is computed at 6.7%, which means that its financial viability would be considerably improved.
(5) Financial Evaluation: A Conclusion
Taking into account the above findings through the sensitivity tests, the Supertram Project could be financially feasible, given four (4) key conditions to be assured:
1) Positive involvement of the government sector through provision of subsidies; 2) Flexible fare system; 3) Diversification of revenue sources other than railway operation revenues; and 4) Establishment of an unique financing and operation mechanism. Firstly, regarding the government sector’s involvement, two functions of the government are expected: one is to provide its subsidy for the initial investment for the infrastructures; and the other is to procure international concession loans from international aid agencies. As for the former function, since it has been proven from the economic evaluation that the Project is economically feasible from the national economy standpoint, a certain amount of the government subsidy or tax money for the Project can be justified. The government, however, may be reluctant to be fully responsible for financing the whole investment cost. The sensitivity test reveals that given the subsidy only for the infrastructures (of which the ownership should be held by the government sector) other than rolling stock, the FIRR of the Project will be positive, 3.6%. This implies that the Project could be financially manageable, should a low interest rate fund be available. It is noted that there are few cases over the world that such a modern urban transit system is being operated without government subsidies.
As per the latter function, the government is expected to arrange a softer loan from possible international aid agencies such as European Investment Bank (EUB), World Bank or Japan Bank for International Cooperation (JBIC). The current ordinal interest rate of a long-term commercial loan seems to be more or less 10 % as of

CREATS: Phase II Final Report, Vol. III: CTA Transport Improvement Project in East Sector of Cairo Chapter 3: A NEW ROLE FOR THE HELIOPOLIS METRO
3 - 181
2003 in Egypt. As proven above, the Project can hardly be managed by commercial finance with such a condition, unless the government provides with its subsidy.
Secondly, regarding the fare level, since the ridership is inherently elastic to the fare level, a small increase of the fare would catalyze a reduction of the ridership. Nevertheless, considering the current passenger behavior, it could be said that the more comfortable transport mode are provided, the more passengers will be attracted. A flat fare system starting with 1.00 LE seems reasonable and affordable for the majority of people nowadays. A flexible fare system responsive to demands should be considered for such a modern and comfortable transport system.
Thirdly, the railway business may diversify its revenue sources from not only fare charges but also commercial business activities at stations and for passengers-related services such as advertisement, kiosk and exhibitions/events at station halls and station plazas. As shown in the sensitivity test, these commercial revenues, are significant to make the Project more viable. Based on this implication, the operator may be given a business right to run some real estate and/or commercial business to use the land adjacent to the Supertram stations. This could facilitate an integrated business scheme with the transport service, thereby leading to a financially viable condition as a whole.
Fourthly, as a result of the above measures, an unique mechanism for financing, operating and managing the Project should be explored, involving the private as well as the government sector. CTA itself also needs to be re-organized to implement the Project. A proposed mechanism is discussed in the following section.
3.8 RECOMMENDED IMPLEMENTATION MECHANISM
3.8.1 Pursuance of A Public Private Partnership Mechanism
It was assessed that the Supertram Project would be economically feasible but financially less feasible. This implies a need for a deliberated design of the implementation mechanism in terms of the financial arrangement. In this regard, three alternatives are generally conceivable as follows:
Alternative 1 (Government-Initiative):
The government sector shall take the full responsibility for the construction and the operation. The investment by tax money is rational and justifiable, because the Project itself ahs been proven to be economically feasible. Therefore, a government subsidy should be injected to an extent that the financial balance shall be assured in the long-term. This option, however, hold two sorts of issues to be tackled: (1) CTA could hardly guarantee an efficient commercial operation without restructuring of CTA. Such an institutional arrangement will be further difficult; and (2) As the Project is financially sensitive, the external resource mobilization with a lower interest rate would be a key, despite that the Egyptian government has currently applied a severe ceiling policy for foreign debts.

CREATS: Phase II Final Report, Vol. III: CTA Transport Improvement Project in East Sector of Cairo Chapter 3: A NEW ROLE FOR THE HELIOPOLIS METRO
3 - 182
Alternative 2 (Privatization):
As an alternative scheme to lessen the government sector’s financial burdens and budgetary constraints, a BOT (Build, Operation and Transfer) mechanism under a well-planned concession scheme is nowadays getting more popular, and may be a possible option for public service provision. However, the BOT scheme is not necessarily recommended for this Project, because of the following four reasons: (1) the private sector will hardly take a financial risk on such a huge amount of investment that will be constantly required over the long-term; (2) the private sector will claim some sort of government guarantee on the revenue, or a constant subsidy to avoid ridership risk which is heavily dependent on the progress of the new communities development; (3) The private sector’s fund-raising capacity for the infrastructure construction is inherently subject to economic fluctuation. Therefore, the private sector could hardly guarantee the scheduled construction and operation as expected; and (4) it will normally take a long time to reach an agreement between both the government and private sectors, thereby losing otherwise-could-be benefits.
In order to make a BOT project successful, as proven by other countries’ experiences, a capacity building process in the public sector is indispensable. The managerial and negotiable capacities in the government side should be strengthened, and at the same time, a well-organized legislative framework to conduct a proper BOT mechanism needs to be prepared before launching a BOT project.
Alternative 3 (Public-Private Partnership):
A type of Public-Private Partnership (PPP) mechanism could be pursued. This option is flexible and applicable for the Supertram Project. The government sector assumes responsibility for the infrastructure development, and owns its property, while the private company or a joint venture company of the public and private sectors, shall assume the responsibility for operation and maintenance including the procurement of rolling stocks, leasing the infrastructure from the owner who is the government sector. The government may recover the investment cost by a concession fee and rents of the infrastructure to be collected from the operator. As this mechanism reinforces both weaknesses, and integrate both strengths of the public and private sectors, this is suitable for such a project like the urban transit system improvement requiring a considerable amount of initial investments and sophisticated technologies for the operation and management. It is recommended that this mechanism, as conceptualized in Table 3.8.1, should be further pursued for the Supertram Project.

CREATS: Phase II Final Report, Vol. III: CTA Transport Improvement Project in East Sector of Cairo Chapter 3: A NEW ROLE FOR THE HELIOPOLIS METRO
3 - 183
Table 3.8.1 A Proposed Framework of Public-Private Partnership Scheme The Infrastructure Owner
(The Government Sector) The Operator
(A Private or Joint Entity)
Investment Provision of capital investments and construction of the infrastructures and the systems
Procurement of rolling stocks and related facilities and equipment
Tasks & Roles
1) Issuing a Concessionaire for use of the Infrastructures
2) Issuing a business operation license with a definite set of rules and regulations
3) Monitoring the operation and management
1) Assuring a proper operation and services
2) Maintaining the Total System 3) Strengthening the human capacity 4) Generating operational revenues 5) Running off-rail business to
strengthen the financial structure
Obligations Recovering the investment by the received Concession Fees in the long-term
Payment of the Concession Fees
Accountability To the public To the Infrastructure owner as well as the public
Access to Funds
• Government subsidy • International donor agencies
• International donor agencies • Local financing institutions and
commercial banks Source: JICA Study Team
3.8.2 A Cash Flown Analysis of A Public Private Partnership Model
The Study Team recommends “Alternative 3” as discussed above, to implement the Supertram Project. Under a conceptual mechanism of Public-Private Partnership (PPP), a cash flow analysis was made to evaluate its overall profitability and implementability.
(1) Assumptions for A Business Model
For a business model, two organizations are supposed, namely, the government (the infrastructure owner) and the operator (an operating company), and the following conditions are assumed:
1) The government sector, or Cairo Governorate is proposed to be the implementing body of the Project, and invests the infrastructure facilities. Therefore, the infrastructures belong to the government sector.
2) The government sector shall procure the funds equivalent to the foreign currency portion for the infrastructure through an ODA soft loan scheme, while that for the local portion shall be raised internally as a government subsidy. Financial conditions of the ODA soft loan are assumed to be: 3% interest rate; 7 years grace period and 25 years repayment period.
3) The operating company, named the Supertram Company (STC), shall be established to maintain all the infrastructure facilities and operate the Supertram service, with procuring the necessary rolling stock. The operating entity may be any form of business corporations. However, the operating company should

CREATS: Phase II Final Report, Vol. III: CTA Transport Improvement Project in East Sector of Cairo Chapter 3: A NEW ROLE FOR THE HELIOPOLIS METRO
3 - 184
guarantee a good practice for the railway operation business and be capable of managing the total system in a commercially and professionally proper manner.
4) It is assumed that the equity of the STC shall share 20% of the initial investment, and that the STC can have access to an international soft loan equivalent to the amount of the foreign currency portion necessary for the rolling stock procurement, and a long-term loan at a commercial bank with a 10% interest rate and short-term loans (one year) at a 13% interest rate at local commercial banks. Needless to say, the gearing ration of the equity is a crucial factor affecting the financial conditions of the company in the start-up period. The assumed rate of 20% seems rational as a rail business entity.
5) It is assumed that the STC shall operate the Supertram service, receiving daily fare revenues from passengers and sales revenues from some sorts of off-rail business such as commercial advertisement, kiosks and real estate services. Taking into account experiences in the other countries, the off-rail business revenue may be assumed to be 6% of the operating revenue at least. Therefore, the financial status with off-rail profits in a range between 6 to 30% of the operating revenue is examined.
6) The STC runs the business, costing repayments of the loans, depreciations of capital assets, recurrent operating expenses and a concession fee which should be paid to the infrastructure owner for its use. The concession is a key for this business model of the Public-Private Partnership scheme. The government sector, as the infrastructure owner, receives the concession fee from the operating company at a certain percentage of the operation revenue, and may earmark the collected fees to recover the initial investment cost in the long-term.
7) The rate of the concession fee that the operator shall pay the infrastructure owner is assumed to be 5% of the operational revenue as a base case, then an appropriate rate is examined in a range of 5% to 50% so that both parties’ financial situations are favorable, or not worsened at least.
(2) Results of the Cash Flow Analysis
The evaluation criteria are set as follows:
For the Operator:
FIRR (Financial Internal Rate of Return): to assess the financial feasibility on the Operator’s investment; and
ROE (Return on Equity) 4 : to measure the profitability of the equity initially raised by investor(s), in terms of a percentage of returns on the initial investments.
4 ROE: A measure of how well a company used reinvested earnings to generate additional earnings. It is
used as a general indication of the company's efficiency; in other words, how much profit it is able to generate given the resources provided by its stockholders. Investors usually look for companies with returns on equity that are higher and growing more than any interest rate of deposits at commercial banks. For this analysis, ROE is computed as a percentage of the average annual returns on the initial investments during the period of the project life.

CREATS: Phase II Final Report, Vol. III: CTA Transport Improvement Project in East Sector of Cairo Chapter 3: A NEW ROLE FOR THE HELIOPOLIS METRO
3 - 185
For the Infrastructure Owner:
Accumulated Subsidy: to measure the amount of the subsidies that the Government provides for the infrastructure development;
Average Annual Subsidy: to assess the magnitude of the average annual subsidy which is shouldered by the Government;
Accumulated Net Profit in 2030: to assess the financial balance between accumulated profits (equivalent to the collected concession fees) and the subsidies in the end of the project life, 2030.
For the cash flow analysis, seven (7) cases with different conditions were examined with a purpose to seek for the most rational and favorable scheme, namely:
Case A: the concession fee rate is assumed at 5% of the operation revenue, and the other conditions are the same as the basic assumptions as mentioned in Item 1), Section 3.7.4.
Case B: the fare is assumed to be 1.0 LE from the beginning of the operation;
Case C: the revenues from off-rail business are considered at 20% of the operating revenue;
Case D: the revenues from off-rail business are considered at 30% of the operating revenue;
Case E: under a combination of Cases B and C, namely, a 1.0 LE fare plus 20% off-rail revenue;
Case F: under a combination of Cases B and D, namely, a 1.0 LE fare plus 30% off-rail revenue; and
Case G: under a combination of Case F and a 20% concession fee rate, namely, a 1.0 LE fare, 30% and off-rail revenue, but the concession fee rate is increased to be 20% of the operating revenue.
Based on the above assumptions, a cash flow analysis was made for each entity, and the results are summarized in Table 3.8.2.

CREATS: Phase II Final Report, Vol. III: CTA Transport Improvement Project in East Sector of Cairo Chapter 3: A NEW ROLE FOR THE HELIOPOLIS METRO
3 - 186
Table 3.8.2 A Summary of Cash Flow Analysis The Operation
Company The Infrastructure Owner
Case Basic Condition FIRR (%)
ROE 1)
(%)
Accumulated Subsidy (Mill. LE)
Average Annual Subsidy (Mill. LE)
Accumulated Net Profit
in 2030 (Mill. LE)
Case A CF 2) =5% 3.6 2.4 1,589 59 -955
Case B Fare = LE1.0 on the Flat Fare System 3) 8.8 16.9 1,527 57 -893
Case C Off-rail Revenue = 20% 4) 6.2 10.0 1,589 59 -955 Case D Off-rail Revenue = 30% 7.3 13.1 1,589 59 -955 Case E Combination of (B) + (C) 11.6 24.2 1,527 57 -893
Case F Combination of (B) + (D) 12.9 27.6 1,527 57 -893
Case G Combination of (F) + CF=20% 11.0 22.5 903 33 - 269
Notes: 1) “ROE”: Return on Equity. 2) “CF” stands for the rate of Concession Fee to the operation revenue. 3) The fare level at the opening time of the Service. 4) Percentage of the operating revenue Source: JICA Study Team
The following are major findings from the analysis:
1) In Case A, the Operator’s feasibility cannot be assured in terms of both FIRR (3.6%) and ROE (2.4%), while the Infrastructure Owner shall shoulder a total of 1,589 million LE for the total investment which is equivalent to 59 million LE on the annual average. As the result, 959 million LE will not be able to be recovered even in 2030.
2) The Operator’s financial state is significantly sensitive to revenue-related factors. Given Case E, the Operator will be able to enjoy sufficient financial returns on its investments, that is, FIRR, 11.6% and ROE, 24.2%. Should Case F be assured, its profitability will be further improved: FIRR, 12.9% and ROE, 27.6. Thus, Case F must be most welcome scheme for the Operator.
3) As far as a 5% concession fee rate is applied (Cases A through F), the financial situation of the Infrastructure Owner cannot be improved substantially. In order to improve the Owner’s financial state, the concession fee rate needs to be increased up to 20% of the operating revenue, that is, Case G. Given this condition, the accumulated subsidies will be decreased to about 903 million LE and the accumulated negative balance in 2030 will be minimized at 269 million LE, and such a negative balance will be fully recovered in the longer-term.
4) Whilst, the Operator will be able to financially manage the Project even in Case G, still enjoying a 11.0% FIRR and a 22.5% ROE, which is deemed to be still attractive to potential investors. Therefore, Case G is assessed to be the most rational for both entities.

CREATS: Phase II Final Report, Vol. III: CTA Transport Improvement Project in East Sector of Cairo Chapter 3: A NEW ROLE FOR THE HELIOPOLIS METRO
3 - 187
3.8.3 Recommendations on the Implementation
As a conceptual business model of Public-Private Partnership, an unique scheme was examined, that is, two entities of the infrastructure owner and the operator shall separately come into the common business ground and integrally play for the implementation of the Project. The result of the cash flow analysis revealed that there exists an appropriate scheme that will enable both parties to manage the Project in such a way that both parties will be able to satisfy their own objectives: the Operator will enjoy a sufficient level of profits, while the Infrastructure Owner (the Government) will recover the vested subsidy in the long run, providing public transport services for the people. Therefore, it is recommended that this scheme should materialize in consideration of the following aspects:
1) Since the Project itself is evaluated economically feasible, the government subsidy for the Project can be justified in the long-term from the national economy point of view, as discussed in Section 3.7.3. Therefore, the government or the Cairo Governorate is recommended to initiate the Supertram Project.
2) The external resource mobilization is essential for the Project, because the Project is financially sensitive, as discussed in the financial evaluation, Section 3.7.4. The fund of the foreign currency portion shall be procured through an ODA soft loan scheme, while that for the local portion shall be raised internally as a subsidy. The conditions of the ODA soft loan are assumed: 3% interest rate; 7 years grace period; and 25 years repayment period. However, as financial conditions for the external funds vary depending upon funding institutions, the analysis needs to be further clarified with the conditions offered by the agency that is interested in the financial support.
3) As for the operating entity, some private sector’s offers could be invited through a biding process, as far as it is assured that the entity can be functionally organized with sufficiently trained staffs. However, a possible option should be “the Supertram Company (STC)” to be arrayed within the commercialized CTA Holding Company scheme as proposed under the CTA Restructuring Program (refer to Chapter 5). The STC can be organized in a joint venture form with private investor(s). Given this setting due to its semi-governmental public entity, the STC could access to an international soft loan equivalent to the amount of the foreign currency portion. The STC shall maintain the whole infrastructure facilities and operate the Supertram service, procuring a necessary number of rolling stocks.
4) The most appropriate scheme is defined as that the Operator can gain a moderate return, while the Infrastructure Owner can minimize the total subsidy and the negative profit (loss). As the result, it can be said that three conditions are necessary, that is, (1) the fare starts with 1.0 LE; (2) Revenue from off-rail business is more or less 30% of the operation revenue; and (3) the concession fee rate is 20% of the operation revenue.
5) Based on the above implications, a “unique mechanism” needs to be newly established for the implementation of the Supertram development. The Operator should be entitled to run some commercial and business activities related to the

CREATS: Phase II Final Report, Vol. III: CTA Transport Improvement Project in East Sector of Cairo Chapter 3: A NEW ROLE FOR THE HELIOPOLIS METRO
3 - 188
Supertram service at the stations and/or in their vicinities to make the operating business more profitable and financially sustainable through a cross-recovery system. Such an incentive scheme must be attractive for the investor to participate in this business.
6) Revenues from “off-rail business” seem possible and practical, taking into account the location advantage of the Supertram Line 1, the catchment area of which is highly urbanized areas having a wide variety of business and commercial opportunities. For instance, a shopping center business may be commercially viable at Ring Road Station that is an intermodal point gathering a considerable number of customers.
7) It should be noted again that all the arguments for the economic and financial evaluation are based on the hypothetical setting where Metro Line 3 will be available in 2017, because Metro Line 3 is treated as a given condition. This Supertram Line 1 cannot function as a substitute for Metro Line 3, but both are dispensable for Cairo to develop a modern urban transport system.
8) The Supertram Line 1 can greatly enlarge a transport capacity with a state-of-art urban transport system to/from the National Stadium where will hopefully host the 2010 Word Cup Game which has been promoted to invite. The Supertram shall be a symbolic project to support such a promotion activity.

CREATS: Phase II Final Report, Vol. III: CTA Transport Improvement Project in East Sector of Cairo Chapter 3: A NEW ROLE FOR THE HELIOPOLIS METRO
3 - 189
3.9 FURTHER TECHNICAL DISCUSSIONS
Previous sections of this chapter have presented Supertram Line 1 in considerable detail. Discussions have focused upon technology, operations, cost, financial feasibility, economic feasibility and environmental assessment. This documentation is sensitive to continuing technical discussions between the Study Team as well as members of the Steering Committee and other Egyptian technical experts. Considerable modifications of Volume III of the draft Final Report (submitted during October, 2003) were, for example, undertaken in response to Committee comments and Study Team responses thereto dated January 25, 2004. This process culminated in the submittal of a revised draft Final Report during mid-July 2004.
Following the procedures indicated above, additional discussions were undertaken with the Committee relative to Volume III; specifically, an expressed desire to provide further clarification of various elements of technical reviews which had, in the opinion of the Committee, not been fully documented as part of the January modifications. These are contained in this Section 2.9 of the report using a series of generic and topical headings. Appropriate references to these sections have been inserted in the main report.
3.9.1 Technology Options
The general crux of the issue is selection of the supertram vis-à-vis an alternative technology option such as urban busway.
The evolving role of the Heliopolis Metro, hence the entire purpose of the supertram feasibility investigations, must be seen in the context of recommendations contained in the Phase I CREATS Master Plan and the list of 20 priority projects. During the course of Phase I investigations a series of technology options were explored. This list includes, in addition to the MRT network, enhancing transport between suburban sub-centers and the realization of three Supertram lines. These lines are to function as regular light rail transit (LRT) systems in their own rights-of-way. Supertram Line 1, as documented in Chapter 3 of the current volume, runs from Ramses Square to the Ring Road; it will, per intent of the MHUUC, ultimately be extended into New Cairo. Project prioritization procedures employed during Phase I confirmed that Supertram Line 1 is the LRT line exhibiting highest priority, and was thus selected for further detailing during the current Phase II investigations.
In terms of the potential applicability of a busway in place of the supertram, it is noted that the forecast year 2022 maximum hourly directional demand for the supertram is 15,500 persons. This cannot be absorbed by a busway for various reasons:
• Busways are indeed a viable alternative to urban rail systems, but only under proper conditions. One of the most obvious ways of maximizing the utility of a busway (as opposed to bus lanes) is to ensure a minimum of stations, proper geometrics and sufficient interstation spacing to achieve higher operating speeds. In other words, an ideal scenario such as the West Wing (refer Volume II of this

CREATS: Phase II Final Report, Vol. III: CTA Transport Improvement Project in East Sector of Cairo Chapter 3: A NEW ROLE FOR THE HELIOPOLIS METRO
3 - 190
report). However, to implement a busway with similar operating capabilities in a densely urbanized area such as East Cairo is considerably more problematic.
• The year 2022 operational scenario shows a required peak supertram headway of some 2 minutes, 10 seconds; that is, a directional train of near 600 person capacity every 2+ minutes. This yields an offered peak hour directional capacity of 16,500 persons. At a two minute headway, judged as a practical minimum for the supertram as currently conceived, capacity would be 18,000 persons per hour per direction (of course, the actual operational calculations take into account other variables, but for the moment the focus is headway and train capacity).
• Horizontal width restrictions in the alignment prevent the use of oversize buses; the largest rolling stock would therefore likely be an articulated bus with a capacity of, say, 200 persons per bus. To accommodate 15,500 persons per direction requires 78 buses per hour, or roughly one bus every 46 seconds. This cannot be achieved, unless of course the busway is expanded to more than one lane per direction; an unrealistic assumption for the corridor in question. This brief description also ignores the obvious concerns of station dwell times (passenger boarding/alighting) plus end-of-line turnarounds.
• A reasonable criteria for a busway is a peak directional headway of two minutes. Based on a 200 person bus, this implies a directional capacity of 6,000 persons, roughly one-third less than the forecast year 2007 supertram demand. Thus, demand could not possibly be met using this technology, and under conditions seen as realistic for the corridor in question.
The consideration of LRT vs busway in core urban areas must, of course, be determined via an initial screening based on capacity and technical issues. Environmental benefits of electric technology, compatibility with pedestrian precincts, ambiance and proven potential for urban development also exist, as discussed throughout Chapter 3 of this report.
3.9.2 Evaluation Considerations
The context of the discussion is the relationship between preliminary screening and detailing of the supertram, as well as between directional demand and operational characteristics.
The indicated demand, such as in Tables 3.2.12 and 3.5.12, is highest directional volume, although both inbound and outbound patterns are reasonably balanced. There is no directional factor per se; the CREATS transport model assigns directional trips (on/off; inbound/outbound) at each designated station which, in turn, yields maximum inter-station accumulations by direction.
The operational characteristics and cost are calculated on the basis of the hourly service variation (which is in turn based on demand) shown in Table 3.5.14. Offered capacity is balanced in both directions given that, generally speaking, an equal number of inbound and outbound trains operate during the indicated time slices. As an interesting observation, it is noted that the hourly offered capacity distribution for Metro Line 1 is similar to that calculated for Supertram Line 1.

CREATS: Phase II Final Report, Vol. III: CTA Transport Improvement Project in East Sector of Cairo Chapter 3: A NEW ROLE FOR THE HELIOPOLIS METRO
3 - 191
Section 3.2, as its name applies, is a technical review of supertram alternatives. Section 3.4 describes which of these selections is the preferred option, and Section 3.5 then provides technical detail for the preferred alternative. In terms of comparative analyses, technical reviews in section 3.2 are not, nor do they have to be, of a similar detail as discussions of the preferred alternative in section 3.5. Thus, section 3.2 is only intended to document comparisons of key operating parameters, while section 3.5 provides a full description, using more refined modeling and analytical techniques, of the preferred alternative.
3.9.3 Operating Cost
The context of the discussion is the derivation of the operational costing depicted in Table 3.3.3.
Table 3.3.3 provides a detailed breakdown of typical European tram-LRT system operating costs in terms of constant year 2002 Euros per train kilometer. Major components are separated in order to synthesize European experience with expected Egyptian operating cost, using a series of factors which differentiate between domestic and foreign content.
There is no other similar project in Egypt to identify more precisely these factors. Thus, the Team was obliged to develop an estimation from European similar projects weighting each cost breakdown value by a specific factor reflecting the part of Egyptian/non Egyptian components and the part of manpower/material to take into account low Egyptian labor cost and productivity.
This exercise is not easy as the future system components could be purchased; for example, in Japan, Europe, the United States, Korea (rolling stock) or China (rail). Each country offers different systems (and costing incentives) corresponding to different standard and comfort. Moreover, currency fluctuation changes project costs almost on a daily basis.

CHAPTER 4
NETWORK OPTIMIZATION AND INTEGRATION IN THE EAST SECTOR

CREATS: Phase II Final Report, Vol. III: CTA Transport Improvement Project in East Sector of Cairo Chapter 4: NETWORK OPTIMIZATION AND INTEGRATION IN THE EAST SECTOR
4 - 1
CHAPTER 4: NETWORK OPTIMIZATION AND INTEGRATION IN THE EAST SECTOR
The previous Chapter 3 deals largely with hardware considerations of Supertram Line 1 and its supporting systems. This chapter focuses on software, in particular intermodal enhancements in the form of feeder bus services, modal integration at key terminals and stations, as well as the realization of an integrated ticketing approach.
4.1 HELIOPOLIS METRO AND CTA TRAM
Supertram Line 1 represents a new technology and new operating system. The antiquated remaining portions of the Heliopolis Metro and CTA Tram located in East Cairo will not be compatible with the supertram. Joint operation on common track will not be possible. Yet, those remaining elements of the Heliopolis Metro not part of Supertram Line 1 are a valuable resource with considerable potential for providing efficient and needed public transport services. The integrity of the system, and its valuable rights-of-way, must be maintained for urban rail purposes. This section sets forth a suggested approach for operational integration with Supertram Line 1.
4.1.1 Strategic Orientation
The evolving role of the Heliopolis Metro must be seen in the context of recommendations contained in the Phase I CREATS Master Plan and the list of 20 priority projects. This list includes, in addition to the MRT network, enhancing transport between suburban sub-centers and the realization of three Supertram lines. These lines are to function as regular light rail transit (LRT) systems in their own rights-of-way. Supertram Line 1, as documented in Chapter 3 of the current volume, runs from Ramses Square to the Ring Road; it will, per intent of the MHUUC, ultimately be extended into New Cairo. Supertram 2 connects Ataba with Nozha, and Supertram 3 is a circumferential line linking Madinet Nasr and Heliopolis with Port Said Street, as well as intermediate intermodal points with ENR, buses and metro. A total of 53 kilometers of Supertram lines is proposed using, whenever possible, existing Heliopolis Metro and CTA Tram rights-of-way (Figure 4.1.1).

CREATS: Phase II Final Report, Vol. III: CTA Transport Improvement Project in East Sector of Cairo Chapter 4: NETWORK OPTIMIZATION AND INTEGRATION IN THE EAST SECTOR
4 - 2
Source: JICA Study Team Figure 4.1.1 The Composite Supertram Network – CREATS Master Plan
Project prioritization procedures employed during Phase I confirmed that Supertram Line 1 is the line exhibiting highest priority, and was thus selected for further feasibility during the current Phase II investigations. However, it is important to note that the committed projects given in the priority list of CREATS Phase I report concerning Metro Line 3 and other extensions of Metro Lines 1 and 2 are to be implemented first. The current feasibility study is based on this assumption.
Following realization of Supertram Line 1, staged implementation of Supertram Line 2 and Supertram Line 3 are to follow, preceded by feasibility studies similar in nature to the current effort. The remaining tram lines in Heliopolis not part of the composite supertram network (some 7.5 kilometers remain) are to be rationalized and rehabilitated so as to improve commercial speed and comfort. Upgrading is expected to include trackage, signaling, power supply and rolling stock, but to the performance of urban tram, not necessarily LRT.
The Study Team urges that this process be followed; that is, any form of upgrading of those segments of the Heliopolis Metro not part of Supertram Line 1 should, in the first instance, lead toward realization of an additional two supertram lines. Any other form of upgrading should be seen as an intermediate or temporary measure.
Following sections describe how the first step should proceed, that is, potential treatments of remaining segments of the Heliopolis Metro after implementation of Supertram Line 1, but prior to the realization of Lines 2 and 3.

CREATS: Phase II Final Report, Vol. III: CTA Transport Improvement Project in East Sector of Cairo Chapter 4: NETWORK OPTIMIZATION AND INTEGRATION IN THE EAST SECTOR
4 - 3
4.1.2 Network and Routes
As existing lines use outdated technology, the rolling stock of Heliopolis Metro and CTA Tram will not be able to use the new state-of-the-art Supertram line. The existing lines that overlap the Supertram line on the common sections from Ramses Station to Ahmed Tayseer St. (HM metro) and from Sayed El Merghany St. to Madinet Nasr terminal (CTA Tram) will therefore be curtailed and reorganized so as to feed the more efficient Supertram line at specific intermodal points : Teacher”s College, Heliopolis Club, and most important, Girl’s College (Figure 4.1.2). Girl's College will then become a major intermodal point for the tram lines, in addition to Metro Line 3 and Supertram Line 2. The Nozha line could then eventually be upgraded to the Supertram line 2. The routes of the reorganized lines are shown in Tables 4.1.1 and 2.
Table 4.1.1 Reorganized Heliopolis Metro Lines Line Line Name (origin / destination) Length (km)
1 Nozha – Heliopolis Club 8.1 2 Merghany – Girl’s College 3.5 3 Abd Aziz Fahmy – Teacher’s College 4.1 5 Almaza – Girl’s College 3.6 6 Almaza – Matareya Sq. 6.7
Total 26.0 Source: JICA Study Team
Source: JICA Study Team and CTA
Figure 4.1.2 Reorganization of HM and CTA Tram Lines

CREATS: Phase II Final Report, Vol. III: CTA Transport Improvement Project in East Sector of Cairo Chapter 4: NETWORK OPTIMIZATION AND INTEGRATION IN THE EAST SECTOR
4 - 4
Table 4.1.2 Reorganized CTA Tram Lines
Line Line Name (origin / destination) Length (km)
34 Sheraton – Girl's College 6.8 35 Matareya – Girl's College 4.5 36 Matareya – Girl's College 5.7 36' Matareya Station - Girl's College 5.2 5 Esmailia Square – Esko 10.2
12 Girl's College – Alf Maskan 5.3 32 Girl's College – Sheraton 7.6 33 Girl's College – Alf Maskan 4.3
Total 49.6 Source: JICA Study Team
4.1.3 Service Considerations
(1) Rehabilitation of the Lines
A low service level and extensive ineffectual common sections of lines characterize the current network. Rehabilitation of the lines, notably the segregated tracks, is therefore recommended in order to improve the service at a low cost, and also to harmonize as much as possible the service with that of the Supertram. This does however not involve a fare integration due to the too important remaining gap between the two systems.
In the frame of a tramway network reorganization, the Study Team recommends a rehabilitation of the tramway tracks as well as effectively establishing priority at crossings during operations. As a result, the tramway will offer higher commercial speeds, reach a higher level of availability and increase its ridership.
The headways of the lines should be low enough to serve a maximum number of passengers and to ensure the regularity of the system so that a timetable is unnecessary. As with the MRT, people should know that a tramway is always available within short time. In this regard, the headway should not exceed 10 to 15 minutes during the day.
Three levels of improvements are foreseen:
• Rolling stock: trains are aged and have had little effective maintenance. Upgrading of the existing fleet should proceed in line with earlier CTA plans as part of the initial proposal for services to New Cairo. These figures contain a unit cost for rehabilitation of 3 million LE per train. Approximately 20 trains would be needed to operate the new service, plus two spares, for a total cost of 66 million LE.

CREATS: Phase II Final Report, Vol. III: CTA Transport Improvement Project in East Sector of Cairo Chapter 4: NETWORK OPTIMIZATION AND INTEGRATION IN THE EAST SECTOR
4 - 5
• Track shaping. The trackbed has also not been maintained properly, with the result being an often misshaped alignment which hinders the achievement of effective speed. A unit cost of 300,000 LE per kilometer is programmed for 22 kilometers of system. The total cost would be 6.67 million LE.
• Finally, a lump sum of 12 million LE has been assumed for miscellaneous functions to include rehabilitation of stops, signage, signals and similar.
(2) Interchanges with the Supertram
The main interchange point between supertram and remaining elements of the Heliopolis Metro is the Girl’s College intermodal station. This is shown in Figure 4.1.2 above, and presented in Section 4.5. In order to optimize this interchange, the design at Girl’s College station includes a common platform offering maximum convenience for passengers wishing to interchange between the supertram and the remaining tram lines whose terminus is Girl’s College station.
Two additional interchange stations are noted: Teacher’s College and Heliopolis Club. However, compared to Girl’s College station, activities will be considerably less since only one line is linked to each of those two stations (refer Figure 4.1.2). In concept, the same treatment as at Girl’s College station should be applied at these locations; that is, the termination of the feeder line at a joint platform with the supertram station. An example for Teacher’s College is shown in Figure 4.1.3.
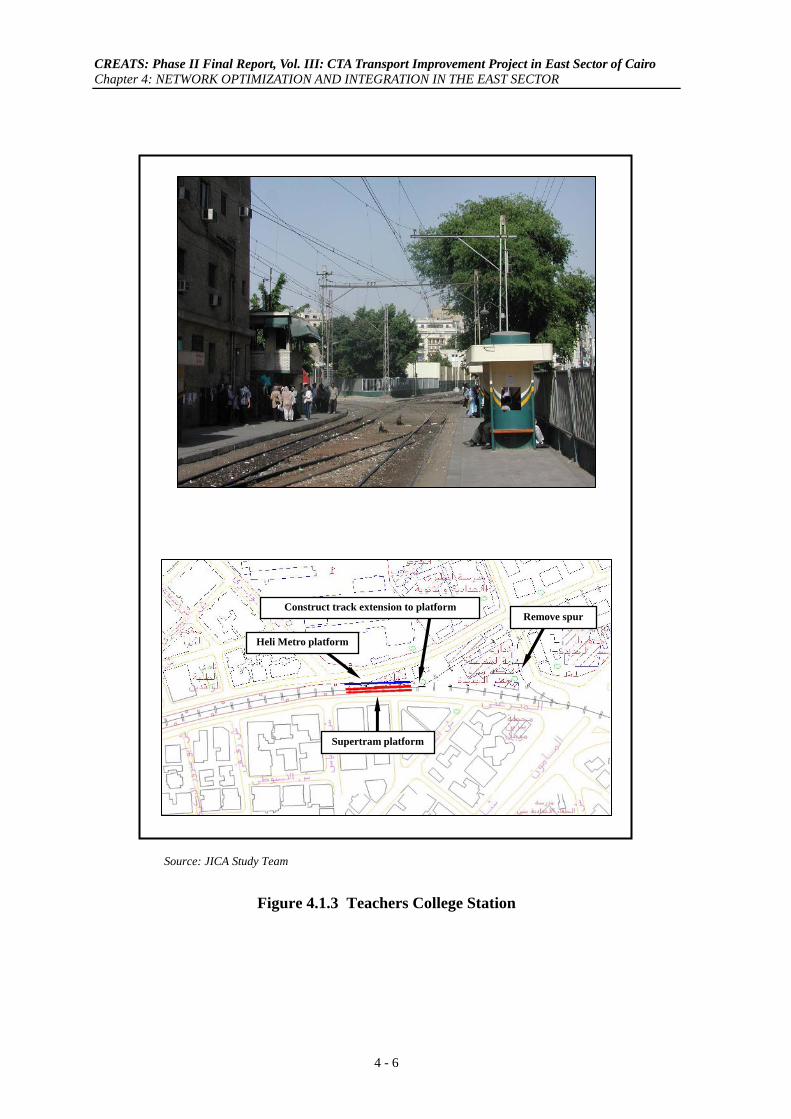
CREATS: Phase II Final Report, Vol. III: CTA Transport Improvement Project in East Sector of Cairo Chapter 4: NETWORK OPTIMIZATION AND INTEGRATION IN THE EAST SECTOR
4 - 6
Source: JICA Study Team
Figure 4.1.3 Teachers College Station
Remove spur
Supertram platform
Heli Metro platform
Construct track extension to platform
CREATS: Phase II Final Report, Vol. III: CTA Transport Improvement Project in East Sector of Cairo Chapter 4: NETWORK OPTIMIZATION AND INTEGRATION IN THE EAST SECTOR
4 - 7
4.2 SHARED TAXI AND TRANSPORT COOPERATIVE SERVICES
Shared taxi service is provided by the private sector using microbuses with a typical capacity of 11 or 14 seats; however, this mandate has recently been expanded by Giza Governorate and services are being provided using private-sector minibuses of some 20 to 30 seats capacity. The minibus fleet is, as in case of shared taxis, licensed by the Governorate, however, ownership is in the form of passenger transport cooperatives consisting of several owners/operators. This is a major departure from the shared taxi fleet whose vehicles are predominately owned by individuals. Unfortunately, official data for shared taxi and cooperative minibus services are fragmented and, at times, uncertain. Information relating to patronage is, by and large, lacking. Even shared taxi route structure is a matter of conjecture. It is the understanding of the Study Team that, while lines are licensed on an origin-destination basis (between defined shared taxi terminals), intermediate routings are not controlled; in fact, some operators, it is understood, choose not to utilize their licensed terminals due to traffic congestion or other reasons. CREATS technical surveys therefore proved to be the only consistent source of data for informal sector modes.
The interested reader is urged to consult Chapter 7, Volume I of Progress Report (2)1 in which public transport systems are quantified to a considerable level detail. Only a brief summary is, for purposes of the current discussion, presented in the following section.
4.2.1 Supply Structure
(1) Shared Taxi Services
Based on information received from the CTA, Giza Governorate and Qalyobeya Governorate, near 20,000 shared taxis are licensed, including some 237 routes as well as over 8,000 microbuses in Cairo Governorate (Table 4.2.1). In case of Qalyobeya Governorate, routes outside of the CREATS Study Area are included; examination of the full Governorate system, and discussions with Governorate representatives, confirms that the majority of the Governorate shared taxi route structure indeed serves areas outside of the CREATS Study Area. Thus, realistically speaking, some 350 shared taxi routes may be considered as being licensed and located within the study area.
The licensing information identifies 173 terminals (route termini); in fact, field investigations reveal that some 24 terminals operate as intermediate stops along
1 Progress Report (2) - Transportation Master Plan and Feasibility Study of Urban Transport Projects in
Greater Cairo Region in the Arab Republic of Egypt, Volume I (Current Urban Transport Status) and Volume II (Results of Transport and Traffic Surveys), op. cit.

CREATS: Phase II Final Report, Vol. III: CTA Transport Improvement Project in East Sector of Cairo Chapter 4: NETWORK OPTIMIZATION AND INTEGRATION IN THE EAST SECTOR
4 - 8
some routes. Thus, within the study area, a total of 149 shared taxi terminals are identified: 84, 55 and eleven in Cairo, Giza and Qalyobeya Governorates, respectively. Further field reviews established that, at the Cairo and Giza Governorates terminals, 536 routes operate instead of the licensed 312. However, some routes do not operate full time; thus, the apparent full time structure consists of 503 routes.
Table 4.2.1 Year 2001 Registered Fleet Size: Shared Taxi Services
Governorate Vehicles(1) Routes
Cairo(2) 8,078 237
Giza(3) 5,000 75
Qalyobeya(4) 6,325 158
Total 19,403 470 Note: (1) Vehicles are predominately 11or 14 seat microbuses, although in case of Qalyobeya Governorate,
about 30 percent of the fleet is indicated as consisting of seven-seat Peugeot sedans. (2) During May, 2001 (3) Understood to be based in Giza City. (4) Total Governorate, including those part outside of the CREATS study area. Sources: CTA, Giza Governorate and Qalyobeya Governorate.
The shared taxi network covers all of Greater Cairo, and in many precincts duplicates, and competes with, formal bus services. There is somewhat of a tendency to concentrate on areas less heavily served by buses and minibuses; in particular, the northeastern corridor beyond Heliopolis as well as Giza, including Pyramid Road (Figure 4.2.1). In terms of day-to-day operations, shared taxis have some advantages over formal bus systems. They change their schedules and deviate from routes in response to consumer demand and congestion (although they may be legally prohibited from doing so). They can negotiate traffic more easily than large buses, and consequently can run more frequently than formal services, although this is typically accomplished at the expense of safe operating practices and in widespread disregard of traffic regulations. Microbuses are more likely to provide guaranteed seats (in crowded vehicles) to their patrons, and are more accessible within a short walking distance than some formal services. Finally, they can provide services in areas where CTA does not or cannot operate. For many Cairenes, informal sector buses are the only practical transport option available. In a broader sense, it is also expected that the informal bus sector provides considerable employment opportunities not only in direct areas such as drivers, but also for service staff, tire dealerships, maintenance establishments, etc.

CREATS: Phase II Final Report, Vol. III: CTA Transport Improvement Project in East Sector of Cairo Chapter 4: NETWORK OPTIMIZATION AND INTEGRATION IN THE EAST SECTOR
4 - 9
Source: JICA Study Team
Figure 4.2.1 Year 2001 Peak Hour Shared Taxi Service Structure
CREATS surveys of shared taxi operations confirm that some 78 percent of riders board at the route origin, a system-wide sample average of 11.9 persons per shared taxi. A further 22 percent of patrons board en-route, leading to a composite usage of 15.1 persons per shared taxi. These findings suggest that shared taxis function, to a large degree, in a line-haul fashion, that is, transport persons between route origin and destination. A further finding of the shared taxi on-board surveys was that route length, in terms of time, varied across a wide spectrum with a mathematical average of 24.1 minutes (running plus stopping time) per one-way journey (Figure 4.2.2). It may therefore be surmised that the typical shared taxi trip is relatively short, and focused upon a specific origin and destination. In some urban sub-areas, shared taxi services have evolved as a de-facto feeder operation for higher-order systems. For example, CREATS surveys established that while walk serves as the dominant access mode for all systems (for roughly 60-70 percent of passengers), shared taxis have evolved as the second most popular access mode, and, by far, the principal motorized access mode. About 29 percent of metro users, 19 percent of bus users and 25 percent of ENR suburban rail users travel on a shared taxi prior to boarding their primary mode.
2,000 PCU2,000 PCU
2,000 Two-way PCU per Hour

CREATS: Phase II Final Report, Vol. III: CTA Transport Improvement Project in East Sector of Cairo Chapter 4: NETWORK OPTIMIZATION AND INTEGRATION IN THE EAST SECTOR
4 - 10
0
10
20
30
40
50
60
70
80
90
100
10 15 20 25 30 35 40 45 50 55 60 >60Trip Running Plus Stopped Time (Minutes)
Cum
ulat
ive
Perc
en
Data source: JICA Study Team. Based on monitoring of 2,428 journeys.
Mathematical Average of Composite One-way Route Traverse = 24.1 Minutes
Figure 4.2.2 Monitored Shared Taxi One-Way Route Time Representative Year 2001 Conditions
Public transport services within the study area carried a total of 12.436 million daily trips2 during a typical 2001 weekday. This represents 68 percent of all motorized trips generated within the CREATS study area. Shared taxis (microbuses) carry some 6.5 million daily passengers, or roughly one-half of daily motorized public transport trips. Public buses (CTA/GCBC bus/minibus) account for a further 3.5 million daily trips, and the metro slightly over two million trips per day. The contribution of other modes is, relative to the “big three”, modest aggregating to about 0.4 million trips per day.
(2) Transport Cooperatives Minibus Services
The main differences between this service and shared taxis are, as the name implies, twofold: firstly, the service is provided via a transport cooperative of vehicle owners rather than individual owners, and secondly, minibuses rather than microbuses are used. Seven cooperatives exist in Giza Governorate; these include 357 members and command a total fleet of 656 minibuses (maximum capacity of 30 persons). About 13 lines are allocated to the cooperatives, all of which traverse long routes. Seven of the lines link 6th October City with different locations in Giza. Cooperative minibus services do not use terminals, but roadside stops. Field
2 This total refers to unlinked trips, which include all journey elements (generally by different modes) made as
part of a single trip linking origin with destination. In terms of public transport usage, unlinked trips may be equated with fare payments. Thus, a single linked trip from home to work could, for example, include four unlinked trips and two public transport fare payments (walk, bus, metro, walk).

CREATS: Phase II Final Report, Vol. III: CTA Transport Improvement Project in East Sector of Cairo Chapter 4: NETWORK OPTIMIZATION AND INTEGRATION IN THE EAST SECTOR
4 - 11
observations suggest that, as in the case of shared taxis, a marked tendency to deviate from licensed routes exists.
CREATS survey findings suggest that some 62 percent of riders board at the route origin, a system-wide sample average of 22.8 persons per bus (compared to an average capacity of 28.5 seats per bus). A further 38 percent of patrons board en-route, leading to a composite usage of 36.7 persons per bus. This suggests that cooperative minibuses function, to a degree, in a line-haul fashion, that is, transport persons between route origin and destination; however, in a less pronounced manner than shared taxi operations.
Modal ridership estimates received from the HIS confirm that cooperative minibuses accommodate some 126 thousand unlinked trips per day, that is, fare payments. The volume of activity is therefore minor when compared to the 6.5 million shared taxi trips.
(3) Fare Policies
No statistics are known to exist regarding informal sector financial performance. The fare schedule for shared taxi services is difficult to quantify with certainty as a number of variables are involved, among them driver preference, service location and route length. Further, it is understood that some operators “turn back” along their route prior to reaching the designated destination, thus forcing passengers to utilize another shared taxi (and pay another fare) to complete the journey. Nevertheless, near 1,700 fare payments were monitored as part of CREATS surveys to obtain an overview of fare structure (all fares on shared taxi services are on a single-payment cash basis; no passes or discounted tickets exist). Findings suggest that a similar range to that of formal services is observed, with monitored values ranging from 10 to 250 Piasters. The 80th percentile of fare payments lies near 80 Piasters, and the mathematical average is 56 Piasters . This is higher than the formal sector bus fare yields which were estimated at 31, 40 and 46 Piasters for CTA bus, GCBC bus and CTA minibus services, respectively.
4.2.2 Towards a Strategic Service Orientation
Developing an intermodal public transport system reliant upon a public and private sector partnership requires the efficient integration and interconnection of the different public transport elements. Real intermodal public transport can only be approached with a rational vision whose foundation lies upon an assessment of the capabilities of the different public transport modes and their interconnectivity with each other. This interconnectivity relates on the one hand to the (important) role of terminals and on the other hand to a hierarchy of public transport systems.
Under such an approach, one may argue that fixed-route and high capacity systems should, on one hand, be given priority in the scheme, while other more flexible public transport systems should be superimposed to create an integrated network. Conversely, low capacity but highly demand-responsive and flexible systems such

CREATS: Phase II Final Report, Vol. III: CTA Transport Improvement Project in East Sector of Cairo Chapter 4: NETWORK OPTIMIZATION AND INTEGRATION IN THE EAST SECTOR
4 - 12
as shared taxis could be considered end-line service providers and should not necessarily be constrained by a fixed route network. But the radius of operations should be geographically limited to a well defined sector, therewith avoiding long-haul travel or predatory practices by this mode. An important element is the allocation of public transport resources into an integrated, intermodal system within which service duplication is largely avoided. This means that whenever possible, the service of an area by more than one main public transport system is only acceptable when this is based upon a capacity need. The principle is demonstrated in Figure 4.2.3.
Source: JICA Study Team
Figure 4.2.3 Potential Integrated Service Model
• Rail mass rapid transit is allocated to those corridors of highest demand, as appropriate to the capabilities of this important mode. Typically, allocation would be within radial corridors linking a high density core (such as central Cairo) with more outlying business districts or suburban centers. Some bus services could also be provided in the rail corridors, however, not in an unbridled, competitive manner. For example, some paralleling bus services are desirable for local convenience as rail stations tend to be spaced further apart than bus stops. Also, should the rail system approach capacity, then there exists a valid argument for providing more intense bus services.
• Light rail or tram would be provided in strong feeder (to rail mass rapid transit) corridors, or between suburban sub-centers. The initial focus for improved services in such corridors would be the Supertram Line 1, linking Ramses Stations with Heliopolis, Madinet Nasr and vicinity of New Cairo.
HighDensity
Core
SatelliteCity
SuburbanCore
Rail mass rapid transitin corridors of
heaviest demand
Light rail transit instrong feeder or
suburban corridors
Suburban railin long distance
corridors
Bus andpriority bus in
radial corridors
Bus and priority busin circumferential
corridors
Paratransit arealicensing with flexible
route structure
Majorintermodal
terminal

CREATS: Phase II Final Report, Vol. III: CTA Transport Improvement Project in East Sector of Cairo Chapter 4: NETWORK OPTIMIZATION AND INTEGRATION IN THE EAST SECTOR
4 - 13
• The formal bus service structure would be redeployed to predominately operate in major corridors, either radial or circumferential, in which higher-order rail systems do not exist. Bus priority treatments, such as bus lanes or busways, could likely be implemented in some corridors or along some critical corridor segments, most likely those where future upgrading to higher-capacity rail modes is likely3. Thus, the structure, fleet and intent of formal bus services would be refocused to providing a premium, high-quality service involving both local and express runs within the major corridors. Some services, as discussed in the previous section, could of course be re-oriented along such corridors to provide direct interphase with higher-order systems such as Supertram Line 1.
• In case of shared taxis, a series of areas would be designated in which this mode enjoys considerable freedom, as discussed in the next section.
• Transport Cooperatives, which provide informal sector bus services using minibuses, at present carry modest numbers of passengers compared to the dominant shared taxi mode. Services are based only in Giza Governorate, with one focus being 6th of October City. In principle and intent, the service provided is similar to that of the shared taxis, with exception of vehicle size and type of management (cooperative versus the dominant single-ownership of the shared taxis). Thus, the allocation of this mode could either follow an area license basis or a route license basis. In fact, the management set-up of the cooperatives can offer valuable guidance regarding the suggested formation of operator associations within the license areas.
• Service to more outlying activity concentrations (such as satellite cities in the CREATS study area) implies a need for higher speed (due to considerable distances involved) and stops at few intermediate locations. The West Wing and East Wing public transport systems feasibility studies, being conducted as part of Program A, focus directly on these issues.
Intermodal terminals play an important, if not critical role, in the efficiency of the system and determine for a large part the level of direct and indirect impact on the total traffic system. The quality of intermodal public transport is therefore determined by the efficiency of the terminals that link the different systems. This efficiency is the results of, on the one hand, available connections and, on the other hand, the quality of the terminals.
3 Further detail regarding bus priority concepts is contained in Technical Report (3): Urban Public Transport
Perspectives; Transportation Master Plan and Feasibility Study of Urban Transport Projects in Greater Cairo Region in the Arab Republic of Egypt, prepared for the Japan International Cooperation Agency and the Higher Committee for Greater Cairo Transportation Planning, by Pacific Consultants International, et. al., May, 2002.

CREATS: Phase II Final Report, Vol. III: CTA Transport Improvement Project in East Sector of Cairo Chapter 4: NETWORK OPTIMIZATION AND INTEGRATION IN THE EAST SECTOR
4 - 14
4.2.3 Implementation Approach
Recent Cairo history confirms that the performance of the private and public bus sectors has diverged. Public services have, by and large, seen an erosion of their patronage base for reasons discussed elsewhere. Private operators, in particular shared taxis, have, on the other hand, experienced an unprecedented boom in patronage. Subsidy needs of the formal sector continue to increase. It has been voiced to the Study Team in a number of instances that public operations should be immediately privatized, hence removed from public coffers. However, it is unlikely that such a radical formula will meet with success due to any number of practical and political constraints. However, a more preferred approach is to design a system that combines the relative strengths of public transport service by both the public and private sectors. There is no reason why public and private sector companies should not co-exist and compete on equal terms in a liberalized market. Indeed, the proposed approach presents a step-wise strategy for a transition approach along the path to privatization (Figure 4.2.4). This topic is discussed further in Chapter 5 of the current report, Organizational and Institutional Reform of the CTA.
• The ultimate goal is to provide the best service at the least cost to government developed around a model where the government’s eventual role is that of strategic planner, coordinator and regulator, and that the private sector is responsible for the actual operation of services under minimal regulation and in a competitive environment. As this goal is not seen as being implementable in the immediate future, a series of steps should be followed which re-shape the current industry into a more effective structure and encourage gradual transition toward the ultimate goal and privatization.
These strategies are being reviewed in detail as part of Component B-2 of Program B, and will be presented in a later section of this report. In terms of the shared taxi
Less Regulation
LessPublicFunds
Public Monopoly
Commercialization
Service Contracting
Line Tendering
Area Franchising
Full Privatization
ImmediateSteps
Figure 4.2.4 The Path to Privatization

CREATS: Phase II Final Report, Vol. III: CTA Transport Improvement Project in East Sector of Cairo Chapter 4: NETWORK OPTIMIZATION AND INTEGRATION IN THE EAST SECTOR
4 - 15
industry, it has been noted in the previous section that an area franchising approach be adopted. This carries several implications.
Given the importance of the shared taxi industry, both as an income generator for the poor and often as a service provider to the poor, simply eliminating it by administrative action should not be the automated response to the perceived problem (as sometimes voiced to the Study Team). Alternatively, CREATS has identified a regulatory and administrative framework within which the potential of the sector can be mobilized and deployed.
The allocation and utilization of shared taxis and cooperative minibuses is a considerable challenge in operational, administrative and political terms. However, modal optimization is not meant to imply a curtailing or elimination of this service (which, in Cairo, carries more than one-half of unlinked public transport trips). Quite to the contrary, the goal is to more effectively harness the considerable potential of this important mode and minimize its most obvious disbenefits. In the first instance, current practices under which shared taxis are licensed to operate governorate-wide on a route basis (which is often ignored), frequently in direct competition with other modes, should be adjusted. A series of areas would be designated in which this mode enjoys considerable freedom to provide demand-responsive area service. One impediment may be the desire of government to guarantee regular scheduled services on routes using a given number of vehicles. This can be overcome by combining area franchising (competitively tendered) with freedom of establishment for (and indeed some encouragement for) area-based operators associations. Considerable freedom would also be given to operators regarding type of vehicle used as long as the fleet complies with established safety, environmental and vehicle inspection guidelines. Smaller vehicles (microbus or smaller) may well be of considerable benefit in serving poorer areas of Cairo where adequate roads are not always available.
Under the proposed scheme, shared taxis and cooperative minibuses would not be permitted to operate outside of their areas (unless, in case of minibuses, some instances of route licensing were adopted), with enforcement possibly enhanced via color-coded license plates. Thus, shared taxis would largely service precincts away from main corridors but within designated areas, and provide feeder services to higher-order modes operating within the main corridors. However, shared taxis would not be permitted to actually operate within the main corridors serviced by higher-order modes, including bus/priority bus (and, in turn, formal bus services would focus to the main corridors). The size and number of designated areas is a matter of negotiation, but using a typical area whose average radius is somewhat larger than the current average trip distance (6.1 km) suggests areas on the order of some 100 to 150 square kilometers, or eight to ten franchise areas within the study area. The Heliopolis/Madinet Nasr complex could well evolve as one area (Figure 4.2.5).
The formation of operators associations should be encouraged within each of the areas. It is likely that operators, many of whom will continue to be one person owning perhaps one or two vehicles, will invariably group together and pool

CREATS: Phase II Final Report, Vol. III: CTA Transport Improvement Project in East Sector of Cairo Chapter 4: NETWORK OPTIMIZATION AND INTEGRATION IN THE EAST SECTOR
4 - 16
knowledge as well as resources via operator organizations, possibly using similar procedures as currently employed by cooperative minibus associations. These could evolve along areal lines within the umbrella of an existing regional jurisdiction (such as the General Syndicate for Land Transport Drivers). In any case, such organizations should be free of governmental interference and control with main objectives being to serve as the collective voice of the industry, ensure the welfare as well interests of its members, and to provide the public with reliable, cost effective as well as safe transport of passengers. Some areas of mutual benefit would include cooperation in terms of:
• Market information exchange;
• Route and line structures;
Source: JICA Study Team Figure 4.2.5 Potential Shared Taxi Area Licensing Structure
• Procurement of vehicles, fuels and spare parts through mutual financing;
• Education and training;
• Managerial rationalization; and,
• Development of terminals and stops.
While the associations should perform essentially free of intrusive governmental control, close working relationships are nevertheless required in several areas:
• The distribution of relevant operator permits in a fair and transparent manner;

CREATS: Phase II Final Report, Vol. III: CTA Transport Improvement Project in East Sector of Cairo Chapter 4: NETWORK OPTIMIZATION AND INTEGRATION IN THE EAST SECTOR
4 - 17
• Operational requirements (vehicle safety, vehicle inspection procedures, emission standards, driver licensing, vehicle licensing); and,
• Enforcement matters.
Further, the government, as the coordinator and supervisor, must ensure that consumers welfare is not compromised. In particular (a) no association should ever be given a complete monopoly status; (b) associations must be open to new members; (c) where an association is the channel through which tenders are won, any penalty for non-performance should be imposed on the association, which should then discipline its non-performing members; and, (d) illegal or criminal activities must not be tolerated.
Many of the defects attributed to the shared taxi industry at present can possibly be traced to its insecurity. Predatory behavior on the road is necessary to make a living. Inadequate capitalization, and the consequent small size and poor quality of the vehicles, may be at least partially attributed to the absence of a sufficiently secure expectation of future revenue (or indeed political non-interference in the industry) to justify commitment of capital to large, non-versatile assets (assuming such capital is actually available). A more preferred path would consequently be to minimize risk, that is, commit little, and preferably even then only in vehicles which have obvious apparent uses and hence good second hand markets. Some additional encouragement may be needed in this area. Firstly, an area franchise, within the security of an operators association, eliminates employment insecurities. However, restricted access to credit will continue to limit the ability of may operators to buy their own vehicles, thus forcing them into a dependence on an absentee owner. Even with the introduction of area franchising, there will be a period until the system is well established during which it may remain difficult to secure funding for vehicles. Assistance with vehicle finance may be a necessary component of the reform project. The ultimate objective, then, should not be to maintain a highly fragmented shared taxi industry for its own sake, but rather to encourage the development of an entrepreneurial culture on which competition can be based.
The Study Team acknowledges that much hesitation will exist to any course of action which implies fairly radical change (perceived or otherwise). It may, therefore, be preferable to undertake the transition to area franchising via a pilot project. Such a pilot project would include setting aside one geographical area and franchising operations within this area under the operating scenario presented. This has several advantages. Firstly, it allows the build up of experience in competitive tendering before this practice is used throughout the metropolitan area. Secondly, it gives a clearer indication of the capabilities of the private sector in terms of providing own vehicle fleet, forming an association and, through the tendering process, an insight into performing cash flow analyses.
Please also refer section 4.6.1 for additional technical discussion.

CREATS: Phase II Final Report, Vol. III: CTA Transport Improvement Project in East Sector of Cairo Chapter 4: NETWORK OPTIMIZATION AND INTEGRATION IN THE EAST SECTOR
4 - 18
4.3 URBAN BUS SERVICES
One of the stated goals of Program B is to optimize Cairo Transport Authority (CTA) bus route services in East Cairo so as to enhance inter-modal operations in the catchment area of Supertram Line 1. That is, address adjustments to those routes most likely to benefit either East Cairo bus or Supertram operations and patronage in terms of providing enhanced services and/or intermodal efficiencies.
4.3.1 Approach and Methodology
The route optimization process is based on a series of logical and cascading steps as illustrated in Figure 4.3.1.
• The initial step involved a review of the metropolitan urban bus system, as quantified during the course of the previous Phase I investigations. The composite route structure, and demand profile, are presented in Sections 4.3.2 and 4.3.3, respectively.
• The subsequent activity was the identification of all CTA and GCBC (Greater Cairo Bus Company) bus routes operating in East Cairo. These services include regular buses, mini buses, air conditioned buses and what CTA terms school buses (but which may be used by both students and non-students). The Study Team experienced considerable challenges in defining year 2003 East Cairo bus activities due to a complete absence of route mapping, and a need to compile up-to-date operating statistics on a route-by-route basis (ridership, average speed, buses in operation, round trips, origin-destination terminal, etc). Numerous technical working sessions with CTA operations staff, and strategic consultative efforts with senior CTA management, were undertaken in this regard and the Study Team hastens to add that only the good working relationship which has been established between the Team and CTA ensured success in this venture. In summary, the Study Team examined 209 routes operating from 44 East Cairo bus terminals,
Figure 4.3.1 Methodology Flowchart
Review ofMetropolitan Bus Services CREATS Phase I Analyses
Identify/Update East CairoBus Network and Services CTA
Code into CREATS GISSystem and Transport Model
Categorize 209 Routes intoFour Generic Alignments
Preliminary CandidateRoutes for Optimization CTA
Ridership, Revenueand Cost Implications
Simulate using CREATSTransport Model
Supertram Line 1 StrategyRecommended Plan
Operational andSocial Considerations
RefineOptimization Concept

CREATS: Phase II Final Report, Vol. III: CTA Transport Improvement Project in East Sector of Cairo Chapter 4: NETWORK OPTIMIZATION AND INTEGRATION IN THE EAST SECTOR
4 - 19
encompassing a service structure of about 1,400 buses, 4,300 route kilometers and 1.1 million ticketed passengers carried per day. East Cairo services are presented in Section 4.3.4.
• The East Cairo bus routes and terminals data were subsequently converted from text description into a GIS format on a route by route basis. This route structure, which reflects year 2003 conditions, was then compared to the bus route structure contained in the CREATS transport model, which reflects year 2001 conditions. As necessary, bus routes in the model were re-coded to reflect year 2003 conditions. Concurrently, of course, the model was also refined to reflect the latest operating strategies for Supertram Line 1 and revised operations for remaining portions of the Heliopolis Metro and CTA Tram. The transport model was executed with the updated public transport systems to define a “year 2003 base condition” in terms of East Cairo public transport ridership, against which impacts of various bus route optimization strategies were tested.
• The East Cairo bus route structure was subdivided into four generic alignment categories to allow more individualized focus upon route optimization within East Cairo and within the Supertram Line 1 catchment area. These four groupings are bus routes which (a) parallel the general alignment of Supertram Line 1, (b) intersect Supertram Line 1, (c) approach Supertram Line 1, and (d) tend to be peripheral relative to Supertram Line 1; that is, principally serve areas not near Supertram Line 1. The catchment area is depicted in Section 4.3.5, while the route categories are presented in Section 4.3.6.
• Following selection of candidate routes based on detailed analysis of each segment of Supertram Line 1, a series of refinement runs using the transport model were executed to evaluate the potential for both enhanced East Cairo services and bus-LRT interchange via adjustments of route structure within the four categories. The Team hastens to add that considerable discussions were held with CTA management in this regard since any proposed change in route structure cannot only be based on textbook theory, but must be viewed through the prism of existing realities while focusing on the provision of bus services at present. As previously noted during numerous presentations and in reports, the Cairo bus route structure is based on a number of quantitative and qualitative considerations including not only ridership, but also fare structure, social obligations and work allocation rules. All these had to be considered in proposing any route structure modification. Thus, any change in route structure was developed in close working consultation between the Study Team and senior management of CTA. The analyses of alternative route strategies is presented in Section 4.3.7.
• The recommended plan is based on an optimized relationship involving both East Cairo services and Supertram Line 1 feeder operations, based on considerations such as ridership, revenue and cost. Recommendations, presented in Section 4.3.8, encompass three strategies: (a) modification, and the overlaying of a premium air conditioned bus service, for some 20 routes which show particular promise in terms of feeding the supertram and/or

CREATS: Phase II Final Report, Vol. III: CTA Transport Improvement Project in East Sector of Cairo Chapter 4: NETWORK OPTIMIZATION AND INTEGRATION IN THE EAST SECTOR
4 - 20
enhancing public bus services in East Cairo; (b) providing a shuttle service within Madinet Nasr; and (c) providing a strategy for feeder bus services linking Ring Road station with New Cairo.
4.3.2 Metropolitan Supply Structure
Public transport services in Cairo may, at present, be categorized as consisting of two generic groupings; namely, formal services and informal services.
• Formal urban public transport services are provided by the public sector. The CTA (Cairo Transport Authority), and its subsidiary GCBC (Greater Cairo Bus Company), provide bus services throughout Greater Cairo using standard-sized buses and mini buses. The CTA also operates light rail services (tram and Heliopolis metro) as well as the water-borne Nile ferries. Other major elements of the formal urban public transport sector include the Cairo Metro Organization (CMO), which provides urban heavy rail services (the Metro) and the Egyptian National Railways (ENR), sponsor of suburban commuter rail services.
• The informal sector consists of route-specific shared taxis operated by private sector individual drivers and/or operators/drivers using microbuses with typical capacities of eleven or fourteen seats. This mandate has been expanded and some services are also being provided via private-sector Transport Cooperatives using minibuses of up to 30 seats, although the scale of these services remains modest vis-à-vis the shared taxi industry. These services have been discussed in the previous Section 4.2.
The interested reader is urged to consult Chapter 7, Volume I of Progress Report (2)1 in which public transport systems are quantified to a considerable level of detail. To provide completeness to the current discussion, a brief summary of the metropolitan supply structure and demand is presented.
(1) CTA and GCBC Bus Services
The April, 2001 CTA bus commercial network consisted of 321 lines which offered service throughout the metropolitan region2 (Figure 4.3.2). The GCBC bus commercial network consisted of 106 lines which, like CTA bus, provided metropolitan-wide services (Figure 4.3.3).
In general, three types of lines can be identified: (a) radial lines which provide direct connection between the suburban areas and the Cairo central area; (b)
1 Progress Report (2) - Transportation Master Plan and Feasibility Study of Urban Transport Projects in
Greater Cairo Region in the Arab Republic of Egypt, Volume I (Current Urban Transport Status) and Volume II (Results of Transport and Traffic Surveys), prepared for the Japan International Cooperation Agency and the Higher Committee for Greater Cairo Transportation Planning, by Pacific Consultants International, et. al., May, 2002
2 Data source: the CTA.

CREATS: Phase II Final Report, Vol. III: CTA Transport Improvement Project in East Sector of Cairo Chapter 4: NETWORK OPTIMIZATION AND INTEGRATION IN THE EAST SECTOR
4 - 21
peripheral and circumferential lines (connection between suburban areas); and, (c) local lines (within suburban areas or subcenters).
Source: JICA Study Team
Figure 4.3.2 Year 2001 Peak Hour Route Structure: CTA Bus Services
Source: JICA Study Team
Figure 4.3.3 Year 2001 Peak Hour Route Structure: GCBC Bus Services
500 PCU500 PCU
500 Two-way PCU per Hour
500 PCU500 PCU
500 Two-way PCU per Hour

CREATS: Phase II Final Report, Vol. III: CTA Transport Improvement Project in East Sector of Cairo Chapter 4: NETWORK OPTIMIZATION AND INTEGRATION IN THE EAST SECTOR
4 - 22
The network is mainly radial; the majority of bus lines pass through the Cairo central area. Therefore, in the center where the network is densest, good accessibility and service frequency are provided to passengers. In outlying areas, however, network accessibility is diminished, even if the composite service area covers most residential precincts.
All buses operate in mixed traffic. There are no bus priority treatments, either in the form of road facilities or, for example, bus signal priorities.
The average line length for CTA bus services was 17 kilometers, with an average of 5.5 assigned operating buses. The average commercial speed was 17.6 kilometers, although considerable variation can be expected; for example, commercial speed in the central areas can be expected to be less than 10 km/hr, while higher speeds are likely along more outlying arterials. On average, each line had 26 stops per direction, which suggests approximately one stop every 650 meters for the composite system. Base ticket prices typically ranged from 25 Piasters to two LE (premium air con service). Peak hour system headway, that is, the average time between buses on a given route, ranged from 7.8 minutes to 85 minutes, with a line average of some 25 minutes. The CTA sold some 1.82 million single-journey tickets per day on its full-sized bus services (Table 4.3.1).
The average line length for GCBC bus services was 25.3 kilometers (about 50 percent longer than the average CTA bus line), with an average of 5.8 assigned operating buses. The average commercial speed was 20.8 kilometers. On average, each line had 36 stops per direction, which suggests approximately one stop every 700 meters for the composite system, slightly higher than the 650 meter CTA bus average. Ticket prices ranged from 10 piasters to 2 LE (premium air con service). Peak hour system headway ranged from five minutes to 180 minutes, with a line average of some 34 minutes. The GCBC sold some 528,000 single-journey tickets per day in April, 2001 (Table 4.3.2).
(2) CTA Mini Bus Services
Minibuses were placed into operation during the mid-1980’s in order to provide a more comfortable mode of transport and to introduce a more competitive services vis-à-vis shared taxis. At inception, minibuses were seen as a premium service with guaranteed seats. While initially seen as being very effective, minibuses have, in a sense, become a victim of their own success. Growing demand has exceeded supply, with the result that, at present, minibuses, like buses, must accommodate significant numbers of both standing and seated patrons. The April, 2001 commercial network consisted of 75 bus lines offering 723 operational minibuses. Services are somewhat oriented along a northeast-southwest axis linking central Cairo with Heliopolis, Madinet Nasr, Imbaba and Giza. Minibuses and buses compete along some major arterials (Figure 4.3.4). All buses operate in mixed traffic. There are no bus priority treatments, either in the form of road facilities or, for example, bus signal priorities.

CREATS: Phase II Final Report, Vol. III: CTA Transport Improvement Project in East Sector of Cairo Chapter 4: NETWORK OPTIMIZATION AND INTEGRATION IN THE EAST SECTOR
4 - 23
Table 4.3.1 Performance Indicators for CTA Bus Services
Average Daily Conditions for Lines Active During April, 2001
Item Line Operation Total
Name Units Minimum Maximum Average(1) System
Lines Number * * * 321
Line Length Kilometers 3.5 39.1 17.0 5,472
Operating Buses Number 2 22 5.5 1,754
Peak Headway Minutes 7.8 85.0 25.0 *
Commercial Speed Km/hr 9.7 34.9 17.6 *
Bus Stops(2) Number 5 60 26 *
Base Fare Piasters 25 250 * *
Ticketed Passengers Number 539 25,419 5,660 1,817,009(1) Mathematical average on line basis. (2) In one direction Note: * indicates not available or not applicable for that particular data item. Source: CTA
Table 4.3.2 Performance Indicators for GCBC Bus Services Average Daily Conditions for Lines Active During April, 2001
Item Line Operation Total
Name Units Minimum Maximum Average(1) System
Lines Number * * * 106
Line Length Kilometers 2.5 60.0 25.3 2,687
Operating Buses Number 1 15 5.8 615
Peak Headway Minutes 5.0 180.0 33.9 *
Commercial Speed Km/hr 12.0 39.5 20.8 *
Bus Stops(2) Number 10 70 36 *
Base Fare Piasters 10 250 * *
Ticketed Passengers Number 443 33,674 4,977 527,561 (1) Mathematical average on line basis. (2) In one direction
Note: * indicates not available or not applicable for that particular data item. Source: CTA

CREATS: Phase II Final Report, Vol. III: CTA Transport Improvement Project in East Sector of Cairo Chapter 4: NETWORK OPTIMIZATION AND INTEGRATION IN THE EAST SECTOR
4 - 24
Source: JICA Study Team Figure 4.3.4 Year 2001 Peak Hour Route Structure: CTA Minibus Services
The average line length for CTA minibus services was 13.5 kilometers, with an average of 9.6 assigned operating buses. The average commercial speed was 15.2 kilometers. On average, each line had 37 stops per direction, which suggests approximately one stop every 370 meters for the composite system. Ticket prices ranged from 25 piasters to one LE. Peak hour system headway, that is, the average time between buses on a given route, ranged from 4.3 minutes to 72 minutes, with a line average of some 15.5 minutes. Thus, in general, minibuses offer more frequent service than buses, but at a lower commercial speed. This is probably due to the fact that minibuses operate in dense areas where traffic congestion is more pronounced. CTA minibus line utilization ranged from a low of 116 ticketed passengers per average day to 20,361 ticketed passengers per day. The system-wide line average was 4,996 ticketed passengers per line, or a total of approximately 375,000 single-journey tickets sold per day in April, 2001 (Table 4.3.3).
500 PCU500 PCU
500 Two-way PCU per Hour

CREATS: Phase II Final Report, Vol. III: CTA Transport Improvement Project in East Sector of Cairo Chapter 4: NETWORK OPTIMIZATION AND INTEGRATION IN THE EAST SECTOR
4 - 25
Table 4.3.3 Performance Indicators for CTA Minibus Services Average Daily Conditions for Lines Active During April, 2001
Item Line Operation Total
Name Units Minimum Maximum Average(1) System
Lines Number * * * 75
Line Length Kilometers 3.5 31.5 13.5 1,016
Operating Buses Number 2 27 9.6 723
Peak Headway Minutes 4.3 72.0 15.5 *
Commercial Speed Km/hr 8.9 21.4 15.2 *
Bus Stops(2) Number 14 58 37 *
Base Fare Piasters 25 100 * *
Ticketed Passengers Number 116 20,361 4,996 374,668 (1) Mathematical average on line basis. (2) In one direction
Note: * indicates not available or not applicable for that particular data item. Source: CTA
(3) Fare Policies
Fares are subject to absolute regulation; fares are not simply regulated, they are frozen. In order to increase revenue, the formal bus operator must establish new services under a separate fee. As a result, the actual service offered is a complex overlay of parallel routes, differentiated by small changes in service characteristics in order to justify different (higher) fares. There also exist numerous categories of users which may ride CTA buses either free or on a reduced fare basis. These concessional fares are available to veterans, handicapped, police, armed forces, various governmental entities, employees and employee family members, among others. The CTA receives no direct reimbursement for these concessional services and can only indirectly request increased subsidies for the operation as a whole.
In case of CTA bus services, base fares range from 25 to 200 Piasters, with 25 Piasters being the dominant fare (on 85.0 percent of lines which are serviced by 80.3 percent of operational buses and carry 84.4 percent of ticketed passengers). On 4.8 percent of the 25 Piaster lines, an extended fare of 50 Piasters may be charged (Table 4.3.4).
GCBC bus services base fares range from 10 Piasters to 200 Piasters and, as is the case with CTA buses, the 25 Piaster fare is dominant (on some three fourths of routes). However, a major difference is that on more than half of those routes an extended fare of 50 or 75 Piasters may be levied. Likewise, on 20 percent of the 50 Piaster routes, an extended fare of 75 or 100 Piasters may be levied (Table 4.3.5).

CREATS: Phase II Final Report, Vol. III: CTA Transport Improvement Project in East Sector of Cairo Chapter 4: NETWORK OPTIMIZATION AND INTEGRATION IN THE EAST SECTOR
4 - 26
Table 4.3.4 Fare Profile for CTA Bus Services
Base Fare Extended Fare
Amount Percent Applicability Relative to Amount On Percent
(Piasters) Lines Buses Passengers (Piasters) Of Routes
25 85.0 80.3 84.4 50 4.8
30 0.6 0.9 1.0 * 0.0
50 12.5 15.9 13.5 * 0.0
200 1.8 2.9 1.1 * 0.0
Total 100.0 100.0 100.0 Data source: Derived from April, 2001 route statistics made available by CTA. Note: * indicates not available or not applicable for that particular data item.
Table 4.3.5 Fare Profile for GCBC Bus Services
Base Fare Extended Fare
Amount Percent Applicability Relative to Amount On Percent
(Piasters) Lines Buses Passengers (Piasters) Of Routes
10 0.9 0.3 0.6 * 0.0
25 76.4 71.2 82.8 50/75 51.9
50 14.2 17.9 13.3 75/100 20.0
75 0.9 0.2 0.2 100 100.0
200 7.5 10.4 3.0 * 0.0
Total 100.0 100.0 100.0 Data source: Derived from April, 2001 route statistics made available by CTA. Note: * indicates not available or not applicable for that particular data item.
CTA minibus fares range from 25 to 100 Piasters, with 50 Piasters being the dominant fare (on 50.6 percent of lines which are serviced by 62.0 percent of operational buses and carry 65.5 percent of ticketed passengers). Extended fares of 30 to 50 Piasters are found on 16 percent of the 25 Piaster routes (Table 4.3.6).
The average yield can be estimated on an order-of-magnitude basis. If one assumes that all ticketed passengers on lines governed only by base fares pay the levied base fare, and that ticketed passengers on lines with extended fares pay the midpoint amount between base and extended fares, then the average yield per ticketed passenger on CTA bus services, GCBC bus services and CTA minibus services is some 31, 40 and 46 Piasters, respectively. This would suggest that CTA bus services, the largest formal road-based public transport service, generates the lowest yield.

CREATS: Phase II Final Report, Vol. III: CTA Transport Improvement Project in East Sector of Cairo Chapter 4: NETWORK OPTIMIZATION AND INTEGRATION IN THE EAST SECTOR
4 - 27
Table 4.3.6 Fare Profile for CTA Minibus Services
Base Fare Extended Fare
Amount Percent Applicability Relative to Amount On Percent
(Piasters) Lines Buses Passengers (Piasters) Of Routes
25 33.3 22.3 25.6 30/50 16.0
30 6.7 4.4 3.4 * 0.0
50 50.6 62.0 65.5 * 0.0
75 2.7 2.4 1.3 * 0.0
100 6.7 9.0 4.2 * 0.0
Total 100.0 100.0 100.0 Data source: Derived from April, 2001 route statistics made available by CTA. Note: * indicates not available or not applicable for that particular data item.
4.3.3 Metropolitan Demand Profile
Public transport services within the study area carried a total of 12.436 million daily trips3 during a typical 2001 weekday. This represents 68 percent of all motorized trips generated within the CREATS study area. Shared taxis (microbuses) carry some 6.5 million daily passengers, or roughly one-half of daily motorized public transport trips. Public buses (CTA/GCBC bus/minibus) account for a further 3.5 million daily trips, and the metro slightly over two million trips per day. The contribution of other modes is, relative to the “big three”, modest aggregating to about 0.4 million trips per day (Figure 4.3.5).
Fluctuation in modal use exists depending on public transport trip orientation; however, the shared taxi mode retains a majority position. For total study area trips (12.44 million), as shown in Figure 4.3.5, some 52 percent of unlinked, internal public transport trips are accomplished using the shared taxi mode. For trips both of whose trip ends lie within the Ring Road (6.34 million), shared taxi use decreases to some 42 percent, while public bus trips increase to 34 percent (vis-à-vis a 25 percent study area wide average). For trips whose trip ends lie either within, or cross, the Ring Road (10.33 million), the shared taxi component totals 48 percent, and in case of trips both of whose trip ends lie outside of the Ring Road (2.11 million), the shared taxi utilization increases to some three-quarters of public transport trips (Figure 4.3.6). Thus, one may surmise that, in the latter case, the use of shared taxis is basically a mode captive situation (except, for example, trips within the Metro Line 1 corridor) as services by other modes are considerably reduced from levels found within the Ring Road. Conversely, depending of course on trip origin-destination patterns and service
3 This total refers to unlinked trips, which include all journey elements (generally by different modes) made
as part of a single trip linking origin with destination. In terms of public transport usage, unlinked trips may be equated with fare payments. Thus, a single linked trip from home to work could, for example, include four unlinked trips and two public transport fare payments (walk, bus, metro, walk).

CREATS: Phase II Final Report, Vol. III: CTA Transport Improvement Project in East Sector of Cairo Chapter 4: NETWORK OPTIMIZATION AND INTEGRATION IN THE EAST SECTOR
4 - 28
structures, it can be argued that shared taxi utilization for trips within the Ring Road, or that cross the Ring Road, include an element of modal preference in that shared taxis may well offer more convenient and frequent service than other modes of public transport.
Suburban Rail0.6 %
0.078 Million Trips/Day
Tram/Heliopolis Metro1.4 %
0.175 Million Trips/Day
Nile Ferry0.1 %
0.011 Million Trips/Day
Public Minibus3.4 %
0.426 Million Trips/Day
Shared Taxi52.3 %
6.501 Million Trips/Day
Metro 16.6 %
2.061 Million Trips/Day
Public Bus24.6 %
3.058 Million Trips/Day
Transport Coops Minibus1.0 %
0.126 Million Trips/Day
Data source: JICA Study Team
Figure 4.3.5 Year 2001 Modal Preferences
Daily Motorized Unlinked Public Transport Trips-CREATS Study Area
0.0
10.0
20.0
30.0
40.0
50.0
60.0
70.0
80.0
Public Bus Shared Taxi Metro OtherMode
Perc
ent o
f Int
erna
l Unl
inke
d Pu
blic
Tra
nspo
rt T
rips Total Study Area
Both Trip Ends Within Ring Road
Trips Within or Crossing Ring Road
Both Trip Ends Outside Ring Road
Data source: JICA Study Team
Figure 4.3.6 Areal Variation in Year 2001 Modal Preferences Daily Motorized Unlinked Public Transport Trips
CREATS: Phase II Final Report, Vol. III: CTA Transport Improvement Project in East Sector of Cairo Chapter 4: NETWORK OPTIMIZATION AND INTEGRATION IN THE EAST SECTOR
4 - 29
A more precise stratification of demand among CTA bus, CTA minibus and GCBC bus may be obtained by examining a 10-year period of operations (Table 4.3.7).
• Network length exhibits highest relative growth increasing from a year 1991 factor of 1.00 to a year 2000 factor of 1.66 by year 2000. This trends highlights one of the operational difficulties faced by the CTA. The original mandate of the organization, which was to provide bus services in Cairo, has gradually been expanded by government to provide services within the metropolitan area of the three Governorates, and most recently to service outlying destinations such as 6th of October City.
• The size of the fleet has only grown some 20 percent over the last decade from some 3,700 to 4,400 buses. Thus, fleet size has not kept pace with network expansion. The CTA, it is understood, only receives sufficient funds each year for approximately 100 new buses. These must be allocated to fleet replacement, intensified service on existing routes, and service on new routes. It is understood that a more realistic fleet replacement need is on the order of 350 buses per year.
• The operational fleet, as a percent of total fleet, has remained fairly steady over the last decade at some 75 percent. Utilization approached 80 percent during the early 1990’s, but by year 2000 had dropped to less than 73 percent. It is understood that one of the underlying reasons is the very heavy workload placed upon the existing fleet to meet established route obligations. A vehicle is typically in operation 18-20 hours per day, with greatly reduced opportunity for maintenance. Hence, more breakdowns and down times are inevitable.
• Ticketed passengers have declined by about 20 percent over year 1991 levels to some 2.75 million per typical day, including 1.83 million for CTA bus, 0.56 million for GCBC bus and 0.36 million for CTA minibus. This decline is attributed to both operational strains placed upon the existing operation, and the emergence of competitive services.
• The ten-year ridership ratio has remained fairly steady among the three services, with near 70 percent of urban bus riders carried by CTA bus, some 21 percent by GCBC bus and ten percent by CTA minibus.
Please also refer to section 4.6.2 for a more comprehensive overview of the study area demand profile.
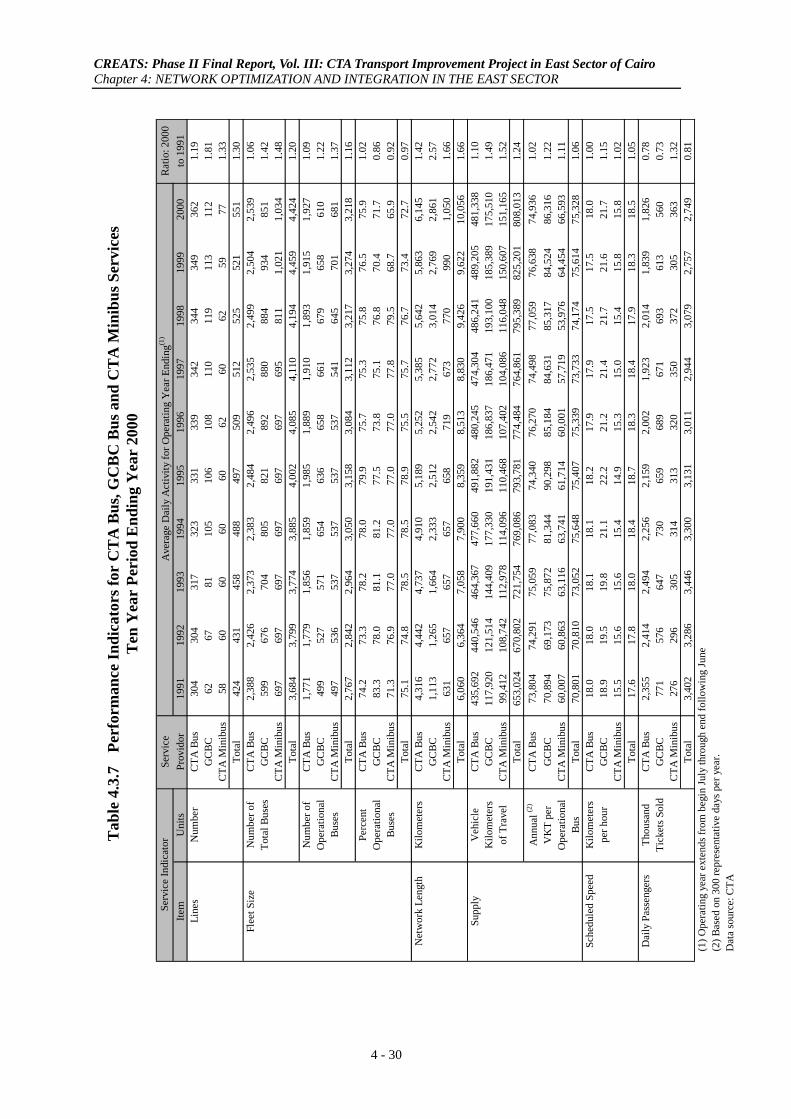
CREATS: Phase II Final Report, Vol. III: CTA Transport Improvement Project in East Sector of Cairo Chapter 4: NETWORK OPTIMIZATION AND INTEGRATION IN THE EAST SECTOR
4 - 30
Serv
ice
Rat
io: 2
000
Item
Uni
tsPr
ovid
or19
9119
9219
9319
9419
9519
9619
9719
9819
9920
00to
199
1Li
nes
Num
ber
CTA
Bus
304
304
317
323
331
339
342
344
349
362
1.19
GC
BC62
6781
105
106
108
110
119
113
112
1.81
CTA
Min
ibus
5860
6060
6062
6062
5977
1.33
Tota
l42
443
145
848
849
750
951
252
552
155
11.
30Fl
eet S
ize
Num
ber o
fC
TA B
us2,
388
2,42
62,
373
2,38
32,
484
2,49
62,
535
2,49
92,
504
2,53
91.
06To
tal B
uses
GC
BC59
967
670
480
582
189
288
088
493
485
11.
42C
TA M
inib
us69
769
769
769
769
769
769
581
11,
021
1,03
41.
48To
tal
3,68
43,
799
3,77
43,
885
4,00
24,
085
4,11
04,
194
4,45
94,
424
1.20
Num
ber o
fC
TA B
us1,
771
1,77
91,
856
1,85
91,
985
1,88
91,
910
1,89
31,
915
1,92
71.
09O
pera
tiona
lG
CBC
499
527
571
654
636
658
661
679
658
610
1.22
Buse
sC
TA M
inib
us49
753
653
753
753
753
754
164
570
168
11.
37To
tal
2,76
72,
842
2,96
43,
050
3,15
83,
084
3,11
23,
217
3,27
43,
218
1.16
Perc
ent
CTA
Bus
74.2
73.3
78.2
78.0
79.9
75.7
75.3
75.8
76.5
75.9
1.02
Ope
ratio
nal
GC
BC83
.378
.081
.181
.277
.573
.875
.176
.870
.471
.70.
86Bu
ses
CTA
Min
ibus
71.3
76.9
77.0
77.0
77.0
77.0
77.8
79.5
68.7
65.9
0.92
Tota
l75
.174
.878
.578
.578
.975
.575
.776
.773
.472
.70.
97N
etw
ork
Leng
thK
ilom
eter
sC
TA B
us4,
316
4,44
24,
737
4,91
05,
189
5,25
25,
385
5,64
25,
863
6,14
51.
42G
CBC
1,11
31,
265
1,66
42,
333
2,51
22,
542
2,77
23,
014
2,76
92,
861
2.57
CTA
Min
ibus
631
657
657
657
658
719
673
770
990
1,05
01.
66To
tal
6,06
06,
364
7,05
87,
900
8,35
98,
513
8,83
09,
426
9,62
210
,056
1.66
Supp
lyV
ehic
leC
TA B
us43
5,69
244
0,54
646
4,36
747
7,66
049
1,88
248
0,24
547
4,30
448
6,24
148
9,20
548
1,33
81.
10K
ilom
eter
sG
CBC
117,
920
121,
514
144,
409
177,
330
191,
431
186,
837
186,
471
193,
100
185,
389
175,
510
1.49
of T
rave
lC
TA M
inib
us99
,412
108,
742
112,
978
114,
096
110,
468
107,
402
104,
086
116,
048
150,
607
151,
165
1.52
Tota
l65
3,02
467
0,80
272
1,75
476
9,08
679
3,78
177
4,48
476
4,86
179
5,38
982
5,20
180
8,01
31.
24A
nnua
l (2)
CTA
Bus
73,8
0474
,291
75,0
5977
,083
74,3
4076
,270
74,4
9877
,059
76,6
3874
,936
1.02
VK
T pe
rG
CBC
70,8
9469
,173
75,8
7281
,344
90,2
9885
,184
84,6
3185
,317
84,5
2486
,316
1.22
Ope
ratio
nal
CTA
Min
ibus
60,0
0760
,863
63,1
1663
,741
61,7
1460
,001
57,7
1953
,976
64,4
5466
,593
1.11
Bus
Tota
l70
,801
70,8
1073
,052
75,6
4875
,407
75,3
3973
,733
74,1
7475
,614
75,3
281.
06Sc
hedu
led
Spee
dK
ilom
eter
sC
TA B
us18
.018
.018
.118
.118
.217
.917
.917
.517
.518
.01.
00pe
r hou
rG
CBC
18.9
19.5
19.8
21.1
22.2
21.2
21.4
21.7
21.6
21.7
1.15
CTA
Min
ibus
15.5
15.6
15.6
15.4
14.9
15.3
15.0
15.4
15.8
15.8
1.02
Tota
l17
.617
.818
.018
.418
.718
.318
.417
.918
.318
.51.
05D
aily
Pas
seng
ers
Thou
sand
CTA
Bus
2,35
52,
414
2,49
42,
256
2,15
92,
002
1,92
32,
014
1,83
91,
826
0.78
Tick
ets S
old
GC
BC77
157
664
773
065
968
967
169
361
356
00.
73C
TA M
inib
us27
629
630
531
431
332
035
037
230
536
31.
32To
tal
3,40
23,
286
3,44
63,
300
3,13
13,
011
2,94
43,
079
2,75
72,
749
0.81
(1
) Ope
ratin
g ye
ar e
xten
ds fr
om b
egin
July
thro
ugh
end
follo
win
g Ju
ne
(2) B
ased
on
300
repr
esen
tativ
e da
ys p
er y
ear.
D
ata
sour
ce: C
TA
Ave
rage
Dai
ly A
ctiv
ity fo
r Ope
ratin
g Y
ear E
ndin
g(1)
Serv
ice
Indi
cato
rTab
le 4
.3.7
Pe
rfor
man
ce In
dica
tors
for
CT
A B
us, G
CB
C B
us a
nd C
TA
Min
ibus
Ser
vice
s T
en Y
ear
Peri
od E
ndin
g Y
ear
2000

CREATS: Phase II Final Report, Vol. III: CTA Transport Improvement Project in East Sector of Cairo Chapter 4: NETWORK OPTIMIZATION AND INTEGRATION IN THE EAST SECTOR
4 - 31
4.3.4 East Cairo Services Profile
With an understanding of the metropolitan system, the subsequent deductive step is to focus on what has been defined as East Cairo. This precinct, which includes the Supertram Line 1 catchment as a sub-area, is a somewhat nebulous description, and encompasses a significant component of the urban bus system. Unfortunately, the clarification of this component proved problematic as very little readily available information exists regarding bus route alignments or inter-terminal service plans. Thus, in close cooperation with the CTA, the Study Team obtained the latest available route statistics (as of April, 2003), terminal locations and point-to-point written descriptions of route alignment. These data were subsequently entered into the CREATS GIS data base thus forming the first up-to-date route map for East Cairo formal bus services.
East Cairo, as defined by the CTA, includes 44 bus terminals (Figure 4.3.7), from which operate 209 bus lines. However, the term “terminal” can be somewhat misleading. Firstly, the route analysis employed by the Study Team corresponds to definitions employed by the bus operators, in which one end is termed the origin terminal (generally, the more outlying route end). Secondly, a terminal may indeed be a major focus of bus routes, but in some cases it is more accurate to describe the point as an end-of-line turnaround. Thus, for presentation purposes, and in keeping with operator practices, route statistics are, in the first instance, arrayed on an origin terminal basis.
The dominant urban bus activity in the East Sector consists of CTA standard-size bus services via 121 routes frequented by three-quarters of a million persons carried on more than 700 buses. Total ridership on East Cairo routes exceeds one million persons per day (Table 4.3.8).
Table 4.3.8 Operator Activity Profile: East Sector Bus Terminals
Average Condition for Lines Active During April, 2003
Urban Bus Activity Indicator by Number of
Operation Lines Route Kilometers
Operating Buses
Daily Passengers
CTA Standard Bus 121 2,404 744 724,420
CTA Minibus 35 605 343 177,937
Student Bus 16 321 52 30,837
Air Conditioned Bus 8 240 90 25,824
GCBC Standard Bus 29 747 160 111,166
Total 209 4,317 1,389 1,070,184 Source: Study Team based on data supplied by the CTA. Statistics apply to total extent of lines, both within and
external to East Cairo. Passengers refer to ticketed passengers.

CREATS: Phase II Final Report, Vol. III: CTA Transport Improvement Project in East Sector of Cairo Chapter 4: NETWORK OPTIMIZATION AND INTEGRATION IN THE EAST SECTOR
4 - 32
Figu
re 4
.3.7
U
rban
Bus
Ter
min
als i
n E
ast C
airo
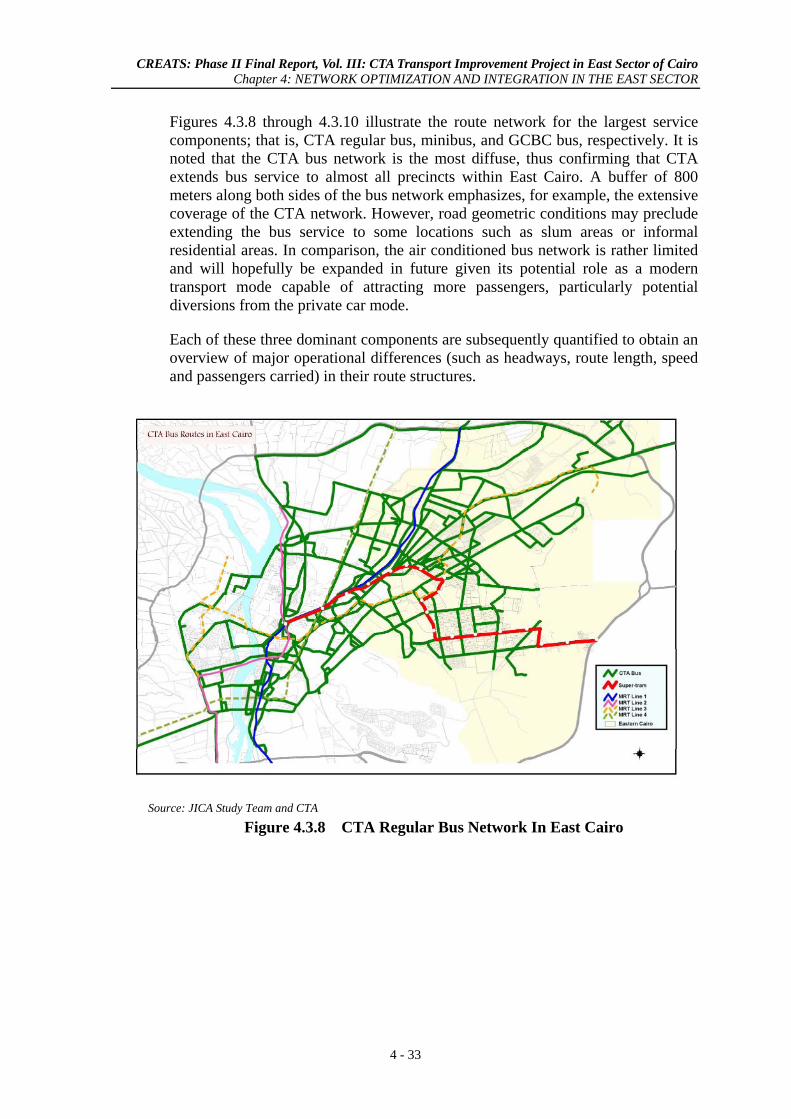
CREATS: Phase II Final Report, Vol. III: CTA Transport Improvement Project in East Sector of Cairo Chapter 4: NETWORK OPTIMIZATION AND INTEGRATION IN THE EAST SECTOR
4 - 33
Figures 4.3.8 through 4.3.10 illustrate the route network for the largest service components; that is, CTA regular bus, minibus, and GCBC bus, respectively. It is noted that the CTA bus network is the most diffuse, thus confirming that CTA extends bus service to almost all precincts within East Cairo. A buffer of 800 meters along both sides of the bus network emphasizes, for example, the extensive coverage of the CTA network. However, road geometric conditions may preclude extending the bus service to some locations such as slum areas or informal residential areas. In comparison, the air conditioned bus network is rather limited and will hopefully be expanded in future given its potential role as a modern transport mode capable of attracting more passengers, particularly potential diversions from the private car mode.
Each of these three dominant components are subsequently quantified to obtain an overview of major operational differences (such as headways, route length, speed and passengers carried) in their route structures.
Source: JICA Study Team and CTA
Figure 4.3.8 CTA Regular Bus Network In East Cairo

CREATS: Phase II Final Report, Vol. III: CTA Transport Improvement Project in East Sector of Cairo Chapter 4: NETWORK OPTIMIZATION AND INTEGRATION IN THE EAST SECTOR
4 - 34
Source: JICA Study Team and CTA
Figure 4.3.9 CTA Minibus Network in East Cairo
Source: JICA Study Team and CTA
Figure 4.3.10 GCBC Regular Bus Network in East Cairo

CREATS: Phase II Final Report, Vol. III: CTA Transport Improvement Project in East Sector of Cairo Chapter 4: NETWORK OPTIMIZATION AND INTEGRATION IN THE EAST SECTOR
4 - 35
The median (50th percentile) peak hour headway lies near 23 minutes for CTA bus, 14 minutes for CTA minibus and 27 minutes for GCBC bus. The 85th percentile for the same operators lies near 36, 21 and 52 minutes, respectively (Figure 4.3.11).
0.0
10.0
20.0
30.0
40.0
50.0
60.0
70.0
80.0
90.0
100.0
2 4 6 8 10 12 14 16 18 20 22 24 26 28 30 32 34 36 38 40 42 44 46 48 50 >50
Peak Hour Headway (Two Minute Ranges Up To Indicated Values)
Cum
ulat
ive
Perc
ent
CTA Bus
CTA Minibus
GCBC Bus
Data source: CTA, April, 2003.
Figure 4.3.11 Scheduled Peak Hour Headway, East Cairo Bus Services Average Condition for Lines Active During April, 2003
The median route length lies near 20 kilometers for CTA bus, 16 kilometers for CTA minibus and 23 kilometers for GCBC bus. The 85th percentile for the same operators lies near 30, 22 and 33 kilometers, respectively (Figure 4.3.12). The median scheduled speed lies near 19 km/hr for CTA bus, 16 km/hr for CTA minibus and 19 km/hr for GCBC bus. The 85th percentile for the same operators lies near 22, 20 and 24 km/hr, respectively (Figure 4.3.13). A final measure is the comparison of average loadings, that is, daily passengers carried per bus. The median carriage lies near 900 persons per bus for CTA bus, 480 persons per bus for CTA minibus and 680 persons per bus for GCBC bus. The 85th percentile for the same operators lies near 1,260, 800 and 1,120 persons per bus, respectively (Figure 4.3.14). In case of CTA bus services, it is noted that loadings include only ticketed passengers; previous CREATS surveys confirm that these carriage totals would likely increase by some 10 to 20 percent when considering total boarding passengers. In case of CTA minibus and GCBC bus, ticketed passenger totals are near total passengers carried as few privileged passenger concessions exist on these two services. CREATS Phase I analyses have already commented that average bus loadings in Cairo, particularly on CTA bus services, have reached intolerable levels, and are high when compared to international norms and expectations.

CREATS: Phase II Final Report, Vol. III: CTA Transport Improvement Project in East Sector of Cairo Chapter 4: NETWORK OPTIMIZATION AND INTEGRATION IN THE EAST SECTOR
4 - 36
0.0
10.0
20.0
30.0
40.0
50.0
60.0
70.0
80.0
90.0
100.0
2 4 6 8 10 12 14 16 18 20 22 24 26 28 30 32 34 36 38 40 >40
Route Length (Two Kilometer Ranges Up To Indicated Values)
Cum
ulat
ive
Perc
ent
CTA Bus
CTA MinibusGCBC Bus
Data source: CTA, April, 2003.
Figure 4.3.12 Route Length, East Cairo Bus Services Average Condition for Lines Active During April, 2003
0.0
10.0
20.0
30.0
40.0
50.0
60.0
70.0
80.0
90.0
100.0
10 11 12 13 14 15 16 17 18 19 20 21 22 23 24 25 26 27 28 29 30 >30
Scheduled Commercial Speed (One Km/hr Ranges Up To Indicated Values)
Cum
ulat
ive
Perc
ent
CTA Bus
CTA Minibus
GCBC Bus
Data source: CTA, April, 2003.
Figure 4.3.13 Scheduled Speed, East Cairo Bus Services Average Condition for Lines Active During April, 2003

CREATS: Phase II Final Report, Vol. III: CTA Transport Improvement Project in East Sector of Cairo Chapter 4: NETWORK OPTIMIZATION AND INTEGRATION IN THE EAST SECTOR
4 - 37
0.0
10.0
20.0
30.0
40.0
50.0
60.0
70.0
80.0
90.0
100.0
100
200
300
400
500
600
700
800
900
1,000
1,100
1,200
1,300
1,400
1,500
>1,500
Average Daily Ticketed Passengers Carried per Bus (100 Person Ranges Up To Indicated Values)
Cum
ulat
ive
Perc
ent
CTA Bus
CTA Minibus
GCBC Bus
Data source: CTA, April, 2003.
Figure 4.3.14 Average Daily Carriage, East Cairo Bus Services Average Condition for Lines Active During April, 2003
The differences can, in general, be summarized as follows:
• CTA minibus services operate more frequently than other formal bus services, with near half the headway of CTA bus and GCBC bus.
• CTA minibus operates the shortest routes, and GCBC bus the longest routes.
• Scheduled operating speed is very similar for all three services, a not surprising result given that all must operate in mixed traffic without the benefit of any priority treatments.
• A typical minibus carries less persons per day than a full-sized bus, a not surprising development. However, loadings are high. Likewise, for full-size buses, daily vehicle carriage is very high, particularly in case of CTA bus.
The allocation of buses to varying lines can be considered as being generally responsive to indicated demand. The allocation curve for GCBC and CTA buses are virtually identical; the allocation curve for CTA minibuses is, as expected, higher given the smaller average vehicle size. For example, given a line demand of some 10,000 ticketed passengers per day implies an allocation of eight to nine standard size buses, or 13-14 minibuses (Figure 4.3.15).

CREATS: Phase II Final Report, Vol. III: CTA Transport Improvement Project in East Sector of Cairo Chapter 4: NETWORK OPTIMIZATION AND INTEGRATION IN THE EAST SECTOR
4 - 38
0
5
10
15
20
25
30
0 2,000 4,000 6,000 8,000 10,000 12,000 14,000 16,000 18,000 20,000 22,000
Average Daily Ticketed Passengers per Line
Ope
ratio
nal B
uses
per
Lin
e
CTA BusGCBC BusCTA MinibusTrendline CTA MinibusTrendline CTA BusTrendline GCBC Bus
Data source: JICA Study Team based on April, 2003 data supplied by CTA
Figure 4.3.15 Line Ridership and Bus Supply Relationship, East Cairo Bus Services Average Condition for Lines Active During April, 2003
On a composite basis for CTA bus, CTA minibus and GCBC bus, all East Sector origin terminals accommodate, as indicated previously, 209 routes on which operate near 1,400 buses carrying 1.1 million ticketed passengers on a typical day (Table 4.3.9). Seven of these terminals are in immediate vicinity of Supertram Line 1 including Zahraa Madinet Nasr (at the proposed eastern terminus of Supertram Line 1) and Hay El Sabea (refer Figure 4.3.7). In terms of pronounced origin activity, these two terminals stand out: Zahraa Madinet Nasr with 22 routes, 148 buses, and 108,700 daily ticketed persons, as well as Hay El Sabea in southern Madinet Nasr with 11 routes, 89 buses, and 75,800 daily ticketed persons. A summation of destination terminals, that is, the opposite route terminus to origin terminal, confirms that, for the East Sector bus terminals noted in Table 4.3.9, three destination terminals stand out in terms of composite activity focus: Ryad, Ataba and Abbaseya (Table 4.3.10).
Table 4.3.10 Activity Profile: East Sector Bus Route Destination Terminals Average Condition for Lines Active During April, 2003
Terminal Name Number of Routes
Assigned Buses
Daily Ticketed
Passengers
Average Passengers per Route
Abdel Moneim Ryad 33 232 151,018 4,576
Ataba 29 192 144,434 4,980
Abbaseya 20 92 72,227 3,611 Data source: CTA for April, 2003

CREATS: Phase II Final Report, Vol. III: CTA Transport Improvement Project in East Sector of Cairo Chapter 4: NETWORK OPTIMIZATION AND INTEGRATION IN THE EAST SECTOR
4 - 39
Table 4.3.9 Activity Profile: East Sector Bus Route Origin Terminals Average Condition for Lines Active During April, 2003
Terminal Number Terminal Name No of
RoutesAssigned
Buses
Daily Ticketed
Passengers
Average Passengers per Route
Number of Bus
Berths(1)
1 Mesala 12 56 60,691 5,058 42 Moasaset El Zakah 5 25 15,272 3,054 --3 Masaken El Matareya 2 8 4,743 2,372 --4 Almaza 6 44 15,429 2,572 25 Roxy 3 41 25,168 8,389 --6 Masaken Ain Shams 10 68 65,110 6,511 47 Zahraa Madinet Nasr 22 148 108,714 4,942 58 Ezbet El Haggana 5 24 18,866 3,773 39 Hay El Aasher 2 14 4,224 2,112 --
10 Masaken El Amireya 8 59 59,414 7,427 311 Ain Shams 1 10 15,510 15,510 --12 Hay El Sabea 11 89 75,781 6,889 --13 Koleyet Banat Ain Shams 2 15 9,345 4,673 --14 Masaken El Toob El Ramly 1 5 3,214 3,214 --15 Masaken Almaza 3 18 17,407 5,802 --16 Wafaa Wal Amal 1 3 1,168 1,168 --17 Haykstep 2 13 9,964 4,982 318 Masaken Osman 3 27 14,484 4,828 --19 Maahad El Khedma El Egtemaeya 1 3 1,811 1,811 --20 Arab El Tawyla 2 18 9,975 4,988 --21 Zahraa Ain Shams 2 18 23,315 11,658 --22 Makhbaz El Aaly 4 21 13,166 3,292 --23 Gabal El Ahmar 1 2 262 262 --24 Nozha El Gadeeda 9 52 35,142 3,905 425 Matareya 4 18 17,701 4,425 --26 Masaken El Helmeya 5 20 20,626 4,125 --27 Madina El Gamieya (Moubarak) 6 23 17,093 2,849 428 Cairo Airport (2) 6 56 37,066 6,178 --29 Nozha (Hegaz) 9 81 56,756 6,306 630 Hay El Thamen 6 36 38,440 6,407 --31 Koleyet El Banat El Eslameya 6 19 10,704 1,784 --32 Cairo Airport (1) 5 57 43,614 8,723 433 Hay El Sades 3 10 8,212 2,737 --34 Madinet El Herafeyeen 1 4 5,480 5,480 --35 Arab El Hesn 1 6 1,199 1,199 --36 Masaken El Shorooq 2 18 16,484 8,242 --37 Marg El Gharbeya (Intercity Termin 2 22 31,380 15,690 338 Madinet El Nahda 3 20 15,607 5,202 --39 Marg El Sharqeya (Intercity Termin 5 26 27,694 5,539 --40 Madinet El Salam (Cairo) 5 36 22,382 4,476 341 Madinet El Salam (Especo) 8 49 25,069 3,134 442 Sooq El Oboor 11 84 61,136 5,558 343 Garage El Mostaqbal 1 5 2,080 2,080 --44 Masaken Sheraton 2 18 3,286 1,643 --
209 1,389 1,070,184 5,120 Data source: CTA, for April 2003 operations. (1) "--" indicates bus berths are not marked.
Total

CREATS: Phase II Final Report, Vol. III: CTA Transport Improvement Project in East Sector of Cairo Chapter 4: NETWORK OPTIMIZATION AND INTEGRATION IN THE EAST SECTOR
4 - 40
4.3.5 Areal Stratification
East Cairo can be viewed at three levels: the entire precinct, the supertram catchment area and the supertram buffer area.
(1) East Cairo, Catchment Area and Buffer Zone
The catchment area, or that portion of East Cairo from which the majority of supertram passengers are likely to be drawn, as well as the buffer zone of 800 meters in each direction from the supertram, are depicted in Figure 4.3.16.4 A distance of 800 meters is widely used as an acceptable walking distance to access an attractive public transport system such as Supertram Line 1. The total area of East Cairo as obtained from the CREATS GIS is around 227 km2. The catchment area and buffer zone represent 73 percent and 16 percent of the East Cairo area, respectively.
A total of 209 bus lines interact with the 227 km2 East Cairo precinct (as defined). The total length of CTA bus routes interacting with the area aggregates to 2,404 kilometers (Figure 4.3.17). Thus, East Cairo services represent a sizable component of the overall urban bus network. The catchment area, as depicted, encompasses 166 km2 and contains 196 bus lines. The total length of regular CTA bus routes interacting with the area aggregates to 2,280 kilometers (Figure 4.3.18).
The supertram buffer zone, or that area extending 800 meters in each direction from the supertram, contains only some 36 km2, yet interacts with 176 bus lines. The total length of CTA bus routes interacting with the area aggregates to 1,165 kilometers (Figure 4.3.19). The importance of Supertram Line 1 is highlighted in that 176 lines out of the total 209 East Cairo bus lines intersect the buffer zone.
(2) CTA Travel Patterns within the Catchment Area
It is of interest to obtain an overview of the travel pattern of CTA passengers within the catchment area. The CREATS home interview survey, which was administered to about 60,000 households, was used to obtain an overview of 2001 trip making patterns between major subsectors of the catchment area (labeled A through F). The pictorial representation (Figure 4.3.20) confirms that:
• The catchment area accounts for almost one million daily passengers being transported by CTA modes.
• There are pronounced passenger movements intersecting with Supertram Line 1 [e.g., C-E (6 percent of total passenger movement within the catchment area), D-E (four percent) and D-F (4 percent)]. This movement pattern implies that CTA passengers are being transported by a considerable number of bus lines,
4 It is noted that East Cairo, as depicted in Sections 4.3.4 through 4.3.6 illustrations, conforms to the
boundaries of the Eastern Sector of CTA services. This depiction is for illustrative purposes only and used to enhance identification of Eastern Sector bus lines. All optimization analyses and decision-making processes extend beyond Eastern Cairo, as defined by the CTA, to include, for example, New Cairo.

CREATS: Phase II Final Report, Vol. III: CTA Transport Improvement Project in East Sector of Cairo Chapter 4: NETWORK OPTIMIZATION AND INTEGRATION IN THE EAST SECTOR
4 - 41
Figure 4.3.16 East Cairo, Catchment Area and Buffer Zone
Figure 4.3.17 Overview of Bus Network in East Cairo
Source: JICA Study Team
Source: JICA Study Team

CREATS: Phase II Final Report, Vol. III: CTA Transport Improvement Project in East Sector of Cairo Chapter 4: NETWORK OPTIMIZATION AND INTEGRATION IN THE EAST SECTOR
4 - 42
Figure 4.3.18 Overview of Bus Network in the Supertram Catchment Area
Figure 4.3.19 Overview of Bus Network in the Supertram Buffer Zone
Source: JICA Study Team
Source: JICA Study Team

CREATS: Phase II Final Report, Vol. III: CTA Transport Improvement Project in East Sector of Cairo Chapter 4: NETWORK OPTIMIZATION AND INTEGRATION IN THE EAST SECTOR
4 - 43
• which in turn suggests that providing a supertram feeder service for these zones of the catchment area is likely not a critical issue. Nevertheless, the fact that people should have a good accessibility to the supertram must not be ignored. The relative absence of demand in the central Madinet Nasr is also noted, again reflective of a more sparse bus network in the area.
• On the other hand, bus movements competing with Supertram Line 1 can not be ignored; particularly passenger movements represented by C-F (7 percent), B-F (5 percent), A-E (6 percent) and A-F (2 percent). Some form of route consolidation may well be appropriate in these corridors.
Source: JICA Study Team Figure 4.3.20 Catchment Area Desire Lines
4.3.6 Route Categorization
The East Cairo bus route structure was subdivided into four generic alignment categories to allow more individualized focus upon route optimization within East Cairo and within the Supertram Line 1 catchment area. These four groupings are bus routes which have broadly different service alignments vis-à-vis the Supertram Line 1 corridor. The four adopted categories consist of bus routes which (a) parallel the general alignment of Supertram Line 1, (b) intersect Supertram Line 1, (c) approach Supertram Line 1, and (d) tend to be peripheral relative to Supertram Line 1; that is, principally serve areas not near Supertram Line 1. Examples of the four alignment categories using illustrative routes are depicted in Figure 4.3.21.
B
D
C
F
E A

CREATS: Phase II Final Report, Vol. III: CTA Transport Improvement Project in East Sector of Cairo Chapter 4: NETWORK OPTIMIZATION AND INTEGRATION IN THE EAST SECTOR
4 - 44
Category 1: Parallel to the Supertram Category 2: Intersect with the Supertram
Category 3: Approaching the Supertram Category 4: Peripheral to the Supertram
Source: JICA Study Team Figure 4.3.21 Examples of Bus Route Categorization
Of principal interest in the first instance are clarification of routes which parallel and intersect the supertram. To facilitate further reviews, the supertram was divided into 18 inter-station sections; for example, the link between Ramses and Ghamra Stations being defined as Section 1. GIS bus route maps were inspected to define the bus routes running parallel with different sections of Supertram Line 1, with results shown in Table 4.3.11. Bus line numbers are sorted in ascending order in each cell for the reader convenience. A null cell indicates no bus service traveling along the concerned segment of the supertram. For instance, 29 CTA bus lines, 16 minibus lines, six students’ bus lines, four air-conditioned bus lines and six GCBC bus lines are parallel (overlapping) with the segment from Ramses station to Ghamra station, for a total of 61 bus lines. It is noted that a given bus line can be categorized as being parallel to more than one section of the supertram.
Similarly, the bus lines intersecting with each segment of Supertram Line 1 are given in Table 4.2.12. The maximum number of intersecting bus lines occur at the fourth segment (Mansheyet El Sadr – Mansheyet El Bakry) including 16 CTA

CREATS: Phase II Final Report, Vol. III: CTA Transport Improvement Project in East Sector of Cairo Chapter 4: NETWORK OPTIMIZATION AND INTEGRATION IN THE EAST SECTOR
4 - 45
regular lines, 10 minibus lines, one students’ line, five air-conditioned lines and one GCBC line, which aggregates to 33 bus lines.
The bus lines data included in Tables 4.3.11 and 4.3.12 are summarized in Table 4.3.13 to present the total number of parallel and intersecting bus lines within the different sections of Supertram Line 1. Following conclusions emerge:
• More than 60 bus lines are running parallel with Supertram Line 1 on Ramses street emphasizing the significant redundancy of some of these lines along that section. Metro Line 1 and the proposed Supertram Line 1 are serving that section, which suggests the viability of diverting some of bus lines; however, it should concurrently be noted that Metro Line 1 is already experiencing near-capacity operations within that corridor.
• The same comment is valid to some extent on the eastern end of Supertram Line 1, where 23 bus lines are operating along Mostafa El Nahhas street.
• The feeder service provided by the intersecting or parallel bus lines with Supertram Line 1 is quite reasonable. However, some of the intersecting lines may need some diversion to the nearest or most appropriate station of Supertram to minimize the walking distance for passengers who are willing to transfer between the two modes. The bus stops of the parallel lines can be slightly moved when necessary to the nearest station of Supertram for the same previous reason (e.g. increasing passenger accessibility to Supertram).
One of the major objectives of presenting Table 4.3.11 is to emphasize that there is redundancy in the bus network because of the remarkable number of bus lines running parallel to Supertram Line 1. On the other hand, Table 4.3.12 emphasizes the strong potential of feeder service represented by the large number of bus lines intersecting different segment of Supertram Line 1.
4.3.7 Analysis of Alternative Optimization Strategies
(1) Conceptual Overview
In order to obtain an integral and efficient public transport network within East Cairo region, a functional hierarchy should be established between various transport modes, particularly CTA bus and Supertram Line 1. The basic rule is that the modes with the highest capacity, i.e. the rail-based mode, should accommodate the main traffic corridors while the buses serve secondary traffic corridors and also function as feeder lines to the rail-based modes.
However, it might be necessary to operate buses on the same corridor of rail-based transport mode to provide service to local passengers who have better accessibility to bus service rather than rail service. Moreover, when the transport demand along a specific corridor exceeds the capacity of the rail-based mode, it is necessary to provide a bus service to accommodate that extra demand, which is also considered as one of the integration measures between different modes of transport.