Embed Size (px)
Citation preview
A weekly publication of the Transportation and Marketing Programs/Transportation Services Division
www.ams.usda.gov/GTR
September 25, 2014
Contents
Article/
Calendar
Grain
Transportation
Indicators
Rail
Barge
Truck
Exports
Ocean
Brazil
Mexico
Grain Truck/Ocean
Rate Advisory
Data Links
Specialists
Subscription
Information
--------------
The next
release is October 2, 2014
Preferred citation: U.S. Dept. of Agriculture, Agricultural Marketing Service. Grain Transportation Report. September 25, 2014.
Web: http://dx.doi.org/10.9752/TS056.09-25-2014
Grain Transportation Report
Contact Us
WEEKLY HIGHLIGHTS
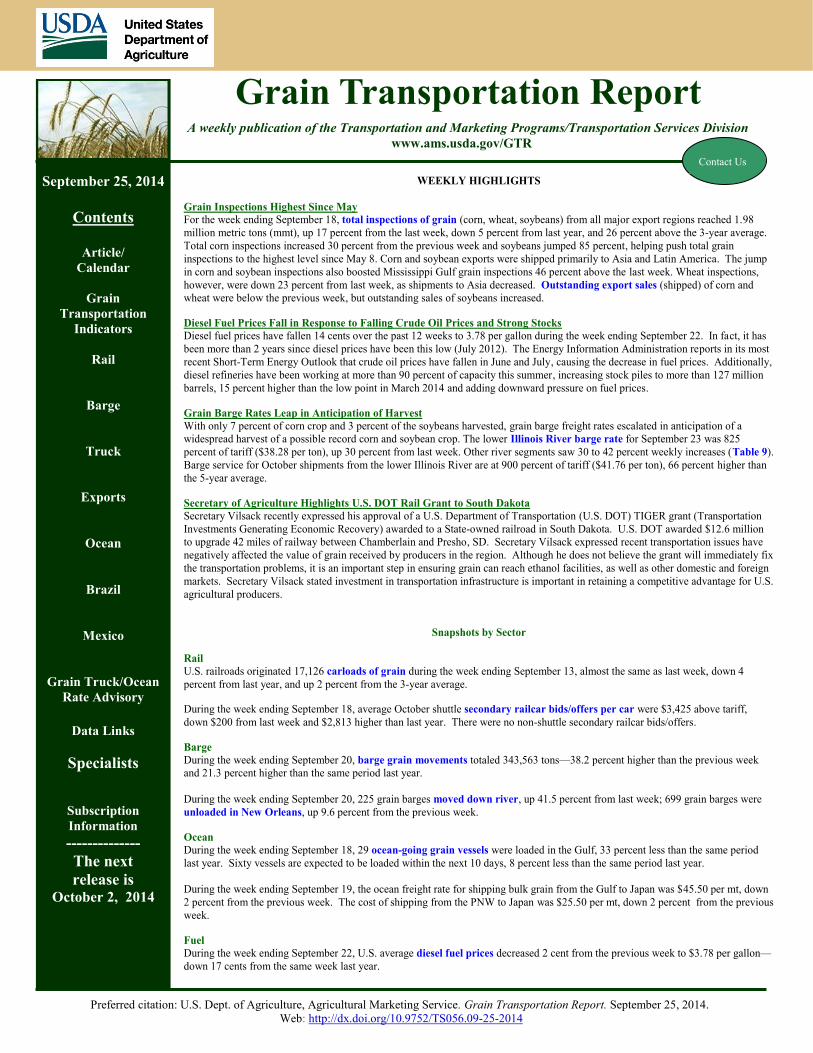
Grain Inspections Highest Since May
For the week ending September 18, total inspections of grain (corn, wheat, soybeans) from all major export regions reached 1.98
million metric tons (mmt), up 17 percent from the last week, down 5 percent from last year, and 26 percent above the 3-year average.
Total corn inspections increased 30 percent from the previous week and soybeans jumped 85 percent, helping push total grain
inspections to the highest level since May 8. Corn and soybean exports were shipped primarily to Asia and Latin America. The jump
in corn and soybean inspections also boosted Mississippi Gulf grain inspections 46 percent above the last week. Wheat inspections,
however, were down 23 percent from last week, as shipments to Asia decreased. Outstanding export sales (shipped) of corn and
wheat were below the previous week, but outstanding sales of soybeans increased.
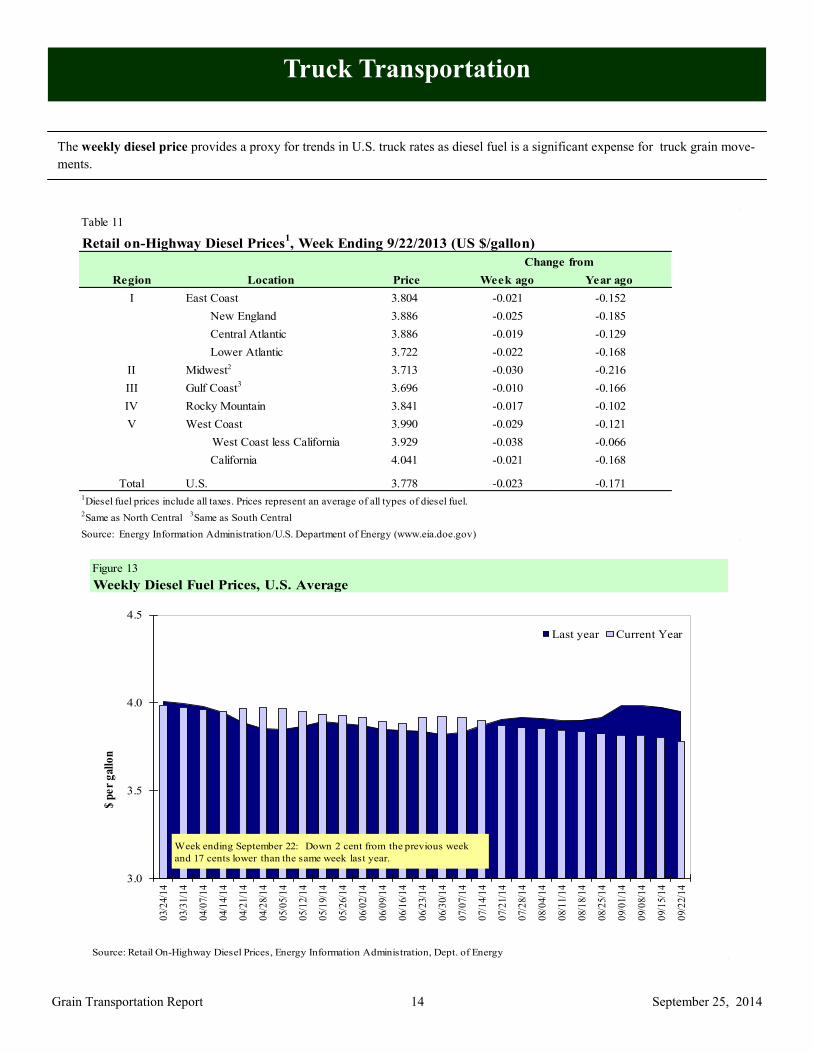
Diesel Fuel Prices Fall in Response to Falling Crude Oil Prices and Strong Stocks
Diesel fuel prices have fallen 14 cents over the past 12 weeks to 3.78 per gallon during the week ending September 22. In fact, it has
been more than 2 years since diesel prices have been this low (July 2012). The Energy Information Administration reports in its most
recent Short-Term Energy Outlook that crude oil prices have fallen in June and July, causing the decrease in fuel prices. Additionally,
diesel refineries have been working at more than 90 percent of capacity this summer, increasing stock piles to more than 127 million
barrels, 15 percent higher than the low point in March 2014 and adding downward pressure on fuel prices.
Grain Barge Rates Leap in Anticipation of Harvest
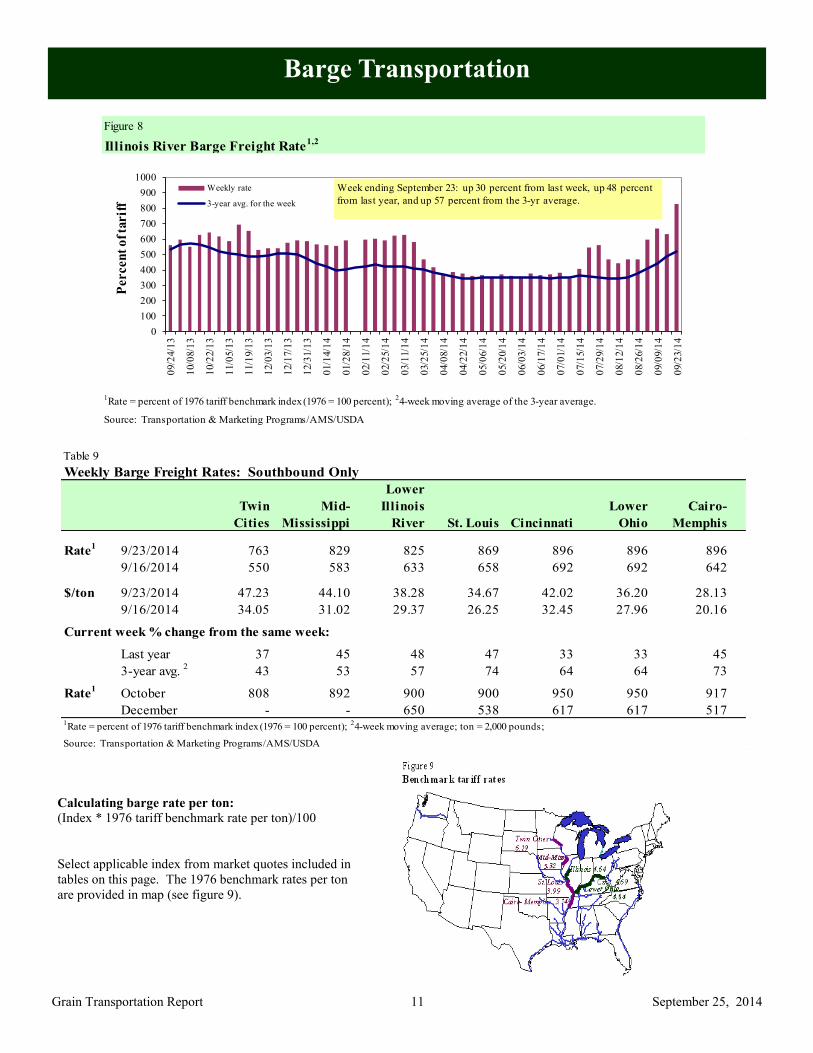
With only 7 percent of corn crop and 3 percent of the soybeans harvested, grain barge freight rates escalated in anticipation of a
widespread harvest of a possible record corn and soybean crop. The lower Illinois River barge rate for September 23 was 825
percent of tariff ($38.28 per ton), up 30 percent from last week. Other river segments saw 30 to 42 percent weekly increases (Table 9).
Barge service for October shipments from the lower Illinois River are at 900 percent of tariff ($41.76 per ton), 66 percent higher than
the 5-year average.
Secretary of Agriculture Highlights U.S. DOT Rail Grant to South Dakota
Secretary Vilsack recently expressed his approval of a U.S. Department of Transportation (U.S. DOT) TIGER grant (Transportation
Investments Generating Economic Recovery) awarded to a State-owned railroad in South Dakota. U.S. DOT awarded $12.6 million
to upgrade 42 miles of railway between Chamberlain and Presho, SD. Secretary Vilsack expressed recent transportation issues have
negatively affected the value of grain received by producers in the region. Although he does not believe the grant will immediately fix
the transportation problems, it is an important step in ensuring grain can reach ethanol facilities, as well as other domestic and foreign
markets. Secretary Vilsack stated investment in transportation infrastructure is important in retaining a competitive advantage for U.S.
agricultural producers.
Snapshots by Sector
Rail
U.S. railroads originated 17,126 carloads of grain during the week ending September 13, almost the same as last week, down 4
percent from last year, and up 2 percent from the 3-year average.
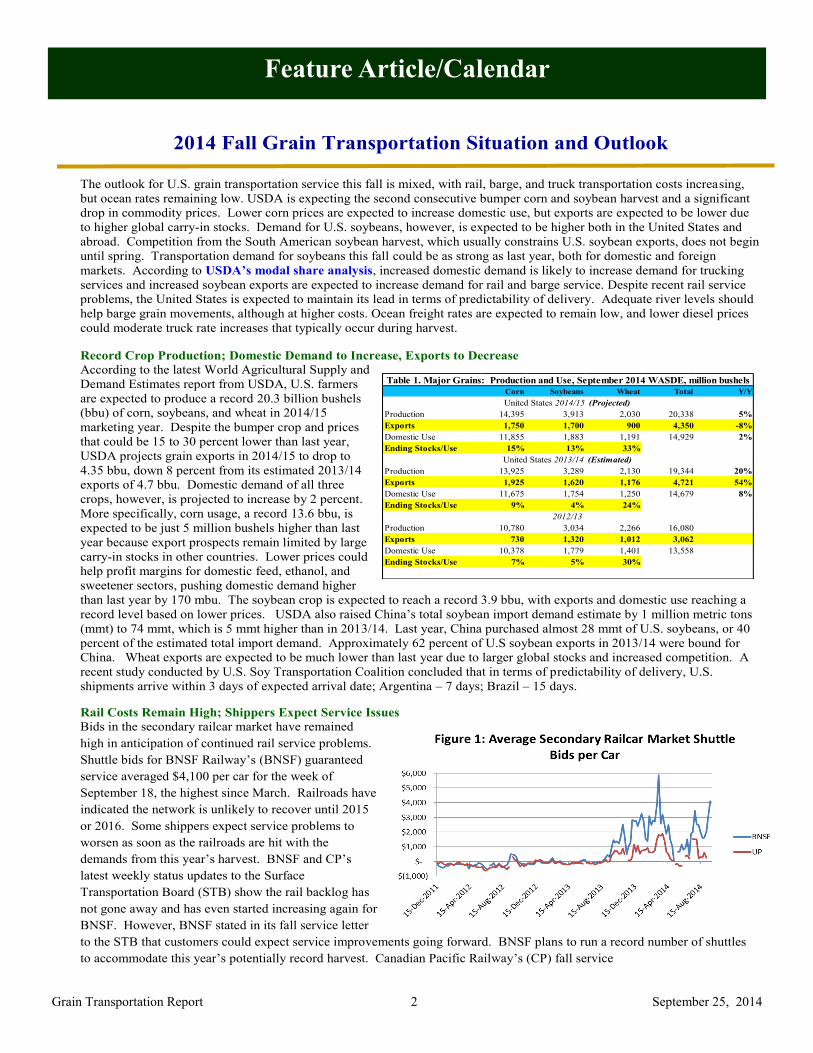
During the week ending September 18, average October shuttle secondary railcar bids/offers per car were $3,425 above tariff,
down $200 from last week and $2,813 higher than last year. There were no non-shuttle secondary railcar bids/offers.
Barge
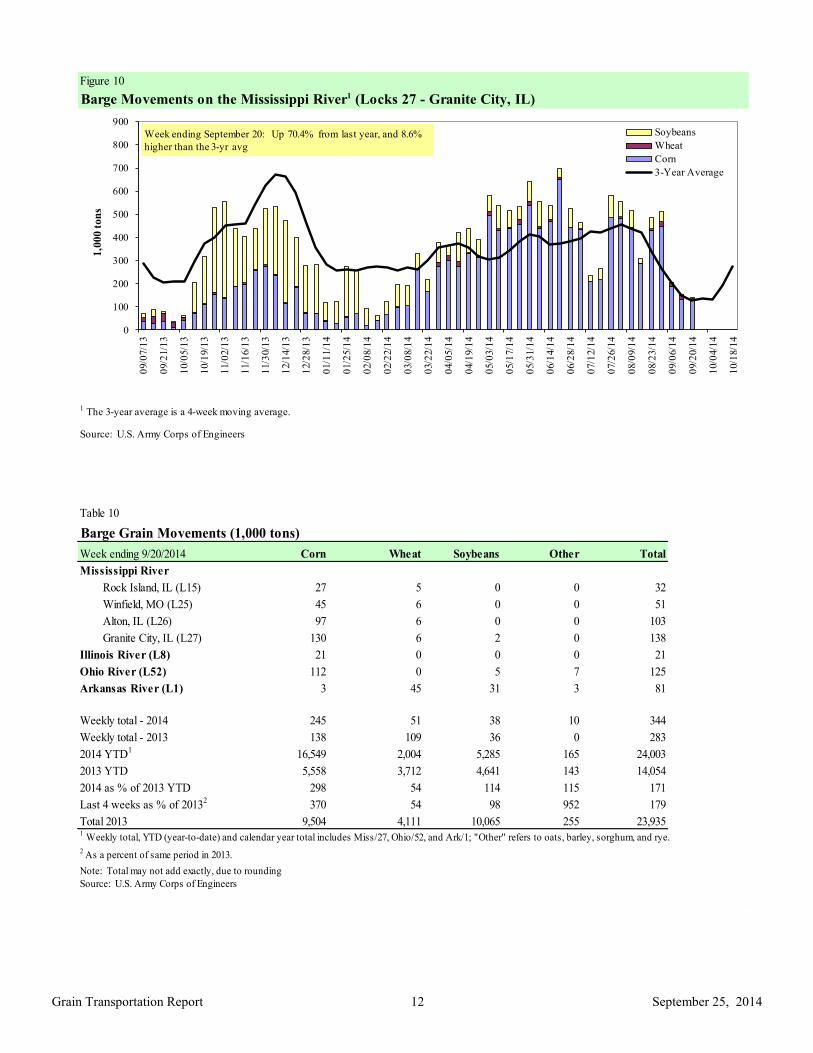
During the week ending September 20, barge grain movements totaled 343,563 tons—38.2 percent higher than the previous week
and 21.3 percent higher than the same period last year.
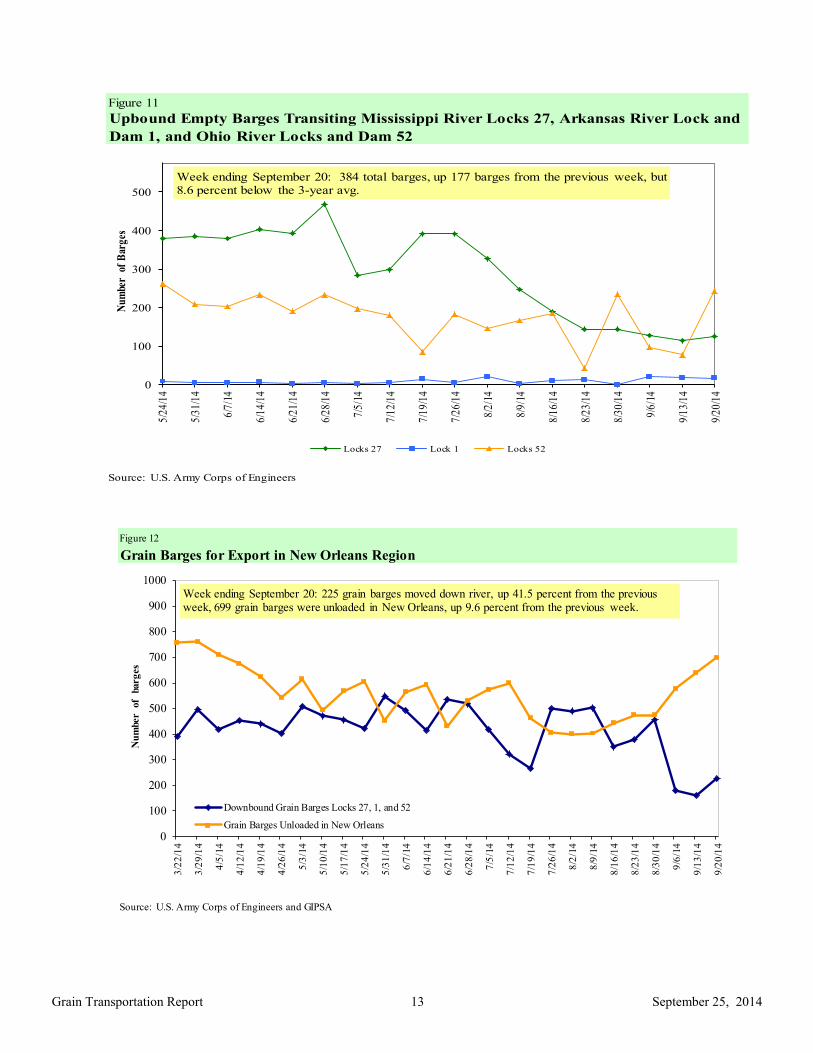
During the week ending September 20, 225 grain barges moved down river, up 41.5 percent from last week; 699 grain barges were
unloaded in New Orleans, up 9.6 percent from the previous week.
Ocean
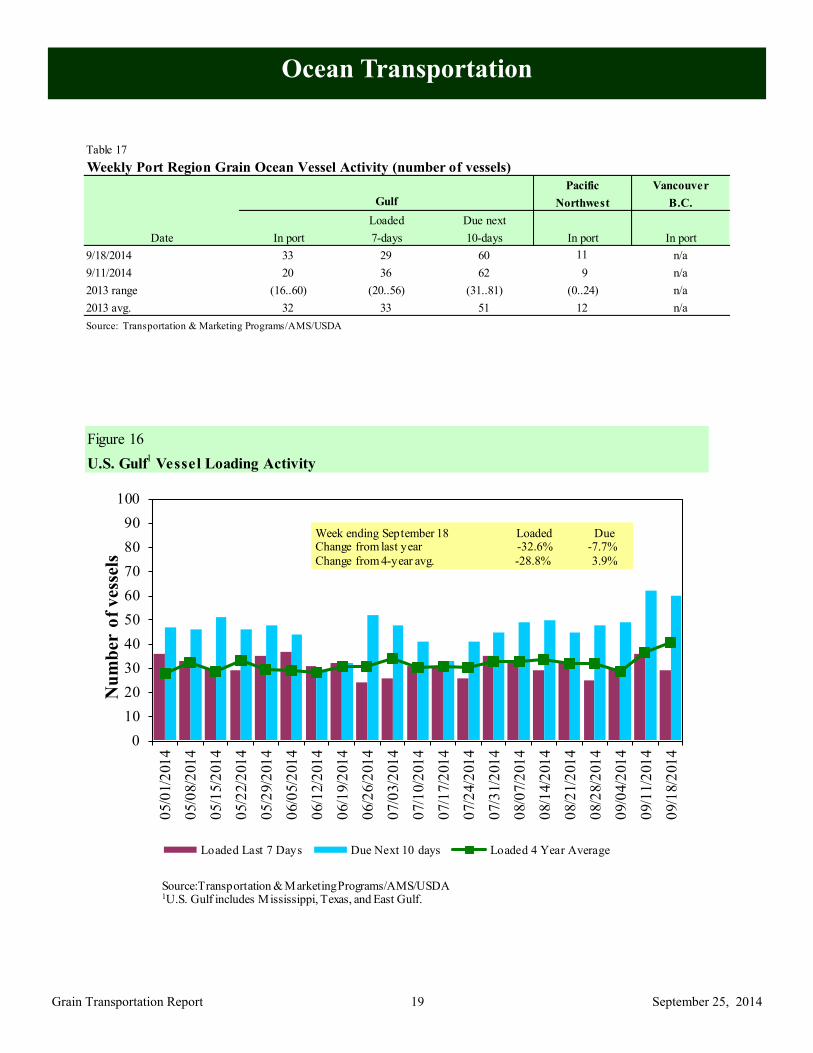
During the week ending September 18, 29 ocean-going grain vessels were loaded in the Gulf, 33 percent less than the same period
last year. Sixty vessels are expected to be loaded within the next 10 days, 8 percent less than the same period last year.
During the week ending September 19, the ocean freight rate for shipping bulk grain from the Gulf to Japan was $45.50 per mt, down
2 percent from the previous week. The cost of shipping from the PNW to Japan was $25.50 per mt, down 2 percent from the previous
week.
Fuel During the week ending September 22, U.S. average diesel fuel prices decreased 2 cent from the previous week to $3.78 per gallon—
down 17 cents from the same week last year.
September 25, 2014
Grain Transportation Report 2
Feature Article/Calendar
2014 Fall Grain Transportation Situation and Outlook
The outlook for U.S. grain transportation service this fall is mixed, with rail, barge, and truck transportation costs increasing,
but ocean rates remaining low. USDA is expecting the second consecutive bumper corn and soybean harvest and a significant
drop in commodity prices. Lower corn prices are expected to increase domestic use, but exports are expected to be lower due
to higher global carry-in stocks. Demand for U.S. soybeans, however, is expected to be higher both in the United States and
abroad. Competition from the South American soybean harvest, which usually constrains U.S. soybean exports, does not begin
until spring. Transportation demand for soybeans this fall could be as strong as last year, both for domestic and foreign
markets. According to USDA’s modal share analysis, increased domestic demand is likely to increase demand for trucking
services and increased soybean exports are expected to increase demand for rail and barge service. Despite recent rail service
problems, the United States is expected to maintain its lead in terms of predictability of delivery. Adequate river levels should
help barge grain movements, although at higher costs. Ocean freight rates are expected to remain low, and lower diesel prices
could moderate truck rate increases that typically occur during harvest.
Record Crop Production; Domestic Demand to Increase, Exports to Decrease
According to the latest World Agricultural Supply and
Demand Estimates report from USDA, U.S. farmers
are expected to produce a record 20.3 billion bushels
(bbu) of corn, soybeans, and wheat in 2014/15
marketing year. Despite the bumper crop and prices
that could be 15 to 30 percent lower than last year,
USDA projects grain exports in 2014/15 to drop to
4.35 bbu, down 8 percent from its estimated 2013/14
exports of 4.7 bbu. Domestic demand of all three
crops, however, is projected to increase by 2 percent.
More specifically, corn usage, a record 13.6 bbu, is
expected to be just 5 million bushels higher than last
year because export prospects remain limited by large
carry-in stocks in other countries. Lower prices could
help profit margins for domestic feed, ethanol, and
sweetener sectors, pushing domestic demand higher
than last year by 170 mbu. The soybean crop is expected to reach a record 3.9 bbu, with exports and domestic use reaching a
record level based on lower prices. USDA also raised China’s total soybean import demand estimate by 1 million metric tons
(mmt) to 74 mmt, which is 5 mmt higher than in 2013/14. Last year, China purchased almost 28 mmt of U.S. soybeans, or 40
percent of the estimated total import demand. Approximately 62 percent of U.S soybean exports in 2013/14 were bound for
China. Wheat exports are expected to be much lower than last year due to larger global stocks and increased competition. A
recent study conducted by U.S. Soy Transportation Coalition concluded that in terms of predictability of delivery, U.S.
shipments arrive within 3 days of expected arrival date; Argentina – 7 days; Brazil – 15 days.
Rail Costs Remain High; Shippers Expect Service Issues Bids in the secondary railcar market have remained
high in anticipation of continued rail service problems.
Shuttle bids for BNSF Railway’s (BNSF) guaranteed
service averaged $4,100 per car for the week of
September 18, the highest since March. Railroads have
indicated the network is unlikely to recover until 2015
or 2016. Some shippers expect service problems to
worsen as soon as the railroads are hit with the
demands from this year’s harvest. BNSF and CP’s
latest weekly status updates to the Surface
Transportation Board (STB) show the rail backlog has
not gone away and has even started increasing again for
BNSF. However, BNSF stated in its fall service letter
to the STB that customers could expect service improvements going forward. BNSF plans to run a record number of shuttles
to accommodate this year’s potentially record harvest. Canadian Pacific Railway’s (CP) fall service
Corn Soybeans Wheat Total Y/Y
Production 14,395 3,913 2,030 20,338 5%
Exports 1,750 1,700 900 4,350 -8%
Domestic Use 11,855 1,883 1,191 14,929 2%
Ending Stocks/Use 15% 13% 33%
Production 13,925 3,289 2,130 19,344 20%
Exports 1,925 1,620 1,176 4,721 54%
Domestic Use 11,675 1,754 1,250 14,679 8%
Ending Stocks/Use 9% 4% 24%
Production 10,780 3,034 2,266 16,080
Exports 730 1,320 1,012 3,062
Domestic Use 10,378 1,779 1,401 13,558
Ending Stocks/Use 7% 5% 30%
Table 1. Major Grains: Production and Use, September 2014 WASDE, million bushels
United States 2014/15 (Projected)
United States 2013/14 (Estimated)
2012/13
September 25, 2014
Grain Transportation Report 3
-5
0
5
10
15
20
25
30
J F M A M J J A S * O N D
River
Level
(gage feet)
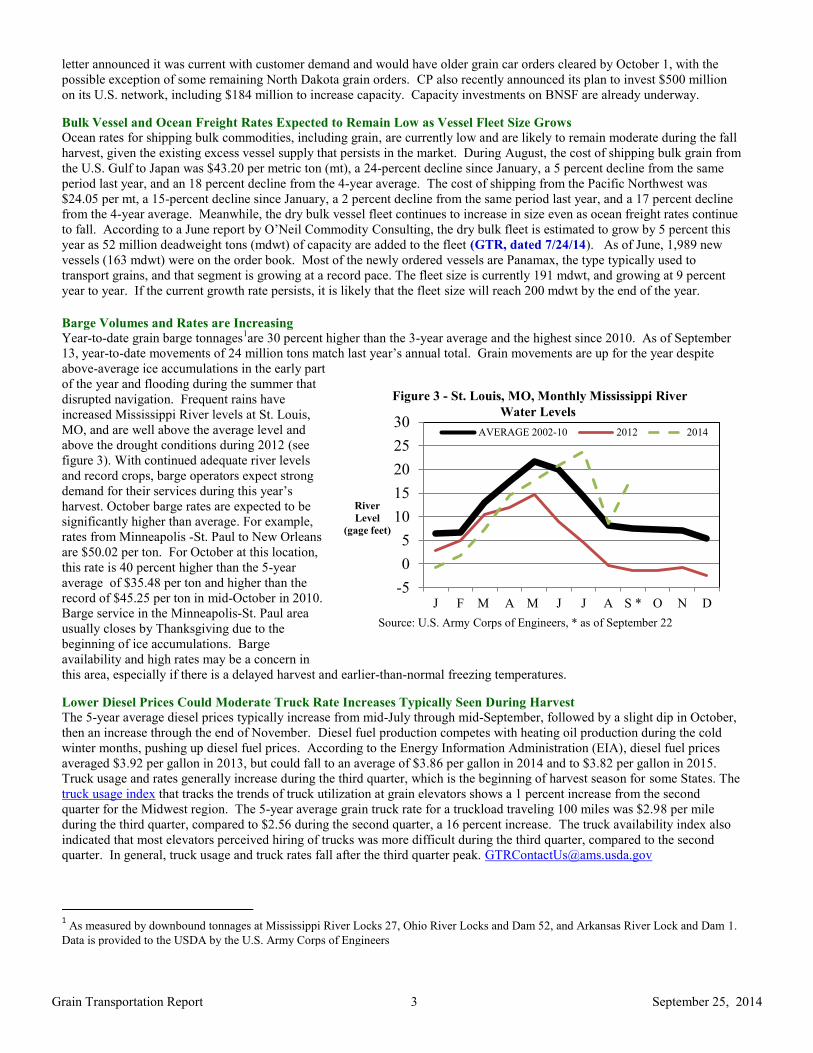
Figure 3 - St. Louis, MO, Monthly Mississippi River
Water Levels
AVERAGE 2002-10 2012 2014
Source: U.S. Army Corps of Engineers, * as of September 22
letter announced it was current with customer demand and would have older grain car orders cleared by October 1, with the
possible exception of some remaining North Dakota grain orders. CP also recently announced its plan to invest $500 million
on its U.S. network, including $184 million to increase capacity. Capacity investments on BNSF are already underway.
Bulk Vessel and Ocean Freight Rates Expected to Remain Low as Vessel Fleet Size Grows
Ocean rates for shipping bulk commodities, including grain, are currently low and are likely to remain moderate during the fall
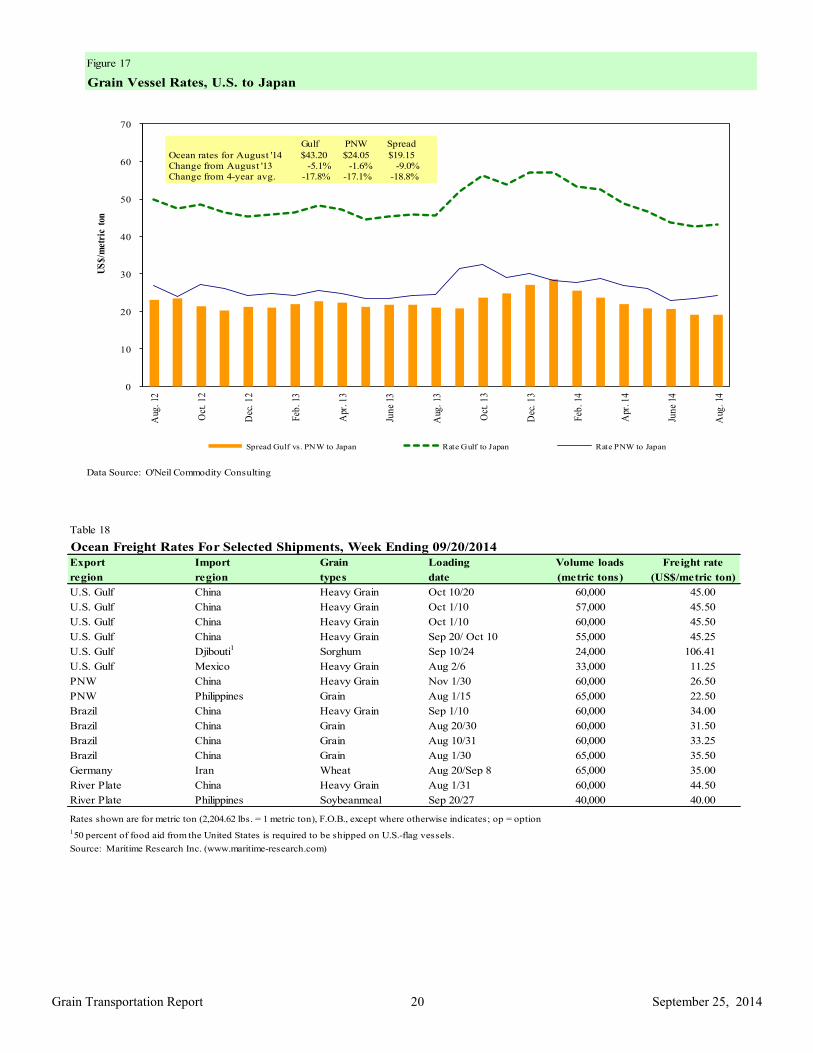
harvest, given the existing excess vessel supply that persists in the market. During August, the cost of shipping bulk grain from
the U.S. Gulf to Japan was $43.20 per metric ton (mt), a 24-percent decline since January, a 5 percent decline from the same
period last year, and an 18 percent decline from the 4-year average. The cost of shipping from the Pacific Northwest was
$24.05 per mt, a 15-percent decline since January, a 2 percent decline from the same period last year, and a 17 percent decline
from the 4-year average. Meanwhile, the dry bulk vessel fleet continues to increase in size even as ocean freight rates continue
to fall. According to a June report by O’Neil Commodity Consulting, the dry bulk fleet is estimated to grow by 5 percent this
year as 52 million deadweight tons (mdwt) of capacity are added to the fleet (GTR, dated 7/24/14). As of June, 1,989 new
vessels (163 mdwt) were on the order book. Most of the newly ordered vessels are Panamax, the type typically used to
transport grains, and that segment is growing at a record pace. The fleet size is currently 191 mdwt, and growing at 9 percent
year to year. If the current growth rate persists, it is likely that the fleet size will reach 200 mdwt by the end of the year.
Barge Volumes and Rates are Increasing
Year-to-date grain barge tonnages1are 30 percent higher than the 3-year average and the highest since 2010. As of September
13, year-to-date movements of 24 million tons match last year’s annual total. Grain movements are up for the year despite
above-average ice accumulations in the early part
of the year and flooding during the summer that
disrupted navigation. Frequent rains have
increased Mississippi River levels at St. Louis,
MO, and are well above the average level and
above the drought conditions during 2012 (see
figure 3). With continued adequate river levels
and record crops, barge operators expect strong
demand for their services during this year’s
harvest. October barge rates are expected to be
significantly higher than average. For example,
rates from Minneapolis -St. Paul to New Orleans
are $50.02 per ton. For October at this location,
this rate is 40 percent higher than the 5-year
average of $35.48 per ton and higher than the
record of $45.25 per ton in mid-October in 2010.
Barge service in the Minneapolis-St. Paul area
usually closes by Thanksgiving due to the
beginning of ice accumulations. Barge
availability and high rates may be a concern in
this area, especially if there is a delayed harvest and earlier-than-normal freezing temperatures.
Lower Diesel Prices Could Moderate Truck Rate Increases Typically Seen During Harvest
The 5-year average diesel prices typically increase from mid-July through mid-September, followed by a slight dip in October,
then an increase through the end of November. Diesel fuel production competes with heating oil production during the cold
winter months, pushing up diesel fuel prices. According to the Energy Information Administration (EIA), diesel fuel prices
averaged $3.92 per gallon in 2013, but could fall to an average of $3.86 per gallon in 2014 and to $3.82 per gallon in 2015.
Truck usage and rates generally increase during the third quarter, which is the beginning of harvest season for some States. The
truck usage index that tracks the trends of truck utilization at grain elevators shows a 1 percent increase from the second
quarter for the Midwest region. The 5-year average grain truck rate for a truckload traveling 100 miles was $2.98 per mile
during the third quarter, compared to $2.56 during the second quarter, a 16 percent increase. The truck availability index also
indicated that most elevators perceived hiring of trucks was more difficult during the third quarter, compared to the second
quarter. In general, truck usage and truck rates fall after the third quarter peak. [email protected]
1 As measured by downbound tonnages at Mississippi River Locks 27, Ohio River Locks and Dam 52, and Arkansas River Lock and Dam 1.
Data is provided to the USDA by the U.S. Army Corps of Engineers
September 25, 2014
Grain Transportation Report 4
Grain Transportation Indicators
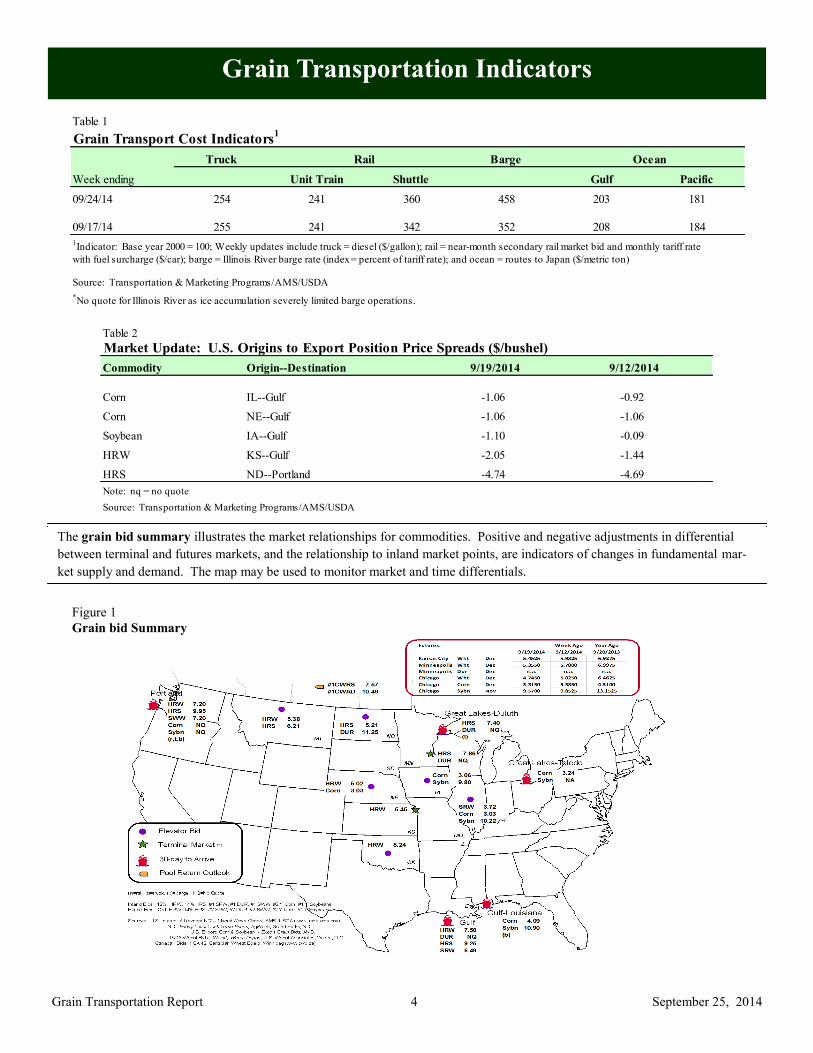
The grain bid summary illustrates the market relationships for commodities. Positive and negative adjustments in differential
between terminal and futures markets, and the relationship to inland market points, are indicators of changes in fundamental mar-
ket supply and demand. The map may be used to monitor market and time differentials.
Table 2
Market Update: U.S. Origins to Export Position Price Spreads ($/bushel)
Commodity Origin--Destination 9/19/2014 9/12/2014
Corn IL--Gulf -1.06 -0.92
Corn NE--Gulf -1.06 -1.06
Soybean IA--Gulf -1.10 -0.09
HRW KS--Gulf -2.05 -1.44
HRS ND--Portland -4.74 -4.69
Note: nq = no quote
Source: Transportation & Marketing Programs/AMS/USDA
Table 1
Grain Transport Cost Indicators1
Truck Barge Ocean
Week ending Unit Train Shuttle Gulf Pacific
09/24/14 254 241 360 458 203 181- 1% # DIV/0 ! 3 0 % - 2 % - 2 %
09/17/14 255 241 342 352 208 184
1Indicator: Base year 2000 = 100; Weekly updates include truck = diesel ($/gallon); rail = near-month secondary rail market bid and monthly tariff rate
with fuel surcharge ($/car); barge = Illinois River barge rate (index = percent of tariff rate); and ocean = routes to Japan ($/metric ton)
Source: Transportation & Marketing Programs/AMS/USDA
*No quote for
Illinois River as ice accumulation severely limited barge operations.
Rail
Figure 1
Grain bid Summary
September 25, 2014
Grain Transportation Report 5
Rail Transportation
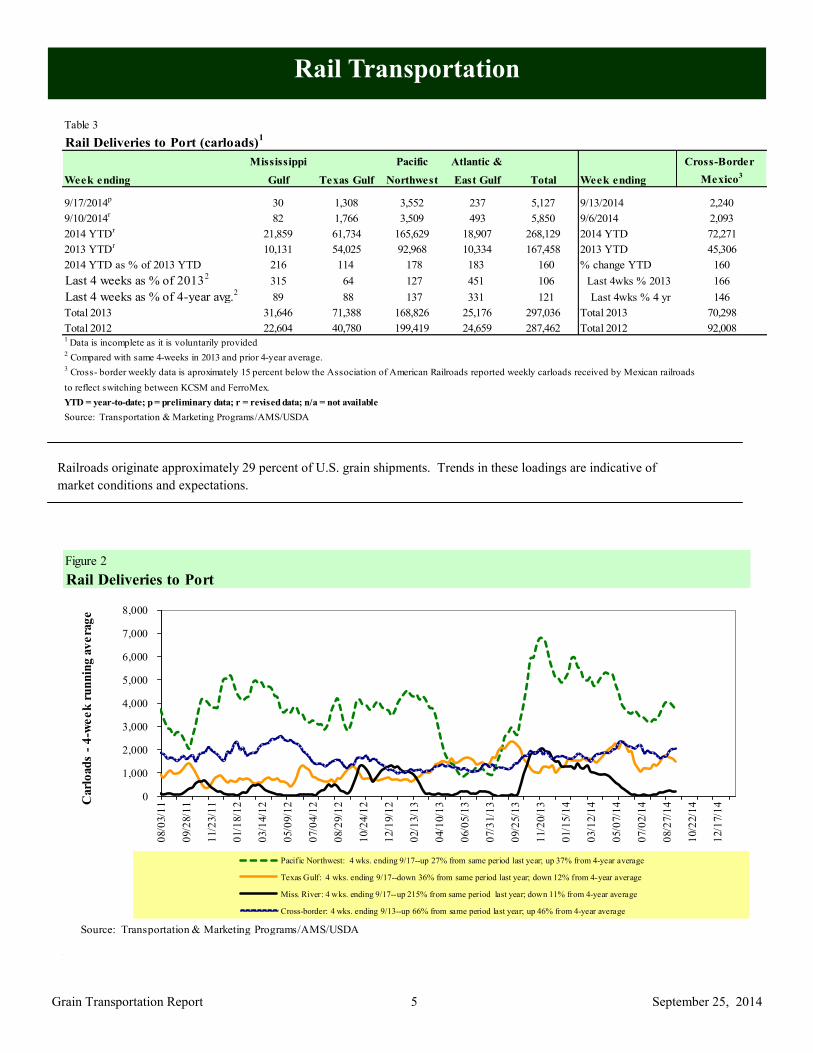
Railroads originate approximately 29 percent of U.S. grain shipments. Trends in these loadings are indicative of
market conditions and expectations.
Figure 2
Rail Deliveries to Port
0
1,000
2,000
3,000
4,000
5,000
6,000
7,000
8,000
08/0
3/1
1
09/2
8/1
1
11/2
3/1
1
01/1
8/1
2
03/1
4/1
2
05/0
9/1
2
07/0
4/1
2
08/2
9/1
2
10/2
4/1
2
12/1
9/1
2
02/1
3/1
3
04/1
0/1
3
06/0
5/1
3
07/3
1/1
3
09/2
5/1
3
11/2
0/1
3
01/1
5/1
4
03/1
2/1
4
05/0
7/1
4
07/0
2/1
4
08/2
7/1
4
10/2
2/1
4
12/1
7/1
4Carl
oad
s -
4-w
ee
k r
un
nin
g a
ve
rag
e
Pacific Northwest: 4 wks. ending 9/17--up 27% from same period last year; up 37% from 4-year average
Texas Gulf: 4 wks. ending 9/17--down 36% from same period last year; down 12% from 4-year average
Miss. River: 4 wks. ending 9/17--up 215% from same period last year; down 11% from 4-year average
Cross-border: 4 wks. ending 9/13--up 66% from same period last year; up 46% from 4-year average
Source: Transportation & Marketing Programs/AMS/USDA
Table 3
Rail Deliveries to Port (carloads)1
Mississippi Pacific Atlantic & Cross-Border
Week ending Gulf Texas Gulf Northwest East Gulf Total Week ending Mexico3
9/17/2014p
30 1,308 3,552 237 5,127 9/13/2014 2,240
9/10/2014r
82 1,766 3,509 493 5,850 9/6/2014 2,093
2014 YTDr
21,859 61,734 165,629 18,907 268,129 2014 YTD 72,271
2013 YTDr
10,131 54,025 92,968 10,334 167,458 2013 YTD 45,306
2014 YTD as % of 2013 YTD 216 114 178 183 160 % change YTD 160
Last 4 weeks as % of 20132
315 64 127 451 106 Last 4wks % 2013 166
Last 4 weeks as % of 4-year avg.2
89 88 137 331 121 Last 4wks % 4 yr 146
Total 2013 31,646 71,388 168,826 25,176 297,036 Total 2013 70,298
Total 2012 22,604 40,780 199,419 24,659 287,462 Total 2012 92,0081
Data is incomplete as it is voluntarily provided2 Compared with same 4-weeks in 2013 and prior 4-year average.
3 Cross- border weekly data is aproximately 15 percent below the Association of American Railroads reported weekly carloads received by Mexican railroads
to reflect switching between KCSM and FerroMex.
YTD = year-to-date; p = preliminary data; r = revised data; n/a = not available
Source: Transportation & Marketing Programs/AMS/USDA
September 25, 2014
Grain Transportation Report 6
Table 5
Railcar Auction Offerings1 ($/car)
2
Week ending
9/18/2014 Oct-14 Oct-13 Nov-14 Nov-13 Dec-14 Dec-13 Jan-15 Jan-14
BNSF3
COT grain units no offer no offer no offer 150 no offer 1 no offer 1
COT grain single-car5
no offer no offer no offer 0 . . 5 no offer 0 . . 2 no offer 0 . . 3
UP4
GCAS/Region 1 no offer no bids no offer no bids no offer no bids n/a n/a
GCAS/Region 2 2197 1 1187 no bids no offer no bids n/a n/a1Auction offerings are for single-car and unit train shipments only.
2Average premium/discount to tariff, last auction
3BNSF - COT = Certificate of Transportation; north grain and south grain bids were combined effective the week ending 6/24/06.
4UP - GCAS = Grain Car Allocation System
Region 1 includes: AR, IL, LA, MO, NM, OK, TX, WI, and Duluth, MN.
Region 2 includes: CO, IA, KS, MN, NE, WY, and Kansas City and St. Joseph, MO.5Range is shown because average is not available. Not available = n/a.
Source: Transportation & Marketing Programs/AMS/USDA.
Delivery period
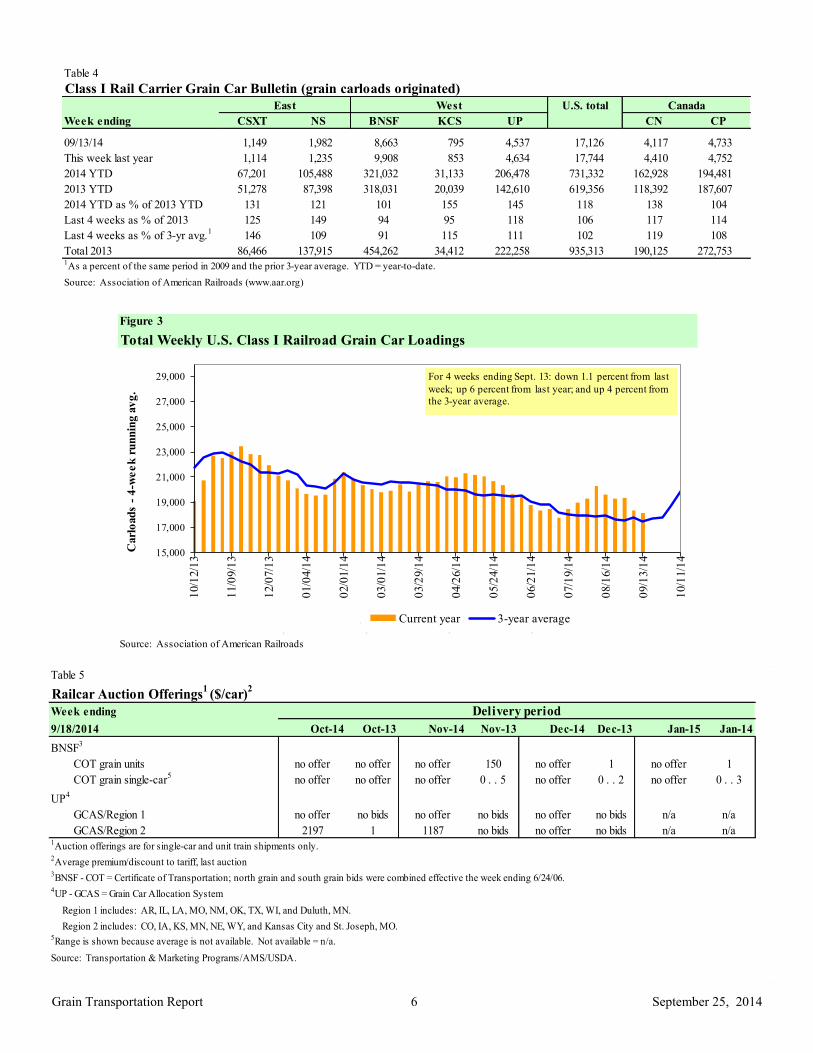
Table 4
Class I Rail Carrier Grain Car Bulletin (grain carloads originated)
U.S. total
Week ending CSXT NS BNSF KCS UP CN CP
09/13/14 1,149 1,982 8,663 795 4,537 17,126 4,117 4,733
This week last year 1,114 1,235 9,908 853 4,634 17,744 4,410 4,752
2014 YTD 67,201 105,488 321,032 31,133 206,478 731,332 162,928 194,481
2013 YTD 51,278 87,398 318,031 20,039 142,610 619,356 118,392 187,607
2014 YTD as % of 2013 YTD 131 121 101 155 145 118 138 104
Last 4 weeks as % of 2013 125 149 94 95 118 106 117 114
Last 4 weeks as % of 3-yr avg.1
146 109 91 115 111 102 119 108
Total 2013 86,466 137,915 454,262 34,412 222,258 935,313 190,125 272,753 1As a percent of the same period in 2009 and the prior 3-year average. YTD = year-to-date.
Source: Association of American Railroads (www.aar.org)
East West Canada
Figure 3
Total Weekly U.S. Class I Railroad Grain Car Loadings
Source: Association of American Railroads
15,000
17,000
19,000
21,000
23,000
25,000
27,000
29,000
10/1
2/1
3
11/0
9/1
3
12/0
7/1
3
01/0
4/1
4
02/0
1/1
4
03/0
1/1
4
03/2
9/1
4
04/2
6/1
4
05/2
4/1
4
06/2
1/1
4
07/1
9/1
4
08/1
6/1
4
09/1
3/1
4
10/1
1/1
4
Carl
oad
s -
4-w
ee
k r
un
nin
g a
vg
.
4-week period endingCurrent year 3-year average
For 4 weeks ending Sept. 13: down 1.1 percent from last
week; up 6 percent from last year; and up 4 percent from
the 3-year average.
September 25, 2014
Grain Transportation Report 7
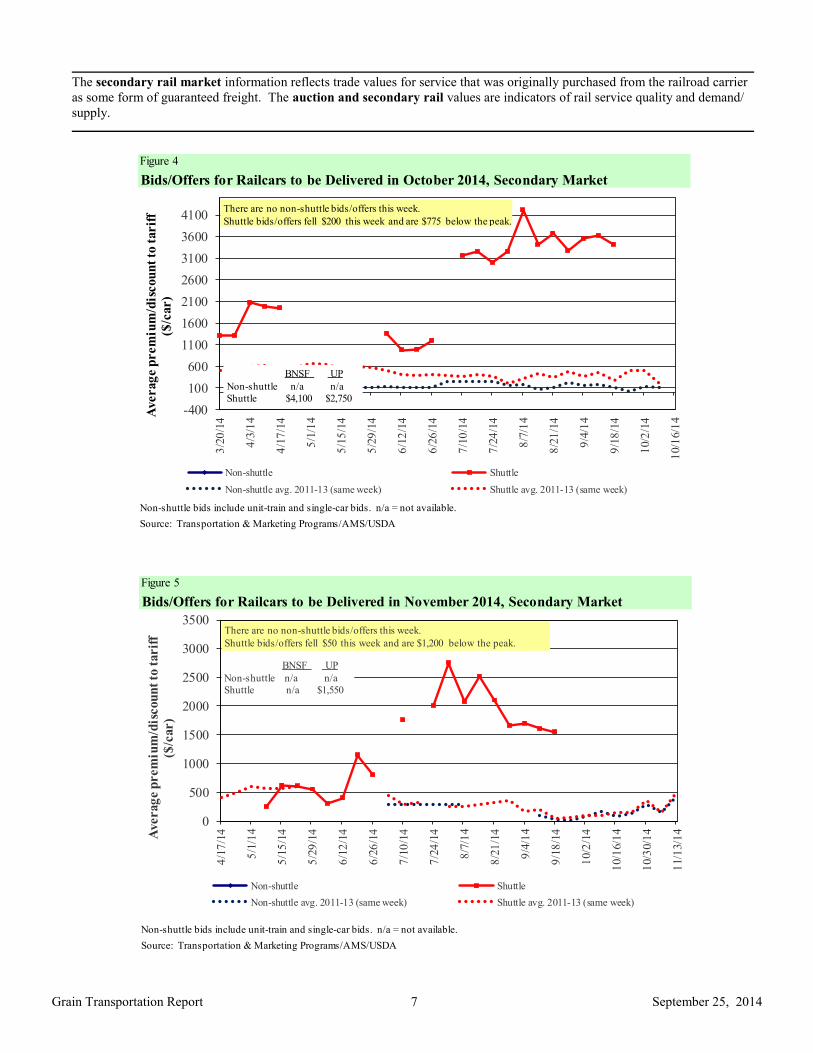
The secondary rail market information reflects trade values for service that was originally purchased from the railroad carrier
as some form of guaranteed freight. The auction and secondary rail values are indicators of rail service quality and demand/
supply.
Figure 5
Bids/Offers for Railcars to be Delivered in November 2014, Secondary Market
Non-shuttle bids include unit-train and single-car bids. n/a = not available.
Source: Transportation & Marketing Programs/AMS/USDA
0
500
1000
1500
2000
2500
3000
3500
4/1
7/1
4
5/1
/14
5/1
5/1
4
5/2
9/1
4
6/1
2/1
4
6/2
6/1
4
7/1
0/1
4
7/2
4/1
4
8/7
/14
8/2
1/1
4
9/4
/14
9/1
8/1
4
10/2
/14
10/1
6/1
4
10/3
0/1
4
11/1
3/1
4
Non-shuttle Shuttle
Non-shuttle avg. 2011-13 (same week) Shuttle avg. 2011-13 (same week)
BNSF UP
Non-shuttle n/a n/a
Shuttle n/a $1,550
Averag
e p
rem
ium
/dis
cou
nt
to t
arif
f ($
/car)
There are no non-shuttle bids/offers this week.
Shuttle bids/offers fell $50 this week and are $1,200 below the peak.
Figure 4
Bids/Offers for Railcars to be Delivered in October 2014, Secondary Market
Non-shuttle bids include unit-train and single-car bids. n/a = not available.
Source: Transportation & Marketing Programs/AMS/USDA
-400
100
600
1100
1600
2100
2600
3100
3600
41003
/20
/14
4/3
/14
4/1
7/1
4
5/1
/14
5/1
5/1
4
5/2
9/1
4
6/1
2/1
4
6/2
6/1
4
7/1
0/1
4
7/2
4/1
4
8/7
/14
8/2
1/1
4
9/4
/14
9/1
8/1
4
10/2
/14
10/1
6/1
4
Non-shuttle Shuttle
Non-shuttle avg. 2011-13 (same week) Shuttle avg. 2011-13 (same week)
BNSF UP
Non-shuttle n/a n/a
Shuttle $4,100 $2,750
Averag
e p
rem
ium
/dis
cou
nt
to t
arif
f ($
/car)
There are no non-shuttle bids/offers this week.
Shuttle bids/offers fell $200 this week and are $775 below the peak.
September 25, 2014
Grain Transportation Report 8
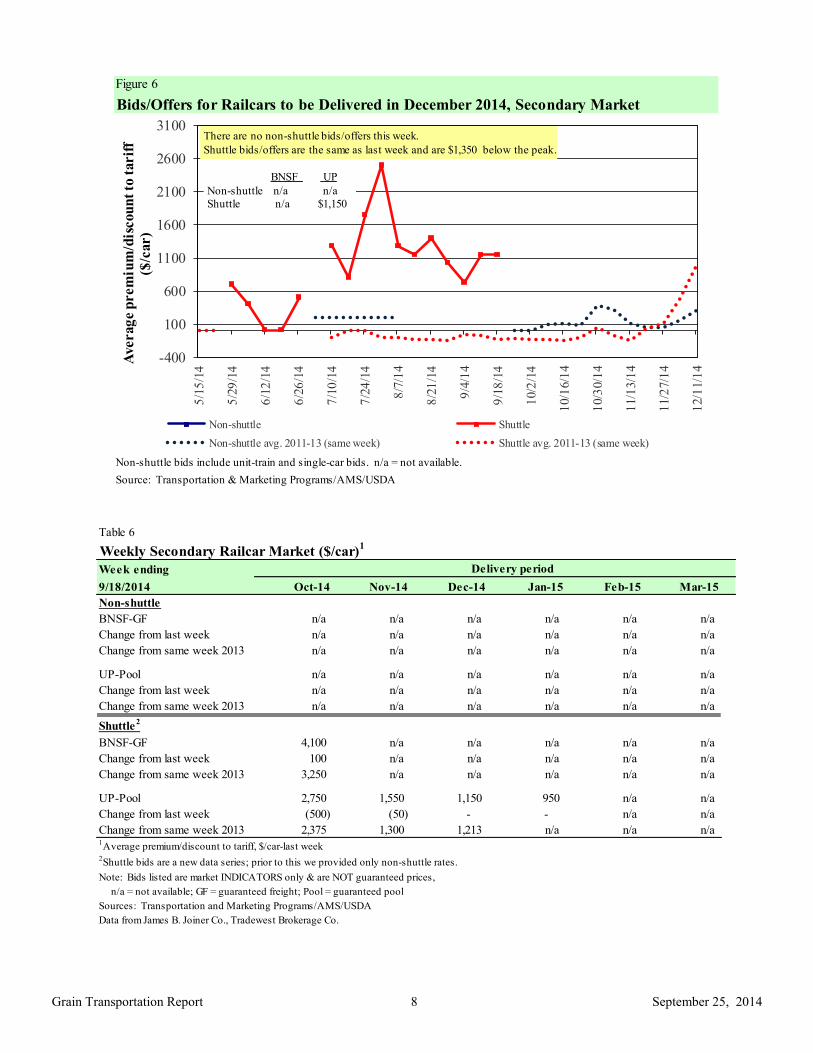
Table 6
Weekly Secondary Railcar Market ($/car)1
Week ending
9/18/2014 Oct-14 Nov-14 Dec-14 Jan-15 Feb-15 Mar-15
Non-shuttle
BNSF-GF n/a n/a n/a n/a n/a n/a
Change from last week n/a n/a n/a n/a n/a n/a
Change from same week 2013 n/a n/a n/a n/a n/a n/a
UP-Pool n/a n/a n/a n/a n/a n/a
Change from last week n/a n/a n/a n/a n/a n/a
Change from same week 2013 n/a n/a n/a n/a n/a n/a
Shuttle2
BNSF-GF 4,100 n/a n/a n/a n/a n/a
Change from last week 100 n/a n/a n/a n/a n/a
Change from same week 2013 3,250 n/a n/a n/a n/a n/a
UP-Pool 2,750 1,550 1,150 950 n/a n/a
Change from last week (500) (50) - - n/a n/a
Change from same week 2013 2,375 1,300 1,213 n/a n/a n/a1Average premium/discount to tariff, $/car-last week
2Shuttle bids are a new data series; prior to this we provided only non-shuttle rates.
Note: Bids listed are market INDICATORS only & are NOT guaranteed prices,
n/a = not available; GF = guaranteed freight; Pool = guaranteed pool
Sources: Transportation and Marketing Programs/AMS/USDA
Data from James B. Joiner Co., Tradewest Brokerage Co.
Delivery period
Figure 6
Bids/Offers for Railcars to be Delivered in December 2014, Secondary Market
Non-shuttle bids include unit-train and single-car bids. n/a = not available.
Source: Transportation & Marketing Programs/AMS/USDA
-400
100
600
1100
1600
2100
2600
3100
5/1
5/1
4
5/2
9/1
4
6/1
2/1
4
6/2
6/1
4
7/1
0/1
4
7/2
4/1
4
8/7
/14
8/2
1/1
4
9/4
/14
9/1
8/1
4
10/2
/14
10/1
6/1
4
10/3
0/1
4
11/1
3/1
4
11/2
7/1
4
12/1
1/1
4
Non-shuttle Shuttle
Non-shuttle avg. 2011-13 (same week) Shuttle avg. 2011-13 (same week)
BNSF UP
Non-shuttle n/a n/a
Shuttle n/a $1,150
Averag
e p
rem
ium
/dis
cou
nt
to t
arif
f
($/c
ar)
There are no non-shuttle bids/offers this week.
Shuttle bids/offers are the same as last week and are $1,350 below the peak.
September 25, 2014
Grain Transportation Report 9
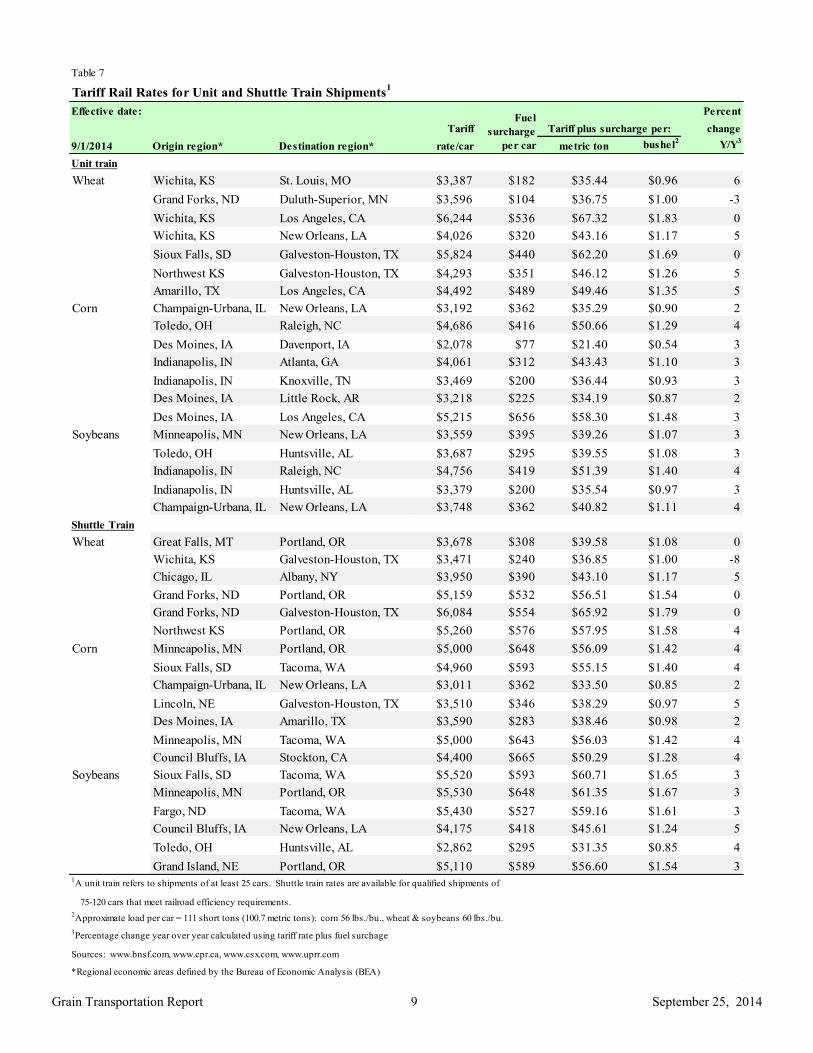
Table 7
Tariff Rail Rates for Unit and Shuttle Train Shipments1
Effective date: Percent
Tariff change
9/1/2014 Origin region* Destination region* rate/car metric ton bushel2
Y/Y3
Unit train
Wheat Wichita, KS St. Louis, MO $3,387 $182 $35.44 $0.96 6
Grand Forks, ND Duluth-Superior, MN $3,596 $104 $36.75 $1.00 -3
Wichita, KS Los Angeles, CA $6,244 $536 $67.32 $1.83 0
Wichita, KS New Orleans, LA $4,026 $320 $43.16 $1.17 5
Sioux Falls, SD Galveston-Houston, TX $5,824 $440 $62.20 $1.69 0
Northwest KS Galveston-Houston, TX $4,293 $351 $46.12 $1.26 5
Amarillo, TX Los Angeles, CA $4,492 $489 $49.46 $1.35 5
Corn Champaign-Urbana, IL New Orleans, LA $3,192 $362 $35.29 $0.90 2
Toledo, OH Raleigh, NC $4,686 $416 $50.66 $1.29 4
Des Moines, IA Davenport, IA $2,078 $77 $21.40 $0.54 3
Indianapolis, IN Atlanta, GA $4,061 $312 $43.43 $1.10 3
Indianapolis, IN Knoxville, TN $3,469 $200 $36.44 $0.93 3
Des Moines, IA Little Rock, AR $3,218 $225 $34.19 $0.87 2
Des Moines, IA Los Angeles, CA $5,215 $656 $58.30 $1.48 3
Soybeans Minneapolis, MN New Orleans, LA $3,559 $395 $39.26 $1.07 3
Toledo, OH Huntsville, AL $3,687 $295 $39.55 $1.08 3
Indianapolis, IN Raleigh, NC $4,756 $419 $51.39 $1.40 4
Indianapolis, IN Huntsville, AL $3,379 $200 $35.54 $0.97 3
Champaign-Urbana, IL New Orleans, LA $3,748 $362 $40.82 $1.11 4
Shuttle Train
Wheat Great Falls, MT Portland, OR $3,678 $308 $39.58 $1.08 0
Wichita, KS Galveston-Houston, TX $3,471 $240 $36.85 $1.00 -8
Chicago, IL Albany, NY $3,950 $390 $43.10 $1.17 5
Grand Forks, ND Portland, OR $5,159 $532 $56.51 $1.54 0
Grand Forks, ND Galveston-Houston, TX $6,084 $554 $65.92 $1.79 0
Northwest KS Portland, OR $5,260 $576 $57.95 $1.58 4
Corn Minneapolis, MN Portland, OR $5,000 $648 $56.09 $1.42 4
Sioux Falls, SD Tacoma, WA $4,960 $593 $55.15 $1.40 4
Champaign-Urbana, IL New Orleans, LA $3,011 $362 $33.50 $0.85 2
Lincoln, NE Galveston-Houston, TX $3,510 $346 $38.29 $0.97 5
Des Moines, IA Amarillo, TX $3,590 $283 $38.46 $0.98 2
Minneapolis, MN Tacoma, WA $5,000 $643 $56.03 $1.42 4
Council Bluffs, IA Stockton, CA $4,400 $665 $50.29 $1.28 4
Soybeans Sioux Falls, SD Tacoma, WA $5,520 $593 $60.71 $1.65 3
Minneapolis, MN Portland, OR $5,530 $648 $61.35 $1.67 3
Fargo, ND Tacoma, WA $5,430 $527 $59.16 $1.61 3
Council Bluffs, IA New Orleans, LA $4,175 $418 $45.61 $1.24 5
Toledo, OH Huntsville, AL $2,862 $295 $31.35 $0.85 4
Grand Island, NE Portland, OR $5,110 $589 $56.60 $1.54 31A unit train refers to shipments of at least 25 cars. Shuttle train rates are available for qualified shipments of
75-120 cars that meet railroad efficiency requirements.
2Approximate load per car = 111 short tons (100.7 metric tons): corn 56 lbs./bu., wheat & soybeans 60 lbs./bu.
3Percentage change year over year calculated using tariff rate plus fuel surchage
Sources: www.bnsf.com, www.cpr.ca, www.csx.com, www.uprr.com
*Regional economic areas defined by the Bureau of Economic Analysis (BEA)
Tariff plus surcharge per:Fuel
surcharge
per car

September 25, 2014
Grain Transportation Report 10
Figure 7
Railroad Fuel Surcharges, North American Weighted Average1
Sources: www.bnsf.com, www.cn.ca, www.cpr.ca, www.csx.com, www.kcsi.com, www.nscorp.com, www.uprr.com
$0.00
$0.10
$0.20
$0.30
$0.40
$0.50
$0.60
$0.70
$0.80
Sep
-12
Oct
-12
Nov
-12
Dec
-12
Jan
-13
Feb
-13
Mar
-13
Ap
r-1
3
May
-13
Jun
-13
Jul-
13
Au
g-1
3
Sep
-13
Oct
-13
Nov
-13
Dec
-13
Jan
-14
Feb
-14
Mar
-14
Ap
r-1
4
May
-14
Jun
-14
Jul-
14
Au
g-1
4
Sep
-14
Dollars
per
railca
r m
ile
Fuel Surcharge* ($/mile/railcar)
3-year Monthly Average
1 Weighted by each Class I railroad's proportion of grain traffic for the prior year.
* Mileage-based fuel surcharges for March and April 2007 are estimated. Beginning January 2009, the Canadian Pacific fuel surcha rge is
computed by a monthly average of the bi-weekly fuel surcharge.
** BNSF strike price (diesel price when fuel surcharges begin) changed from $1.25/gal. to $2.50/gal starting March 1, 2011. As a result, the
weighted average fuel surcharge for March 2011 was $0.227/mile instead of $0.331/mile.
September 2014: $0.318, down 3% from last month's surcharge of $0.326/mile; down 1% from the September
2013 surcharge of $0.319/mile; and up 1% from the September prior 3-year average of $0.314/mile.
$0.318
Table 8
Tariff Rail Rates for U.S. Bulk Grain Shipments to MexicoEffective date: 9/1/2014 Percent
Tariff change
Commodity Destination region rate/car1
metric ton3
bushel3
Y/Y4
Wheat MT Chihuahua, CI $6,460 $563 $71.76 $1.95 1
OK Cuautitlan, EM $6,315 $684 $71.50 $1.94 -5
KS Guadalajara, JA $6,899 $660 $77.24 $2.10 -16
TX Salinas Victoria, NL $3,798 $258 $41.44 $1.13 30
Corn IA Guadalajara, JA $7,974 $777 $89.41 $2.27 3
SD Celaya, GJ $7,656 $736 $85.75 $2.18 4
NE Queretaro, QA $7,353 $690 $82.18 $2.09 3
SD Salinas Victoria, NL $5,880 $560 $65.80 $1.67 3
MO Tlalnepantla, EM $6,712 $670 $75.43 $1.91 2
SD Torreon, CU $6,722 $617 $74.98 $1.90 3
Soybeans MO Bojay (Tula), HG $7,916 $655 $87.58 $2.38 4
NE Guadalajara, JA $8,447 $749 $93.96 $2.55 4
IA El Castillo, JA $8,855 $732 $97.95 $2.66 3
KS Torreon, CU $6,864 $465 $74.88 $2.04 3
Sorghum TX Guadalajara, JA $6,953 $479 $75.94 $1.93 7
NE Celaya, GJ $7,212 $669 $80.51 $2.04 3
KS Queretaro, QA $6,650 $420 $72.24 $1.83 -2
NE Salinas Victoria, NL $5,368 $492 $59.87 $1.52 -1
NE Torreon, CU $6,243 $549 $69.40 $1.76 11Rates are based upon published tariff rates for high-capacity shuttle trains. Shuttle trains are available for qualified
shipments of 75--110 cars that meet railroad efficiency requirements.2Fuel surcharge adjusted to reflect the change in Ferrocarril Mexicano, S.A. de C.V railroad fuel surcharge policy as of 10/01/2009
3Approximate load per car = 97.87 metric tons: Corn & Sorghum 56 lbs/bu, Wheat & Soybeans 60 lbs/bu
4Percentage change year over year calculated using tariff rate plus fuel surchage
Sources: www.bnsf.com, www.uprr.com, www.kcsouthern.com
Fuel
surcharge
per car2
Tariff plus surcharge per:Origin
state
September 25, 2014
Grain Transportation Report 11
Barge Transportation
Calculating barge rate per ton:
(Index * 1976 tariff benchmark rate per ton)/100
Select applicable index from market quotes included in
tables on this page. The 1976 benchmark rates per ton
are provided in map (see figure 9).
Figure 8
Illinois River Barge Freight Rate1,2
1Rate = percent of 1976 tariff benchmark index (1976 = 100 percent);
24-week moving average of the 3-year average.
Source: Transportation & Marketing Programs/AMS/USDA
0
100
200
300
400
500
600
700
800
900
10000
9/2
4/1
3
10/
08/
13
10/
22/
13
11/
05/
13
11/
19/
13
12/
03/
13
12/
17/
13
12/
31/
13
01/
14/
14
01/
28/
14
02/
11/
14
02/
25/
14
03/
11/
14
03/
25/
14
04/
08/
14
04/
22/
14
05/
06/
14
05/
20/
14
06/
03/
14
06/
17/
14
07/
01/
14
07/
15/
14
07/
29/
14
08/
12/
14
08/
26/
14
09/
09/
14
09/
23/
14
Percen
t o
f ta
rif
f
Weekly rate
3-year avg. for the week
Week ending September 23: up 30 percent from last week, up 48 percent
from last year, and up 57 percent from the 3-yr average.
Table 9
Weekly Barge Freight Rates: Southbound Only
Twin
Cities
Mid-
Mississippi
Lower
Illinois
River St. Louis Cincinnati
Lower
Ohio
Cairo-
Memphis
Rate1
9/23/2014 763 829 825 869 896 896 896
9/16/2014 550 583 633 658 692 692 642
$/ton 9/23/2014 47.23 44.10 38.28 34.67 42.02 36.20 28.13
9/16/2014 34.05 31.02 29.37 26.25 32.45 27.96 20.16
Current week % change from the same week:
Last year 37 45 48 47 33 33 45
3-year avg. 2
43 53 57 74 64 64 73-2 6 6
Rate1
October 808 892 900 900 950 950 917
December - - 650 538 617 617 5171Rate = percent of 1976 tariff benchmark index (1976 = 100 percent);
24-week moving average; ton = 2,000 pounds;
Source: Transportation & Marketing Programs/AMS/USDA
September 25, 2014
Grain Transportation Report 12
Figure 10
Barge Movements on the Mississippi River1 (Locks 27 - Granite City, IL)
1 The 3-year average is a 4-week moving average.
Source: U.S. Army Corps of Engineers
0
100
200
300
400
500
600
700
800
900
09/0
7/1
3
09/2
1/1
3
10/0
5/1
3
10/1
9/1
3
11/0
2/1
3
11/1
6/1
3
11/3
0/1
3
12/1
4/1
3
12/2
8/1
3
01/1
1/1
4
01/2
5/1
4
02/0
8/1
4
02/2
2/1
4
03/0
8/1
4
03/2
2/1
4
04/0
5/1
4
04/1
9/1
4
05/0
3/1
4
05/1
7/1
4
05/3
1/1
4
06/1
4/1
4
06/2
8/1
4
07/1
2/1
4
07/2
6/1
4
08/0
9/1
4
08/2
3/1
4
09/0
6/1
4
09/2
0/1
4
10/0
4/1
4
10/1
8/1
4
1,0
00
to
ns
Soybeans
Wheat
Corn
3-Year Average
Week ending September 20: Up 70.4% from last year, and 8.6%
higher than the 3-yr avg
Table 10
Barge Grain Movements (1,000 tons)
Week ending 9/20/2014 Corn Wheat Soybeans Other Total
Mississippi River
Rock Island, IL (L15) 27 5 0 0 32
Winfield, MO (L25) 45 6 0 0 51
Alton, IL (L26) 97 6 0 0 103
Granite City, IL (L27) 130 6 2 0 138
Illinois River (L8) 21 0 0 0 21
Ohio River (L52) 112 0 5 7 125
Arkansas River (L1) 3 45 31 3 81
Weekly total - 2014 245 51 38 10 344
Weekly total - 2013 138 109 36 0 283
2014 YTD1
16,549 2,004 5,285 165 24,003
2013 YTD 5,558 3,712 4,641 143 14,054
2014 as % of 2013 YTD 298 54 114 115 171
Last 4 weeks as % of 20132
370 54 98 952 179
Total 2013 9,504 4,111 10,065 255 23,9351 Weekly total, YTD (year-to-date) and calendar year total includes Miss/27, Ohio/52, and Ark/1; "Other" refers to oats, barley, sorghum, and rye.
2 As a percent of same period in 2013.
Source: U.S. Army Corps of Engineers
Note: Total may not add exactly, due to rounding
September 25, 2014
Grain Transportation Report 13
Figure 11
Source: U.S. Army Corps of Engineers
Upbound Empty Barges Transiting Mississippi River Locks 27, Arkansas River Lock and
Dam 1, and Ohio River Locks and Dam 52
0
100
200
300
400
500
5/2
4/1
4
5/3
1/1
4
6/7
/14
6/1
4/1
4
6/2
1/1
4
6/2
8/1
4
7/5
/14
7/1
2/1
4
7/1
9/1
4
7/2
6/1
4
8/2
/14
8/9
/14
8/1
6/1
4
8/2
3/1
4
8/3
0/1
4
9/6
/14
9/1
3/1
4
9/2
0/1
4
Nu
mbe
r of
Bar
ges
Locks 27 Lock 1 Locks 52
Week ending September 20: 384 total barges, up 177 barges from the previous week, but 8.6 percent below the 3-year avg.
Figure 12
Grain Barges for Export in New Orleans Region
Source: U.S. Army Corps of Engineers and GIPSA
0
100
200
300
400
500
600
700
800
900
1000
3/2
2/1
4
3/2
9/1
4
4/5
/14
4/1
2/1
4
4/1
9/1
4
4/2
6/1
4
5/3
/14
5/1
0/1
4
5/1
7/1
4
5/2
4/1
4
5/3
1/1
4
6/7
/14
6/1
4/1
4
6/2
1/1
4
6/2
8/1
4
7/5
/14
7/1
2/1
4
7/1
9/1
4
7/2
6/1
4
8/2
/14
8/9
/14
8/1
6/1
4
8/2
3/1
4
8/3
0/1
4
9/6
/14
9/1
3/1
4
9/2
0/1
4
Downbound Grain Barges Locks 27, 1, and 52
Grain Barges Unloaded in New Orleans
Nu
mber
of
barg
es
Week ending September 20: 225 grain barges moved down river, up 41.5 percent from the previous week, 699 grain barges were unloaded in New Orleans, up 9.6 percent from the previous week.
September 25, 2014
Grain Transportation Report 14
The weekly diesel price provides a proxy for trends in U.S. truck rates as diesel fuel is a significant expense for truck grain move-
ments.
Truck Transportation
Table 11
Change from
Region Location Price Week ago Year ago
I East Coast 3.804 -0.021 -0.152
New England 3.886 -0.025 -0.185
Central Atlantic 3.886 -0.019 -0.129
Lower Atlantic 3.722 -0.022 -0.168
II Midwest2 3.713 -0.030 -0.216
III Gulf Coast3
3.696 -0.010 -0.166
IV Rocky Mountain 3.841 -0.017 -0.102
V West Coast 3.990 -0.029 -0.121
West Coast less California 3.929 -0.038 -0.066
California 4.041 -0.021 -0.168
Total U.S. 3.778 -0.023 -0.1711Diesel fuel prices include all taxes. Prices represent an average of all types of diesel fuel.
2Same as North Central
3Same as South Central
Source: Energy Information Administration/U.S. Department of Energy (www.eia.doe.gov)
Retail on-Highway Diesel Prices1, Week Ending 9/22/2013 (US $/gallon)
Figure 13
Weekly Diesel Fuel Prices, U.S. Average
Source: Retail On-Highway Diesel Prices, Energy Information Administration, Dept. of Energy
3.0
3.5
4.0
4.5
03/
24/
14
03/
31/
14
04/
07/
14
04/
14/
14
04/
21/
14
04/
28/
14
05/
05/
14
05/
12/
14
05/
19/
14
05/
26/
14
06/
02/
14
06/
09/
14
06/
16/
14
06/
23/
14
06/
30/
14
07/
07/
14
07/
14/
14
07/
21/
14
07/
28/
14
08/
04/
14
08/
11/
14
08/
18/
14
08/
25/
14
09/
01/
14
09/
08/
14
09/
15/
14
09/
22/
14
Last year Current Year
$ p
er
gal
lon
Week ending September 22: Down 2 cent from the previous week
and 17 cents lower than the same week last year.
September 25, 2014
Grain Transportation Report 15
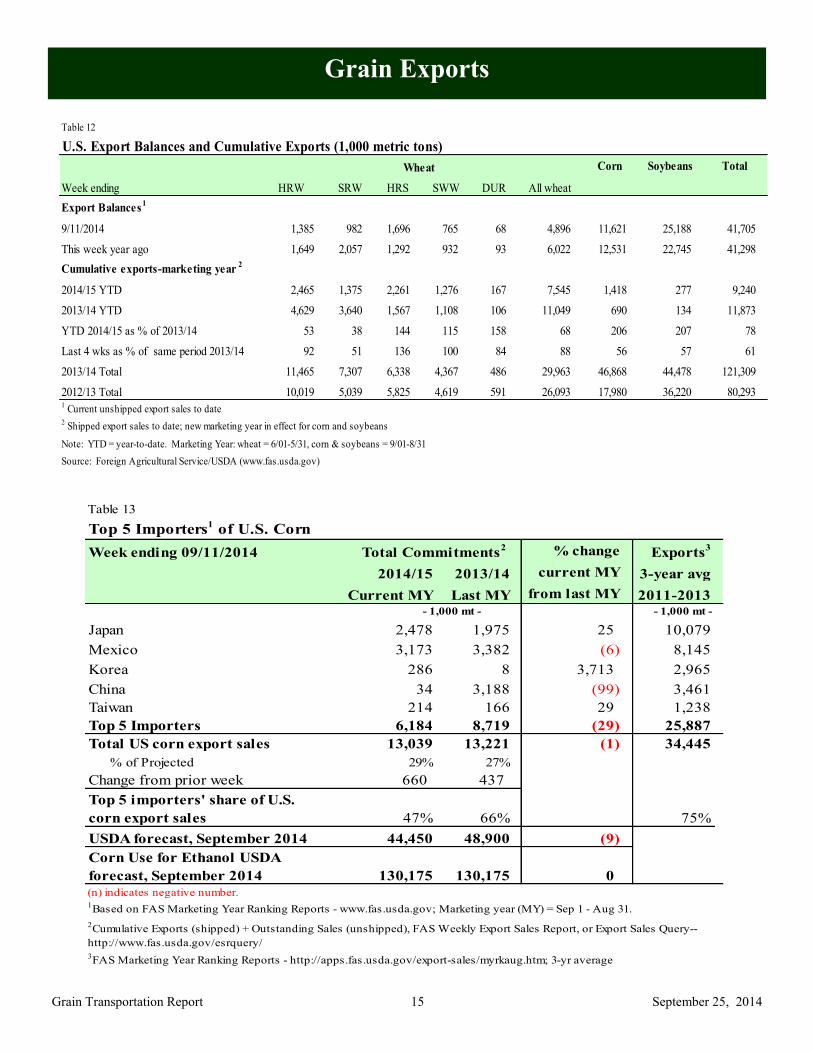
Grain Exports
Table 12
U.S. Export Balances and Cumulative Exports (1,000 metric tons)
Wheat Corn Soybeans Total
Week ending HRW SRW HRS SWW DUR All wheat
Export Balances1
9/11/2014 1,385 982 1,696 765 68 4,896 11,621 25,188 41,705
This week year ago 1,649 2,057 1,292 932 93 6,022 12,531 22,745 41,298
Cumulative exports-marketing year 2
2014/15 YTD 2,465 1,375 2,261 1,276 167 7,545 1,418 277 9,240
2013/14 YTD 4,629 3,640 1,567 1,108 106 11,049 690 134 11,873
YTD 2014/15 as % of 2013/14 53 38 144 115 158 68 206 207 78
Last 4 wks as % of same period 2013/14 92 51 136 100 84 88 56 57 61
2013/14 Total 11,465 7,307 6,338 4,367 486 29,963 46,868 44,478 121,309
2012/13 Total 10,019 5,039 5,825 4,619 591 26,093 17,980 36,220 80,2931 Current unshipped export sales to date
2 Shipped export sales to date; new marketing year in effect for corn and soybeans
Note: YTD = year-to-date. Marketing Year: wheat = 6/01-5/31, corn & soybeans = 9/01-8/31
Source: Foreign Agricultural Service/USDA (www.fas.usda.gov)
Table 13
Top 5 Importers1 of U.S. Corn
Week ending 09/11/2014 % change
Exports3
2014/15 2013/14 current MY 3-year avg
Current MY Last MY from last MY 2011-2013 - 1,000 mt -
Japan 2,478 1,975 25 10,079
Mexico 3,173 3,382 (6) 8,145
Korea 286 8 3,713 2,965
China 34 3,188 (99) 3,461
Taiwan 214 166 29 1,238
Top 5 Importers 6,184 8,719 (29) 25,887
Total US corn export sales 13,039 13,221 (1) 34,445
% of Projected 29% 27%
Change from prior week 660 437
Top 5 importers' share of U.S.
corn export sales 47% 66% 75%
USDA forecast, September 2014 44,450 48,900 (9)
Corn Use for Ethanol USDA
forecast, September 2014 130,175 130,175 0
1Based on FAS Marketing Year Ranking Reports - www.fas.usda.gov; Marketing year (MY) = Sep 1 - Aug 31.
Total Commitments2
- 1,000 mt -
3FAS Marketing Year Ranking Reports - http://apps.fas.usda.gov/export-sales/myrkaug.htm; 3-yr average
2Cumulative Exports (shipped) + Outstanding Sales (unshipped), FAS Weekly Export Sales Report, or Export Sales Query--
http://www.fas.usda.gov/esrquery/
(n) indicates negative number.
September 25, 2014
Grain Transportation Report 16
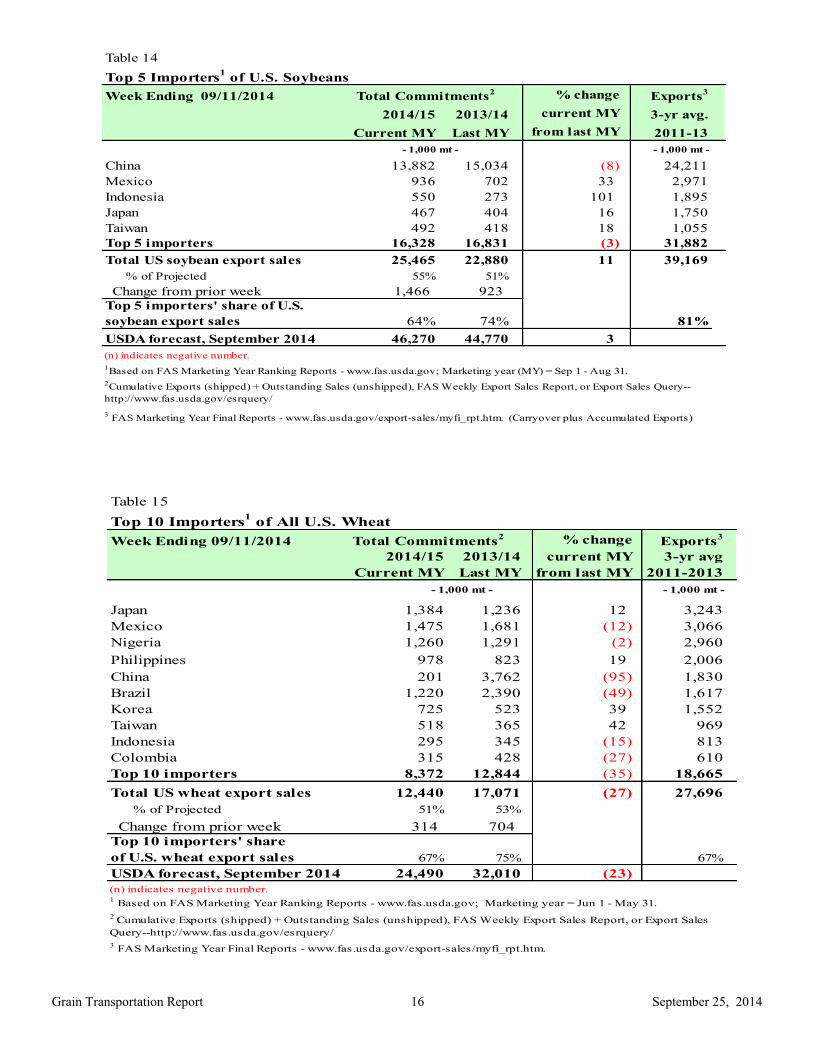
Table 15
Top 10 Importers1 of All U.S. Wheat
Week Ending 09/11/2014 % change
Exports3
2014/15 2013/14 current MY 3-yr avg
Current MY Last MY from last MY 2011-2013
- 1,000 mt -
Japan 1,384 1,236 12 3,243
Mexico 1,475 1,681 (12) 3,066
Nigeria 1,260 1,291 (2) 2,960
Philippines 978 823 19 2,006
China 201 3,762 (95) 1,830
Brazil 1,220 2,390 (49) 1,617
Korea 725 523 39 1,552
Taiwan 518 365 42 969
Indonesia 295 345 (15) 813
Colombia 315 428 (27) 610
Top 10 importers 8,372 12,844 (35) 18,665
Total US wheat export sales 12,440 17,071 (27) 27,696
% of Projected 51% 53%
Change from prior week 314 704
Top 10 importers' share
of U.S. wheat export sales 67% 75% 67%
USDA forecast, September 2014 24,490 32,010 (23)
1 Based on FAS Marketing Year Ranking Reports - www.fas.usda.gov; Marketing year = Jun 1 - May 31.
Total Commitments2
3 FAS Marketing Year Final Reports - www.fas.usda.gov/export-sales/myfi_rpt.htm.
(n) indicates negative number.
2 Cumulative Exports (shipped) + Outstanding Sales (unshipped), FAS Weekly Export Sales Report, or Export Sales
Query--http://www.fas.usda.gov/esrquery/
- 1,000 mt -
Table 14
Top 5 Importers1 of U.S. Soybeans
Week Ending 09/11/2014 % change
Exports3
2014/15 2013/14 current MY 3-yr avg.
Current MY Last MY from last MY 2011-13
- 1,000 mt -
China 13,882 15,034 (8) 24,211
Mexico 936 702 33 2,971
Indonesia 550 273 101 1,895
Japan 467 404 16 1,750
Taiwan 492 418 18 1,055
Top 5 importers 16,328 16,831 (3) 31,882
Total US soybean export sales 25,465 22,880 11 39,169
% of Projected 55% 51%
Change from prior week 1,466 923
Top 5 importers' share of U.S.
soybean export sales 64% 74% 81%
USDA forecast, September 2014 46,270 44,770 3
1Based on FAS Marketing Year Ranking Reports - www.fas.usda.gov; Marketing year (MY) = Sep 1 - Aug 31.
Total Commitments2
- 1,000 mt -
3 FAS Marketing Year Final Reports - www.fas.usda.gov/export-sales/myfi_rpt.htm. (Carryover plus Accumulated Exports)
(n) indicates negative number.
2Cumulative Exports (shipped) + Outstanding Sales (unshipped), FAS Weekly Export Sales Report, or Export Sales Query--
http://www.fas.usda.gov/esrquery/
September 25, 2014
Grain Transportation Report 17
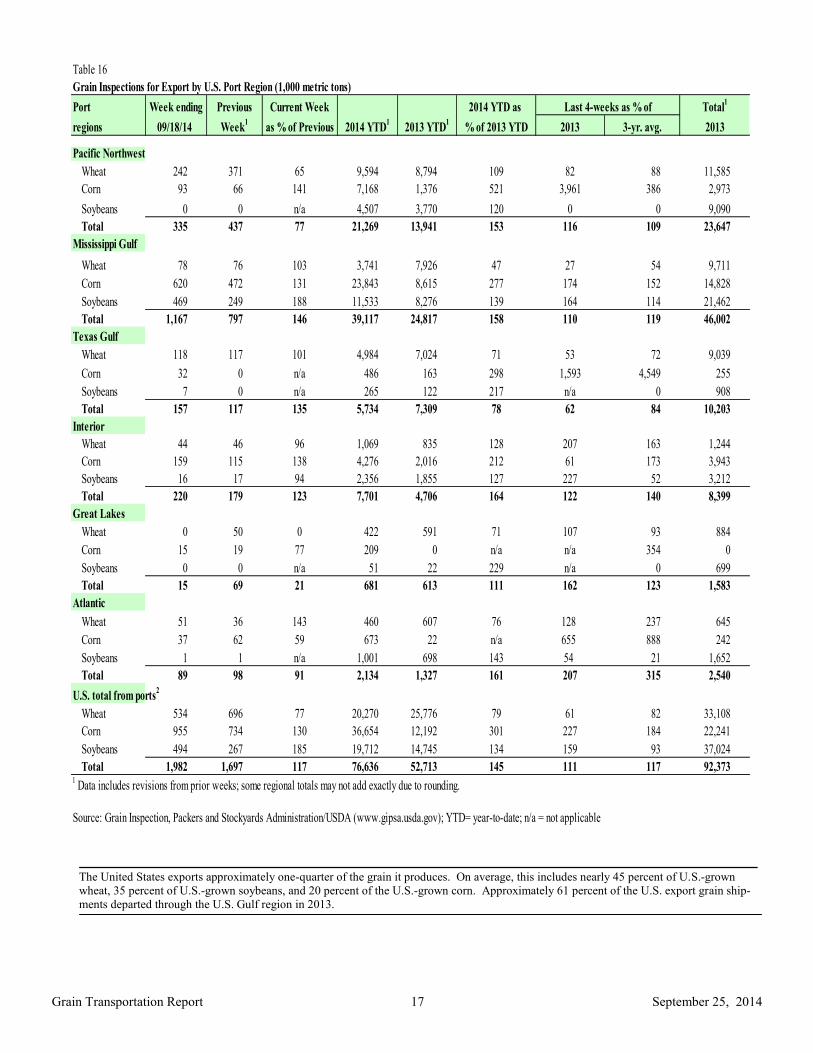
The United States exports approximately one-quarter of the grain it produces. On average, this includes nearly 45 percent of U.S.-grown
wheat, 35 percent of U.S.-grown soybeans, and 20 percent of the U.S.-grown corn. Approximately 61 percent of the U.S. export grain ship-
ments departed through the U.S. Gulf region in 2013.
Table 16
Grain Inspections for Export by U.S. Port Region (1,000 metric tons)
Port Week ending Previous Current Week 2014 YTD as Total1
regions 09/18/14 Week1
as % of Previous 2014 YTD1
2013 YTD1
% of 2013 YTD 2013 3-yr. avg. 2013
Pacific Northwest
Wheat 242 371 65 9,594 8,794 109 82 88 11,585
Corn 93 66 141 7,168 1,376 521 3,961 386 2,973
Soybeans 0 0 n/a 4,507 3,770 120 0 0 9,090
Total 335 437 77 21,269 13,941 153 116 109 23,647
Mississippi Gulf
Wheat 78 76 103 3,741 7,926 47 27 54 9,711
Corn 620 472 131 23,843 8,615 277 174 152 14,828
Soybeans 469 249 188 11,533 8,276 139 164 114 21,462
Total 1,167 797 146 39,117 24,817 158 110 119 46,002
Texas Gulf
Wheat 118 117 101 4,984 7,024 71 53 72 9,039
Corn 32 0 n/a 486 163 298 1,593 4,549 255
Soybeans 7 0 n/a 265 122 217 n/a 0 908
Total 157 117 135 5,734 7,309 78 62 84 10,203
Interior
Wheat 44 46 96 1,069 835 128 207 163 1,244
Corn 159 115 138 4,276 2,016 212 61 173 3,943
Soybeans 16 17 94 2,356 1,855 127 227 52 3,212
Total 220 179 123 7,701 4,706 164 122 140 8,399
Great Lakes
Wheat 0 50 0 422 591 71 107 93 884
Corn 15 19 77 209 0 n/a n/a 354 0
Soybeans 0 0 n/a 51 22 229 n/a 0 699
Total 15 69 21 681 613 111 162 123 1,583
Atlantic
Wheat 51 36 143 460 607 76 128 237 645
Corn 37 62 59 673 22 n/a 655 888 242
Soybeans 1 1 n/a 1,001 698 143 54 21 1,652
Total 89 98 91 2,134 1,327 161 207 315 2,540
U.S. total from ports2
Wheat 534 696 77 20,270 25,776 79 61 82 33,108
Corn 955 734 130 36,654 12,192 301 227 184 22,241
Soybeans 494 267 185 19,712 14,745 134 159 93 37,024
Total 1,982 1,697 117 76,636 52,713 145 111 117 92,3731 Data includes revisions from prior weeks; some regional totals may not add exactly due to rounding.
Source: Grain Inspection, Packers and Stockyards Administration/USDA (www.gipsa.usda.gov); YTD= year-to-date; n/a = not applicable
Last 4-weeks as % of
September 25, 2014
Grain Transportation Report 18
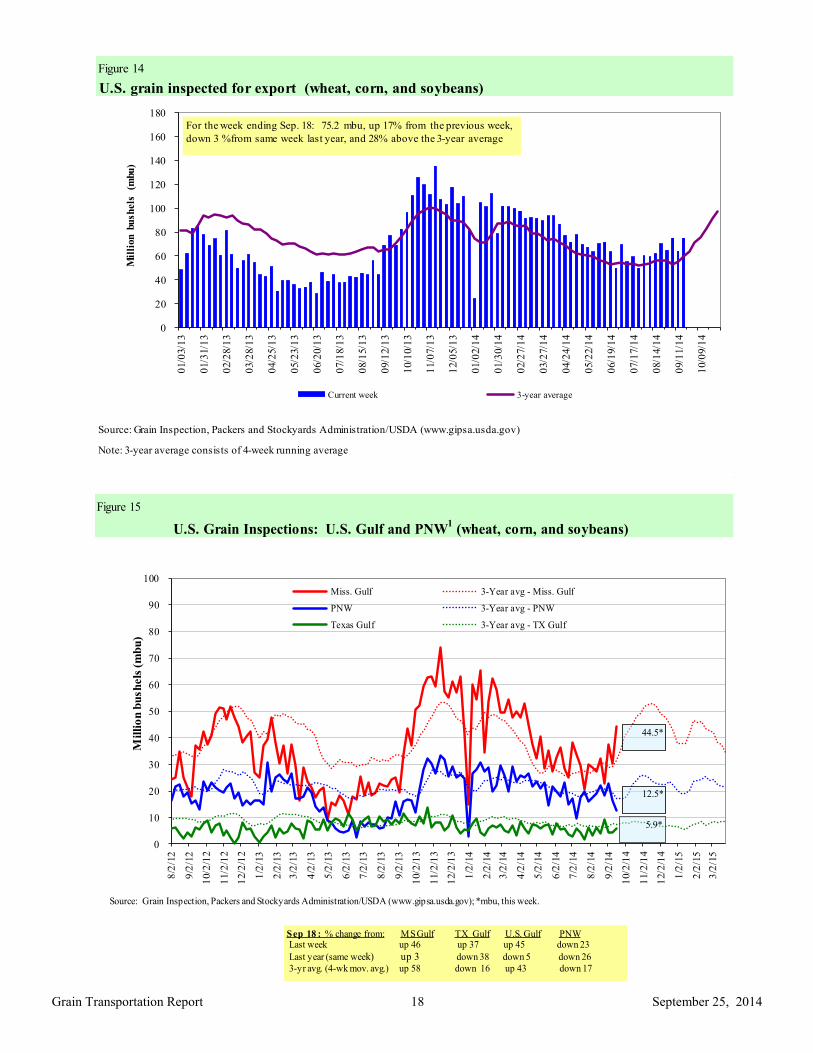
Figure 14
U.S. grain inspected for export (wheat, corn, and soybeans)
Source: Grain Inspection, Packers and Stockyards Administration/USDA (www.gipsa.usda.gov)
Note: 3-year average consists of 4-week running average
0
20
40
60
80
100
120
140
160
180
01/
03/
13
01/
31/
13
02/
28/
13
03/
28/
13
04/
25/
13
05/
23/
13
06/
20/
13
07/
18/
13
08/
15/
13
09/
12/
13
10/
10/
13
11/
07/
13
12/
05/
13
01/
02/
14
01/
30/
14
02/2
7/1
4
03/2
7/1
4
04/2
4/1
4
05/2
2/1
4
06/1
9/1
4
07/1
7/1
4
08/1
4/1
4
09/1
1/1
4
10/0
9/1
4
Mil
lion
bu
sh
els
(m
bu
)
Current week 3-year average
For the week ending Sep. 18: 75.2 mbu, up 17% from the previous week,
down 3 %from same week last year, and 28% above the 3-year average
Figure 15
U.S. Grain Inspections: U.S. Gulf and PNW1 (wheat, corn, and soybeans)
0
10
20
30
40
50
60
70
80
90
100
8/2
/12
9/2
/12
10/2
/12
11/2
/12
12/2
/12
1/2
/13
2/2
/13
3/2
/13
4/2
/13
5/2
/13
6/2
/13
7/2
/13
8/2
/13
9/2
/13
10/2
/13
11/2
/13
12/2
/13
1/2
/14
2/2
/14
3/2
/14
4/2
/14
5/2
/14
6/2
/14
7/2
/14
8/2
/14
9/2
/14
10/2
/14
11/2
/14
12/2
/14
1/2
/15
2/2
/15
3/2
/15
Mil
lio
n b
ush
els
(m
bu
)
Miss. Gulf 3-Year avg - Miss. Gulf
PNW 3-Year avg - PNW
Texas Gulf 3-Year avg - TX Gulf
5.9*
44.5*
12.5*
Source: Grain Inspection, Packers and Stockyards Administration/USDA (www.gipsa.usda.gov); *mbu, this week.
Sep 18 : % change from: MS Gulf TX Gulf U.S. Gulf PNWLast week up 46 up 37 up 45 down 23
Last year (same week) up 3 down 38 down 5 down 26
3-yr avg. (4-wk mov. avg.) up 58 down 16 up 43 down 17
September 25, 2014
Grain Transportation Report 19
Ocean Transportation
Table 17
Weekly Port Region Grain Ocean Vessel Activity (number of vessels)
Pacific Vancouver
Gulf Northwest B.C.
Loaded Due next
Date In port 7-days 10-days In port In port
9/18/2014 33 29 60 11 n/a
9/11/2014 20 36 62 9 n/a
2013 range (16..60) (20..56) (31..81) (0..24) n/a
2013 avg. 32 33 51 12 n/a
Source: Transportation & Marketing Programs/AMS/USDA
Figure 16
U.S. Gulf1 Vessel Loading Activity
0
10
20
30
40
50
60
70
80
90
100
05/0
1/2
01
4
05/0
8/2
01
4
05/1
5/2
01
4
05/2
2/2
01
4
05/2
9/2
01
4
06/0
5/2
01
4
06/1
2/2
01
4
06/1
9/2
01
4
06/2
6/2
01
4
07/0
3/2
01
4
07/1
0/2
01
4
07/1
7/2
01
4
07/2
4/2
01
4
07/3
1/2
01
4
08/0
7/2
01
4
08/1
4/2
01
4
08/2
1/2
01
4
08/2
8/2
01
4
09/0
4/2
01
4
09/1
1/2
01
4
09/1
8/2
01
4
Nu
mb
er o
f v
esse
ls
Loaded Last 7 Days Due Next 10 days Loaded 4 Year Average
Source:Transportation & Marketing Programs/AMS/USDA1U.S. Gulf includes Mississippi, Texas, and East Gulf.
Week ending September 18 Loaded Due Change from last year -32.6% -7.7%
Change from 4-year avg. -28.8% 3.9%
September 25, 2014
Grain Transportation Report 20
Figure 17
Grain Vessel Rates, U.S. to Japan
Data Source: O'Neil Commodity Consulting
0
10
20
30
40
50
60
70
Aug
. 12
Oct
. 1
2
Dec
. 1
2
Feb
. 13
Apr
. 13
Jun
e 13
Aug
. 13
Oct
. 1
3
Dec
. 1
3
Feb
. 14
Apr
. 14
Jun
e 14
Aug
. 14
US
$/m
etri
c to
n
Spread Gulf vs. PNW to Japan Rate Gulf to Japan Rate PNW to Japan
Gulf PNW Spread
Ocean rates for August '14 $43.20 $24.05 $19.15
Change from August '13 -5.1% -1.6% -9.0%
Change from 4-year avg. -17.8% -17.1% -18.8%
Table 18
Ocean Freight Rates For Selected Shipments, Week Ending 09/20/2014
Export Import Grain Loading Volume loads Freight rate
region region types date (metric tons) (US$/metric ton)
U.S. Gulf China Heavy Grain Oct 10/20 60,000 45.00
U.S. Gulf China Heavy Grain Oct 1/10 57,000 45.50
U.S. Gulf China Heavy Grain Oct 1/10 60,000 45.50
U.S. Gulf China Heavy Grain Sep 20/ Oct 10 55,000 45.25
U.S. Gulf Djibouti1
Sorghum Sep 10/24 24,000 106.41
U.S. Gulf Mexico Heavy Grain Aug 2/6 33,000 11.25
PNW China Heavy Grain Nov 1/30 60,000 26.50
PNW Philippines Grain Aug 1/15 65,000 22.50
Brazil China Heavy Grain Sep 1/10 60,000 34.00
Brazil China Grain Aug 20/30 60,000 31.50
Brazil China Grain Aug 10/31 60,000 33.25
Brazil China Grain Aug 1/30 65,000 35.50
Germany Iran Wheat Aug 20/Sep 8 65,000 35.00
River Plate China Heavy Grain Aug 1/31 60,000 44.50
River Plate Philippines Soybeanmeal Sep 20/27 40,000 40.00
Rates shown are for metric ton (2,204.62 lbs. = 1 metric ton), F.O.B., except where otherwise indicates; op = option
150 percent of food aid from the United States is required to be shipped on U.S.-flag vessels.
Source: Maritime Research Inc. (www.maritime-research.com)
5/15
September 25, 2014
Grain Transportation Report 21
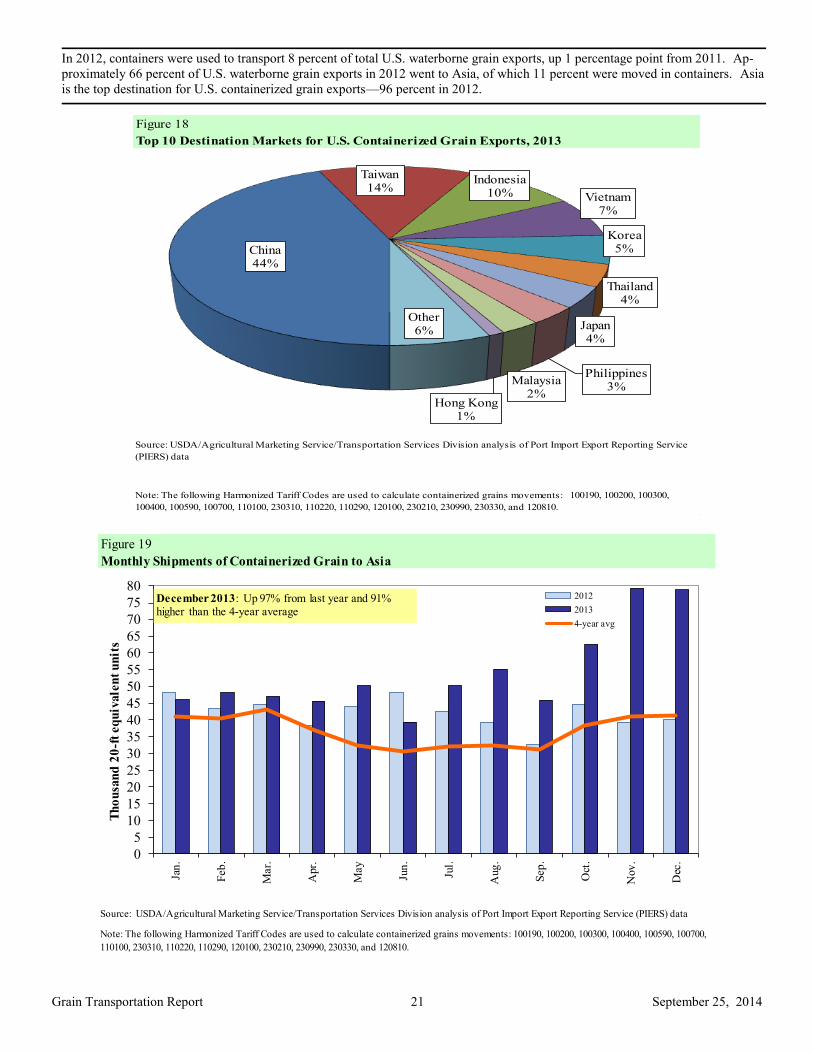
In 2012, containers were used to transport 8 percent of total U.S. waterborne grain exports, up 1 percentage point from 2011. Ap-
proximately 66 percent of U.S. waterborne grain exports in 2012 went to Asia, of which 11 percent were moved in containers. Asia
is the top destination for U.S. containerized grain exports—96 percent in 2012.
Figure 18
Top 10 Destination Markets for U.S. Containerized Grain Exports, 2013
Source: USDA/Agricultural Marketing Service/Transportation Services Division analysis of Port Import Export Reporting Service
(PIERS) data
Note: The following Harmonized Tariff Codes are used to calculate containerized grains movements: 100190, 100200, 100300,
100400, 100590, 100700, 110100, 230310, 110220, 110290, 120100, 230210, 230990, 230330, and 120810.
China44%
Taiwan14%
Indonesia10% Vietnam
7%
Korea5%
Thailand4%
Japan4%
Philippines3%
Malaysia2%
Hong Kong1%
Other6%
Figure 19
Monthly Shipments of Containerized Grain to Asia
Source: USDA/Agricultural Marketing Service/Transportation Services Division analysis of Port Import Export Reporting Service (PIERS) data
Note: The following Harmonized Tariff Codes are used to calculate containerized grains movements: 100190, 100200, 100300, 100400, 100590, 100700,
110100, 230310, 110220, 110290, 120100, 230210, 230990, 230330, and 120810.
0
5
10
15
20
25
30
35
40
45
50
55
60
65
70
75
80
Jan
.
Feb
.
Mar.
Apr.
May
Jun
.
Jul.
Aug
.
Sep
.
Oct
.
Nov
.
Dec
.
Th
ou
san
d 2
0-f
t eq
uiv
ale
nt
un
its
2012
2013
4-year avg
December 2013: Up 97% from last year and 91%higher than the 4-year average
September 25, 2014
Grain Transportation Report 22
Coordinators
Surajudeen (Deen) Olowolayemo [email protected] (202) 720 - 0119
Pierre Bahizi [email protected] (202) 690 - 0992
Adam Sparger [email protected] (202) 205 - 8701
Weekly Highlight Editors
Marina Denicoff [email protected] (202) 690 - 3244
Surajudeen (Deen) Olowolayemo [email protected] (202) 720 - 0119
April Taylor [email protected] (202) 295 - 7374
Nicholas Marathon [email protected] (202) 690 - 4430
Grain Transportation Indicators
Surajudeen (Deen) Olowolayemo [email protected] (202) 720 - 0119
Rail Transportation
Marvin Prater [email protected] (540) 361 - 1147
Johnny Hill [email protected] (202) 690 - 3295
Adam Sparger [email protected] (202) 205 - 8701
Barge Transportation
Nicholas Marathon [email protected] (202) 690 - 4430
April Taylor [email protected] (202) 295 - 7374
Truck Transportation
April Taylor [email protected] (202) 295 - 7374
Grain Exports
Johnny Hill [email protected] (202) 690 - 3295
Marina Denicoff [email protected] (202) 690 - 3244
Ocean Transportation
Surajudeen (Deen) Olowolayemo [email protected] (202) 720 - 0119
(Freight rates and vessels)
April Taylor [email protected] (202) 295 - 7374
(Container movements)
Subscription Information: Send relevant information to [email protected] for an electronic copy
(printed copies are also available upon request).
Preferred citation: U.S. Dept. of Agriculture, Agricultural Marketing Service. Grain Transportation Report.
September 25, 2014. Web: http://dx.doi.org/10.9752/TS056.09-25-2014
Contacts and Links
The U.S. Department of Agriculture (USDA) prohibits discrimination in all of its programs and activities on the basis of race, color, national origin, age, disability, and where applicable, sex (including gender identity and expression), marital status, familial status, parental status, religion, sexual orientation, political beliefs,
genetic information, reprisal, or because all or part of an individual's income is derived from any public assistance program. (Not all prohibited bases apply to all
programs.) Persons with disabilities who require alternative means for communication of program information (Braille, large print, audiotape, etc.) should contact USDA's TARGET Center at (202) 720-2600 (voice and TDD).