Embed Size (px)
Citation preview
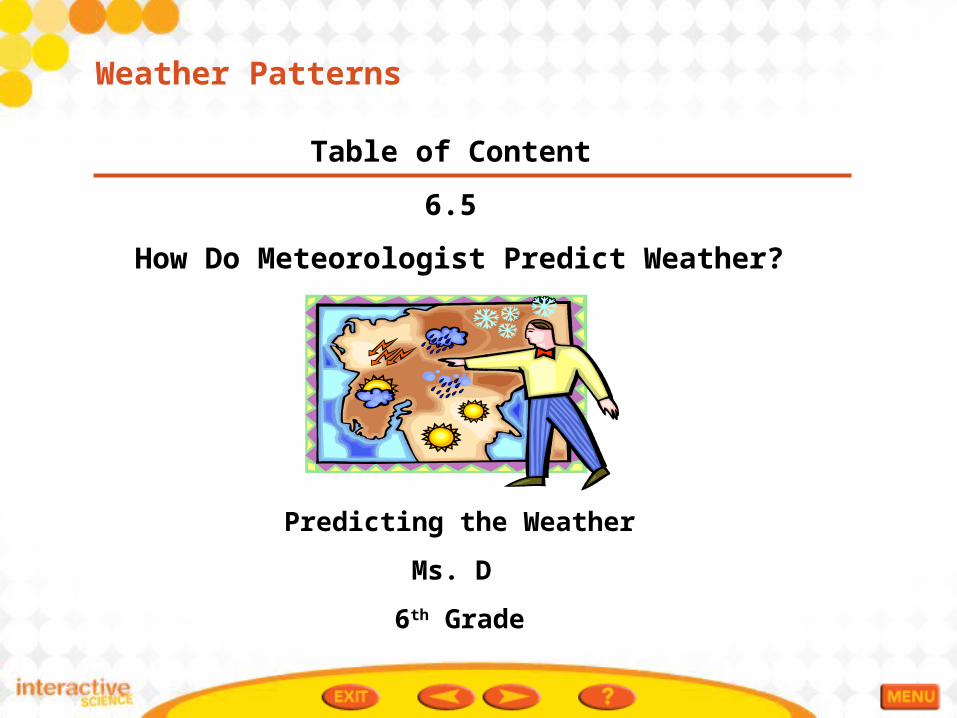
Table of Content
6.5
How Do Meteorologist Predict Weather?
Predicting the Weather
Ms. D
6th Grade
Weather Patterns
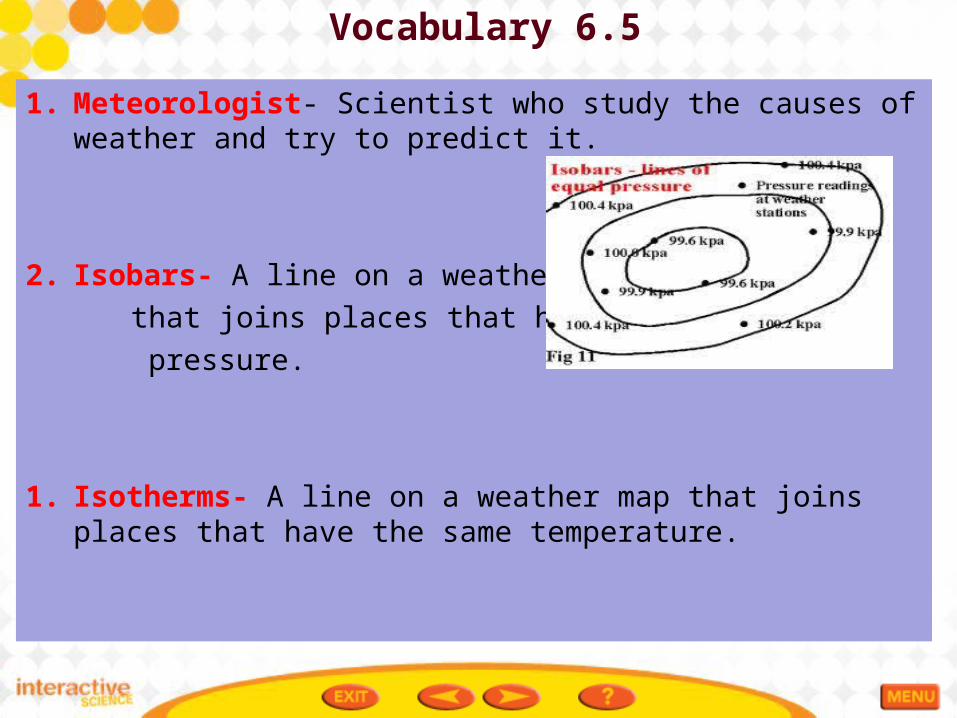
Vocabulary 6.5
1. Meteorologist- Scientist who study the causes of weather and try to predict it.
2. Isobars- A line on a weather map
that joins places that have the same
pressure.
1. Isotherms- A line on a weather map that joins places that have the same temperature.
Predicting the Weather pg. 217
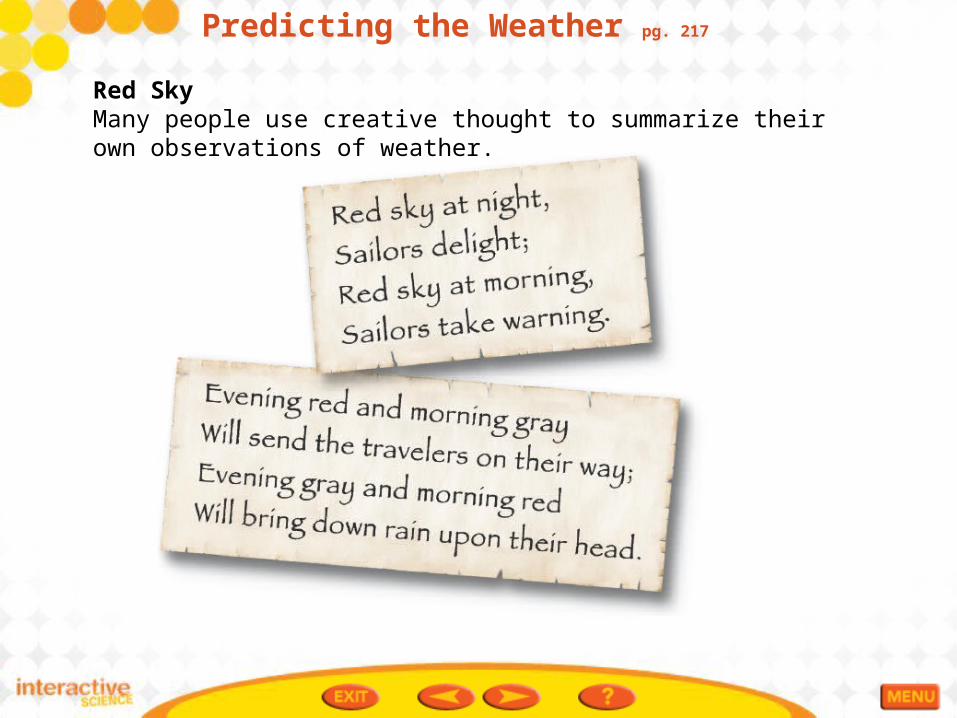
Red SkyMany people use creative thought to summarize their own observations of weather.
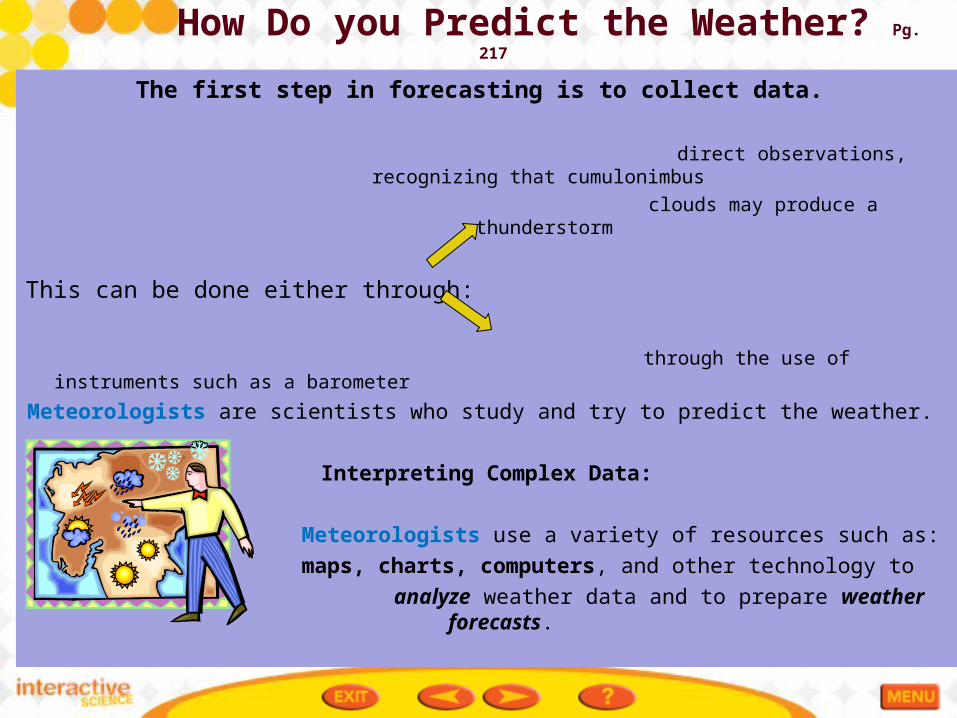
How Do you Predict the Weather? Pg. 217
The first step in forecasting is to collect data.
direct observations, recognizing that cumulonimbus
clouds may produce a thunderstorm
This can be done either through:
through the use of instruments such as a barometer
Meteorologists are scientists who study and try to predict the weather.
Interpreting Complex Data:
Meteorologists use a variety of resources such as:
maps, charts, computers, and other technology to
analyze weather data and to prepare weather forecasts.
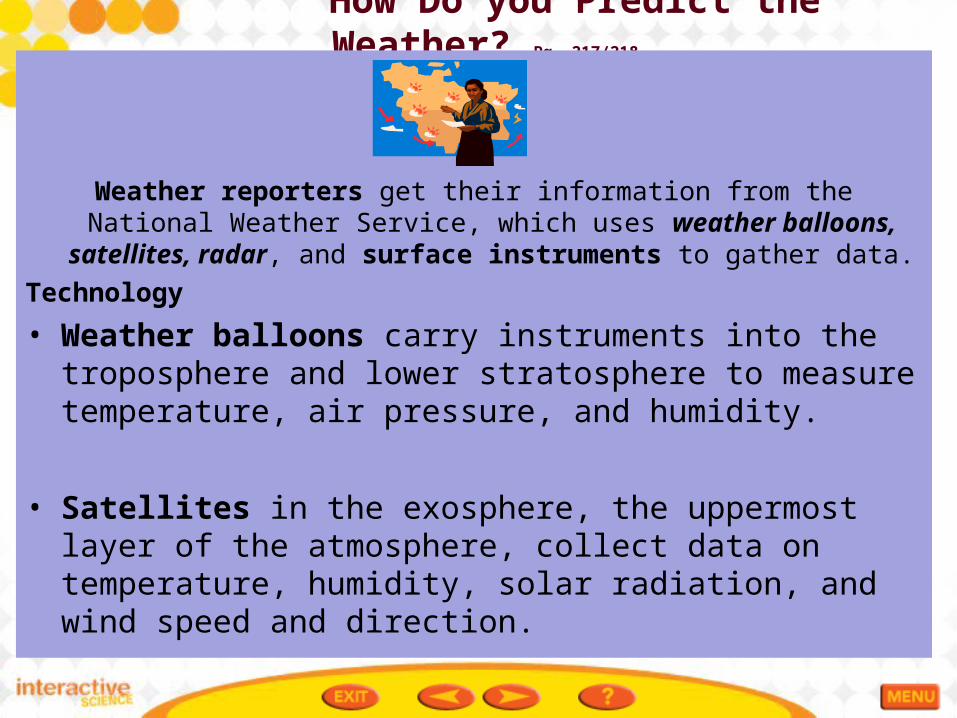
How Do you Predict the Weather? Pg. 217/218
Weather reporters get their information from the National Weather Service, which uses weather balloons, satellites, radar, and surface
instruments to gather data.
Technology
• Weather balloons carry instruments into the troposphere and lower stratosphere to measure temperature, air pressure, and humidity.
• Satellites in the exosphere, the uppermost layer of the atmosphere, collect data on temperature, humidity, solar radiation, and wind speed and direction.
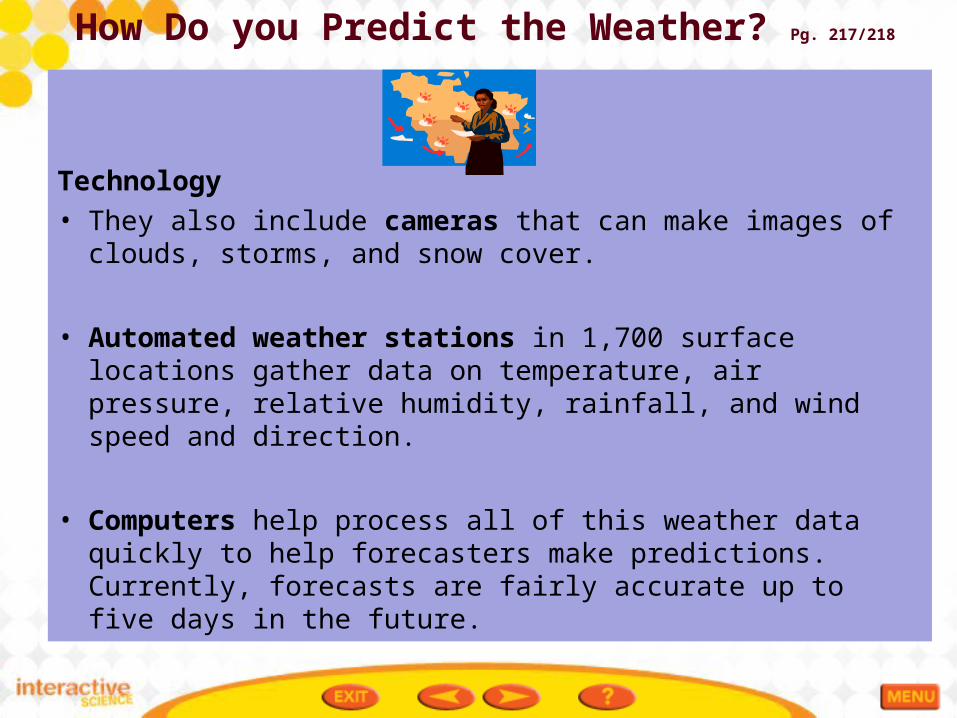
How Do you Predict the Weather? Pg. 217/218
Technology• They also include cameras that can make images of
clouds, storms, and snow cover.
• Automated weather stations in 1,700 surface locations gather data on temperature, air pressure, relative humidity, rainfall, and wind speed and direction.
• Computers help process all of this weather data quickly to help forecasters make predictions. Currently, forecasts are fairly accurate up to five days in the future.
What Can You Learn From Weather Maps? Pg. 219
The National Weather Service maintains weather maps that are snapshots of conditions at a particular time over a large area.
• Some show curved lines that connect places where certain conditions are the same. Isobars (-bar as in barometer) are lines joining places on the map that have the same air pressure. (These readings may be given in inches of mercury or in millibars.)
• Isotherms are lines joining places that have the same temperature. They may be labeled in degrees Fahrenheit, degrees Celsius, or both.
Standard symbols on weather maps show fronts, areas of high and low pressure, types of precipitation, and temperatures.
Predicting the Weather pg. 219
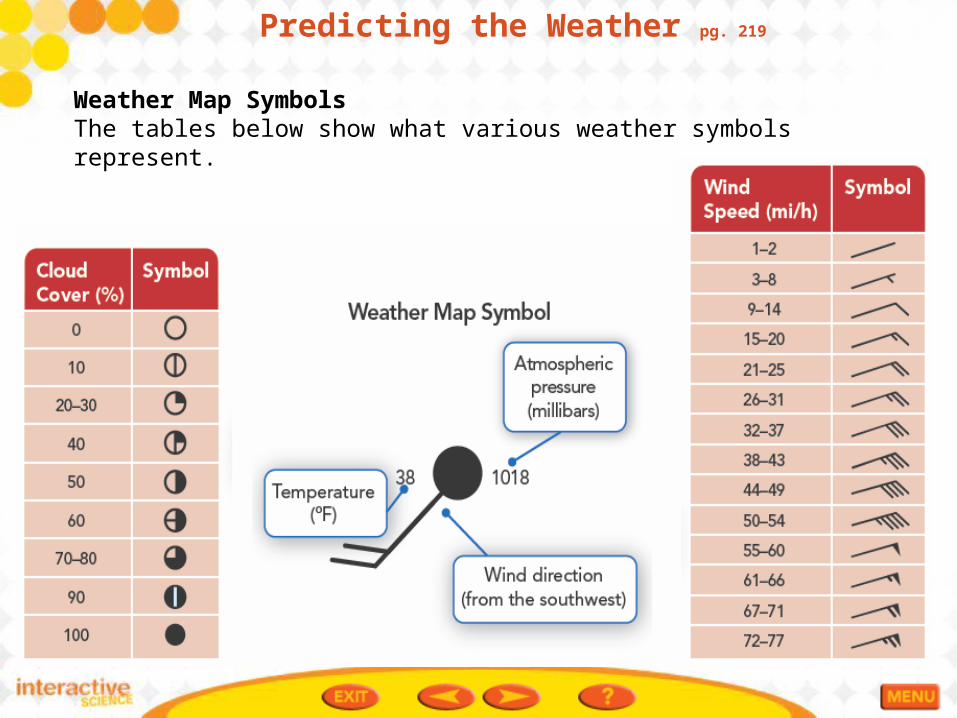
Weather Map SymbolsThe tables below show what various weather symbols represent.
Predicting the WeatherPg. 220
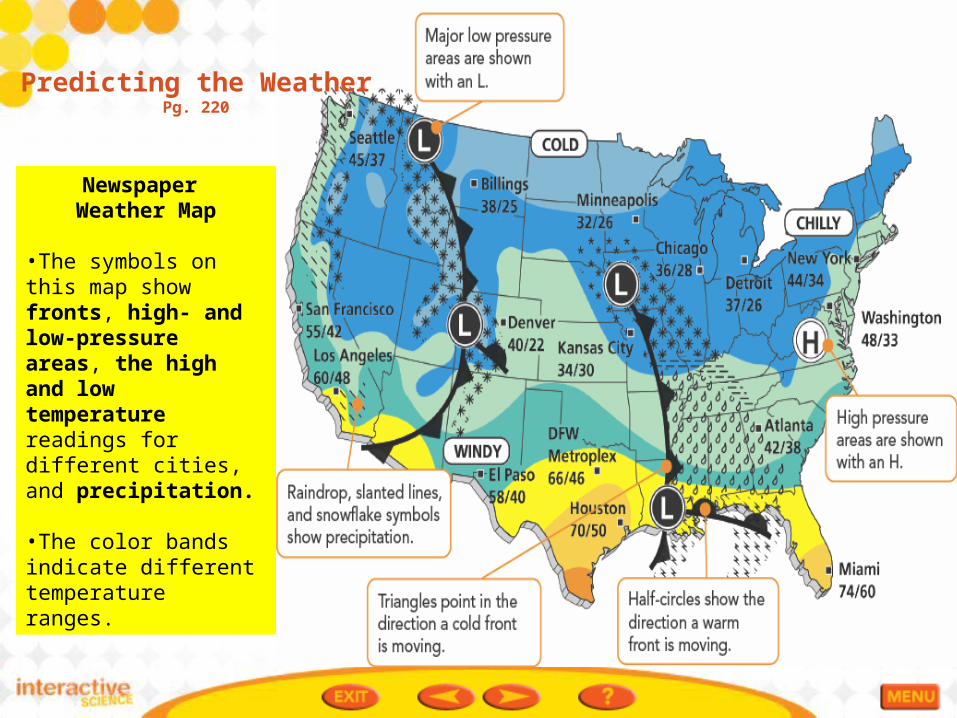
Newspaper Weather Map
•The symbols on this map show fronts, high- and low-pressure areas, the high and low temperature readings for different cities, and precipitation.
•The color bands indicate different temperature ranges.
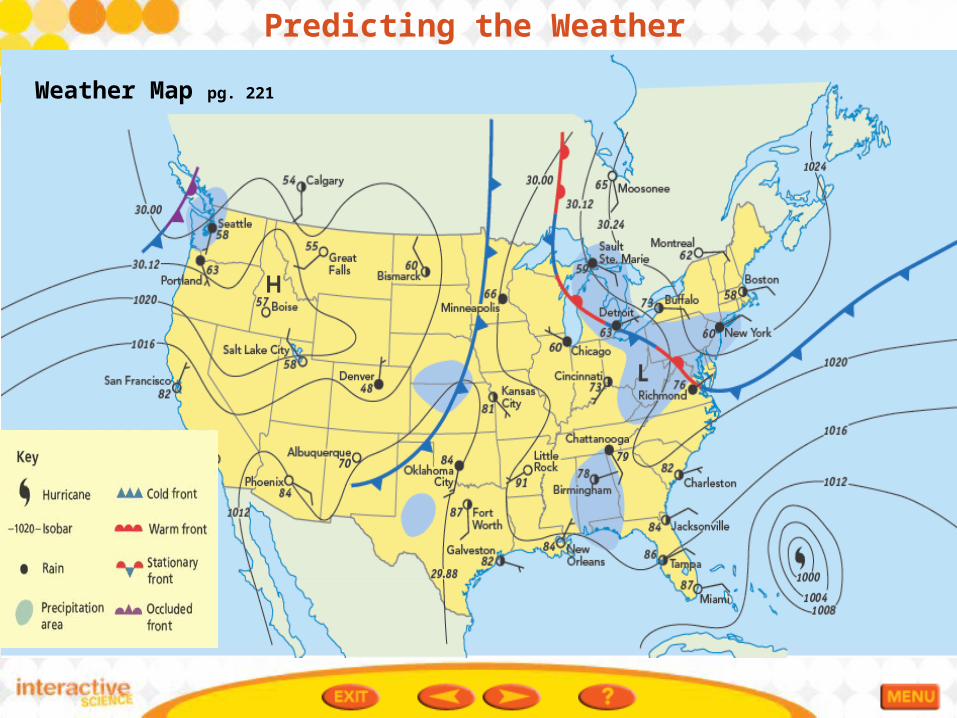
Weather Map pg. 221
Predicting the Weather