Embed Size (px)
Citation preview
1
2
Table of Contents
Page Executive Summary......................................................................... 6
Air Quality
1.1 Sources of Air Pollution .............................................................. 8
1.1.1 Stationary Sources ............................................................. 8
1.1.2 Mobile Sources ................................................................. 11
1.1.3 Area Sources .................................................................... 13
1.1.4 Emissions Inventory .......................................................... 14 1.2 Status of Air Quality
1.2.1 Air Quality Monitoring .......................................................... 15
1.2.2 Criteria Pollutants ............................................................... 16
1.2.3 Air Quality Index ................................................................ 18
1.2.4 Air Quality Trends .............................................................. 21 1.3 Impacts of Air Pollution
1.3.1 Impacts on Health .............................................................. 39
1.3.2 Impacts on Climate and Influence on
Atmospheric Conditions ...................................................... 43
1.3.3 Impacts on Agriculture ....................................................... 44
1.3.4 Impacts on Water Quality .............................................. ..... 45
1.3.5 Other Impacts: Poor Visibility .............................................. 46 1.4 Air Quality Management
1.4.1 DENR-Environmental Management Bureau ............................ 46
1.4.2 Accomplishments of Other Government Agencies and
InitiativesFrom Various Sectors ............................................ 55 1.6 Legal and Policy Aspects ........................................................... 63
1
3
List of Tables
Table 1-1. Types of Air Quality Monitoring Systems in the
Philippines and Pollutants Monitored, 2015 .............................. 16
Table 1-2. National Ambient Air Quality Guideline Values (NAAQGV)
from RA 8749 ...................................................................... 17
Table 1-3. Air Quality Index Breakpoints, Annex of RA 8749-IRR ........ ........ 19
Table 1-4. Summary Matrix of Pollutant-Specific Cautionary Statements
for General Public ................................................................. 20
Table 1-5. Total Suspended Particulates Annual Mean Values
2008 – 2015 ........................................................................ 21
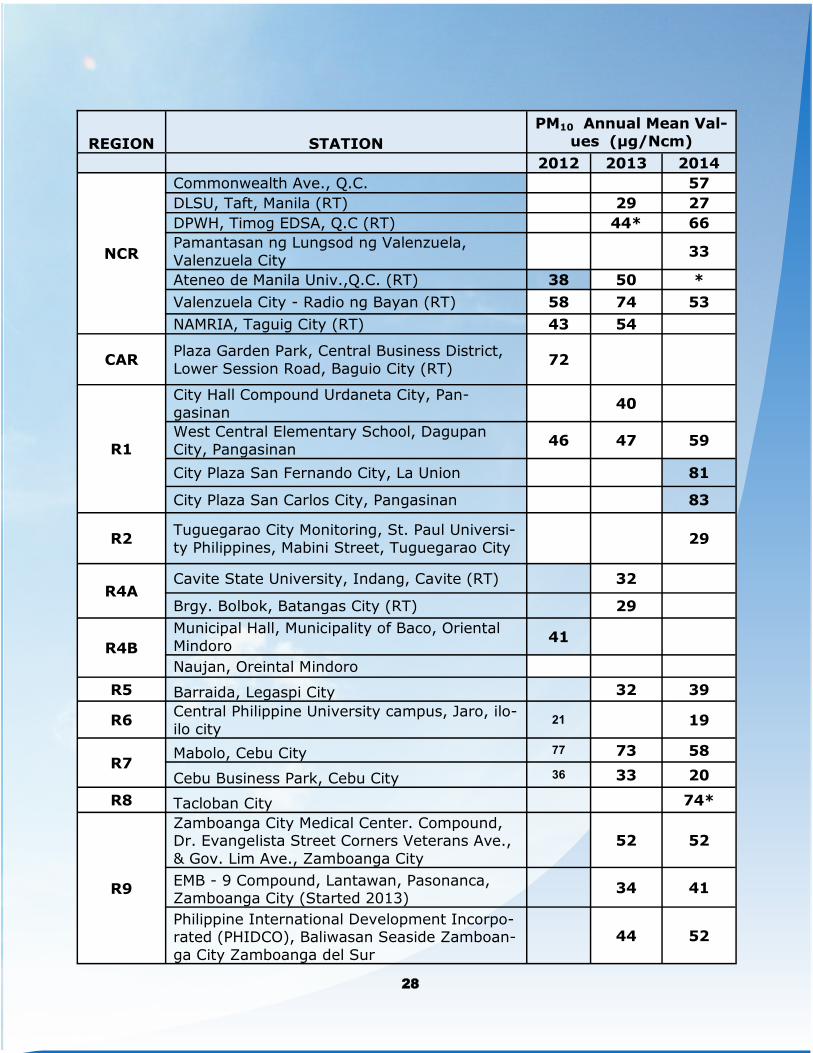
Table 1-6. PM10 Annual Mean in Regional Monitoring Stations,
2012-2014 .......................................................................... 27
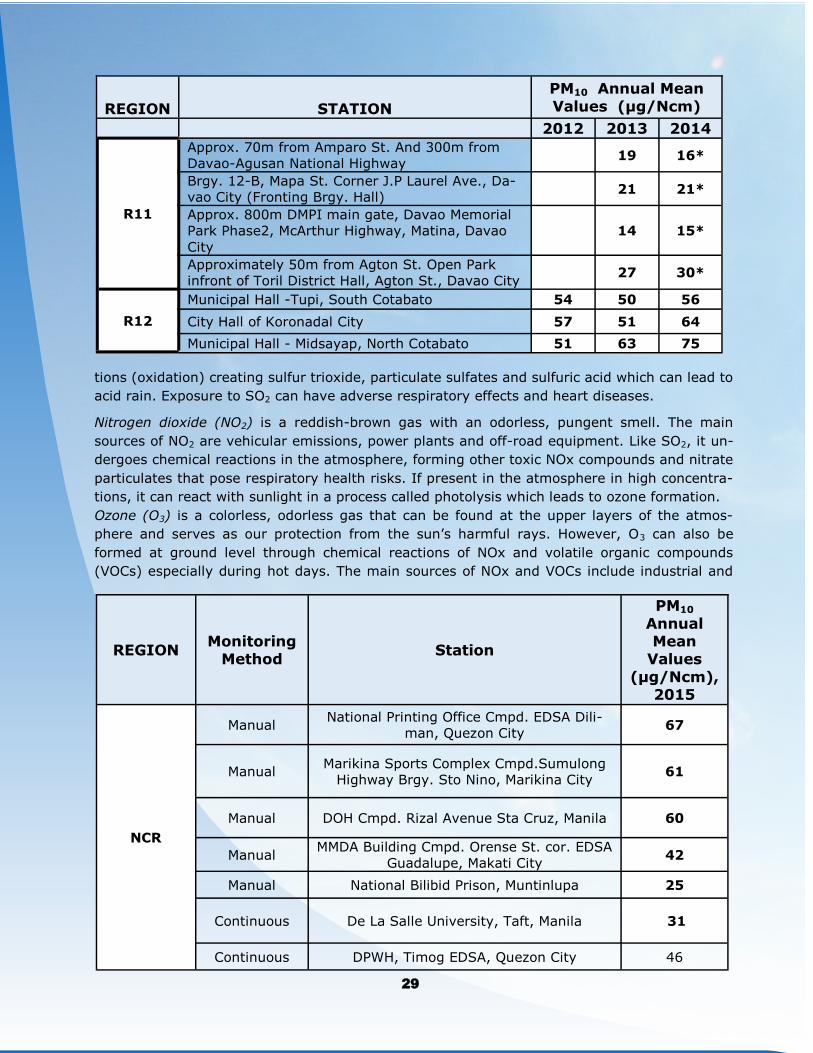
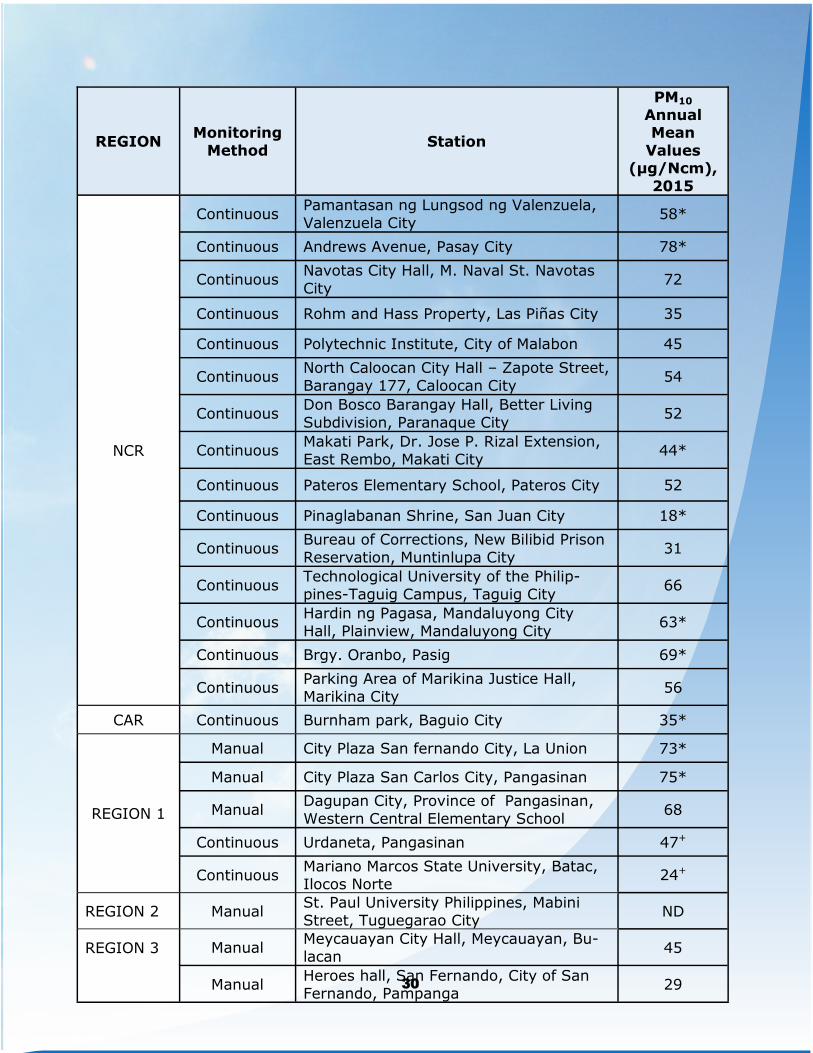
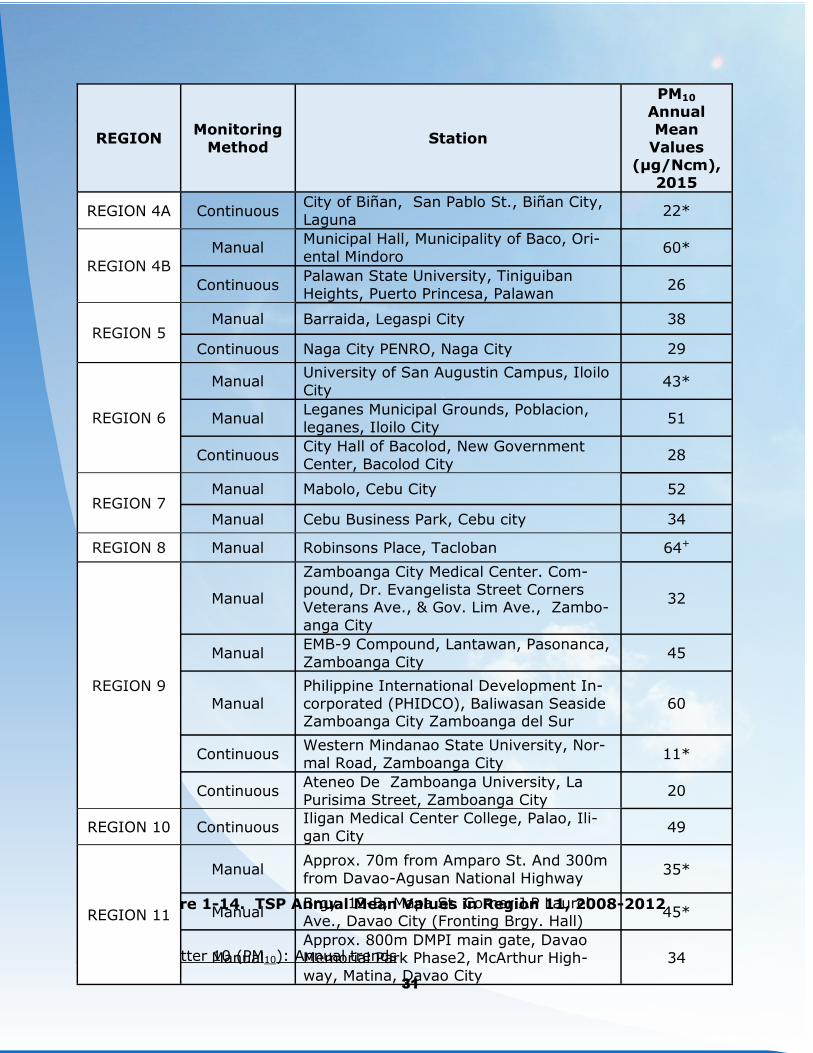
Table 1-7. PM10 Annual Mean in Regional Monitoring Stations, 2015........... 29
Table 1-8. PM2.5 Annual levels in NCR Monitoring Stations,
2012-2014 .......................................................................... 35
Table 1-9. Average statistics for S02, N02 and 03 in NCR, 2014 ................. 36
Table 1-10. Health Effects Attributable to Short-Term and Long-Term
Exposure to Air Pollution ....................................................... 40
Table 1-11. Health Effects of Criteria Air Pollutants ................................... 41
Table 1-12. Effects of PM10 Reduction on Air Pollution-Related Morbidity
and Mortality ....................................................................... 42
Table 1-13. Symptoms of Effects of Air Pollutants on Plants ........................ 45
Table 1-14. List of Third Party Source Emission Testing Firms,2015 ............. 49
Table 1-15. Metro Manila ASB Apprehension, 2015 .................................... 51
Table 1-16. Garage Testing, 2015............................................................ 52
Table 1-17. Fuel Specifications Based on Different Standards Levels ............ 53
Table 1-18. Accomplishment of Other Government Agencies Mandated
Under RA 8749 .................................................................... 55
Table 1-19. Initiatives of Local Government Units on
2

4
List of Figures
Figure 1-1. Number of Firms Monitored, 2010-2014 ................................. 8
Figure 1-2. Number of NOVs Issued, 2010-2014 ...................................... 9
Figure 1-3. Number of PTOs Issued, 2010-2014 ....................................... 10
Figure 1-4. Total Number of Registered Motor Vehicles in the
Philippines from 2010-2015 ................................................. 11
Figure 1-5. Number of Registered Motor Vehicles by Type,2008-2013 ........ 12
Figure 1-6. Number of Construction Projects in the Philippines,2011-2013 .. 13
Figure 1-7. National Emissions Inventory, by Source, 2015 ...................... 14
Figure 1-8. NCR Emissions Inventory, by Source, 2015 ............................ 14
Figure 1-9 National Emissions Inventory, by Source and Pollutant,2015..... 15
Figure 1-10. TSP Annual Mean Values in NCR, 2008-2015 ...........................24
Figure 1-11. TSP Annual Mean Values in Region 3, 2008-2015 .................... 25
Figure 1-12. TSP Annual Mean Values in Region 5, 2008-2015 .................... 25
Figure 1-13. TSP Annual Mean Values in Region 7, 2011-2015 .................... 26
Figure 1-14. TSP Annual Mean Values in Region 11, 2008-2012 .................. 27
Figure 1-15. PM10 (24-Hour Average Statistics) in the National Capital
Region, 2012-2015 .............................................................33
Figure 1-16. Figure 1-15. PM10 (24-Hour Average Statistics) Outside
Metro Manila, 2015 ............................................................34
Figure 1-17. Box plot of 24-hour Average SO2 Levels in the NCR in 2014 ..... 37
Figure 1-18. Annual Average SO2 Levels in the NCR in 2014 .......................37
Figure 1-19. Box Plot of 24-hour Average NO2 Levels in the NCR in 2014 .... 38
Figure 1-20. Box Plot of 8-hour Average NO2 Levels in the NCR in 2014 ...... 38
Figure 1-21. Leading Causes of Mortality and Morbidity Attributable to
Air Pollution,2010 ...............................................................43
Figure 1-22. Designated Airsheds in the Philippines,2015 ...........................47
Figure 1-23. Number of COCs Issued from 2010-2015 .................................50
3
5
Acronyms and Abbreviations
µg/Nm3 micrograms per normal cubic meter
AAQS Ambient Air Quality Standard
ADB Asian Development Bank
ALS Alternative Learning System
AQI Air Quality Index
AQMF Air Quality Management Fund
AQMS Air Quality Management Section
ASB Anti Smoke Belching
ASBU Anti Smoke Belching Unit
BPS Bureau of Philippine Standards
CAA Clean Air Act
CACAP Clean Air Compliance Assistance Program
CEMS Continuous Emission Monitoring System
CENRO City Environment and Natural Resources Office
CNG Compressed Natural Gas
CO carbon monoxide
COC Certificate of Conformity
CSO Civil Society Organization
DAO Department Administrative Order
DBM Department of Budget Management
DENR Department of Environment and Natural Resources
DOH Department of Health
DOTr Department of Transportation
DTI Department of Trade and Industry
EMB Environmental Management Bureau
IARC International Agency for Research on Cancer
IEC Information and Education Campaign
IEMP Industrial Emission Management Program
IRR Implementing Rules and Regulations
JAO Joint Administrative Order
kTOE kilotonne of oil equivalent
LGU Local Government Unit
LPG Liquefied Petroleum Gas
LRT Light Rail Transit
LTFRB Land Transportation Franchising and Regulatory Board
LTO Land Transportation Office
4
6
MC Memorandum Circulars
MMDA Metro Manila Development Authority
MMT Multipartite Monitoring Teams
MMUTIS Metro Manila Urban Transportation Integration Study
MRT Metro Rail Transit
MV Motor Vehicle
MVIC Motor Vehicle Inspection Center
MVUC Motor Vehicle User’s Charge
MW megawatt
NAAQGV National Ambient Air Quality Guideline Value
NAT Nuclear and Analytical Technique
NCR National Capital Region
NESSAP National Emission Standards for Sources Specific Air
Pollutant
NGVPPT Natural Gas Vehicle Program for Public Transport
NO2 nitrogen dioxide
NOV Notice of Violations
NOx nitrogen oxides
O3 ozone
OAP Outdoor Air Pollution
PCO Pollution Control Officer
PETC Private Emission Testing Center
PM Particulate matter
PM10 Particulate matter with diameter of less than 10 microns
PNR Philippine National Railways
PPP Public-Private Partnership
PTO Permit to Operate
RA Republic Act
RITMT Roadside Inspection, Testing and Monitoring Team
SAT Sampling Assessment Team
SMIEC Social Marketing, Information and Education Campaign
SO2 sulfur dioxide
SUV Sports Utility Vehicle
SVPCF Special Vehicle Pollution Control Fund
TPSETF Third Party Source Emission Testing Firm
TSP Total Suspended Particulates
USEPA United States Environmental Protection Agency
UV Utility Vehicle
UVVRP Unified Vehicular Volume Reduction Program
WHO World Health Organization
5
7
Executive Summary
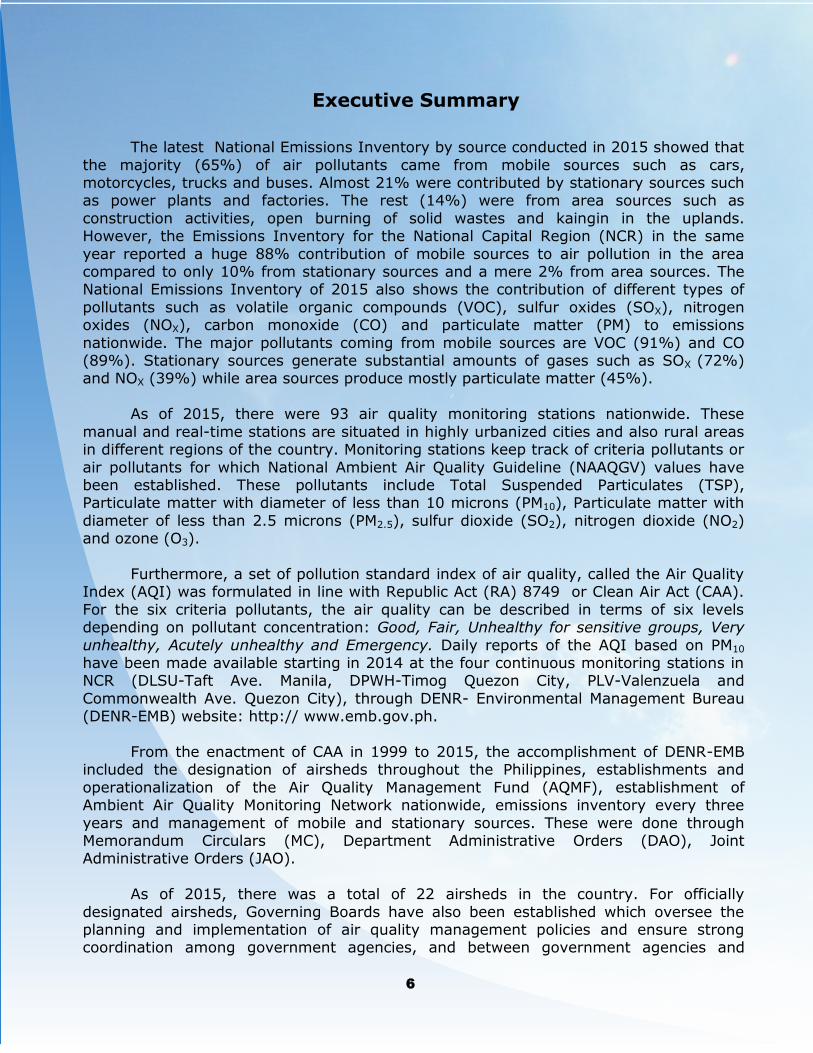
The latest National Emissions Inventory by source conducted in 2015 showed that
the majority (65%) of air pollutants came from mobile sources such as cars, motorcycles, trucks and buses. Almost 21% were contributed by stationary sources such as power plants and factories. The rest (14%) were from area sources such as
construction activities, open burning of solid wastes and kaingin in the uplands. However, the Emissions Inventory for the National Capital Region (NCR) in the same
year reported a huge 88% contribution of mobile sources to air pollution in the area compared to only 10% from stationary sources and a mere 2% from area sources. The National Emissions Inventory of 2015 also shows the contribution of different types of
pollutants such as volatile organic compounds (VOC), sulfur oxides (SOX), nitrogen oxides (NOX), carbon monoxide (CO) and particulate matter (PM) to emissions
nationwide. The major pollutants coming from mobile sources are VOC (91%) and CO (89%). Stationary sources generate substantial amounts of gases such as SOX (72%) and NOX (39%) while area sources produce mostly particulate matter (45%).
As of 2015, there were 93 air quality monitoring stations nationwide. These
manual and real-time stations are situated in highly urbanized cities and also rural areas in different regions of the country. Monitoring stations keep track of criteria pollutants or
air pollutants for which National Ambient Air Quality Guideline (NAAQGV) values have been established. These pollutants include Total Suspended Particulates (TSP), Particulate matter with diameter of less than 10 microns (PM10), Particulate matter with
diameter of less than 2.5 microns (PM2.5), sulfur dioxide (SO2), nitrogen dioxide (NO2) and ozone (O3).
Furthermore, a set of pollution standard index of air quality, called the Air Quality Index (AQI) was formulated in line with Republic Act (RA) 8749 or Clean Air Act (CAA).
For the six criteria pollutants, the air quality can be described in terms of six levels depending on pollutant concentration: Good, Fair, Unhealthy for sensitive groups, Very
unhealthy, Acutely unhealthy and Emergency. Daily reports of the AQI based on PM10 have been made available starting in 2014 at the four continuous monitoring stations in NCR (DLSU-Taft Ave. Manila, DPWH-Timog Quezon City, PLV-Valenzuela and
Commonwealth Ave. Quezon City), through DENR- Environmental Management Bureau (DENR-EMB) website: http:// www.emb.gov.ph.
From the enactment of CAA in 1999 to 2015, the accomplishment of DENR-EMB included the designation of airsheds throughout the Philippines, establishments and
operationalization of the Air Quality Management Fund (AQMF), establishment of Ambient Air Quality Monitoring Network nationwide, emissions inventory every three
years and management of mobile and stationary sources. These were done through Memorandum Circulars (MC), Department Administrative Orders (DAO), Joint Administrative Orders (JAO).
As of 2015, there was a total of 22 airsheds in the country. For officially
designated airsheds, Governing Boards have also been established which oversee the planning and implementation of air quality management policies and ensure strong coordination among government agencies, and between government agencies and
6
8
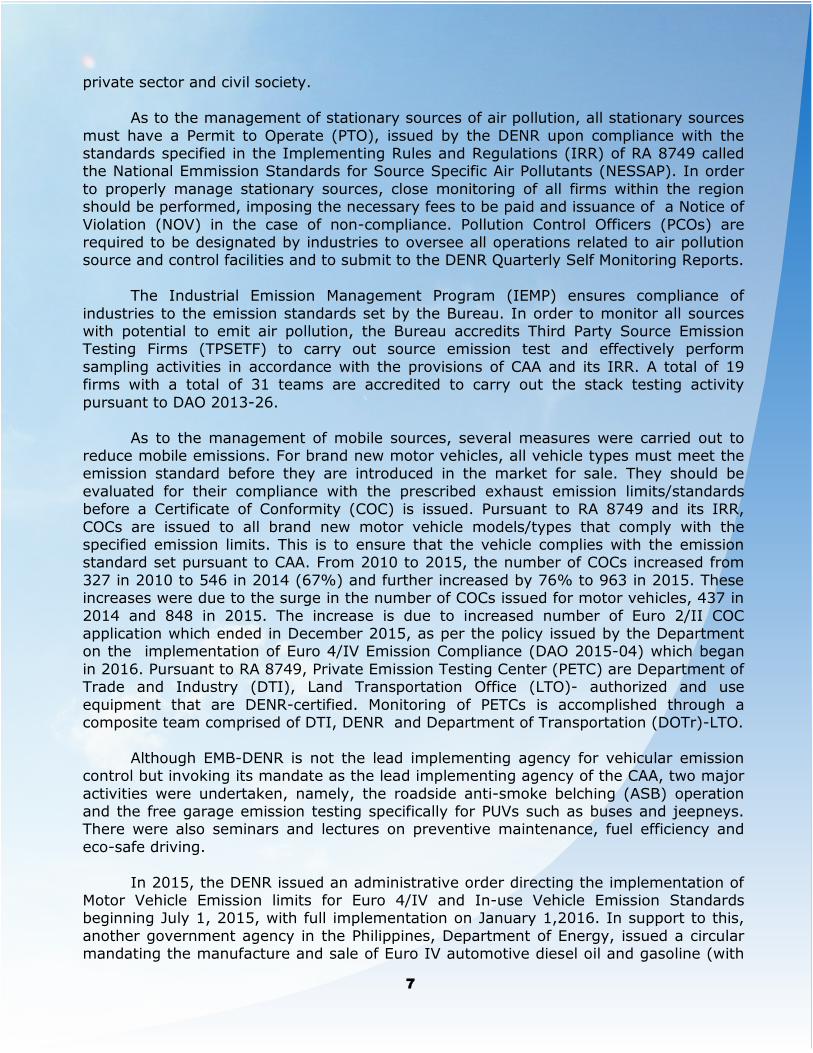
private sector and civil society.
As to the management of stationary sources of air pollution, all stationary sources
must have a Permit to Operate (PTO), issued by the DENR upon compliance with the standards specified in the Implementing Rules and Regulations (IRR) of RA 8749 called the National Emmission Standards for Source Specific Air Pollutants (NESSAP). In order
to properly manage stationary sources, close monitoring of all firms within the region should be performed, imposing the necessary fees to be paid and issuance of a Notice of
Violation (NOV) in the case of non-compliance. Pollution Control Officers (PCOs) are required to be designated by industries to oversee all operations related to air pollution source and control facilities and to submit to the DENR Quarterly Self Monitoring Reports.
The Industrial Emission Management Program (IEMP) ensures compliance of
industries to the emission standards set by the Bureau. In order to monitor all sources with potential to emit air pollution, the Bureau accredits Third Party Source Emission Testing Firms (TPSETF) to carry out source emission test and effectively perform
sampling activities in accordance with the provisions of CAA and its IRR. A total of 19 firms with a total of 31 teams are accredited to carry out the stack testing activity
pursuant to DAO 2013-26.
As to the management of mobile sources, several measures were carried out to reduce mobile emissions. For brand new motor vehicles, all vehicle types must meet the emission standard before they are introduced in the market for sale. They should be
evaluated for their compliance with the prescribed exhaust emission limits/standards before a Certificate of Conformity (COC) is issued. Pursuant to RA 8749 and its IRR,
COCs are issued to all brand new motor vehicle models/types that comply with the specified emission limits. This is to ensure that the vehicle complies with the emission standard set pursuant to CAA. From 2010 to 2015, the number of COCs increased from
327 in 2010 to 546 in 2014 (67%) and further increased by 76% to 963 in 2015. These increases were due to the surge in the number of COCs issued for motor vehicles, 437 in
2014 and 848 in 2015. The increase is due to increased number of Euro 2/II COC application which ended in December 2015, as per the policy issued by the Department on the implementation of Euro 4/IV Emission Compliance (DAO 2015-04) which began
in 2016. Pursuant to RA 8749, Private Emission Testing Center (PETC) are Department of Trade and Industry (DTI), Land Transportation Office (LTO)- authorized and use
equipment that are DENR-certified. Monitoring of PETCs is accomplished through a composite team comprised of DTI, DENR and Department of Transportation (DOTr)-LTO.
Although EMB-DENR is not the lead implementing agency for vehicular emission control but invoking its mandate as the lead implementing agency of the CAA, two major
activities were undertaken, namely, the roadside anti-smoke belching (ASB) operation and the free garage emission testing specifically for PUVs such as buses and jeepneys. There were also seminars and lectures on preventive maintenance, fuel efficiency and
eco-safe driving.
In 2015, the DENR issued an administrative order directing the implementation of Motor Vehicle Emission limits for Euro 4/IV and In-use Vehicle Emission Standards beginning July 1, 2015, with full implementation on January 1,2016. In support to this,
another government agency in the Philippines, Department of Energy, issued a circular mandating the manufacture and sale of Euro IV automotive diesel oil and gasoline (with
7
9
1. Air quality
1.1 Sources of Air Pollution
Air pollutants can come from both natural and anthropogenic sources, but anthropogenic air pollutants dominate the atmosphere of areas primarily undergoing industrialization.
For management purposes, air pollution sources can be classified as stationary, mobile or area, as described in Republic Act (RA) 8749 or the Clean Air Act.
1.1.2 Stationary Sources
Stationary sources refer to any building or immobile structure, facility or installation
which emits or may emit any air pollutant, and may be defined generally as individual points of air emissions (e.g. smokestacks). Under RA 8749, all industries classified as a
stationary source should perform their own emissions monitoring and report the results to the Department of Environment and Natural Resources (DENR). All stationary sources of air emissions must comply with National Emission Standards for Sources Specific Air
Pollution (NESSAP) and Ambient Air Quality Standard (AAQS) pertaining to the source. Upon compliance to standards, the DENR issues a Permit to Operate (PTO) to these in-
dustries prior to their operation.
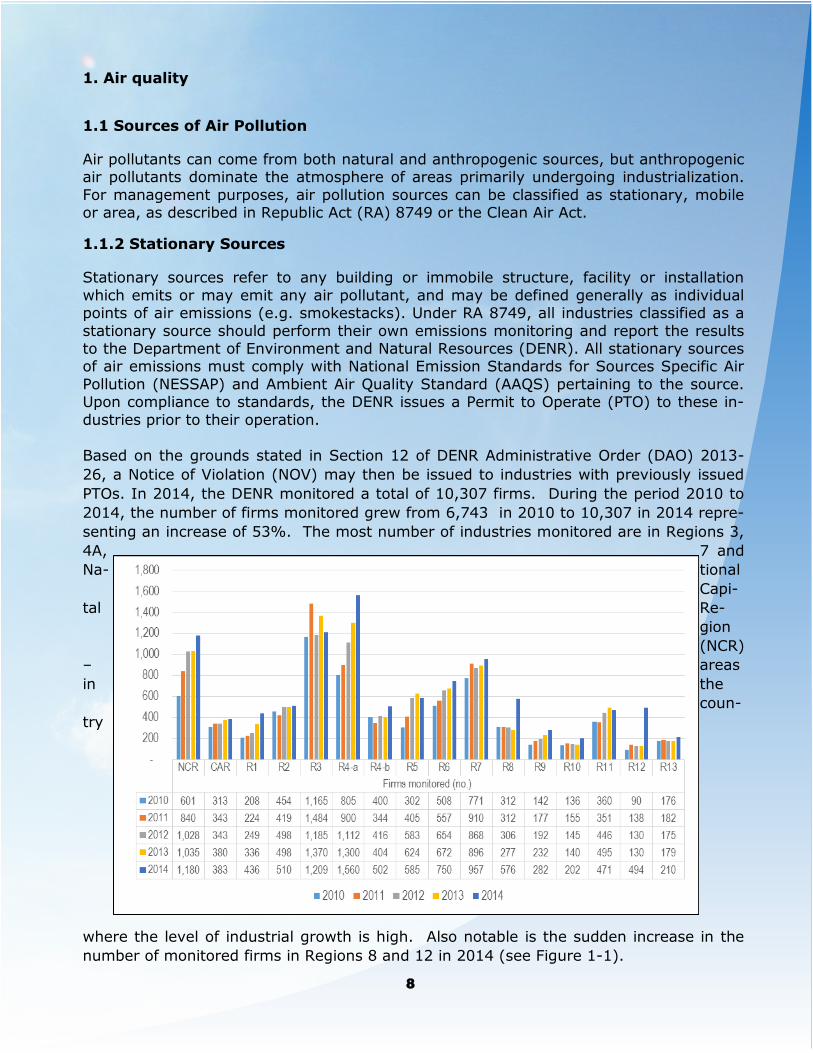
Based on the grounds stated in Section 12 of DENR Administrative Order (DAO) 2013-
26, a Notice of Violation (NOV) may then be issued to industries with previously issued
PTOs. In 2014, the DENR monitored a total of 10,307 firms. During the period 2010 to
2014, the number of firms monitored grew from 6,743 in 2010 to 10,307 in 2014 repre-
senting an increase of 53%. The most number of industries monitored are in Regions 3,
4A, 7 and
Na- tional
Capi-
tal Re-
gion
(NCR)
– areas
in the
coun-
try
where the level of industrial growth is high. Also notable is the sudden increase in the
number of monitored firms in Regions 8 and 12 in 2014 (see Figure 1-1).
8
10
1
Figure 1-1.
Number of Firms Monitored, 2010-2014
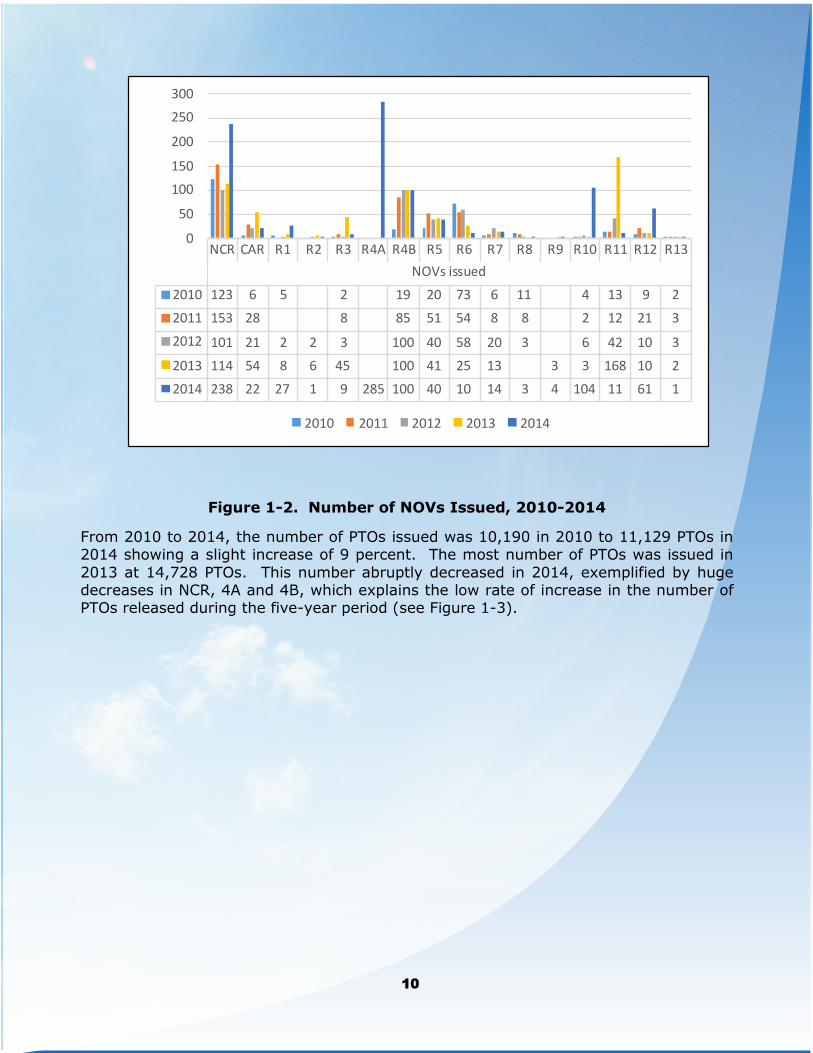
By region, during the period 2010 to 2014, NOVs issued increased from 293 in 2010 to
930 NOVs in 2014 for an increase of more than 200% (Figure 1-2). In 2014, the most number of NOVs recorded are in Region 4A (285), NCR (238), Region 10 (104) and Re-
gion 4B (100).
9
11
Figure 1-2. Number of NOVs Issued, 2010-2014
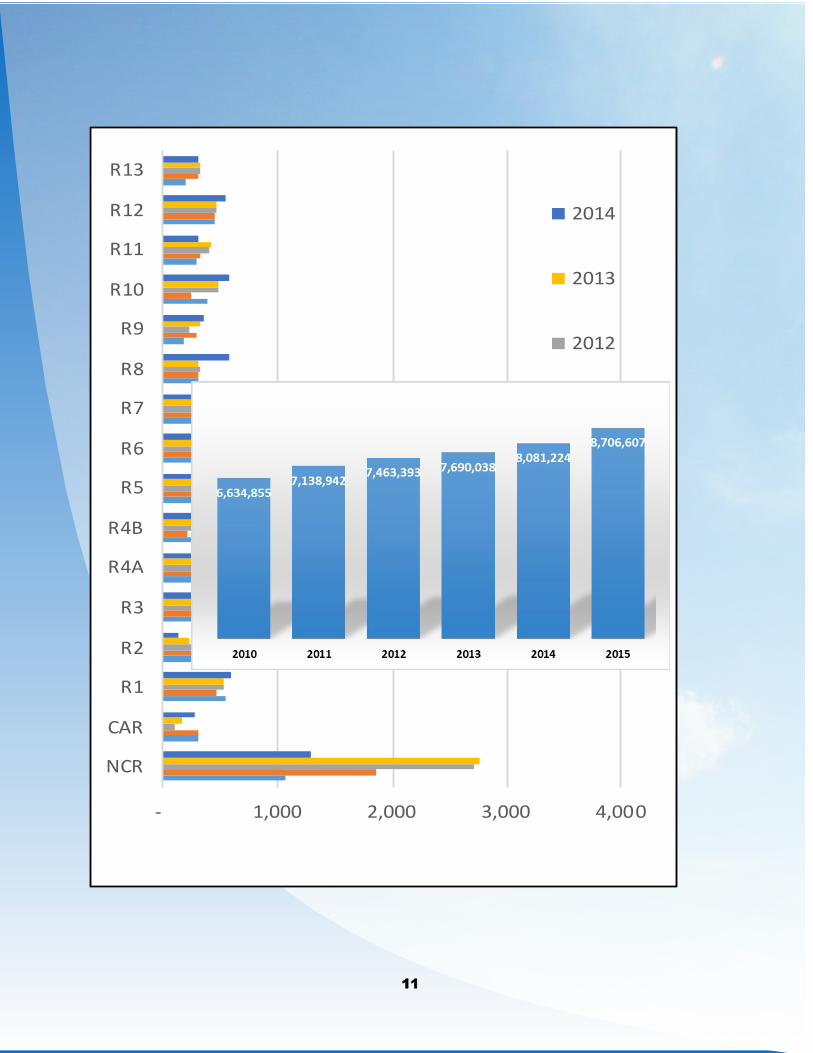
From 2010 to 2014, the number of PTOs issued was 10,190 in 2010 to 11,129 PTOs in 2014 showing a slight increase of 9 percent. The most number of PTOs was issued in
2013 at 14,728 PTOs. This number abruptly decreased in 2014, exemplified by huge decreases in NCR, 4A and 4B, which explains the low rate of increase in the number of PTOs released during the five-year period (see Figure 1-3).
NCR CAR R1 R2 R3 R4A R4B R5 R6 R7 R8 R9 R10 R11 R12 R13
NOVs issued
2010 123 6 5 2 19 20 73 6 11 4 13 9 2
2011 153 28 8 85 51 54 8 8 2 12 21 3
2012 101 21 2 2 3 100 40 58 20 3 6 42 10 3
2013 114 54 8 6 45 100 41 25 13 3 3 168 10 2
2014 238 22 27 1 9 285 100 40 10 14 3 4 104 11 61 1
0
50
100
150
200
250
300
2010 2011 2012 2013 2014
10
12
1
- 1,000 2,000 3,000 4,000
NCR
CAR
R1
R2
R3
R4A
R4B
R5
R6
R7
R8
R9
R10
R11
R12
R13
2014
2013
2012
2011
2010
11
13
Figure 1-3. Number of PTOs Issued, 2010-2014
Source: EMB
1.1.2 Mobile Sources Mobile sources are any vehicles propelled by or through combustion of carbon-based or
other fuel, constructed and operated principally for the conveyance of persons or the transportation of property or goods. It has already been reported in the 1996 to 1999
Metro Manila Urban Transportation Integration Study (MMUTIS) that the sources of ma-jor atmospheric pollutants such as particulate matter and nitrogen oxides (NOx) come mostly from motor vehicle exhaust emissions mainly attributed to jeepneys, buses and
taxicabs. However, the total volume of emissions of criteria pollutants attributed from the transport sector disaggregated as to the types of motor vehicles and areas of oper-
ation has not yet been fully studied and reported.
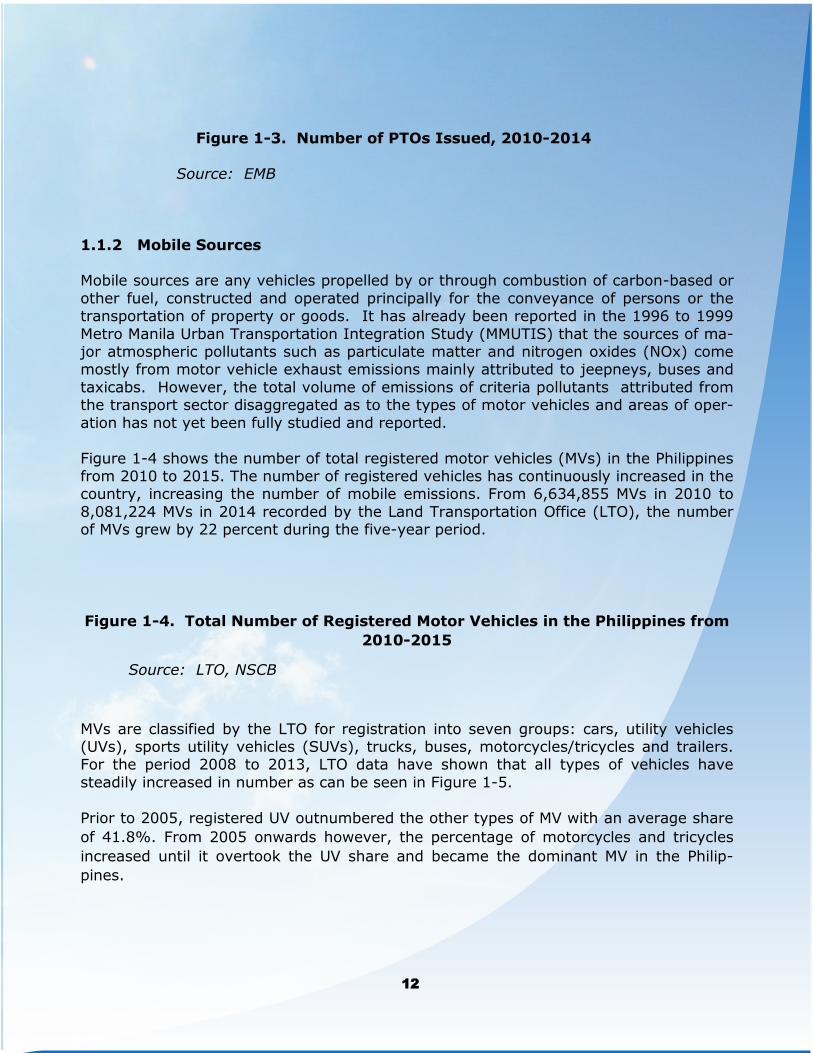
Figure 1-4 shows the number of total registered motor vehicles (MVs) in the Philippines from 2010 to 2015. The number of registered vehicles has continuously increased in the country, increasing the number of mobile emissions. From 6,634,855 MVs in 2010 to
8,081,224 MVs in 2014 recorded by the Land Transportation Office (LTO), the number of MVs grew by 22 percent during the five-year period.
Figure 1-4. Total Number of Registered Motor Vehicles in the Philippines from
2010-2015
Source: LTO, NSCB
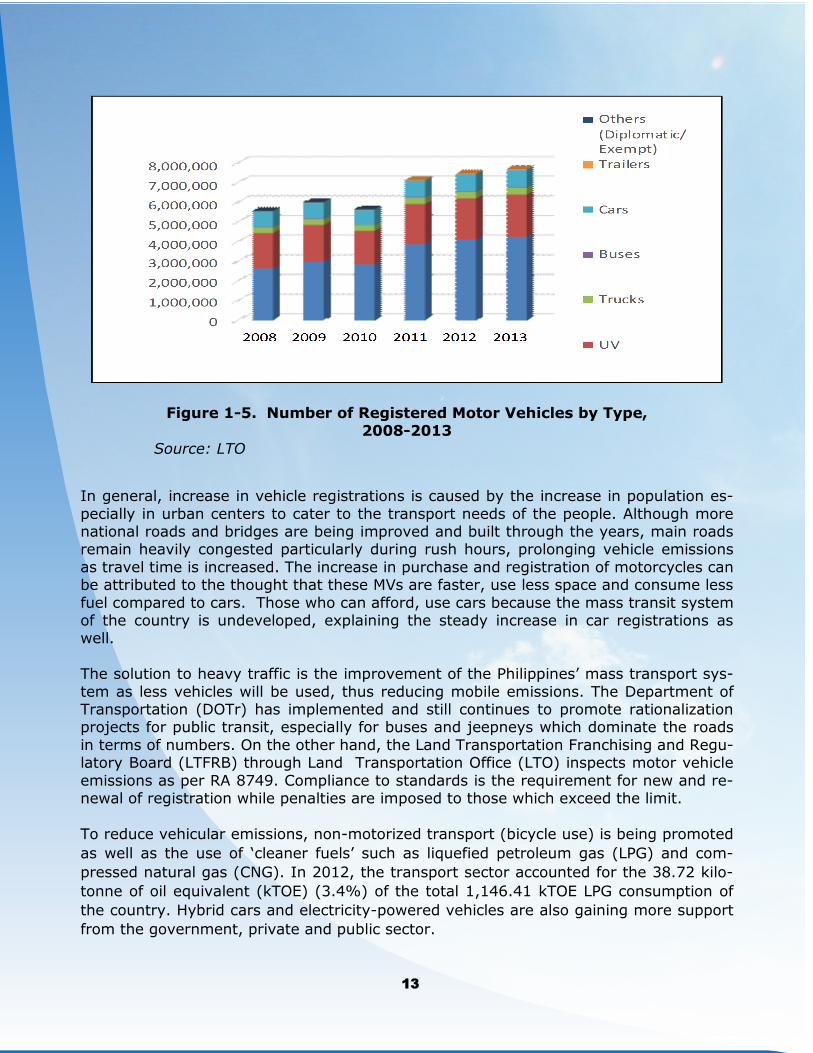
MVs are classified by the LTO for registration into seven groups: cars, utility vehicles (UVs), sports utility vehicles (SUVs), trucks, buses, motorcycles/tricycles and trailers. For the period 2008 to 2013, LTO data have shown that all types of vehicles have
steadily increased in number as can be seen in Figure 1-5.
Prior to 2005, registered UV outnumbered the other types of MV with an average share
of 41.8%. From 2005 onwards however, the percentage of motorcycles and tricycles
increased until it overtook the UV share and became the dominant MV in the Philip-
pines.
12
14
1
Figure 1-5. Number of Registered Motor Vehicles by Type, 2008-2013
Source: LTO
In general, increase in vehicle registrations is caused by the increase in population es-
pecially in urban centers to cater to the transport needs of the people. Although more national roads and bridges are being improved and built through the years, main roads remain heavily congested particularly during rush hours, prolonging vehicle emissions
as travel time is increased. The increase in purchase and registration of motorcycles can be attributed to the thought that these MVs are faster, use less space and consume less
fuel compared to cars. Those who can afford, use cars because the mass transit system of the country is undeveloped, explaining the steady increase in car registrations as well.
The solution to heavy traffic is the improvement of the Philippines’ mass transport sys-
tem as less vehicles will be used, thus reducing mobile emissions. The Department of Transportation (DOTr) has implemented and still continues to promote rationalization projects for public transit, especially for buses and jeepneys which dominate the roads
in terms of numbers. On the other hand, the Land Transportation Franchising and Regu-latory Board (LTFRB) through Land Transportation Office (LTO) inspects motor vehicle
emissions as per RA 8749. Compliance to standards is the requirement for new and re-newal of registration while penalties are imposed to those which exceed the limit.
To reduce vehicular emissions, non-motorized transport (bicycle use) is being promoted
as well as the use of ‘cleaner fuels’ such as liquefied petroleum gas (LPG) and com-
pressed natural gas (CNG). In 2012, the transport sector accounted for the 38.72 kilo-
tonne of oil equivalent (kTOE) (3.4%) of the total 1,146.41 kTOE LPG consumption of
the country. Hybrid cars and electricity-powered vehicles are also gaining more support
from the government, private and public sector.
13
15
1.1.3 Area Sources
Area source is a source of air emissions that is not confined to a discrete point or points of emissions, examples of which (but not limited to) are construction activities, unpaved
road ways, lagoons (photochemically reactive compounds and/or other emissions), in-dustrial facilities with many small or generalized potential sources such as valves, seals, etc. (photochemically reactive compounds and/or other emissions); and common gen-
erally industrial, small, non-regulated point sources (e.g. dry cleaners and gasoline sta-tions) where the point source(s) cannot feasibly or practically be measured.
Household cooking, meat curing and waste burning are also among the contributors to area sources. Pursuant to Part VII, Section 13 (d) of the RA 8749 Implementing Rules
and Regulations (IRR), open burning of materials such as plastic, polyvinyl chloride, paints, ink, wastes containing heavy metals, organic chemicals, petroleum-related com-pound, industrial wastes, ozone-depleting substances and other similar toxic and haz-
ardous substances, is prohibited.
As specified in Section 24 of RA
8749, there is also a ban on
smoking in- side a public
building or an enclosed public
place includ- ing public vehi-
cles and other means of
transport or in any enclosed ar-
ea outside of one's private
residence, pri- vate place of
work or any duly designated
enclosed smoking area.
Implementa- tion of this policy
seems lacking as a large part of
14
16
1 the 17.3 million Filipino (aged 15 years old and above) smokers can be seen smoking
every day in the streets and public vehicles.
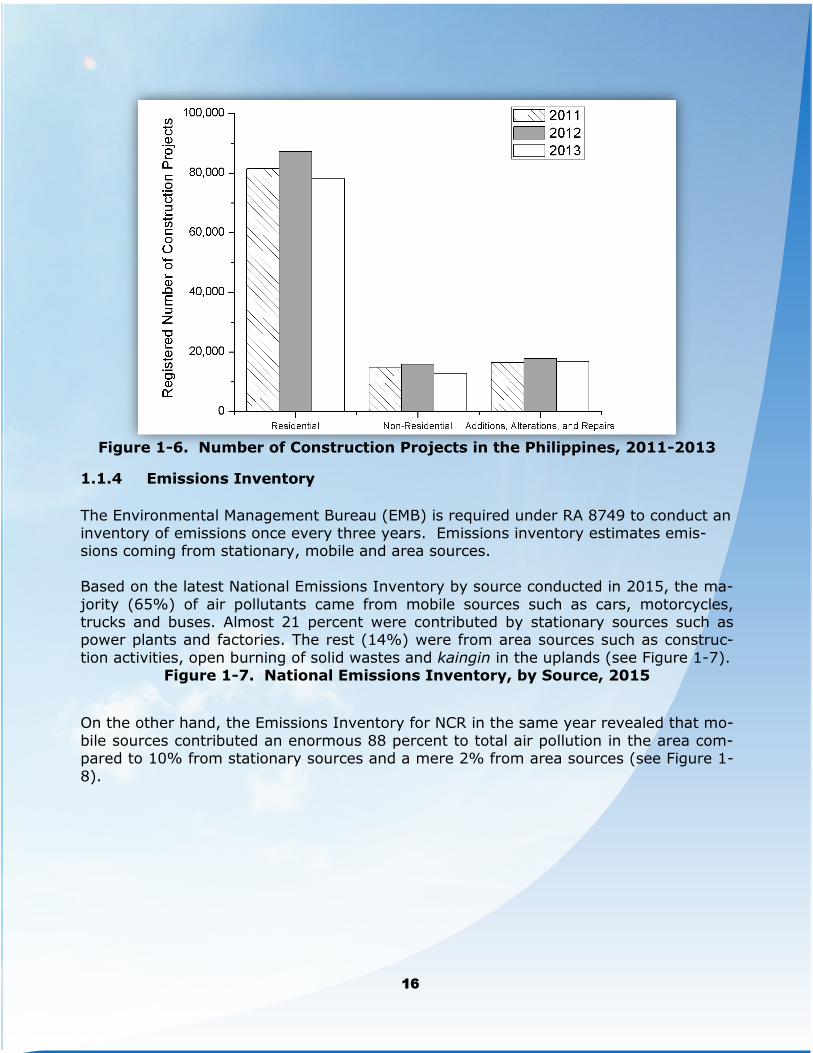
Alongside the increase in urbanization rates and economic development, the number
of construction activities has also increased during the past decade. The total number
of new construction projects in 2011 was 112,881 and this increased by 6.75% in
2012 to 121,051 with the most number of constructions occurring in Region 4A at
27,729 projects (22.9%). From 2012, a 10.98% decrease to 107,765 construction
projects was recorded in
2013 (Figure 1-6). From
2011 to 2013, the
major type of construc-
tion was residential,
comprising 70 to 75% of
all approved construction
projects.
15
17
Figure 1-6. Number of Construction Projects in the Philippines, 2011-2013
1.1.4 Emissions Inventory
The Environmental Management Bureau (EMB) is required under RA 8749 to conduct an inventory of emissions once every three years. Emissions inventory estimates emis-sions coming from stationary, mobile and area sources.
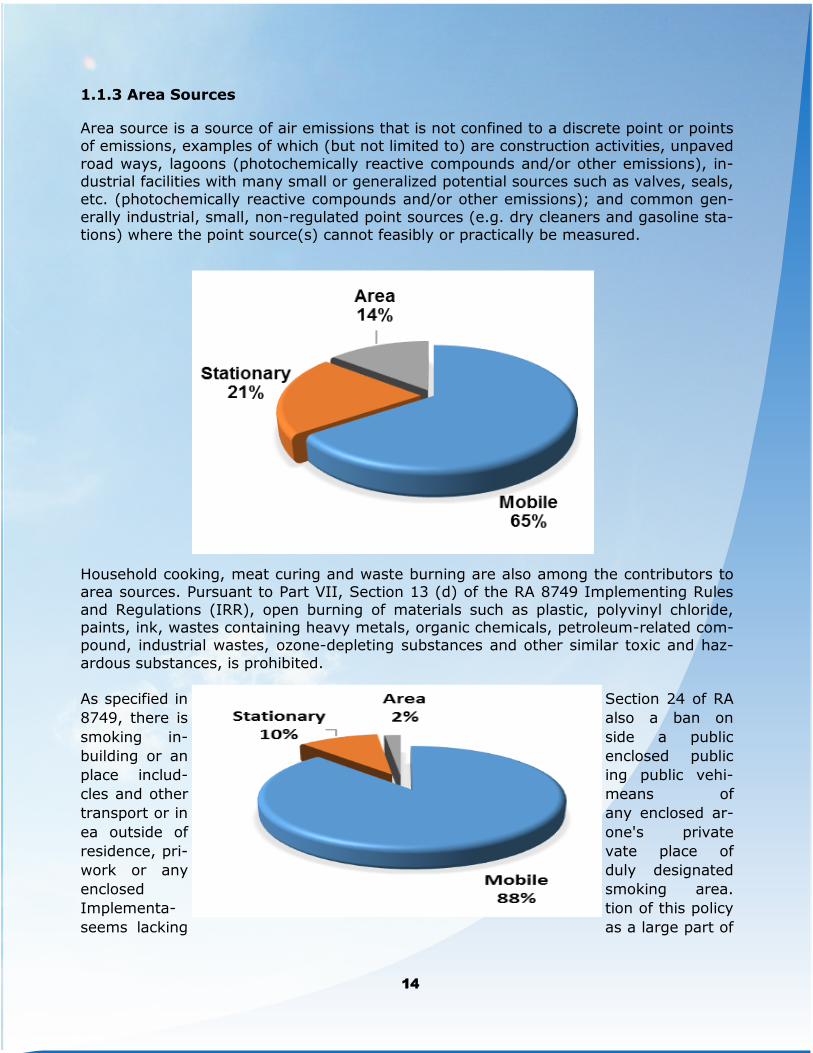
Based on the latest National Emissions Inventory by source conducted in 2015, the ma-
jority (65%) of air pollutants came from mobile sources such as cars, motorcycles, trucks and buses. Almost 21 percent were contributed by stationary sources such as power plants and factories. The rest (14%) were from area sources such as construc-
tion activities, open burning of solid wastes and kaingin in the uplands (see Figure 1-7). Figure 1-7. National Emissions Inventory, by Source, 2015
On the other hand, the Emissions Inventory for NCR in the same year revealed that mo-
bile sources contributed an enormous 88 percent to total air pollution in the area com-pared to 10% from stationary sources and a mere 2% from area sources (see Figure 1-
8).
16
18
1
Fig- ure 1-8.
NCR Emis-sions In-
ventory, by Source,
2015
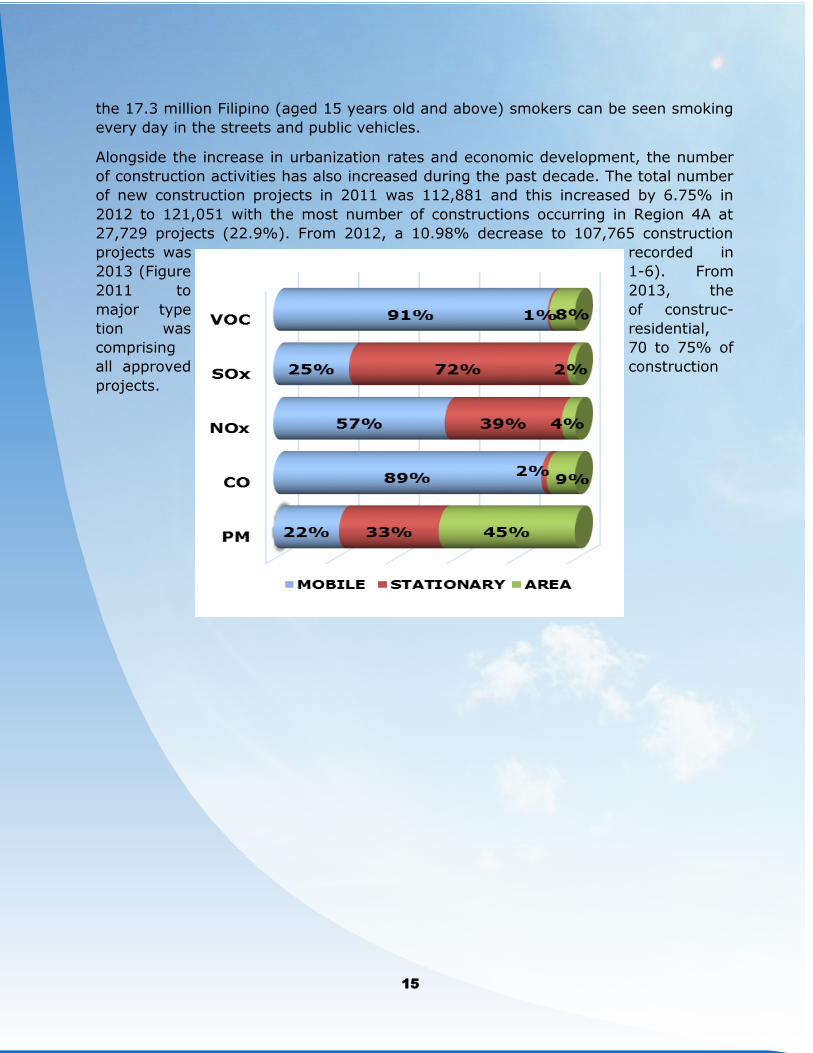
The Na- tional Emis-
sions In- ventory of
2015 also shows the
contribu- tion of dif-
ferent types of
pollutants such as vol-
atile or- ganic com-
pounds (VOC), sul-
fur oxides (SOx), ni-
trogen ox- ides (NOx),
carbon monoxide
(CO) and particulate
matter (PM) to
emissions nationwide.
As pre- sented in
Figure 1- 8, the ma-
jor pollu- tants com-
ing from mobile sources are VOC (91%) and CO (89%). Stationary sources generate
substantial amounts of gases such as SOx (72%) and NOx (39%) while area sources
produce mostly particulate matter (45%).
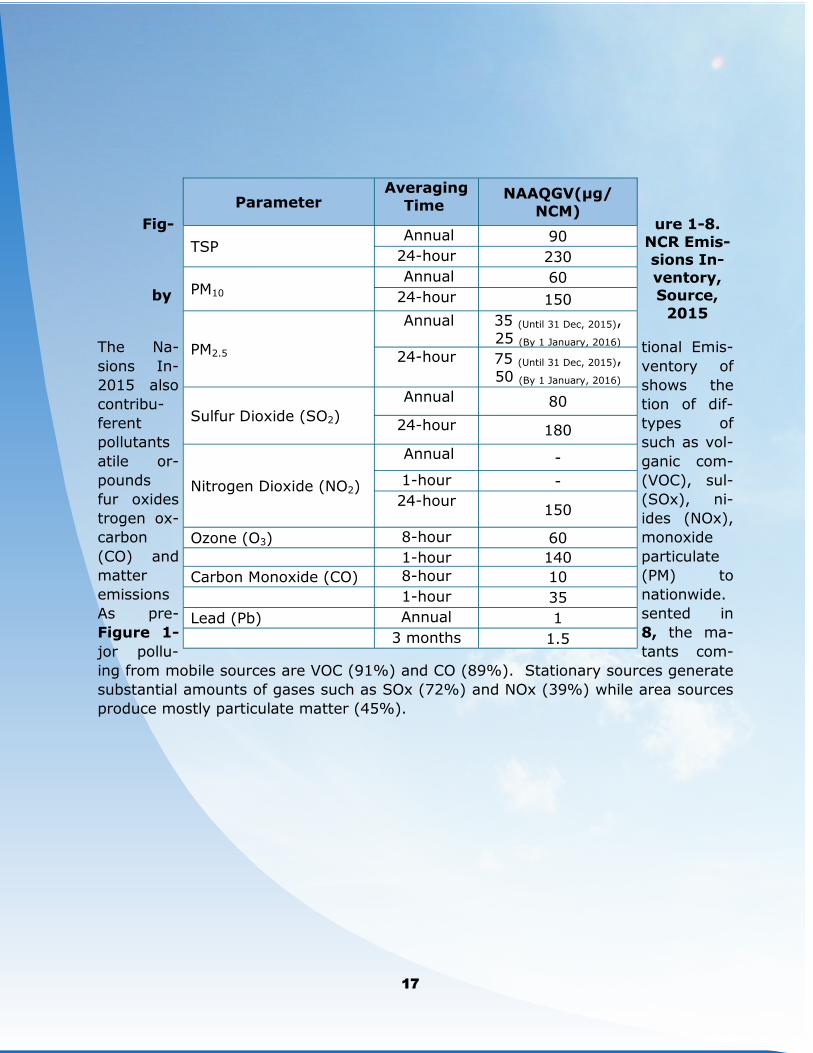
Parameter Averaging
Time NAAQGV(µg/
NCM)
TSP Annual 90
24-hour 230
PM10 Annual 60
24-hour 150
PM2.5
Annual 35 (Until 31 Dec, 2015),
25 (By 1 January, 2016)
24-hour 75 (Until 31 Dec, 2015),
50 (By 1 January, 2016)
Sulfur Dioxide (SO2)
Annual 80
24-hour 180
Annual -
Nitrogen Dioxide (NO2) 1-hour -
24-hour
150
Ozone (O3) 8-hour 60
1-hour 140
Carbon Monoxide (CO) 8-hour 10
1-hour 35
Lead (Pb) Annual 1
3 months 1.5
17
19
Figure 1-9. National Emissions inventory, by source and pollutant, 2015
Source: EMB
1.2 Status of Air Quality
1.2.1 Air Quality Monitoring
Ambient Air Quality is defined by RA 8749 as the general amount of pollution present in a broad area, and refers to the atmosphere’s average purity as distinguished from
discharge measurements taken at the source of pollution. In order to monitor the am-bient air quality of the country, EMB regional monitoring stations routinely take meas-urements of criteria air pollutants. In the existing National Air Quality Monitoring Set-
up of the DENR EMB, there are sampling equipment located all over the Philippines classified according to type of monitoring and criteria pollutants monitored.
General Ambient and Roadside Ambient Air Quality Monitoring Program
General air pollution monitoring stations monitor the ambient air quality of a fixed
area. Roadside air quality monitoring stations monitor the ambient air quality near roads with large traffic volumes and assess air pollution caused by motor vehicles. The Quality Assurance/Quality Control of air monitoring network ensures that the
ambient air quality monitoring equipment are operated, maintained and calibrated. The manual and real time stations are situated in highly urbanized cities and also
rural areas nationwide. These are being managed by focal and alternate focal persons in the regional ofices as mandated through EMB Special Order No. 219 Series of 2015. They are tasked to oversee day-to-day operation of the stations located in
their respective territorial jurisdiction and submit a quarterly report of the stations operation. The Air Quality Management Section (AQMS) of the EMB Central Office
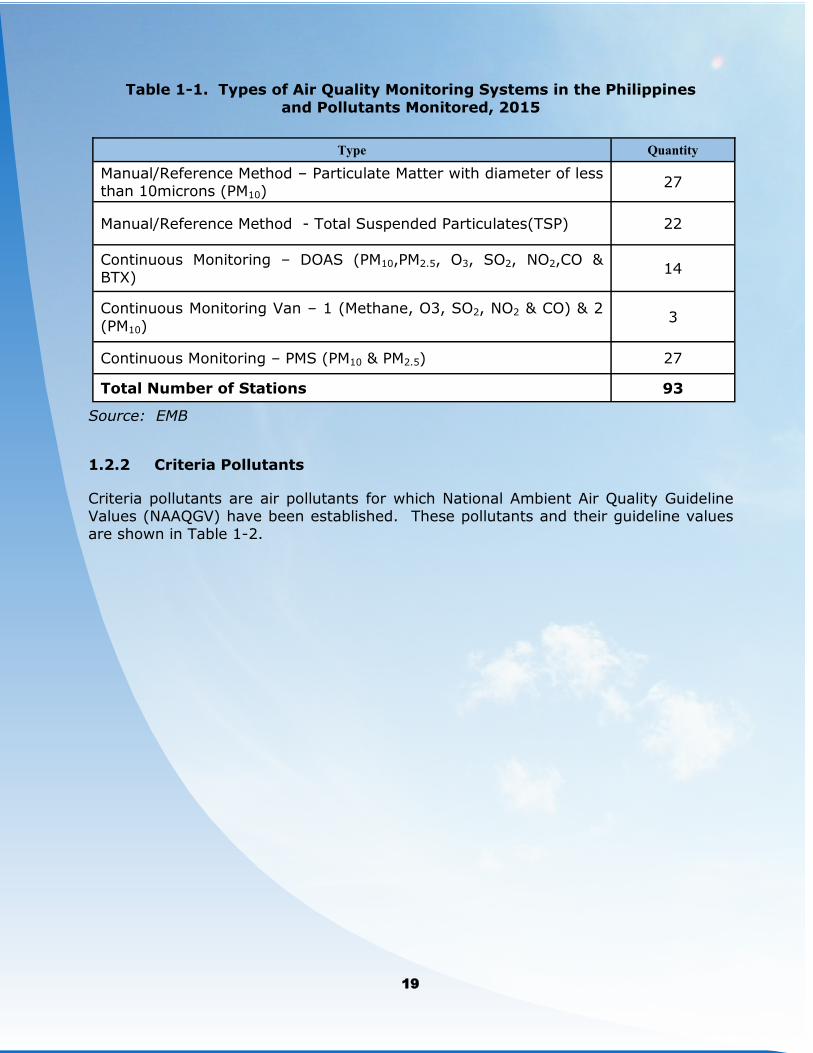
manages the central depository system and acts as the overall section in charge of the operation and maintenance of the 93 stations nationwide (see Table 1-1).
18
20
1 Table 1-1. Types of Air Quality Monitoring Systems in the Philippines
and Pollutants Monitored, 2015
Source: EMB
1.2.2 Criteria Pollutants
Criteria pollutants are air pollutants for which National Ambient Air Quality Guideline Values (NAAQGV) have been established. These pollutants and their guideline values are shown in Table 1-2.
Type Quantity
Manual/Reference Method – Particulate Matter with diameter of less than 10microns (PM10)
27
Manual/Reference Method - Total Suspended Particulates(TSP) 22
Continuous Monitoring – DOAS (PM10,PM2.5, O3, SO2, NO2,CO & BTX)
14
Continuous Monitoring Van – 1 (Methane, O3, SO2, NO2 & CO) & 2
(PM10) 3
Continuous Monitoring – PMS (PM10 & PM2.5) 27
Total Number of Stations 93
19
21
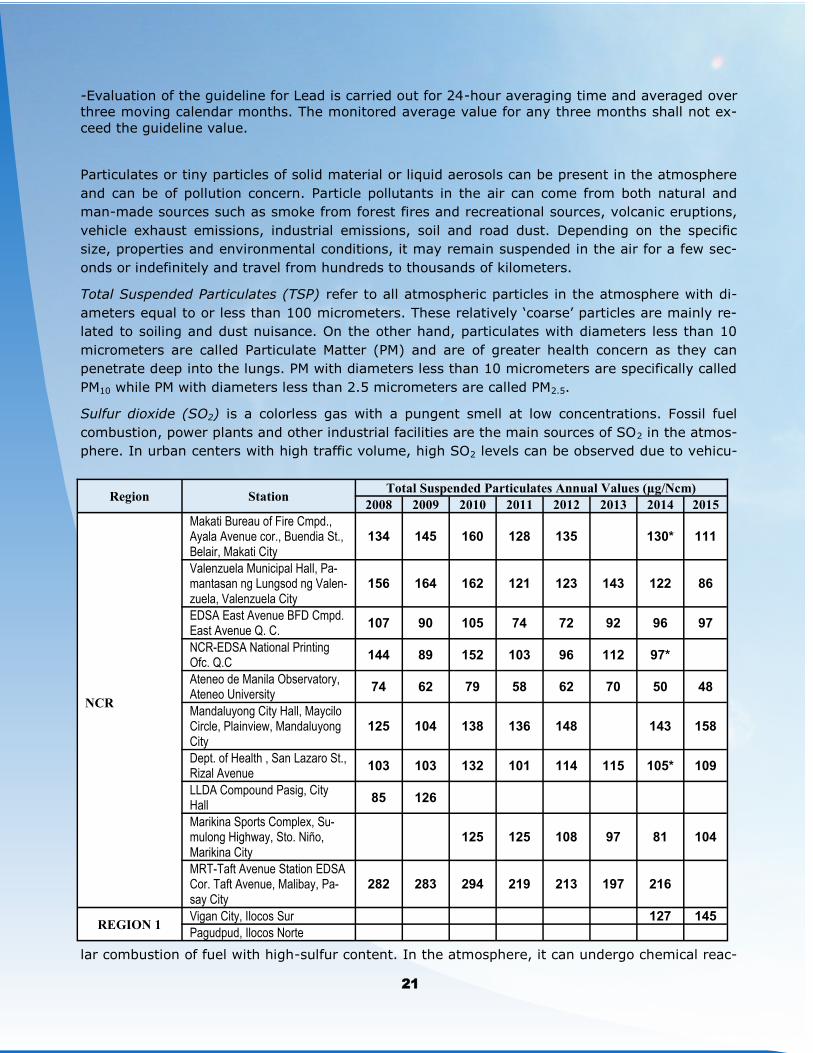
Table 1-2. National Ambient Air Quality Guideline Values (NAAQGV)
from RA 8749
Notes: Notes for Table 1-2
-SO2 and Suspended Particulate Matter are sampled once every six days when using the
manual methods. A minimum of twelve sampling days per quarter or forty-eight sampling
days each year is required for these methods. Daily sampling may be done in the future once
continuous analyzers are procured and become available.
-For short term values, maximum limits represented by ninety-eight percentile (98%) values
not to exceed more than once a year.
-Annual values of TSP (Total Suspended Particulates) and PM10 (Particulate matter with diam-
eter of less than 10 microns) are reported as Geometric Mean. *Geometric mean is used be-
cause the annual mean pollutant level in a year is dependent of the pollutant level from the
previous year.
20
22
1 -Evaluation of the guideline for Lead is carried out for 24-hour averaging time and averaged over
three moving calendar months. The monitored average value for any three months shall not ex-
ceed the guideline value.
Particulates or tiny particles of solid material or liquid aerosols can be present in the atmosphere
and can be of pollution concern. Particle pollutants in the air can come from both natural and
man-made sources such as smoke from forest fires and recreational sources, volcanic eruptions,
vehicle exhaust emissions, industrial emissions, soil and road dust. Depending on the specific
size, properties and environmental conditions, it may remain suspended in the air for a few sec-
onds or indefinitely and travel from hundreds to thousands of kilometers.
Total Suspended Particulates (TSP) refer to all atmospheric particles in the atmosphere with di-
ameters equal to or less than 100 micrometers. These relatively ‘coarse’ particles are mainly re-
lated to soiling and dust nuisance. On the other hand, particulates with diameters less than 10
micrometers are called Particulate Matter (PM) and are of greater health concern as they can
penetrate deep into the lungs. PM with diameters less than 10 micrometers are specifically called
PM10 while PM with diameters less than 2.5 micrometers are called PM2.5.
Sulfur dioxide (SO2) is a colorless gas with a pungent smell at low concentrations. Fossil fuel
combustion, power plants and other industrial facilities are the main sources of SO2 in the atmos-
phere. In urban centers with high traffic volume, high SO2 levels can be observed due to vehicu-
lar combustion of fuel with high-sulfur content. In the atmosphere, it can undergo chemical reac-
Region Station Total Suspended Particulates Annual Values (µg/Ncm)
2008 2009 2010 2011 2012 2013 2014 2015
NCR
Makati Bureau of Fire Cmpd., Ayala Avenue cor., Buendia St., Belair, Makati City
134 145 160 128 135 130* 111
Valenzuela Municipal Hall, Pa-mantasan ng Lungsod ng Valen-zuela, Valenzuela City
156 164 162 121 123 143 122 86
EDSA East Avenue BFD Cmpd. East Avenue Q. C.
107 90 105 74 72 92 96 97
NCR-EDSA National Printing Ofc. Q.C
144 89 152 103 96 112 97*
Ateneo de Manila Observatory, Ateneo University
74 62 79 58 62 70 50 48
Mandaluyong City Hall, Maycilo Circle, Plainview, Mandaluyong City
125 104 138 136 148 143 158
Dept. of Health , San Lazaro St., Rizal Avenue
103 103 132 101 114 115 105* 109
LLDA Compound Pasig, City Hall
85 126
Marikina Sports Complex, Su-mulong Highway, Sto. Niño, Marikina City
125 125 108 97 81 104
MRT-Taft Avenue Station EDSA Cor. Taft Avenue, Malibay, Pa-say City
282 283 294 219 213 197 216
REGION 1 Vigan City, Ilocos Sur 127 145
Pagudpud, Ilocos Norte
21
23
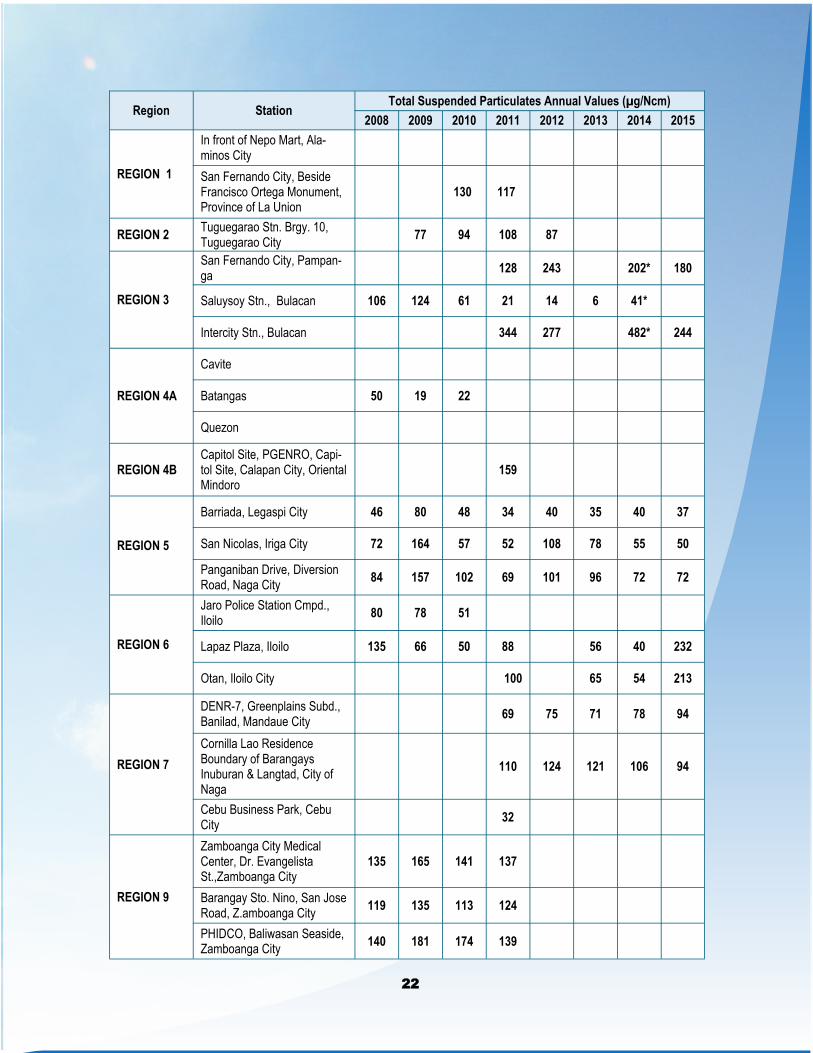
Region Station Total Suspended Particulates Annual Values (µg/Ncm)
2008 2009 2010 2011 2012 2013 2014 2015
REGION 1
In front of Nepo Mart, Ala-minos City
San Fernando City, Beside Francisco Ortega Monument, Province of La Union
130 117
REGION 2 Tuguegarao Stn. Brgy. 10, Tuguegarao City
77 94 108 87
REGION 3
San Fernando City, Pampan-ga
128 243 202* 180
Saluysoy Stn., Bulacan 106 124 61 21 14 6 41*
Intercity Stn., Bulacan 344 277 482* 244
REGION 4A
Cavite
Batangas 50 19 22
Quezon
REGION 4B Capitol Site, PGENRO, Capi-tol Site, Calapan City, Oriental Mindoro
159
REGION 5
Barriada, Legaspi City 46 80 48 34 40 35 40 37
San Nicolas, Iriga City 72 164 57 52 108 78 55 50
Panganiban Drive, Diversion Road, Naga City
84 157 102 69 101 96 72 72
REGION 6
Jaro Police Station Cmpd., Iloilo
80 78 51
Lapaz Plaza, Iloilo 135 66 50 88 56 40 232
Otan, Iloilo City 100 65 54 213
REGION 7
DENR-7, Greenplains Subd., Banilad, Mandaue City
69 75 71 78 94
Cornilla Lao Residence Boundary of Barangays Inuburan & Langtad, City of Naga
110 124 121 106 94
Cebu Business Park, Cebu City
32
Zamboanga City Medical Center, Dr. Evangelista St.,Zamboanga City
135 165 141 137
REGION 9 Barangay Sto. Nino, San Jose Road, Z.amboanga City
119 135 113 124
PHIDCO, Baliwasan Seaside, Zamboanga City
140 181 174 139
22
24
1
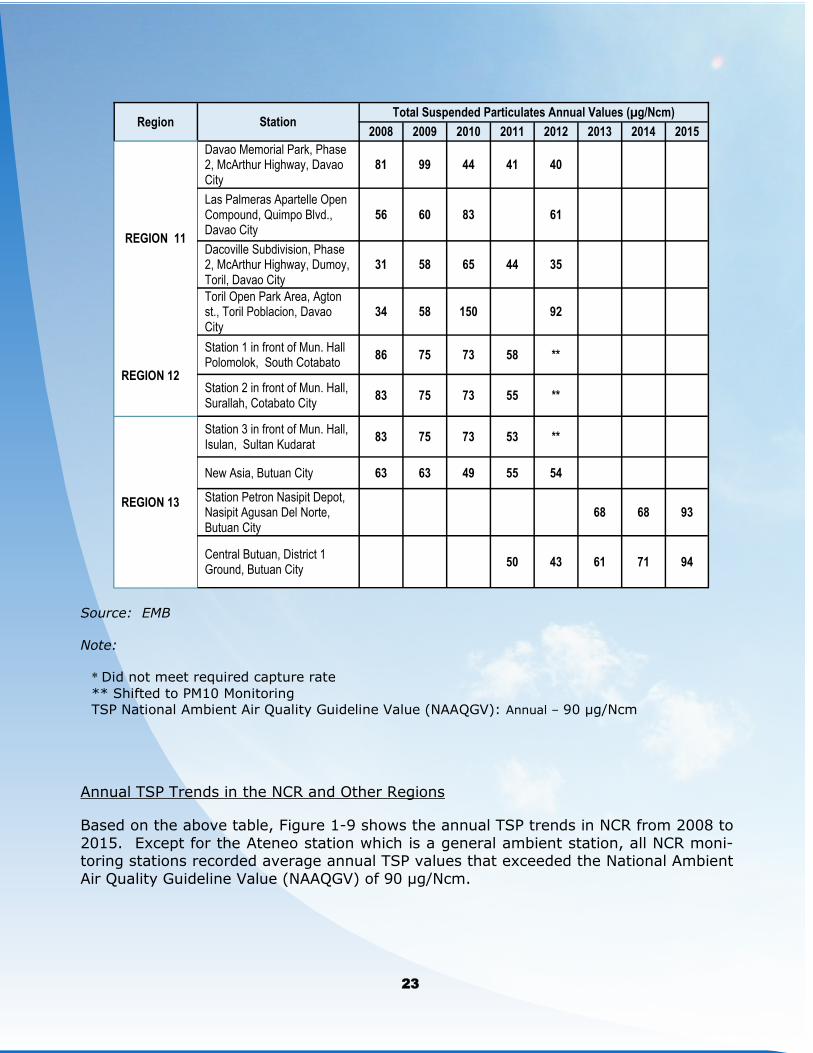
Source: EMB
Note:
Annual TSP Trends in the NCR and Other Regions
Based on the above table, Figure 1-9 shows the annual TSP trends in NCR from 2008 to
2015. Except for the Ateneo station which is a general ambient station, all NCR moni-toring stations recorded average annual TSP values that exceeded the National Ambient
Air Quality Guideline Value (NAAQGV) of 90 µg/Ncm.
* Did not meet required capture rate
** Shifted to PM10 Monitoring
TSP National Ambient Air Quality Guideline Value (NAAQGV): Annual – 90 µg/Ncm
Region Station Total Suspended Particulates Annual Values (µg/Ncm)
2008 2009 2010 2011 2012 2013 2014 2015
REGION 11
Davao Memorial Park, Phase 2, McArthur Highway, Davao City
81 99 44 41 40
Las Palmeras Apartelle Open Compound, Quimpo Blvd., Davao City
56 60 83 61
Dacoville Subdivision, Phase 2, McArthur Highway, Dumoy, Toril, Davao City
31 58 65 44 35
Toril Open Park Area, Agton st., Toril Poblacion, Davao City
34 58 150 92
REGION 12
Station 1 in front of Mun. Hall Polomolok, South Cotabato
86 75 73 58 **
Station 2 in front of Mun. Hall, Surallah, Cotabato City
83 75 73 55 **
REGION 13
Station 3 in front of Mun. Hall, Isulan, Sultan Kudarat
83 75 73 53 **
New Asia, Butuan City 63 63 49 55 54
Station Petron Nasipit Depot, Nasipit Agusan Del Norte, Butuan City
68 68 93
Central Butuan, District 1 Ground, Butuan City
50 43 61 71 94
23
25
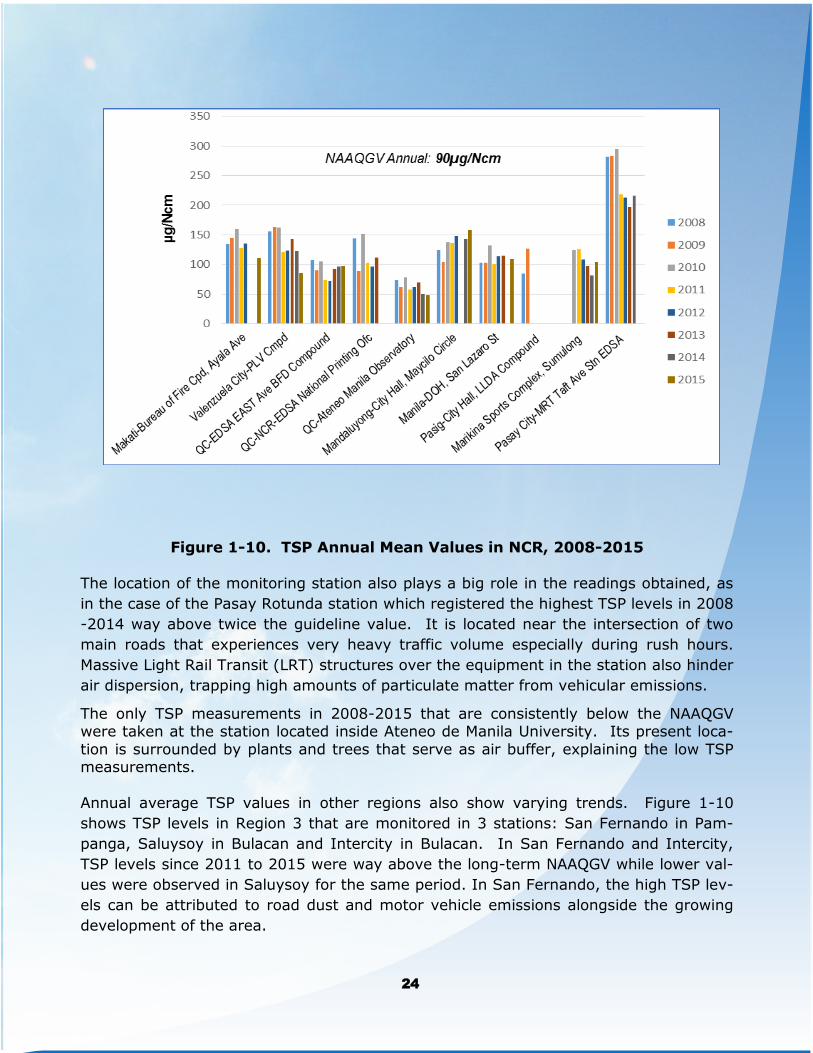
Figure 1-10. TSP Annual Mean Values in NCR, 2008-2015
The location of the monitoring station also plays a big role in the readings obtained, as
in the case of the Pasay Rotunda station which registered the highest TSP levels in 2008
-2014 way above twice the guideline value. It is located near the intersection of two
main roads that experiences very heavy traffic volume especially during rush hours.
Massive Light Rail Transit (LRT) structures over the equipment in the station also hinder
air dispersion, trapping high amounts of particulate matter from vehicular emissions.
The only TSP measurements in 2008-2015 that are consistently below the NAAQGV were taken at the station located inside Ateneo de Manila University. Its present loca-
tion is surrounded by plants and trees that serve as air buffer, explaining the low TSP measurements.
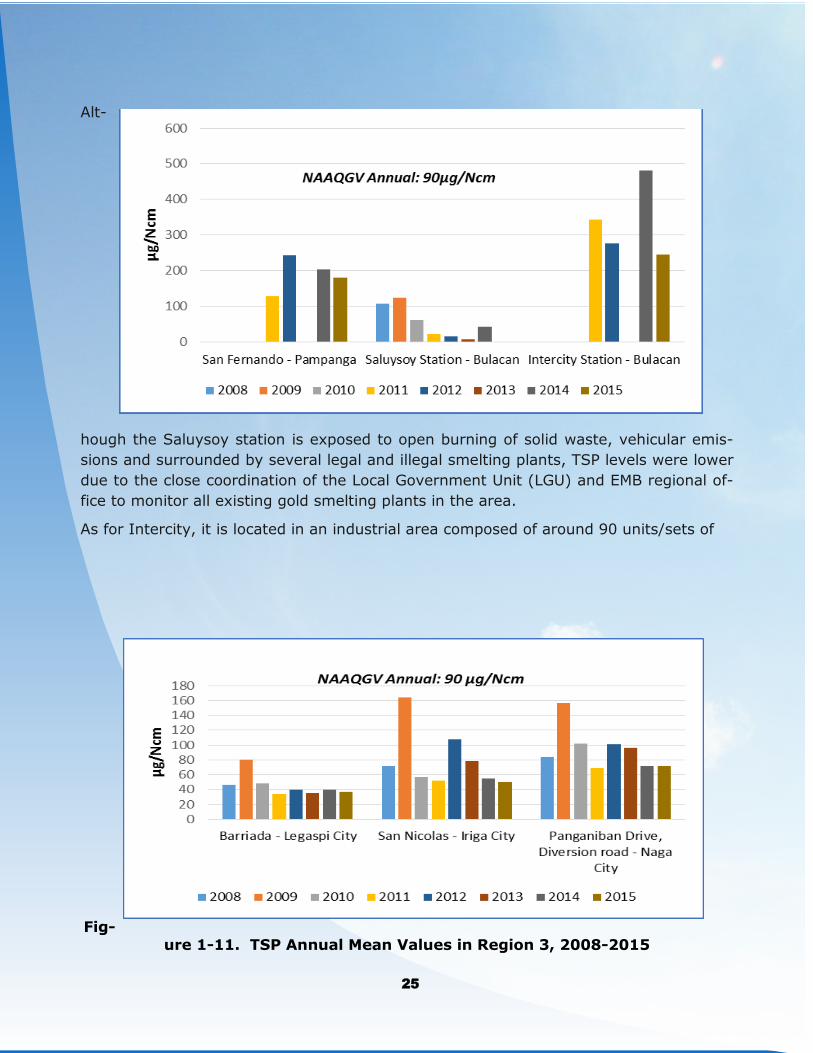
Annual average TSP values in other regions also show varying trends. Figure 1-10
shows TSP levels in Region 3 that are monitored in 3 stations: San Fernando in Pam-
panga, Saluysoy in Bulacan and Intercity in Bulacan. In San Fernando and Intercity,
TSP levels since 2011 to 2015 were way above the long-term NAAQGV while lower val-
ues were observed in Saluysoy for the same period. In San Fernando, the high TSP lev-
els can be attributed to road dust and motor vehicle emissions alongside the growing
development of the area.
24
26
1
Alt-
hough the Saluysoy station is exposed to open burning of solid waste, vehicular emis-
sions and surrounded by several legal and illegal smelting plants, TSP levels were lower
due to the close coordination of the Local Government Unit (LGU) and EMB regional of-
fice to monitor all existing gold smelting plants in the area.
As for Intercity, it is located in an industrial area composed of around 90 units/sets of
Fig-
ure 1-11. TSP Annual Mean Values in Region 3, 2008-2015
25
27
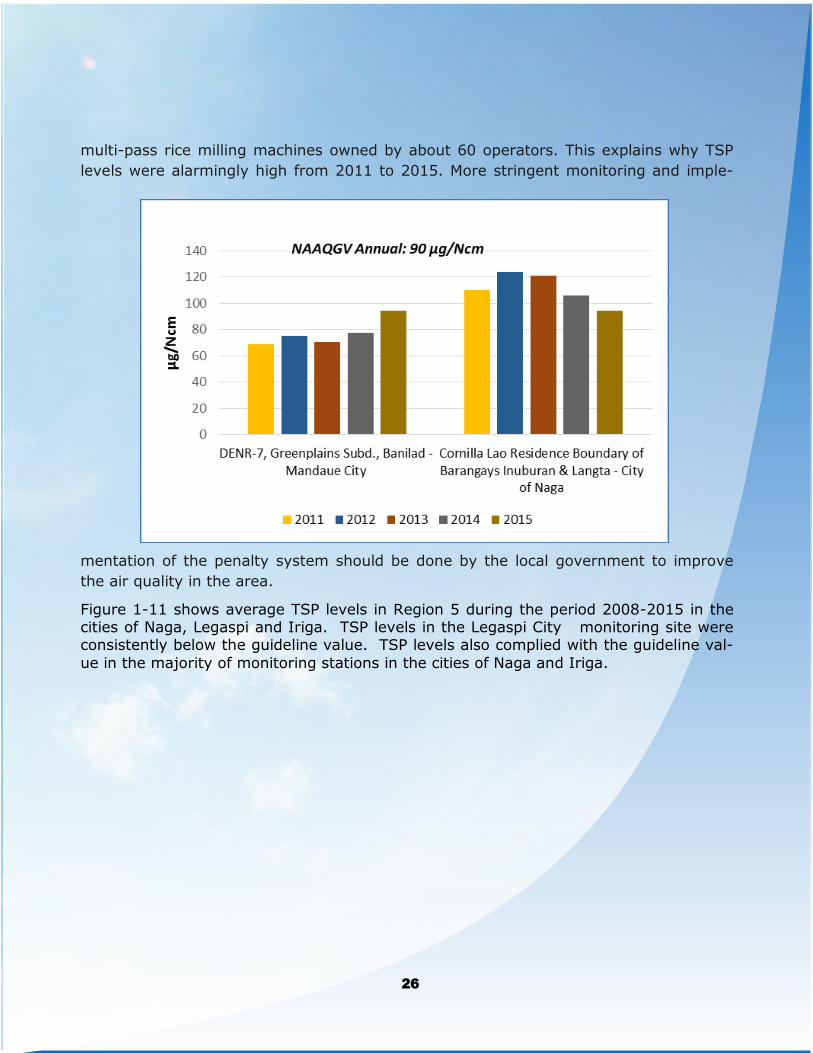
multi-pass rice milling machines owned by about 60 operators. This explains why TSP
levels were alarmingly high from 2011 to 2015. More stringent monitoring and imple-
mentation of the penalty system should be done by the local government to improve
the air quality in the area.
Figure 1-11 shows average TSP levels in Region 5 during the period 2008-2015 in the cities of Naga, Legaspi and Iriga. TSP levels in the Legaspi City monitoring site were consistently below the guideline value. TSP levels also complied with the guideline val-
ue in the majority of monitoring stations in the cities of Naga and Iriga.
26
28
1
Fig- ure 1-12. TSP An- nual
Mean Val-
ues in Re-gion
5, 2008-
2015
In Region
7, TSP lev- els
were moni-tored
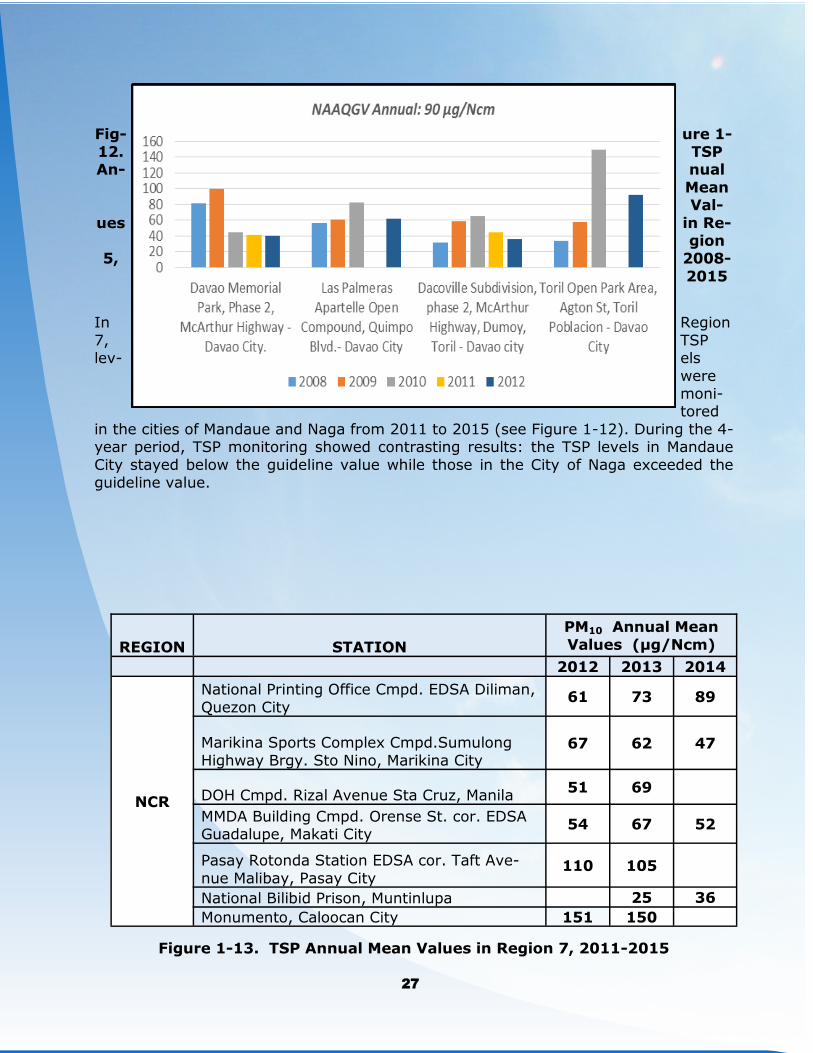
in the cities of Mandaue and Naga from 2011 to 2015 (see Figure 1-12). During the 4-year period, TSP monitoring showed contrasting results: the TSP levels in Mandaue
City stayed below the guideline value while those in the City of Naga exceeded the guideline value.
Figure 1-13. TSP Annual Mean Values in Region 7, 2011-2015
REGION STATION
PM10 Annual Mean
Values (μg/Ncm)
2012 2013 2014
National Printing Office Cmpd. EDSA Diliman,
Quezon City 61 73 89
NCR
Marikina Sports Complex Cmpd.Sumulong
Highway Brgy. Sto Nino, Marikina City 67 62 47
DOH Cmpd. Rizal Avenue Sta Cruz, Manila 51 69
MMDA Building Cmpd. Orense St. cor. EDSA Guadalupe, Makati City
54 67 52
Pasay Rotonda Station EDSA cor. Taft Ave-
nue Malibay, Pasay City 110 105
National Bilibid Prison, Muntinlupa 25 36
Monumento, Caloocan City 151 150
27
29
REGION STATION
PM10 Annual Mean Val-
ues (μg/Ncm)
2012 2013 2014
NCR
Commonwealth Ave., Q.C. 57
DLSU, Taft, Manila (RT) 29 27
DPWH, Timog EDSA, Q.C (RT) 44* 66
Pamantasan ng Lungsod ng Valenzuela,
Valenzuela City 33
Ateneo de Manila Univ.,Q.C. (RT) 38 50 *
Valenzuela City - Radio ng Bayan (RT) 58 74 53
NAMRIA, Taguig City (RT) 43 54
CAR Plaza Garden Park, Central Business District,
Lower Session Road, Baguio City (RT) 72
R1
City Hall Compound Urdaneta City, Pan-
gasinan 40
West Central Elementary School, Dagupan
City, Pangasinan 46 47 59
City Plaza San Fernando City, La Union 81
City Plaza San Carlos City, Pangasinan 83
R2 Tuguegarao City Monitoring, St. Paul Universi-
ty Philippines, Mabini Street, Tuguegarao City 29
R4A Cavite State University, Indang, Cavite (RT) 32
Brgy. Bolbok, Batangas City (RT) 29
R4B
Municipal Hall, Municipality of Baco, Oriental
Mindoro 41
Naujan, Oreintal Mindoro
R5 Barraida, Legaspi City 32 39
R6 Central Philippine University campus, Jaro, ilo-
ilo city 21 19
R7 Mabolo, Cebu City 77 73 58
Cebu Business Park, Cebu City 36 33 20
R8 Tacloban City 74*
Zamboanga City Medical Center. Compound, Dr. Evangelista Street Corners Veterans Ave.,
& Gov. Lim Ave., Zamboanga City
52 52
R9 EMB - 9 Compound, Lantawan, Pasonanca, Zamboanga City (Started 2013)
34 41
Philippine International Development Incorpo-rated (PHIDCO), Baliwasan Seaside Zamboan-
ga City Zamboanga del Sur
44 52
28
30
1
tions (oxidation) creating sulfur trioxide, particulate sulfates and sulfuric acid which can lead to
acid rain. Exposure to SO2 can have adverse respiratory effects and heart diseases.
Nitrogen dioxide (NO2) is a reddish-brown gas with an odorless, pungent smell. The main
sources of NO2 are vehicular emissions, power plants and off-road equipment. Like SO2, it un-
dergoes chemical reactions in the atmosphere, forming other toxic NOx compounds and nitrate
particulates that pose respiratory health risks. If present in the atmosphere in high concentra-
tions, it can react with sunlight in a process called photolysis which leads to ozone formation.
Ozone (O3) is a colorless, odorless gas that can be found at the upper layers of the atmos-
phere and serves as our protection from the sun’s harmful rays. However, O3 can also be
formed at ground level through chemical reactions of NOx and volatile organic compounds
(VOCs) especially during hot days. The main sources of NOx and VOCs include industrial and
REGION STATION
PM10 Annual Mean
Values (μg/Ncm)
2012 2013 2014
R11
Approx. 70m from Amparo St. And 300m from
Davao-Agusan National Highway 19 16*
Brgy. 12-B, Mapa St. Corner J.P Laurel Ave., Da-
vao City (Fronting Brgy. Hall) 21 21*
Approx. 800m DMPI main gate, Davao Memorial
Park Phase2, McArthur Highway, Matina, Davao
City
14 15*
Approximately 50m from Agton St. Open Park
infront of Toril District Hall, Agton St., Davao City 27 30*
Municipal Hall -Tupi, South Cotabato 54 50 56
R12 City Hall of Koronadal City 57 51 64
Municipal Hall - Midsayap, North Cotabato 51 63 75
REGION Monitoring
Method Station
PM10
Annual Mean
Values
(μg/Ncm), 2015
NCR
Manual National Printing Office Cmpd. EDSA Dili-
man, Quezon City 67
Manual Marikina Sports Complex Cmpd.Sumulong
Highway Brgy. Sto Nino, Marikina City 61
Manual DOH Cmpd. Rizal Avenue Sta Cruz, Manila 60
Manual MMDA Building Cmpd. Orense St. cor. EDSA
Guadalupe, Makati City 42
Manual National Bilibid Prison, Muntinlupa 25
Continuous De La Salle University, Taft, Manila 31
Continuous DPWH, Timog EDSA, Quezon City 46
29
31
REGION Monitoring
Method Station
PM10 Annual Mean
Values (μg/Ncm),
2015
Continuous Pamantasan ng Lungsod ng Valenzuela,
Valenzuela City 58*
NCR
Continuous Andrews Avenue, Pasay City 78*
Continuous Navotas City Hall, M. Naval St. Navotas
City 72
Continuous Rohm and Hass Property, Las Piñas City 35
Continuous Polytechnic Institute, City of Malabon 45
Continuous North Caloocan City Hall – Zapote Street,
Barangay 177, Caloocan City 54
Continuous Don Bosco Barangay Hall, Better Living
Subdivision, Paranaque City 52
Continuous Makati Park, Dr. Jose P. Rizal Extension,
East Rembo, Makati City 44*
Continuous Pateros Elementary School, Pateros City 52
Continuous Pinaglabanan Shrine, San Juan City 18*
Continuous Bureau of Corrections, New Bilibid Prison
Reservation, Muntinlupa City 31
Continuous Technological University of the Philip-
pines-Taguig Campus, Taguig City 66
Continuous Hardin ng Pagasa, Mandaluyong City
Hall, Plainview, Mandaluyong City 63*
Continuous Brgy. Oranbo, Pasig 69*
Continuous Parking Area of Marikina Justice Hall,
Marikina City 56
CAR Continuous Burnham park, Baguio City 35*
REGION 1
Manual City Plaza San fernando City, La Union 73*
Manual City Plaza San Carlos City, Pangasinan 75*
Manual Dagupan City, Province of Pangasinan,
Western Central Elementary School 68
Continuous Urdaneta, Pangasinan 47+
Continuous Mariano Marcos State University, Batac,
Ilocos Norte 24+
REGION 2 Manual St. Paul University Philippines, Mabini
Street, Tuguegarao City ND
REGION 3 Manual Meycauayan City Hall, Meycauayan, Bu-
lacan 45
Manual Heroes hall, San Fernando, City of San
Fernando, Pampanga 29 30
32
1 In Region 11, TSP levels were monitored in 4 monitoring stations in Davao City from
2008 to 2012 (see Figure 1-13). Except for a couple of monitoring results in 2 stations, TSP levels in Davao City monitoring sites had been in compliance with the guideline val-
ue of 90 µg/Ncm. To upgrade the monitoring station, since 2013, TSP monitoring had been replaced with PM10 monitoring in the Davao area.
Figure 1-14. TSP Annual Mean Values in Region 11, 2008-2012
Particulate Matter 10 (PM10): Annual trends
REGION Monitoring
Method Station
PM10
Annual Mean
Values (μg/Ncm),
2015
REGION 4A Continuous City of Biñan, San Pablo St., Biñan City,
Laguna 22*
REGION 4B
Manual Municipal Hall, Municipality of Baco, Ori-
ental Mindoro 60*
Continuous Palawan State University, Tiniguiban
Heights, Puerto Princesa, Palawan 26
REGION 5 Manual Barraida, Legaspi City 38
Continuous Naga City PENRO, Naga City 29
Manual University of San Augustin Campus, Iloilo
City 43*
REGION 6 Manual Leganes Municipal Grounds, Poblacion,
leganes, Iloilo City 51
Continuous City Hall of Bacolod, New Government
Center, Bacolod City 28
REGION 7 Manual Mabolo, Cebu City 52
Manual Cebu Business Park, Cebu city 34
REGION 8 Manual Robinsons Place, Tacloban 64+
REGION 9
Manual
Zamboanga City Medical Center. Com-
pound, Dr. Evangelista Street Corners Veterans Ave., & Gov. Lim Ave., Zambo-
anga City
32
Manual EMB-9 Compound, Lantawan, Pasonanca,
Zamboanga City 45
Manual
Philippine International Development In-
corporated (PHIDCO), Baliwasan Seaside Zamboanga City Zamboanga del Sur
60
Continuous Western Mindanao State University, Nor-
mal Road, Zamboanga City 11*
Continuous Ateneo De Zamboanga University, La
Purisima Street, Zamboanga City 20
REGION 10 Continuous Iligan Medical Center College, Palao, Ili-
gan City 49
REGION 11
Manual Approx. 70m from Amparo St. And 300m
from Davao-Agusan National Highway 35*
Manual Brgy. 12-B, Mapa St. Corner J.P Laurel
Ave., Davao City (Fronting Brgy. Hall) 45*
Manual
Approx. 800m DMPI main gate, Davao
Memorial Park Phase2, McArthur High-way, Matina, Davao City
34
31
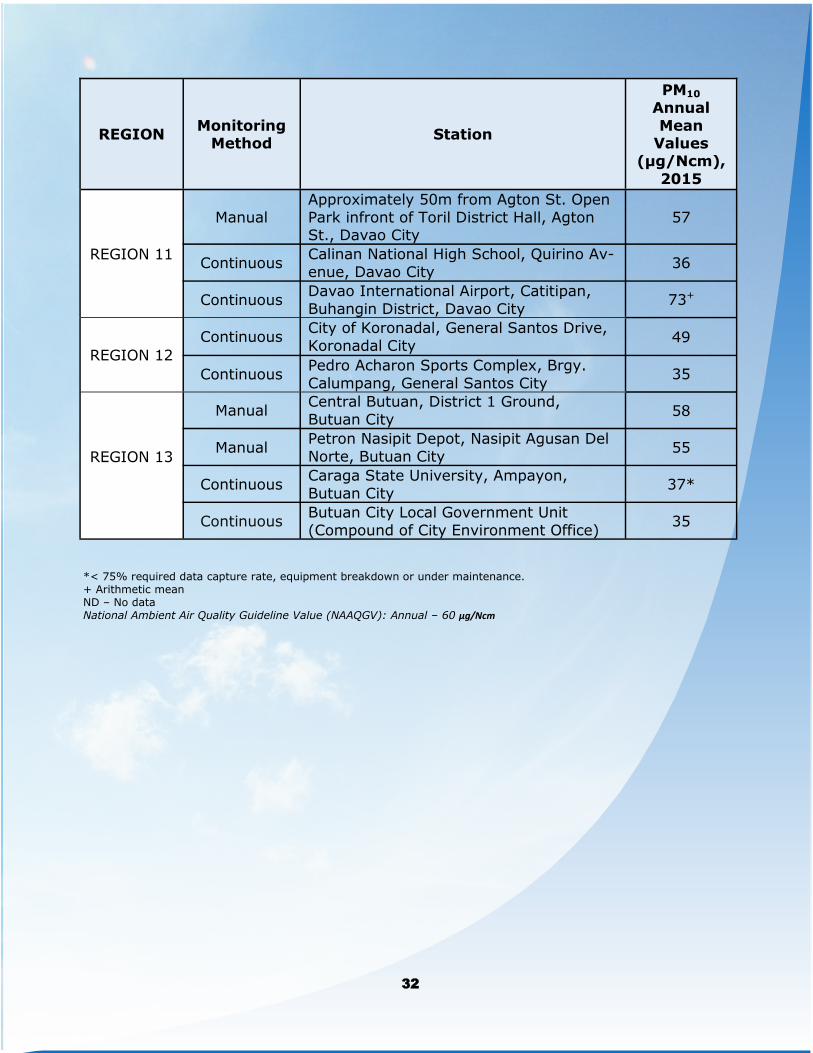
33
*< 75% required data capture rate, equipment breakdown or under maintenance. + Arithmetic mean ND – No data National Ambient Air Quality Guideline Value (NAAQGV): Annual – 60 μg/Ncm
REGION Monitoring
Method Station
PM10 Annual
Mean Values
(μg/Ncm),
2015
Manual
Approximately 50m from Agton St. Open
Park infront of Toril District Hall, Agton St., Davao City
57
REGION 11 Continuous
Calinan National High School, Quirino Av-
enue, Davao City 36
Continuous Davao International Airport, Catitipan,
Buhangin District, Davao City 73+
REGION 12
Continuous City of Koronadal, General Santos Drive,
Koronadal City 49
Continuous Pedro Acharon Sports Complex, Brgy.
Calumpang, General Santos City 35
REGION 13
Manual Central Butuan, District 1 Ground,
Butuan City 58
Manual Petron Nasipit Depot, Nasipit Agusan Del
Norte, Butuan City 55
Continuous Caraga State University, Ampayon,
Butuan City 37*
Continuous Butuan City Local Government Unit
(Compound of City Environment Office) 35
32
34
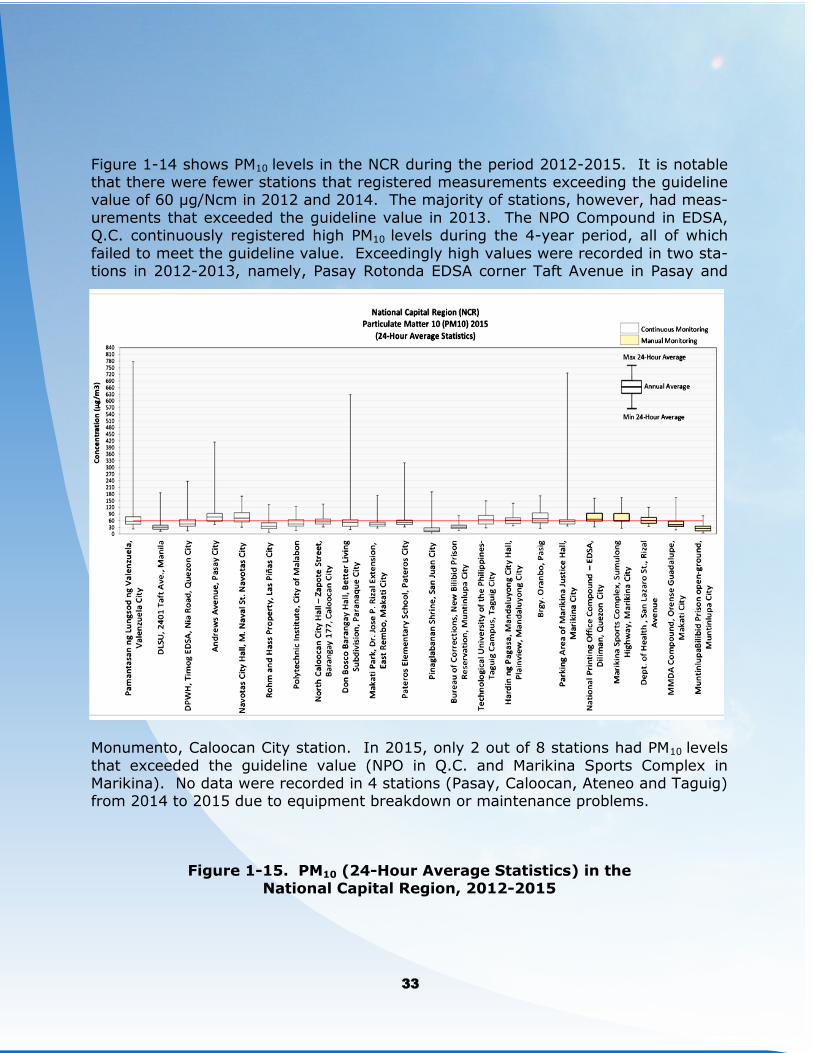
1
Figure 1-14 shows PM10 levels in the NCR during the period 2012-2015. It is notable that there were fewer stations that registered measurements exceeding the guideline value of 60 µg/Ncm in 2012 and 2014. The majority of stations, however, had meas-
urements that exceeded the guideline value in 2013. The NPO Compound in EDSA, Q.C. continuously registered high PM10 levels during the 4-year period, all of which
failed to meet the guideline value. Exceedingly high values were recorded in two sta-tions in 2012-2013, namely, Pasay Rotonda EDSA corner Taft Avenue in Pasay and
Monumento, Caloocan City station. In 2015, only 2 out of 8 stations had PM10 levels
that exceeded the guideline value (NPO in Q.C. and Marikina Sports Complex in Marikina). No data were recorded in 4 stations (Pasay, Caloocan, Ateneo and Taguig) from 2014 to 2015 due to equipment breakdown or maintenance problems.
Figure 1-15. PM10 (24-Hour Average Statistics) in the National Capital Region, 2012-2015
33
35
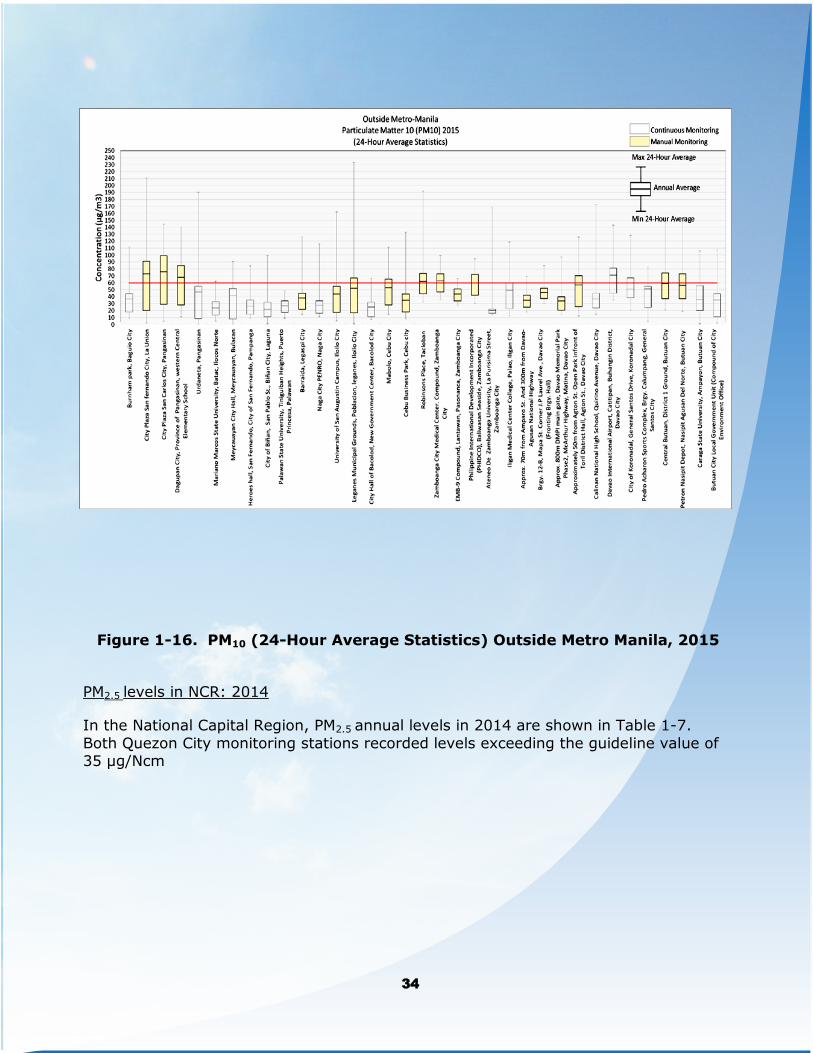
Figure 1-16. PM10 (24-Hour Average Statistics) Outside Metro Manila, 2015
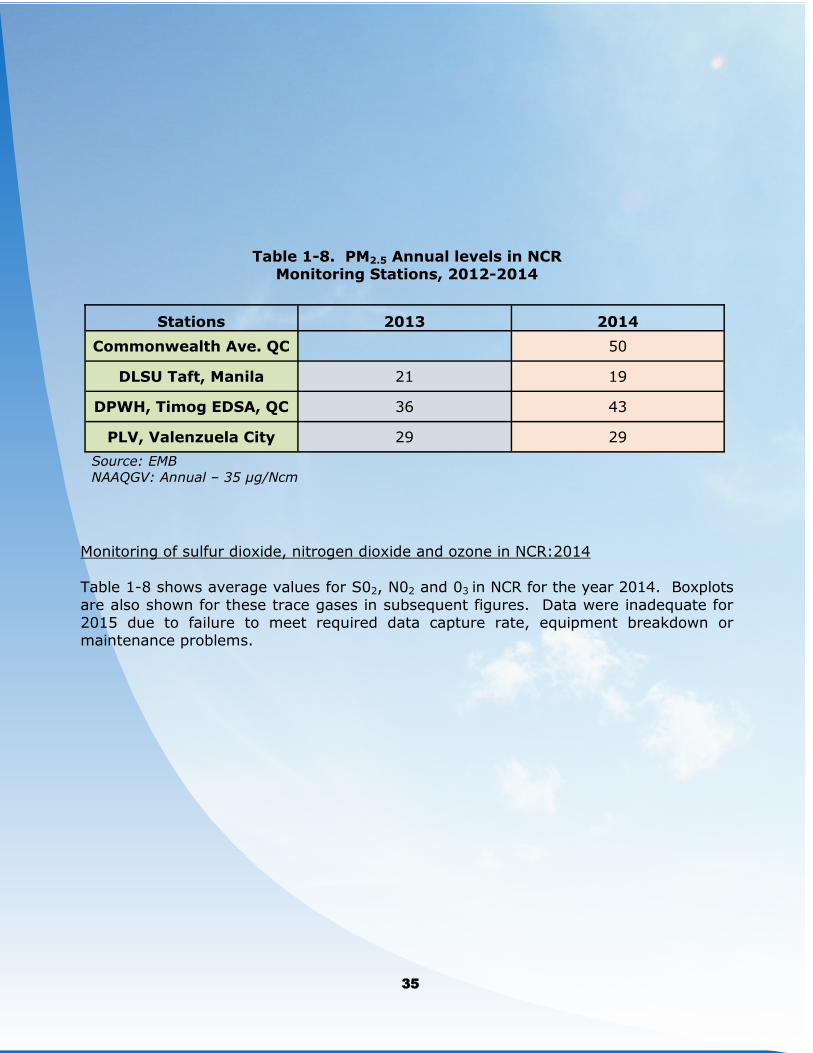
PM2.5 levels in NCR: 2014
In the National Capital Region, PM2.5 annual levels in 2014 are shown in Table 1-7.
Both Quezon City monitoring stations recorded levels exceeding the guideline value of 35 µg/Ncm
34
36
1
Table 1-8. PM2.5 Annual levels in NCR
Monitoring Stations, 2012-2014
Monitoring of sulfur dioxide, nitrogen dioxide and ozone in NCR:2014
Table 1-8 shows average values for S02, N02 and 03 in NCR for the year 2014. Boxplots
are also shown for these trace gases in subsequent figures. Data were inadequate for 2015 due to failure to meet required data capture rate, equipment breakdown or maintenance problems.
Stations 2013 2014
Commonwealth Ave. QC 50
DLSU Taft, Manila 21 19
DPWH, Timog EDSA, QC 36 43
PLV, Valenzuela City 29 29
Source: EMB
NAAQGV: Annual – 35 µg/Ncm
35
37
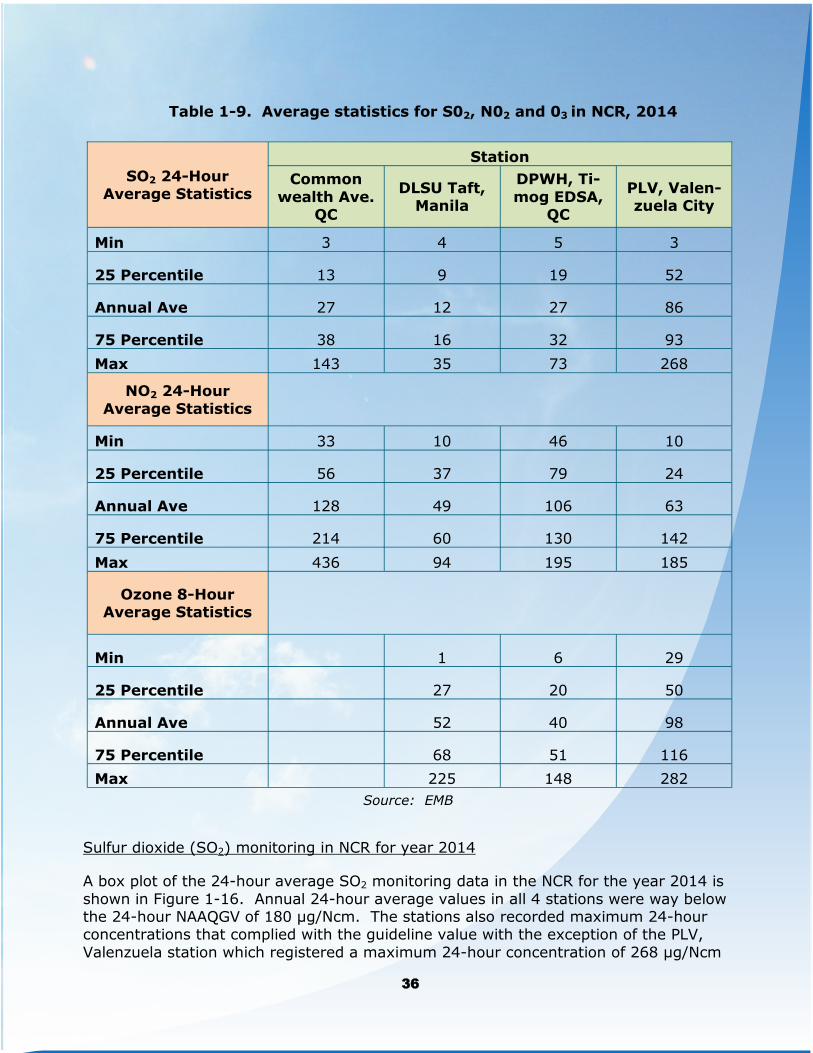
Table 1-9. Average statistics for S02, N02 and 03 in NCR, 2014
Source: EMB
Sulfur dioxide (SO2) monitoring in NCR for year 2014
A box plot of the 24-hour average SO2 monitoring data in the NCR for the year 2014 is
shown in Figure 1-16. Annual 24-hour average values in all 4 stations were way below the 24-hour NAAQGV of 180 μg/Ncm. The stations also recorded maximum 24-hour concentrations that complied with the guideline value with the exception of the PLV,
Valenzuela station which registered a maximum 24-hour concentration of 268 μg/Ncm
SO2 24-Hour Average Statistics
Station
Common
wealth Ave. QC
DLSU Taft, Manila
DPWH, Ti-
mog EDSA, QC
PLV, Valen-zuela City
Min 3 4 5 3
25 Percentile 13 9 19 52
Annual Ave 27 12 27 86
75 Percentile 38 16 32 93
Max 143 35 73 268
NO2 24-Hour
Average Statistics
Min 33 10 46 10
25 Percentile 56 37 79 24
Annual Ave 128 49 106 63
75 Percentile 214 60 130 142
Max 436 94 195 185
Ozone 8-Hour Average Statistics
Min 1 6 29
25 Percentile 27 20 50
Annual Ave 52 40 98
75 Percentile 68 51 116
Max 225 148 282
36
38
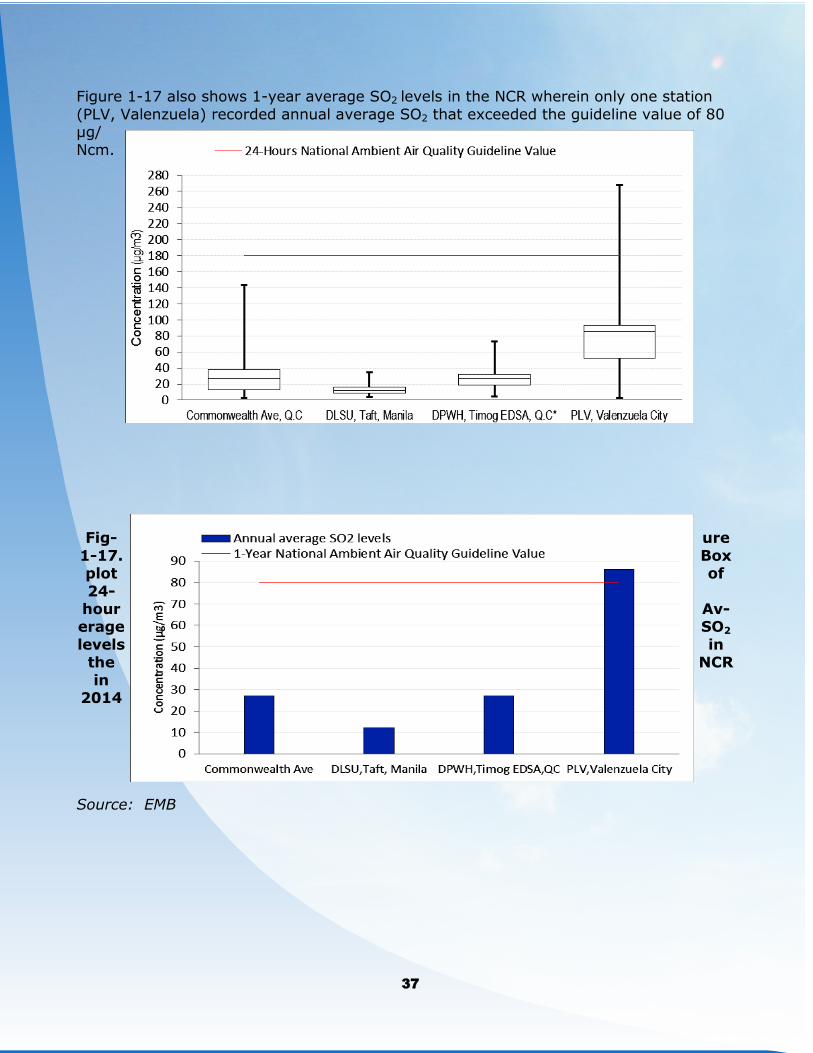
1 Figure 1-17 also shows 1-year average SO2 levels in the NCR wherein only one station
(PLV, Valenzuela) recorded annual average SO2 that exceeded the guideline value of 80 μg/
Ncm.
Fig- ure
1-17. Box plot of
24-hour Av-erage SO2
levels in the NCR
in 2014
Source: EMB
37
39
Fig-ure
1- 18. An-
nual average SO2 levels in the NCR in 2014
Source: EMB
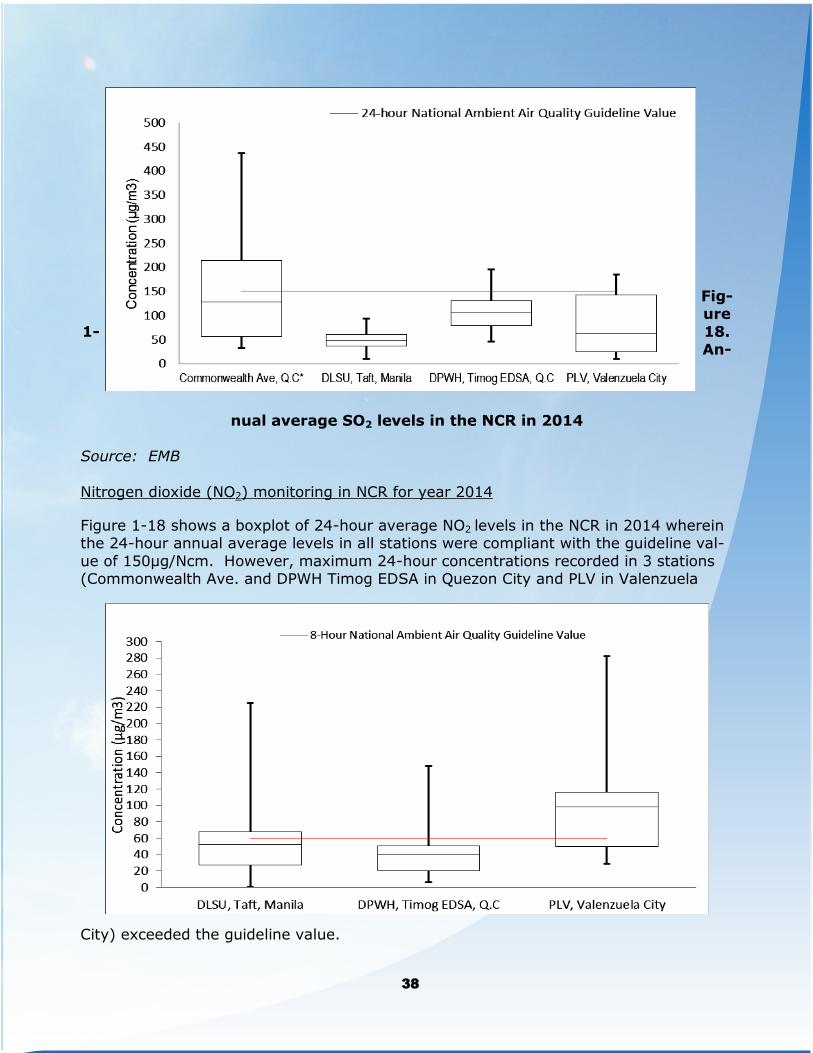
Nitrogen dioxide (NO2) monitoring in NCR for year 2014
Figure 1-18 shows a boxplot of 24-hour average NO2 levels in the NCR in 2014 wherein the 24-hour annual average levels in all stations were compliant with the guideline val-
ue of 150µg/Ncm. However, maximum 24-hour concentrations recorded in 3 stations (Commonwealth Ave. and DPWH Timog EDSA in Quezon City and PLV in Valenzuela
City) exceeded the guideline value.
38
40
1
Figure 1-19. Box plot of 24-hour Average NO2 levels in the NCR in 2014
Source: EMB
Ozone (O3) monitoring in NCR for year 2014
A boxplot of 8-hour average ozone levels in the NCR in 2014 shows that 2 out of 3 sta-
tions (DLSU Taft, Manila and DPWH Timog EDSA, Q.C.) recorded 8-hour annual average values that were within the guideline value of 60 μg/m3. The PLV Valenzuela station registered average and maximum levels exceeding the guideline value (see Figure 1-
19).
39
41
Figure 1-20. Box plot of 8-hour Average Ozone levels in the NCR in 2014 Source: EMB
1.3 Impacts of air pollution
Air quality is the overall description of air pollution levels in a defined area that may af-
fect the environment and public health. Over the years, increasing levels of air pollu-
tants from natural and human-related (anthropogenic) sources led to poor air quality.
According to the US EPA, an average adult inhales around 11,000 liters of air per day,
while children breathe greater volumes of air, hence greater amounts of air pollutants
which can lead to respiratory problems. In 2009, World Bank has estimated that annu-
ally, more than 1 million people get sick and 15,000 die prematurely due to outdoor air
pollution (OAP) in the Philippines. The annual cost of disease due to OAP is estimated to
be around Php 0.9 billion while the annual income loss from mortality is more than Php
5.0 billion. Thus, essentially, the cost of pollution is Php 5.9 billion annually. In other
parts of the world, air pollution has also been linked to changes in climate through dif-
ferent mechanisms such as shifting of monsoons and accelerated melting of polar ice
caps. Aside from these, several international studies including the Philippines have also
proven major agricultural productivity losses, posing a threat to food security. Air quali-
ty is therefore of great national concern as it can affect the country’s ecological balance
and the health of every individual.
1.3.1 Impacts on health
The main reason in abating air pollution is the detrimental effect it poses on human
health. As breathing clean air is a basic necessity for human well-being, elevated levels
of pollutants in the atmosphere is one of the most significant global health concerns.
The World Health Organization (WHO) reported in 2005 that urban indoor and outdoor
air pollution causes more than 2 million premature deaths worldwide, primarily affecting
populations of developing countries. In 2013, the International Agency for Research on
Cancer (IARC) of the WHO has also classified outdoor air pollution as the leading envi-
ronmental cause of cancer deaths.
Health effects of air pollution range from acute symptoms such as coughing and respir-
atory infections, to development of chronic diseases and even mortality. However, nu-
merous studies have proven that severity of effects depends on the specific pollutant
40
42
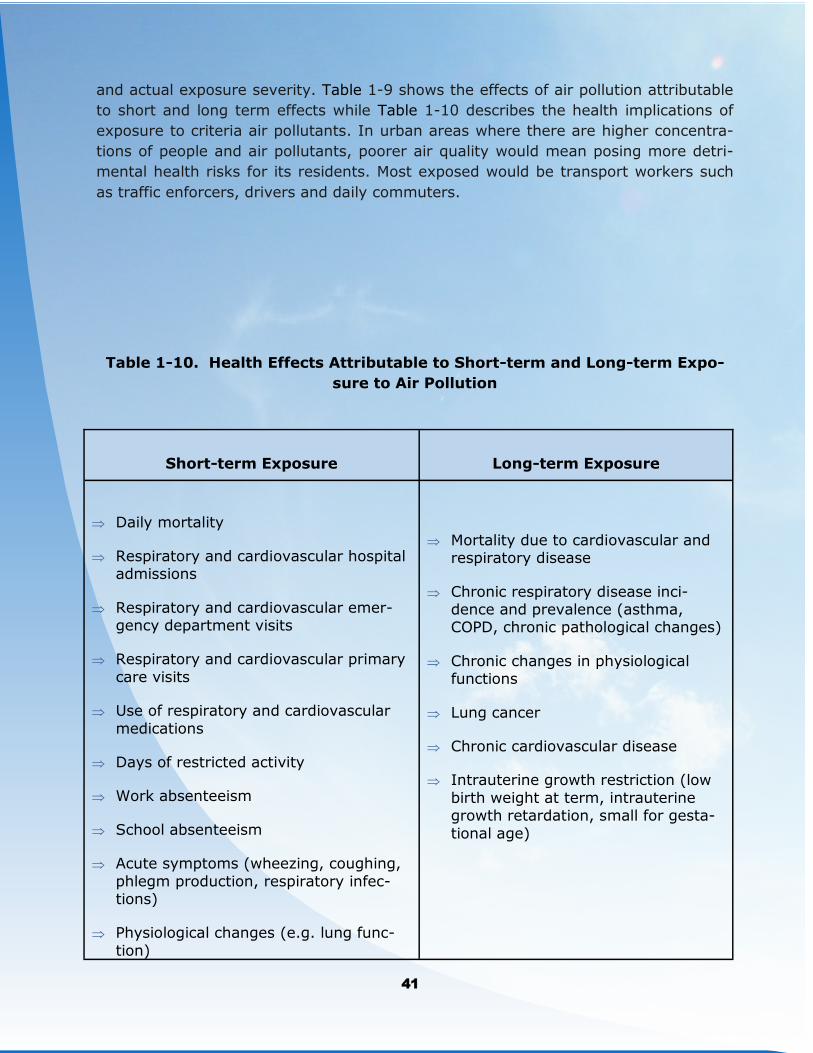
1 and actual exposure severity. Table 1-9 shows the effects of air pollution attributable
to short and long term effects while Table 1-10 describes the health implications of
exposure to criteria air pollutants. In urban areas where there are higher concentra-
tions of people and air pollutants, poorer air quality would mean posing more detri-
mental health risks for its residents. Most exposed would be transport workers such
as traffic enforcers, drivers and daily commuters.
Table 1-10. Health Effects Attributable to Short-term and Long-term Expo-
sure to Air Pollution
Short-term Exposure Long-term Exposure
Daily mortality
Respiratory and cardiovascular hospital admissions
Respiratory and cardiovascular emer-gency department visits
Respiratory and cardiovascular primary
care visits
Use of respiratory and cardiovascular
medications
Days of restricted activity
Work absenteeism
School absenteeism
Acute symptoms (wheezing, coughing,
phlegm production, respiratory infec-tions)
Physiological changes (e.g. lung func-
tion)
Mortality due to cardiovascular and respiratory disease
Chronic respiratory disease inci-dence and prevalence (asthma, COPD, chronic pathological changes)
Chronic changes in physiological functions
Lung cancer
Chronic cardiovascular disease
Intrauterine growth restriction (low
birth weight at term, intrauterine growth retardation, small for gesta-
tional age)
41
43
Also playing important roles are environmental factors and the susceptibility of the ex-
posed individual which is based on age, health status, diet, lifestyle and genetics. Chil-
dren are at higher risks since they breathe in higher volumes of air compared to adults.
Those with pre-existing cardiac or respiratory diseases are also more likely to experi-
ence more intense effects. Pregnant women, old and immune-compromised people are
also at higher risks.
World Bank reported that in 2001, the health costs of PM10 exposure in Metro Manila,
Baguio City, Cebu City and Davao City, are estimated to be over $430 million annually
due to 2,000 premature deaths and 9,000 people suffering from chronic bronchitis. Ac-
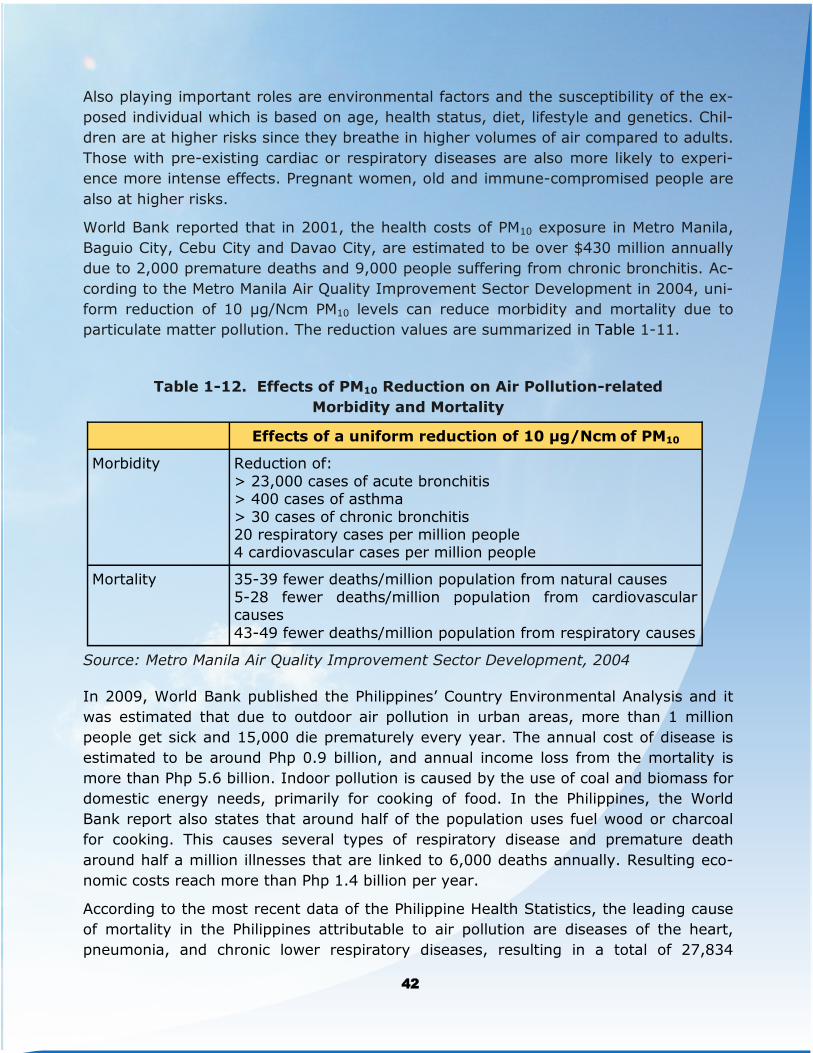
cording to the Metro Manila Air Quality Improvement Sector Development in 2004, uni-
form reduction of 10 µg/Ncm PM10 levels can reduce morbidity and mortality due to
particulate matter pollution. The reduction values are summarized in Table 1-11.
Table 1-12. Effects of PM10 Reduction on Air Pollution-related
Morbidity and Mortality
Source: Metro Manila Air Quality Improvement Sector Development, 2004
In 2009, World Bank published the Philippines’ Country Environmental Analysis and it
was estimated that due to outdoor air pollution in urban areas, more than 1 million
people get sick and 15,000 die prematurely every year. The annual cost of disease is
estimated to be around Php 0.9 billion, and annual income loss from the mortality is
more than Php 5.6 billion. Indoor pollution is caused by the use of coal and biomass for
domestic energy needs, primarily for cooking of food. In the Philippines, the World
Bank report also states that around half of the population uses fuel wood or charcoal
for cooking. This causes several types of respiratory disease and premature death
around half a million illnesses that are linked to 6,000 deaths annually. Resulting eco-
nomic costs reach more than Php 1.4 billion per year.
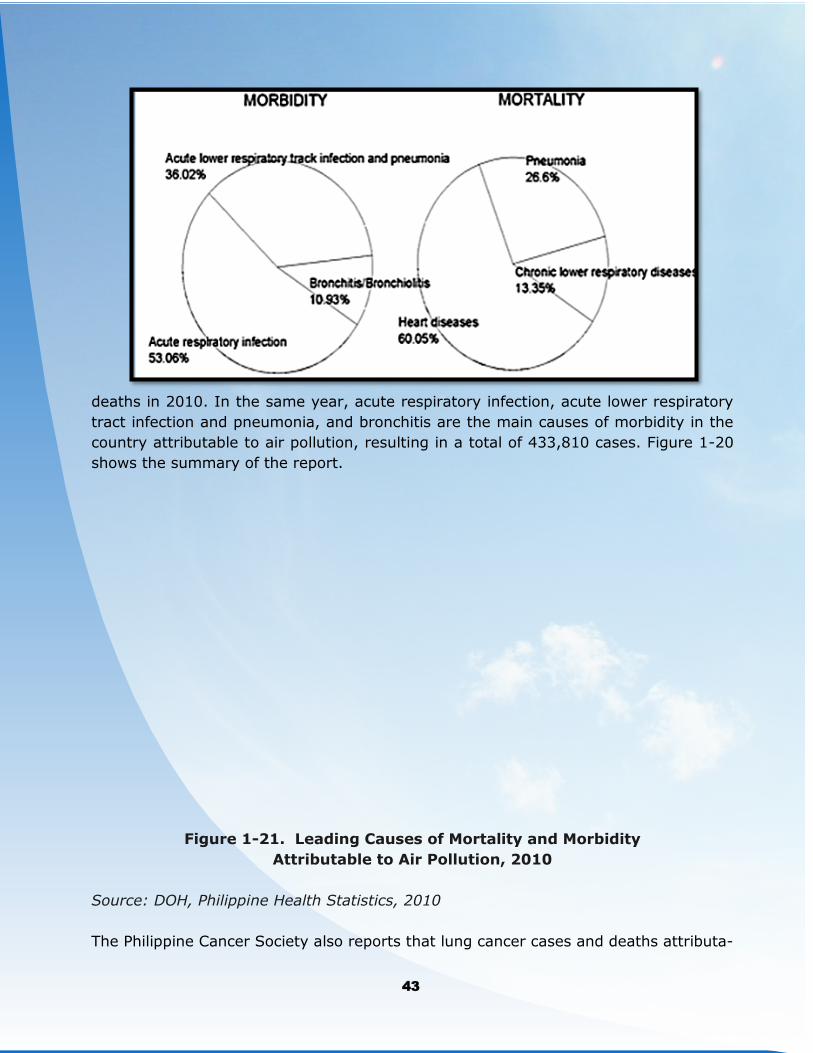
According to the most recent data of the Philippine Health Statistics, the leading cause
of mortality in the Philippines attributable to air pollution are diseases of the heart,
pneumonia, and chronic lower respiratory diseases, resulting in a total of 27,834
Effects of a uniform reduction of 10 µg/Ncm of PM10
Morbidity Reduction of:
> 23,000 cases of acute bronchitis > 400 cases of asthma
> 30 cases of chronic bronchitis 20 respiratory cases per million people 4 cardiovascular cases per million people
Mortality 35-39 fewer deaths/million population from natural causes
5-28 fewer deaths/million population from cardiovascular causes
43-49 fewer deaths/million population from respiratory causes
42
44
1
deaths in 2010. In the same year, acute respiratory infection, acute lower respiratory
tract infection and pneumonia, and bronchitis are the main causes of morbidity in the
country attributable to air pollution, resulting in a total of 433,810 cases. Figure 1-20
shows the summary of the report.
Figure 1-21. Leading Causes of Mortality and Morbidity
Attributable to Air Pollution, 2010
Source: DOH, Philippine Health Statistics, 2010
The Philippine Cancer Society also reports that lung cancer cases and deaths attributa-
43
45
ble to air pollution are 2,930 and 2,700, respectively in 2005 and these values de-
creased to 1,948 and 1,561, respectively, in 2010.
1.3.2 Impacts on Climate and Influence on Atmospheric Conditions
Air pollution has been linked to changes in climate through different mechanisms. For
instance, particle pollutants affect climate directly by absorbing sunlight, thus heating
the surface atmosphere. Such is the effect of black carbon, commonly known as soot.
Indirectly, soot of finer sizes forms clouds with smaller droplet sizes, forming small
cloud droplets that acts as mirrors and reflects back heat towards the earth’s surface.
Direct effects include the general ability of soot to absorb heat from surroundings. This
results in elevated ambient temperatures on the Earth’s surface that further leads to
warmer air and ocean temperatures, more high-intensity rainfall events and more fre-
quent heat waves. As ambient temperatures become much higher due to climate
change, this also promotes the formation of ozone (O3) smog from nitrogen oxide com-
pounds, thus aggravating atmospheric pollution and its health effects.
Particles such as sulfates and nitrates, on the other hand, have a cooling effect, as it re-
flects sunlight. Indirectly, particles can affect climate by influencing precipitation and
cloud formation by acting as condensation nuclei or ‘cloud seeds’ where water vapor
condenses on.
The PAGASA has published “Climate Change in the Philippines” in 2011 discussing the
climate trends in the country from 1951 to 2009, with the average period of 1971 to
2000 as a reference value. The key findings include increase in annual mean tempera-
ture by 0.57˚C and significant increase in number of hot days but decrease in cool
nights. There is no indication of an increase in frequency of occurrence of typhoons, but
a very slight increase in number of cyclones greater than 150kph and above. However,
there had been no reference made on the actual effect of air pollution levels in the
country on these changes in climate.
Atmospheric conditions which can affect air pollutant levels include ambient tempera-
ture, pressure and amount of rainfall. Cooler temperatures during dry months make the
air more dense, bringing pollutants at a much lower altitude where it is at breathing lev-
el. High pressure systems also induce inversion layers, wherein cold air is trapped close
to the surface. This prevents pollution dispersion, and can lead to smog formation. In
some of the monitoring stations in the Philippines where the samplers are coupled to or
near a weather station, the basic observation is the decrease in particulate levels during
rainy season as the pollutants are washed out by precipitation and there are stronger
winds for pollutant dispersion.
1.3.3 Impacts on Agriculture
Poor air quality adversely affects organisms and the ecological systems with which they
thrive in. Aside from affecting humans, air pollutants also have a detrimental impact on
44
46
1 plants because of its immobility. Some of the major phytotoxic (substances which pose a
certain toxicity to plants) pollutants are O3, SO2, NO2, H2S, F2 and peroxyl acyl nitrate,
NH3 and particulate matter. Symptoms of the effects of these pollutants to crops are de-
tailed in Table 1-12. Effects of air pollution on plants can be visible, such as loss of color,
necrosis, decrease in yield and morphological changes. Non-visible effects have also
been determined wherein the physiological and biochemical process of the plant is al-
tered, thus changing the rate of metabolism and photosynthesis.
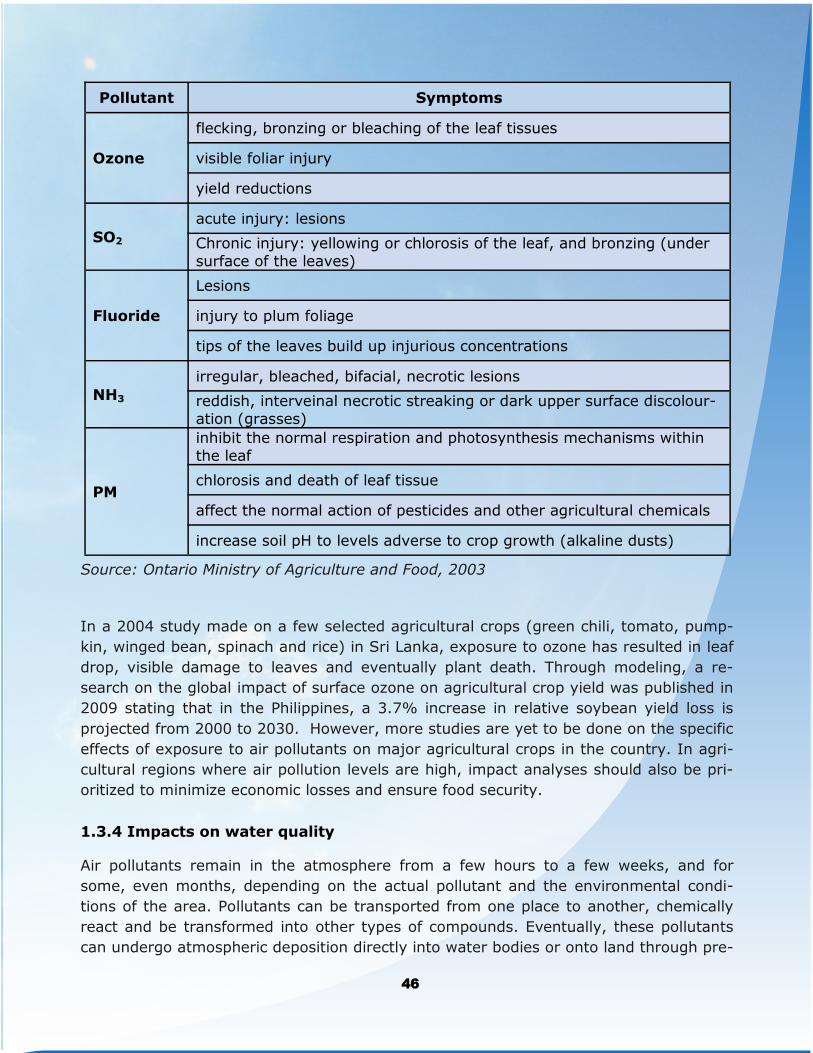
Table 1-13. Symptoms of Effects of Air Pollutants on Plants
45
47
Source: Ontario Ministry of Agriculture and Food, 2003
In a 2004 study made on a few selected agricultural crops (green chili, tomato, pump-
kin, winged bean, spinach and rice) in Sri Lanka, exposure to ozone has resulted in leaf
drop, visible damage to leaves and eventually plant death. Through modeling, a re-
search on the global impact of surface ozone on agricultural crop yield was published in
2009 stating that in the Philippines, a 3.7% increase in relative soybean yield loss is
projected from 2000 to 2030. However, more studies are yet to be done on the specific
effects of exposure to air pollutants on major agricultural crops in the country. In agri-
cultural regions where air pollution levels are high, impact analyses should also be pri-
oritized to minimize economic losses and ensure food security.
1.3.4 Impacts on water quality
Air pollutants remain in the atmosphere from a few hours to a few weeks, and for
some, even months, depending on the actual pollutant and the environmental condi-
tions of the area. Pollutants can be transported from one place to another, chemically
react and be transformed into other types of compounds. Eventually, these pollutants
can undergo atmospheric deposition directly into water bodies or onto land through pre-
Pollutant Symptoms
Ozone
flecking, bronzing or bleaching of the leaf tissues
visible foliar injury
yield reductions
SO2
acute injury: lesions
Chronic injury: yellowing or chlorosis of the leaf, and bronzing (under
surface of the leaves)
Fluoride
Lesions
injury to plum foliage
tips of the leaves build up injurious concentrations
NH3
irregular, bleached, bifacial, necrotic lesions
reddish, interveinal necrotic streaking or dark upper surface discolour-
ation (grasses)
PM
inhibit the normal respiration and photosynthesis mechanisms within
the leaf
chlorosis and death of leaf tissue
affect the normal action of pesticides and other agricultural chemicals
increase soil pH to levels adverse to crop growth (alkaline dusts)
46
48
1
cipitation, in dust or through gravity. Once in land, it can be eroded into water bodies
mainly through surface run-off or water flow from land.
Once the pollutants are in aquatic systems, they can affect the water quality by be-
coming water contaminants. During rainy season in the Philippines when measured air
pollutant levels are observed to be less, the air pollutants may be dispersed, trans-
ported to other areas, directly deposited to water systems or carried by rainfall down
to the land, and eventually end up in canal systems, rivers or oceans. Aside from the
determination of pollutant levels in the atmosphere, its deposition rates should also be
analyzed in order to have an idea of atmospheric contribution to levels of water pollu-
tion, ensuring an integrated approach to environmental safety and management for
the country.
1.3.5 Other impacts: poor visibility
Aside from alarming hazards to health, excessively high concentrations of air pollu-
tants can result in poor visibility that may affect transportation safety. During New
Year’s celebrations in the Philippines, pollutant levels go as high as ten times the
NAAQGV due to the use of fireworks and firecrackers.
47
49
1.4 Air Quality Management
1.4.1 DENR-Environmental Management Bureau
From the enactment of RA 8749 in 1999 to 2015, the accomplishments of DENR through
Environmental Management Bureau include the designation of airsheds throughout the
Philippines, establishment and operationalization of the Air Quality Management Fund
(AQMF), establishment of Ambient Air Quality Monitoring Network nationwide, emissions
inventory every three years and management of mobile and stationary sources. These
are done through Memorandum Circulars (MC), Department Administrative Orders
(DAO), Joint Administrative Orders (JAO).
Airsheds
One of the Air Quality Principles stated in the IRR of RA 8749 is the recognition that the
cleaning of the environment is primarily area-based and that air quality management and control are most effective at the level of airsheds. As defined in the act, “Airsheds”
are areas with similar climate, meteorology and topology which affect the interchange and diffusion of pollutants in the atmosphere. Sub-areas within airsheds may therefore
have similar air quality, and face similar problems, development programs and prospects
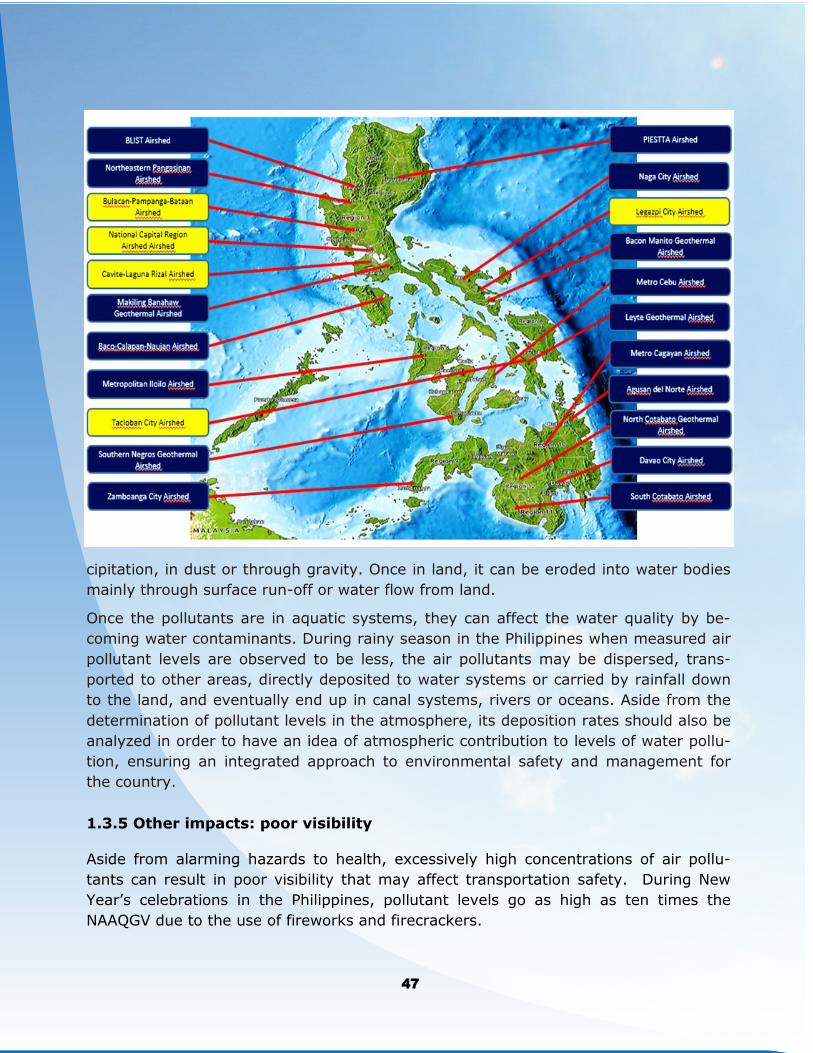
Figure 1-22. Designated Airsheds in the Philippines,2015
As of 2015, there was a total of 22 airsheds in the Philippines. (see Figure 1-21). Also
included are geothermal airsheds that are specially designated due to the presence of a
geothermal plant in the area. For airsheds officially designated, Governing Boards have
also been established which oversee the planning and implementation of air quality man-
agement policies and ensure strong coordination among government agencies and be-
tween government agencies and private sector / civil society.
Air Quality Management Fund
48
50
1 As established by the IRR of RA 8739, the Air Quality Management Fund (AQMF) is a
special account in the National Treasury established to finance containment, removal, and clean-up operations of air pollution cases, guarantee restoration of ecosystems
and rehabilitate areas affected by the acts of RA 8749 violators, to support research, enforcement and monitoring activities and capabilities of the relevant agencies, as well as to provide technical assistance to the relevant agencies. In order to do these
undertakings, such fund may be allocated per airshed. In 2012, no budget was re-leased by the Department of Budget and Management (DBM) but in 2013, Php 35 mil-
lion was allocated to 16 regions (Php 2 million each) and Php 3 million to the DENR Central Office. In 2014, no budget was released but in 2015, DBM allocated PHP 35 million to EMB central and regional offices. The process of disbursement is the same
as Regular Fund (101) wherein the Total Capital Outlay is Php 31.5 million and the Total Maintenance and other Operating Expenses is Php 3.5 million.
Management of Stationary Sources
All trade, industry, process, fuel-burning equipment or industrial plant emitting air
pollutants are classified as stationary sources. All stationary sources must have a Per-
mit to Operate (PTO), issued by the DENR upon compliance with the standards speci-
fied in the IRR of RA 8739 called the National Emission Standards for Source Specific
Air Pollutants (NESSAP). In order to properly manage stationary sources, close moni-
toring of all firms within the region should be performed, imposing the necessary fees
to be paid and issuance of a Notice of Violation (NOV) in the case of non-compliance.
Pollution Control Officers (PCOs) are required to be designated by industries to over-
see all operations related to air pollution source and control facilities, and to submit to
the DENR Quarterly Self-Monitoring Reports.
Establishment owners are encouraged to install high-technology facilities and perform
mitigating measures to lessen air pollutants generated during their operation. In large
-scale industries such as cement plants, beverages manufacturing plants and power
generating plants, the Multipartite Monitoring Teams (MMT) of the project and compa-
ny establishes ambient air quality monitoring stations. A Continuous Emission Moni-
toring System (CEMS) is specifically required to be installed in the following major in-
dustries for particulates and SO2 emissions:
a) Fossil fuel-fired power plant over 10 megawatt (MW) rating (including NOx);
b) Petroleum refinery, petrochemical industries (including NOx);
c) Primary copper smelter (including NOx);
d) Steel plant, ferro-alloy production facility (particulates only); and
e) Cement Plant (particulates only)
Industrial Emission Management Program
The Industrial Emission Management Program (IEMP) ensures compliance of indus-
49
51
tries to the emission standards set by the Bureau. Thus, issuance of permit and regular
monitoring is done. With the increasing number of stationary sources, extensive monitor-
ing is required. In order to monitor all sources with potential to emit air pollution, the
Bureau accredits Third Party Source Emission Testing firms (TPSETF) to carry out source
emission test and effectively perform sampling activities in accordance with the provi-
sions of CAA and its Implementing Rules and Regulations.
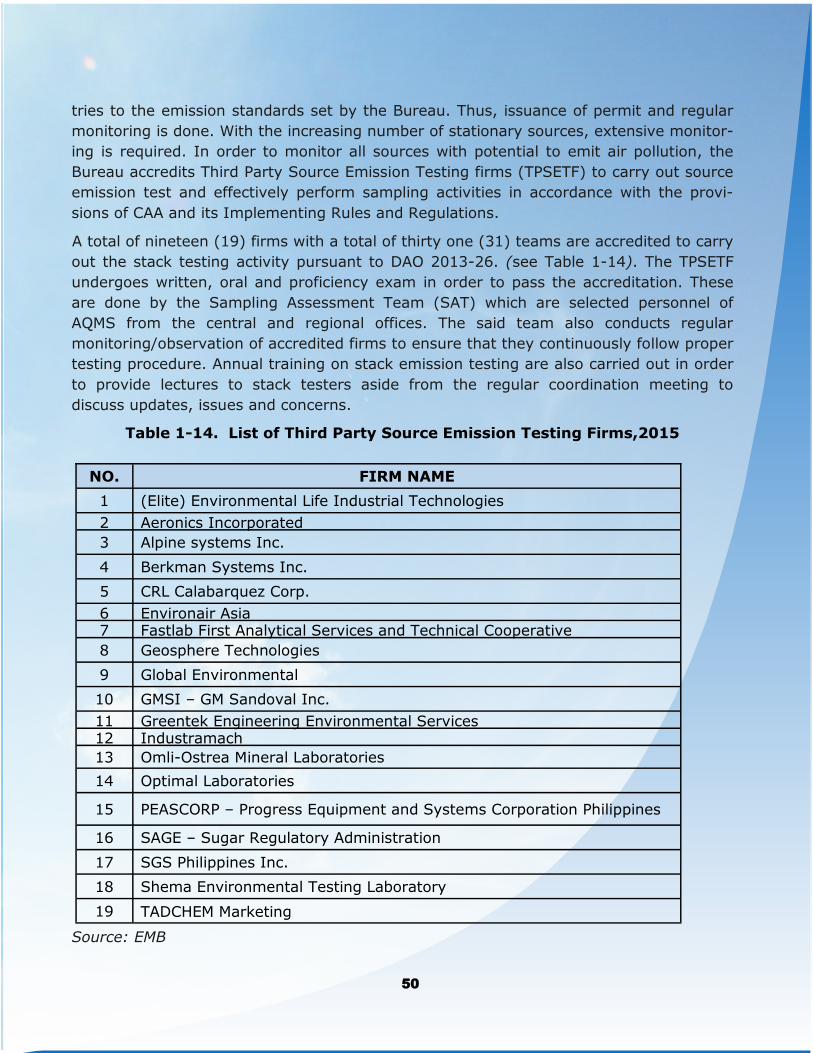
A total of nineteen (19) firms with a total of thirty one (31) teams are accredited to carry
out the stack testing activity pursuant to DAO 2013-26. (see Table 1-14). The TPSETF
undergoes written, oral and proficiency exam in order to pass the accreditation. These
are done by the Sampling Assessment Team (SAT) which are selected personnel of
AQMS from the central and regional offices. The said team also conducts regular
monitoring/observation of accredited firms to ensure that they continuously follow proper
testing procedure. Annual training on stack emission testing are also carried out in order
to provide lectures to stack testers aside from the regular coordination meeting to
discuss updates, issues and concerns.
Table 1-14. List of Third Party Source Emission Testing Firms,2015
Source: EMB
NO. FIRM NAME
1 (Elite) Environmental Life Industrial Technologies
2 Aeronics Incorporated
3 Alpine systems Inc.
4 Berkman Systems Inc.
5 CRL Calabarquez Corp.
6 Environair Asia 7 Fastlab First Analytical Services and Technical Cooperative
8 Geosphere Technologies
9 Global Environmental
10 GMSI – GM Sandoval Inc.
11 Greentek Engineering Environmental Services 12 Industramach
13 Omli-Ostrea Mineral Laboratories
14 Optimal Laboratories
15 PEASCORP – Progress Equipment and Systems Corporation Philippines
16 SAGE – Sugar Regulatory Administration
17 SGS Philippines Inc.
18 Shema Environmental Testing Laboratory
19 TADCHEM Marketing
50
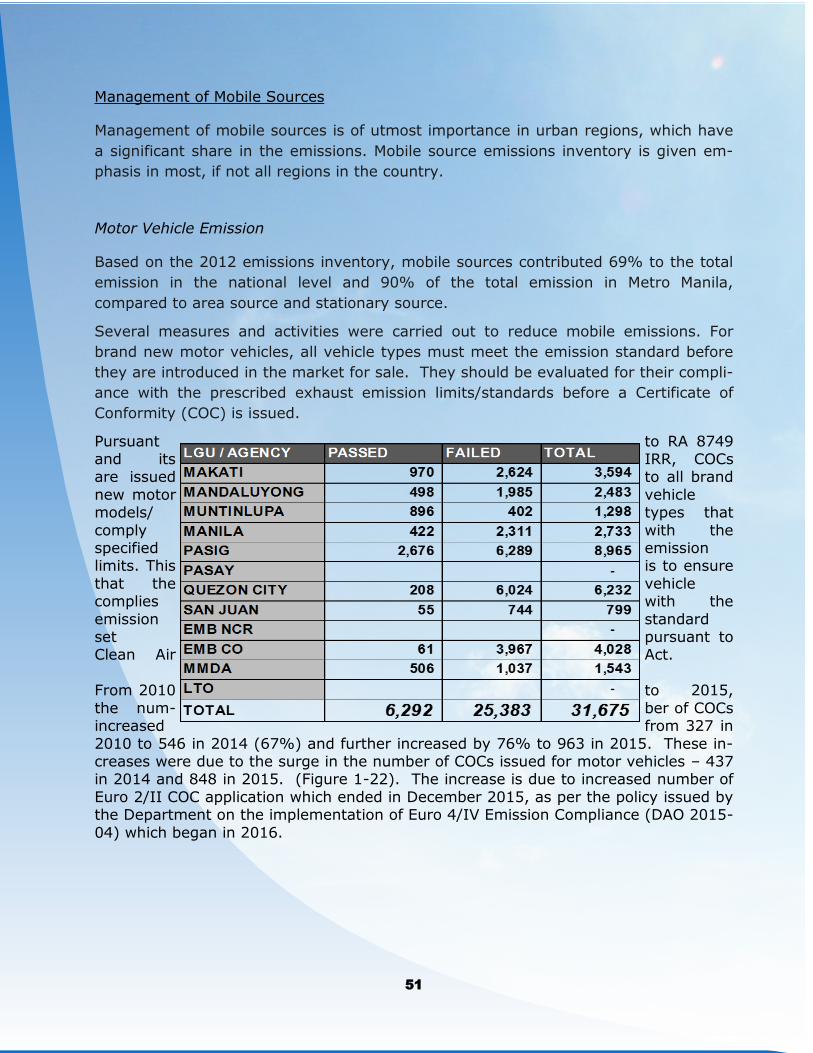
52
1 Management of Mobile Sources
Management of mobile sources is of utmost importance in urban regions, which have
a significant share in the emissions. Mobile source emissions inventory is given em-
phasis in most, if not all regions in the country.
Motor Vehicle Emission
Based on the 2012 emissions inventory, mobile sources contributed 69% to the total
emission in the national level and 90% of the total emission in Metro Manila,
compared to area source and stationary source.
Several measures and activities were carried out to reduce mobile emissions. For
brand new motor vehicles, all vehicle types must meet the emission standard before
they are introduced in the market for sale. They should be evaluated for their compli-
ance with the prescribed exhaust emission limits/standards before a Certificate of
Conformity (COC) is issued.
Pursuant to RA 8749 and its IRR, COCs are issued to all brand
new motor vehicle models/ types that
comply with the specified emission limits. This is to ensure
that the vehicle complies with the
emission standard set pursuant to Clean Air Act.
From 2010 to 2015,
the num- ber of COCs increased from 327 in
2010 to 546 in 2014 (67%) and further increased by 76% to 963 in 2015. These in-creases were due to the surge in the number of COCs issued for motor vehicles – 437 in 2014 and 848 in 2015. (Figure 1-22). The increase is due to increased number of
Euro 2/II COC application which ended in December 2015, as per the policy issued by the Department on the implementation of Euro 4/IV Emission Compliance (DAO 2015-
04) which began in 2016.
51
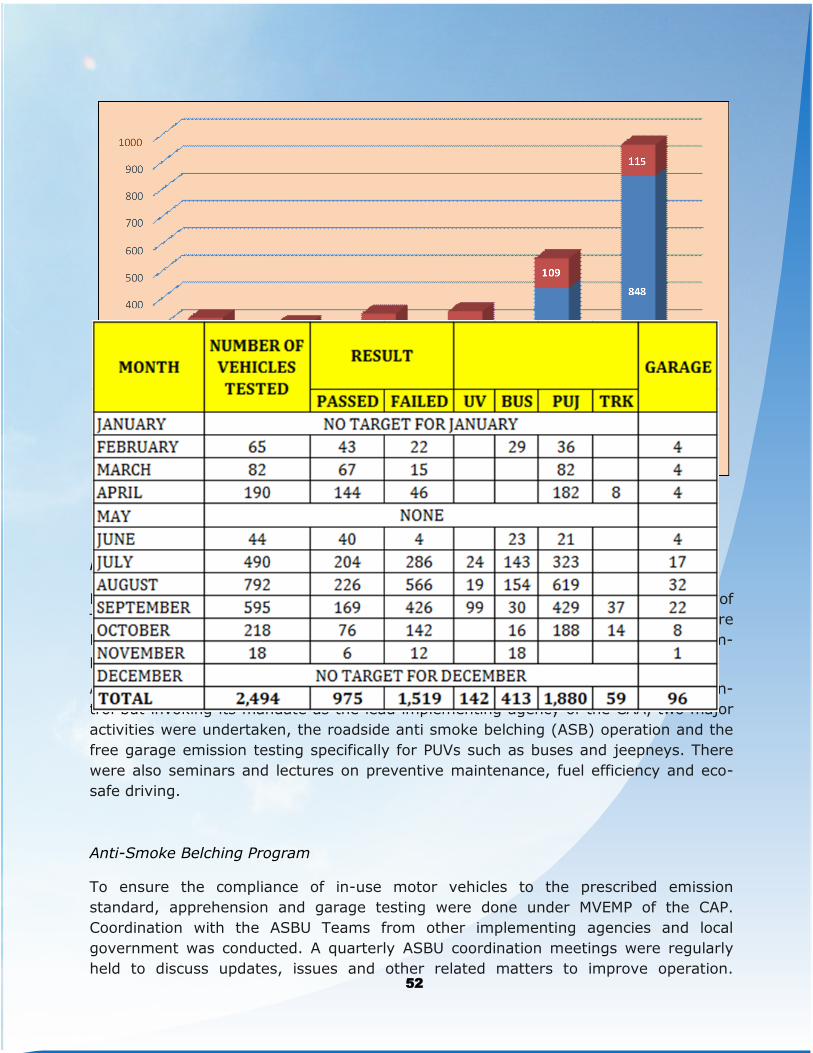
53
Figure 1-23. Number of COCs Issued from 2010 to 2015
Motor Vehicle Inspection Program
Pursuant to RA 8749, Private Emission Testing Centers (PETCs) are Department of
Trade and Industry (DTI) accredited, LTO-authorized and use equipment that are
DENR-certified. Monitoring of PETCs is accomplished through a composite team com-
prised of DTI, DENR and DOTr-LTO.
Although EMB-DENR is not the lead implementing agency for vehicular emission con-
trol but invoking its mandate as the lead implementing agency of the CAA, two major
activities were undertaken, the roadside anti smoke belching (ASB) operation and the
free garage emission testing specifically for PUVs such as buses and jeepneys. There
were also seminars and lectures on preventive maintenance, fuel efficiency and eco-
safe driving.
Anti-Smoke Belching Program
To ensure the compliance of in-use motor vehicles to the prescribed emission
standard, apprehension and garage testing were done under MVEMP of the CAP.
Coordination with the ASBU Teams from other implementing agencies and local
government was conducted. A quarterly ASBU coordination meetings were regularly
held to discuss updates, issues and other related matters to improve operation. 52
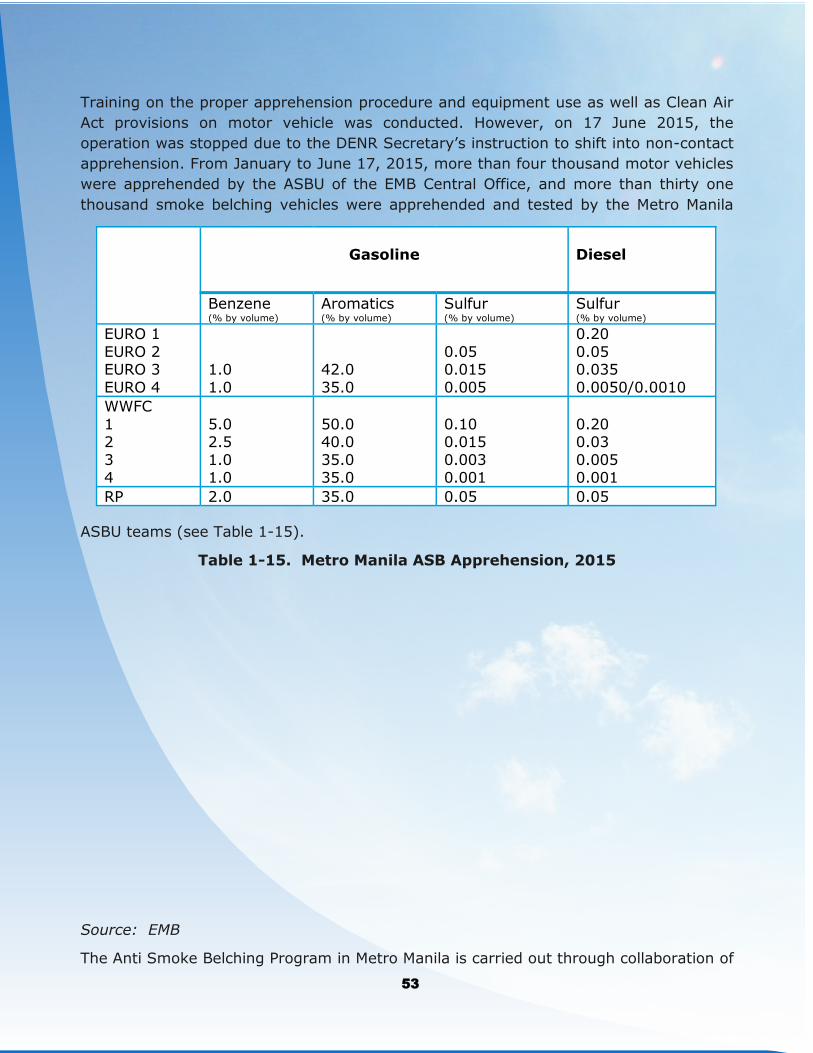
54
1 Training on the proper apprehension procedure and equipment use as well as Clean Air
Act provisions on motor vehicle was conducted. However, on 17 June 2015, the
operation was stopped due to the DENR Secretary’s instruction to shift into non-contact
apprehension. From January to June 17, 2015, more than four thousand motor vehicles
were apprehended by the ASBU of the EMB Central Office, and more than thirty one
thousand smoke belching vehicles were apprehended and tested by the Metro Manila
ASBU teams (see Table 1-15).
Table 1-15. Metro Manila ASB Apprehension, 2015
Source: EMB
The Anti Smoke Belching Program in Metro Manila is carried out through collaboration of
Gasoline
Diesel
Benzene (% by volume)
Aromatics (% by volume)
Sulfur (% by volume)
Sulfur (% by volume)
EURO 1
EURO 2 EURO 3
EURO 4
1.0
1.0
42.0
35.0
0.05 0.015
0.005
0.20
0.05 0.035
0.0050/0.0010
WWFC
1 2
3 4
5.0 2.5
1.0 1.0
50.0 40.0
35.0 35.0
0.10 0.015
0.003 0.001
0.20 0.03
0.005 0.001
RP 2.0 35.0 0.05 0.05
53
55
efforts from CAA Implementing Agencies DENR- EMB, DOTr-LTO, and Metro Manila De-
velopment Authority (MMDA), and the Local Government Units (LGUs). Eight (8) LGUs
with ASB Ordinance namely Makati, Mandaluyong, Muntinlupa, Manila, Pasig, Pasay,
Quezon City, and San Juan are regularly apprehending smoke belching vehicles within
their area of jurisdiction. Their apprehension data are regularly reported every quarter
during the quarterly Metro Manila Anti Smoke Belching Units Coordination meeting which
is being organized by EMB Central Office. The said coordination meeting is an avenue to
discuss whereabouts of the operation and the issues dealt by the apprehending officers.
Recently, the Ombudsman Office (Environmental Ombudsman) also joined the regular
coordination meeting due to increasing concerns in the ASBU Operation.
Garage testing
Garage Testing successfully engaged the cooperation of Metro Manila bus operators and
public utility jeepneys (PUJs). Assistance provided by this program include free emission
testing, information and education campaign on fuel efficiency and management and
regular vehicle maintenance. Out of 2,494 vehicles tested, 975 passed while 1,519 failed
the vehicle emission standard (see Table 1-16).
Table 1-16. Garage Testing, 2015
Source: EMB
Regulation of fuels, additives and substances
Table 1-16 shows the fuel specifications based on different standard levels, and based on maximum % sulfur content, the Philippines should have followed Euro 2/II standards by
2004 as specified in RA 8749. However, the Euro 2/II emission standard was only im-posed in January 2008. As early as 2005, discussions on implementing Euro 4/IV equiva-
lent standards for diesel and petroleum were already underway. In 2009, the target date for implementation was set to 2012, two years later than the original 2010 date. Finally, in 2015, the DENR issued an administrative order directing the implementation of Motor
Vehicle Emission limits for Euro 4/IV and In-use Vehicle Emission Standards beginning July 1, 2015, with full implementation on January 1, 2016.
In support to this, another government agency in the Philippines, the Department of En-ergy, issued a circular mandating the manufacture and sale of Euro IV automotive diesel
oil and gasoline (with 50 ppm sulfur content) nationwide effective January 1, 2016.
Table 1-17. Fuel specifications based on different standard levels.
54
56
Philippine Walkable-Bikeable Communities Awards’-“Bayanihan sa Daan”
The Special Recognition and Launching of the Philippine Walkable-Bikeable Communities
Awards’-“Bayanihan sa Daan” was held on November 27, 2014 at the Kalayaan Hall,
Malacañan Palace. The recognition aimed to highlight efforts made by local government
units and individuals around the country to transform the roads into more walkable and
bikeable communities, or pockets of promising and successful initiatives in the Road
Sharing Campaign.
This is co-organized by the DENR-EMB with concerned civil society organizations and
government offices which include the Office of the President, Office of the Presidential
Adviser for Environmental Protection and the Climate Change Commission, and the De-
partments of Public Works and Highways, Transportation, Interior and Local Government.
Among the recognized walkable-bikeable communities LGUs were Cebu, Iloilo, Marikina,
Pasig and Vigan City.
Clean Air Concert, Youth Forum and Exhibits
The first Clean Air Concert was held in 2012, with the theme, “Clean Air? Pwede!” in Em-
erald Avenue, Pasig City. This was followed by Ayoko Mag-gas mask” in 2014, at Fair-
view Terraces Activity Center, Quezon City and “Perwisyong Usok Pigilan, Konting Abala
Laking Ginhawa ”in 2015.
The Clean Air Concert was organized by the DENR through EMB with the Earth Day Jam
Foundation. The concert aimed to promote awareness on the quality of air in Metro Ma-
nila, and urge action for the Filipinos, particularly the youth, to combat the ill effects of
air pollution, through biking, no smoking, preventive maintenance of vehicles, no burning
of garbage and climate change.
Clean Air Fiesta Caravan
Following the theme “Usok Mo, Buhay Ko,” in 2012, Clean Air Fiesta Caravan was held at
different communities in Metro Manila to promote awareness on the ill effects of air pollu-
tion and actions to help clean the air. The caravan was co-organized by the EMB and the
Philippine Medical Association, which featured medical lectures, painting contests and en-
vironmental lectures on clean air management.
Regional Information and Education Campaigns
To alleviate massive deforestation in Cordillera Administrative Region, the website
named “GREENITIATIVE” was created to promote social mobilization and consciousness
on forest significance. Lectures were also given to officials, students and teachers within
54
57
1 the Baguio, La Trinidad, Itogon, Sabang, Trinidad (BLISTT) Airshed municipalities. Plans
and programs are also discussed and promoted over DZEQ Radyo ng Bayan, a govern-
ment radio station aired every Friday from 10:00 to 11:00 in the morning. The title of
the program is called, “Makialam sa Kapaligiran” or “The State of the Brown Environ-
ment.” In Baguio City, Alay sa Kalinisan (ASK) reports are done weekly to inform the
public on RITMT operations and ambient air monitoring.
DENR EMB Region 2 has also a regular radio program over DWPE entitled “Tao at Kapa-
ligiran,” where environmental concepts including abatement of air pollution are dis-
cussed on air. A forum attended by the Officers of the Tricycle Operators and Drivers
Association and Barangay Officials within Tuguegarao City on the salient features of RA
8749 was also held in Region 2 in 2013.
In Region 6, an orientation/planning workshop was conducted in 2012, in Iloilo City,
which was attended by LGU Committee on Environment members with the objective of
“Clean Air for All.” There is also the celebration of Environment Month every June,
where an environmental symposium was conducted in the Oton Municipal Hall and at-
tended by high school students. A Driver’s Forum was also held in Iloilo City in 2012
where speakers from Technical Education and Skills Development Authority (TESDA),
LTO, Department of Health (DOH) and EMB talked about air pollution, the ill effects of
air pollution (smoking, pollution from motor vehicles), traffic rules and proper engine
maintenance (focusing on driver’s proper engine maintenance to lessen smoke emis-
sion). Around 50 drivers and operators attended it. An On-the-Spot Poster Making Con-
test and Environmental Quiz Bee in celebration of the National Clean Air Month and En-
vironmental Awareness Month in November were also organized by the EMB VI and the
Metro Iloilo Airshed Governing Board.
55
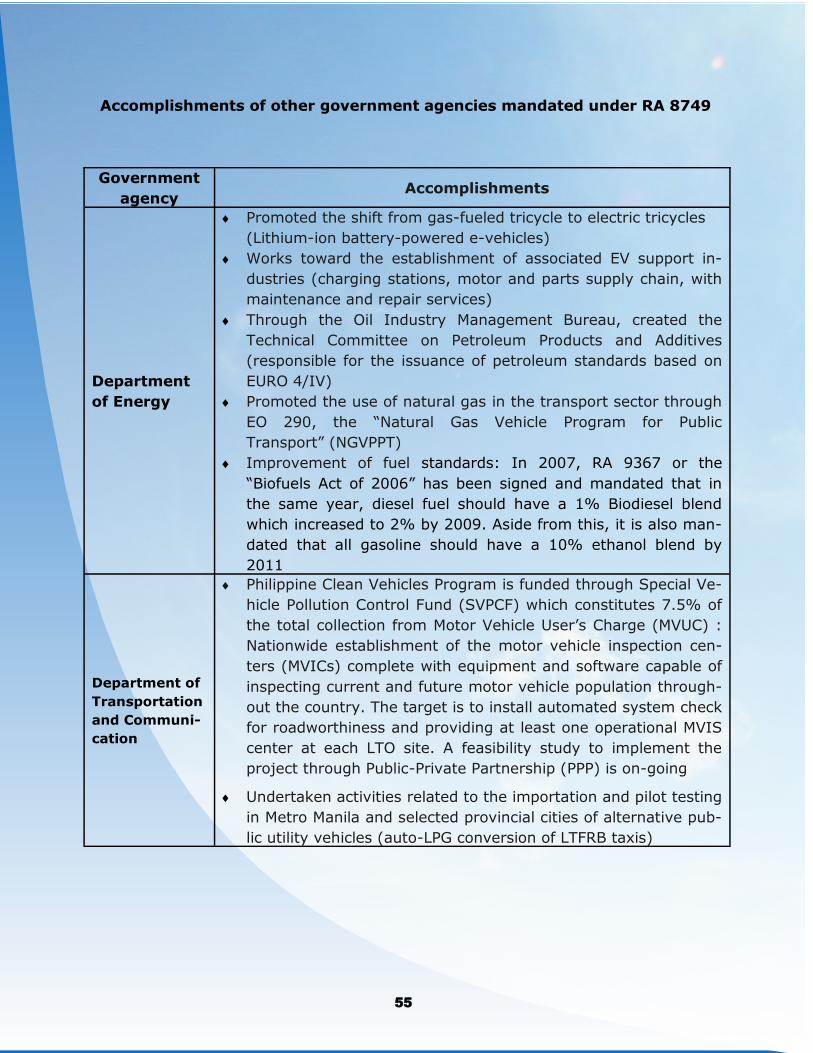
58
1 Accomplishments of other government agencies mandated under RA 8749
Government
agency Accomplishments
Department
of Energy
Promoted the shift from gas-fueled tricycle to electric tricycles
(Lithium-ion battery-powered e-vehicles)
Works toward the establishment of associated EV support in-
dustries (charging stations, motor and parts supply chain, with
maintenance and repair services)
Through the Oil Industry Management Bureau, created the
Technical Committee on Petroleum Products and Additives
(responsible for the issuance of petroleum standards based on
EURO 4/IV)
Promoted the use of natural gas in the transport sector through
EO 290, the “Natural Gas Vehicle Program for Public
Transport” (NGVPPT)
Improvement of fuel standards: In 2007, RA 9367 or the
“Biofuels Act of 2006” has been signed and mandated that in
the same year, diesel fuel should have a 1% Biodiesel blend
which increased to 2% by 2009. Aside from this, it is also man-
dated that all gasoline should have a 10% ethanol blend by
2011
Department of
Transportation
and Communi-
cation
Philippine Clean Vehicles Program is funded through Special Ve-
hicle Pollution Control Fund (SVPCF) which constitutes 7.5% of
the total collection from Motor Vehicle User’s Charge (MVUC) :
Nationwide establishment of the motor vehicle inspection cen-
ters (MVICs) complete with equipment and software capable of
inspecting current and future motor vehicle population through-
out the country. The target is to install automated system check
for roadworthiness and providing at least one operational MVIS
center at each LTO site. A feasibility study to implement the
project through Public-Private Partnership (PPP) is on-going
Undertaken activities related to the importation and pilot testing
in Metro Manila and selected provincial cities of alternative pub-
lic utility vehicles (auto-LPG conversion of LTFRB taxis)
55
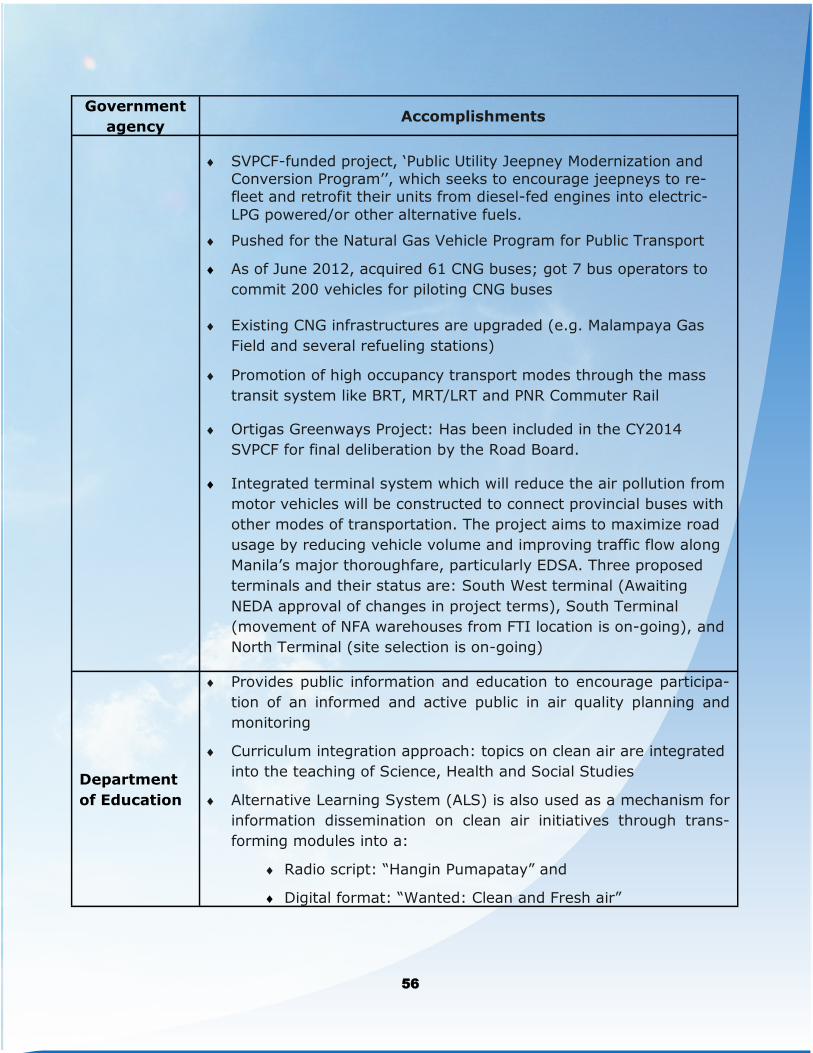
59
Government
agency Accomplishments
SVPCF-funded project, ‘Public Utility Jeepney Modernization and Conversion Program’’, which seeks to encourage jeepneys to re-fleet and retrofit their units from diesel-fed engines into electric-
LPG powered/or other alternative fuels.
Pushed for the Natural Gas Vehicle Program for Public Transport
As of June 2012, acquired 61 CNG buses; got 7 bus operators to
commit 200 vehicles for piloting CNG buses
Existing CNG infrastructures are upgraded (e.g. Malampaya Gas
Field and several refueling stations) Promotion of high occupancy transport modes through the mass
transit system like BRT, MRT/LRT and PNR Commuter Rail
Ortigas Greenways Project: Has been included in the CY2014
SVPCF for final deliberation by the Road Board.
Integrated terminal system which will reduce the air pollution from
motor vehicles will be constructed to connect provincial buses with
other modes of transportation. The project aims to maximize road
usage by reducing vehicle volume and improving traffic flow along
Manila’s major thoroughfare, particularly EDSA. Three proposed
terminals and their status are: South West terminal (Awaiting
NEDA approval of changes in project terms), South Terminal
(movement of NFA warehouses from FTI location is on-going), and
North Terminal (site selection is on-going)
Department
of Education
Provides public information and education to encourage participa-
tion of an informed and active public in air quality planning and
monitoring
Curriculum integration approach: topics on clean air are integrated
into the teaching of Science, Health and Social Studies
Alternative Learning System (ALS) is also used as a mechanism for
information dissemination on clean air initiatives through trans-
forming modules into a:
Radio script: “Hangin Pumapatay” and
Digital format: “Wanted: Clean and Fresh air”
56
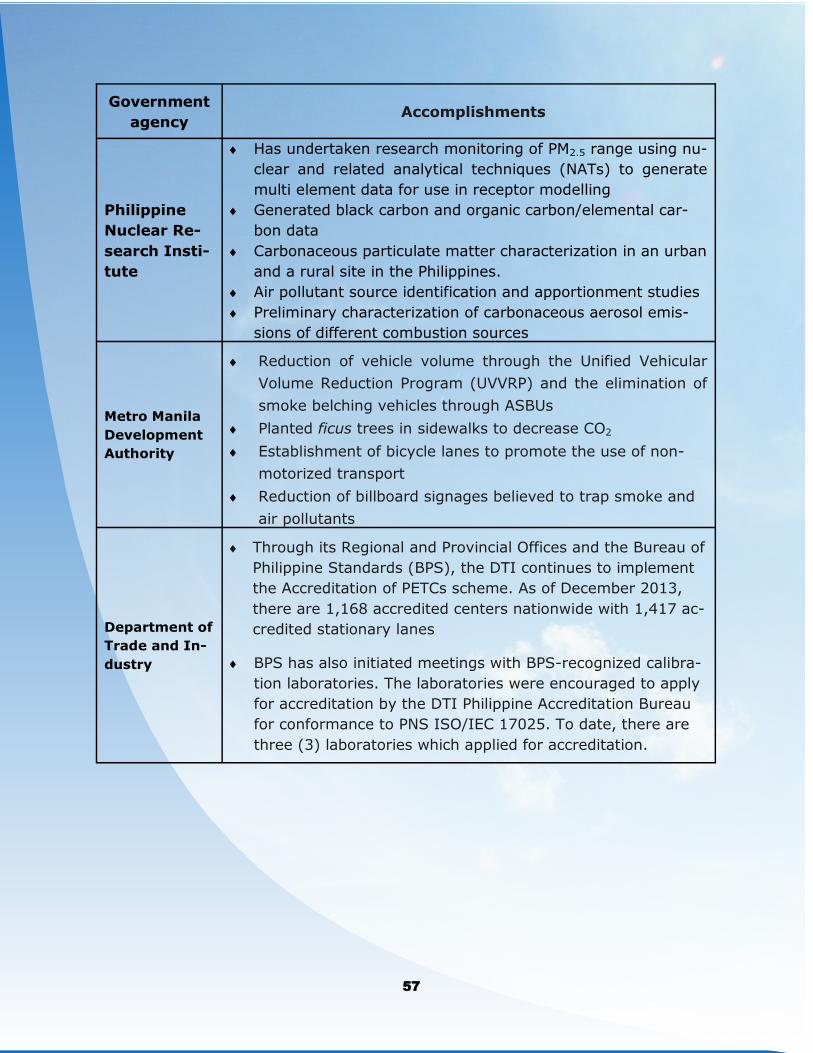
60
1
Government
agency Accomplishments
Philippine
Nuclear Re-
search Insti-
tute
Has undertaken research monitoring of PM2.5 range using nu-
clear and related analytical techniques (NATs) to generate
multi element data for use in receptor modelling
Generated black carbon and organic carbon/elemental car-
bon data
Carbonaceous particulate matter characterization in an urban
and a rural site in the Philippines.
Air pollutant source identification and apportionment studies
Preliminary characterization of carbonaceous aerosol emis-
sions of different combustion sources
Metro Manila
Development
Authority
Reduction of vehicle volume through the Unified Vehicular
Volume Reduction Program (UVVRP) and the elimination of
smoke belching vehicles through ASBUs
Planted ficus trees in sidewalks to decrease CO2
Establishment of bicycle lanes to promote the use of non-
motorized transport
Reduction of billboard signages believed to trap smoke and
air pollutants
Department of
Trade and In-
dustry
Through its Regional and Provincial Offices and the Bureau of
Philippine Standards (BPS), the DTI continues to implement
the Accreditation of PETCs scheme. As of December 2013,
there are 1,168 accredited centers nationwide with 1,417 ac-
credited stationary lanes
BPS has also initiated meetings with BPS-recognized calibra-
tion laboratories. The laboratories were encouraged to apply
for accreditation by the DTI Philippine Accreditation Bureau
for conformance to PNS ISO/IEC 17025. To date, there are
three (3) laboratories which applied for accreditation.
57
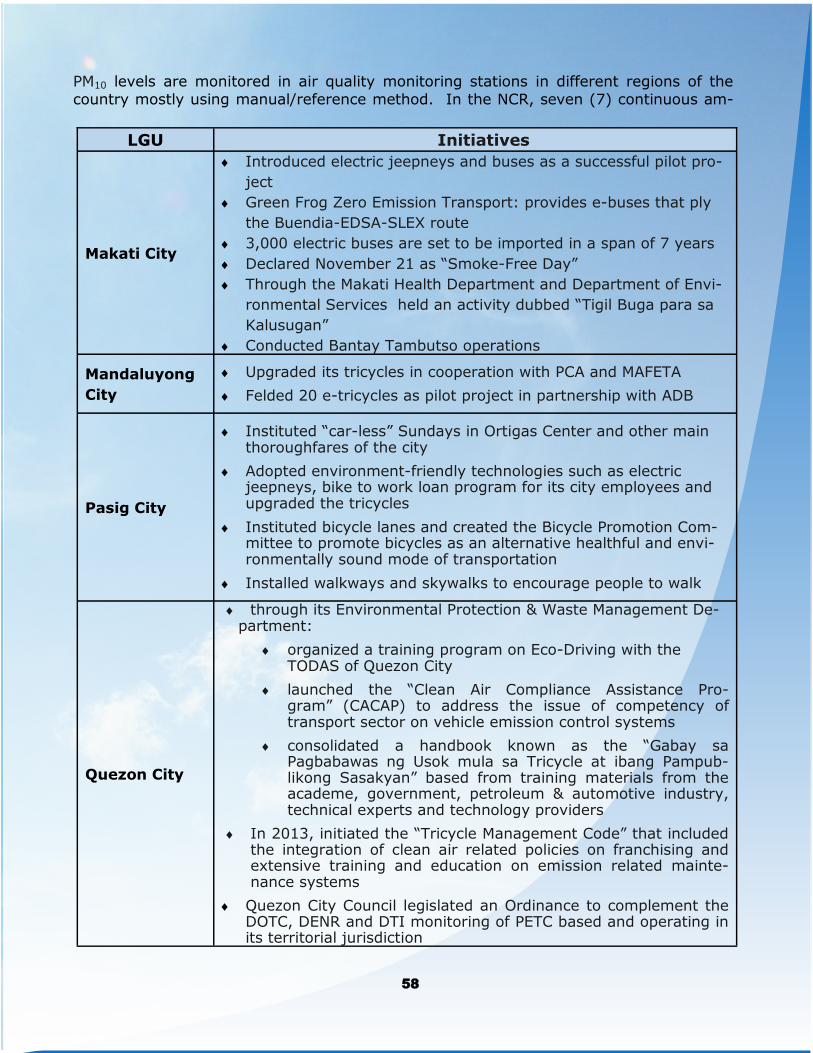
61
PM10 levels are monitored in air quality monitoring stations in different regions of the
country mostly using manual/reference method. In the NCR, seven (7) continuous am-
LGU Initiatives
Makati City
Introduced electric jeepneys and buses as a successful pilot pro-
ject
Green Frog Zero Emission Transport: provides e-buses that ply
the Buendia-EDSA-SLEX route
3,000 electric buses are set to be imported in a span of 7 years
Declared November 21 as “Smoke-Free Day”
Through the Makati Health Department and Department of Envi-
ronmental Services held an activity dubbed “Tigil Buga para sa
Kalusugan”
Conducted Bantay Tambutso operations
Mandaluyong
City
Upgraded its tricycles in cooperation with PCA and MAFETA
Felded 20 e-tricycles as pilot project in partnership with ADB
Pasig City
Instituted “car-less” Sundays in Ortigas Center and other main thoroughfares of the city
Adopted environment-friendly technologies such as electric jeepneys, bike to work loan program for its city employees and upgraded the tricycles
Instituted bicycle lanes and created the Bicycle Promotion Com-mittee to promote bicycles as an alternative healthful and envi-ronmentally sound mode of transportation
Installed walkways and skywalks to encourage people to walk
Quezon City
through its Environmental Protection & Waste Management De-partment:
organized a training program on Eco-Driving with the TODAS of Quezon City
launched the “Clean Air Compliance Assistance Pro-gram” (CACAP) to address the issue of competency of transport sector on vehicle emission control systems
consolidated a handbook known as the “Gabay sa Pagbabawas ng Usok mula sa Tricycle at ibang Pampub-likong Sasakyan” based from training materials from the academe, government, petroleum & automotive industry, technical experts and technology providers
In 2013, initiated the “Tricycle Management Code” that included the integration of clean air related policies on franchising and extensive training and education on emission related mainte-nance systems
Quezon City Council legislated an Ordinance to complement the DOTC, DENR and DTI monitoring of PETC based and operating in its territorial jurisdiction
58
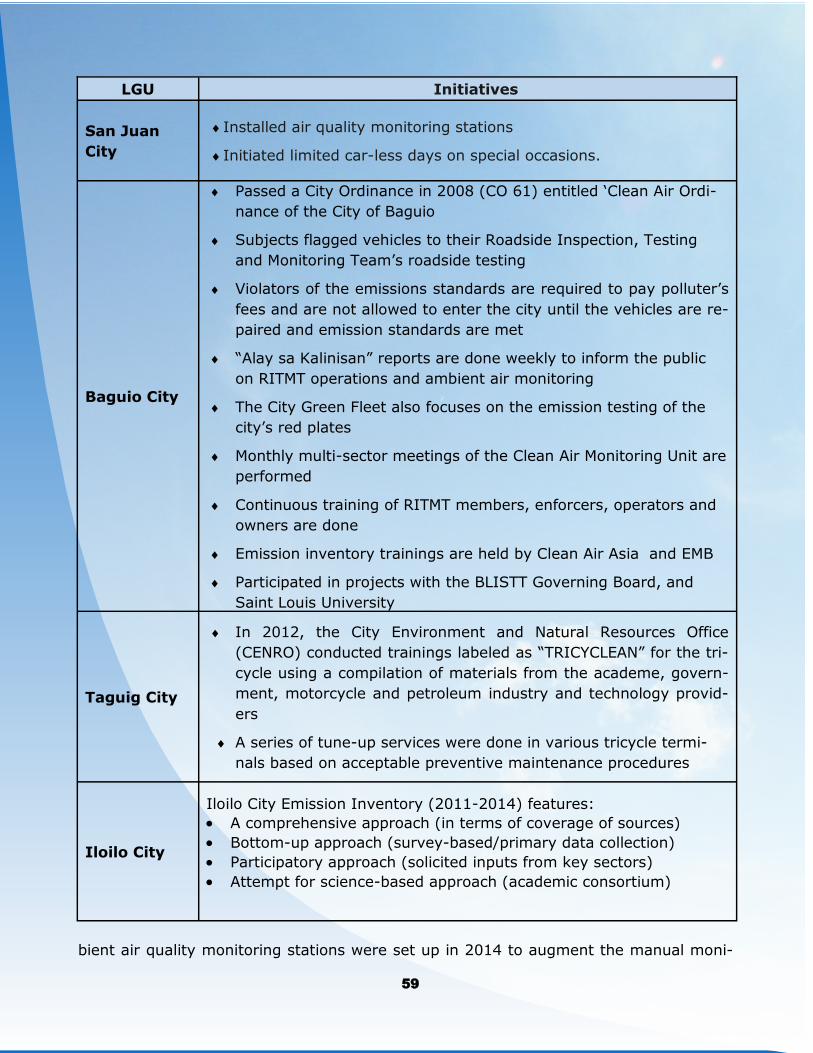
62
1
bient air quality monitoring stations were set up in 2014 to augment the manual moni-
LGU Initiatives
San Juan
City
Installed air quality monitoring stations
Initiated limited car-less days on special occasions.
Baguio City
Passed a City Ordinance in 2008 (CO 61) entitled ‘Clean Air Ordi-
nance of the City of Baguio
Subjects flagged vehicles to their Roadside Inspection, Testing
and Monitoring Team’s roadside testing
Violators of the emissions standards are required to pay polluter’s
fees and are not allowed to enter the city until the vehicles are re-
paired and emission standards are met
“Alay sa Kalinisan” reports are done weekly to inform the public
on RITMT operations and ambient air monitoring
The City Green Fleet also focuses on the emission testing of the
city’s red plates
Monthly multi-sector meetings of the Clean Air Monitoring Unit are
performed
Continuous training of RITMT members, enforcers, operators and
owners are done
Emission inventory trainings are held by Clean Air Asia and EMB
Participated in projects with the BLISTT Governing Board, and
Saint Louis University
Taguig City
In 2012, the City Environment and Natural Resources Office
(CENRO) conducted trainings labeled as “TRICYCLEAN” for the tri-
cycle using a compilation of materials from the academe, govern-
ment, motorcycle and petroleum industry and technology provid-
ers
A series of tune-up services were done in various tricycle termi-
nals based on acceptable preventive maintenance procedures
Iloilo City
Iloilo City Emission Inventory (2011-2014) features:
A comprehensive approach (in terms of coverage of sources)
Bottom-up approach (survey-based/primary data collection)
Participatory approach (solicited inputs from key sectors)
Attempt for science-based approach (academic consortium)
59
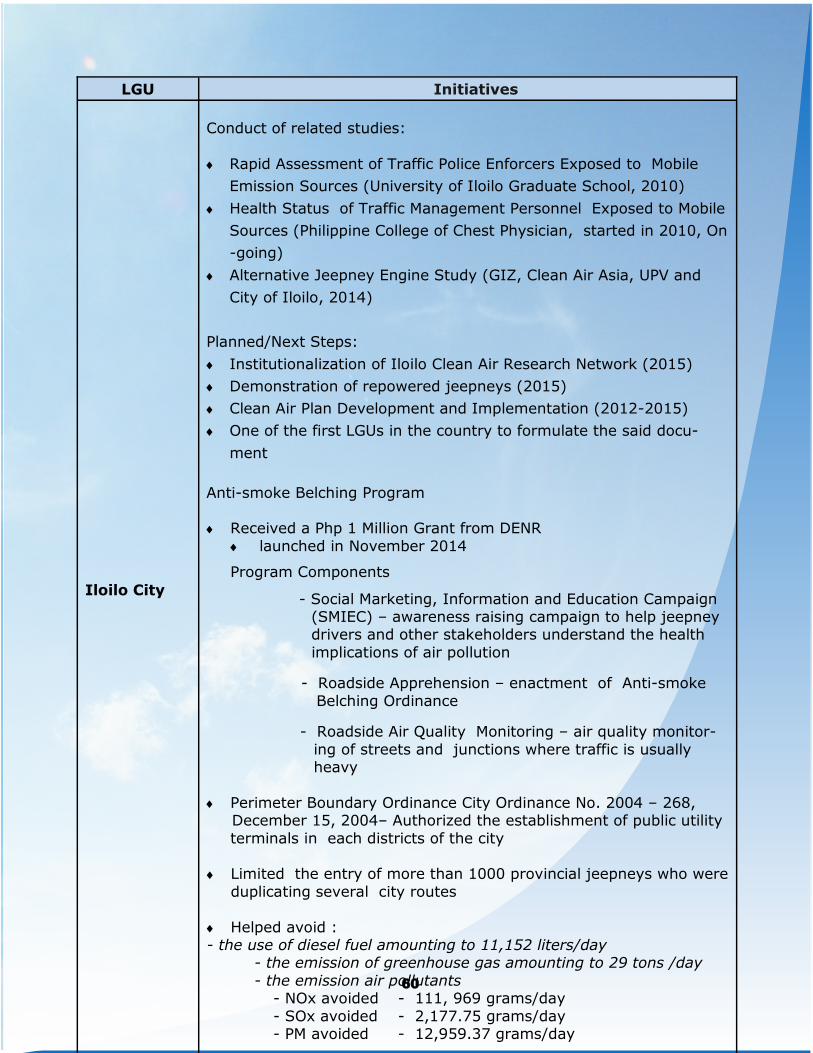
63
LGU Initiatives
Iloilo City
Conduct of related studies:
Rapid Assessment of Traffic Police Enforcers Exposed to Mobile
Emission Sources (University of Iloilo Graduate School, 2010)
Health Status of Traffic Management Personnel Exposed to Mobile
Sources (Philippine College of Chest Physician, started in 2010, On
-going)
Alternative Jeepney Engine Study (GIZ, Clean Air Asia, UPV and
City of Iloilo, 2014)
Planned/Next Steps:
Institutionalization of Iloilo Clean Air Research Network (2015)
Demonstration of repowered jeepneys (2015)
Clean Air Plan Development and Implementation (2012-2015)
One of the first LGUs in the country to formulate the said docu-
ment
Anti-smoke Belching Program Received a Php 1 Million Grant from DENR
launched in November 2014
Program Components
- Social Marketing, Information and Education Campaign (SMIEC) – awareness raising campaign to help jeepney drivers and other stakeholders understand the health
implications of air pollution
- Roadside Apprehension – enactment of Anti-smoke
Belching Ordinance - Roadside Air Quality Monitoring – air quality monitor-
ing of streets and junctions where traffic is usually heavy
Perimeter Boundary Ordinance City Ordinance No. 2004 – 268, December 15, 2004– Authorized the establishment of public utility
terminals in each districts of the city Limited the entry of more than 1000 provincial jeepneys who were
duplicating several city routes
Helped avoid : - the use of diesel fuel amounting to 11,152 liters/day
- the emission of greenhouse gas amounting to 29 tons /day
- the emission air pollutants - NOx avoided - 111, 969 grams/day
- SOx avoided - 2,177.75 grams/day - PM avoided - 12,959.37 grams/day
60
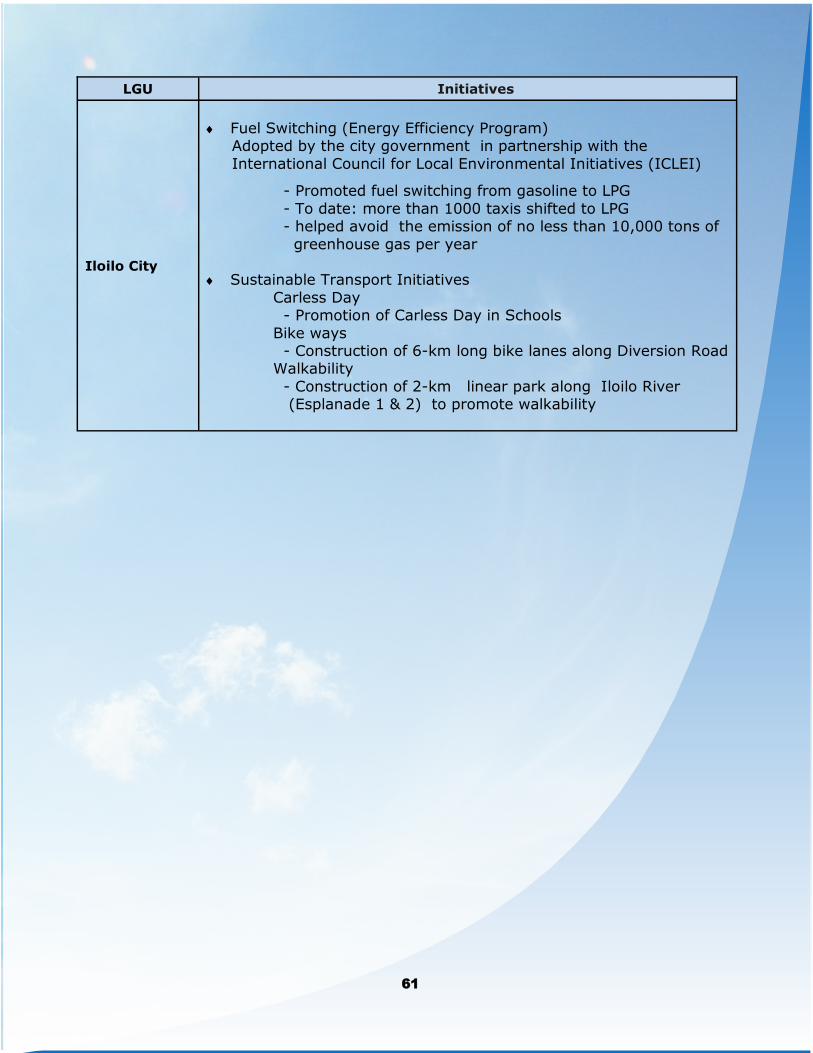
64
LGU Initiatives
Iloilo City
Fuel Switching (Energy Efficiency Program) Adopted by the city government in partnership with the
International Council for Local Environmental Initiatives (ICLEI) - Promoted fuel switching from gasoline to LPG
- To date: more than 1000 taxis shifted to LPG - helped avoid the emission of no less than 10,000 tons of
greenhouse gas per year Sustainable Transport Initiatives
Carless Day - Promotion of Carless Day in Schools
Bike ways - Construction of 6-km long bike lanes along Diversion Road Walkability
- Construction of 2-km linear park along Iloilo River (Esplanade 1 & 2) to promote walkability
61
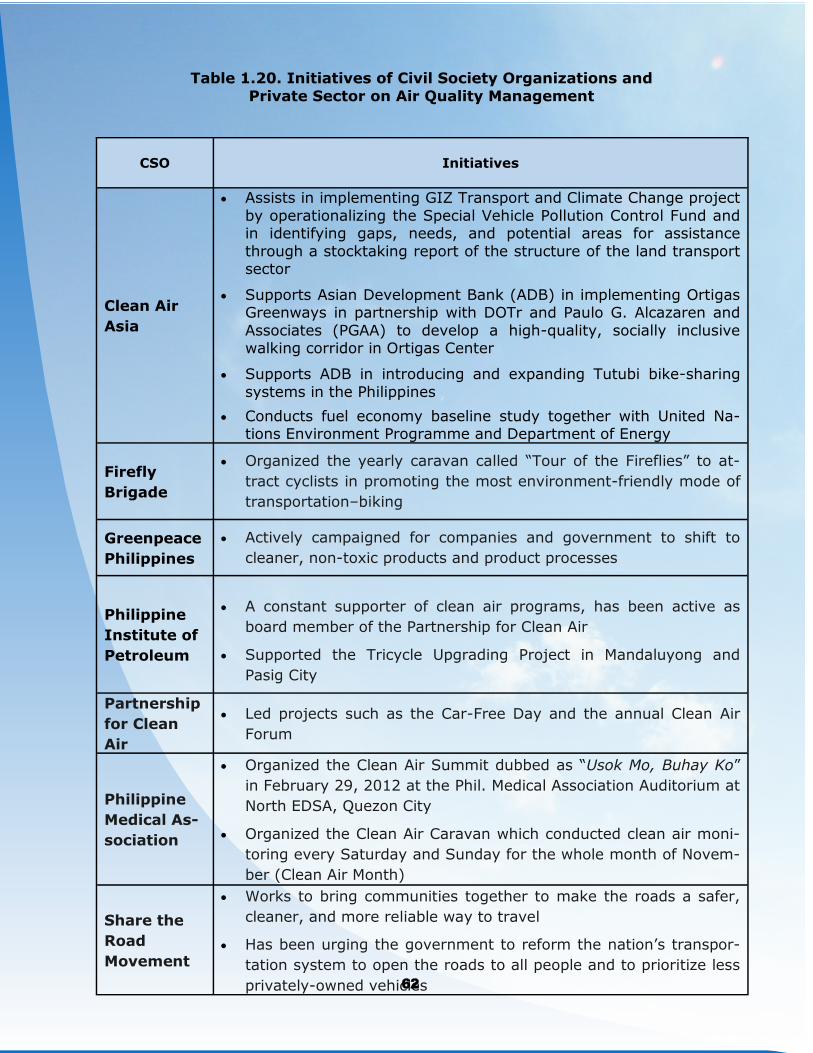
65
1
CSO Initiatives
Clean Air
Asia
Assists in implementing GIZ Transport and Climate Change project
by operationalizing the Special Vehicle Pollution Control Fund and in identifying gaps, needs, and potential areas for assistance
through a stocktaking report of the structure of the land transport sector
Supports Asian Development Bank (ADB) in implementing Ortigas Greenways in partnership with DOTr and Paulo G. Alcazaren and
Associates (PGAA) to develop a high-quality, socially inclusive walking corridor in Ortigas Center
Supports ADB in introducing and expanding Tutubi bike-sharing
systems in the Philippines
Conducts fuel economy baseline study together with United Na-tions Environment Programme and Department of Energy
Firefly
Brigade
Organized the yearly caravan called “Tour of the Fireflies” to at-
tract cyclists in promoting the most environment-friendly mode of
transportation–biking
Greenpeace
Philippines
Actively campaigned for companies and government to shift to
cleaner, non-toxic products and product processes
Philippine
Institute of
Petroleum
A constant supporter of clean air programs, has been active as
board member of the Partnership for Clean Air
Supported the Tricycle Upgrading Project in Mandaluyong and
Pasig City
Partnership
for Clean
Air
Led projects such as the Car-Free Day and the annual Clean Air
Forum
Philippine
Medical As-
sociation
Organized the Clean Air Summit dubbed as “Usok Mo, Buhay Ko”
in February 29, 2012 at the Phil. Medical Association Auditorium at
North EDSA, Quezon City
Organized the Clean Air Caravan which conducted clean air moni-
toring every Saturday and Sunday for the whole month of Novem-
ber (Clean Air Month)
Share the
Road
Movement
Works to bring communities together to make the roads a safer,
cleaner, and more reliable way to travel
Has been urging the government to reform the nation’s transpor-
tation system to open the roads to all people and to prioritize less
privately-owned vehicles 62
Table 1.20. Initiatives of Civil Society Organizations and
Private Sector on Air Quality Management
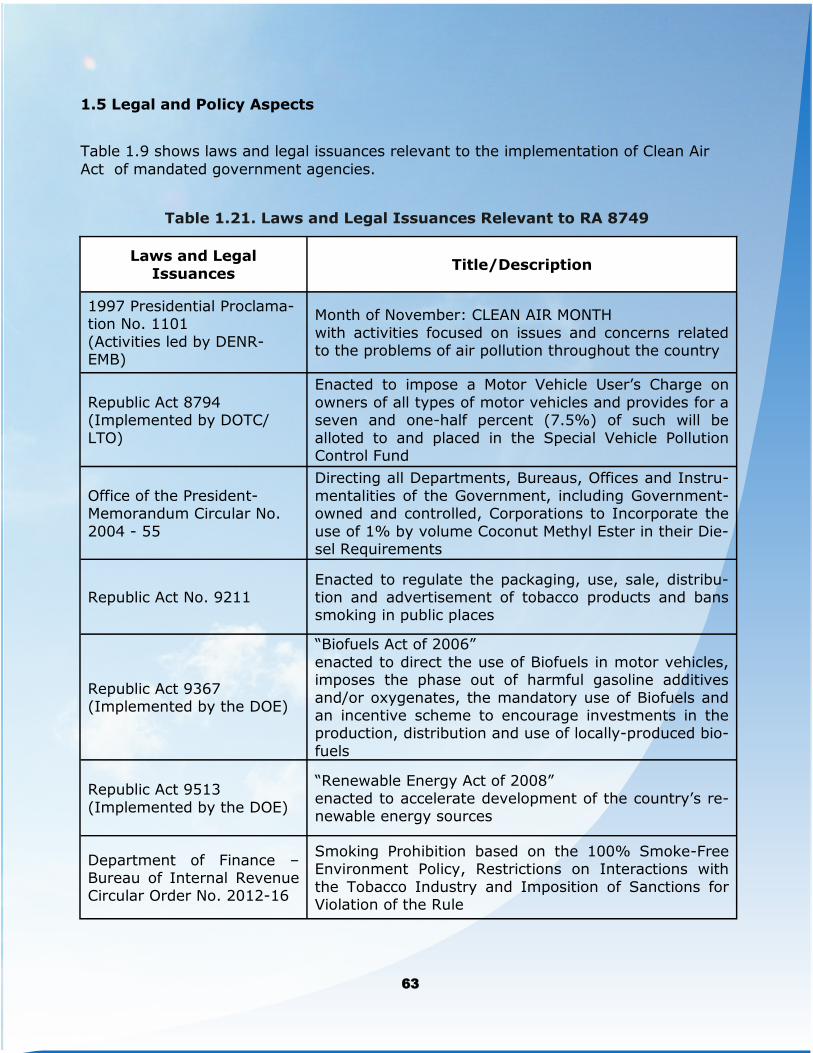
66
1.5 Legal and Policy Aspects
Table 1.9 shows laws and legal issuances relevant to the implementation of Clean Air
Act of mandated government agencies.
Table 1.21. Laws and Legal Issuances Relevant to RA 8749
Laws and Legal
Issuances Title/Description
1997 Presidential Proclama-tion No. 1101
(Activities led by DENR-EMB)
Month of November: CLEAN AIR MONTH
with activities focused on issues and concerns related to the problems of air pollution throughout the country
Republic Act 8794 (Implemented by DOTC/
LTO)
Enacted to impose a Motor Vehicle User’s Charge on
owners of all types of motor vehicles and provides for a seven and one-half percent (7.5%) of such will be
alloted to and placed in the Special Vehicle Pollution Control Fund
Office of the President-Memorandum Circular No.
2004 - 55
Directing all Departments, Bureaus, Offices and Instru-
mentalities of the Government, including Government-owned and controlled, Corporations to Incorporate the
use of 1% by volume Coconut Methyl Ester in their Die-sel Requirements
Republic Act No. 9211 Enacted to regulate the packaging, use, sale, distribu-tion and advertisement of tobacco products and bans smoking in public places
Republic Act 9367 (Implemented by the DOE)
“Biofuels Act of 2006”
enacted to direct the use of Biofuels in motor vehicles, imposes the phase out of harmful gasoline additives
and/or oxygenates, the mandatory use of Biofuels and an incentive scheme to encourage investments in the production, distribution and use of locally-produced bio-
fuels
Republic Act 9513
(Implemented by the DOE)
“Renewable Energy Act of 2008” enacted to accelerate development of the country’s re-newable energy sources
Department of Finance – Bureau of Internal Revenue Circular Order No. 2012-16
Smoking Prohibition based on the 100% Smoke-Free Environment Policy, Restrictions on Interactions with
the Tobacco Industry and Imposition of Sanctions for Violation of the Rule
63
67
1
1.7 Challenges and recommendations
This section aims to list a number of recommended steps and measures in four main
aspects – policy, research and development, capacity building and institutional frame-
work, and finance, which various stakeholders can consider to implement in the im-
mediate or long-term periods, with strong support at the national and local levels of
governance in the country.
Mobile Source Management
The National Motor Vehicle Inspection and Maintenance Program
The Clean Air Act provides for the formulation and implementation of a national motor
vehicle inspection and maintenance program that will promote efficient and safe oper-
ation of all motor vehicles - to ensure the substantial reduction of emissions from mo-
tor vehicles. Thus, the DTI should already develop and implement standards and pro-
cedures for the certification of training institutions, instructors and facilities and the
licensing of qualified private service centers and their technicians as prerequisite for
performing the testing, servicing, repair and the required adjustment to the vehicle
emission system. The DTI should also prescribe regulations requiring the disclosure of
odometer readings and the use of tamper- resistant odometers for all motor vehicles
including tamper-resistant fuel management systems for the effective implementation
of the inspection and maintenance program.
In line with the goal of reducing the emissions of motor vehicles, Republic Act 9367,
also known as the “Biofuels Act of 2006” was also enacted to direct the use of Biofu-
els in motor vehicles. Specifically, it imposes the phase out of harmful gasoline addi-
tives and/or oxygenates, the mandatory use of Biofuels and an incentive scheme to
encourage investments in the production, distribution and use of locally-produced bio-
fuels. The promotion of the use of alternative fuels thru conversion to E-vehicles, CNG
and LPG, including infrastructure development for refilling/charging stations should be
actively pursued. Provision of more incentives, such as reduced tax for vehicles using
alternative fuels and vehicles with fuel-efficient engines, will help promote the use of
low emission vehicles.
Measurement of carbon dioxide levels should also be part of the emissions testing of
motor vehicles and incentives for low-carbon emissions may be provided.
Area Source Management
The use of firecrackers during New Year’s celebration should be regulated as it con-
tributes extremely high levels of pollutants in the atmosphere. Municipalities can fo-
cus on controlled use of fireworks in public places. To better understand the pollution
contribution of fireworks, chemical analyses of its composition and emissions can also
be done. RA 7183 regulates the sale, manufacture, distribution and use of firecrack-
64
68
ers and other pyrotechnic devices, and this law should be more stringently implemented
considering the effects of such materials on air quality and the corresponding health risks
involved.
Local Legislation
Considering the important functions of Environment and Natural Resources Office (ENRO)
under Section 37, RA 8749 and the mandated role of LGUs to undertake full administra-
tion of air quality management in their territorial jurisdiction (section 36), the optional
provision on creation of ENRO per LGU should be made mandatory through local legisla-
tion.
Research and Development
To alleviate air pollution, there should be a continuous understanding of the latest infor-
mation on what factors define it, the full extent of its impacts and the new developments
and technology related to its mitigation. Section 15 of Chapter 2, Article 1 of the RA
8749 IRR mandates the DENR, Department of Science and Technology, other agencies,
private sector, the academe, non-government organizations and people’s organizations
to establish a National Research and Development Program for the prevention and con-
trol of air pollution. As such, the following research and development projects are there-
fore recommended:
Specific Studies on Health Impacts
More research on the detailed health impacts of specific levels of pollutants should be
done in the country, and reported in a manner that can be understood by the general
public as Filipinos tend to disregard health advisories unless they are already affected.
For example, specific health studies can be done on workers most exposed to air pollu-
tion such as traffic enforcers or PUV drivers, and the objective result would be to identify
respiratory ailment/s which can be developed given this amount of exposure to specific
pollutant levels. Area-based data generated would increase awareness of the public and
would thus encourage participation in improving the quality of air
Mobile Source Management through Transport Research and Development
Real time monitoring of traffic conditions especially in urban areas, combined with more
accurate emission factors can be of use in predicting real-time, pollutant levels through
modeling. More effort should be placed on managing the transport flow not only because
65
69
1 of the inconvenience but also of the health implications brought by air pollution. Con-
tinuous development of mass transit systems is also important as reduction of mobile
vehicles will directly lessen air pollutants. The government must see to it, however,
that modes of mass transportation can keep up with the demand while ensuring the
safety of the commuters.
Multi-partite studies should also be done on the efficiency and health safety of using
converted engines for alternative fuels such as LPG and CNG. Results of these studies
can provide stronger support to the claim that engine conversion is the best way to al-
leviate air pollution in the country and not just a ‘band-aid solution’ that can lead to
other implications in the future.
It is also recommended that vehicles of use for 15 years and greater, if not phased-
out, should be limited to areas with air quality that is not compromised.
Land Use planning
An efficient land use plan particularly for urban areas also plays a role in improving air
quality because the development of land, building design and orientation affects the
transportation choices of people. The location of urban centers and places with essen-
tial services such as schools, hospitals and business districts, and the availability of
mass transit will determine whether people will opt to take public transportation, use
private vehicles, or ride a bicycle to work.
It is also very important that there is a high forestland cover as trees and other types
of vegetation, as these contribute in the reduction of air pollution by helping to settle,
trap and hold particle pollutants, absorb carbon dioxide and other gases while replen-
ishing the oxygen in the atmosphere. Further, areas with lush vegetation and trees re-
duce ultraviolet radiation, lower air temperature and alter wind patterns which can lead
to pollutant dispersion. In urbanized regions where there is low vegetation and forest
cover and high percentage of built-up areas, high levels of pollution are expected. Land
use and changes in land cover due to urbanization impact air quality by affecting emis-
sions, heat and energy balances, climate and pollutant deposition.
66
70
Acknowledgments
In the preparation of this Report, the contribution of the following organizations is hereby acknowledged:
Ateneo School of Government Clean Air Asia
City of Makati - Department of Environmental Services Department of Agriculture Department of Energy
Department of Health Department of Interior and Local Government
Department of Transportation Institute for Climate and Sustainable Cities Land Transportation Office
Manila International Airports Authority Manila Observatory
Miriam College — Environmental Studies Institute National Statistics Office National Statistical Coordination Board
Partnership for Clean Air Philippine Institute of Petroleum
Philippine Nuclear Research Institute Philippine Medical Association
Pharmaceutical and Healthcare Association of the Philippines EMB Regional Offices
EMB/DENR Cordillera Administrative Region EMB/DENR Region I
EMB/DENR Region II EMB/DENR Region III EMB/DENR Region IV A
EMB/DENR Region IV B EMB/DENR Region V
EMB/DENR Region VI EMB/DENR Region VII EMB/DENR Region VIII
EMB/DENR Region IX EMB/DENR Region X
EMB/DENR Region XI EMB/DENR Region XII EMB/DENR National Capital Region
EMB/DENR CARAGA
67
71
THE PROJECT TEAM
Engr. Metodio Turbella
Director, EMB
Engr. Vizminda Osorio
Assistant Director, EMB
Air Quality Management Section-EMB
Mr. Jerry Capulong
Engr. Jundy del Socorro Engr. Michiko Sibunga
Mr. Joel Michael Tugano
EMB Air Quality Management Technical Specialists
Engr. Jean Rosete
Engr. Teresita Peralta
Environment Education and Information Division–EMB
Ms. Elenida Basug Ms. Karen Pacpaco
Ms. Cristina Francisco
Ms. Daneelyn Manguerra Mr. Curtiss Lim
Ms. Amherstia Calma Ms. Merva Arapo
Mr. Emil Xavier Cruz
Mr.Mabini Arevalo, Jr., Editor
68
72
Department of Environment and Natural Resources
Environmental Management Bureau DENR Compound, Visayas Avenue, Quezon City
Tel. No. (+63) 928-4674 and (+63) 376-5610 Hotline No. (+63) 376-5541 / [email protected]
www.emb.gov.ph / www.denr.gov.ph
www.facebook.com/DENREnviBureau
www.facebook.com/emb.eeid
www.facebook.com/EcoFriendlySchoolsPhilippines
@denr_emb