Embed Size (px)
Citation preview
UNIT 4
Quantitative Relationships in Chemical Changes
Teaching Unit 4: Quantitative Relationships in Chemical ChangesGeneral Outcomes and Contents . . . . . . . . . . . . . . . . . . . . . . . . . . . . . . 4-1Content Summary and Curriculum Fit . . . . . . . . . . . . . . . . . . . . . . . . . 4-1Core Concepts . . . . . . . . . . . . . . . . . . . . . . . . . . . . . . . . . . . . . . . . . . . . 4-2Related Skills . . . . . . . . . . . . . . . . . . . . . . . . . . . . . . . . . . . . . . . . . . . . . 4-3Activities and Target Skills . . . . . . . . . . . . . . . . . . . . . . . . . . . . . . . . . . . 4-5Conceptual Challenges . . . . . . . . . . . . . . . . . . . . . . . . . . . . . . . . . . . . . . 4-5Using the Unit 4 Preparation Feature . . . . . . . . . . . . . . . . . . . . . . . . . . . 4-6Answers to Practice Problems 1-2 . . . . . . . . . . . . . . . . . . . . . . . . . . . . . . 4-6
Unit 4: Course Materials . . . . . . . . . . . . . . . . . . . . . . . . . . . . . . . . . . . . 4-7
Chapter 7 Curriculum Correlation . . . . . . . . . . . . . . . . . . . . . . . . . . . 4-10
Chapter 7 Stoichiometry
Answers to Questions for Comprehension, notes on Figures and Web Linksappear throughout the chapter.
Chapter Concepts . . . . . . . . . . . . . . . . . . . . . . . . . . . . . . . . . . . . . . 4-15Common Misconceptions . . . . . . . . . . . . . . . . . . . . . . . . . . . . . . . 4-15Helpful Resources . . . . . . . . . . . . . . . . . . . . . . . . . . . . . . . . . . . . . . 4-15Launch Lab: The Thermal Decomposition of Baking Soda . . . . . . 4-16
7.1 Reactions in Aqueous Solution . . . . . . . . . . . . . . . . . . . . . . . . . . . . 4-17Section Outcomes and Key Terms . . . . . . . . . . . . . . . . . . . . . . . . . 4-17Chemistry Background . . . . . . . . . . . . . . . . . . . . . . . . . . . . . . . . . . 4-17Teaching Strategies . . . . . . . . . . . . . . . . . . . . . . . . . . . . . . . . . . . . . 4-18Answers to Practice Problems 1-2 . . . . . . . . . . . . . . . . . . . . . . . . . . 4-18Thought Lab 7.1: Identifying Unknown Aqueous Solutions . . . . . 4-19Investigation 7.A: Qualitative Analysis . . . . . . . . . . . . . . . . . . . . . . 4-19Section 7.1 Review Answers . . . . . . . . . . . . . . . . . . . . . . . . . . . . . . 4-21
7.2 Stoichiometry and Quantitative Analysis . . . . . . . . . . . . . . . . . . . . 4-22Section Outcomes and Key Terms . . . . . . . . . . . . . . . . . . . . . . . . . 4-22Chemistry Background . . . . . . . . . . . . . . . . . . . . . . . . . . . . . . . . . . 4-22Teaching Strategies . . . . . . . . . . . . . . . . . . . . . . . . . . . . . . . . . . . . . 4-22Answers to Practice Problems 3-7 . . . . . . . . . . . . . . . . . . . . . . . . . . 4-23Answers to Practice Problems 8-15 . . . . . . . . . . . . . . . . . . . . . . . . . 4-24Connections (Science and Technology): Waste Water Treatment . . . . 4-24
T a b l e o f C o n t e n t s

Answers to Practice Problems 16-19 . . . . . . . . . . . . . . . . . . . . . . . . 4-25Investigation 7.B: Determining the Concentration of a Solution . . . . 4-25Answers to Practice Problems 20-23, 24-27 . . . . . . . . . . . . . . . . . . 4-27Investigation 7.C: Analyzing Industrial Processes . . . . . . . . . . . . . . 4-27Section 7.2 Review Answers . . . . . . . . . . . . . . . . . . . . . . . . . . . . . . 4-28Chapter 7 Review Answers . . . . . . . . . . . . . . . . . . . . . . . . . . . . . . . 4-30
Chapter 8 Curriculum Correlation . . . . . . . . . . . . . . . . . . . . . . . . . . . 4-34
Chapter 8 Applications of Stoichiometry
Answers to Questions for Comprehension, notes on Figures and Web Linksappear throughout the chapter.
Chapter Concepts . . . . . . . . . . . . . . . . . . . . . . . . . . . . . . . . . . . . . . 4-39Common Misconceptions . . . . . . . . . . . . . . . . . . . . . . . . . . . . . . . 4-39Helpful Resources . . . . . . . . . . . . . . . . . . . . . . . . . . . . . . . . . . . . . . 4-39Launch Lab: The Model Air Bag . . . . . . . . . . . . . . . . . . . . . . . . . . 4-40
8.1 Limiting and Excess Reactants . . . . . . . . . . . . . . . . . . . . . . . . . . . . 4-41Section Outcomes and Key Terms . . . . . . . . . . . . . . . . . . . . . . . . . 4-41Chemistry Background . . . . . . . . . . . . . . . . . . . . . . . . . . . . . . . . . . 4-41Teaching Strategies . . . . . . . . . . . . . . . . . . . . . . . . . . . . . . . . . . . . . 4-41Thought Lab 8.1: The Limiting Item . . . . . . . . . . . . . . . . . . . . . . . 4-42Answers to Practice Problems 1-6 . . . . . . . . . . . . . . . . . . . . . . . . . . 4-43Investigation 8.A: The Limiting Reactant . . . . . . . . . . . . . . . . . . . . 4-43Answers to Practice Problems 7-12 . . . . . . . . . . . . . . . . . . . . . . . . . 4-44Section 8.1 Review Answers . . . . . . . . . . . . . . . . . . . . . . . . . . . . . . 4-45
8.2 Predicted and Experimental Yield . . . . . . . . . . . . . . . . . . . . . . . . . 4-46Section Outcomes and Key Terms . . . . . . . . . . . . . . . . . . . . . . . . . 4-46Chemistry Background . . . . . . . . . . . . . . . . . . . . . . . . . . . . . . . . . . 4-46Teaching Strategies . . . . . . . . . . . . . . . . . . . . . . . . . . . . . . . . . . . . . 4-46Answers to Practice Problems 13-19 . . . . . . . . . . . . . . . . . . . . . . . . 4-47Investigation 8.B: Determining the Percentage Yield of a
Chemical Reaction . . . . . . . . . . . . . . . . . . . . . . . . . . . . . . . . . . 4-47Section 8.2 Review Answers . . . . . . . . . . . . . . . . . . . . . . . . . . . . . . 4-48
8.3 Acid-Base Titration . . . . . . . . . . . . . . . . . . . . . . . . . . . . . . . . . . . . 4-49Section Outcomes and Key Terms . . . . . . . . . . . . . . . . . . . . . . . . . 4-49Chemistry Background . . . . . . . . . . . . . . . . . . . . . . . . . . . . . . . . . . 4-49Teaching Strategies . . . . . . . . . . . . . . . . . . . . . . . . . . . . . . . . . . . . . 4-50Answers to Practice Problems 20-25 . . . . . . . . . . . . . . . . . . . . . . . . 4-51Investigation 8.C: Standardizing a Hydrochloric Acid Solution . . . 4-51Thought Lab 8.2: Plotting a Titration Curve . . . . . . . . . . . . . . . . . 4-53Connections (Science and Technology): Sulfur from Sour Gas . . . . 4-54Investigation 8.D: Titrating a Strong Base with a Strong Acid . . . . 4-55Section 8.3 Review Answers . . . . . . . . . . . . . . . . . . . . . . . . . . . . . . 4-57Chapter 8 Review Answers . . . . . . . . . . . . . . . . . . . . . . . . . . . . . . . 4-57
Career Focus: Ask a Pharmaceutical Chemist . . . . . . . . . . . . . . . . . . . . 4-59Unit 4 Review Answers . . . . . . . . . . . . . . . . . . . . . . . . . . . . . . . . . . . . 4-59
Teaching Unit 4:Quantitative Relationships
in Chemical Changes (32% of course time; approximately 40 hours)Student Textbook pages 252 to 331
General Outcomes■ Explain how balanced chemical equations show the
quantitative relationships among the reactants andproducts involved in chemical changes.
■ Use stoichiometry in quantitative analysis.
Contents
Chapter 7 Stoichiometry
Chapter 8 Applications of Stoichiometry
Content SummaryQuantitative relationships have an impact on every area ofchemistry, thus the concepts in this unit have applications inindustry, farming, medicine, and the home, as well as in thechemical laboratory. This unit begins with reactions inaqueous solutions and the techniques of qualitative analysis.Quantitative analysis is made possible using chemicalequations and mole ratios. These concepts are extended tosolution stoichiometry and to gas stoichiometry. The conceptsof a limiting reactant and reaction yield are introduced next,and these are extremely important in many industrialreactions. Finally in this unit, quantitative analysis is extendedto acid-base titrations.
Chapter 7 begins with ionic and net ionic equations. Thenet ionic equation for a reaction eliminates spectator ions,leaving a simplified equation showing only the actualchemical change that took place. The techniques of qualitativeanalysis are described next. These include the colour of thesolution of some common ions, flame tests, and the formationof a precipitate. Students apply their knowledge of the
solubility guidelines and use flame tests to qualitativelyidentify unknown ions present in solutions. Students writechemical and net ionic equations and learn how to apply moleratios to solve stoichiometry problems. Gravimetricstoichiometry naturally follows when the amount of asubstance in moles is converted to mass. Students willmanipulate between concentrations, volumes, amount inmoles, and masses of precipitates. Next, students usegravimetric stoichiometry skills to determine theconcentration of a solution. Finally in Chapter 7, gasstoichiometry includes the concepts from Chapter 3 and 4:Exploring Gas Laws, including the law of combining gasvolumes and the ideal gas equation.
The focus of Chapter 8 is the applications ofstoichiometry in the development of solutions totechnological problems. Principles of stoichiometry are usedto minimize waste and to maximize the yield of a desiredproduct. Factors that limit experimental yield are discussed,and students predict the theoretical yield and measure theactual yield of a reaction. Students then return to acid-basereactions where they will learn how to perform acid-basetitrations using an indicator to determine the equivalencepoint. Students also determine the molar concentration ofhydrochloric acid samples that are to be standardized.Students learn about acid-base titration curves, and plotvolumetric data for a strong acid-strong base titration. Finally,students design the procedure and perform a titration using astandard solution of HCl(aq) to determine the concentrationof a solution of sodium hydroxide.
Curriculum FitBackground■ Science 10, Unit A: Energy and Matter in Chemical
Change.This unit continues the study of solutions, acids and basesfrom the previous unit, and includes concepts from gaseslearned in Unit B. Quantitative relationships may be useful inany area of chemistry but will be essential for success in thefollowing units of Chemistry 30: Thermodynamics (found inUnit 5); Electrochemistry (found in Unit 6), and Equilibrium(found in Unit 8).
4-1Unit 4 Quantitative Relationships in Chemical Changes • MHR
4-2 MHR • Unit 4 Quantitative Relationships in Chemical Changes
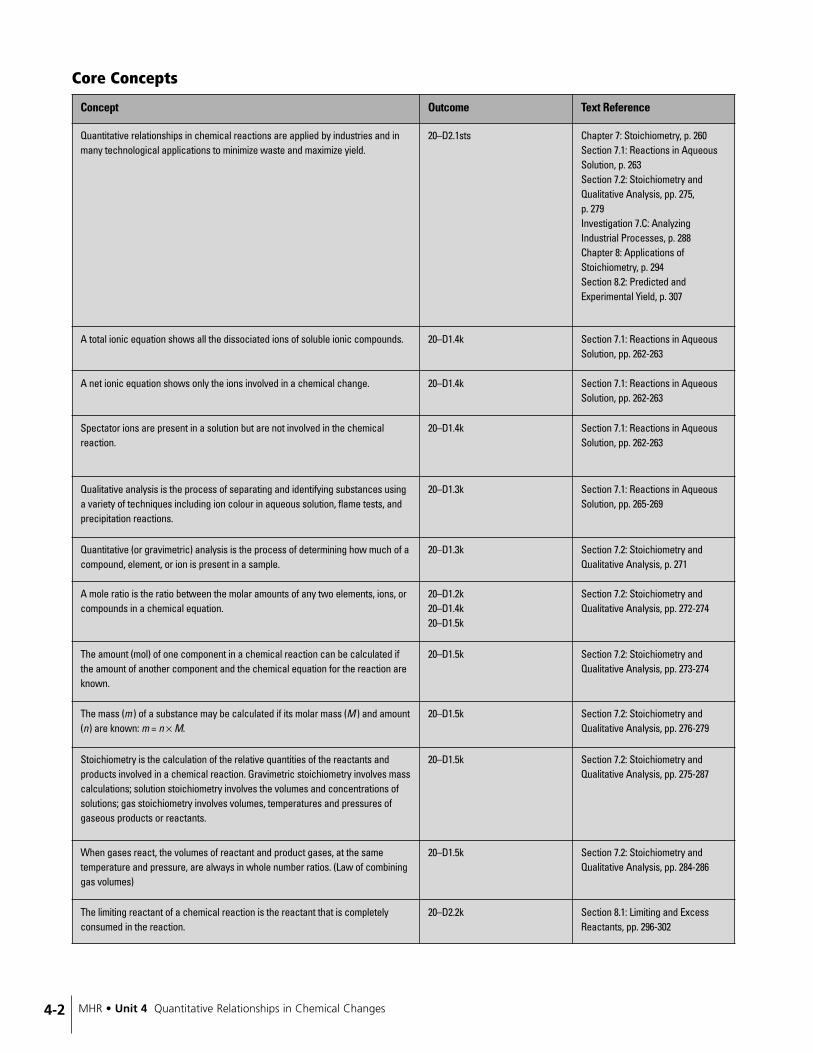
Core Concepts
Concept Outcome Text Reference
Quantitative relationships in chemical reactions are applied by industries and inmany technological applications to minimize waste and maximize yield.
20–D2.1sts Chapter 7: Stoichiometry, p. 260Section 7.1: Reactions in AqueousSolution, p. 263Section 7.2: Stoichiometry andQualitative Analysis, pp. 275, p. 279Investigation 7.C: AnalyzingIndustrial Processes, p. 288Chapter 8: Applications ofStoichiometry, p. 294Section 8.2: Predicted andExperimental Yield, p. 307
A total ionic equation shows all the dissociated ions of soluble ionic compounds. 20–D1.4k Section 7.1: Reactions in AqueousSolution, pp. 262-263
A net ionic equation shows only the ions involved in a chemical change. 20–D1.4k Section 7.1: Reactions in AqueousSolution, pp. 262-263
Spectator ions are present in a solution but are not involved in the chemicalreaction.
20–D1.4k Section 7.1: Reactions in AqueousSolution, pp. 262-263
Qualitative analysis is the process of separating and identifying substances usinga variety of techniques including ion colour in aqueous solution, flame tests, andprecipitation reactions.
20–D1.3k Section 7.1: Reactions in AqueousSolution, pp. 265-269
Quantitative (or gravimetric) analysis is the process of determining how much of acompound, element, or ion is present in a sample.
20–D1.3k Section 7.2: Stoichiometry andQualitative Analysis, p. 271
A mole ratio is the ratio between the molar amounts of any two elements, ions, orcompounds in a chemical equation.
20–D1.2k20–D1.4k20–D1.5k
Section 7.2: Stoichiometry andQualitative Analysis, pp. 272-274
The amount (mol) of one component in a chemical reaction can be calculated ifthe amount of another component and the chemical equation for the reaction areknown.
20–D1.5k Section 7.2: Stoichiometry andQualitative Analysis, pp. 273-274
The mass (m ) of a substance may be calculated if its molar mass (M ) and amount(n) are known: m = n × M.
20–D1.5k Section 7.2: Stoichiometry andQualitative Analysis, pp. 276-279
Stoichiometry is the calculation of the relative quantities of the reactants andproducts involved in a chemical reaction. Gravimetric stoichiometry involves masscalculations; solution stoichiometry involves the volumes and concentrations ofsolutions; gas stoichiometry involves volumes, temperatures and pressures ofgaseous products or reactants.
20–D1.5k Section 7.2: Stoichiometry andQualitative Analysis, pp. 275-287
When gases react, the volumes of reactant and product gases, at the sametemperature and pressure, are always in whole number ratios. (Law of combininggas volumes)
20–D1.5k Section 7.2: Stoichiometry andQualitative Analysis, pp. 284-286
The limiting reactant of a chemical reaction is the reactant that is completelyconsumed in the reaction.
20–D2.2k Section 8.1: Limiting and ExcessReactants, pp. 296-302

4-3Unit 4 Quantitative Relationships in Chemical Changes • MHR
Concept Outcome Text Reference
The experimental yield from a reaction is usually reduced by a number of factors.Percentage yield =
20–D2.3k20–D2.4k
Section 8.2: Predicted andExperimental Yield, pp. 305-310
In an acid-base titration, the concentration of one solution is quantitativelydetermined by observing the reaction with another solution of knownconcentration. The end of the reaction is often observed using an indicator.
20–D2.6k Section 8.3: Acid-Base Titration, p.312
The end point of an acid-base titration occurs when the indictor changes colour.The equivalence point occurs when stoichiometrically equivalent amounts ofreactants have been mixed.
20–D2.7k Section 8.3: Acid-Base Titration, pp.312-313
An acid-base titration curve is a plot of the pH of the reaction mixture against thevolume of titrant added.
20–D2.5k Section 8.3: Acid-Base Titration, pp.318-319
The endpoint pH for an indicator must be within the steep change in the titrationcurve.
20–D2.6k20–D2.7k
Section 8.3: Acid-Base Titration, pp.319-320
× 100%Experimental yield��
Predicted yield
Related Skills
Skills Outcome Text Reference
Students will experimentally determine the mole ratio of reactant to product in adecomposition reaction.
20–D1.3s Chapter 7 Launch Lab: The ThermalDecomposition of Baking Soda, p.261
Given the chemical formula(s) of the reactant(s), students will identify the reactiontype, predict the product(s) of the reaction and write a chemical equationdescribing the change.
20–D1.1k20–D1.2k
Unit 4 Preparation, pp. 255-258
Students will write ionic and net ionic equations for reactions taking place inaqueous solutions, and identify the spectator ions.
20–D1.1k20–D1.2k20–D1.4k
Section 7.1: Reactions in AqueousSolution, pp. 262-264Section 7.1, Investigation 7.A:Qualitative Analysis, pp. 268-269
Students will use the techniques of qualitative analysis to identify the ions presentin unknown solutions.
20–D1.1k20–D1.2s20–D1.4k
Section 7.1, Thought Lab 7.1:Identifying Unknown AqueousSolutions, p. 267Section 7.1, Investigation 7.A:Qualitative Analysis, pp. 268-269
Students will write the mole ratio for any two components of a chemical reaction,and determine the amount of one component given the amount of the other.
20–D1.5k Section 7.2: Stoichiometry andQualitative Analysis, pp. 273-274
Students will calculate the amount (mol) of one component in a chemical reactiongiven the amount of another component and the chemical equation for thereaction.
20–D1.5k Section 7.2: Stoichiometry andQualitative Analysis, pp. 274, 279
Students will analyze the use of technology to reduce the environmental impact ofprocessing natural gas.
20–D2.2sts Section 7.2: Stoichiometry andQualitative Analysis, p. 279
4-4 MHR • Unit 4 Quantitative Relationships in Chemical Changes
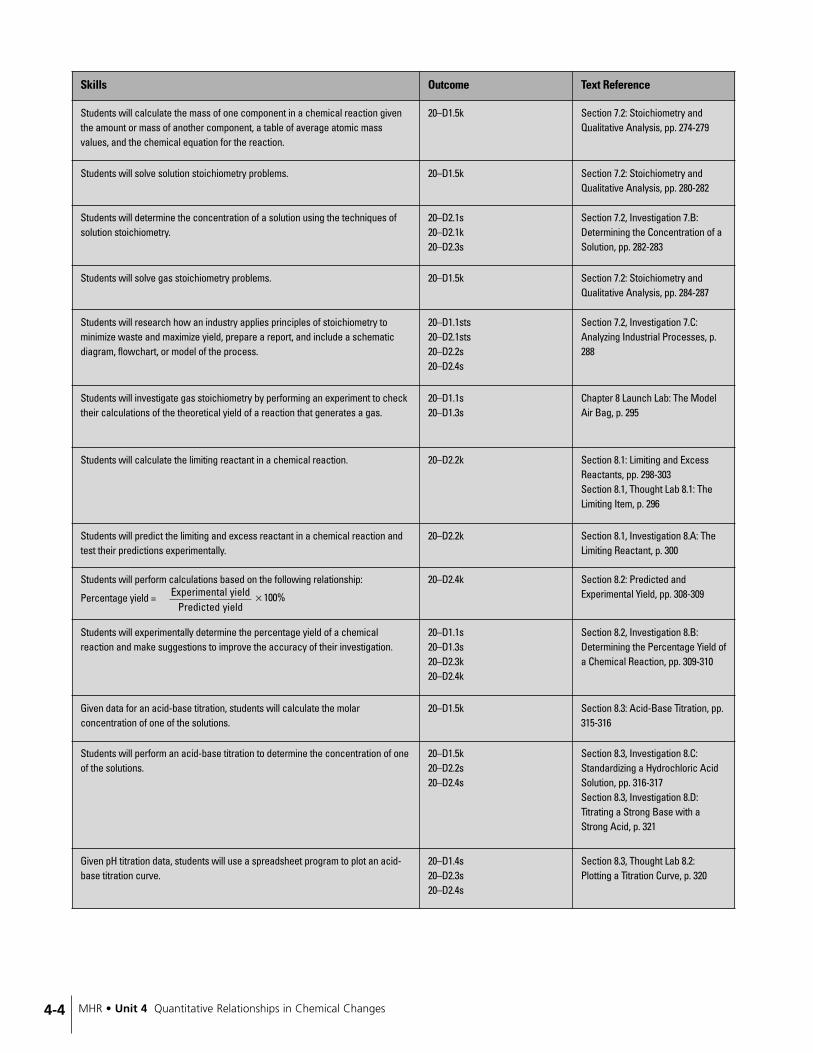
Skills Outcome Text Reference
Students will calculate the mass of one component in a chemical reaction giventhe amount or mass of another component, a table of average atomic massvalues, and the chemical equation for the reaction.
20–D1.5k Section 7.2: Stoichiometry andQualitative Analysis, pp. 274-279
Students will solve solution stoichiometry problems. 20–D1.5k Section 7.2: Stoichiometry andQualitative Analysis, pp. 280-282
Students will determine the concentration of a solution using the techniques ofsolution stoichiometry.
20–D2.1s20–D2.1k20–D2.3s
Section 7.2, Investigation 7.B:Determining the Concentration of aSolution, pp. 282-283
Students will solve gas stoichiometry problems. 20–D1.5k Section 7.2: Stoichiometry andQualitative Analysis, pp. 284-287
Students will research how an industry applies principles of stoichiometry tominimize waste and maximize yield, prepare a report, and include a schematicdiagram, flowchart, or model of the process.
20–D1.1sts20–D2.1sts20–D2.2s20–D2.4s
Section 7.2, Investigation 7.C:Analyzing Industrial Processes, p.288
Students will investigate gas stoichiometry by performing an experiment to checktheir calculations of the theoretical yield of a reaction that generates a gas.
20–D1.1s20–D1.3s
Chapter 8 Launch Lab: The ModelAir Bag, p. 295
Students will calculate the limiting reactant in a chemical reaction. 20–D2.2k Section 8.1: Limiting and ExcessReactants, pp. 298-303Section 8.1, Thought Lab 8.1: TheLimiting Item, p. 296
Students will predict the limiting and excess reactant in a chemical reaction andtest their predictions experimentally.
20–D2.2k Section 8.1, Investigation 8.A: TheLimiting Reactant, p. 300
Students will perform calculations based on the following relationship:
Percentage yield =
20–D2.4k Section 8.2: Predicted andExperimental Yield, pp. 308-309
Students will experimentally determine the percentage yield of a chemicalreaction and make suggestions to improve the accuracy of their investigation.
20–D1.1s20–D1.3s20–D2.3k20–D2.4k
Section 8.2, Investigation 8.B:Determining the Percentage Yield ofa Chemical Reaction, pp. 309-310
Given data for an acid-base titration, students will calculate the molarconcentration of one of the solutions.
20–D1.5k Section 8.3: Acid-Base Titration, pp.315-316
Students will perform an acid-base titration to determine the concentration of oneof the solutions.
20–D1.5k20–D2.2s20–D2.4s
Section 8.3, Investigation 8.C:Standardizing a Hydrochloric AcidSolution, pp. 316-317Section 8.3, Investigation 8.D:Titrating a Strong Base with aStrong Acid, p. 321
Given pH titration data, students will use a spreadsheet program to plot an acid-base titration curve.
20–D1.4s20–D2.3s20–D2.4s
Section 8.3, Thought Lab 8.2:Plotting a Titration Curve, p. 320
× 100%Experimental yield��
Predicted yield
4-5Unit 4 Quantitative Relationships in Chemical Changes • MHR
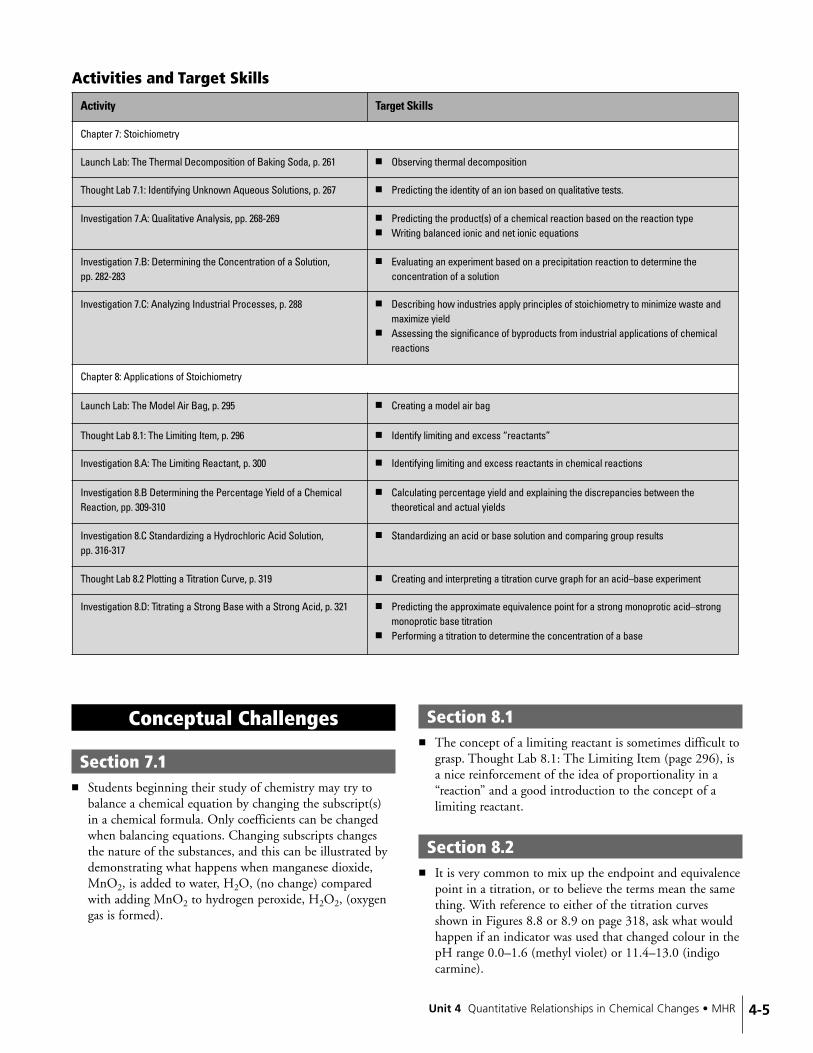
Activities and Target Skills
Activity Target Skills
Chapter 7: Stoichiometry
Launch Lab: The Thermal Decomposition of Baking Soda, p. 261 ■ Observing thermal decomposition
Thought Lab 7.1: Identifying Unknown Aqueous Solutions, p. 267 ■ Predicting the identity of an ion based on qualitative tests.
Investigation 7.A: Qualitative Analysis, pp. 268-269 ■ Predicting the product(s) of a chemical reaction based on the reaction type■ Writing balanced ionic and net ionic equations
Investigation 7.B: Determining the Concentration of a Solution, pp. 282-283
■ Evaluating an experiment based on a precipitation reaction to determine theconcentration of a solution
Investigation 7.C: Analyzing Industrial Processes, p. 288 ■ Describing how industries apply principles of stoichiometry to minimize waste andmaximize yield
■ Assessing the significance of byproducts from industrial applications of chemicalreactions
Chapter 8: Applications of Stoichiometry
Launch Lab: The Model Air Bag, p. 295 ■ Creating a model air bag
Thought Lab 8.1: The Limiting Item, p. 296 ■ Identify limiting and excess “reactants”
Investigation 8.A: The Limiting Reactant, p. 300 ■ Identifying limiting and excess reactants in chemical reactions
Investigation 8.B Determining the Percentage Yield of a ChemicalReaction, pp. 309-310
■ Calculating percentage yield and explaining the discrepancies between thetheoretical and actual yields
Investigation 8.C Standardizing a Hydrochloric Acid Solution, pp. 316-317
■ Standardizing an acid or base solution and comparing group results
Thought Lab 8.2 Plotting a Titration Curve, p. 319 ■ Creating and interpreting a titration curve graph for an acid–base experiment
Investigation 8.D: Titrating a Strong Base with a Strong Acid, p. 321 ■ Predicting the approximate equivalence point for a strong monoprotic acid–strongmonoprotic base titration
■ Performing a titration to determine the concentration of a base
Conceptual Challenges
Section 7.1■ Students beginning their study of chemistry may try to
balance a chemical equation by changing the subscript(s)in a chemical formula. Only coefficients can be changedwhen balancing equations. Changing subscripts changesthe nature of the substances, and this can be illustrated bydemonstrating what happens when manganese dioxide,MnO2, is added to water, H2O, (no change) comparedwith adding MnO2 to hydrogen peroxide, H2O2, (oxygengas is formed).
Section 8.1■ The concept of a limiting reactant is sometimes difficult to
grasp. Thought Lab 8.1: The Limiting Item (page 296), isa nice reinforcement of the idea of proportionality in a“reaction” and a good introduction to the concept of alimiting reactant.
Section 8.2■ It is very common to mix up the endpoint and equivalence
point in a titration, or to believe the terms mean the samething. With reference to either of the titration curvesshown in Figures 8.8 or 8.9 on page 318, ask what wouldhappen if an indicator was used that changed colour in thepH range 0.0–1.6 (methyl violet) or 11.4–13.0 (indigocarmine).
■ Students may believe that the volumes of reactant solutionsare related by the stoichiometric coefficients. Solutionvolumes are usually not in the ratio of the moles ofreactants, and this can be discussed in the post-lab to eitherof the titration experiments, Investigation 8.C:Standardizing a Hydrochloric Solution (page 316-317) orInvestigation 8.D: Titrating a Strong Base with a StrongAcid (page 321).
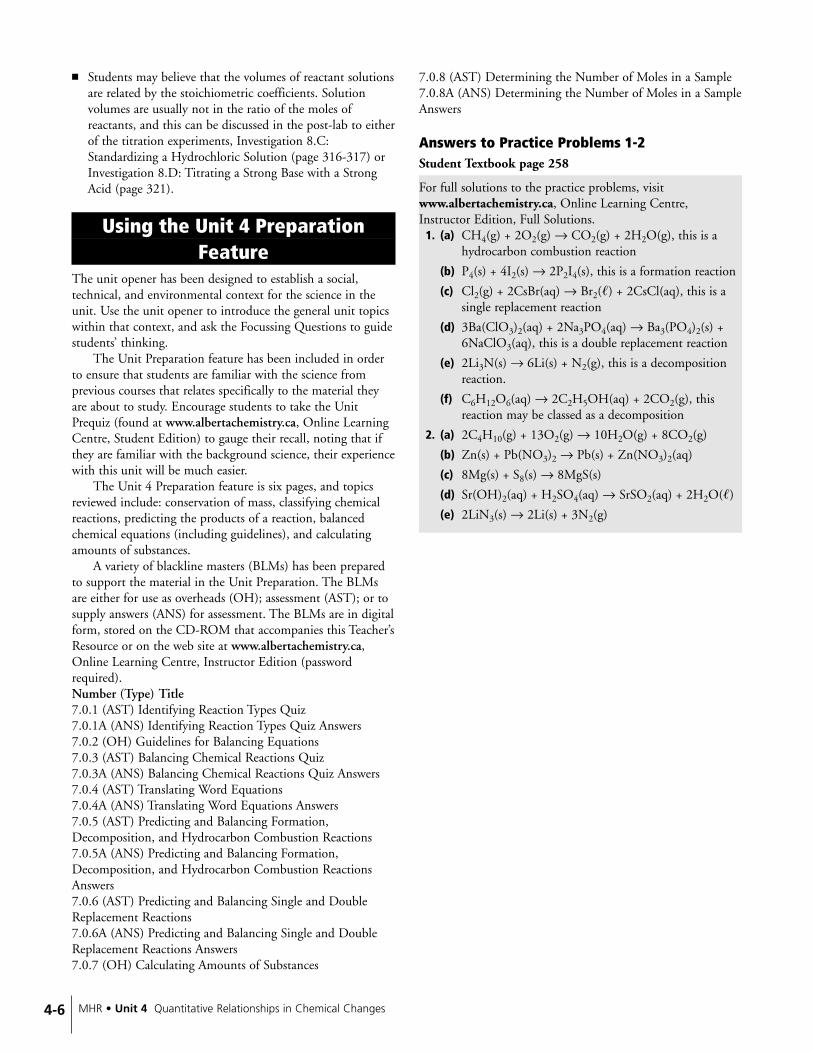
Using the Unit 4 PreparationFeature
The unit opener has been designed to establish a social,technical, and environmental context for the science in theunit. Use the unit opener to introduce the general unit topicswithin that context, and ask the Focussing Questions to guidestudents’ thinking.
The Unit Preparation feature has been included in orderto ensure that students are familiar with the science fromprevious courses that relates specifically to the material theyare about to study. Encourage students to take the UnitPrequiz (found at www.albertachemistry.ca, Online LearningCentre, Student Edition) to gauge their recall, noting that ifthey are familiar with the background science, their experiencewith this unit will be much easier.
The Unit 4 Preparation feature is six pages, and topicsreviewed include: conservation of mass, classifying chemicalreactions, predicting the products of a reaction, balancedchemical equations (including guidelines), and calculatingamounts of substances.
A variety of blackline masters (BLMs) has been preparedto support the material in the Unit Preparation. The BLMsare either for use as overheads (OH); assessment (AST); or tosupply answers (ANS) for assessment. The BLMs are in digitalform, stored on the CD-ROM that accompanies this Teacher’sResource or on the web site at www.albertachemistry.ca,Online Learning Centre, Instructor Edition (passwordrequired).Number (Type) Title7.0.1 (AST) Identifying Reaction Types Quiz7.0.1A (ANS) Identifying Reaction Types Quiz Answers7.0.2 (OH) Guidelines for Balancing Equations7.0.3 (AST) Balancing Chemical Reactions Quiz7.0.3A (ANS) Balancing Chemical Reactions Quiz Answers7.0.4 (AST) Translating Word Equations7.0.4A (ANS) Translating Word Equations Answers7.0.5 (AST) Predicting and Balancing Formation,Decomposition, and Hydrocarbon Combustion Reactions7.0.5A (ANS) Predicting and Balancing Formation,Decomposition, and Hydrocarbon Combustion ReactionsAnswers7.0.6 (AST) Predicting and Balancing Single and DoubleReplacement Reactions7.0.6A (ANS) Predicting and Balancing Single and DoubleReplacement Reactions Answers7.0.7 (OH) Calculating Amounts of Substances
7.0.8 (AST) Determining the Number of Moles in a Sample7.0.8A (ANS) Determining the Number of Moles in a SampleAnswers
Answers to Practice Problems 1-2Student Textbook page 258
For full solutions to the practice problems, visitwww.albertachemistry.ca, Online Learning Centre,Instructor Edition, Full Solutions.
1. (a) CH4(g) + 2O2(g) → CO2(g) + 2H2O(g), this is ahydrocarbon combustion reaction
(b) P4(s) + 4I2(s) → 2P2I4(s), this is a formation reaction
(c) Cl2(g) + 2CsBr(aq) → Br2(�) + 2CsCl(aq), this is asingle replacement reaction
(d) 3Ba(ClO3)2(aq) + 2Na3PO4(aq) → Ba3(PO4)2(s) +6NaClO3(aq), this is a double replacement reaction
(e) 2Li3N(s) → 6Li(s) + N2(g), this is a decompositionreaction.
(f) C6H12O6(aq) → 2C2H5OH(aq) + 2CO2(g), thisreaction may be classed as a decomposition
2. (a) 2C4H10(g) + 13O2(g) → 10H2O(g) + 8CO2(g)
(b) Zn(s) + Pb(NO3)2 → Pb(s) + Zn(NO3)2(aq)
(c) 8Mg(s) + S8(s) → 8MgS(s)
(d) Sr(OH)2(aq) + H2SO4(aq) → SrSO2(aq) + 2H2O(�)
(e) 2LiN3(s) → 2Li(s) + 3N2(g)
4-6 MHR • Unit 4 Quantitative Relationships in Chemical Changes

4-7Unit 4 Quantitative Relationships in Chemical Changes • MHR
UNIT 4: COURSE MATERIALS
Chapter, Section Item Description Suggested Quantity(assume 40 in class)
Text Activity
Chapters 7, 8 safety goggles 40 pairs Chapter 7 Launch Lab, Ch8 Launch Lab;Investigations: 7.A, 7.B, , 8.A, 8.B, 8.C
Chapters 7, 8 nonlatex disposable gloves 40 pairs × 5 investigations Investigations: 7.A, 7.B, 8.A, 8.C, 8.D,
Chapters 7, 8 aprons 40 Investigations: 7.B, 8.A, 8.B, 8.C
Chapter 7,Chapter Opener
baking sodacrucibleiron ring clay triangleBunsen burner or alcohol burnerretort standelectronic balanceheat-resistant gloves
2–3 g per group1 per group1 per group1 per group1 per group1 per group11 pair per group
Launch Lab: The Thermal Decomposition ofBaking Soda, p. 261
Chapter 7,Section 7.1
12- or 24-well plate, or spot plateset of unknown solutions, each set containing thefollowing labelled dropper bottles:A/reactant: 0.10 mol/L NaNO3(aq)B/reactant: 0.10 mol/L AgNO3(aq)C/reactant: 0.10 mol/L Ca(NO3)2(aq)D/reactabt: 0.10 mol/L Cu(NO3)2(aq)set of labelled reactants in dropper bottles:0.10 mol/L HCl (aq)0.10 mo/L H2SO4(aq)cotton swabslaboratory burnerheat-resistant padwash bottle containing de-ionized waterwaste container
1 per group1 set per group
50 mL50 mL50 mL50 mL1 set per group5 mL per group5 mL per group5001 per group1 per group1 per group1
Investigation 7.A: Qualitative Analysis, p. 268–269
Chapter 7, Section 7.2 Mg(NO3)2(aq) solution of unknown concentration0.200 mol/L Na3PO4(aq)deionized water150 mL beaker50 mL volumetric pipette250 mL Erlenmeyer flaskfunnelretort standwash bottledrying oven (if available)stirring rodring clamp or funnel rackfilter paperlarge watch glasselectronic balance
50 mL per group50 mL per group
1 per group1 per group1 per group1 per group1 per group1 per group11 per group1 per group1 per group1 per group1
Investigation 7.B: Determining theConcentration of a Solution, pp. 282–283
4-8 MHR • Unit 4 Quantitative Relationships in Chemical Changes
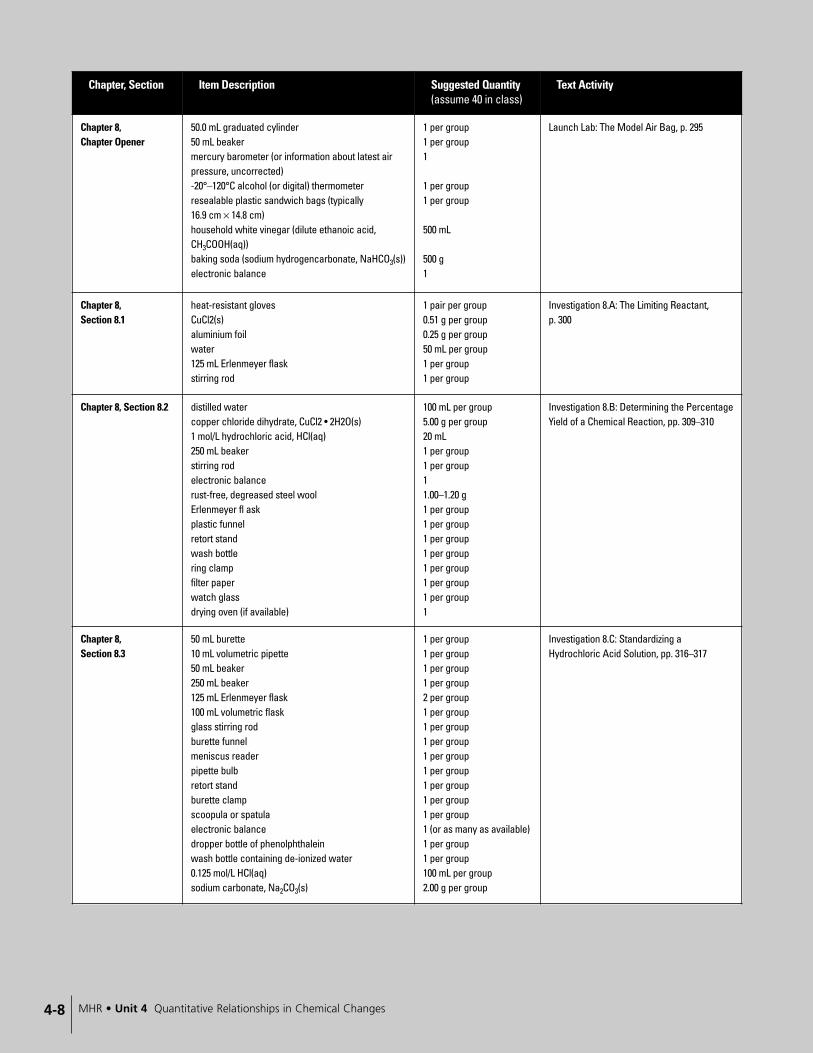
Chapter, Section Item Description Suggested Quantity(assume 40 in class)
Text Activity
Chapter 8,Chapter Opener
50.0 mL graduated cylinder50 mL beakermercury barometer (or information about latest airpressure, uncorrected)-20°–120°C alcohol (or digital) thermometerresealable plastic sandwich bags (typically16.9 cm × 14.8 cm)household white vinegar (dilute ethanoic acid,CH3COOH(aq))baking soda (sodium hydrogencarbonate, NaHCO3(s))electronic balance
1 per group1 per group1
1 per group1 per group
500 mL
500 g1
Launch Lab: The Model Air Bag, p. 295
Chapter 8,Section 8.1
heat-resistant glovesCuCl2(s)aluminium foilwater125 mL Erlenmeyer flaskstirring rod
1 pair per group0.51 g per group0.25 g per group50 mL per group1 per group1 per group
Investigation 8.A: The Limiting Reactant, p. 300
Chapter 8, Section 8.2 distilled watercopper chloride dihydrate, CuCl2 • 2H2O(s)1 mol/L hydrochloric acid, HCl(aq)250 mL beakerstirring rodelectronic balancerust-free, degreased steel woolErlenmeyer fl askplastic funnelretort standwash bottlering clampfilter paperwatch glassdrying oven (if available)
100 mL per group5.00 g per group20 mL 1 per group1 per group11.00–1.20 g 1 per group1 per group1 per group1 per group1 per group1 per group1 per group1
Investigation 8.B: Determining the PercentageYield of a Chemical Reaction, pp. 309–310
Chapter 8,Section 8.3
50 mL burette10 mL volumetric pipette50 mL beaker250 mL beaker125 mL Erlenmeyer flask100 mL volumetric flaskglass stirring rodburette funnelmeniscus readerpipette bulbretort standburette clampscoopula or spatulaelectronic balancedropper bottle of phenolphthalein wash bottle containing de-ionized water0.125 mol/L HCl(aq)sodium carbonate, Na2CO3(s)
1 per group1 per group1 per group1 per group2 per group1 per group1 per group1 per group1 per group1 per group1 per group1 per group1 per group1 (or as many as available)1 per group1 per group100 mL per group 2.00 g per group
Investigation 8.C: Standardizing aHydrochloric Acid Solution, pp. 316–317

Unit 4 Quantitative Relationships in Chemical Changes • MHR 4-9
Chapter, Section Item Description Suggested Quantity(assume 40 in class)
Text Activity
Chapter 8,Section 8.3
50 mL burette10 mL volumetric pipette50 mL beaker250 mL beaker125 mL Erlenmeyer flask100 mL volumetric flaskglass stirring rodburette funnelmeniscus readerpipette bulbretort standburette clampscoopula or spatulaelectronic balance
dropper bottle of methyl orange, phenolphthalein,bromothymol blue (or other suitable indicators)wash bottle containing de-ionized water0.125 mol/L HCl(aq)
0.150 mol/L NaOH(aq)
1 per group1 per group1 per group1 per group2 per group1 per group1 per group1 per group1 per group1 per group1 per group1 per group1 per group1 (or as many as available)1 per group1 per group
100 mL per group(standardized inInvestigation 8.C)100 mL per group
Investigation 8.D: Titrating a Strong Base witha Strong Acid, p. 321
4-10 MHR • Chapter 7 Stoichiometry
Student Textbook Assessment Options
Outcomes for Knowledge
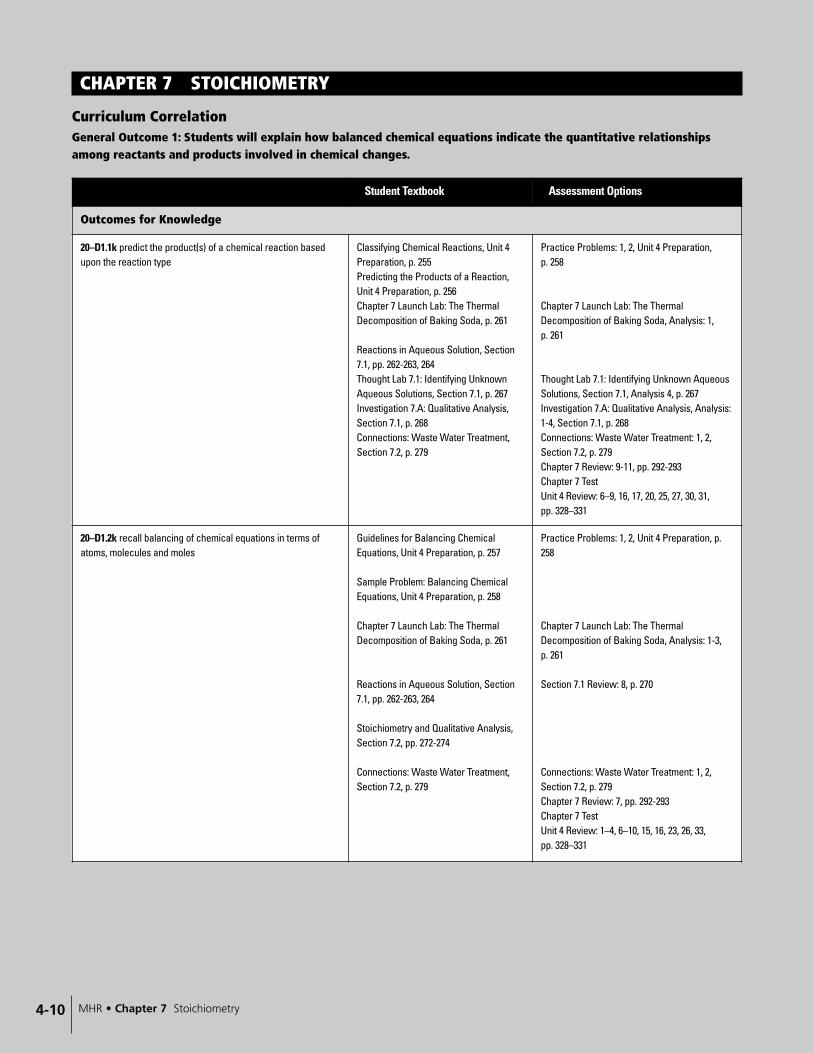
20–D1.1k predict the product(s) of a chemical reaction basedupon the reaction type
Classifying Chemical Reactions, Unit 4Preparation, p. 255Predicting the Products of a Reaction,Unit 4 Preparation, p. 256Chapter 7 Launch Lab: The ThermalDecomposition of Baking Soda, p. 261
Reactions in Aqueous Solution, Section7.1, pp. 262-263, 264Thought Lab 7.1: Identifying UnknownAqueous Solutions, Section 7.1, p. 267Investigation 7.A: Qualitative Analysis,Section 7.1, p. 268Connections: Waste Water Treatment,Section 7.2, p. 279
Practice Problems: 1, 2, Unit 4 Preparation, p. 258
Chapter 7 Launch Lab: The ThermalDecomposition of Baking Soda, Analysis: 1, p. 261
Thought Lab 7.1: Identifying Unknown AqueousSolutions, Section 7.1, Analysis 4, p. 267Investigation 7.A: Qualitative Analysis, Analysis:1-4, Section 7.1, p. 268Connections: Waste Water Treatment: 1, 2,Section 7.2, p. 279Chapter 7 Review: 9-11, pp. 292-293Chapter 7 TestUnit 4 Review: 6–9, 16, 17, 20, 25, 27, 30, 31, pp. 328–331
20–D1.2k recall balancing of chemical equations in terms ofatoms, molecules and moles
Guidelines for Balancing ChemicalEquations, Unit 4 Preparation, p. 257
Sample Problem: Balancing ChemicalEquations, Unit 4 Preparation, p. 258
Chapter 7 Launch Lab: The ThermalDecomposition of Baking Soda, p. 261
Reactions in Aqueous Solution, Section7.1, pp. 262-263, 264
Stoichiometry and Qualitative Analysis,Section 7.2, pp. 272-274
Connections: Waste Water Treatment,Section 7.2, p. 279
Practice Problems: 1, 2, Unit 4 Preparation, p.258
Chapter 7 Launch Lab: The ThermalDecomposition of Baking Soda, Analysis: 1-3, p. 261
Section 7.1 Review: 8, p. 270
Connections: Waste Water Treatment: 1, 2,Section 7.2, p. 279Chapter 7 Review: 7, pp. 292-293Chapter 7 TestUnit 4 Review: 1–4, 6–10, 15, 16, 23, 26, 33, pp. 328–331
CHAPTER 7 STOICHIOMETRY
Curriculum CorrelationGeneral Outcome 1: Students will explain how balanced chemical equations indicate the quantitative relationshipsamong reactants and products involved in chemical changes.
4-11Chapter 7 Stoichiometry • MHR
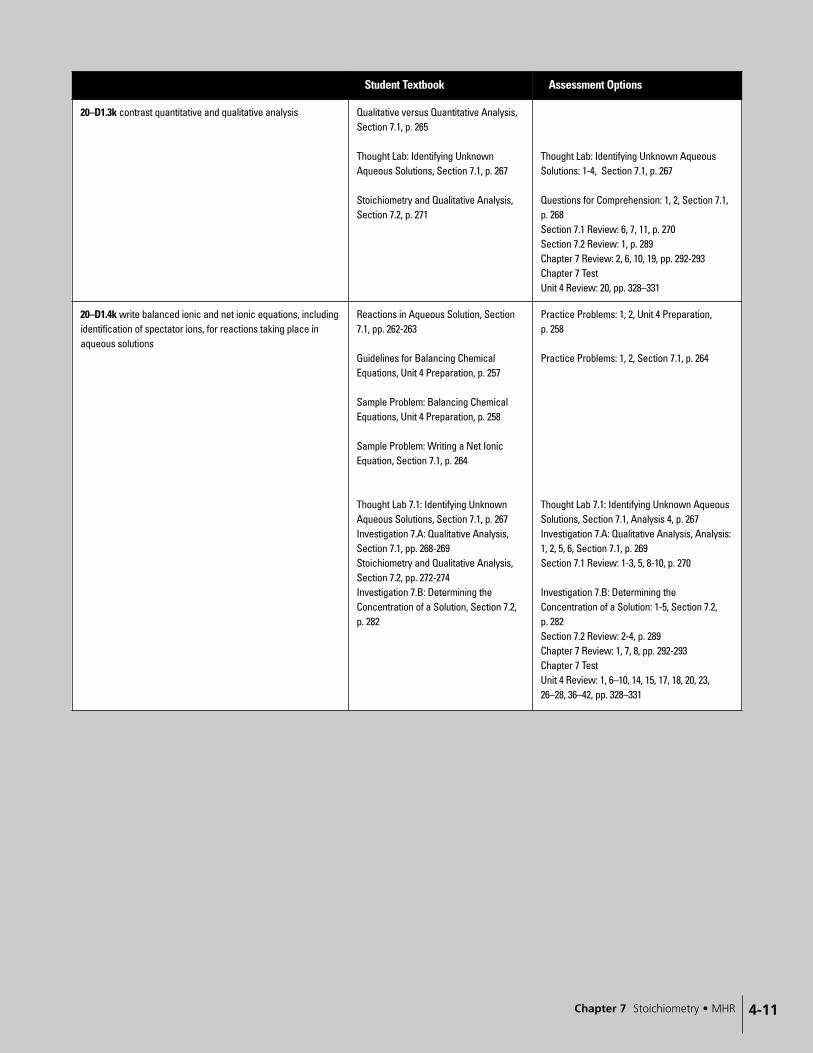
Student Textbook Assessment Options
20–D1.3k contrast quantitative and qualitative analysis Qualitative versus Quantitative Analysis,Section 7.1, p. 265
Thought Lab: Identifying UnknownAqueous Solutions, Section 7.1, p. 267
Stoichiometry and Qualitative Analysis,Section 7.2, p. 271
Thought Lab: Identifying Unknown AqueousSolutions: 1-4, Section 7.1, p. 267
Questions for Comprehension: 1, 2, Section 7.1,p. 268Section 7.1 Review: 6, 7, 11, p. 270Section 7.2 Review: 1, p. 289Chapter 7 Review: 2, 6, 10, 19, pp. 292-293Chapter 7 TestUnit 4 Review: 20, pp. 328–331
20–D1.4k write balanced ionic and net ionic equations, includingidentification of spectator ions, for reactions taking place inaqueous solutions
Reactions in Aqueous Solution, Section7.1, pp. 262-263
Guidelines for Balancing ChemicalEquations, Unit 4 Preparation, p. 257
Sample Problem: Balancing ChemicalEquations, Unit 4 Preparation, p. 258
Sample Problem: Writing a Net IonicEquation, Section 7.1, p. 264
Thought Lab 7.1: Identifying UnknownAqueous Solutions, Section 7.1, p. 267Investigation 7.A: Qualitative Analysis,Section 7.1, pp. 268-269Stoichiometry and Qualitative Analysis,Section 7.2, pp. 272-274Investigation 7.B: Determining theConcentration of a Solution, Section 7.2,p. 282
Practice Problems: 1, 2, Unit 4 Preparation, p. 258
Practice Problems: 1, 2, Section 7.1, p. 264
Thought Lab 7.1: Identifying Unknown AqueousSolutions, Section 7.1, Analysis 4, p. 267Investigation 7.A: Qualitative Analysis, Analysis:1, 2, 5, 6, Section 7.1, p. 269Section 7.1 Review: 1-3, 5, 8-10, p. 270
Investigation 7.B: Determining theConcentration of a Solution: 1-5, Section 7.2, p. 282Section 7.2 Review: 2-4, p. 289Chapter 7 Review: 1, 7, 8, pp. 292-293Chapter 7 TestUnit 4 Review: 1, 6–10, 14, 15, 17, 18, 20, 23,26–28, 36–42, pp. 328–331
4-12 MHR • Chapter 7 Stoichiometry
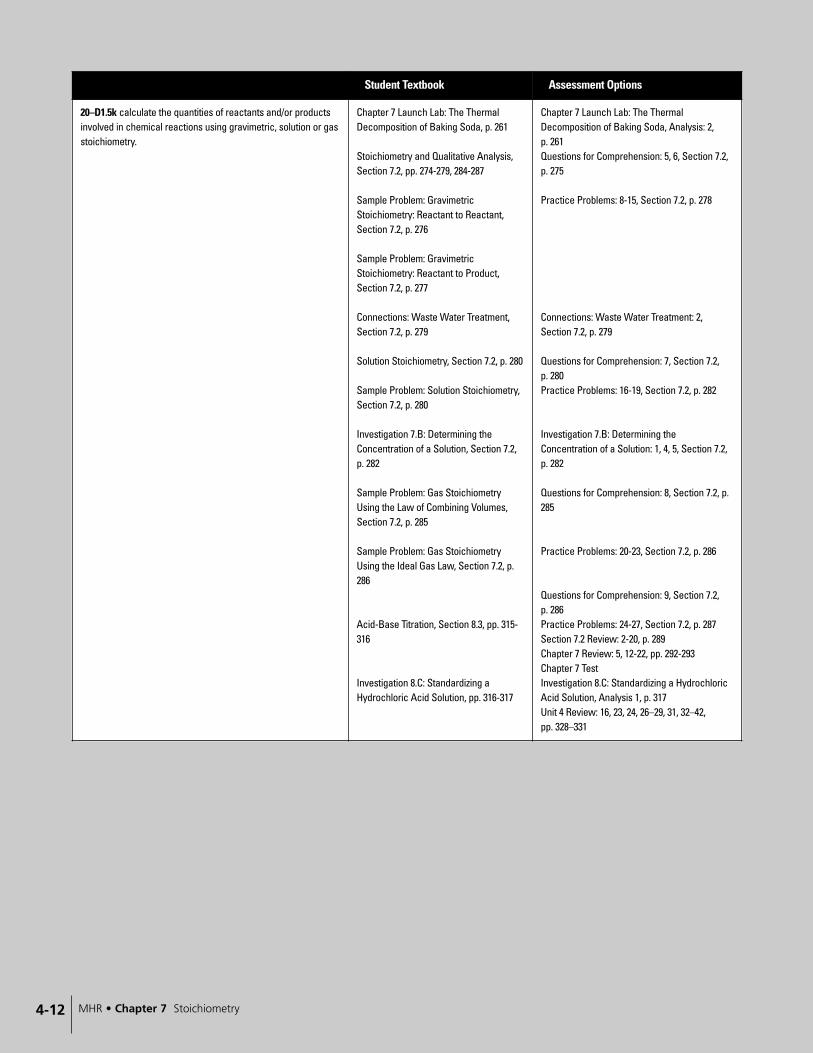
Student Textbook Assessment Options
20–D1.5k calculate the quantities of reactants and/or productsinvolved in chemical reactions using gravimetric, solution or gasstoichiometry.
Chapter 7 Launch Lab: The ThermalDecomposition of Baking Soda, p. 261
Stoichiometry and Qualitative Analysis,Section 7.2, pp. 274-279, 284-287
Sample Problem: GravimetricStoichiometry: Reactant to Reactant,Section 7.2, p. 276
Sample Problem: GravimetricStoichiometry: Reactant to Product,Section 7.2, p. 277
Connections: Waste Water Treatment,Section 7.2, p. 279
Solution Stoichiometry, Section 7.2, p. 280
Sample Problem: Solution Stoichiometry,Section 7.2, p. 280
Investigation 7.B: Determining theConcentration of a Solution, Section 7.2,p. 282
Sample Problem: Gas StoichiometryUsing the Law of Combining Volumes,Section 7.2, p. 285
Sample Problem: Gas StoichiometryUsing the Ideal Gas Law, Section 7.2, p.286
Acid-Base Titration, Section 8.3, pp. 315-316
Investigation 8.C: Standardizing aHydrochloric Acid Solution, pp. 316-317
Chapter 7 Launch Lab: The ThermalDecomposition of Baking Soda, Analysis: 2, p. 261Questions for Comprehension: 5, 6, Section 7.2,p. 275
Practice Problems: 8-15, Section 7.2, p. 278
Connections: Waste Water Treatment: 2,Section 7.2, p. 279
Questions for Comprehension: 7, Section 7.2, p. 280Practice Problems: 16-19, Section 7.2, p. 282
Investigation 7.B: Determining theConcentration of a Solution: 1, 4, 5, Section 7.2,p. 282
Questions for Comprehension: 8, Section 7.2, p.285
Practice Problems: 20-23, Section 7.2, p. 286
Questions for Comprehension: 9, Section 7.2, p. 286Practice Problems: 24-27, Section 7.2, p. 287Section 7.2 Review: 2-20, p. 289Chapter 7 Review: 5, 12-22, pp. 292-293Chapter 7 TestInvestigation 8.C: Standardizing a HydrochloricAcid Solution, Analysis 1, p. 317Unit 4 Review: 16, 23, 24, 26–29, 31, 32–42, pp. 328–331

4-13Chapter 7 Stoichiometry • MHR
Student Textbook Assessment Options
Outcomes for Science, Technology and Society (Emphasis on social and environmental contexts)
20–D1.1sts explain that the focus in technology is on thedevelopment of solutions, involving devices and systems thatmeet a given need within the constraints of a problem by■ analyzing the chemical reactions involved in various
industrial and commercial processes and products that usestoichiometric and chemical principles, using examplesfrom the following:– production of urea– fertilizers– fuel combustion– water treatment– air-bag deployment– neutralization of excess stomach acid.
Connections: Waste Water Treatment,Section 7.2, p. 279
Investigation 7.C: Analyzing IndustrialProcesses, Section 7.2, p. 288
Connections: Waste Water Treatment: 1-4,Section 7.2, p. 279
Investigation 7.C: Analyzing IndustrialProcesses: 1-3, 1, 2, Section 7.2, p. 288Chapter 7 Review: 19-22, p. 292-293Unit 4 Review: 43–45, p. 328–331
Skill Outcomes (Focus on problem solving)
Initiating and Planning
20–D1.1s ask questions about observed relationships and planinvestigations of questions, ideas, problems and issues by■ planning and predicting states, products and theoretical
yields for chemical reaction■ designing an experiment to identify an ion, e.g., precipitation,
flame test■ describing procedures for safe handling, storage and
disposal of materials used in the laboratory, with referenceto WHMIS and consumer product labelling information.
Thought Lab: Identifying UnknownAqueous Solutions, Section 7.1, p. 267
Investigation 7.B: Determining theConcentration of a Solution, Section 7.2,p. 282
Chapter 8, Launch Lab: The Model AirBag, p. 295Investigation 8.B: Determining thePercentage Yield of a Chemical Reaction,pp. 309-310
Thought Lab: Identifying Unknown AqueousSolutions, Analysis: 1-4, Section 7.1, p. 267
Investigation 7.B: Determining theConcentration of a Solution: 1-5, Section 7.2, p. 282Chapter 7 Review: 19-21, pp. 292-293Chapter 8, Launch Lab: The Model Air Bag,Analysis 2, p. 295Investigation 8.B: Determining the PercentageYield of a Chemical Reaction, Analysis 1-3, p. 310Unit 4 Review: 11, 22, 43–45, pp. 328–331
Performing and Recording
20–D1.2s conduct investigations into relationships amongobservable variables and use a broad range of tools andtechniques to gather and record data and information by■ translating word equations for chemical reactions into
chemical equations, including states of matter for theproducts and reactants
■ balancing chemical equations for chemical reactions, usinglowest whole-number coefficients.
Thought Lab: Identifying UnknownAqueous Solutions, Section 7.1, p. 267
Connections: Waste Water Treatment,Section 7.2, p. 279
Investigation 7.A: Qualitative Analysis, pp. 273-274Investigation 7.B: Determining theConcentration of a Solution, Section 7.2,p. 282
Thought Lab: Identifying Unknown AqueousSolutions, Analysis: 1-4, Section 7.1, p. 267
Connections: Waste Water Treatment: 1,Section 7.2, p. 279
Investigation 7.A: Qualitative Analysis, Analysis1, 2, p. 274Investigation 7.B: Determining theConcentration of a Solution: 1-5, Section 7.2, p. 282

4-14 MHR • Chapter 7 Stoichiometry
Student Textbook Assessment Options
Analyzing and Interpreting
20–D1.3s analyze data and apply mathematical and conceptualmodels to develop and assess possible solutions by■ interpreting stoichiometric ratios from chemical reaction
equations■ performing calculations to determine theoretical yields■ using appropriate SI notation, fundamental and derived units
and significant digits when performing stoichiometriccalculations.
Investigation 7.B: Determining theConcentration of a Solution, Section 7.2,p. 282Throughout Chapter 7
Chapter 8, Launch Lab: The Model AirBag, p. 295Investigation 8.B: Determining thePercentage Yield of a Chemical Reaction,pp. 309-310
Investigation 7.B: Determining theConcentration of a Solution: 1-5, Section 7.2, p. 282Throughout Chapter 7
Chapter 8, Launch Lab: The Model Air Bag,Analysis 1, p. 295Investigation 8.B: Determining the PercentageYield of a Chemical Reaction, Conclusion 4,Extension 5, pp. 309-310Unit 4 Review: 19, 23–42, pp. 328–331
Communication and Teamwork
20–D1.4s work as members of a team in addressing problemsand apply the skills and conventions of science incommunicating information and ideas and in assessing resultsby■ using integrated software effectively and efficiently to
incorporate data and text.
Investigation 7.C: Analyzing IndustrialProcesses, Section 7.2, p. 288
Thought Lab 8.2: Plotting a TitrationCurve, p. 320
Investigation 7.C: Analyzing IndustrialProcesses: 1-3, Section 7.2, p. 288Section 7.2 Review: 8, p. 290
Thought Lab 8.2: Plotting a Titration Curve,Procedure 1, Analysis 5, p. 320

4-15Chapter 7 Stoichiometry • MHR
Chapter 7
StoichiometryStudent Textbook pages 260–293
Chapter ConceptsSection 7.1 Reactions in Aqueous Solution■ Complete balanced, ionic, and net ionic equations are all
ways to represent reactions in solution.■ Qualitative tests, such as flame tests and precipitation
reactions, test for the presence of dissolved ions.
Section 7.2 Stoichiometry and Quantitative Analysis■ The coefficients of a balanced chemical reaction can be
used to predict the masses of products and reactants, giventhe mass of another product or reactant.
■ Stoichiometric techniques can be used to determine theconcentration and volume of aqueous solutions.
■ Precipitation reactions are useful for determining theconcentration of an unknown solution.
■ Stoichiometric techniques can be used to determine thevolume, temperature, mass, or pressure of gaseous reactantsor products.
■ Industrial processes use stoichiometric principles tomaximize yield and minimize loss.
Common Misconceptions■ When predicting net ionic equations in aqueous solutions,
some students may incorrectly dissociate molecularcompounds C6H12O6(aq) → 6C2–(aq) + 12 H+(aq) + 6O2–(aq).Students should be reminded that molecular compoundsdo not break apart when placed in an aqueousenvironment. In conjunction, weak acids do not ionize insolutions, and students should be reminded of thedistinction between strong and weak acids.
■ Some students will believe that flame and solution coloursare representative of the element as well as the ion. Forexample, a piece of sodium will produce a yellow colourwhen placed in a flame. The flame and solution colours areproduced by the ion, not the atom. This point should bereinforced.
■ When calculating the molar mass of compounds found ina balanced equation, students will sometimes take the valueof the coefficient for a particular compound intoconsideration. Explain that the units for molar mass are�m
gol�, not �2 m
gol
� or �3 mg
ol�. The coefficients are part of the
balanced chemical equation, not of the molar mass. ■ Some students may not be aware that it is the metallic
portion of the compound that gives the colour to the flamein a flame test. They may think that the anion is involvedas well. It may be helpful to show them that any sodiumsalt, whether it is a chloride, bromide, iodide, or carbonate,will give the same yellow colour to the flame.
■ Students may believe that the colour of ions in solution isthe same colour that will be seen from the ion in a flametest. Table 7.2 on page 265 of the student textbook showsthe colour of some ions in solution; on the next page,Table 7.3 shows the colour of selected metal ions in aflame test. You could make up one or two of the solutionsand show how coloured compounds in solution do notgive that same colour in a flame, to show that the twocolour charts mean different things.
■ The mole is one of the more difficult concepts in anintroductory chemistry course. Although this unit is not thefirst to introduce the mole, it does use the concept extensively.Students need a clear understanding based on making theconnection between the amount of substance and a numericalquantity. Students who struggle to manipulate numbers andsymbols will find a strictly mathematical approach towardslearning the mole very difficult to understand and the chemicalmeaning of the mole concept should be emphasized.
■ Students quite often believe that the number of reactantmoles must be the same as the number of product moles ina balanced chemical equation. In other words, they believethat moles are conserved. Point out that mass is conservedin a chemical change, not number of moles.
■ It is a quite common misconception that substances alwaysreact in a 1:1 ratio. A similar misconception arises whenstudents assume that substances react by equal mass, orthat the coefficients in the chemical equation are a ratio ofreacting masses. These misconceptions can be dealt with inthe post-lab discussion of the Launch lab (page 261), orany of the stoichiometric labs that follow in this unit.
■ Students often use the atomic mass for the elements of thediatomic gases (hydrogen, oxygen, chlorine, etc.) as themolar mass. Tell students to be careful of any chemicalequation that contains a diatomic gas, and to calculate themolar mass correctly.
■ Another fairly common misconception is applied whenstudents use the product of the molar mass and thecoefficient as the molar mass. When the coefficient is alsoused in the mole ratio, the stoichiometry is incorrect. Thiscan be shown with an example the first time thismisconception arises in class.
Helpful ResourcesJournal Articles■ Ault, A. “How to Say How Much: Amounts and
Stoichiometry,” Journal of Chemical Education, Vol. 79,2001, p. 1345.
■ Haim, L.; Corton, E.; Kocmur, S.; and Galagovsky, L.“Learning Stoichiometry with Hamburger Sandwiches,”Journal of Chemical Education, Vol. 80, 2003, p. 1021. Gabel, D. “Improving Teaching and Learning throughChemistry Education Research: A Look to the Future,”Journal of Chemical Education, Vol. 76, 1999, p. 548.
■ Kashmar, R.J. “The Use of Cut-Out Molecular Models onthe Overhead Projector To Illustrate Stoichiometry and

Limiting Reactants,” Journal of Chemical Education, Vol.74, 1997, p. 791.
■ Krieger, C.R. “Stoogiometry: A Cognitive Approach toTeaching Stoichiometry,” Journal of Chemical Education,Vol. 74, 1997, p. 306.
■ Toth, Z. “Limiting Reactant: An Alternative Analogy,”Journal of Chemical Education, Vol. 76, 1999, p. 934.
■ Witzel, J. E. “Lego Stoichiometry,” Journal of ChemicalEducation, Vol. 79, 2002, p. 3528.
Web SitesWeb links related to stoichiometry can be found atwww.albertachemistry.ca. Go to the Online Learning Centre,and log on to Instructor Edition. Choose Teacher Web Links.
List of BLMs Blackline masters (BLMs) have been prepared to support thematerial in this chapter. The BLMs are either for assessment(AST); use as overheads (OH); use as handouts (HAND), inparticular to support activities; or to supply answers (ANS) forassessment or handouts. The BLMs are in digital form, storedon the CD-ROM that accompanies this Teacher’s Resource oron the web site at www.albertachemistry.ca, Online LearningCentre, Instructor Edition, BLMs.
Number (Type) Title7.0.1 (AST) Identifying Reaction Types7.0.1A (ANS) Identifying Reaction Types Answer Key7.0.2 (OH) Guidelines for Balancing Equations7.0.3 (AST) Balancing Chemical Reactions7.0.3A (ANS) Balancing Chemical Reactions Answer Key7.0.4 (AST) Translating Word Equations7.0.4A (ANS) Translating Word Equations Answer Key7.0.5 (AST) Predicting and Balancing Formation,Decomposition, and Hydrocarbon Combustion Reactions7.0.5A (ANS) Predicting and Balancing Formation,Decomposition, and Hydrocarbon Combustion ReactionsAnswer Key7.0.6 (AST) Predicting and Balancing Single and DoubleReplacement Reactions7.0.6A (ANS) Predicting and Balancing Single and DoubleReplacement Reactions Answer Key7.0.7 (OH) Calculating Amounts of Substances7.0.8 (AST) Determining the Number of Moles in a Sample7.0.8A (ANS) Determining the Number of Moles in a SampleAnswer Key7.0.9 (HAND) Launch Lab: The Thermal Decomposition ofBaking Soda7.0.9A (ANS) Launch Lab: The Thermal Decomposition ofBaking Soda Answer Key
7.1.1 (OH) Net Ionic Equations7.1.2 (AST) Writing Net Ionic Equations7.1.2A (ANS) Writing Net Ionic Equations Answer Key7.1.3 (OH) Qualitative Analysis7.1.4 (OH) Identifying Ions Using Precipitation Reactions7.1.5 (AST) Qualitative Analysis Questions7.1.5A (ANS) Qualitative Analysis Questions Answer Key
7.1.6 (HAND) Thought Lab 7.1: Identifying UnknownAqueous Solutions7.1.6A (ANS) Thought Lab 7.1: Identifying UnknownAqueous Solutions Answer Key7.1.7 (HAND) Investigation 7.A: Qualitative Analysis7.1.7A (ANS) Investigation 7.A: Qualitative Analysis AnswerKey
7.2.1 (OH) Balanced Chemical Equations7.2.2 (HAND) Gravimetric Stoichiometry Tutorial7.2.3 (AST) Gravimetric Stoichiometry Problems7.2.3A (ANS) Gravimetric Stoichiometry Problems AnswerKey7.2.4 (HAND) Solution Stoichiometry Tutorial7.2.5 (AST) Solution Stoichiometry Problems7.2.5A (ANS) Solution Stoichiometry Problems Answer Key7.2.6 (HAND) Investigation 7.B: Determining theConcentration of a Solution7.2.6A (ANS) Investigation 7.B: Determining theConcentration of a Solution Answer Key7.2.7 (AST) Gas Stoichiometry Problems7.2.7A (ANS) Gas Stoichiometry Problems Answer Key7.2.8 (AST) Law of Combining Volumes7.2.8A (ANS) Law of Combining Volumes Answer Key7.2.9 (AST) Mixed Stoichiometry Quiz7.2.9A (ANS) Mixed Stoichiometry Quiz Answer Key7.2.10 (HAND) Investigation 7.C: Analyzing IndustrialProcesses7.2.10A (ANS) Investigation 7.C: Analyzing IndustrialProcesses Answer Key
7.3.1 (AST) Chapter 7 Test7.3.1A (ANS) Chapter 7 Test Answer Key
Using the Chapter 7 OpenerStudent Textbook pages 260-261
Teaching Strategies■ Prepare a number of chemical reactions for the class to observe.
For example, have a candle burning at the front of theclassroom. Ask students to describe what is occurring and howthis could be communicated in a simplified manner (thechemical equation). You could discuss the evidence for chemicalchange. Suggested reactions include: aqueous silver nitrate andcopper strips (formation of a precipitate and a colour change ifleft long enough); household vinegar and baking soda(production of a gas); aqueous sodium iodide and aqueouslead(II) nitrate (formation of a brightly coloured precipitate);and the addition of aqueous sodium hydroxide to a sample ofhydrochloric acid containing phenolphthalein (colour change).
■ Prepare a number of reactions (reactants only) on separatepieces of paper; fold them and place them into a jar. Dividestudents into pairs and have one member of each pair selecta reaction. Allow the pairs a certain length of time topredict the products, balance the equation, and identify thereaction type. Each team that correctly completes their taskreceives points. Winning pairs could be given an incentive,
4-16 MHR • Unit 4 Quantitative Relationships in Chemical Changes

4-17Chapter 7 Stoichiometry • MHR
such as a “Get Out of Homework Free” card that can beused during the course of the year.
■ Devise a game similar to Jeopardy. Categories such asproducts of reaction, reactants, coefficients of reaction, andevidence of reaction could be used, and appropriatequestions could be devised for each category. Form teamsand rotate the team members so that each student has theopportunity to respond. Keep track of team points.
Launch Lab The Thermal Decomposition of Baking Soda
Student Textbook page 261
PurposeStudents observe the thermal decomposition of NaHCO3(s)and compare the mole relationship between reactant andproducts in the reaction.
Outcomes■ 20–D1.1k■ 20–D1.2k
Advance Preparation
Time Required45 minutes
Helpful Tips■ A 0.1 g balance is sufficient to determine the difference in
mass, but a 0.01 g balance yields more precise data.
■ Make sure students understand that the crucibles and othermaterials must be completely dry before use so thatmoisture does not affect the change in mass.
■ Use BLM 7.0.9 (HAND) Launch Lab: The ThermalDecomposition of Baking Soda and BLM 7.0.9A (ANS)Launch Lab: The Thermal Decomposition of Baking SodaAnswer Key to support this activity. Remove sections asappropriate to meet the needs of the students in your class.
■ Expected Results When the sodium hydrogen carbonate isheated, it will decompose according to the equation:
2NaHCO3(s) → Na2CO3(s) + CO2(g) + H2O(g)
The carbon dioxide and water will escape as gases leaving solidsodium carbonate behind. When the students determine themass of the remaining solid sodium carbonate and calculatethe number of moles of the sodium hydrogen carbonate andsodium carbonate, they will find a ratio very close to 2:1. Theyshould notice that the coefficients of sodium hydrogencarbonate and sodium carbonate are 2 and 1 respectively.
Answers to Analysis Questions1. 2NaHCO3(s) → Na2CO3(s) + CO2(g) + H2O(g)
2. Using the mass of baking soda suggested in the lab, molesof sodium hydrogen carbonate used = 3.00 g / 84.01 �m
gol�
= 0.0357 mol (to the correct number of significant digits).
The mass of sodium carbonate obtained ideally would beapproximately 2.00 g.
Moles of sodium carbonate produced =
2.00 g / 105.99 �mgol� = 0.0189 mol
3. The ratio is 1.89:1, or approximately 2:1.
4. The ratio calculated in question 3 is the mole ratio, or theratio of the whole number coefficients from the balancedchemical equation.
Assessment Options■ Collect and assess students’ answers to Analysis questions.■ Use Assessment Checklist 2 Laboratory Reports.
7.1 Reactions in Aqueous SolutionStudent Textbook pages 262–270
Section OutcomesStudents will:■ write balanced ionic and net ionic equations, including
identification of spectator ions, for reactions taking place inaqueous solutions
■ contrast quantitative and qualitative analysis■ perform qualitative analysis to identify unknowns
Key Termsspectator ionscomplete balanced equationionic equation
Materials
■ baking soda■ crucible■ iron ring■ clay triangle■ Bunsen burner or alcohol burner■ retort stand■ electronic balance
When to Begin What to Do
2 to 3 weeks ■ Ensure all materials andchemical are available.
1 day before ■ Set up student stations.■ Collect materials.■ Photocopy BLM 7.0.9
(HAND) Launch Lab: TheThermal Decomposition ofBaking Soda.
4-18 MHR • Unit 4 Quantitative Relationships in Chemical Changes
net ionic equationqualitative analysisquantitative analysisflame testprecipitation reaction
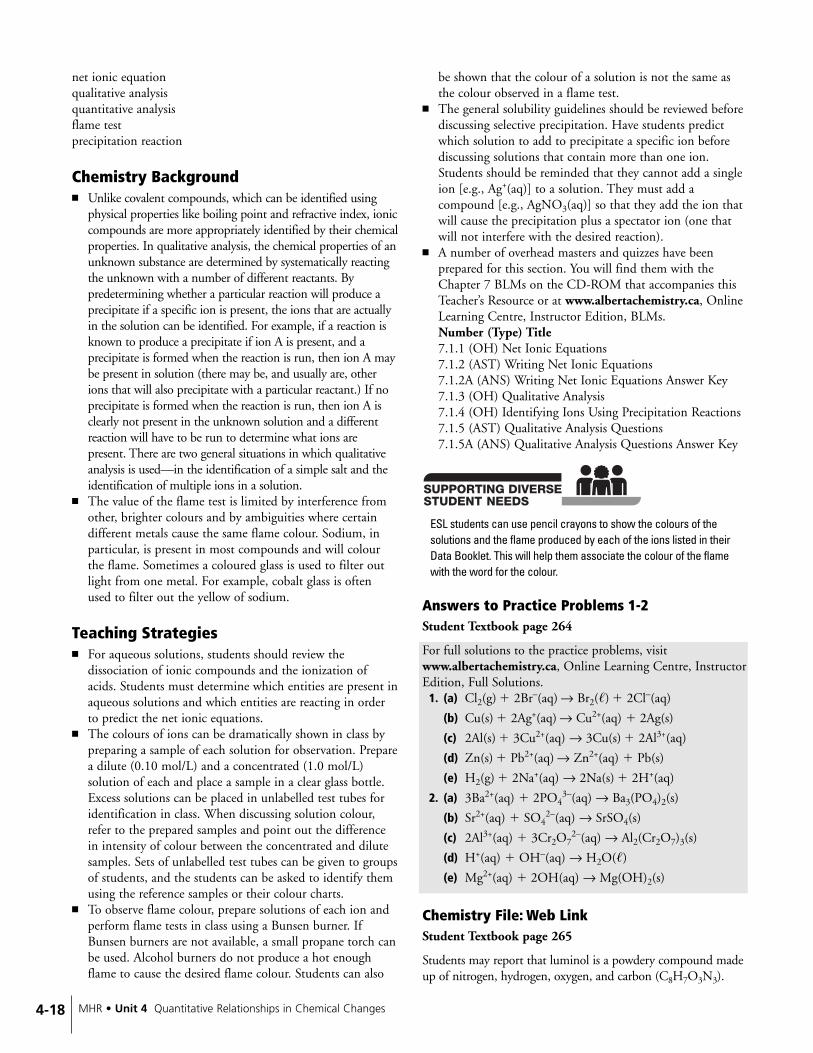
Chemistry Background■ Unlike covalent compounds, which can be identified using
physical properties like boiling point and refractive index, ioniccompounds are more appropriately identified by their chemicalproperties. In qualitative analysis, the chemical properties of anunknown substance are determined by systematically reactingthe unknown with a number of different reactants. Bypredetermining whether a particular reaction will produce aprecipitate if a specific ion is present, the ions that are actuallyin the solution can be identified. For example, if a reaction isknown to produce a precipitate if ion A is present, and aprecipitate is formed when the reaction is run, then ion A maybe present in solution (there may be, and usually are, otherions that will also precipitate with a particular reactant.) If noprecipitate is formed when the reaction is run, then ion A isclearly not present in the unknown solution and a differentreaction will have to be run to determine what ions arepresent. There are two general situations in which qualitativeanalysis is used—in the identification of a simple salt and theidentification of multiple ions in a solution.
■ The value of the flame test is limited by interference fromother, brighter colours and by ambiguities where certaindifferent metals cause the same flame colour. Sodium, inparticular, is present in most compounds and will colourthe flame. Sometimes a coloured glass is used to filter outlight from one metal. For example, cobalt glass is oftenused to filter out the yellow of sodium.
Teaching Strategies■ For aqueous solutions, students should review the
dissociation of ionic compounds and the ionization ofacids. Students must determine which entities are present inaqueous solutions and which entities are reacting in orderto predict the net ionic equations.
■ The colours of ions can be dramatically shown in class bypreparing a sample of each solution for observation. Preparea dilute (0.10 mol/L) and a concentrated (1.0 mol/L)solution of each and place a sample in a clear glass bottle.Excess solutions can be placed in unlabelled test tubes foridentification in class. When discussing solution colour,refer to the prepared samples and point out the differencein intensity of colour between the concentrated and dilutesamples. Sets of unlabelled test tubes can be given to groupsof students, and the students can be asked to identify themusing the reference samples or their colour charts.
■ To observe flame colour, prepare solutions of each ion andperform flame tests in class using a Bunsen burner. IfBunsen burners are not available, a small propane torch canbe used. Alcohol burners do not produce a hot enoughflame to cause the desired flame colour. Students can also
be shown that the colour of a solution is not the same asthe colour observed in a flame test.
■ The general solubility guidelines should be reviewed beforediscussing selective precipitation. Have students predictwhich solution to add to precipitate a specific ion beforediscussing solutions that contain more than one ion.Students should be reminded that they cannot add a singleion [e.g., Ag+(aq)] to a solution. They must add acompound [e.g., AgNO3(aq)] so that they add the ion thatwill cause the precipitation plus a spectator ion (one thatwill not interfere with the desired reaction).
■ A number of overhead masters and quizzes have beenprepared for this section. You will find them with theChapter 7 BLMs on the CD-ROM that accompanies thisTeacher’s Resource or at www.albertachemistry.ca, OnlineLearning Centre, Instructor Edition, BLMs.Number (Type) Title7.1.1 (OH) Net Ionic Equations7.1.2 (AST) Writing Net Ionic Equations7.1.2A (ANS) Writing Net Ionic Equations Answer Key7.1.3 (OH) Qualitative Analysis7.1.4 (OH) Identifying Ions Using Precipitation Reactions7.1.5 (AST) Qualitative Analysis Questions7.1.5A (ANS) Qualitative Analysis Questions Answer Key
ESL students can use pencil crayons to show the colours of thesolutions and the flame produced by each of the ions listed in theirData Booklet. This will help them associate the colour of the flamewith the word for the colour.
Answers to Practice Problems 1-2Student Textbook page 264
For full solutions to the practice problems, visitwww.albertachemistry.ca, Online Learning Centre, InstructorEdition, Full Solutions.
1. (a) Cl2(g) � 2Br–(aq) → Br2(�) � 2Cl–(aq)
(b) Cu(s) � 2Ag+(aq) → Cu2+(aq) � 2Ag(s)
(c) 2Al(s) � 3Cu2+(aq) → 3Cu(s) � 2Al3+(aq)
(d) Zn(s) � Pb2+(aq) → Zn2+(aq) � Pb(s)
(e) H2(g) � 2Na+(aq) → 2Na(s) � 2H+(aq)
2. (a) 3Ba2+(aq) � 2PO43–(aq) → Ba3(PO4)2(s)
(b) Sr2+(aq) � SO42–(aq) → SrSO4(s)
(c) 2Al3+(aq) � 3Cr2O72–(aq) → Al2(Cr2O7)3(s)
(d) H+(aq) � OH–(aq) → H2O(�)
(e) Mg2+(aq) � 2OH(aq) → Mg(OH)2(s)
Chemistry File: Web LinkStudent Textbook page 265
Students may report that luminol is a powdery compound madeup of nitrogen, hydrogen, oxygen, and carbon (C8H7O3N3).

4-19Chapter 7 Stoichiometry • MHR
Investigators mix luminol with liquid containing hydrogenperoxide (H2O2), a hydroxide (OH–) and other chemicals tocreate a mixture that can be sprayed. Luminol and the hydrogenperoxide are keys to the oxidation reaction, but they need acatalyst to accelerate the process and produce a strong glow. Onecatalyst is the iron in hemoglobin. The luminol-based spray isinteracting with the catalyst when it comes into contact withbloodstains and begins to glow. The chemical reaction producedby the luminol spray can destroy other evidence in the crimescene so it is used as a final step or last resort.
They may also report on other types of chemical tracers suchas the HemaTrace test. It is based on the presence of monoclonalantibodies for human hemoglobin. It is called a presumptive testbecause it isn’t perfect. (It also gives a positive for ferret blood.)
Thought Lab 7.1: Identifying Unknown Aqueous Solutions
Student Textbook page 267
PurposeStudents will analyze data from a series of reactions to identifyions in an unknown solution.
Outcomes■ 20–D1.3k ■ 20–D1.2s■ 20–D1.1s
Advance Preparation
Time Required30 minutes
Helpful Tips■ Review concepts learned in Section 7.1 before beginning
this Thought Lab.■ Use BLM 7.1.6 (HAND) Thought Lab 7.1: Identifying
Unknown Aqueous Solutions and BLM 7.1.6A (ANS)Thought Lab 7.1: Identifying Unknown AqueousSolutions Answer Key to support this activity. Removesections as appropriate to meet the needs of the students inyour class.
Answers to Analysis Questions1. Ca2+(aq)
2. Ca2+ (aq) and Sr2+ (aq)
3. The flame will appear yellow, as aqueous sodium ions havebeen added at Steps 2 and 4.
4. ■ Solution 1: a colourless solution that produces a yellowflame and does not produce a precipitate when eitherHCl(aq) or NaOH(aq) is added.
■ Solution 2: a blue solution that produces a blue-greenflame and does not produce a precipitate when HCl(aq)is added, but does produce a precipitate whenNaOH(aq) is added.
■ Solution 3: a colourless solution that produces a yellowflame and produces a precipitate when either HCl(aq)or NaOH(aq) is added.
■ Solution 4: a blue solution that produces a blue-greenflame, a precipitate when HCl(aq) is added, and aprecipitate when NaOH(aq) is added.
Assessment Options■ Collect and assess students’ answers to the Analysis
questions.
Answers to Questions for ComprehensionStudent Textbook page 268
Q1. (a) dichromate ion
(b) copper(II) ion
(c) sodium ion
Q2. (a) SO42–(aq), OH–(aq), PO4
3–(aq), SO32–(aq), or
CO32–(aq).
(b) CH3COO–(aq), Cl– (aq), Br– (aq), or I– (aq) willprecipitate aqueous silver ions, but not aqueouscalcium ions.
(c) Flame colour: the solution containing calcium ionswill produce a red flame, while the solution containingsilver ions will not.
Investigation 7.A: Qualitative AnalysisStudent Textbook pages 268–269
PurposeStudents will use their knowledge of chemical reactions andthe general solubility guidelines to identify ions in solution.Qualitative analysis techniques such as selective precipitationand flame colour, in conjunction with solution colour, will beused to identify the ions.
Outcomes■ 20–D1.1k ■ IP–NS2■ 20–D1.4k ■ IP C6–4.2
When to Begin What to Do
1 day before ■ Photocopy BLM 7.1.6(HAND) Thought Lab 7.1:Identifying UnknownAqueous Solutions
4-20 MHR • Unit 4 Quantitative Relationships in Chemical Changes
Advance Preparation
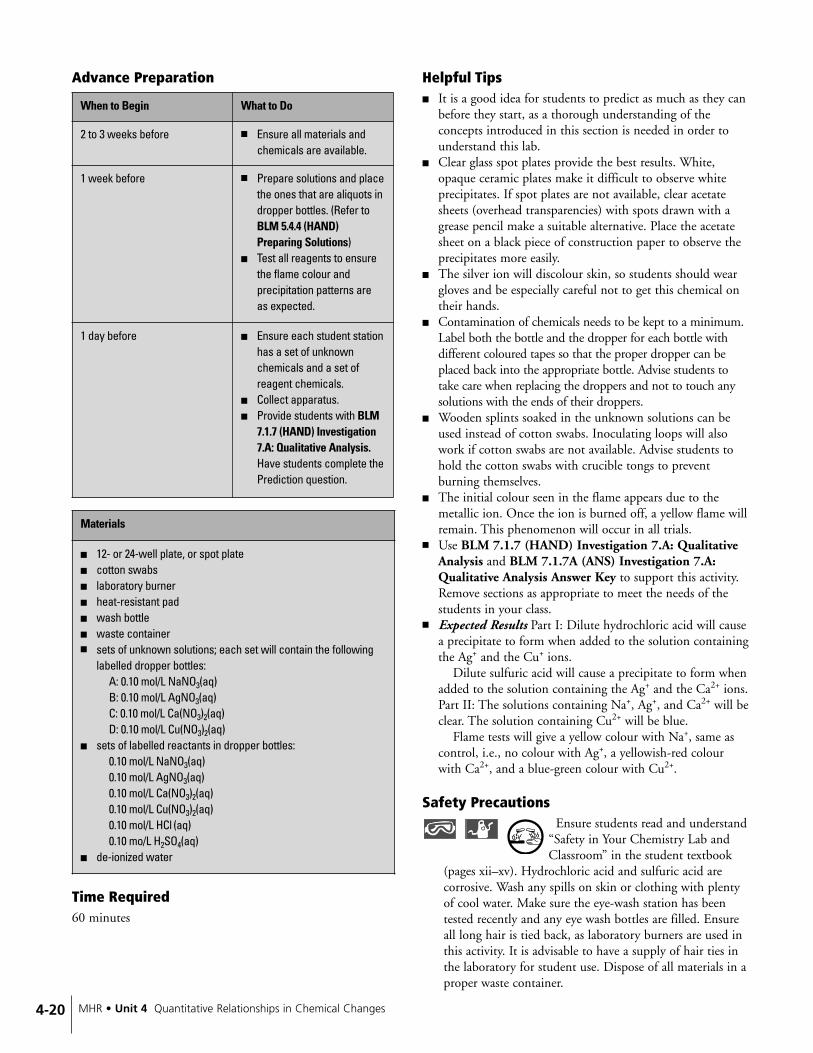
Time Required60 minutes
Helpful Tips■ It is a good idea for students to predict as much as they can
before they start, as a thorough understanding of theconcepts introduced in this section is needed in order tounderstand this lab.
■ Clear glass spot plates provide the best results. White,opaque ceramic plates make it difficult to observe whiteprecipitates. If spot plates are not available, clear acetatesheets (overhead transparencies) with spots drawn with agrease pencil make a suitable alternative. Place the acetatesheet on a black piece of construction paper to observe theprecipitates more easily.
■ The silver ion will discolour skin, so students should weargloves and be especially careful not to get this chemical ontheir hands.
■ Contamination of chemicals needs to be kept to a minimum.Label both the bottle and the dropper for each bottle withdifferent coloured tapes so that the proper dropper can beplaced back into the appropriate bottle. Advise students totake care when replacing the droppers and not to touch anysolutions with the ends of their droppers.
■ Wooden splints soaked in the unknown solutions can beused instead of cotton swabs. Inoculating loops will alsowork if cotton swabs are not available. Advise students tohold the cotton swabs with crucible tongs to preventburning themselves.
■ The initial colour seen in the flame appears due to themetallic ion. Once the ion is burned off, a yellow flame willremain. This phenomenon will occur in all trials.
■ Use BLM 7.1.7 (HAND) Investigation 7.A: QualitativeAnalysis and BLM 7.1.7A (ANS) Investigation 7.A:Qualitative Analysis Answer Key to support this activity.Remove sections as appropriate to meet the needs of thestudents in your class.
■ Expected Results Part I: Dilute hydrochloric acid will causea precipitate to form when added to the solution containingthe Ag+ and the Cu+ ions.
Dilute sulfuric acid will cause a precipitate to form whenadded to the solution containing the Ag+ and the Ca2+ ions.Part II: The solutions containing Na+, Ag+, and Ca2+ will beclear. The solution containing Cu2+ will be blue.
Flame tests will give a yellow colour with Na+, same ascontrol, i.e., no colour with Ag+, a yellowish-red colourwith Ca2+, and a blue-green colour with Cu2+.
Safety PrecautionsEnsure students read and understand
“Safety in Your Chemistry Lab andClassroom” in the student textbook
(pages xii–xv). Hydrochloric acid and sulfuric acid arecorrosive. Wash any spills on skin or clothing with plentyof cool water. Make sure the eye-wash station has beentested recently and any eye wash bottles are filled. Ensureall long hair is tied back, as laboratory burners are used inthis activity. It is advisable to have a supply of hair ties inthe laboratory for student use. Dispose of all materials in aproper waste container.
Materials
■ 12- or 24-well plate, or spot plate■ cotton swabs■ laboratory burner ■ heat-resistant pad■ wash bottle ■ waste container■ sets of unknown solutions; each set will contain the following
labelled dropper bottles:A: 0.10 mol/L NaNO3(aq)B: 0.10 mol/L AgNO3(aq)C: 0.10 mol/L Ca(NO3)2(aq)D: 0.10 mol/L Cu(NO3)2(aq)
■ sets of labelled reactants in dropper bottles:0.10 mol/L NaNO3(aq)0.10 mol/L AgNO3(aq)0.10 mol/L Ca(NO3)2(aq)0.10 mol/L Cu(NO3)2(aq)0.10 mol/L HCl (aq)0.10 mo/L H2SO4(aq)
■ de-ionized water
When to Begin What to Do
2 to 3 weeks before ■ Ensure all materials andchemicals are available.
1 week before ■ Prepare solutions and placethe ones that are aliquots indropper bottles. (Refer toBLM 5.4.4 (HAND)Preparing Solutions)
■ Test all reagents to ensurethe flame colour andprecipitation patterns areas expected.
1 day before ■ Ensure each student stationhas a set of unknownchemicals and a set ofreagent chemicals.
■ Collect apparatus.■ Provide students with BLM
7.1.7 (HAND) Investigation7.A: Qualitative Analysis.Have students complete thePrediction question.

4-21Chapter 7 Stoichiometry • MHR
Answers to Analysis Questions1. (a) The Ag+(aq) will form a precipitate when hydrochloric
acid is added.
Ag+(aq) � Cl-(aq) → AgCl(s)
(b) Students should be able to predict this reaction usingtheir solubility guidelines.
2. (a) Both the Ag+(aq) and the Ca2+(aq) will form aprecipitate when the sulfuric acid is added.
2Ag+(aq) � SO42-(aq) → Ag2SO4(s)
Ca2+(aq) � SO42-(aq) → CaSO4(s)
(b) Students should be able to predict these reactionsusing their solubility guidelines.
3. Sodium, calcium and copper(II) ions will form solublechlorides. Sodium and copper(II) ions will form solublesulfates.
4. Cu2+(aq) is blue.
5. Students’ tentative identifications will depend on the letterused to label each unknown solution. Clues to use are: silverions form a precipitate with both acids; calcium ions form aprecipitate with only sulfuric acid; and copper(II) ions make ablue-coloured solution. Sodium ions will need to be confirmedby a flame test, however, because they do not form anyprecipitates and are colourless in solution.
6. The flame test should easily show the difference betweencalcium ions (which produce a red-orange colour) andsodium ions (which produce a yellow colour).
Answer to Conclusion Question7. Given the above clues, students should be able to identify each
of the cations and anions and to match them up with theappropriate letter given by the teacher. If the students havecorrectly identified the ions, they should have confidence intheir decisions and no further action will be required. If thestudents have not correctly identified the ions, they will nothave confidence in their decisions and may suggest that theyretest some of the solutions or perform the test on a freshsample of the solution if they feel it may be contaminated, orthat they would like to have other solutions to test theirunknowns (ones not provided in the investigation).
Assessment Options■ Collect and assess students’ responses to the Analysis and
Conclusion questions.■ Use Assessment Checklist 3 Performance Task Self-Assessment
to assess student participation and parts of AssessmentChecklist 5 Learning Skills to assess group interaction.
Section 7.1 Review AnswersStudent Textbook page 270
1. Spectator ions are aqueous ions that remain unchangedwhen the reaction is over. When forming ionic
compounds with other ions, spectator ions formcompounds with high solubility.
2. (a) 3Sn2+(aq) � 2PO43-(aq) → Sn3(PO4)2(s)
(b) Ni2+(aq) � CO32-(aq) → NiCO3(s)
(c) 2Cr3+(aq) � 3S2-(aq) → Cr2S3(s)
3. (a) The spectator ions are Cl-(aq) and K+(aq).
(b) The spectator ions are Cl-(aq) and Na+(aq).
(c) The spectator ions are SO42-(aq) and NH4
+(aq).
4. The precipitate that will form is copper(II) carbonate,CuCO3(s). The net ionic equation is Cu2+(aq) � CO3
2-
(aq) → CuCO3(s). The spectator ions are SO42-(aq) and
Na+(aq).
5. (a) Ba(NO3)2(aq)* � Na3PO4(aq)**
(b) Mg(NO3)2(aq)* � NaOH(aq)**
(c) Al(NO3)3(aq)* � Na2Cr2O7(aq)**
*the cation can also combine with ClO4- or ClO3
-
**the anion can combine with any group 1 ion, H+ orNH4
+
6. Qualitative analysis only determines whether or not aparticular substance is present. Quantitative analysis allowsthe determination of the amount of a particular substance.
7. No. Qualitative analysis will only provide the identity ofions present. Qualitative analysis such as solution colour,flame colour, and selective precipitation will only tell youif an ion is present or not. More complicated gravimetricprocedures (that will be described in the remaining part of this chapter, as well as in Chapter 8) are needed todetermine the amount of each ion present.
8. (a) CO2(g) � H2O(�) → H2CO3(aq)
H2CO3(aq) � Ca(OH)2(aq) →2HOH(�) � CaCO3(s)
(b) The first reaction can be classified as a formationreaction, while the second is classified as a double-replacement reaction.
(c) This is a qualitative test, as it only tells you if carbondioxide is present, not how much is present.
9. (a) Pb2+(aq), PbCl2(s)
(b) Pb2+(aq) � 2Cl-(aq) → PbCl2(s)
10. (a) Na2SO4(aq) (any group 1 sulfate)
(b) NaCl(aq), NaBr(aq), NaI(aq) (any group 1 halide)
(c) To the solution, add Na2SO4(aq) until no moreprecipitate forms.Remove the PbSO4(s) precipitate by filtration anddispose of the precipitate appropriately.
To the filtrate, add NaCl(aq) until no more precipitateforms. Remove the CuCl(s) precipitate by filtrationand dispose of the precipitate appropriately.
To the filtrate, add NaOH(aq) until no more precipitateforms. Remove the Eu(OH)3(s) precipitate by filtrationand dispose of the precipitate appropriately.
4-22 MHR • Unit 4 Quantitative Relationships in Chemical Changes
(d) To test for Pb2+(aq), add Na2SO4(aq). If a precipitateforms, lead(II) ions are present; if no precipitate forms,lead(II) ions are not present. To remove all of the lead(II)ions, continue to add Na2SO4(aq) until no moreprecipitate forms. (If a precipitate forms, filter the solutionbefore continuing to test for the presence of other ions.)
To test for the presence of Cu+(aq), observe the solutioncolour. If the solution appears blue-green, copper(I)ions are present; if the solution is colourless, copper(I)ions are not present. To remove all of the copper(I)ions, add NaCl(aq) until no more precipitate formsbefore continuing to test for europium(III) ions. (If aprecipitate forms, filter the solution before continuingto test for the presence of other ions.)
To test for Eu3+(aq), add NaOH(aq). If a precipitateforms, europium(III) ions are present; if no precipitateforms, europium(III) ions are not present.
Dispose of all wastes appropriately.
11. From left to right – purple: permanganate; orange:dichromate; green: chromium, copper(I), iron(II), ornickel(III); yellow: chromate; pink: cobalt(II) ormanganese(II). To increase confidence in predictions aboutthe composition of solutions, react them with a variety ofcations and/or anions in order to produce precipitateaccording to the solubility guidelines.
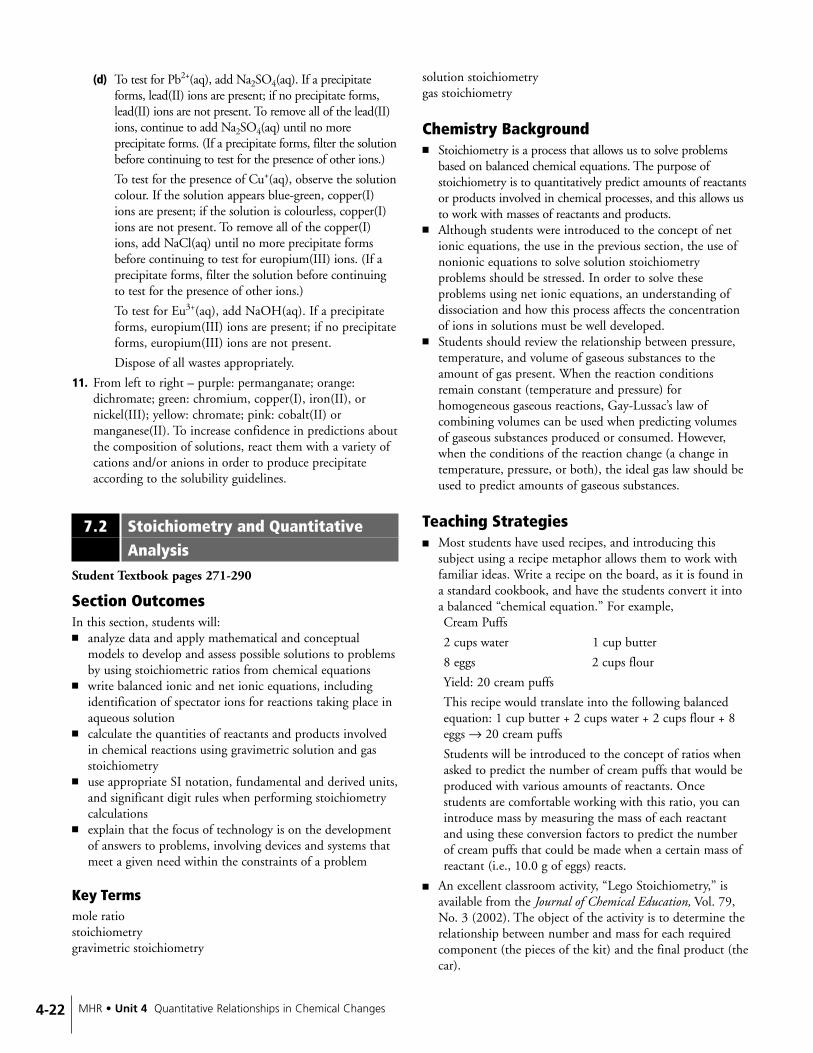
7.2 Stoichiometry and Quantitative Analysis
Student Textbook pages 271-290
Section OutcomesIn this section, students will:■ analyze data and apply mathematical and conceptual
models to develop and assess possible solutions to problemsby using stoichiometric ratios from chemical equations
■ write balanced ionic and net ionic equations, includingidentification of spectator ions for reactions taking place inaqueous solution
■ calculate the quantities of reactants and products involvedin chemical reactions using gravimetric solution and gasstoichiometry
■ use appropriate SI notation, fundamental and derived units,and significant digit rules when performing stoichiometrycalculations
■ explain that the focus of technology is on the developmentof answers to problems, involving devices and systems thatmeet a given need within the constraints of a problem
Key Termsmole ratiostoichiometrygravimetric stoichiometry
solution stoichiometrygas stoichiometry
Chemistry Background■ Stoichiometry is a process that allows us to solve problems
based on balanced chemical equations. The purpose ofstoichiometry is to quantitatively predict amounts of reactantsor products involved in chemical processes, and this allows usto work with masses of reactants and products.
■ Although students were introduced to the concept of netionic equations, the use in the previous section, the use ofnonionic equations to solve solution stoichiometryproblems should be stressed. In order to solve theseproblems using net ionic equations, an understanding ofdissociation and how this process affects the concentrationof ions in solutions must be well developed.
■ Students should review the relationship between pressure,temperature, and volume of gaseous substances to theamount of gas present. When the reaction conditionsremain constant (temperature and pressure) forhomogeneous gaseous reactions, Gay-Lussac’s law ofcombining volumes can be used when predicting volumesof gaseous substances produced or consumed. However,when the conditions of the reaction change (a change intemperature, pressure, or both), the ideal gas law should beused to predict amounts of gaseous substances.
Teaching Strategies■ Most students have used recipes, and introducing this
subject using a recipe metaphor allows them to work withfamiliar ideas. Write a recipe on the board, as it is found ina standard cookbook, and have the students convert it intoa balanced “chemical equation.” For example,Cream Puffs
2 cups water 1 cup butter
8 eggs 2 cups flour
Yield: 20 cream puffs
This recipe would translate into the following balancedequation: 1 cup butter + 2 cups water + 2 cups flour + 8eggs → 20 cream puffs
Students will be introduced to the concept of ratios whenasked to predict the number of cream puffs that would beproduced with various amounts of reactants. Oncestudents are comfortable working with this ratio, you canintroduce mass by measuring the mass of each reactantand using these conversion factors to predict the numberof cream puffs that could be made when a certain mass ofreactant (i.e., 10.0 g of eggs) reacts.
■ An excellent classroom activity, “Lego Stoichiometry,” isavailable from the Journal of Chemical Education, Vol. 79,No. 3 (2002). The object of the activity is to determine therelationship between number and mass for each requiredcomponent (the pieces of the kit) and the final product (thecar).
4-23Chapter 7 Stoichiometry • MHR
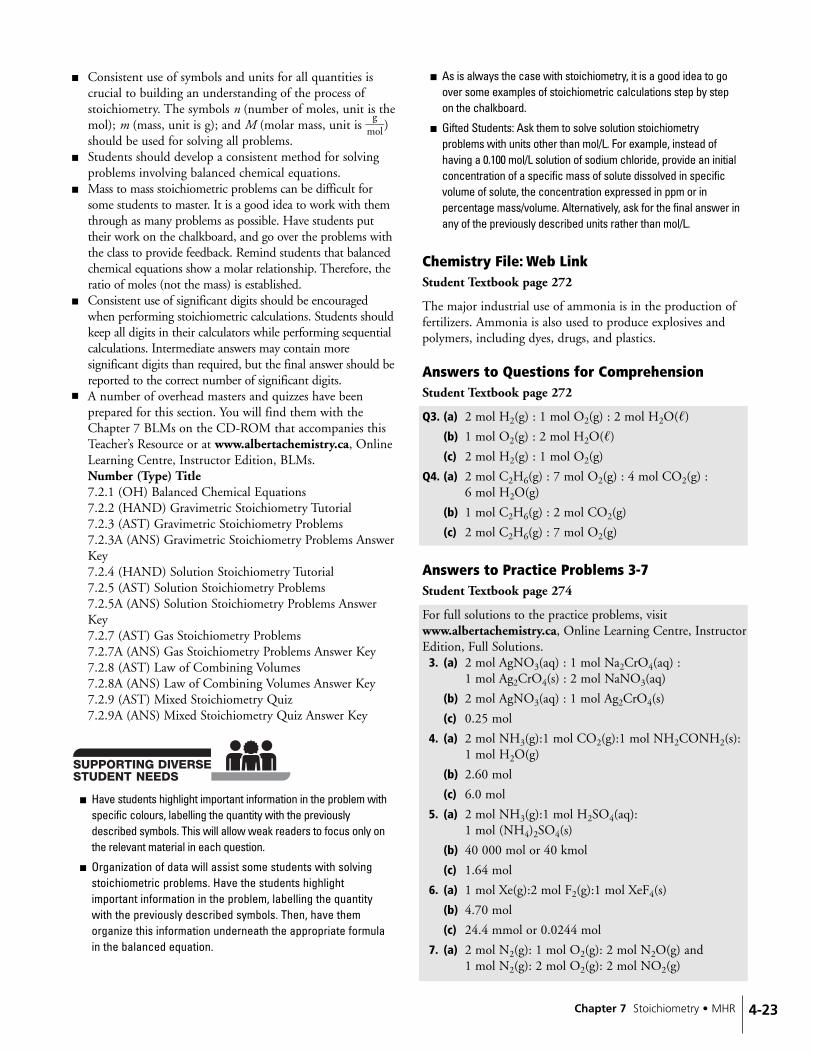
■ Consistent use of symbols and units for all quantities iscrucial to building an understanding of the process ofstoichiometry. The symbols n (number of moles, unit is themol); m (mass, unit is g); and M (molar mass, unit is �m
gol�)
should be used for solving all problems.■ Students should develop a consistent method for solving
problems involving balanced chemical equations. ■ Mass to mass stoichiometric problems can be difficult for
some students to master. It is a good idea to work with themthrough as many problems as possible. Have students puttheir work on the chalkboard, and go over the problems withthe class to provide feedback. Remind students that balancedchemical equations show a molar relationship. Therefore, theratio of moles (not the mass) is established.
■ Consistent use of significant digits should be encouragedwhen performing stoichiometric calculations. Students shouldkeep all digits in their calculators while performing sequentialcalculations. Intermediate answers may contain moresignificant digits than required, but the final answer should bereported to the correct number of significant digits.
■ A number of overhead masters and quizzes have beenprepared for this section. You will find them with theChapter 7 BLMs on the CD-ROM that accompanies thisTeacher’s Resource or at www.albertachemistry.ca, OnlineLearning Centre, Instructor Edition, BLMs.Number (Type) Title7.2.1 (OH) Balanced Chemical Equations7.2.2 (HAND) Gravimetric Stoichiometry Tutorial7.2.3 (AST) Gravimetric Stoichiometry Problems7.2.3A (ANS) Gravimetric Stoichiometry Problems AnswerKey7.2.4 (HAND) Solution Stoichiometry Tutorial7.2.5 (AST) Solution Stoichiometry Problems7.2.5A (ANS) Solution Stoichiometry Problems AnswerKey7.2.7 (AST) Gas Stoichiometry Problems7.2.7A (ANS) Gas Stoichiometry Problems Answer Key7.2.8 (AST) Law of Combining Volumes7.2.8A (ANS) Law of Combining Volumes Answer Key7.2.9 (AST) Mixed Stoichiometry Quiz7.2.9A (ANS) Mixed Stoichiometry Quiz Answer Key
■ Have students highlight important information in the problem withspecific colours, labelling the quantity with the previouslydescribed symbols. This will allow weak readers to focus only onthe relevant material in each question.
■ Organization of data will assist some students with solvingstoichiometric problems. Have the students highlightimportant information in the problem, labelling the quantitywith the previously described symbols. Then, have themorganize this information underneath the appropriate formulain the balanced equation.
■ As is always the case with stoichiometry, it is a good idea to goover some examples of stoichiometric calculations step by stepon the chalkboard.
■ Gifted Students: Ask them to solve solution stoichiometryproblems with units other than mol/L. For example, instead ofhaving a 0.100 mol/L solution of sodium chloride, provide an initialconcentration of a specific mass of solute dissolved in specificvolume of solute, the concentration expressed in ppm or inpercentage mass/volume. Alternatively, ask for the final answer inany of the previously described units rather than mol/L.
Chemistry File: Web LinkStudent Textbook page 272
The major industrial use of ammonia is in the production offertilizers. Ammonia is also used to produce explosives andpolymers, including dyes, drugs, and plastics.
Answers to Questions for ComprehensionStudent Textbook page 272
Q3. (a) 2 mol H2(g) : 1 mol O2(g) : 2 mol H2O(�)
(b) 1 mol O2(g) : 2 mol H2O(�)
(c) 2 mol H2(g) : 1 mol O2(g)
Q4. (a) 2 mol C2H6(g) : 7 mol O2(g) : 4 mol CO2(g) : 6 mol H2O(g)
(b) 1 mol C2H6(g) : 2 mol CO2(g)
(c) 2 mol C2H6(g) : 7 mol O2(g)
Answers to Practice Problems 3-7Student Textbook page 274
For full solutions to the practice problems, visitwww.albertachemistry.ca, Online Learning Centre, InstructorEdition, Full Solutions.
3. (a) 2 mol AgNO3(aq) : 1 mol Na2CrO4(aq) : 1 mol Ag2CrO4(s) : 2 mol NaNO3(aq)
(b) 2 mol AgNO3(aq) : 1 mol Ag2CrO4(s)
(c) 0.25 mol
4. (a) 2 mol NH3(g):1 mol CO2(g):1 mol NH2CONH2(s):1 mol H2O(g)
(b) 2.60 mol
(c) 6.0 mol
5. (a) 2 mol NH3(g):1 mol H2SO4(aq):1 mol (NH4)2SO4(s)
(b) 40 000 mol or 40 kmol
(c) 1.64 mol
6. (a) 1 mol Xe(g):2 mol F2(g):1 mol XeF4(s)
(b) 4.70 mol
(c) 24.4 mmol or 0.0244 mol
7. (a) 2 mol N2(g): 1 mol O2(g): 2 mol N2O(g) and 1 mol N2(g): 2 mol O2(g): 2 mol NO2(g)

4-24 MHR • Unit 4 Quantitative Relationships in Chemical Changes
(b) 0.0468 mol
(c) 187 mmol or 0.187 mol
Answers to Questions for ComprehensionStudent Textbook page 275
Q5. The equation used is n � �Mm
�, where n is the number ofmoles of reactant or product, m is the mass and M is themolar mass.
Q6. 0.72 g CuO(s) is produced
Complete SolutionUsing equations:n � 0.0090 mol CuO(s)M � 79.55 g/mol CuO(s)m � ?
n � �Mm
�
m � nM
� (0.0090 mol CuO(s))(79.55 �mgol� CuO(s))
� 0.72 g CuO(s)
Using dimensional analysis:
mCuO(s) � 0.0090 mol CuO(s) × �mo7l9C.5
u5Og(s)
�
� 0.72 g CuO(s)
Answers to Practice Problems 8-15Student Textbook page 278
For full solutions to the practice problems, visitwww.albertachemistry.ca, Online Learning Centre,Instructor Edition, Full Solutions.
8. 1.3 × 10⁵ g
9. 5.84 × 10⁵ g or 5.84 × 10² kg
10. (a) Cu(s) + 2AgNO3(aq) → 2Ag(s) + Cu(NO3)2(aq)(b) 3.39 g
11. 112 g
12. 8.06 g
13. 20.1 g
14. 40.3 g
15. 417 g
Connections (Science and Technology):Waste Water Treatment
Student Textbook page 279
Teaching Strategies■ Have students research the methods used to remove
phosphate and nitrogen from waste water in their area.■ Use question 4 to stimulate a class discussion. Create an
overhead chart and ask students to list possible benefits
and drawbacks of the two different waste water treatmentmethods.
Answers to Questions1. FeCl3(aq) � PO4
3–(aq) → FePO4(s) � 3Cl–(aq)
2. Al2(SO4)3•14H2O(s) � 2PO43–(aq) →
2AlPO4(s) � 3SO42–(aq) � 14H2O(l )
m � ? g m � 2 mg
M � 594.45 g/mol M � 94.97 g/mol
malum � 2 mg PO43- × �9
14.
m97
olgPPOO
4
4
3
3
-
-� × �21
mm
oollPaOlum
43-�
× �59
14m.4
o5lgal
aulmum
�
� 6 mg
3. The sludge contains bacteria (and other forms of micro-organisms) from human waste, some of which may bepathogenic. The sludge can be used for grain crops, as thegrain is processed prior to human consumption. Vegetablescan be eaten raw (unprocessed or only slightly processed)and if contaminated with pathogenic bacteria, can causedisease. Washing the vegetables would not be sufficient toremove all contaminants.
4. Sample of possible answer:
(a) Benefits: produces ammonia that can be used forfertilizer production; removal of the substancesprevents eutrophification.
Drawbacks: produces a precipitate that must beremoved and disposed of, adding chemicals to thewater that may be harmful (aluminium ions havebeen linked to Alzheimer’s disease).
(b) Benefits: removal prevents eutrophification; noaddition of harmful chemicals to the environment;produces a fertilizer that can be used in crops;produces nitrogen gas; a naturally occurring substance.
Drawbacks: harmful organisms can be introduced intocrops in the field (and ultimately the water table).
Chemistry File: Web LinkStudent Textbook page 280
The chemical reaction that occurs when alcohol reacts with anacidic aqueous solution of potassium dichromate is:2K2Cr2O7 + 3CH3CH2OH + H2SO4 →
2Cr2(SO4)3 + 2K2SO4 + 3CH3COOH + 11H2O The legal limit for driving in Alberta is a blood alcoholconcentration of 0.08 g/100 mL of blood.
Answer to Question for ComprehensionStudent Textbook page 280
Q7. 0.03 mol NaCl(aq)
Complete Solutionn NaCl(aq) = c NaCl(aq) × VNaCl(aq)

4-25Chapter 7 Stoichiometry • MHR
= �1 mol N
LaCl(aq)� × 0.025 L
= 0.3 mol NaCl(aq)
Answers to Practice Problems 16-19Student Textbook page 282
For full solutions to the practice problems, visitwww.albertachemistry.ca, Online Learning Centre,Instructor Edition, Full Solutions.16. 18 mL
17. 12.9 mL
18. (a) Pb(NO3)2(aq) + 2NaI(aq) → PbI2(s) + 2NaNO3(aq)
(b) 40.0 mL
(c) 1.15 g
19. (a) 0.33 L
(b) 0.13 L
(c) 0.46 L
Investigation 7.B: Determining the Concentration of a Solution
Student Textbook page 282-283
PurposeStudents determine the concentration of a solution based on aprecipitation reaction.
Outcomes■ 20-D2.1s■ 20-D2.3s
Time Required■ 60 minutes to carry out procedure
Helpful Tips■ Ensure students are confident with the concepts involved
in solution stoichiometry before beginning thisinvestigation.
■ Use BLM 7.2.6 (HAND) Investigation 7.B:Determining the Concentration of a Solution and BLM7.2.6A (ANS) Investigation 7.B: Determining theConcentration of a Solution Answer Key to support thisactivity. Remove sections as appropriate to meet the needsof the students in your class.
■ Expected Results A small amount of the magnesiumnitrate will be soluble and therefore lost in the solution.Some of the magnesium nitrate will be lost in the transferprocess. The calculated concentration will be less than theactual concentration.
Safety Precautions
■ Ensure students read and understand “Safety in YourChemistry Laboratory and Classroom” in the studenttextbook.
■ Dispose of all material in a proper waste container.■ Flush skin with plenty of water if it comes in contact
solutions.
Answers to Analysis Questions1. Students’ responses should show all calculations clearly.
(a) Suppose students were given a volume of 50.0 mL of0.150 mol/L Mg(NO3)2(aq), and decide to usesodium phosphate, Na3PO4(aq), to precipitate themagnesium from solution. The equation is:
Materials
■ 150 mL beaker■ 50 mL volumetric pipette■ 250 mL Erlenmeyer flask■ funnel■ retort stand■ wash bottle■ drying oven (if available)■ stirring rod■ ring clamp or funnel rack■ filter paper■ electronic balance■ large watch glass■ 0.150 mol/L Mg(NO3)2(aq) or Ca(NO3)2(aq) (concentration
unknown to student)■ 0.200 mol/ L Na3PO4(aq)■ deionized water
When to Begin What to Do
2 to 3 weeks before ■ Ensure all materials andchemicals are available.
1 week before ■ Prepare solutions. (Refer toBLM 5.4.4 (HAND)Preparing Solutions)
■ Test all reagents to ensurethe reaction takes place asexpected.
1 day before ■ Collect materials.■ Photocopy BLM 7.2.6
(HAND) Investigation 7.B:Determining theConcentration of a Solution.

4-26 MHR • Unit 4 Quantitative Relationships in Chemical Changes
3Mg(NO3)2(aq) � 2Na3PO4(aq) → Mg3(PO4)2(s) �6NaNO3(aq)
If a student obtains 0.62 g of Mg3(PO4)2(s) byfiltration. The calculation is as follows:
m � 0.62 g Mg3(PO4)2(s) ×
× ×
� 1.0 g Mg(NO3)2(aq)
This represents the mass of solute dissolved in 50.0 mL of the original solution.
(b) Continuing with the same data as above, the mass ofsolute per 100 mL of solution is 2 × 1.0 g � 2.0 g.
(c) Using the same data as above, student shouldcalculate the molar concentration in the followingway:
c � 0.62 g Mg3(PO4)2(s) ×
× × �10
5000.0
mmLL/L
�
� 0.14 mol/L Mg(NO3)2(aq)
If the expected concentration is 0.150 mol/L this is areasonable result considering that some of themagnesium phosphate will remain dissolved in solution.
2. Errors could include:
■ The solubility of expected precipitate is close to the 0.1 mol/L limit and less precipitate is obtained thanexpected, because the combined volume of the filtrateand washings dissolved precipitate significantly. This isespecially true for the CaSO4(s) which has the highestKsp of the salts suggested—students need to considerthis qualitatively, not quantitatively.
■ The sample is insufficiently dry and the mass obtainedexceeds what should be expected, resulting in a higherthan expected concentration for the original solutionconcentration.
■ Milky filtrate or damaged filter paper could give a lowresult.
■ Not adding sufficient reactant to produce maximumprecipitate would give a low result.
3. Improvements could include drying for a longer period oftime, refiltering the filtrate if it is milky, using a smaller-pore filter paper, or adding more reactant to ensuremaximum precipitation.
4. A milky filtrate is an example of evidence that not all of theprecipitate was collected on the filter paper. Students couldsuggest that a different reactant could have been used, thata different filter paper could have been used, or that thesolution could have been cooled to reduce solubility.
Answer to Conclusion Question5. Students should report their data with the appropriate
number of significant digits. Using the data in the answerto Analysis question 1, the concentration of the solutionis 0.14 mol/L Mg(NO3)2(aq).
Assessment OptionsWhen assessing procedures, note that a sound procedureshould include or demonstrate:■ between 5 and 10 steps■ steps that are sufficient to obtain the kind of
data/information needed to answer the problem■ good control of variables■ clean materials■ knowledge of what to observe (how do you know the
reaction is complete?)■ suitable sample size (e.g., 50 mL)■ thorough drying of the sample■ clean-up/disposal considerations
A good example would be:1. Set up the filtration apparatus as demonstrated by your
teacher. Rinse the funnel with deionized water.
2. Fold a suitable-sized filter paper in preparation for theprocedure before measuring and recording its mass.
3. Use a clean 100 mL measuring cylinder (or volumetricpipette) to obtain 50 mL of the aqueous solution of theMg(NO3)2(aq) and deliver it to a clean 100 mL beaker.
4. Add Na3PO4(aq) to the solution in the beaker until notrace of additional precipitate formation is evident whenthe solution is added in small amounts.
5. Filter the mixture through filter paper, record theprecipitate colour, and wash the precipitate with smallamounts of deionized water.
6. When the filtration/washing step is complete, remove thefilter paper with its precipitate and place it on a watchglass.
7. Leave the sample to dry (one hour in an oven at 70 °C, orovernight on the countertop).
8. Clean up your laboratory station and dispose of all wasteas instructed by your teacher.
9. Measure and record the mass of the filter paper andprecipitate and dispose of the waste as instructed by yourteacher.
■ Students are prone to neglect cleaning materials, volumemeasurements, colour recordings, mass recordings, anddisposal requirements.
■ Use Assessment Checklist 3 for self evaluation by eachstudent. (This rubric could be given to each student beforethey design their experiment.)
■ Use Assessment Checklist 2 to assess each students’laboratory reports.
3 mol Mg(NO3)2(aq)���1 mol Mg3(PO4)2(s)
1 mol Mg3(PO4)2(s)���262.87 g Mg3(PO4)2(s)
148.31 g Mg(NO3)2(aq)���
1 mol Mg(NO3)2(aq)3 mol Mg(NO3)2(aq)���1 mol Mg3(PO4)2(s)
1 mol Mg3(PO4)2(s)���262.87 g Mg3(PO4)2(s)

4-27Chapter 7 Stoichiometry • MHR
Answers to Question for ComprehensionStudent Textbook page 285
Q8. (a) 2 mol O2(g):1 mol N2O4(g)
(b) 2 L O2(g):1 L N2O4(g)
(c) If 1 L of N2O4(g) is produced, then 2 L of O2(g)would have been consumed if temperature andpressure remain constant.
(d) 2 L of oxygen will be consumed.
Answers to Practice Problems 20-23Student Textbook page 286
For full solutions to the practice problems, visitwww.albertachemistry.ca, Online Learning Centre,Instructor Edition, Full Solutions.20. (a) 1 mol O2(g): 2 mol H2O(g)
(b) 1 mol H2(g): 1 mol H2O(g)
(c) 20 L
21. 24.0 L
22. 30 L
23. (a) 2A(g) + B(g) → C(g)
(b) A4B2(g)
Answer to Question for ComprehensionStudent Textbook page 286
Q9. 74 L
Complete SolutionP � 100 kPan � 3.0 mol H2(g)T � 25ºC = 298.15 KV � ?
PV � nRT
V � �nR
PT
�
�
= 74 L
Answers to Practice Problems 24-27Student Textbook page 287
For full solutions to the practice problems, visitwww.albertachemistry.ca, Online Learning Centre,Instructor Edition, Full Solutions.24. (a) 67 L
(b) 0.016 mol
(c) 4.8 × 10⁻⁴ mol
25. 0.787 L
26. 5.7 × 10⁶ L
27. 2.73 × 10⁻³ g
Investigation 7.C: Analyzing Industrial Processes
Student Textbook page 288
PurposeStudents will investigate an industrial process used by anAlberta industry. The purpose of this exercise is to describehow industries apply principles of stoichiometry to minimizewaste and maximize yield, and to assess the significance of by-products from industrial applications of chemical reactions.
Outcomes■ 20–D2.1sts■ 20–D2.2sts■ 20–D2.4sts■ 20–D1.4s ■ ICT P4-4.3
Advance Preparation
When to Begin What to Do
2 to 3 months before ■ Search the Internet for linksto the industries listed in thetext. Contact the companiesand ask them to provideprint information regardingtheir company. You maywant to contactenvironmental protectionagencies and ask them foradditional materials as well.
■ Book the computer lab (ifnecessary).
2 to 3 days before ■ Provide BLM 7.2.10 (HAND)Investigation 7.C: AnalyzingIndustrial Processes toeach student.
■ Develop an assessmentrubric with the class usingAssessment Checklist 7.
1 day before ■ Divide the class into groupsand have each group selectan industry. Each groupshould have time to go overthe assignment and dividethe work appropriately.
(3.0 mol H2(g))��8.3m14
olL••KkPa
��(298.15 K)�����
100 kPa

4-28 MHR • Unit 4 Quantitative Relationships in Chemical Changes
Criterion Level 4 Level 3 Level 2 Level 1 Insufficient
Details of process
■ Clear, detaileddescription of thechemical processincluding allreactants andproducts involvedis included.
■ Clearly labelledflowchart of theprocess is present.
■ All chemicalequations arepresent, arebalanced, and usescientificconventions.
■ Description ofprocess is complete,but lacks detailssuch as temperature.Some reactants orproducts may bemissing.
■ Flowchart is labelledbut may containminor errors oromissions.
■ Chemical equationsare balanced but donot use scientificconventions.
■ Description of theprocess isincomplete, somereactants orproducts are missing.
■ Flowchart is partiallylabelled andcontains majorerrors or omissions,such as missingproducts.
■ Chemical equationsare not balancedand do not usescientificconventions.
■ Description ofprocess isincomplete, no clearfinished product isevident, or thestudent is unsure ofstarting materials.
■ Flowchart is minimal,major steps areomitted, products orreactants are notevident.
■ Chemical equationsare not balanced andchemical formulasused are incorrect.
■ No process isevident.
■ Flowchart isincomprehensible.
■ No evidence of abalanced chemicalequation is present.
An example of a worked criterion:
Time Required120 minutes (over two periods) for computer work
Helpful Tips■ Make sure adequate resources are available. Students find it
frustrating to search for materials when none are available.Also, if students find alternative industries to study,encourage them to develop these potential resources.
■ Instead of a report, students could prepare a computerslide presentation (if the appropriate technology isavailable). Have students point out similarities between the
different industrial processes. These presentations could beshown at the beginning of classes (perhaps 2 or 3 per day).
■ Developing an assessment rubric with your class will helpstudents become more thoughtful judges of their own work.
■ Suggested criteria for grading include:■ Does the student explain how the process maximizes
yield?■ Does the student explain how the process minimizes waste?■ Does the student explain how the process minimizes
environmental impact?■ Is the process described from raw materials to finished
product?■ Are all relevant chemical equations included, along with
details of reaction conditions?■ Are the by-products identified and their uses described?■ Is a list of references included?■ Does the author state an opinion about the process and
does he or she support this opinion with scientific facts?■ Does the author include a plan for improvement of the
process and does he or she support this plan withspecific examples?
Materials
■ computers with Internet access■ industry pamphlets (if available)■ environmental pamphlets (if available)■ Newspapers (if available)■ BLM 7.2.10 (HAND) Investigation 7.C: Analyzing Industrial
Processes■ paper and pencil
■ If you have it in your school library, the followingresource is extremely useful for finding details ofstandard industrial chemical processes: Austin, G.T., Shreve's Chemical Process Industries, 5thedition, McGraw-Hill, New York, 1984.
■ Use BLM 7.2.10 (HAND) Investigation 7.C: AnalyzingIndustrial Processes and BLM 7.2.10A (ANS)Investigation 7.C: Analyzing Industrial ProcessesAnswer Key to support this activity. Remove sections asappropriate to meet the needs of the students in your class.
Assessment Options■ Assessment Checklists 3, 4, and/or 7.
Section 7.2 Review AnswersStudent Textbook page 289
1. Qualitative analysis only determines whether or not aparticular substance is present. Quantitative analysis allowsthe determination of the amount of a particular substance.
2. 2KOH(aq) � Cu(NO3)2(aq) →Cu(OH)2(s) � 2KNO3(aq)
m � 3.66 g m � ? g
M � 56.11 g/mol M � 97.57 g/mol

4-29Chapter 7 Stoichiometry • MHR
m Cu(OH)2 � 3.66 g KOH × �516.
m11
olgKKOOHH
�
× �1
2m
mol
oCluK(OO
HH)2
� �917.
m57
olgCCuu(O(O
HH)2
)2�
� 3.18 g
3. CH4(g) � 2O2(g) → CO2(g) � 2H2O(g)
m � 1.00 kg m � ? kg
m �? kg M � 16.05 g/mol
M � 44.01 g/mol M � 18.02 g/mol
mCO2 � 1.00 kg CH4 × �116.
m05
olgCCHH
4
4� × �
11
mm
ooll
CC
HO2
4�
× �414.
m01
olgCCOO
2
2�
� 2.74 kg
mH2O � 1.00 kg CH4 × �116.
m05
olgCCHH
4
4� × �
21
mm
oollHCH
2O
4�
× �118.
m02
olgHH
2
2
OO
�
� 2.25 kg
4. Fe2O3(s) � 2Al(s) → Al2O3(s) � 2Fe(�)
m � 28 kg m � ? g
M � 159.70 g/mol M � 55.85 g/mol
mAl � 28 kg Fe2O3 × �1519m.7
o0lgFe
F2
eO
2O3
3� × �1
2m
mol
oFleA
2Ol
3�
× �917.
m57
olgAAll
�
� 20 kg
5. 2NaHCO3(s) → Na2CO3(s) � CO2(g) � H2O(g)
m � 16.8 g m � ? g
M � 84.01 g/mol M � 105.99 g/mol
mNa2CO3 � 16.8 g NaHCO3 �81
4.
m
01
ol
g
N
N
a
a
H
H
C
C
O
O3
3�
× �21
mm
oollNN
aaH2C
COO
3
3� �
1015m.9
o9lgN
Na2
aC2CO
O
3
3�
� 10.6 g
6. Zn(s) � 2AgNO3(aq) → 2Ag(s) � Zn(NO3)2(aq)
m � 1.6 g m � ? g
M � 65.39 g/mol M � 169.88 g/mol
mAg NO3 � 1.6 g Zn × �615.
m41
olgZZnn
� × �2 m1
omloAlgZNnO3�
× �1169
m.8o8l A
ggANgNO
O
3�
� 8.3 g AgNO3
7. To the solution that contains Pb(NO3)2(aq), add NaI(aq)until no more precipitate forms. Weigh a piece of filter
paper, remove the PbI2(s) by filtration, and allow theprecipitate and filter paper to dry overnight. Determinethe mass of the filter paper and precipitate, and thensubtract the mass of the filter paper to obtain the mass ofthe precipitate. Use stoichiometry to determine the massof the Pb(NO3)2(aq) in the original solution.
8. There are many different types of spreadsheets studentscan prepare. Have students e-mail their spreadsheet to youso you can assess each design individually. Have somestudents present their spreadsheet designs to the class.
9. Ba(NO3)2(aq) � Na2CO3(aq) →BaCO3(s) � 2NaNO3(aq)
V � 60.0 mL m � ? g
c � 0.100 mol/L M � 105.99 g/mol
m Na2CO3 � 0.0600 L × ×
�11mm
oollBNa(aN2C
OO
3)3
2� �
1015m.9
o9lgN
Na2
aC2CO
O
3
3�
� 636 mg or 0.636 g Na2CO3
10. MgCO3(s) � 2HCl(aq) →MgCl2(aq) � H2O(�) � CO2(g)
m � 1.62 g V � ? L
M � 84.32 g/mol c � 0.383 mol/L
V HCl � 1.62 g MgCO3 × �814.
m32
olgMM
ggCCOO
3
3� ×
�1
2m
mol
oMl H
gCC
Ol
3� × �0.383
1m
Lol HCl�
� 0.100 L
11. 2Na2S2O3(aq) � Cl2(aq) → 2NaCl(aq) � Na2S4O6(aq)
V � ? L V � 54 L
c � 0.170 mol/L c � 2.8 × 10⁻⁵ mol/L
V Na2S2O3 � 54 L ×�2.8 × 10
1
–5
Lmol Cl2�
× �2 m
1oml N
olaC2S
l2
2
O3� ×
� 18 mL or 0.018 L
12. Na2SO4(aq) � Pb(NO3)2(aq) → PbSO4(s) � 2NaNO3(aq)
V � ? L V � 100 mL
c � 0.150 mol/L c � 0.100 mol/L
V Na2SO4 � 100 mL × ×
�11mmoollPNb(
aN2S
OO
3
4
)2� �
0.150 m1
omlLNa2SO4�
� 66.7 mL or 0.0667 L
13. Sr(OH)2(aq) � 2CH3COOH(aq) → Sr(CH3COO)2(aq) � 2 H2O(l )
V � ? L V � 5.00 mL
0.100 mol Pb(NO3)2���1 mL
1 L���0.170 mol Na2S2O3
0.100 mol Ba(NO3)2���
L

4-30 MHR • Unit 4 Quantitative Relationships in Chemical Changes
c � 0.100 mol/L c � 0.833 mol/L
V Sr(OH)2 � 5.00 mL × ×
�2
1m
mol
oClHSr
3
(CO
OH
O)2
H� �0.150 m
1ol
LSr(OH)2�
� 20.8 mL
14. 3NO2(g) � H2O(�) → 2HNO3(aq) � NO(g)
n � 2.31 x 10⁴ mol V � ? L
c � 15.4 mol/L
V HNO3 � 2.31 × 10⁴ mol NO2 × �23mmoollHNNOO
2
3� ×
�15.4 m
1ol
LHNO3�
� 1.00 × 10³ L
15. C2H5OH(aq) � O2(g) → CH3COOH(aq) � H2O(�)
m � 6.00 g V � 1.00L
M � 46.08 g/mol c � ? mol/L
c CH3COOH � 6.00 g C2H5OH �416.
m08
olgCC
2
2
HH
5
5
OOHH
�
�1
1m
mol
oCl C
H
2
3
HC
5
OO
OH
H� × �
1.010 L�
� 0.130 mol/L
16. H2(g) � Cl2(g) → 2HCl(g)
V � 2.00 L V � ? L
V HCl � 2.00 L H2 × �21LL
HH
C
2
l� � 4.00 L HCl
17. v Total � 4.00 mol C3H5(NO3)2 �4 mo2l9Cm
3Hol
5(gNas
O3)2�
× �1
2m4o.8l g
Las
�
� 719 L
18. 2NI3(s) → N2(g) � 3I2(g)
m � 395 mg V � ? L V � ? L
M � 394.71 g/mol
V N2 � 395 mg NI3 × �39
14m.7
o1lgN
NI3
I3� × �
21
mm
oollNN
I2
3�
× �1
2m2o.4l N
L
2�
� 10.1 mL
V I2 � 395 mg NI3 × �39
14m.7
o1lgN
NI3
I3� × �
23mmoollNI2
I3�
× �12m2.
o4lLI2
�
� 44.8 mL
19. MnO2(s) � 4HCl(aq) →MnCl2(aq) � 2H2O(�) � Cl2(g)
m � 0.250 g V � 100 mL V � ? L
M � 86.94 g/mol c � 0.104 mol/L
If the MnO2 is limiting
m Cl2 � 0.250 g MnO2 × �816.
m94
olgMM
nnOO
2
2�
× �11m
mol
oMl C
nlO2
2� × �
12m4o.8l C
Ll2
�
� 0.0713 L
If the HCl is limiting
m Cl2 � 0.100 L × �0.104
1m
Lol HCl� × �
41
mm
oollHC
Cl2
l�
× �1
2m4o.8l C
Ll2
�
� 0.0645 L
Since the HCl(aq) would produce the least amount ofproduct, it is the limiting reactant and the volume of gasto be collected will be 0.0645 L.
20. 2C2H6(g) � 7O2(g) → 4CO2(g) � 6H2O(�)
If the C2H6 is limiting
V CO2 � 2.00 L C2H6 × �24
LL
CC
2
OH
2
6� � 4.00 L
If the O2 is limiting
V CO2 � 2.00 L O2 × �47LLCOO
2
2� � 1.14 L
Since the O2(g) produces the least amount of product, itis the limiting reactant and the volume of gas to becollected will be 1.14 L.
Chapter 7 Review AnswersStudent Textbook pages 292-293
Answers to Understanding Concepts Questions1. A complete balanced equation shows all the reactants and
products as if they were intact compounds that do notdissociate in solution. An ionic equation is a moreaccurate representation of a reaction in solution, becauseit shows all the high-solubility ionic compoundsdissociated into ions. A net ionic equation shows only theactual chemical change that occurs.
2. A specific colour is emitted when thermally excitedelectrons from a heated metal ion emit energy as visiblelight as they move back down to lower energy levelswithin the ion.
3. To determine the mole ratio of two compounds in areaction, use the coefficients in the balanced chemicalequation.
4. A stoichiometric calculation would be important tochemical engineers trying to determine the masses ofliquid hydrogen, liquid oxygen, and solid fuel needed forlaunching a space shuttle.
5. Gravimetric stoichiometry calculations determine themass of one component based on the mass of anothercomponent in a reaction equation. Solution stoichiometry
0.100 mol CH3COOH���
1 L
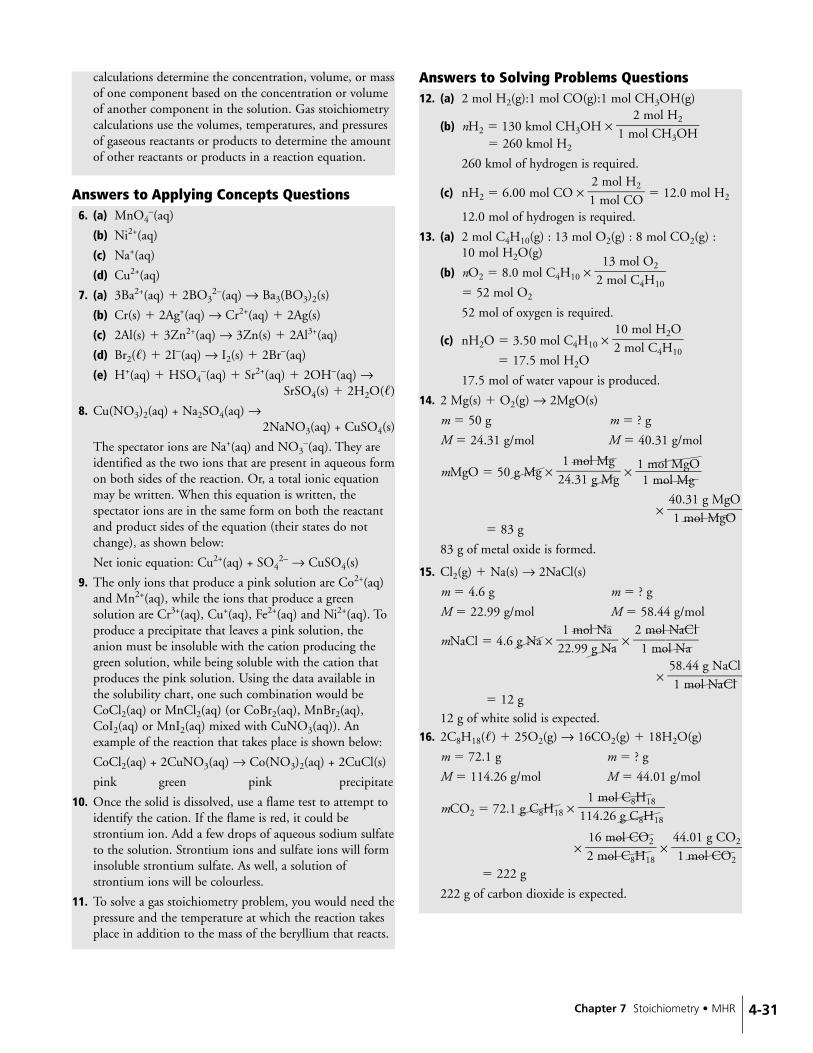
4-31Chapter 7 Stoichiometry • MHR
calculations determine the concentration, volume, or massof one component based on the concentration or volumeof another component in the solution. Gas stoichiometrycalculations use the volumes, temperatures, and pressuresof gaseous reactants or products to determine the amountof other reactants or products in a reaction equation.
Answers to Applying Concepts Questions6. (a) MnO4
–(aq)
(b) Ni2+(aq)
(c) Na+(aq)
(d) Cu2+(aq)
7. (a) 3Ba2+(aq) � 2BO32–(aq) → Ba3(BO3)2(s)
(b) Cr(s) � 2Ag+(aq) → Cr2+(aq) � 2Ag(s)
(c) 2Al(s) � 3Zn2+(aq) → 3Zn(s) � 2Al3+(aq)
(d) Br2(�) � 2I–(aq) → I2(s) � 2Br–(aq)
(e) H+(aq) � HSO4–(aq) � Sr2+(aq) � 2OH–(aq) →
SrSO4(s) � 2H2O(�)
8. Cu(NO3)2(aq) + Na2SO4(aq) →2NaNO3(aq) + CuSO4(s)
The spectator ions are Na+(aq) and NO3–(aq). They are
identified as the two ions that are present in aqueous formon both sides of the reaction. Or, a total ionic equationmay be written. When this equation is written, thespectator ions are in the same form on both the reactantand product sides of the equation (their states do notchange), as shown below:
Net ionic equation: Cu2+(aq) + SO42– → CuSO4(s)
9. The only ions that produce a pink solution are Co2+(aq)and Mn2+(aq), while the ions that produce a greensolution are Cr3+(aq), Cu+(aq), Fe2+(aq) and Ni2+(aq). Toproduce a precipitate that leaves a pink solution, theanion must be insoluble with the cation producing thegreen solution, while being soluble with the cation thatproduces the pink solution. Using the data available inthe solubility chart, one such combination would beCoCl2(aq) or MnCl2(aq) (or CoBr2(aq), MnBr2(aq),CoI2(aq) or MnI2(aq) mixed with CuNO3(aq)). Anexample of the reaction that takes place is shown below:
CoCl2(aq) + 2CuNO3(aq) → Co(NO3)2(aq) + 2CuCl(s)
pink green pink precipitate
10. Once the solid is dissolved, use a flame test to attempt toidentify the cation. If the flame is red, it could bestrontium ion. Add a few drops of aqueous sodium sulfateto the solution. Strontium ions and sulfate ions will forminsoluble strontium sulfate. As well, a solution ofstrontium ions will be colourless.
11. To solve a gas stoichiometry problem, you would need thepressure and the temperature at which the reaction takesplace in addition to the mass of the beryllium that reacts.
Answers to Solving Problems Questions12. (a) 2 mol H2(g):1 mol CO(g):1 mol CH3OH(g)
(b) nH2 � 130 kmol CH3OH × �1 m2oml C
olHH
3O2
H�
� 260 kmol H2
260 kmol of hydrogen is required.
(c) nH2 � 6.00 mol CO × �12
mm
oollCH
O2
� � 12.0 mol H2
12.0 mol of hydrogen is required.
13. (a) 2 mol C4H10(g) : 13 mol O2(g) : 8 mol CO2(g) : 10 mol H2O(g)
(b) nO2 � 8.0 mol C4H10 × �21m3
omloCl
4
OH
2
10�
� 52 mol O2
52 mol of oxygen is required.
(c) nH2O � 3.50 mol C4H10 × �210
mmol
oCl H
4H2O
10�
� 17.5 mol H2O
17.5 mol of water vapour is produced.
14. 2 Mg(s) � O2(g) → 2MgO(s)
m � 50 g m � ? g
M � 24.31 g/mol M � 40.31 g/mol
mMgO � 50 g Mg × �214.
m31
olgMM
gg
� × �11mmoollMM
ggO
�
× �410.
m31
olgMM
ggOO
�
� 83 g
83 g of metal oxide is formed.
15. Cl2(g) � Na(s) → 2NaCl(s)
m � 4.6 g m � ? g
M � 22.99 g/mol M � 58.44 g/mol
mNaCl � 4.6 g Na × �212.
m99
olgNNaa
� × �21mmoollNNaC
al
�
× �5
1
8.
m
44
ol
g
N
N
a
a
C
C
l
l�
� 12 g12 g of white solid is expected.
16. 2C8H18(�) � 25O2(g) → 16CO2(g) � 18H2O(g)
m � 72.1 g m � ? g
M � 114.26 g/mol M � 44.01 g/mol
mCO2 � 72.1 g C8H18 × �1114m.2
o6lgC
C8H
8H18
18�
× �216
mmol
oCl C
8HO
1
2
8� × �
414.
m01
olgCCOO
2
2�
� 222 g
222 g of carbon dioxide is expected.
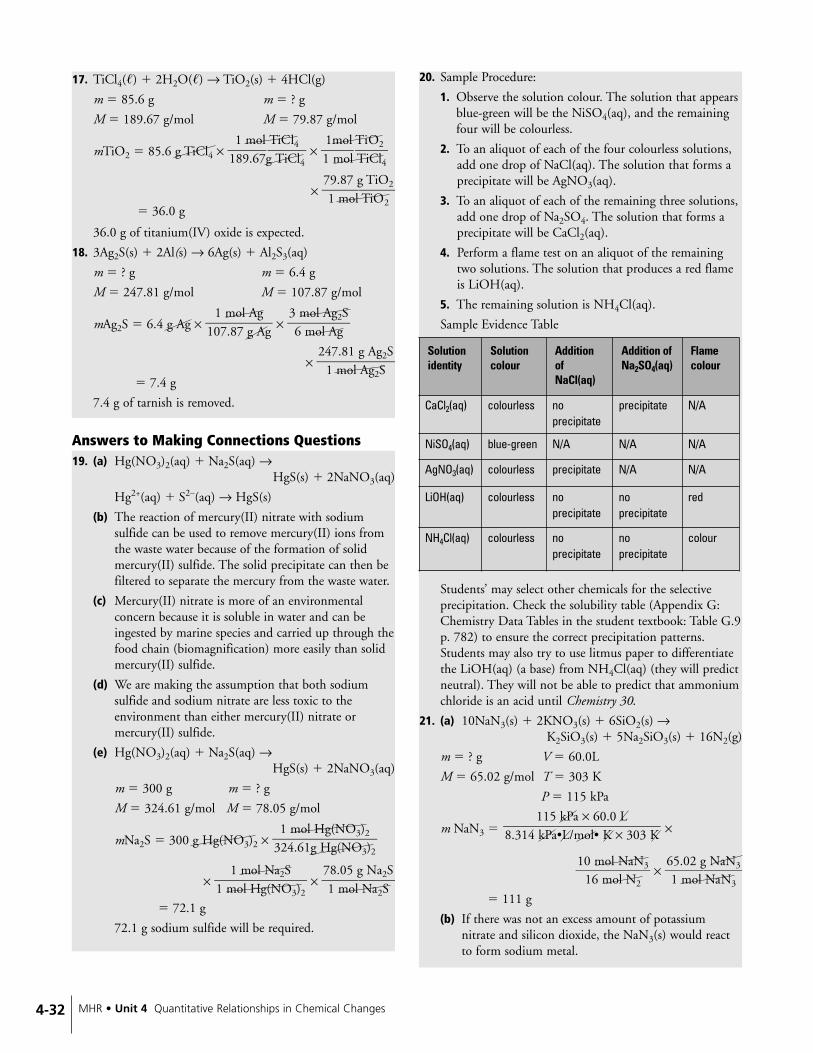
4-32 MHR • Unit 4 Quantitative Relationships in Chemical Changes
17. TiCl4(�) � 2H2O(�) → TiO2(s) � 4HCl(g)
m � 85.6 g m � ? g
M � 189.67 g/mol M � 79.87 g/mol
mTiO2 � 85.6 g TiCl4 × �1189
m.6
o7lgTTiCiC
l4l4
� × �11m
moollTT
iiOCl
2
4�
× �719.
m87
olgTTiOiO
2
2�
� 36.0 g
36.0 g of titanium(IV) oxide is expected.
18. 3Ag2S(s) � 2Al(s) → 6Ag(s) � Al2S3(aq)
m � ? g m � 6.4 g
M � 247.81 g/mol M � 107.87 g/mol
mAg2S � 6.4 g Ag × �1017m.8
o7lgA
Ag
g� × �
36mmoollAAgg2S
�
× �24
17m.8
o1lgA
Ag2
gS2S
�
� 7.4 g
7.4 g of tarnish is removed.
Answers to Making Connections Questions19. (a) Hg(NO3)2(aq) � Na2S(aq) →
HgS(s) � 2NaNO3(aq)
Hg2+(aq) � S2–(aq) → HgS(s)
(b) The reaction of mercury(II) nitrate with sodiumsulfide can be used to remove mercury(II) ions fromthe waste water because of the formation of solidmercury(II) sulfide. The solid precipitate can then befiltered to separate the mercury from the waste water.
(c) Mercury(II) nitrate is more of an environmentalconcern because it is soluble in water and can beingested by marine species and carried up through thefood chain (biomagnification) more easily than solidmercury(II) sulfide.
(d) We are making the assumption that both sodiumsulfide and sodium nitrate are less toxic to theenvironment than either mercury(II) nitrate ormercury(II) sulfide.
(e) Hg(NO3)2(aq) � Na2S(aq) →HgS(s) � 2NaNO3(aq)
m � 300 g m � ? g
M � 324.61 g/mol M � 78.05 g/mol
mNa2S � 300 g Hg(NO3)2 �3124
m.6
o1lgHHg(gN(N
OO3)
3
2
)2�
× �1 m1oml H
olgN(N
a2
OS
3)2� × �
718.
m05
olgNNaa
2
2
SS
�
� 72.1 g
72.1 g sodium sulfide will be required.
20. Sample Procedure:
1. Observe the solution colour. The solution that appearsblue-green will be the NiSO4(aq), and the remainingfour will be colourless.
2. To an aliquot of each of the four colourless solutions,add one drop of NaCl(aq). The solution that forms aprecipitate will be AgNO3(aq).
3. To an aliquot of each of the remaining three solutions,add one drop of Na2SO4. The solution that forms aprecipitate will be CaCl2(aq).
4. Perform a flame test on an aliquot of the remainingtwo solutions. The solution that produces a red flameis LiOH(aq).
5. The remaining solution is NH4Cl(aq).
Sample Evidence Table
Students’ may select other chemicals for the selectiveprecipitation. Check the solubility table (Appendix G:Chemistry Data Tables in the student textbook: Table G.9p. 782) to ensure the correct precipitation patterns.Students may also try to use litmus paper to differentiatethe LiOH(aq) (a base) from NH4Cl(aq) (they will predictneutral). They will not be able to predict that ammoniumchloride is an acid until Chemistry 30.
21. (a) 10NaN3(s) � 2KNO3(s) � 6SiO2(s) →K2SiO3(s) � 5Na2SiO3(s) � 16N2(g)
m � ? g V � 60.0L
M � 65.02 g/mol T � 303 K
P � 115 kPa
m NaN3 � ×
�10
16m
mol
oNl N
aN
2
3� × �
615.
m02
olgNNaaNN
3
3�
� 111 g
(b) If there was not an excess amount of potassiumnitrate and silicon dioxide, the NaN3(s) would reactto form sodium metal.
115 kPa × 60.0 L���8.314 kPa•L/mol• K × 303 K
Solutionidentity
Solutioncolour
AdditionofNaCl(aq)
Addition ofNa2SO4(aq)
Flamecolour
CaCl2(aq) colourless noprecipitate
precipitate N/A
NiSO4(aq) blue-green N/A N/A N/A
AgNO3(aq) colourless precipitate N/A N/A
LiOH(aq) colourless noprecipitate
noprecipitate
red
NH4Cl(aq) colourless noprecipitate
noprecipitate
colour

4-33Chapter 7 Stoichiometry • MHR
(c) Testing the safety of reactions is important because itensures that they are safe and people who use the finalproduct will be unharmed. Safety testing can alsohelp predict where reactions can go wrong if thesystem needs to be redesigned.
22. (a) 4KO2(s) � 2CO2(g) → 2K2CO3(s) � 3O2(g)
m � ? g v � 50.0 L
M � 71.10 �m
gol� T � 295 K
P � 101.3 kPa
mKO ��180.311.34
kkPPaa•
×L5/0m.0ol
L•
� × �4K
m×
o2l9K5OK
2�
×
� 294 g
(b) The potassium superoxide reaction also producesoxygen that is required by the astronauts in the spacevehicle.
71.10 g KO2���2 mol CO2 1 mol KO2

4-34 MHR • Chapter 8 Applications of Stoichiometry
Student Textbook Assessment Options
Outcomes for Knowledge
20–D2.1k explain chemical principles, i.e., conservation of massin a chemical change, using quantitative analysis
Limiting and Excess Reactants, Section8.1, p. 296Investigation 8.B: Determining thePercentage Yield of a Chemical Reaction,Section 8.2, p. 309
Investigation 8.B: Determining the PercentageYield of a Chemical Reaction, Extension: 5,Section 8.2, p. 309Section 8.1 Review: 1, p. 304Chapter 8 Review: 2, 3, pp. 324-325Chapter 8 TestUnit 4 Review: 1, 2, pp. 328-331
20–D2.2k identify limiting and excess reagents in chemicalreactions
Thought Lab 8.1: The Limiting Item,Section 8.1, p. 296Limiting and Excess Reactants, Section8.1, pp. 296, 298-303Limiting and Excess Reactants inChemical Reactions, Section 8.1, p. 297Sample Problem: GravimetricStoichiometry with a Limiting Reactant,Section 8.1, p. 298Investigation 8.A: The Limiting Reactant,Section 8.1, p. 300
Sample Problem: Precipitating Mercury:A Limiting Reactant Problem, Section 8.1,p. 301Sample Problem: Precipitating SilverChromate, Section 8.1, p. 302Investigation 8.B: Determining thePercentage Yield of a Chemical Reaction,Section 8.2, pp. 309-310
Thought Lab 8.1: The Limiting Item: Analysis: 1-3, Section 8.1, p. 296Questions for Comprehension: 1, Section 8.1, p. 297Practice Problems: 1-6, Section 8.1, p. 299
Investigation 8.A: The Limiting Reactant,Analysis: 1, 2, Conclusion: 4, Extension: 5,Section 8.1, p. 300Practice Problems: 7-12, Section 8.1, p. 302
Investigation 8.B: Determining the PercentageYield of a Chemical Reaction, Analysis: 1,Section 8.2, pp. 309-310Section 8.1 Review: 1-8, p. 304Chapter 8 Review: 1, 3, 11-15, pp. 324-325Chapter 8 TestUnit 4 Review: 23-42, pp. 328-331
CHAPTER 8 APPLICATIONS OF STOICHIOMETRY
Curriculum CorrelationGeneral Outcome 2: Students will use stoichiometry in quantitative analysis.

4-35Chapter 8 Applications of Stoichiometry • MHR
Student Textbook Assessment Options
20–D2.3k calculate theoretical yields and determine actualyields
Chapter 8 Launch Lab: The Model AirBag, Analysis, p. 295Sample Problem: GravimetricStoichiometry with a Limiting Reactant,Section 8.1, p. 298Sample Problem: Precipitating Mercury:A Limiting Reactant Problem, Section 8.1,p. 301Sample Problem: Precipitating SilverChromate, Section 8.1, p. 302Predicted and Exerpmental Yield, Section8.2, pp. 305-310Sample Problem: Calculating thePercentage Yield, Section 8.2, p. 307Investigation 8.B: Determining thePercentage Yield of a Chemical Reaction,Section 8.2, p. 309Connections: Sulfur from Sour Gas,Section 8.3, p. 320
Chapter 8 Launch Lab: The Model Air Bag,Analysis: 1, 2, p. 295Practice Problems: 1-6, Section 8.1, p. 299
Practice Problems: 7-12, Section 8.1, p. 302
Investigation 8.B: Determining the PercentageYield of a Chemical Reaction, Analysis: 3,Extension: 4, 5, Section 8.2, p. 309Connections: Sulfur from Sour Gas: 1, 2, Section 8.3, p. 320Section 8.1 Review: 3-8, p. 304Questions for Comprehension: 3, Section 8.2, p. 307Practice Problems: 13-19, Section 8.2, p. 308Section 8.2 Review: 1-8, p. 311Chapter 8 Review: 15-17, pp. 324-325Chapter 8 TestUnit 4 Review: 35, 40-42, pp. 328-331
20–D2.4k explain the discrepancy between theoretical andactual yields and calculate percent yield
Predicted and Experimental Yield,Section 8.2, pp. 305, 308-309Calculating the Percentage Yield of aReaction, Section 8.2, p. 307Investigation 8.B: Determining thePercentage Yield of a Chemical Reaction,Section 8.2, p. 309Acid-Base Titration, Section 8.3, p. 312
Investigation 8.B: Determining the PercentageYield of a Chemical Reaction, Analysis: 2, 3,Conclusion: 4, Extension: 5, Section 8.2, p. 309Section 8.1 Review: 6, 7, p. 304Questions for Comprehension: 2, 3, Section 8.2,p. 307Practice Problems: 13-19, Section 8.2, p. 308Section 8.2 Review: 1, 2, 7, 8, p. 311Chapter 8 Review: 3-5, pp. 324-325Chapter 8 Test

4-36 MHR • Chapter 8 Applications of Stoichiometry
Student Textbook Assessment Options
20–D2.5k draw and interpret titration curve graphs, using datafrom titration experiments involving strong monoprotic acids andstrong monoprotic bases
Sample Problem: Determining AcidConcentration by Titration, Section 8.3, p. 314Investigation 8.C: Standardizing aHydrochloric Acid Solution, Section 8.3,p. 316Acid-Base Titration Curves, Section 8.3,p. 317Acid-Base Titration, Section 8.3, pp. 318-319Thought Lab 8.2: Plotting a TitrationCurve, Section 8.3, p. 319
Practice Problems: 20-25, Section 8.3, p. 315
Investigation 8.C: Standardizing a HydrochloricAcid Solution: 1-8, Section 8.3, p. 316
Thought Lab 8.2: Plotting a Titration Curve: 1-6,Section 8.3, p. 319Questions for Comprehension: 8-10, Section 8.3,p. 319Section 8.3 Review: 4, 6, p. 322Chapter 8 Review: 10, 19, pp. 324-325Chapter 8 Test
20–D2.6k describe the function and choice of indicators intitrations
Acid-Base Titration, Section 8.3, p. 312Investigation 8.C: Standardizing aHydrochloric Acid Solution, Section 8.3,p. 316Choosing an Indicator, Section 8.3, p. 318Thought Lab 8.2: Plotting a TitrationCurve, Section 8.3, p. 319Investigation 8.D: Titrating a Strong Basewith a Strong Acid, Section 8.3, p. 321
Investigation 8.C: Standardizing a HydrochloricAcid Solution, Section 8.3, 1-8, p. 317
Thought Lab 8.2: Plotting a Titration Curve,Extension: 6, Section 8.3, p. 319Investigation 8.D: Titrating a Strong Base with aStrong Acid: 7, Section 8.3, p. 321Section 8.3 Review: 2, 6, p. 322Chapter 8 Review: 6, 10, 19, pp. 324-325Chapter 8 TestUnit 4 Review: 12, 35, pp. 328-331
20–D2.7k identify equivalence points on strong monoprotic acid-strong monoprotic base titration curves and differentiatebetween the indicator endpoint and the equivalence point.
Acid-Base Titration, Section 8.3, pp. 312,319-320Thought Lab 8.2: Plotting a TitrationCurve, Section 8.3, p. 319Investigation 8.D: Titrating a Strong Basewith a Strong Acid, Section 8.3, p. 321
Questions for Comprehension: 9, 10, Section 8.3,p. 319Thought Lab 8.2: Plotting a Titration Curve,Extension: 6, Section 8.3, p. 319Investigation 8.D: Titrating a Strong Base with aStrong Acid: 6, 7, Section 8.3, p. 321Section 8.3 Review: 2, 6, p. 322Chapter 8 Review: 6, 8, 21, pp. 324-325Chapter 8 TestUnit 4 Review: 12, pp. 328-331

4-37Chapter 8 Applications of Stoichiometry • MHR
Student Textbook Assessment Options
Outcomes for Science, Technology and Society (Emphasis on science and technology)
20–D2.1sts explain that scientific knowledge may lead to thedevelopment of new technologies and that new technologiesmay lead to scientific discovery by■ describing how industries apply principles of stoichiometry
to minimize waste and maximize yield
Stoichiometry, Chapter 7 opener, p. 260Reactions in Aqueous Solution, Section7.1, p. 263Stoiciometry and qualitative Analysis,Section 7.2, pp, 275, 279Investigation 7.C: Analyzing IndustrialProcesses, Section 7.2, p. 288Applications of Stoichiometry, Chapter 8opener, p. 294Chapter 8 Launch Lab: The Model AirBag, p. 295Predicted and Experimental Yield,Section 8.2, p. 307Connections: Sulfur from Sour Gas,Section 8.3, p. 320
Investigation 7.C: Analyzing IndustrialProcesses: 1-3, 1, 2 Section 7.2, p. 288
Chapter 8 Launch Lab: The Model Air Bag,Analysis: 1, 2, p. 295
Connections: Sulfur from Sour Gas: 1-3, Section8.3, p. 320Chapter 8 Review: 3, 5, 21, pp. 324-325Unit 4 Review: 43-45, pp. 328-331
20–D2.2sts explain how the appropriateness and the risks andbenefits of technologies need to be assessed for each potentialapplication from a variety of perspectives, includingsustainability by■ assessing the significance of specific by-products from
industrial, commercial and household applications ofchemical reactions
■ analyzing the use of technology to reduce environmentalimpact in SO2(g) removal from smokestacks, catalyticconverters in automobiles and reducing greenhouse gasemissions.
Stoichiometry and Qualitative Analysis,Section 7.2, p. 279Investigation 7.C: Analyzing IndustrialProcesses, Section 7.2, p. 288Chapter 8 Launch Lab: The Model AirBag, Analysis, p. 295
Connections: Sulfur from Sour Gas,Section 8.3, p. 320
Investigation 7.C: Analyzing IndustrialProcesses: 1-3, 1, 2 Section 7.2, p. 288Chapter 8 Launch Lab: The Model Air Bag,Analysis: 1, 2, p. 295Chapter 8 Review: 3, 5, 21, pp. 324-325Unit 4 Review: 43-45, pp. 328-331Connections: Sulfur from Sour Gas: 1-3, Section 8.3, p. 320
Skill Outcomes (Focus on problem solving)
Initiating and Planning
20–D2.1s ask questions about observed relationships and planinvestigations of questions, ideas, problems and issues by■ designing a method using crystallization, filtration or titration
to determine theconcentration of a solution
■ describing procedures for safe handling, storage anddisposal of materials used in the laboratory, with referenceto WHMIS and consumer product labelling information
■ predicting the approximate equivalence point for a strongmonoprotic acid-strong monoprotic base titration andselecting an appropriate indicator.
Investigation 8.C: Standardizing aHydrochloric Acid Solution, Section 8.3,p. 316Thought Lab 8.2: Plotting a TitrationCurve, Section 8.3, p. 319
Investigation 8.D: Titrating a Strong Basewith a Strong Acid, Section 8.3, p. 321
Section 8.1 Review: 8, p. 304
Investigation 8.C: Standardizing a HydrochloricAcid Solution: 1-8, Section 8.3, p. 316
Thought Lab 8.2: Plotting a Titration Curve,Extension: 6, Section 8.3, p. 319
Investigation 8.D: Titrating a Strong Base with aStrong Acid: 1-7, Section 8.3, p. 321Chapter 8 Review: 10, 24, pp. 324-325Unit 4 Review: 22, 45, pp. 328-331
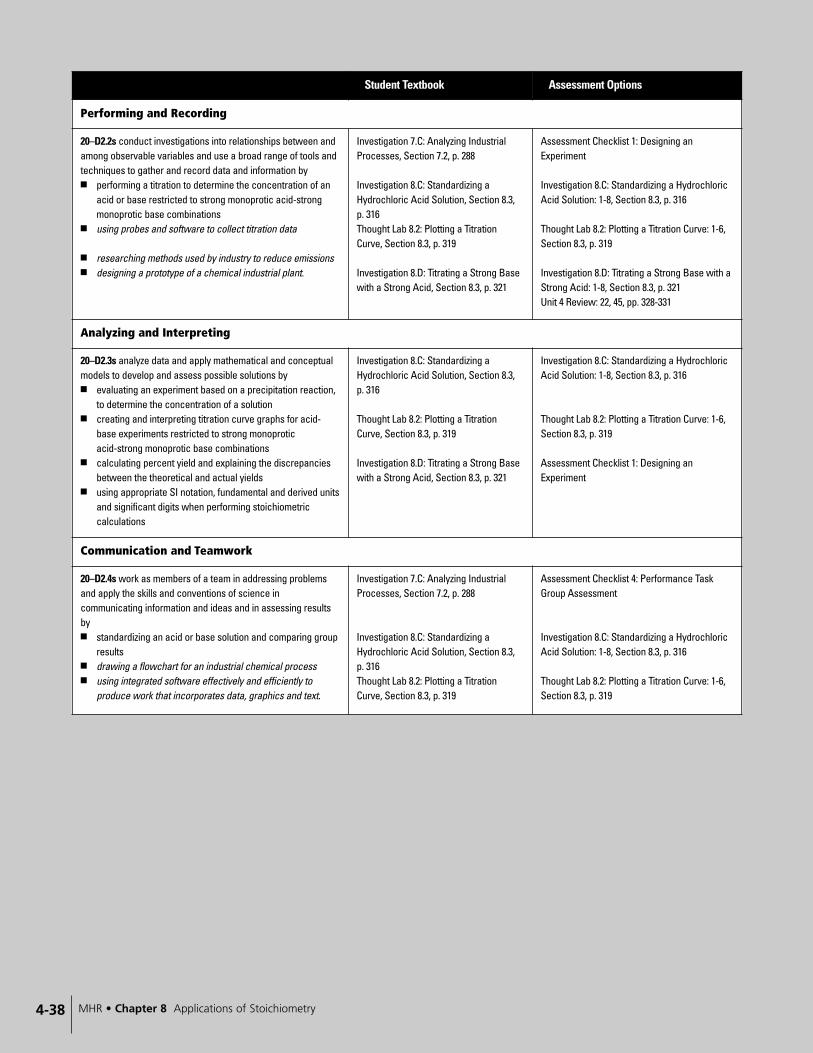
4-38 MHR • Chapter 8 Applications of Stoichiometry
Student Textbook Assessment Options
Performing and Recording
20–D2.2s conduct investigations into relationships between andamong observable variables and use a broad range of tools andtechniques to gather and record data and information by■ performing a titration to determine the concentration of an
acid or base restricted to strong monoprotic acid-strongmonoprotic base combinations
■ using probes and software to collect titration data
■ researching methods used by industry to reduce emissions■ designing a prototype of a chemical industrial plant.
Investigation 7.C: Analyzing IndustrialProcesses, Section 7.2, p. 288
Investigation 8.C: Standardizing aHydrochloric Acid Solution, Section 8.3,p. 316Thought Lab 8.2: Plotting a TitrationCurve, Section 8.3, p. 319
Investigation 8.D: Titrating a Strong Basewith a Strong Acid, Section 8.3, p. 321
Assessment Checklist 1: Designing anExperiment
Investigation 8.C: Standardizing a HydrochloricAcid Solution: 1-8, Section 8.3, p. 316
Thought Lab 8.2: Plotting a Titration Curve: 1-6,Section 8.3, p. 319
Investigation 8.D: Titrating a Strong Base with aStrong Acid: 1-8, Section 8.3, p. 321Unit 4 Review: 22, 45, pp. 328-331
Analyzing and Interpreting
20–D2.3s analyze data and apply mathematical and conceptualmodels to develop and assess possible solutions by■ evaluating an experiment based on a precipitation reaction,
to determine the concentration of a solution■ creating and interpreting titration curve graphs for acid-
base experiments restricted to strong monoproticacid-strong monoprotic base combinations
■ calculating percent yield and explaining the discrepanciesbetween the theoretical and actual yields
■ using appropriate SI notation, fundamental and derived unitsand significant digits when performing stoichiometriccalculations
Investigation 8.C: Standardizing aHydrochloric Acid Solution, Section 8.3,p. 316
Thought Lab 8.2: Plotting a TitrationCurve, Section 8.3, p. 319
Investigation 8.D: Titrating a Strong Basewith a Strong Acid, Section 8.3, p. 321
Investigation 8.C: Standardizing a HydrochloricAcid Solution: 1-8, Section 8.3, p. 316
Thought Lab 8.2: Plotting a Titration Curve: 1-6,Section 8.3, p. 319
Assessment Checklist 1: Designing anExperiment
Communication and Teamwork
20–D2.4s work as members of a team in addressing problemsand apply the skills and conventions of science incommunicating information and ideas and in assessing resultsby■ standardizing an acid or base solution and comparing group
results■ drawing a flowchart for an industrial chemical process■ using integrated software effectively and efficiently to
produce work that incorporates data, graphics and text.
Investigation 7.C: Analyzing IndustrialProcesses, Section 7.2, p. 288
Investigation 8.C: Standardizing aHydrochloric Acid Solution, Section 8.3,p. 316Thought Lab 8.2: Plotting a TitrationCurve, Section 8.3, p. 319
Assessment Checklist 4: Performance TaskGroup Assessment
Investigation 8.C: Standardizing a HydrochloricAcid Solution: 1-8, Section 8.3, p. 316
Thought Lab 8.2: Plotting a Titration Curve: 1-6,Section 8.3, p. 319

4-39Chapter 8 Applications of Stoichiometry • MHR
Chapter 8
Applications ofStoichiometry
Student Textbook pages 294-325
Chapter ConceptsSection 8.1 Limiting and Excess Reactants■ Reactants are not usually present in the exact amounts
required by the reaction.■ One reactant limits the reaction, while the other reactants
are left over after the reaction is complete.
Section 8.2 Predicted and Experimental Yield■ Chemical reactions rarely produce the predicted amount of
product.■ Percentage yield compares the experimental yield with the
predicted yield.
Section 8.3 Acid-Base Titration■ You can determine the concentration of a strong acid by
adding a strong base or the concentration of strong base byadding a strong acid.
■ Indicators and pH meters allow you to determine whenneutralization is near.
Common Misconceptions■ Students may designate the limiting reactant as the
reactant present in the lowest mass, or in the lowestnumber of moles, without looking at the balancedchemical equation. Remind students that the ratio ofreactants must be taken into consideration whendetermining the limiting reactant.
■ Some students will confuse the endpoint and equivalencepoint or treat them as the same thing. The point in thetitration at which the chosen indicator changes colour isthe endpoint. The equivalence point, or stoichiometricpoint, is the point at which the number of moles of acidequals the number of moles of base that have been added.A good choice of indicator for a titration is one that willproduce an endpoint that occurs at the equivalence pointor very close to it (in the steep portion of the pH curve).
Helpful ResourcesJournal Articles■ Arasasingham, R.D., Taagepera, M., Potter, F., and
Lonjers, S. “Using Knowledge Space Theory to AssessStudent Understanding of Stoichiometry,” Journal ofChemical Education, Vol. 81, No. 10, October 2004, p.1517.
■ Ault, A. “How to Say How Much: Amounts andStoichiometry,” Journal of Chemical Education, Vol. 78,No. 10, October 2001, p. 1345.
■ Cook, E. and Cook, R.L. “Cross-Proportions: AConceptual Method for Developing Quantitative Problem-Solving Skills,” Journal of Chemical Education, Vol. 82, No.8, August 2005, p. 1187.
■ Gabel, D. “Improving Teaching and Learning throughChemistry Education Research: A Look to the Future,”Journal of Chemical Education, Vol. 76, No. 4, April 1999,p. 548.
■ Krieger, C.R. “Stoogiometry: A Cognitive Approach toTeaching Stoichiometry,” Journal of Chemical Education,Vol. 74, No. 3, March 1997, p. 306.
■ Lin, H. and Cheng, H. “The Assessment of Students andTeachers’ Understanding of Gas Laws,” Journal of ChemicalEducation, Vol. 77, No. 2, February 2000, p. 235.
■ Rohrig, B, “Fizzy Drinks: Stoichiometry You Can Taste,”Journal of Chemical Education, Vol. 77, No. 12, December2000, p. 1608B.
Web SitesWeb links related to applications of stoichiometry can befound at www.albertachemistry.ca. Go to the OnlineLearning Centre, and log on to the Instructor Edition.Choose Teacher Web Links.
List of BLMs Blackline masters (BLMs) have been prepared to support thematerial in this chapter. The BLMs are either for assessment(AST); use as overheads (OH); use as handouts (HAND), inparticular to support activities; or to supply answers (ANS) forassessment or handouts. The BLMs are in digital form, storedon the CD-ROM that accompanies this Teacher’s Resource oron the web site at www.albertachemistry.ca, Online LearningCentre, Instructor Edition, BLMs.
Number (Type) Title8.0.1 (HAND) Launch Lab: The Model Airbag8.0.1A (ANS) Launch Lab: The Model Airbag Answer Key
8.1.1 (HAND) Thought Lab 8.1: The Limiting Item8.1.1A (ANS) Thought Lab 8.1: The Limiting Item AnswerKey8.1.2 (AST) Limiting Reactant Problems8.1.2A (ANS) Limiting Reactant Problems Answer Key8.1.3 (AST) Expected Quantity of Product Problems8.1.3A (ANS) Expected Quantity of Product ProblemsAnswer Key8.1.4 (OH) Process for Solving Limited Reactant SolutionStoichiometry Problems8.1.5 (AST) Limiting Reactant in Solution and GasStoichiometry 8.1.5A (ANS) Limiting Reactant in Solution and GasStoichiometry Answer Key8.1.6 (HAND) Investigation 8.A: The Limiting Reactant8.1.6A (ANS) Investigation 8.A: The Limiting ReactantAnswer Key

8.2.1 (AST) Percentage Yield Problems8.2.1A (ANS) Percentage Yield Problems Answer Key8.2.2 (HAND) Investigation 8.B: Determining the PercentageYield of a Chemical Reaction8.2.2A (ANS) Investigation 8.B: Determining the PercentageYield of a Chemical Reaction Answer Key
8.3.1 (AST) Acid-Base Titration8.3.1A (ANS) Acid-Base Titration Answer Key8.3.2 (OH) Titration Step-by-Step8.3.3 (AST) Titration Problems8.3.3A (ANS) Titration Problems Answer Key8.3.4 (HAND) Investigation 8.C: Standardizing aHydrochloric Acid Solution8.3.4A (ANS) Investigation 8.C: Standardizing aHydrochloric Acid Solution Answer Key8.3.5 (OH) pH Titration Curves and Indicators8.3.6 (AST) Selecting an Indicator8.3.6A (ANS) Selecting an Indicator Answer Key8.3.7 (HAND) Thought Lab 8.2: Plotting a Titration Curve8.3.7A (ANS) Thought Lab 8.2: Plotting a Titration CurveAnswer Key8.3.8 (HAND) Investigation 8.D: Titrating a Strong Basewith a Strong Acid8.3.8A (ANS) Investigation 8.D: Titrating a Strong Base witha Strong Acid Answer Key
8.4.1 (AST) Chapter 8 Test8.4.1A (ANS) Chapter 8 Test Answer Key
Using the Chapter 8 OpenerStudent Textbook pages 294-295
Teaching Strategies■ Read the Chapter Opener with students. Ask them what
engineers need to predict when they want to fill an air bagwith gas (answer: the volume of the gas). Ask students howthey would determine the volume of a gaseous productbased on the mass of a solid reactant (answer: convert massof reactant to moles, convert moles of product to volume).Have students discuss how to determine the volume of agas based on molar amount (answer: molecular volume,Gay-Lussac’s law of combining volumes, and the ideal gaslaw). This discussion will prepare students nicely for theLaunch Lab: The Model Airbag.
Launch Lab The Model AirbagStudent Textbook page 295
PurposeStudents try to fill a bag by producing a gas from the reactionof household vinegar (ethanoic acid) and baking soda (sodiumhydrogen carbonate). In this way, students gain anappreciation of how stoichiometry can be used to solve realproblems.
Outcomes■ 20-D1.1sts■ 20-D1.3s
Advance Preparation
Time Required30 minutes
Helpful Tips■ Typically, sandwich bags have a capacity of 500 to 700 mL
in volume before the plastic bag stretches.■ If possible, try the procedure yourself using one of the
sandwich bags you will provide for the students. This wayyou can test the capacity and stretchiness of the bags andwill also have some idea how quickly the reaction willproceed.
■ Measure the barometric pressure and the room temperatureand provide to students the day before the laboratoryexercise to allow them to make a prediction. The mass ofbaking soda should be approximately 1.6 to 2.3 gassuming a pressure of 94 kPa and a temperature of 22 °C.
■ The concentration of vinegar is typically 5% by volume,which corresponds to a molar concentration of 0.833 mol/Lethanoic acid. The volume of ethanoic acid that should be
Materials
■ 50 mL graduated cylinder■ 50 mL beaker■ barometer or the latest air pressure (uncorrected)■ –20 to 120 °C alcohol or digital thermometer■ resealable plastic sandwich bags (typically 16.9 cm x 14.8 cm)■ household white vinegar (CH3COOH(aq))■ baking soda (NaHCO3(s))
When to Begin What to Do
2 to 3 weeks before ■ Ensure all materials andchemicals are available
1 day before ■ Set up student stations ■ Collect materials■ Test the reaction and
materials to ensure that thedesired effect is achieved
■ Provide each student withBLM 8.0.1 (HAND) LaunchLab: The Model Airbag andhave students complete theprediction
The day of the lab ■ Check the weather officefor the barometric pressure(uncorrected) if a mercurybarometer is unavailable
4-40 MHR • Unit 4 Quantitative Relationships in Chemical Changes
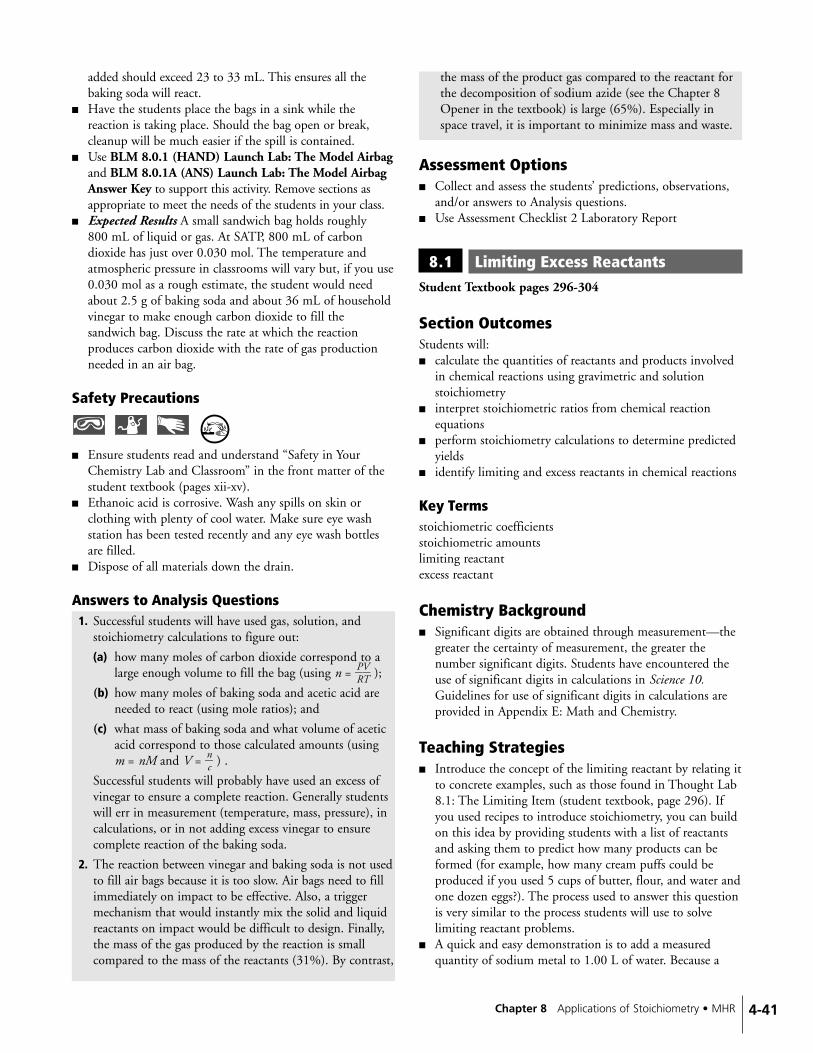
4-41Chapter 8 Applications of Stoichiometry • MHR
added should exceed 23 to 33 mL. This ensures all thebaking soda will react.
■ Have the students place the bags in a sink while thereaction is taking place. Should the bag open or break,cleanup will be much easier if the spill is contained.
■ Use BLM 8.0.1 (HAND) Launch Lab: The Model Airbagand BLM 8.0.1A (ANS) Launch Lab: The Model AirbagAnswer Key to support this activity. Remove sections asappropriate to meet the needs of the students in your class.
■ Expected Results A small sandwich bag holds roughly 800 mL of liquid or gas. At SATP, 800 mL of carbondioxide has just over 0.030 mol. The temperature andatmospheric pressure in classrooms will vary but, if you use0.030 mol as a rough estimate, the student would needabout 2.5 g of baking soda and about 36 mL of householdvinegar to make enough carbon dioxide to fill thesandwich bag. Discuss the rate at which the reactionproduces carbon dioxide with the rate of gas productionneeded in an air bag.
Safety Precautions
■ Ensure students read and understand “Safety in YourChemistry Lab and Classroom” in the front matter of thestudent textbook (pages xii-xv).
■ Ethanoic acid is corrosive. Wash any spills on skin orclothing with plenty of cool water. Make sure eye washstation has been tested recently and any eye wash bottlesare filled.
■ Dispose of all materials down the drain.
Answers to Analysis Questions1. Successful students will have used gas, solution, and
stoichiometry calculations to figure out:
(a) how many moles of carbon dioxide correspond to alarge enough volume to fill the bag (using n = �
RPV
T� );
(b) how many moles of baking soda and acetic acid areneeded to react (using mole ratios); and
(c) what mass of baking soda and what volume of aceticacid correspond to those calculated amounts (using m = nM and V = �
nc� ) .
Successful students will probably have used an excess ofvinegar to ensure a complete reaction. Generally studentswill err in measurement (temperature, mass, pressure), incalculations, or in not adding excess vinegar to ensurecomplete reaction of the baking soda.
2. The reaction between vinegar and baking soda is not usedto fill air bags because it is too slow. Air bags need to fillimmediately on impact to be effective. Also, a triggermechanism that would instantly mix the solid and liquidreactants on impact would be difficult to design. Finally,the mass of the gas produced by the reaction is smallcompared to the mass of the reactants (31%). By contrast,
the mass of the product gas compared to the reactant forthe decomposition of sodium azide (see the Chapter 8Opener in the textbook) is large (65%). Especially inspace travel, it is important to minimize mass and waste.
Assessment Options■ Collect and assess the students’ predictions, observations,
and/or answers to Analysis questions.■ Use Assessment Checklist 2 Laboratory Report
8.1 Limiting Excess ReactantsStudent Textbook pages 296-304
Section OutcomesStudents will:■ calculate the quantities of reactants and products involved
in chemical reactions using gravimetric and solutionstoichiometry
■ interpret stoichiometric ratios from chemical reactionequations
■ perform stoichiometry calculations to determine predictedyields
■ identify limiting and excess reactants in chemical reactions
Key Termsstoichiometric coefficientsstoichiometric amountslimiting reactantexcess reactant
Chemistry Background■ Significant digits are obtained through measurement—the
greater the certainty of measurement, the greater thenumber significant digits. Students have encountered theuse of significant digits in calculations in Science 10.Guidelines for use of significant digits in calculations areprovided in Appendix E: Math and Chemistry.
Teaching Strategies■ Introduce the concept of the limiting reactant by relating it
to concrete examples, such as those found in Thought Lab8.1: The Limiting Item (student textbook, page 296). Ifyou used recipes to introduce stoichiometry, you can buildon this idea by providing students with a list of reactantsand asking them to predict how many products can beformed (for example, how many cream puffs could beproduced if you used 5 cups of butter, flour, and water andone dozen eggs?). The process used to answer this questionis very similar to the process students will use to solvelimiting reactant problems.
■ A quick and easy demonstration is to add a measuredquantity of sodium metal to 1.00 L of water. Because a
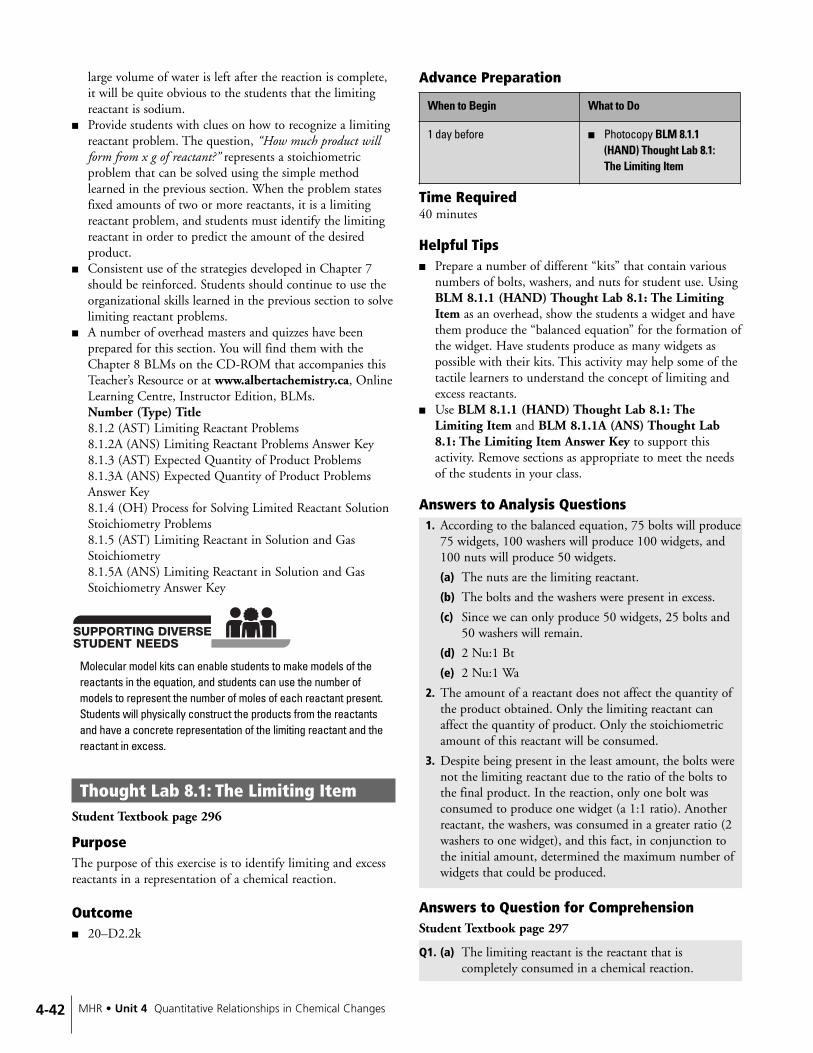
4-42 MHR • Unit 4 Quantitative Relationships in Chemical Changes
large volume of water is left after the reaction is complete,it will be quite obvious to the students that the limitingreactant is sodium.
■ Provide students with clues on how to recognize a limitingreactant problem. The question, “How much product willform from x g of reactant?” represents a stoichiometricproblem that can be solved using the simple methodlearned in the previous section. When the problem statesfixed amounts of two or more reactants, it is a limitingreactant problem, and students must identify the limitingreactant in order to predict the amount of the desiredproduct.
■ Consistent use of the strategies developed in Chapter 7should be reinforced. Students should continue to use theorganizational skills learned in the previous section to solvelimiting reactant problems.
■ A number of overhead masters and quizzes have beenprepared for this section. You will find them with theChapter 8 BLMs on the CD-ROM that accompanies thisTeacher’s Resource or at www.albertachemistry.ca, OnlineLearning Centre, Instructor Edition, BLMs.Number (Type) Title8.1.2 (AST) Limiting Reactant Problems8.1.2A (ANS) Limiting Reactant Problems Answer Key8.1.3 (AST) Expected Quantity of Product Problems8.1.3A (ANS) Expected Quantity of Product ProblemsAnswer Key8.1.4 (OH) Process for Solving Limited Reactant SolutionStoichiometry Problems8.1.5 (AST) Limiting Reactant in Solution and GasStoichiometry 8.1.5A (ANS) Limiting Reactant in Solution and GasStoichiometry Answer Key
Molecular model kits can enable students to make models of thereactants in the equation, and students can use the number ofmodels to represent the number of moles of each reactant present.Students will physically construct the products from the reactantsand have a concrete representation of the limiting reactant and thereactant in excess.
Thought Lab 8.1: The Limiting Item Student Textbook page 296
PurposeThe purpose of this exercise is to identify limiting and excessreactants in a representation of a chemical reaction.
Outcome■ 20–D2.2k
Advance Preparation
Time Required40 minutes
Helpful Tips■ Prepare a number of different “kits” that contain various
numbers of bolts, washers, and nuts for student use. UsingBLM 8.1.1 (HAND) Thought Lab 8.1: The LimitingItem as an overhead, show the students a widget and havethem produce the “balanced equation” for the formation ofthe widget. Have students produce as many widgets aspossible with their kits. This activity may help some of thetactile learners to understand the concept of limiting andexcess reactants.
■ Use BLM 8.1.1 (HAND) Thought Lab 8.1: TheLimiting Item and BLM 8.1.1A (ANS) Thought Lab8.1: The Limiting Item Answer Key to support thisactivity. Remove sections as appropriate to meet the needsof the students in your class.
Answers to Analysis Questions1. According to the balanced equation, 75 bolts will produce
75 widgets, 100 washers will produce 100 widgets, and100 nuts will produce 50 widgets.
(a) The nuts are the limiting reactant.
(b) The bolts and the washers were present in excess.
(c) Since we can only produce 50 widgets, 25 bolts and50 washers will remain.
(d) 2 Nu:1 Bt
(e) 2 Nu:1 Wa
2. The amount of a reactant does not affect the quantity ofthe product obtained. Only the limiting reactant canaffect the quantity of product. Only the stoichiometricamount of this reactant will be consumed.
3. Despite being present in the least amount, the bolts werenot the limiting reactant due to the ratio of the bolts tothe final product. In the reaction, only one bolt wasconsumed to produce one widget (a 1:1 ratio). Anotherreactant, the washers, was consumed in a greater ratio (2washers to one widget), and this fact, in conjunction tothe initial amount, determined the maximum number ofwidgets that could be produced.
Answers to Question for ComprehensionStudent Textbook page 297
Q1. (a) The limiting reactant is the reactant that iscompletely consumed in a chemical reaction.
When to Begin What to Do
1 day before ■ Photocopy BLM 8.1.1(HAND) Thought Lab 8.1:The Limiting Item
4-43Chapter 8 Applications of Stoichiometry • MHR
(b) The limiting reactant is not always the chemicalpresent in the fewest number of moles. It is thereactant that will form fewer moles of product.
Answers to Practice Problems 1-6Student Textbook page 299
For full solutions to the practice problems, visitwww.albertachemistry.ca, Online Learning Centre,Instructor Edition, Full Solutions.
1. Fe(NO3)2(aq)
2. 1.9 g
3. 22 g
4. 7.7 g
5. The zinc would react completely.
6. NH3(g) is the limiting reagent.
Investigation 8.A: The Limiting Reactant
Student Textbook page 300
PurposeStudents will predict the limiting reactant in a chemical reactionbetween a strip of aluminium foil and a solution containingcopper(II) chloride. Students will test their predictions byperforming the reaction and observing which reactant was presentat the conclusion of the reaction. Students will have anopportunity in the Extension to determine the excess reactant byobservation when the quantities of reactants are unknown.
Outcomes■ 20–D2.2k ■ 20–D2.1s■ 20–D1.4s
Advance Preparation
Time Required60 minutes
Helpful Tips■ Prepare a sample mass of aluminium foil and CuCl2(s) for
students to see before they perform the investigation.■ Pre-weighed samples of CuCl2(s) can be stored in film
canisters. Students who finish the experiment quickly canprepare these samples for the next class. CuCl2 frequentlycomes as a dihydrate, CuCl2•2H2O(s). If this is the case,you need to give each group 0.65 g of the dihydrate. Donot tell the students; talking about hydrated ioniccompounds is an unnecessary complication at this point.
■ All solids should be filtered out upon completion of this lab.The solid copper can be kept for later use, and the AlCl3(aq)can be stored in a sealed container labelled “organic waste.”
■ Students should have completed the prediction for thislaboratory exercise and prepared an evidence table. Theprediction should include the formation of a precipitate,colour changes, and a decrease in mass of the aluminiumfoil. Students who have completed this section will bebetter prepared to make all the necessary observations tocomplete this exercise.
■ If you wish to do the Extension to the investigation,measure 15 strips of magnesium ribbon with a mass of 0.3 g, and prepare the following volumes of HCl(aq) priorto the laboratory date.
■ Unknown A: 10 mL 0.125 mol/L HCl(aq) � 40 mLde-ionized water (4 flasks).
■ Unknown B: 15 mL 0.125 mol/L HCl(aq) � 35 mLde-ionized water (4 flasks).
Materials
■ 125 mL Erlenmeyer flask■ stirring rod■ 500 mL wash bottle■ waste container■ electronic balance■ CuCl2(s)■ aluminium foil■ de-ionized water■ Mg(s) ribbon■ 0.125 mol/L HCl(aq)
When to Begin What to Do
1 day before ■ Set up student stations. ■ Collect apparatus.■ Provide each student with
BLM 8.1.6 (HAND)Investigation 8.A: TheLimiting Reactant and havestudents complete thePrediction.
When to Begin What to Do
2 to 3 weeks before ■ Ensure all materials andchemicals are available.
2 to 3 days before ■ Measure the mass ofaluminium and copper(II)chloride (and Mg(s) andvolumes of HCl(aq) if youare planning to do theExtension).
■ Test all reagents to ensurethe reaction goes tocompletion as expectedand to determine theapproximate length of timethat the reaction will need.

4-44 MHR • Unit 4 Quantitative Relationships in Chemical Changes
■ Unknown C: 25 mL 0.125 mol/L HCl(aq) � 25 mLde-ionized water (4 flasks).
■ Unknown D: 30 mL 0.125 mol/L HCl(aq) � 20 mLde-ionized water (4 flasks).
In Unknowns A and B, the HCl(aq) is limiting, and inUnknowns C and D, the magnesium is limiting. If youwish to simplify this portion of the lab, prepare all theflasks with the same amounts of HCl(aq).
■ This lab can be performed as a demonstration in front ofthe class to reduce chemicals and clean up. The flask whenplaced on a white sheet of paper will be visible at the backof a regular-sized classroom. Model making observationsand lead a discussion while the reaction proceeds tocompletion.
■ Use BLM 8.1.6 (HAND) Investigation 8.A: TheLimiting Reactant and BLM 8.1.6A (ANS) Investigation8.A: The Limiting Reactant Answer Key to support thisactivity. Remove sections as appropriate to meet the needsof the students in your class.
■ Expected Results Copper (II) chloride is the limitingreactant. When the reaction is complete and thealuminium is no longer visible, the solution will remainblue because there is still some Cu2+ in the solution.
Safety PrecautionsEnsure students read and understand “Safety in
Your Chemistry Lab and Classroom” in the student textbook(pages xii-xv). The reaction mixture may get very hot. Instructthe students not to hold the flask as the reaction proceeds. Theycan gently swirl the flask while on the laboratory bench. Makesure you have the necessary equipment available to clean up glass,should a flask break during the reaction. Dispose of all materialsin a proper waste container.
Answers to Analysis Questions1. The CuCl2(aq) was the limiting reactant because the blue
colour of the original solution completely disappeared.
2. The Al(s) was present in excess because small pieces ofAl(s) remained in the flask at the end of the reaction.
3. If the students correctly calculated the prediction, theirobservations should match. CuCl2(aq) was the limitingreactant and should be completely consumed in the reaction.
Answer to Conclusion Question4. In the reaction between 0.25 g of Al(s) and 0.51 g of
CuCl2(aq), CuCl2(aq) was determined to be the limitingreactant because the blue colour caused by the Cu2+(aq)completely disappeared during the course of the reaction,while small pieces of Al(s) remained. These observationswere supported by the stoichiometric calculationsperformed in the prediction. Based on the results of thisexercise, stoichiometric calculations appear to be aneffective way to predict limiting and excess reactants.
Answer to Extension Question5. (a) The solid magnesium ribbon would be completely
consumed (the metal would disappear) in the reactionif the magnesium were the limiting reactant. If thehydrochloric acid were limiting, small pieces of themagnesium would remain at the end of the reaction.
(b) Place the Mg(s) in the HCl(aq) and observe thereaction. If the bubbling, due to production of H2(g),stops and there is Mg(s) remaining, then the HCl(aq)is the limiting reactant. If the Mg(s) is used upcompletely, then it is likely the limiting reactant,although the possibility exists that there may bestoichiometric quantities of both. A second test canbe carried out to ensure that Mg(s) is the limitingreactant by adding a second piece of Mg(s) to thesolution. If bubbles are produced, this confirms thatthere is HCl(aq) left from the previous reaction andMg(s) is definitely the limiting reactant.
Assessment Options■ Collect and assess students’ predictions.■ Collect and assess students’ responses to the Analysis,
Conclusion, and Extension questions.■ Use Assessment Checklist 3 Performance Task Self-
Assessment to assess student participation.■ You could also use parts of Assessment Checklist 5
Learning Skills and Assessment Checklist 6 Using Math in Science.
Answers to Practice Problems 7-12Student Textbook page 303
For full solutions to the practice problems, visitwww.albertachemistry.ca, Online Learning Centre,Instructor Edition, Full Solutions.
7. The limiting reagent is Mg(NO3)2(aq)
8. 4 g
9. Since HgCl2(aq) is the limiting reagent, there is sufficientNa2S(aq) to precipitate all of the Hg2+(aq) ions from thesolution.
10. 15 g
Pb(NO3)2(aq) + 2KI(aq) → PbI2(s) + 2KNO3(aq)
11. (a) CuSO4(aq) + Sr(NO3)2(aq) →Cu(NO3)2(aq) + SrSO4(s)
(b) The filtrate will be red.
(c) Priti should expect approximately 1.47 g ofprecipitate.
(d) The percentage yield is 97.4%.
12. (a) Na2SiO3(aq) + 2AgNO3(aq) →Ag2SiO3(s) + 2NaNO3(aq)
(b) Since the concentration and volume of silver nitrate,AgNO3(aq), produces less precipitate, it is thelimiting reagent.

(c) The predicted yield is 4.9 g Ag2SiO3(s).
(d) Yes, all of the silver ions would be removed from thesolution since all of the limiting reagent, which in thiscase is AgNO3(aq), is consumed in the reaction.
Section 8.1 Review AnswersStudent Textbook page 304
1. You need not consider reactants that are in excess, as theydo not determine the yield of the reaction; only thelimiting reactant will influence the yield. Studentanalogies will vary. Most students will provide analogies ofrecipes.
2. (a) The O2(g) will be in excess because the amount ofP4(s) is set, while the quantity of oxygen in air isvirtually limitless.
(b) Gold is far too expensive to be in excess. Due to itsprohibitive cost, a chemist would want to use all thegold in the reaction.
(c) The characteristics of a reactant that would make itsuitable as an excess reactant would be low cost, highsolubility (because most reactions take place in water),and ease of disposal (non-toxic).
3. Cu(s) � 4HNO3(aq) →Cu(NO3)2(aq) � 2NO2(g) � 2H2O(�)
m � 57.4 g m � 140 g m � ? g
M � 63.55 g/mol M � 63.02 g/mol M � 187.57 g/mol
If Cu(s) is limiting:
mCu(NO3)2� 57.4 g Cu × �613.
m55
olgCCuu
�
�1 m1ol
mCoul(CN
uO3)2� ×
� 169 g
If HNO3 (aq) is limiting:
mCu(NO3)2� 140 g HNO3 × �613.
m02
olgHHNNOO
3
3� ×
�1
4m
mol
oCl H
u(NN
OO
3
3)2� ×
� 104 g
(a) Since the HNO3(aq) will produce the least amount ofproduct, it is the limiting reactant. Therefore, theCu(s) is the reactant in excess.
(b) The mass of Cu(NO3)2(aq) that could be obtained is156 g.
4. 2CaCO3(s) � 2SO2(g) � O2(g) →2CaSO4(s) � 2CO2(g)
m � 2000 kg m � 1000 kg
M � 100.09 g/mol M � 64.07 g/mol
If CaCO3(s) is limiting:
mSO2 � 2000 kg CaCO3 �1010m.0
o9lgC
CaC
aCO
O3
3� ×
�2
2m
mol
oCl S
aCO
O2
3� × �
614.
m07
olgSSOO
2
2�
� 1280 kg
According to the previous calculation, the quantity ofSO2(g) that can be removed is 1280 kg. Since only 1000 kg is present, it will be completely removed.
5. Pb(NO3)2(aq) � Na2SiO3(aq) → PbSiO3(s) � 2NaNO3(aq)
m � 7.16 g m � 20 g m � ? g
M � 331.23 g/mol M � 122.07 g/mol M � 283.30 g/mol
If Pb(NO3)2(aq) is limiting:
mPbSiO3 � 7.16 g Pb(NO3)2 �3311m.2
o3lgPb
P(bN(N
OO3)
3
2
)2� ×
�1
1m
mol
olP
Pb(
bNSi
OO
3
3
)2� �
2813m.3
o0lgPb
PSbiSOiO
3
3�
� 6.1 g
If Na2SiO3(aq) is limiting:
mPbSiO3� 20 g Na2SiO3 �1212m.0
o7lgN
Na2
aS
2
iSOiO
3
3� ×
�11
mm
oollNPb
a2
SSiiOO
3
3� �
2813m.3
o0lgPb
PSbiSOiO
3
3�
� 46 g
Since the Pb(NO3)2 produces the least amount ofproduct, it is the limiting reactant and the mass ofprecipitate to be collected will be 6.1 g.
6. (a) Zn(s) � CuCl2(aq) → Cu(s) � ZnCl2(aq)
(b) To analyze the reaction, students should record theinitial mass of zinc, final mass of zinc, initial colour ofthe solution, and final colour of the solution.
(c) The presence of the blue colour indicates Cu2+(aq)ions are left over at the end of the reaction, makingCuCl2(aq) the reactant in excess.
(d) Zn(s) � CuCl2(aq) → Cu(s) � ZnCl2(aq)
m� ? g m � 3.12 g
M � 65.39 g/mol M � 134.45 g/mol
mZn � 3.12 g CuCl2 × �1314m.4
o5lgC
CuC
uCl2
l2� ×
�1
1m
mol
oCl Z
uCn
l2� × �
1615m.3
o9lgZ
Zn
n�
� 1.52 g
The stoichiometric amount of Zn(s) required to reactwith the CuCl2(aq) was 1.52 g. Since some CuCl2(aq)
187.57 g Cu(NO3)2���
1 mol Cu(NO3)2
187.57 g Cu(NO3)2���
1 mol Cu(NO3)2
4-45Chapter 8 Applications of Stoichiometry • MHR

4-46 MHR • Unit 4 Quantitative Relationships in Chemical Changes
remained at the end of the reaction, the mass of zincpowder added must have been less than 1.52 g.
7. (a) Yes, all of the sulfuric acid was neutralized.
(b) 0.346 g of sodium hydrogen carbonate remained.
(c) 87 mL of carbon dioxide was produced.
(d) If sodium hydroxide was used to neutralize sulfuricacid, any excess sodium hydroxide would make thespill basic. When sodium hydrogen carbonate is used,the by-products are a neutral salt (sodium sulfate),carbon dioxide, and water. No acid or base remains.
8. Wear gloves, goggles, and an apron. Add a minimum of266 mL of a 1.00 mol/L solution of sodium chloride tothe silver nitrate. (For the sake of safety, it would be wiseto use 300 mL of sodium chloride.) The silver ions willprecipitate out in the form of silver chloride. Filter thesolution using a funnel lined with filter paper situated inan Erlenmeyer flask. Dispose of the filter paper with theprecipitate in a solid waste container or dry it and placethe silver chloride in a labelled container. A total of about29 g of silver in the form of silver chloride will berecovered from the solution.
8.2 Predicted and Experimental YieldStudent Textbook pages 305-311
Section OutcomesIn this section, students will:■ calculate the quantities of reactants and products involved
in chemical reactions using gravimetric stoichiometricratios from chemical equations
■ interpret stoichiometric ratios from chemical equations■ perform stoichiometric calculations to determine predicted
yields■ use appropriate SI notation, fundamental and derived
units, and significant digit rules when performingstoichiometric calculations
■ calculate predicted yield and determine experimental yield■ explain the discrepancy between predicted and
experimental yields, and calculate percentage yield
Key Termspredicted yieldexperimental yieldmechanical lossespercentage yield
Chemistry Background■ Predicted (theoretical) yield is the amount of product that
would be produced assuming the limiting reactant wascompletely consumed in the reaction. Chemical reactions arerarely simple, however. Reversibility of reactions, competingreactions, and experimental error all contribute to thereduced recovery of a product. Chemists will alter reaction
conditions and measure the amount of product obtained.Calculation of percentage yield allows scientists to easilyidentify those conditions that produce the maximum yield.
■ Quantitative analysis allows chemists to predict theamount of product that will be produced in a reaction,given a specific amount of reactant, and to assess theperformance of a particular chemical process. Qualitativeanalysis allows for only the identification of ions inaqueous solutions. In this type of analysis, the presence orabsence of a particular ion is determined and is usuallyused to screen samples for further quantitative student. Forexample, samples of water could be screened for presenceof lead(II) ions. Qualitative analysis is dependant on theconcentration of ions in the solution; when dealing withvery dilute samples, concentration of the solution throughevaporation might be performed prior to screening.
Teaching Strategies■ Stress the fact that the calculations used in stoichiometry
provide an idealized yield that can only be obtained if thereaction is carried out to completion under the properconditions. Have students recall their laboratoryexperiences and compile a list of reasons why predictedyields are not always met. Factors that can be included are:errors in measurement, spills and lab mishaps, incompletereactions, and other competing rections.
■ Continue to reinforce the problem-solving techniques thathave been developed in Chapter 7 and Section 8.1.
■ A quiz has been prepared for this section. You will find itwith the Chapter 8 BLMs on the CD-ROM thataccompanies this Teacher’s Resource or atwww.albertachemistry.ca, Online Learning Centre,Instructor Edition, BLMs.Number (Type) Title8.2.1 (AST) Percentage Yield Problems8.2.1A (ANS) Percentage Yield Problems Answer Key
If students are having difficulty grasping the percentage yieldcalculation, approach the problem by using the calculation ofclassroom marks as an example. If the maximum mark on a test is50, and a student achieves a 38, what is the student’s percentageyield? Once they understand they need to calculate percentages,go back to a stoichiometric problem and have them apply the sameprocess.
Answers to Questions for ComprehensionStudent Textbook page 307
Q2. (a) The following five factors can limit or reduce theyield of a chemical reaction: a competing reaction,collection and transfer methods, reactant purity, areaction that does not proceed to completion, and aslow reaction.
4-47Chapter 8 Applications of Stoichiometry • MHR
(b) The predicted yield is higher than the experimentalyield for a reaction, because predicted yield is themaximum quantity of product expected from areaction and is rarely met.
Q3. 64%
Answers to Practice Problems 13-19Student Textbook pages 308–309
For full solutions to the practice problems, visitwww.albertachemistry.ca, Online Learning Centre,Instructor Edition, Full Solutions.13. (a) 11.4 g Cu(s)
(b) 79% yield
14. 60% yield
15. Trial 1: 95.5%, Trial 2: 94.3%, and Trial 3: 97.2%
Average is 95.7%.
16. 95.2% yield
17. 26.7% yield
18. (a) 2.88 g
(b) 97.3% yield
19. (a) 15.0 g
(b) 10.5 g
(c) 12.8 g
Investigation 8.B: Determining the Percentage Yield of a Chemical Reaction
Student Textbook pages 309–310
PurposeThe purpose of this investigation is to calculate the percentageyield for a reaction between steel wool and copper(II)chloride. Students will also examine potential sources of errorand ways to improve the yield for this reaction.
Outcomes■ 20–D1.5k ■ ICT C6–4.1■ 20–D1.1s ■ ICT C6–4.3■ 20–D2.3k ■ AI–NS3■ 20–D2.4k ■ AI–NS4■ IP–NS3 ■ PR–NS2, 3, 4, 5
Advance Preparation
Time Required60 minutes
Helpful Tips■ Use dry, fine steel wool. This can be obtained at a local
hardware store or building centre.■ The filtered copper should be collected and disposed of
appropriately, or used for other laboratory investigations.■ Inform students that they are basing their calculations on
the assumption that the steel wool is 100% iron.■ Have students print their names with pencil on the filter
paper before taking the initial weight so that they canidentify their filter paper after it has dried.
■ Use a pipette to flow the acid down around the perimeteredge of the filter paper when performing Step 9.
Materials
■ 50.0 mL beaker■ 250 mL beaker■ 250 mL Erlenmeyer flask■ plastic funnel■ retort stand■ wash bottle■ drying oven (if available)■ stirring rod■ ring clamp or funnel rack■ filter paper■ electronic balance■ large watch glass■ waste container■ CuCl2•2H2O(s)■ 1 mol/L HCl(aq)■ rust-free, degreased steel wool■ de-ionized water
When to Begin What to Do
2 to 3 days before ■ Test all reagents to ensurethe reaction goes tocompletion as expectedand to determine theapproximate length of timethat the reaction will need.
1 day before ■ Set up student stations. ■ Collect apparatus.■ Provide each student with
BLM 8.2.2 (HAND)Investigation 8.B:Determining thePercentage of a ChemicalReaction and have studentscomplete the prediction.
When to Begin What to Do
2 to 3 weeks before ■ Ensure all materials andchemicals are available.

4-48 MHR • Unit 4 Quantitative Relationships in Chemical Changes
■ Use BLM 8.2.2 (HAND) Investigation 8.B: Determiningthe Percentage Yield of a Chemical Reaction and BLM8.2.2A (ANS) Investigation 8.B: Determining thePercentage Yield of a Chemical Reaction Answer Key tosupport this activity. Remove sections as appropriate to meetthe needs of the students in your class.
Safety PrecautionsEnsure students read and understand “Safety in Your Chemistry Lab and Classroom” in the student textbook (pages xii-xv). Hydrochloric acid is corrosive.
Wash any spills on skin or clothing with plenty of cool water.Make sure the eye wash station has been tested recently andany eye wash bottles are filled. Dispose of all materials in aproper waste container.
Answers to Analysis Questions1. Fe(s) � CuCl2(aq) → Cu(s) � FeCl2(aq)
m � 1.00 g m � ? g
M � 55.85 g/mol M � 134.45 g/mol
mCuCl2 � 1.00 g Fe × �515.
m85
olgFFee
� × �1 m
1omloCluFCe
l2� ×
�13
14m.4
o5lgC
CuC
uCl2
l2�
� 2.41 g
Since 1.00 g of Fe(s) required only 2.41 g of CuCl2(aq) tocompletely react, the addition of 5.00 g of this reactantensures it is the reactant in excess.
2. Sources of error can include product loss duringdecanting, an incomplete reaction between the iron andcopper(II) chloride, the product not being completely dry,or impure iron in the steel wool.
3. Percentage yield could be improved by altering the type ofsteel wool used, increasing the concentration of thecopper(II) chloride, using a more careful laboratorytechnique, or allowing for a longer drying period.
Answer to Conclusion Question
4. Use the formula
Percentage Yield ��Ex
Ppreerdimict
eendtaYliYel
ideld
� × 100%
Students’ will solve using the mass of copper obtained fromthe experiment and their prediction.
Answer to Extension Question5. (a) The precision of a result is related to the sensitivity of
the equipment used to make the measurements.
(b) The precision of the result could be improved byusing more sensitive measuring instruments.
(c) The accuracy of the result may have been affected bypoor experimental technique, such as a loss of
product during decanting or the product not beingcompletely dry before measuring. An incompletereaction or impure reactants also may have affectedthe accuracy of the result.
(d) Students should list factors such as improvedexperimental technique and higher quality steel wool.
Assessment Options■ Collect and assess students’ predictions.■ Collect and assess students’ responses to the Analysis and
Conclusion questions.■ Use Assessment Checklist 3 Performance Task Self-
Assessment to assess student participation.■ Use parts of Assessment Checklist 5 Learning Skills and
Assessment Checklist 6 Using Math in Science.
Section 8.2 Review AnswersStudent Textbook page 311
1. The units used when calculating a percentage yield of aproduct would have no effect on the calculation, as theywill cancel in the equation.
2. If the limiting reactant is impure, the percentage yield ofthe reaction would decrease, because the amount oflimiting reagent would be less than what was used in theprediction.
3. (a) C7H6O4(s) + CH3OH(�) → C8H8O3(�) + H2O(�)
m = 3.50 g m = ?
M = 138.13 M = 152.16
m(C8H8O3) = 3.50 g C7H6O3 �1318m.1
o3lgC
C7H
7H6O
6O3
3�
× �11
mm
ooll
CC
8
7
HH
8
6
OO
3
3� �
1512m.1
o6lgC
C
8H8H
8O8O
3
3�
= 3.86 g
(b) C7H6O4(s) + CH3OH(�) → C8H8O3(�) + H2O(�)
m = 3.50 g - 2.84 g
m = 0.66 g m = ?
M = 138.13 M = 152.16
m(C8H8O3) = 0.66 g C7H6O3 �1318m.1
o3lgC
C7H
7H6O
6O3
3�
× �11
mm
ooll
CC
8
7
HH
8
6
OO
3
3� �
1512m.1
o6lgC
C
8H8H
8O8O
3
3�
= 0.727 g
(c) Percentage Yield ��Ex
Ppreerdimict
eendtaYliYel
ideld
� × 100%
� �03..78257505
gg
� × 100 %
� 18.886%
� 18.9%

4. (a) 2NaCl(aq) � Pb(NO3)2(aq) →PbCl2(s) � 2NaNO3(aq)
m � 0.58 g m � 3.50 g m � ? g
M � 58.44 g/mol M � 331.23 g/mol M �278.11 g/mol
If NaCl is limiting:
mPbCl2 � 0.58 g NaCl × �518.
m44
olgNNaaCCll
� ×
�12
mm
oollPNbaCCll2
� × �27
18m.1
o1lgPb
PCbC
l2
l2�
� 1.4 g
If Pb(NO3)2 is limiting:
mPbCl2 � 3.50 g Pb(NO3)2 �3311m.2
o3lgPb
P(bN(N
OO3)
3
2
)2�
× �1 m1
omloPlbP(bNCOl2
3)2� × �
2718m.1
o1lgPb
PCbC
l2
l2�
� 2.94 g
Since the NaCl(aq) produces the least amount ofproduct, it is the limiting reactant and the mass ofprecipitate to be collected will be 1.4 g.
(b) Percentage Yield ��Ex
Ppreerdimict
eendtaYliYel
ideld
� × 100 �
�11..2328
gg
� × 100 � 88%
The percentage yield is 87%.
5. (a) Cr2O3(s) � 2Al(s) → Al2O3(s) � 2Cr(�)
m � 100 g m � 54 g m �?g
M � 152.00 g/mol M � 26.98 g/mol M � 52.00 g/mol
If Cr2O3 is limiting:
mCr � 100 g Cr2O3 × �1512m.0
o0lgC
Cr2
rO
2O3
3� ×
�1
2m
mol
oClrC
2Or
3� × �
512.
m00
olgCCrr
�
� 68 g
If Al is limiting:
mCr � 54 g Al × �216.
m98
olgAAll
� × �11
mm
oollCA
rl
�
× �512.
m00
olgCCrr
�
� 104 g
Since the Cr2O3(s) produces the least amount ofproduct, it is the limiting reactant and the mass ofprecipitate to be collected will be 68 g.
(b) Percentage Yield ��Ex
Ppreerdimict
eendtaYliYel
ideld
� × 100
� �6680.4
gg
� × 100 � 88%
The percentage yield is 88%.
6. The design should include dissolving a known mass ofsilver nitrate in water and reacting it with excess copper
metal. The reaction should be allowed to go tocompletion, and the silver metal should be recovered byfiltration. The predicted yield of product can becalculated stoichiometrically from the mass of the silvernitrate. The percentage yield can be calculated using themass of silver metal collected in the experiment and thepredicted yield.
7. Using cool solvent removes traces of reactants or otherproducts from the precipitate during rinsing. Some of theprecipitate will also dissolve in the solvent, but this is limited.
8. It is important for chemists to know the purity of theirreactants because impurities can result in reduced yields.
8.3 Acid-Base TitrationStudent Textbook pages 312-322
Section OutcomesIn this section, students will:■ describe the function and choice of indicators in titrations■ draw pH titration curve graphs using data from titration
experiments involving strong monoprotic acids and strongmonoprotic bases
■ interpret pH titration curve graphs using data fromtitration experiments involving strong monoprotic acidsand strong monoprotic bases
■ identify equivalence points on strong monoproticacid–strong monoprotic base pH titration curves
■ differentiate between the indicator endpoint and theequivalence point
■ calculate the quantities of reactants and products involvedin neutralization reactions
Key Termstitrationtitrantequivalence pointendpointstandardizingburettepH titration curve
Chemistry Background■ Titration is a technique where a solution of a known
concentration is used to determine the concentration of anunknown solution. The titrant (usually the knownsolution) is added from a burette to a known quantity ofthe analyte (usually the unknown solution) until thereaction is complete. When the titrant has reacted with theanlayte completely, the equivalence point or thestoichiometric endpoint has been reached. An indicator isoften used to signal the end of the reaction. Terms forvarieties of titration can reflect the type of reactionbetween the titrant and analyte: acid-base,complexometric, chelatometric, oxidation-reduction, and
4-49Chapter 8 Applications of Stoichiometry • MHR

precipitation titrations. Additionally, the terms can reflectthe nature of the titrant, such as acidometric, alkalimetric,and iodometric titrations, as well as coulometric titrations,in which the titrant is generated electrolytically rather thanbeing added as a standard solution. Titration is a standardtechnique that is used extensively in quantitative analysisand will be used again in Chemistry 30.
■ Solutions must be standardized before they can be used tomeasure the concentration of the unknown. Standardsubstances are chosen because they are relatively reactive(e.g., hydrochloric acid is a strong acid, sodium hydroxideis a strong base, potassium permanganate is a strongoxidizing agent) and relatively cheap to purchase.Unfortunately, these substances are not primary standards,and must be standardized prior to use.
■ Indicators are weak acids or weak bases. The undissociatedform of the substance is a different colour than thedissociated form. Indicators change colour over a range ofhydrogen ion concentrations and this colour change intervalis expressed as a pH range. Many fruits, vegetables, andflowers contain natural indicators.
■ Titrations are often recorded as titration curves or pHcurves. The manipulated variable is the volume of thetitrant, while the responding variable is the pH of theresulting solution. The equivalence point is a significantpoint on the graph and can be calculated (beyond thescope of high school chemistry) or estimated throughinspection. In this section, only strong monoprotic acid-strong monobasic base pH curves will be examined,however, analysis of weak acid-strong base and strong acid-weak base pH curves will be included in Chemistry 30(Chapter 15).
Helpful ResourcesJournal Articles■ Arasasingham, R.D., Taagepera, M., Potter, F., and
Lonjers, S. “Using Knowledge Space Theory to AssessStudent Understanding of Stoichiometry,” Journal ofChemical Education, Vol. 81, No. 10, October 2004,p.1517.
■ Ault, A. “How to Say How Much: Amounts andStoichiometry,” Journal of Chemical Education, Vol. 78,No. 10, October 2001, p. 1345.
■ Cook, E. and Cook, R.L. “Cross-Proportions: AConceptual Method for Developing Quantitative Problem-Solving Skills,” Journal of Chemical Education, Vol. 82, No.8, August 2005, p. 1187.
■ Gabel, D. “Improving Teaching and Learning throughChemistry Education Research: A Look to the Future,”Journal of Chemical Education, Vol. 76, No. 4, April 1999,p. 548.
■ Krieger, C.R. “Stoogiometry: A Cognitive Approach toTeaching Stoichiometry,” Journal of Chemical Education,Vol. 74, No. 3, March 1997, p. 306.
■ Lin, H. and Cheng, H. “The Assessment of Students andTeachers’ Understanding of Gas Laws,” Journal of ChemicalEducation, Vol. 77, No. 2, February 2000, p. 235.
■ Rohrig, B, “Fizzy Drinks: Stoichiometry You Can Taste,”Journal of Chemical Education, Vol. 77, No. 12, December2000, p. 1608B.
Teaching Strategies■ A number of overhead masters and quizzes have been
prepared for this section. You will find them with theChapter 8 BLMs on the CD-ROM that accompanies thisTeacher’s Resource or at www.albertachemistry.ca, OnlineLearning Centre, Instructor Edition, BLMs.Number (Type) Title8.3.1 (AST) Acid-Base Titration8.3.1A (ANS) Acid-Base Titration Answer Key8.3.2 (OH) Titration Step-by-Step8.3.3 (AST) Titration Problems8.3.3A (ANS) Titration Problems Answer Key8.3.5 (OH) pH Titration Curves and Indicators8.3.6 (AST) Selecting an Indicator8.3.6A (ANS) Selecting an Indicator Answer Key
■ Review BLM 7.2.4 (HAND) Solution StoichiometryTutorial. The process students have previously used tosuccessfully solve stoichiometry problems applies to acid-base neutralization problems as well.
■ Challenge students to generate a list of practicalapplications of titrations outside of the chemistryclassroom. Applications may include determining theacidity of carbonated beverages, monitoring industrialprocesses, and determining the concentrations ofhousehold cleaners.
■ Emphasize safety at all times during titration experiments.Ensure that students handle concentrated solutions andglass equipment carefully. Demonstrate how to use apipette and burette. If possible, provide students withpipettes and burettes and have them practice filling andreading the volumes with deionized water.
■ Use BLM 8.3.3 (AST) Titration Problems to givestudents additional practice in analyzing titration data. Itcontains problems in which titration data is provided for anumber of experiments. Students will calculate theconcentrations of various reactants using the data.
■ Produce a titration curve in class by titrating a sample ofhydrochloric acid with sodium hydroxide, and bymonitoring the pH with a pH meter. The pH can bemeasured after the addition of 1.00 mL of base (0.1 mLnear the equivalence point). Have a student read out thepH measurements as you add the titrant. The class couldplot the data points graphically. The students could thencompare this curve to the one produced by calculation inthe Thought Lab in this section.
4-50 MHR • Unit 4 Quantitative Relationships in Chemical Changes

4-51Chapter 8 Applications of Stoichiometry • MHR
■ In this section, many new words are introduced. Encouragestudents who are having difficulty understanding the newterminology to create a 4-point dictionary. On an index card,students write the word on one side and on the opposite sidewrite the definition from the glossary, a definition in their ownwords, draw a diagram (or structure), and provide examples.These cards can be used as flash cards for studying.
■ ESL Students: Use pencil crayons to show the colour of theindicator over the number line. This will help the studentsassociate the colour of the indicator with the name of the colour.
■ Students who are colourblind may have difficulty perceiving thecolour change of an indicator. Pair these students with otherswho can see the colour change. Alternatively, consider givingthese students the opportunity to work with a pH meter.
Answers to Questions for ComprehensionStudent Textbook 314
Q4. The titrant is found in the burette. In this example thetitrant is HCl(aq).
Q5. (a) Standardization is using a standard solution (asolution with a precisely known concentration) todetermine the concentration of another solution bytitration.
(b) Strong acids need to be standardized because overtime the acid concentrations changes.
(c) Strong bases need to be standardized as theconcentration changes over time, because they tend toabsorb carbon dioxide from the air.
Q6. In a titration, an indicator is added which has an endpoint(i.e., changes colour) very close to the equivalence point ofthe reaction. The purpose of an indicator is to provide avisual cue that equivalence point has been reached.
Q7. (a) 1.5 mol of HCl(aq) are required to neutralize 1.5 molof KOH(aq) since the mole ratio of HCl(aq) :KOH(aq) is 1:1. The equivalence point occurs whenan equal amount (in mol) of HCl(aq) has been addedto KOH(aq).
(b) 0.8 mL KOH(aq)
Answers to Practice Problems 20-25Student Textbook 315
For full solutions to the practice problems, visitwww.albertachemistry.ca, Online Learning Centre,Instructor Edition, Full Solutions.20. 1 mol/L
21. 0.210 mol/L
22. 0.19 mol/L
23. 0.26 mol/L KOH(aq)
24. (a) 3 × 101 mL
(b) By performing this calculation before the titration,you know approximately the volume of titrant thatwill be used. The NaOH(aq) can be added quickly upto a few mL of the endpoint, then proceed to titrateslowly towards the endpoint. Therefore, time is savedin performing the titration.
25. 0.524 mol/L
Investigation 8.C: Standardizing a Hydrochloric Acid Solution
Student Textbook pages 316-317
PurposeThe purpose of this investigation is to standardize a solutionof hydrochloric acid using a primary standard of sodiumcarbonate. Students will gain familiarity with commonlaboratory glassware, techniques of titration, and will observethe colour change of an indicator.
Outcomes■ 20–D2.4s
Advance Preparation
When to Begin What to Do
2 to 3 weeks before ■ Ensure all materials andchemicals are available.
1 week before ■ Prepare the solutions.(Refer to BLM 5.4.4 (HAND)Preparing Solutions)
2 to 3 days before ■ Set up the student stations. ■ Collect the materials.
1 day before ■ Titrate the hydrochloric acidsolution and calculate itsconcentration.
■ Provide each student withBLM 8.3.4 (HAND)Investigation 8.C –Standardizing a Solution ofHydrochloric Acid Solutionand provide the studentswith the prediction.

4-52 MHR • Unit 4 Quantitative Relationships in Chemical Changes
Time Required60 minutes
Helpful Tips■ Students often run out of time before they can repeat
enough trials for a more reliable average result. If possible,students should practice the technique of pipetting andtitrating before attempting a full investigation.
■ Quickly run through a demonstration of the technique forstudents. Some students will forget about proceduresdiscussed in class on a previous day.
■ Use an approximate concentration of 0.20 mol/L to 0.25 mol/L for the hydrochloric acid. Having the titrationvolume between 10 mL to 20 mL gives the studentspractice titrating without using too much solution orproducing too much waste. Because the students are notgiven an exact amount of sodium carbonate to use for theirstandard solution, there will be a range of titrationvolumes. Students could weigh a given amount so thatthey all have the same concentration for their standard, butas long as the concentration of the standard is known, thestandard can be used.
■ Use BLM 8.3.4 (HAND) Investigation 8.C:Standardizing a Hydrochloric Acid Solution and BLM8.3.4A (ANS) Investigation 8.C: Standardizing aHydrochloric Acid Solution Answer Key to support thisactivity. Remove sections as appropriate to meet the needsof the students in your class.
Safety Precautions
■ Ensure students read and understand “Safety in YourChemistry Lab and Classroom” in the front matter of thestudent textbook (pages xii-xv).
■ Hydrochloric acid is corrosive. Wash any spills on skin orclothing with plenty of cool water. Make sure eye washstation has been tested recently and any eye wash bottlesare filled.
■ Dispose of all materials down the drain.
Answers to Analysis Questions1. (a) Students should show clearly their calculations for
their answer to this question. Understanding theprocess is more important at this stage of learningthan attaining high accuracy. Lab skills will developwith experience.
Sample answer:
Vave �
� 13.65 mL
(b) Performing multiple trials allows students to useaverage volumes in calculations. This diminishes theeffect of random errors.
2. Na2CO3(aq) � 2HCl(aq) → 2NaCl(aq) � H2CO3(aq)OR
Na2CO3(aq) � 2HCl(aq) →2NaCl(aq) � H2O(�) � CO2(g)
3. Students’ answers should be close to the value of 0.125 mol/L that was prepared. Assuming that the massof the sodium carbonate used to make the standardsolution is 0.90 g, and using the average volume ofHCl(aq) of 13.65 mL, a sample calculation is as follows:
c HCl(aq) � �0
1
.9
0
0
5.
g
99
N
g
a
/2
mCO
ol3
� × �1
1
0
0
.
0
0
.
0
0
m
m
L
L� ×
�12
mm
oollNH
aC
2Cl(a
Oq
3
)� × �
10010LmL� × �
13.615 mL�
� 0.124 mol/L
4. Any results outside the range of 0.120–0.130 mol/Lshould be discarded. The rest of the class results should beaveraged and used as the concentration for Investigation8.D.
Answers to Conclusion Questions5. The class average should be reasonably close to the value
of 0.125 mol/L.
6. Students’ answers will depend on the data they collect. Ingeneral the class average should be relatively close to theactual value of 0.125 mol/L, as the greater the number ofvalues used to calculate the class average, the moreaccurate the average becomes (one of the reasons scientists
13.60 mL � 13.65 mL � 13.70 mL����
3
Materials
■ phenolpthtralein■ deionized water■ 0.125 mol/L HCl(aq)■ standard grade sodium carbonate, Na2CO3(s)■ 50 mL burette■ 10 mL volumetric pipette■ 50 mL beaker■ 250 mL beaker■ 125 mL Erlenmeyer flasks (2)■ 100 mL volumetric flask■ glass stirring rod■ funnel■ meniscus reader■ pipette bulb■ retort stand■ burette clamp■ scoopula or spatula■ electronic balance
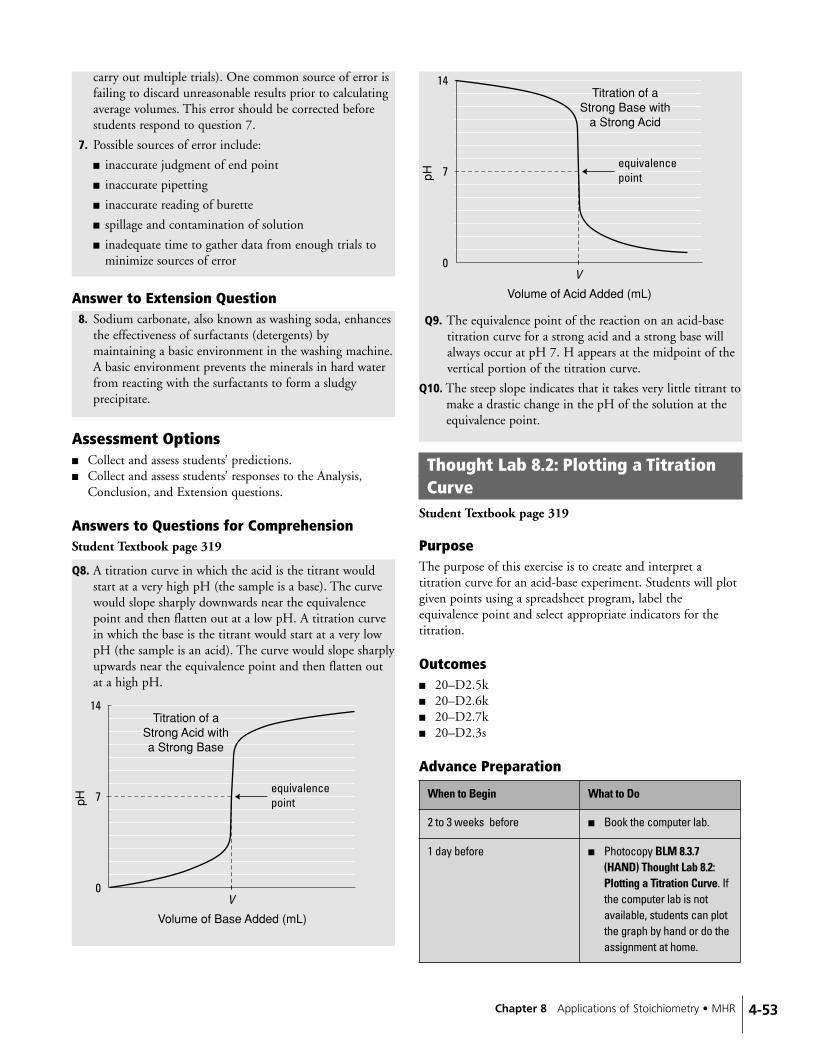
4-53Chapter 8 Applications of Stoichiometry • MHR
carry out multiple trials). One common source of error isfailing to discard unreasonable results prior to calculatingaverage volumes. This error should be corrected beforestudents respond to question 7.
7. Possible sources of error include:
■ inaccurate judgment of end point
■ inaccurate pipetting
■ inaccurate reading of burette
■ spillage and contamination of solution
■ inadequate time to gather data from enough trials tominimize sources of error
Answer to Extension Question8. Sodium carbonate, also known as washing soda, enhances
the effectiveness of surfactants (detergents) bymaintaining a basic environment in the washing machine.A basic environment prevents the minerals in hard waterfrom reacting with the surfactants to form a sludgyprecipitate.
Assessment Options■ Collect and assess students’ predictions.■ Collect and assess students’ responses to the Analysis,
Conclusion, and Extension questions.
Answers to Questions for ComprehensionStudent Textbook page 319
Q8. A titration curve in which the acid is the titrant wouldstart at a very high pH (the sample is a base). The curvewould slope sharply downwards near the equivalencepoint and then flatten out at a low pH. A titration curvein which the base is the titrant would start at a very lowpH (the sample is an acid). The curve would slope sharplyupwards near the equivalence point and then flatten outat a high pH.
Q9. The equivalence point of the reaction on an acid-basetitration curve for a strong acid and a strong base willalways occur at pH 7. H appears at the midpoint of thevertical portion of the titration curve.
Q10. The steep slope indicates that it takes very little titrant tomake a drastic change in the pH of the solution at theequivalence point.
Thought Lab 8.2: Plotting a Titration Curve
Student Textbook page 319
PurposeThe purpose of this exercise is to create and interpret atitration curve for an acid-base experiment. Students will plotgiven points using a spreadsheet program, label theequivalence point and select appropriate indicators for thetitration.
Outcomes■ 20–D2.5k■ 20–D2.6k■ 20–D2.7k■ 20–D2.3s
Advance Preparation
When to Begin What to Do
2 to 3 weeks before ■ Book the computer lab.
1 day before ■ Photocopy BLM 8.3.7(HAND) Thought Lab 8.2:Plotting a Titration Curve. Ifthe computer lab is notavailable, students can plotthe graph by hand or do theassignment at home.
V0
Volume of Acid Added (mL)
pH
Titration of aStrong Base with
a Strong Acid
14
7equivalencepoint
V0
Volume of Base Added (mL)
pH
Titration of aStrong Acid witha Strong Base
14
7equivalencepoint
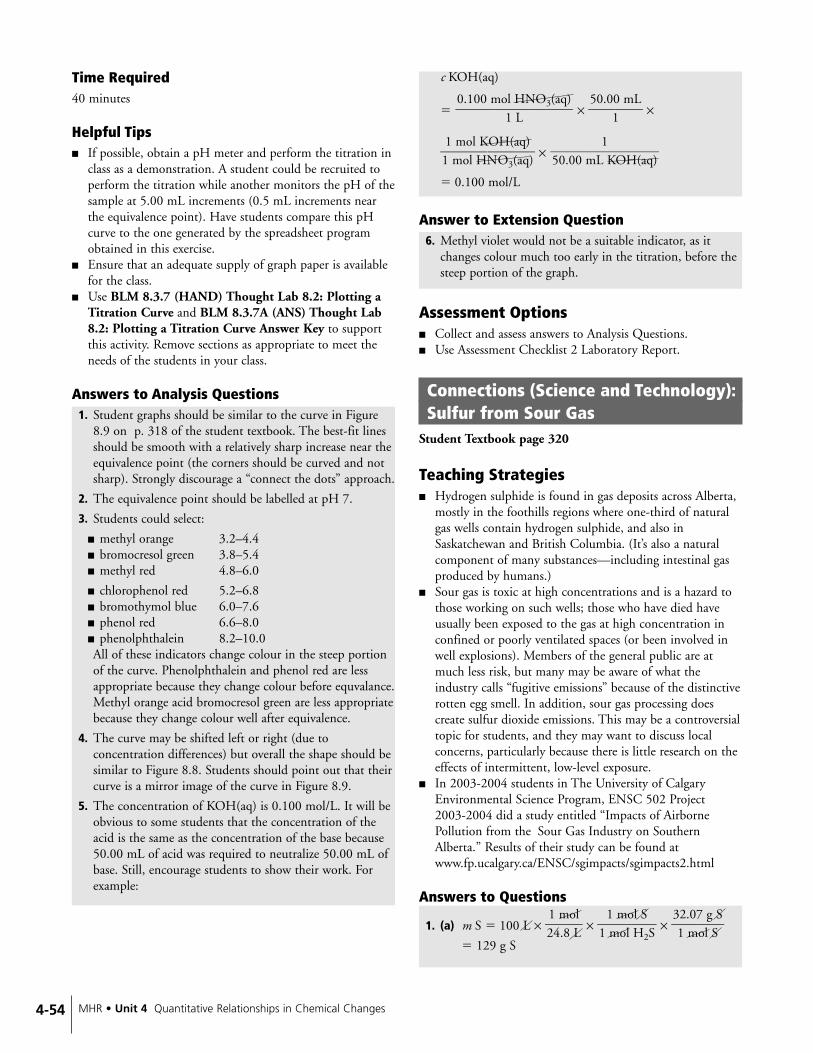
Time Required40 minutes
Helpful Tips■ If possible, obtain a pH meter and perform the titration in
class as a demonstration. A student could be recruited toperform the titration while another monitors the pH of thesample at 5.00 mL increments (0.5 mL increments nearthe equivalence point). Have students compare this pHcurve to the one generated by the spreadsheet programobtained in this exercise.
■ Ensure that an adequate supply of graph paper is availablefor the class.
■ Use BLM 8.3.7 (HAND) Thought Lab 8.2: Plotting aTitration Curve and BLM 8.3.7A (ANS) Thought Lab8.2: Plotting a Titration Curve Answer Key to supportthis activity. Remove sections as appropriate to meet theneeds of the students in your class.
Answers to Analysis Questions1. Student graphs should be similar to the curve in Figure
8.9 on p. 318 of the student textbook. The best-fit linesshould be smooth with a relatively sharp increase near theequivalence point (the corners should be curved and notsharp). Strongly discourage a “connect the dots” approach.
2. The equivalence point should be labelled at pH 7.
3. Students could select:
■ methyl orange 3.2–4.4■ bromocresol green 3.8–5.4■ methyl red 4.8–6.0
■ chlorophenol red 5.2–6.8■ bromothymol blue 6.0–7.6■ phenol red 6.6–8.0■ phenolphthalein 8.2–10.0All of these indicators change colour in the steep portionof the curve. Phenolphthalein and phenol red are lessappropriate because they change colour before equvalance.Methyl orange acid bromocresol green are less appropriatebecause they change colour well after equivalence.
4. The curve may be shifted left or right (due toconcentration differences) but overall the shape should besimilar to Figure 8.8. Students should point out that theircurve is a mirror image of the curve in Figure 8.9.
5. The concentration of KOH(aq) is 0.100 mol/L. It will beobvious to some students that the concentration of theacid is the same as the concentration of the base because50.00 mL of acid was required to neutralize 50.00 mL ofbase. Still, encourage students to show their work. Forexample:
c KOH(aq)
� × �50.0
10 mL� ×
�11
mm
oollHK
NO
OH
3
((aaqq))
� ×
� 0.100 mol/L
Answer to Extension Question6. Methyl violet would not be a suitable indicator, as it
changes colour much too early in the titration, before thesteep portion of the graph.
Assessment Options■ Collect and assess answers to Analysis Questions.■ Use Assessment Checklist 2 Laboratory Report.
Connections (Science and Technology):Sulfur from Sour Gas
Student Textbook page 320
Teaching Strategies■ Hydrogen sulphide is found in gas deposits across Alberta,
mostly in the foothills regions where one-third of naturalgas wells contain hydrogen sulphide, and also inSaskatchewan and British Columbia. (It’s also a naturalcomponent of many substances—including intestinal gasproduced by humans.)
■ Sour gas is toxic at high concentrations and is a hazard tothose working on such wells; those who have died haveusually been exposed to the gas at high concentration inconfined or poorly ventilated spaces (or been involved inwell explosions). Members of the general public are atmuch less risk, but many may be aware of what theindustry calls “fugitive emissions” because of the distinctiverotten egg smell. In addition, sour gas processing doescreate sulfur dioxide emissions. This may be a controversialtopic for students, and they may want to discuss localconcerns, particularly because there is little research on theeffects of intermittent, low-level exposure.
■ In 2003-2004 students in The University of CalgaryEnvironmental Science Program, ENSC 502 Project2003-2004 did a study entitled “Impacts of AirbornePollution from the Sour Gas Industry on SouthernAlberta.” Results of their study can be found atwww.fp.ucalgary.ca/ENSC/sgimpacts/sgimpacts2.html
Answers to Questions
1. (a) m S � 100 L × �214m.8
oLl
� × �1
1m
mol
oHl S
2S� × �
312.
m07
olgSS
�
� 129 g S
1���50.00 mL KOH(aq)
0.100 mol HNO3(aq)���
1 L
4-54 MHR • Unit 4 Quantitative Relationships in Chemical Changes
4-55Chapter 8 Applications of Stoichiometry • MHR
(b) 2S(�) � 2H2O(�) � O2(g) → 2H2SO4(aq)
m � 1.00 kg v � ? L
M � 32.07 g/mol c � 6.0 mol/L
V H2SO4 � 1000 g S × �312.
m07
olgSS
� × �2 m
2oml H
ol2
SSO4
�
× �6.0 mo1lLH2SO4� � 5.2 L
2. The natural gas must go through further processing andincineration to extract another percent of H2S(g) from thegas. It is important to remove H2S(g) because whenH2S(g) is burned it creates SO2(g), which leads to theformation of acid rain.
Investigation 8.D: Titrating a Strong Base with a Strong Acid
Student Textbook page 321
PurposeThe purpose of this lab is to determine the concentration of asolution of sodium hydroxide. Students will perform atitration of the unknown solution with the hydrochloric acidthey standardized in Investigation 8.C and select anappropriate indicator.
Outcomes■ 20–D2.1s■ 20–D2.2s
Advance Preparation
Time Required60 minutes
Helpful Tips■ A sound procedure should include or demonstrate:
■ between 5 and 10 steps■ steps that are sufficient to obtain the kind of data
needed to answer the problem■ a good control of variables■ a step for cleaning the burette and pipette■ a suitable indicator and knowledge of what to observe
(the colour change at the endpoint)■ modest sample sizes (5 mL, 10 mL, 20 mL)■ repetition of the titration for accuracy■ clean-up/disposal considerationsThis list could be given to students to help them preparetheir procedure.
■ Use BLM 8.3.8 (HAND) Investigation 8.D: Titrating aStrong Base with a Strong Acid and BLM 8.3.8A (ANS)Investigation 8.D: Titrating a Strong Base with a StrongAcid Answer Key to support this activity. Remove sections asappropriate to meet the needs of the students in your class.
Materials
■ methyl orange, phenolphthalein, bromothymol blue (or othersuitable indicators)
■ deionized water■ 0.125 mol/L HCl(aq) (standarized in Investigation 8.C)■ 0.150 mol/L NaOH(aq)■ electronic balance ■ 50.0 mL burette■ 10.0 mL volumetric pipette■ 50 mL beaker■ 250 mL beaker■ 125 mL Erlenmeyer flasks (2)■ 100.0 mL volumetric flask■ glass stirring rod■ funnel■ meniscus reader■ pipette bulb■ retort stand■ burette clamp■ scoopula or spatula
When to Begin What to Do
1 day before ■ Titrate the sodiumhydroxide solution andcalculate its concentration.
■ Provide the students withan approximateconcentration in order tocomplete the prediction.
When to Begin What to Do
2 to 3 weeks before ■ Ensure all materials andchemicals are available.
1 week before ■ Prepare the solutions.(Refer to BLM 5.4.4 (HAND)Preparing Solutions)
3 days before ■ Provide the students withBLM 8.3.8 (HAND)Investigation 8.D – Titratinga Strong Base with aStrong Acid in order todesign the method.
2 days before ■ Take in student proceduresto ensure that each grouphas a workable design.
■ Set up the student stations. ■ Collect the materials.

■ Hydrochloric acid and sodium hydroxide are corrosive.Phenolphthalein solution is toxic and flammable. Makesure students inform you immediately if these substancesare spilled.
■ The following is an example procedure that usesbromothymol blue or phenolphthalein:– Using a pipette, place 10.0 mL of NaOH(aq) into an
Erlenmeyer flask and add 3 to 5 drops of bromothymolblue or phenolphthalein indicator.
– Set up the burette to contain HCl(aq).– Place 70 to 80 mL of HCl(aq) into a clean dry beaker.– Pour HCl(aq) into the burette using a funnel.– Record the initial burette reading to 0.1 mL.– Titrate the NaOH(aq) with HCl(aq) until a single drop
produces a permanent change from blue to bluish-greenif using bromothymol blue or from pink to clear if usingphenolphthalein.
– Record the final burette reading to 0.1 mL.– Repeat until three consistent volumes of hydrochloric
acid are obtained.
Safety Precautions
■ Ensure students read and understand “Safety in YourChemistry Lab and Classroom” in the front matter of theStudent Textbook (pages xii-xv).
■ Hydrochloric acid and sodium hydroxide are corrosive.Wash any spills on skin or clothing with plenty of coolwater. Make sure your eye wash station has been testedrecently and any eye wash bottles are filled.
Answers to Analysis Questions1. Students should clearly show their calculations for their
answer to this question. The average volume of titrantused should be approximately 1.2 times greater than thevolume of sample titrated.
2. NaOH(aq) � HCl(aq) → NaCl(aq) � H2O(�)
3. Students should clearly show their calculations for theiranswer to this question. The value should be close to0.150 mol/L.
Answers to Conclusion Questions4. Students’ answers will depend on their experimental
design. The value obtained should be close to 0.150 mol/L.
5. Possible sources of error include:
■ inaccurate judgment of endpoint
■ inaccurate pipetting
■ inaccurate reading of burette
■ spillage and contamination of solution
■ inadequate time to gather data from enough trials tominimize sources of error
6. Students’ answers will depend on the data they collect andthe errors they report. Suggested improvements should beconsistent with their reported errors. For example, ifstudents report they had an inaccurate endpoint, they maysuggest preparing a standard to which they will compare thecolour. A general “be more careful” is not adequate.
Answers to Extension Questions7. Since the drain cleaner is concentrated, it must be diluted
before it can be analyzed. If not, it would require a largevolume of acid to react. This would make the titrationlengthy and tedious.
8. Suggestions for bases could include: ammonia, draincleaner, detergents, antacid tablets or liquids, or soaps.Suggestions for acids could include: lemon juice, vinegar,vitamin C tablets, or rust and lime cleaners.
Assessment Options■ Use Assessment Checklist 3 for self-evaluation by each
student. (Consider providing this rubric to each studentbefore they design their experiment.)
■ A sample experimental plan is:1. Set up the titration apparatus as demonstrated by the
teacher. Rinse the burette with de-ionized water, thenwith the standardized hydrochloric acid.
2. Fill the burette with the standardized hydrochloric acid.
3. Measure and record the initial burette reading.
4. Use a clean pipette to obtain 10.0 mL of the aqueoussodium hydroxide solution and deliver it to a clean 125 mL Erlenmeyer flask.
5. Add 2 to 3 drops of methyl orange (or another suitableindicator) to the sample in the flask and note the initialindicator colour.
6. Titrate the aqueous sodium hydroxide sample with thehydrochloric acid until a distinct endpoint is observed(the colour change should be described at this point, inthis case the solution changes from yellow to orange orred). Record the final burette reading.
7. Repeat steps 3 to 6 until you have performed threeconsecutive titrations with differences within a� 0.2 mL range.
8. Clean up your laboratory station and dispose of allwastes as instructed by the teacher.
■ Check that the following points are included in theexperimental plan:
■ cleaning of apparatus
■ measurements of volume
■ recording of colour
■ stating number of drops of indicator
■ clean up instructions
■ recording instructions
4-56 MHR • Unit 4 Quantitative Relationships in Chemical Changes

■ Use Assessment Checklist 2 to assess each student’slaboratory report.
■ Use Assessment Checklist 6 to assess Analysis calculations.
Section 8.3 Review AnswersStudent Textbook page 322
1. (a) KOH(aq) � HClO3(aq) → KClO3(aq) � H2O(�)
(b) HI(aq) � NaOH(aq) → NaI(aq) � H2O(�)
(c) HBr(aq) � RbOH(aq) → RbBr(aq) � H2O(�)
(d) NaOH(aq) � HNO3(aq) → NaNO3(aq) � H2O(�)
(e) 2HCl(aq) � Na2CO3(aq) →2NaCl(aq) � H2O(�) � CO2(g)
2. (a) The endpoint is the pH at which an indicatorchanges colour. The equivalence point is the pH atwhich stoichiometrically equivalent amounts ofreactants combine. A suitable endpoint occurs withthe addition of one drop of extra titrant beyond theequivalence point.
(b) The endpoint pH range and the equivalence pointpH need not be identical, but they ought to be veryclose. The pH changes dramatically at equivalence, soa close endpoint pH range will suffice.
3. H2SO4(aq) � NaOH(aq) → 2NaCl(aq) + 2H2O(�)
V � 23.00 mL – 1.05 mL V � 10.00 mL
� 21.95 mL
c � 0.118 �mLol� c � ? mol/L
c NaOH � 21.95 mL ×�0.118 m1oLl H2SO4� ×
�12
mm
ooll
HNa
2SOOH
4� × �
10.010 mL�
� 0.518 mol/L
4. HCl(aq) � NaOH(aq) → NaCl(aq) � H2O(�)Discard trial #1.
Vave(NaOH) �
� 22.02 mL
V � 10.00 mL V � 22.02 mL
c � ? c � 0.06649 �mLol�
cHCl � 22.02 mL × ×
�1
1m
mol
olN
HaO
CHl
� × �10.0
10 mL�
� 0.1464 mol/L
5. 3KOH(aq) � H3C6H5O7(aq) →K3C6H5O7(aq) � 3H2O(�)
V � 18.2 mL V � 10.00 mL
c � 0.100 mol/L c � ? mol/L
c H3C6H5O7 � 18.2 mL �0.100 m
1oLl KOH� ×
�1 m
3oml H
ol3
KC
O6H
H5O7
� × �10.0
10 mL�
� 0.0607 mol/L
6. (a) This mistake would dilute the acid, requiring a lowervolume of titrant and yielding a lower calculated[HCl(aq)].
(b) A wet Erlenmeyer flask would have no effect. It is theamount of reactant in the pipetted sample thatmatters, not its concentration in the Erlenmeyer flask.
(c) This mistake would create the impression that agreater volume of titrant was necessary, and yield ahigher calculated [HCl(aq)]—the tip of mostanalytical burettes holds about 1 mL of titrant. Thismistake could have contributed to the discrepancy inthe problem.
(d) This would create the false impression that lowervolume of titrant was necessary and yield a lowercalculated [HCl(aq)]. That said, the effect would beso small as to be within the limits of human error—one drop of titrant is about 0.05 mL.
Chapter 8 Review AnswersStudent Textbook pages 324-325
Answers to Understanding Concepts Questions1. A limiting reactant is a reactant that is completely
consumed in a chemical reaction.
2. When reactants are present in stoichiometric amountsthey are present in amounts that correspond exactly to themole ratios.
3. A company may choose to use a large excess of onereactant instead of using stoichiometric amounts of allreactants to ensure that the more expensive or scarcerreactant is consumed and not wasted.
4. The yield of a chemical reaction can be lower than thepredicted amount if there is a competing reaction, if thereaction is slow, or the reactant are impure.
5. A certain percentage of the desired compound is lost inevery step of an industrial process. A greater percentage islost as the number of steps increases. For example, itwould seem that a recovery of 90% would be good.However, if you recover 90% of the products in every stepof a four step process, the final percentage recoveredwould be:
0.90 × 0.90 × 0.90 × 0.90 = 0.66 or 66%.
6. The equivalence point is reached first in an acid-basetitration. The indicator will just begin to change colour atthe equivalence point. The end-point comes when theindicator has completely changed colour or after the pHhas completed its change. The equivalence point is at the
0.06649 mol NaOH���
1 L
22.00 mL � 22.02 mL � 22.04 mL����
3
4-57Chapter 8 Applications of Stoichiometry • MHR
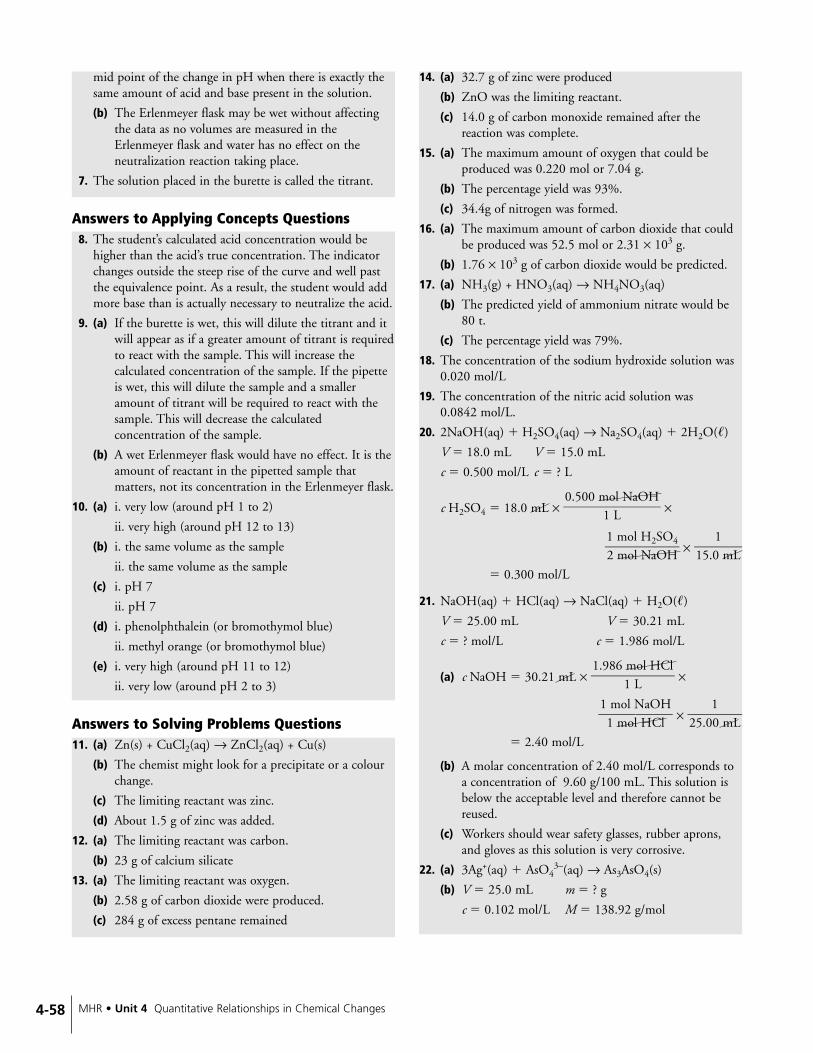
mid point of the change in pH when there is exactly thesame amount of acid and base present in the solution.
(b) The Erlenmeyer flask may be wet without affectingthe data as no volumes are measured in theErlenmeyer flask and water has no effect on theneutralization reaction taking place.
7. The solution placed in the burette is called the titrant.
Answers to Applying Concepts Questions8. The student’s calculated acid concentration would be
higher than the acid’s true concentration. The indicatorchanges outside the steep rise of the curve and well pastthe equivalence point. As a result, the student would addmore base than is actually necessary to neutralize the acid.
9. (a) If the burette is wet, this will dilute the titrant and itwill appear as if a greater amount of titrant is requiredto react with the sample. This will increase thecalculated concentration of the sample. If the pipetteis wet, this will dilute the sample and a smalleramount of titrant will be required to react with thesample. This will decrease the calculatedconcentration of the sample.
(b) A wet Erlenmeyer flask would have no effect. It is theamount of reactant in the pipetted sample thatmatters, not its concentration in the Erlenmeyer flask.
10. (a) i. very low (around pH 1 to 2)
ii. very high (around pH 12 to 13)
(b) i. the same volume as the sample
ii. the same volume as the sample
(c) i. pH 7
ii. pH 7
(d) i. phenolphthalein (or bromothymol blue)
ii. methyl orange (or bromothymol blue)
(e) i. very high (around pH 11 to 12)
ii. very low (around pH 2 to 3)
Answers to Solving Problems Questions11. (a) Zn(s) + CuCl2(aq) → ZnCl2(aq) + Cu(s)
(b) The chemist might look for a precipitate or a colourchange.
(c) The limiting reactant was zinc.
(d) About 1.5 g of zinc was added.
12. (a) The limiting reactant was carbon.
(b) 23 g of calcium silicate
13. (a) The limiting reactant was oxygen.
(b) 2.58 g of carbon dioxide were produced.
(c) 284 g of excess pentane remained
14. (a) 32.7 g of zinc were produced
(b) ZnO was the limiting reactant.
(c) 14.0 g of carbon monoxide remained after thereaction was complete.
15. (a) The maximum amount of oxygen that could beproduced was 0.220 mol or 7.04 g.
(b) The percentage yield was 93%.
(c) 34.4g of nitrogen was formed.
16. (a) The maximum amount of carbon dioxide that couldbe produced was 52.5 mol or 2.31 × 10³ g.
(b) 1.76 × 10³ g of carbon dioxide would be predicted.
17. (a) NH3(g) + HNO3(aq) → NH4NO3(aq)
(b) The predicted yield of ammonium nitrate would be80 t.
(c) The percentage yield was 79%.
18. The concentration of the sodium hydroxide solution was0.020 mol/L
19. The concentration of the nitric acid solution was 0.0842 mol/L.
20. 2NaOH(aq) � H2SO4(aq) → Na2SO4(aq) � 2H2O(�)
V � 18.0 mL V � 15.0 mL
c � 0.500 mol/L c � ? L
c H2SO4 � 18.0 mL �0.500 m
1oLl NaOH� ×
�12
mm
ooll
HNa
2SOOH
4� × �
15.01
mL�
� 0.300 mol/L
21. NaOH(aq) � HCl(aq) → NaCl(aq) � H2O(�)
V � 25.00 mL V � 30.21 mL
c � ? mol/L c � 1.986 mol/L
(a) c NaOH � 30.21 mL × �1.986
1
m
L
ol HCl� ×
�1
1m
mol
olN
HaO
CHl
� × �25.0
10 mL�
� 2.40 mol/L
(b) A molar concentration of 2.40 mol/L corresponds toa concentration of 9.60 g/100 mL. This solution isbelow the acceptable level and therefore cannot bereused.
(c) Workers should wear safety glasses, rubber aprons,and gloves as this solution is very corrosive.
22. (a) 3Ag+(aq) � AsO43–(aq) → As3AsO4(s)
(b) V � 25.0 mL m � ? g
c � 0.102 mol/L M � 138.92 g/mol
4-58 MHR • Unit 4 Quantitative Relationships in Chemical Changes

m AsO43– � 25.0 mL × �
0.1021mLol Ag+
� ×
�1
3m
mol
oAlsAOg
4+
3–
� × �13
18m.9
o2lgA
AsO
sO
434–
3–
�
� 118 mg
(c) m As � 118 mg AsO43– × �138
7.49.292
ggAs
AOs
43–�
� 63.6 mg As
% As � �0.10.62326gg
� × 100 � 5.21%
23. CH3COOH(aq) � NaOH(aq) →NaCH3COO(aq) � H2O(�)
V � 2.50 mL V � 34.9 mL
c � ? L c � 0.0960 mol/L
c CH3COOH � 34.9 mL �0.0960 m
1oLl NaOH� ×
�1 m
1oml C
olHN
3CaO
OHOH
� × �2.50
1mL�
� 1.34 mol/L
m CH3COOH � 2.00 L × ×
� 161 g
Answers to Making Connections Questions24. (a) The phosphate-contaminated water could be treated
with a solution containing calcium or magnesiumions. (These ions were chosen as they are normallypresent in hard water.) The precipitate could beremoved by settling and then disposed ofappropriately.
(b) Suggested methods may include using detergents orcleaners that do not contain phosphate, replacingphosphate in cleaners with other ions, or treating thewater with a biological agent to remove the phosphate(such as a bacterium).
Career Focus: Ask a Pharmaceutical Chemist
Student Textbook pages 326-327
PurposeStudents are exposed to new applications of stoichiometry,specifically for drug research. An introductory overview ofpharmaceutical development from the point of view of aresearch chemist is presented.
Teaching StrategiesAsk students to think about the areas of research in whichcontainer molecules are being applied as mentioned in thetext. Have students think of other areas beyond thepharmaceutical industry where this chemistry can be applied.If time allows, have students research and create 3-D modelsof their own container molecules with an accompanyingexplanation.
Go Further... Answers1. Targeted drugs are more specific, less toxic, and more
effective with enhanced solubility and stability. Thesedrugs can target passively or actively in the system. Thebetter targeted the drug is, the less waste there will be anda better pharmacological response will result.
2. The container molecules (guest) can entrap the materialof interest (host) to separate the host from contaminants,as in the case of water purification. The containermolecule can then be removed from the host by one ormore means of chemical separation. Answers may vary,but should reflect that container molecules can completelyrecognize and encapsulate smaller substrates; selectivelyrecognize substrates; stabilize and characterize highlyreactive chemical species; and demonstratestereoisomerism.
Unit 4 Review AnswersStudent Textbook pages 328-331
Answers to Understanding Concepts Questions1. (a) The coefficients in a balanced chemical equation
represent the number of atoms, molecules, or ionsparticipating in the reaction.
(b) The coefficients also represent the number of molesof a specific atom, molecule, or ion participating inthe reaction.
2. The mass of products and the mass of reactants in abalanced equation are equal. Since the same numbers ofatoms, molecules, or ions remain the same so must themasses of these substances.
3. (a) H2(g) � CuO(s) → Cu(s) � H2O(g) single replacement
(b) 16Ag(s) � S8(s) → 8Ag2S(s) formation
(c) C4H8(g) � 6O2(g) → 4CO2(g) � 4H2O(g)combustion
(d) 2MgO(s) → 2Mg(s) � O2(g) decomposition
(e) Al2(SO4)3(aq) � 3K2CrO4(aq) →3K2SO4(aq) � Al2(CrO4)3(s) double replacement
4. (a) 2CH3OH(�) � 3O2(g) → 2CO2(g) � 4H2O(g)combustion
(b) P4(s) � 5O2(g) → P4O10(s) formation
60.06 g CH3COOH���1 mol CH3COOH
1.34 mol CH3COOH���
1 L
4-59Chapter 8 Applications of Stoichiometry • MHR

4-60 MHR • Unit 4 Quantitative Relationships in Chemical Changes
(c) CaCO3(s) → CaO(s) � CO2(g) decomposition
(d) 3Sr(NO3)2(aq) � 2K3PO4(aq) →Sr3(PO4)2(s) � 6KNO3(aq) double replacement
(e) 2Li3N(s) → 6Li(s) � N2(g) decomposition
(f) Ca(s) � 2H2O(�) → Ca(OH)2(s) � H2(g) singlereplacement
5. (a) high solubility
(b) high solubility
(c) high solubility
(d) low solubility
(e) low solubility
6. (a) 2C2H2(g) � 5O2(g) → 4CO2(g) � 2H2O(g)
(b) Cd(s) � Pb(NO3)2(aq) → Pb(s) � Cd(NO3)2(aq)
(c) 4Al(s) � 3O2(g) → 2Al2O3(s)
(d) Sr(OH)2(aq) � H2SO3(aq) → SrSO3(s) � 2H2O(�)
(e) 8HgS(s) → 8Hg(�) � S8(s)
7. Al2(SO4)3(aq) → 2Al3+(aq) � 3SO42–(aq)
8. (a) Pb(NO3)2(aq) � 2NaBr(aq) →PbBr2(s) � 2NaNO3(aq)
(b) Pb2+(aq) � 2NO3–(aq) � 2Na+(aq) � 2Br–(aq) →
PbBr2(s) � 2NO3–(aq) � 2Na+(aq)
(c) The spectator ions are NO3–(aq) and Na+(aq).
(d) Pb2+(aq) � 2Br-(aq) → PbBr2(s)
9. 2Ag+(aq) + CrO42-(aq) → Ag2CrO4(s)
10. 2HCl(aq) � Ba(OH)2(aq) → BaCl2(aq) � 2H2O(�)
Since the number of moles of hydrochloric acid andbarium hydroxide are equal, the hydrochloric acid will bethe limiting reactant and the barium hydroxide will be inexcess. In order to be in stoichiometric amounts, twice asmany moles of acid would need to be present tocompletely react with the base.
11. (a) ring stand, burette clamp, burette, burette funnel,beakers, Erlenmeyer flasks, volumetric pipette,meniscus reader pipette bulb
(b)
12. The equivalence point of a reaction occurs when thereactants are present in stoichiometric amounts. Theendpoint occurs when the indicator changes colour. Asatisfactory endpoint occurs with the addition of one dropof titrant that drives the pH beyond the equivalencepoint.
13. A burette should be thoroughly rinsed with de-ionizedwater, then rinsed with the titrant before filling it with thetitrant.
14. A total ionic equation lists all the entities involved in achemical reaction. A net ionic equation represents onlythose entities that change during the course of thereaction.
15. A sample equation is as follows.
HCl(aq) � NaOH(aq) → NaCl(aq) � H2O(�)
Answers to Applying Concepts Questions16. H2(g) � Cl2(g) → 2HCl(g)
A total of 200 molecules of hydrogen chloride will beproduced. The chlorine gas is in excess and 100 moleculesof the gas will remain.
17. Li2SO4(s)
18. Student answers may vary. One such sequence would beNaCH3COO(aq), NaCl(aq), followed by Na2SO4(aq)
19. Students’ answers will vary. Designs can include titrationwith hydrochloric acid to determine which antacidneutralizes the most stomach acid or the pH of a sampleof acid when the antacid is added. In each case, the doseof the antacid should be controlled. The manipulatedvariable is the brand of antacid and the respondingvariable is the volume of acid neutralized/pH of thesolution (depending on design).
20. Cu2+(aq) � S2–(aq) → CuS(s)Copper(II) sulfide is the precipitate.
21. (a) The pH curve begins at a relatively low pH andremains low until a very steep rise near theequivalence point at pH 7. Slightly after theequivalence point, the curve flattens out at a relativelyhigh pH.
x0
Volume of Base Added (mL)
pH
Titration of aStrong Acid witha Strong Base
14
7equivalencepoint
burette clamp
ring standErlenmeyer flask
meniscusreader
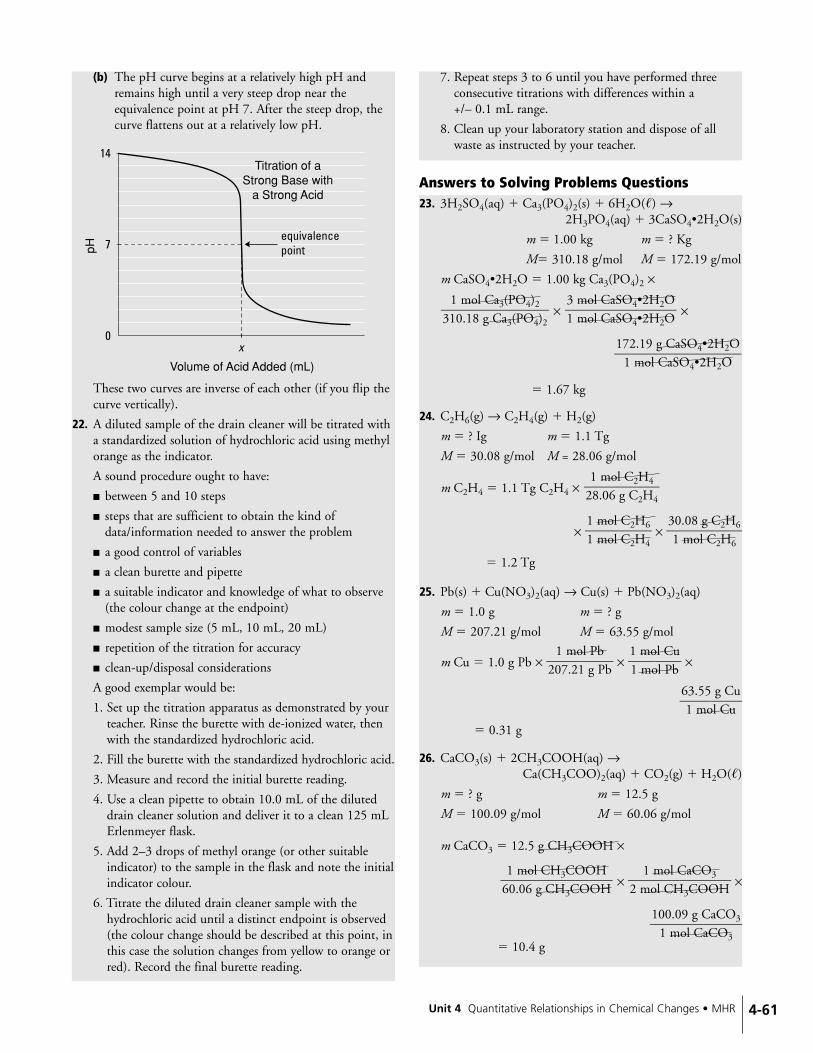
(b) The pH curve begins at a relatively high pH andremains high until a very steep drop near theequivalence point at pH 7. After the steep drop, thecurve flattens out at a relatively low pH.
These two curves are inverse of each other (if you flip thecurve vertically).
22. A diluted sample of the drain cleaner will be titrated witha standardized solution of hydrochloric acid using methylorange as the indicator.
A sound procedure ought to have:
■ between 5 and 10 steps
■ steps that are sufficient to obtain the kind ofdata/information needed to answer the problem
■ a good control of variables
■ a clean burette and pipette
■ a suitable indicator and knowledge of what to observe(the colour change at the endpoint)
■ modest sample size (5 mL, 10 mL, 20 mL)
■ repetition of the titration for accuracy
■ clean-up/disposal considerations
A good exemplar would be:
1. Set up the titration apparatus as demonstrated by yourteacher. Rinse the burette with de-ionized water, thenwith the standardized hydrochloric acid.
2. Fill the burette with the standardized hydrochloric acid.
3. Measure and record the initial burette reading.
4. Use a clean pipette to obtain 10.0 mL of the diluteddrain cleaner solution and deliver it to a clean 125 mLErlenmeyer flask.
5. Add 2–3 drops of methyl orange (or other suitableindicator) to the sample in the flask and note the initialindicator colour.
6. Titrate the diluted drain cleaner sample with thehydrochloric acid until a distinct endpoint is observed(the colour change should be described at this point, inthis case the solution changes from yellow to orange orred). Record the final burette reading.
7. Repeat steps 3 to 6 until you have performed threeconsecutive titrations with differences within a +/– 0.1 mL range.
8. Clean up your laboratory station and dispose of allwaste as instructed by your teacher.
Answers to Solving Problems Questions23. 3H2SO4(aq) � Ca3(PO4)2(s) � 6H2O(�) →
2H3PO4(aq) � 3CaSO4•2H2O(s)
m � 1.00 kg m � ? Kg
M� 310.18 g/mol M � 172.19 g/mol
m CaSO4•2H2O � 1.00 kg Ca3(PO4)2 ×
× ×
� 1.67 kg
24. C2H6(g) → C2H4(g) � H2(g)
m � ? Ig m � 1.1 Tg
M � 30.08 g/mol M = 28.06 g/mol
m C2H4 � 1.1 Tg C2H4 ×
× �11
mm
ooll
CC
2
2
HH
6
4� × �
310.
m08
olgCC
2
2
HH
6
6�
� 1.2 Tg
25. Pb(s) � Cu(NO3)2(aq) → Cu(s) � Pb(NO3)2(aq)
m � 1.0 g m � ? g
M � 207.21 g/mol M � 63.55 g/mol
m Cu � 1.0 g Pb × �2017m.2
o1lgPb
Pb� × �
11
mm
oollCPb
u� ×
�613.
m55
olgCCuu
�
� 0.31 g
26. CaCO3(s) � 2CH3COOH(aq) →Ca(CH3COO)2(aq) � CO2(g) � H2O(�)
m � ? g m � 12.5 g
M � 100.09 g/mol M � 60.06 g/mol
m CaCO3 � 12.5 g CH3COOH ×
�2 m1
oml
oClHC
3
aCCOO
O3
H� ×
�10
10m.0
o9lgC
CaC
aCO
O
3
3�
� 10.4 g
1 mol CH3COOH���60.06 g CH3COOH
1 mol C2H4��28.06 g C2H4
172.19 g CaSO4•2H2O���
1 mol CaSO4•2H2O
3 mol CaSO4•2H2O���1 mol CaSO4•2H2O
1 mol Ca3(PO4)2���310.18 g Ca3(PO4)2
x0
Volume of Acid Added (mL)
pH
Titration of aStrong Base with
a Strong Acid
14
7equivalencepoint
4-61Unit 4 Quantitative Relationships in Chemical Changes • MHR

4-62 MHR • Unit 4 Quantitative Relationships in Chemical Changes
Since 12.5 g of ethanoic acid will react completely withonly 10.4 g of calcium carbonate, the lime scale will notbe completely removed.
27. (a) Pb(CH3COO)2(aq) � 2NH4Cl(aq) →PbCl2(s) � 2NH4CH3COO(aq)
(b) V � 21.0 mL m � ? g
c � 0.125 g/mol M � 278.11 g/mol
m PbCl2 � 21.0 mL �0.125 m
1oLl NH4Cl� ×
�21
mm
oollNP
HbC
4Cl2
l� × �
2718m.1
o1lgPb
PCbC
l2
l2�
� 365 mg
28. HCl(aq) � KOH(aq) → KCl(aq) � H2O(�)
V � 2.68 L V � 3.17 L m � ? g
c � 2.11 mol/L c � 2.29 mol/L M � 74.55 g/mol
If the HCl is limiting
m KCl � 2.68 L × �2.11 m
1oLl HCl� × �
11
mm
oollHKC
Cll
� ×
�714.
m55
olgKKCCll
�
� 422 g
If the KOH is limiting
m KCl � 3.17 L × �2.29 m
1oLl KOH� × �1
1mmoollKKOCHl
�
× �714.
m55
olgKKCCll
�
� 541 g
Since HCl(aq) produces the least mass of product, it isthe limiting reactant and the mass of KCl(aq) producedwill be 422 g.
29. H2SO4(aq) � 2KOH(aq) → K2SO4(aq) � 2H2O(�)
V � 25.0 mL V � 38.93 mL
c � ? mol/L c � 4.50 mmol/L
c H2SO4 � 38.93 mL �4.50 m
1m
Lol KOH� ×
�12
mm
oollHK
2
OSO
H4
� × �25.0
1mL�
� 3.50 mmol/L
30. Ca(NO3)2(aq) � Na2SO4(aq) →CaSO4(s) � 2NaNO3(aq)
V � 50.0 mL V � 200 mL
c � 0.200 mol/L c � 0.180 mol/L
n Na2SO4 � 50.0 mL × ×
�11mmoollCNa(
aN2S
OO
3
4
)2�
� 10.0 mmol
n Na2SO4 remaining � 36.0 mmol – 10.0 mmol
� 26.0 mmol
c Na2SO4 � �26
2.500mmmLol
� � 0.104 mol/L
31. AgNO3(aq) � KCl(aq) → AgCl(s) � KNO3(aq)
V � 25.0 mL m � 0.842 g
c � ? mol/L M � 143.32 g/mol
c AgNO3 � 0.842 g AgCl × �1413m.3
o2lgA
AgC
gCl
l� ×
�11mmolol
AAgNgC
Ol
3� × �
25.01
mL� × �
10010LmL�
� 0.235 mol/L
32. S8(s) � 12O2(g) � 8H2O(�) → 8H2SO4(�)
m � 1.00 kg m � ? g
M � 256.56 g/mol M � 98.09 g/mol
m H2SO4 � 1.00 kg S8 × �25
16m.5
o6lgS8
S8� × �
8 m1
omloHl
2
SS
8
O4�
× �918.
m09
olgHH
2
2
SSOO
4
4�
� 3.06 kg
33. (a) P4S3 (g) � 8O2(g)→ P4O10(g) � 3SO2(g)
(b) V � 5.3 L O2(g) × �38
LL
SOO
2
2
((gg))
� � 2.0 L SO2 (g)
(c) m ��22.54.3L/
Lm
Ool
2(Og)
2(g)� × �
18
mm
oollPO4S
2(3
g(s))
� ×
�22
10m.0
o9lgP4
PS4
3
S(3
s()s)
�
� 6.5 g P4S3(s)
34. 3CH4(g) � 6H2O(�) � 4N2(g) →8NH3(g) � 3CO2(g)
m � 1000 kg V � ? L
M � 16.05 g/mol T � 300 K
P � 100 kPa
(a) V NH3 � 1000 kg CH4 × �116.
m05
olgCCHH
4
4� ×
�83
mm
oollNCH
H
4
3� ×
� 4.15 × 10⁶ L
(b) m NH3 � 1000 kg CH4 × �116.
m05
olgCCHH
4
4� ×
�83
mm
oollNCH
H
4
3� × �
117.
m04
olgNNHH
3
3�
� 2831 kg
8.314 kPa•L/mol•K × 300 K���
100 kPa
0.200 mol Ca(NO3)2���
1 L

(c) V � 2831 kg × �681
m.9
3
1 kg� � 4.15 m3
35. C9H8O4(aq) � NaOH(aq) → NaC9H7O4(aq) � H2O(�)
m � ? g V � 13.4 mL
M � 180.17 g/mol c � 0.132 mol/L
(a) m C9H8O4 � 13.4 mL �0.132 m
1oLl NaOH� ×
�11mmoollCN
9HaO
8OH
4� �
1810m.1
o7lgC
C
9H9H
8O8O
4
4�
� 319 mg
(b) % Yield � �331295
mm
gg
� × 100 � 98.2%
(c) A small piece of the tablet could have broken off dueto the tablets bumping against each other and againstthe bottle.
36. Ca2+(aq) � 2HF(aq) → CaF2(s) � 2H+(aq)
V � 2.8 L V � ? L
c � 2.5 mmol/L c � 1.5 mol/L
v HF � 2.8 L × �2.5 m
1m
Lol Ca2+
� × �12
mm
oollCHaF2+� ×
�1.5 m
1oLl HF�
� 9.3 mL
37. 2C4H9SH(�) � NaOCl(aq) →(C4H9)2S(�) � NaCl(aq) � H2O(�)
m � ? g V � 5.00 mL
M � 90.21 g/mol c � 0.0986 mol/L
m C4H9SH � 5.00 mL �0.0986 m
1oLl NaOCl� ×
�2
1
m
m
o
o
l
l
C
N4H
aO9S
C
H
l� �
9
1
0.
m
21
ol
g
C
C
4
4
HH
9
9
SSHH
�
� 88.9 mg
38. Fe2O3(s) � 6H2C2O4(aq) →2Fe(C2O4)3
3–(aq) � 3H2O(�) � 6H+(aq)
m � ? g V � 500 mL
M � 159.70 g/mol c � 0.11 g/mol
m Fe2O3 � 500 mL �0.1
11
Lm
Hol
2
HC2
2
OC2
4
O4� ×
�61mmoollHF
2
eC2O
2O3
4� × �
1519m.7
o0lgFe
F
2
eO2O
3
3�
� 1.46 g
Since only 1.0 g of red rust is present, there is more thanenough oxalic acid to completely remove it.
39. H2SO4(aq) � 2NaOH(aq) → Na2SO4(aq) � 2H2O(�)
n � ? mol V � 27.9 mL
c � 0.250 mol/L c � 0.230 mol/L
n H2SO4 � 27.9 mL �0.230 m
1oLl NaOH� ×
�12
mm
ooll
HNa
2SOOH
4�
� 3.21 mmol remains
n H2SO4 originally present � 50.0 mL ×
�0.250 m
1oLl H2SO4�
� 12.5 mmol
n H2SO4 that reacted � 12.5 mmol – 3.21 mmol
� 9.3 mmol
n NH3 � 9.3 mmol H2SO4 × �12mmoollHN
2SHO
3
4�
� 18.6 mmol
n (NH4)2SO4 � 18.6 mmol NH3 �1 m
2ol
m(oNlHN
4
H)2
3
SO4�
� 9.3 mmol
m (NH4)2SO4 � 9.3 mmol (NH4)2SO4 ×
� 1.23 g
percentage � (1.23 g / 10.0 g) × 100 � 12.3%
40. (a) 7.32 g H2O(g)
Complete Solution
nSiO2(s) � �M
mS
S
i
i
O
O
2
2
(
(
s
s
)
)�
�
� 0.203 mol SiO2(s)
nH2O(g) � 0.203 mol SiO2(s) × �21
mm
oollHSi
2
OO
2
((gs))
�
� 0.406 mol H2O(g)
mH2O(g) � nH2O(g)MH2O(g)
� 0.406 mol H2O(g) × �118.
m02
olgHH
2
2
OO(g(g))
�
� 7.32 g H2O(g)
12.2 g SiO2(s)��
60.09�mgoSliSOiO
2(
2
s()s)
�
132.17 g (NH4)2SO4���
1 mol (NH4)2SO4
4-63Unit 4 Quantitative Relationships in Chemical Changes • MHR

(b) 34.2% yield
Complete Solution
percentage yield � × 100%
� �27..5302
gg
� × 100%
� 34.2% yield
(c) 7.22 g of SiF4(s) would be formed.
Complete Solution
nH2O(g) � �M
mH
H
2
2
O
O
(
(
g
g
)
)�
�
� 0.139 mol H2O(g)
nSiF4(s) � 0.139 mol H2O(g) × �21
mm
oollHSI
2
FO
4((sg))
�
� 0.0694 mol SIF4(s)
mSiF4(s) � nSiF4(s)MSiF4(s)
� 0.694 mol SIF4(s) × �10
14m.0
o9lgSI
SFI
4
F(4
s()s)
�
� 7.22 g SIF4(s)
41. 36.6% yield
Complete Solution
nNa2SO4(s) � �M
mN
N
a
a
2
2
S
S
O
O
4
4
(
(
s
s
)
)�
�
� 0.0307 mol Na2SO4(s)
nSiF4(s) � 0.0307 mol Na2SO4(s) × �11
mm
oollNBaa
2
SSOO
4
4
((ss))
�
� 0.0307 mol BaSO4(s)
mSiF4(s) � nSiF4(s)MSiF4(s)
� 0.0307 mol BaSO4(s) × �1 m2o3l3B.4a0SO
g
4(s)�
� 7.16 g BaSO4(s)
percentage yield � × 100%
� �27..6126
gg
� × 100%
� 36.6% yield
42. (a) 15.1 g C6H5Br(�)
nC6H6(�) � �M
mC
C
6
6
H
H
6
6
(
(
�
�
)
)�
�
� 0.0960 mol C6H6(�)
nC6H5Br(�) � 0.0960 mol C6H6(�) �11mmoollCC6H
6H5B
6(r�
(�))
�
� 0.0960 mol C6H5Br(�)
mC6H5Br(�) � nC6H5Br(�)MC6H5Br(�)
� 0.0960 mol C6H5Br(�) ×
� 15.1 g C6H5Br(�)
(b) 0.414 g
Complete Solution
nC6H4Br2(�) � �M
mC
C
6
6
H
H
4
4
B
B
r
r
2
2
(
(
�
�
)
)�
�
� 0.00530 mol C6H4Br2(�)
nC6H6(�) � 0.00530 mol C6H4Br2(�) �11m
mol
oCl C
6H6H
4B6
r(
2
�
()�)
�
� 0.00530 mol C6H6(�)
mC6H6(�) � nC6H6(�)MC6H6(�)
� 0.00530 mol C6H6(�) �718.
m12
olgCC
6
6
HH
6
6
(�(�))
�
� 0.414 g C6H6(�)
(c) 14.2 g of bromobenzene were formed.
(d) The yield was 94.5 %.
Answers to Making Connections Questions43. The words “air bags” and “airbags” in a Google search
bring up a number of excellent resources for high schoolstudents. Most of the entries list the pros for the use of airbags, but some sites do investigate the cons. These sitesalso describe the specific conditions in which air bagsshould not be used. A number of questionable sites,lacking scientific basis, also appeared in the search.Discuss the difference between reputable sources (e.g.,Canadian Safety Council) and less reputable sources (e.g., joe’swebpage.com) and how to use internet resourcesjudiciously.
Pros
■ deaths from impact injuries in collisions are reduced
1.25 g C6H4Br2(�)���
235.9�mgoCl C
6H
6H4B
4Br2
r(
2
�
()�)
�
157.01 g C6H5Br(�)���
1 mol C6H5Br(�)
7.50 g C6H6(�)��
�78
m.1o2lgC
C
6H6H
6(6
�
()�)
�
experimental yield��
predicted yield
4.36 g Na2SO4(s)���
142.05�mgoNl N
a2
aS
2
OSO
4(
4
s()s)
�
2.50 g H2O(g)��
18.02�mgoHl H
2O
2O(g
()g)
�
experimental yield��
predicted yield
4-64 MHR • Unit 4 Quantitative Relationships in Chemical Changes

■ injuries due to automobile accidents are reduced
■ health care costs due to automobile accidents arereduced
Cons
■ driver and passenger must be properly seated in car(proper distance from front of car)
■ small children cannot be in the front seat with anairbag
■ rear-facing infant seats cannot be used with an air bag
■ air bags may cause injury
44. Students should support their position with specificexamples. If they agree, they may make reference to thecost of developing a market for the by-products, the costof shipping by-products to be used in another process, orthe cost of research into new products made from by-products that ultimately translates into consumer costs. Ifstudents disagree, they may make reference toenvironmental costs of disposal, the sheer volume of by-products and how this may have environmental costs,potential profits from using by-products, or utilizing ournatural resources fully (fewer resources have to beprocessed to provide a variety of different of products).
45. Vitamin C, or ascorbic acid, is an acid. The concentrationof an acid in a solution can be determined using acid-basetitration.
Variables:
Manipulated: type of orange juice
Responding: the volume of base required to reachequivalence (as measured by the indicator endpoint)
Controlled: the volume of orange juice; the concentrationof the base; the indicator used
Data Table: Volume of base required to neutralize thevitamin C in a 250 mL glass of orange juice
Diagram:
Sample Calculation:
From the four trials, average the volume of base requiredto reach equivalence point. This is the volume of base.
A sample balanced equation is shown below.
2NaOH(aq) + H2C6H6O6(aq) →Na2C6H6O6(aq) + 2H2O(�)
nNaOH(aq) � cNaOH(aq) × VNaOH(aq)
� nNaOH(aq)
nH2C6H6O6(aq) � nNaOH(aq) ×
� nH2C6H6O6(aq)
cH2C6H6O6(aq) � �V
nH
H
2
2
C
C
6
6
H
H
6
6
O
O
6
6
(
(
a
a
q
q
)
)�
nH2C6H6O6(aq)�
0.250 L
� cH2C6H6O6(aq)
1 mol H2C6H6O6(aq)���
2 mol NaOH(aq)
burette clamp
burette
tap (or stopcock)
Erlenmeyer flask
retort standtitrant
Trial 1 Trial 2 Trial 3 Trial 4
Finalburettevolume (mL)
Initialburettevolume (mL)
Volume ofbase added(mL)
4-65Unit 4 Quantitative Relationships in Chemical Changes • MHR