Embed Size (px)
Citation preview

2
Table of Contents
1. DNBi Overview .............................................................................. 3
2. Dashboard ..................................................................................... 4
2.1 Overview ..................................................................................................................4
2.2 Watch List ................................................................................................................5
2.3 Section & Watch list Customization .....................................................................6
2.4 Charts Selection .................................................................................................................. 7
2.5 Charts .......................................................................................................................8
2.6 News and Alerts ......................................................................................................9
2.7 Quick Search .........................................................................................................10
3. Search ......................................................................................... 11
3.1 Overview ................................................................................................................11
3.2 Results....................................................................................................................13
4. Company Details ......................................................................... 15
4.1 Company Summary..............................................................................................15
4.2 Customize ..............................................................................................................16
4.3 Header ....................................................................................................................18
4.4 Drill Down ...............................................................................................................19
4.5 Corporate Linkage Tab ........................................................................................21
4.6 Print .........................................................................................................................23
4.7 PDF .........................................................................................................................24
4.8 Email .......................................................................................................................25
4.9 Preferences ...........................................................................................................26
4.10 Add to Folder .......................................................................................................27
5. Companies .................................................................................. 28
5.1 Overview ................................................................................................................28
5.2 Creating Folders ...................................................................................................29
5.3 Using Folders ........................................................................................................30
5.4 Customize Columns .............................................................................................31
5.5 Snapshots ..............................................................................................................32
6. News and Alerts .......................................................................... 33
6.1 Overview ................................................................................................................33
6.2 Customization........................................................................................................34
7. Trade Groups .............................................................................. 35
7.1 Overview ................................................................................................................35
7.2 Access ....................................................................................................................36
8. Summary ..................................................................................... 37

3
1. DNBi Overview DNBi is an interactive, customizable Web application that provides you with the most complete and up-to-date DUNSRight information D&B has available, comprehensive monitoring, and portfolio analysis, all for one set price. DNBi delivers:
• The Power of insight
DNBi empowers you to make more informed, efficient, and insightful credit decisions by providing online access to the most complete and up-to-date information we have available on the more than 100 million companies in the D&B global database. This information is presented in an easy-to-
navigate, customizable Web-based format that makes your work life easier.
• The Freedom of one set price View all the business information you need- when you want and how you want- for one set price.
• The Confidence of DUNSRight-driven results
Have the confidence that all the insight you gain and every decision you make using DNBi is backed by D&B’s DUNSRight Quality Process. With D&B, you know you are using the most accurate, timely, and
Complete information available.

4
2. Dashboard
2.1 Overview
The Dashboard provides an at-a-glance overview of your DNBi Portfolio.
Figure 1

5
2.2 Watch List
The top companies section of the Dashboard allows you to monitor the D&B D-U-N-S® Numbered companies in
your DNBi portfolio. Each time you log in, the latest D&B information is displayed.
Figure 2

6
2.3 Section & Watch list Customization
Customize the Dashboard to select up to 10 Alerts, News, Trade Group, Watch list or Risk Charts sections to
make it more useful for you. To customize, click on the “Customize Dashboard” button and select the sections you would like to see by clicking “Add Item”. Choose from the list of other sections to add or remove more sections to the Dashboard and move them around the page to set their position by clicking on the cross-arrows icon and selecting whether to move the item up/down/left/right.
Next, select the ‘Top Companies’option to show a list of the most risky companies in a watch list by a data element you would like to display in the columns. You can select to display scores for either Canadian or U.S. companies. You will see a * for scores in place of the score for the country not selected. (Scores are not mathematically comparable across countries and have different scales.)
In addition, instead of the default display of the All Companies folder, you can choose another folder to be displayed on the watch list. This allows you to select and monitor the companies of the most importance to you. Example: If you want to see the companies in your Portfolio with the riskiest Commercial Credit Score Percentile, select “Commercial Credit Score Percentile” from the Sort By list and Most Risk to Least Risk” as the Sort Order. DNBi will auto-generate your watch list based on the preferences you have chosen.
Figure 3

7
2.4 Charts Selection
The Portfolio Risk Distribution charts you have chosen to display on the Dashboard provide aggregate information on your DNBi Portfolio. This information is automatically updated each night by D&B. In addition, you can customize the layout of the Dashboard by selecting where you want the individual sections of the Dashboard displayed.
Figure 4
8
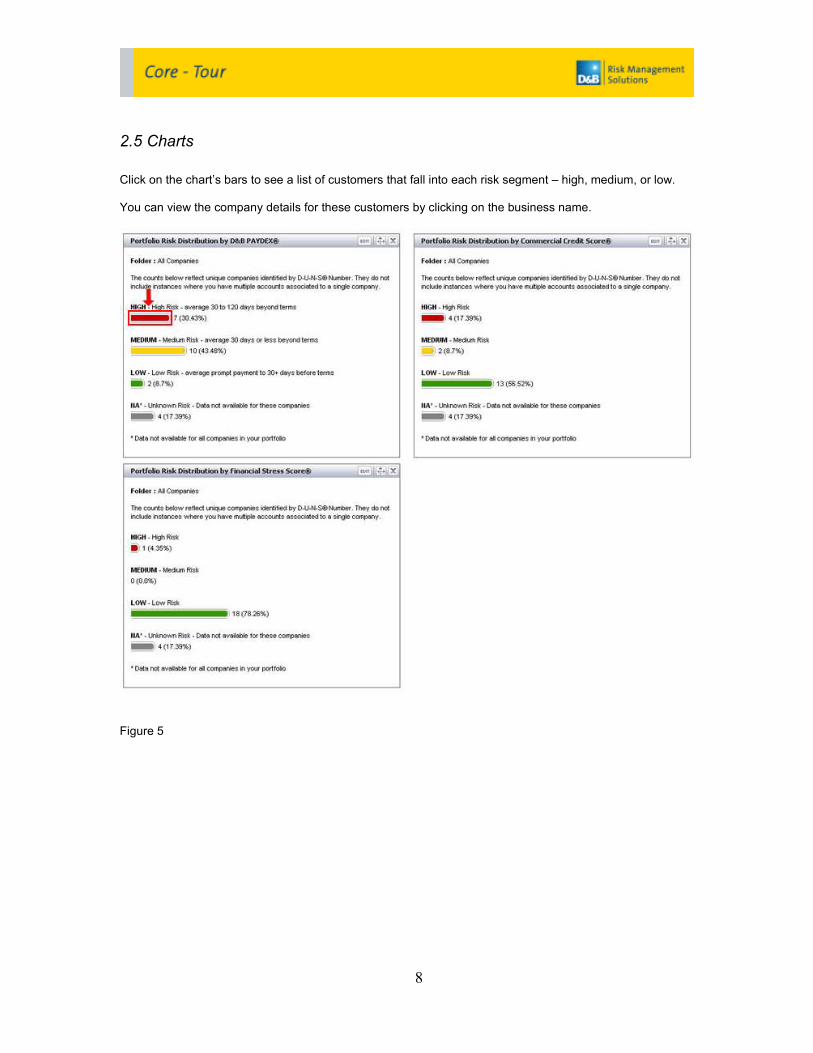
2.5 Charts
Click on the chart’s bars to see a list of customers that fall into each risk segment – high, medium, or low. You can view the company details for these customers by clicking on the business name.
Figure 5

9
2.6 News and Alerts
The Dashboard also allows you to access and view the most recent News and Alerts for each company in your Portfolio. Click “More” to view the Alert details.
Figure 6

10
2.7 Quick Search
Finally, the Dashboard’s “Quick Search” feature provides easy access to your monitored companies in both DNBi as well as the D&B global database. Enter the company name and state to initiate the search. You can click on "More Options" to expand your search criteria. We will review how to conduct a more focused Full Company search in the next section. You can also include an Endorsement / Billing reference when performing an advanced search. This information will be carried to your monthly usage statement along with your transaction details.
Figure 7

11
3. Search
3.1 Overview
DNBi has robust company search tools that let you be as accurate as possible to find the company you are looking for. You can conduct a Full Company Search, which has advanced search capabilities. Click on "More Options" to expand your search criteria to include address, DUNS Number, phone number, and Executive Name.
Figure 8

12
Click “Search” to find the company you’re looking for.
Figure 9

13
3.2 Results
Detailed search results are displayed, with matches already in your portfolio listed first. If you wish to find a new company not in your DNBi portfolio, click on “Search D&B” to search D&B’s Global Database. Once you find the company you are looking for, you can click on the report to view the company summary. Company not found? Request an investigation online.
Figure 10

14
You can extend your search to find businesses that have not yet qualified for a D&B D-U-N-S® Number in the Small Business Risk Insight Unmatched database (Available through additional subscription – Conditions and fees apply).
Figure 11

15
4. Company Details
4.1 Company Summary
DNBi is dynamic and comprehensive. Each time you view company information in DNBi, you see the most complete and up-to-date information D&B has available.
Each time you view company information in DNBi, you start with the DNBi Company Summary, a customizable
executive summary that allows you to review key information and statistics at a glance. You can request an investigation on this company by clicking the “Order an Investigation” button in the header of the report.
Figure 12

16
4.2 Customize
Customize the Company Summary to make it more useful for you. (Available for U.S. and Canadian
Companies; all other country reports are in a fixed snapshot format.) Customization is easy. Just add the content you want to see by clicking on” Add item” and save your changes. DNBi will automatically show this customized Company Summary each time you view information on a company. Get more information about the sections by clicking on the “I” icon in the top corner of each section added. You can also customize the elements displayed in the Scorebar section of the report. Click on the Customize button in the scorebar section to begin. The default elements will appear at the top of the customize page. Select an item from the list of elements below and click on the ‘Add item’ button to move the element to the list above.
Figure 13

17
Once an element moves up to the “ scorebar “ preview section at the top of the page, you can click and drag the elements in the top section from left to right to position them on the page.
Figure 14

18
4.3 Header
The header displays the company name, trade names and Ticker symbol for public companies. Icons representing key features such as adding this company to a folder, Printing, Emailing or Converting this report to a PDF file are on the top right. The preferences icon is used to select the sections to be shown in Email, Printed copies and PDF files saved." "Below the Heading, boxed sections below will contain address and phone information followed by the status of this report and then buttons for actions you can take regarding this report. One action is to request an investigation on this company. To do this, simply click on the “Order an Investigation” button in the header of the report. By clicking on Map Using Google, you can view the company’s location through Google Maps. The Map, Satellite, and Hybrid views of the company and its corporate family are available. Next to the tabs, you will see the current status of this company and buttons that enable you to take action on this company.
Figure 15

19
4.4 Drill Down
In addition to the Company Summary tab, which displays an executive summary of key statistics and data, you can access additional information on the company by clicking on the tabs in the left navigation. Each section may contain links to obtain more information about the section. Corporate Linkage: This displays the expanded D&B Family Tree, allowing you to more easily view and assess risk across different parts of an organization Predictive Scores: Deliver a statistically based assessment of the company’s likelihood of future severe payment delinquency and business failure. By clicking on the “I” icon in the top corner of each section, you will see help content about this section of the report.
Figure 16 Trade Payments: Help you quickly assess payment habits of prospects and customers. Public Filings: Include records from 3,100 U.S. courts and legal filings offices to provide critical insight on credit risk. Special Events: List recent developments not featured in other categories that may impact your potential relationship with the company History & Operations: Provides background on the management team and key principals, details on related companies, and incorporation and banking information. In the Location on Map section, you can view the location of this company through Google Maps. Financial Statements: Gives access to public company financial statements as well as the most complete listing of private company financial statements available anywhere. Key business ratios are included here, as is the option to request financials from your company contact. Compare annual and quarterly financial statements from Edgar. Fraud Risk Score: Allows you to identify characteristics and behaviors that are similar to previously identified frauds (Available through additional subscription).
20
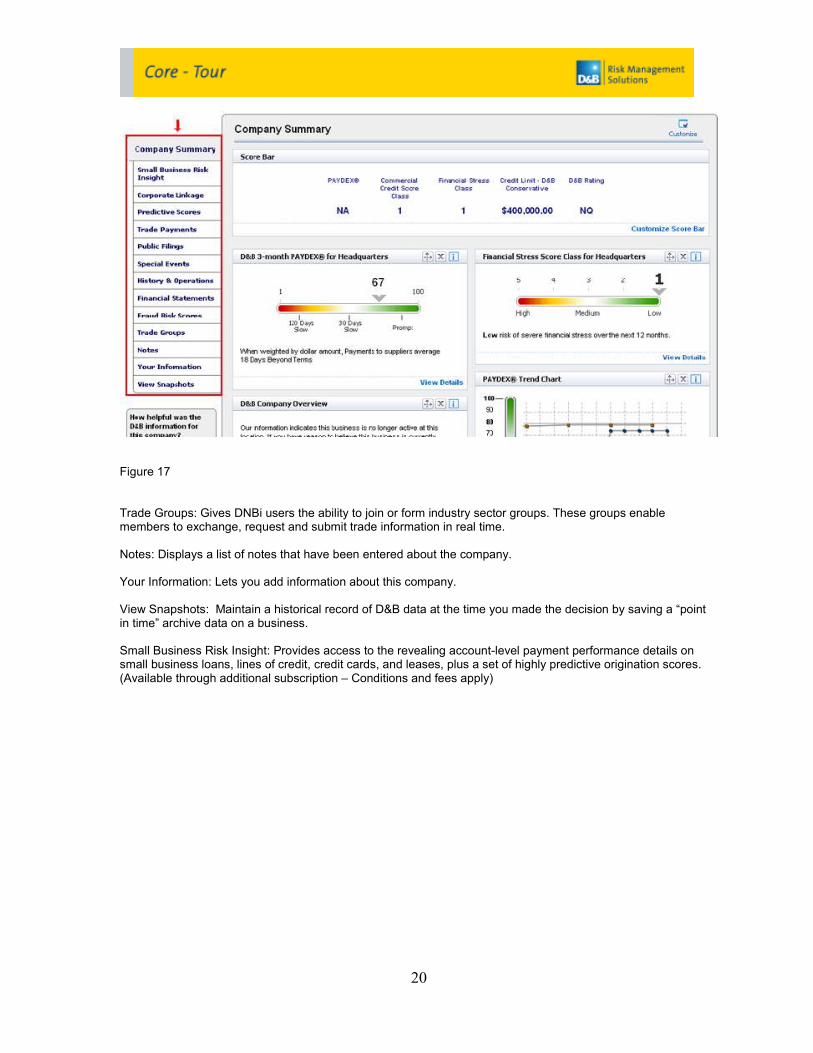
Figure 17 Trade Groups: Gives DNBi users the ability to join or form industry sector groups. These groups enable members to exchange, request and submit trade information in real time. Notes: Displays a list of notes that have been entered about the company. Your Information: Lets you add information about this company. View Snapshots: Maintain a historical record of D&B data at the time you made the decision by saving a “point in time” archive data on a business. Small Business Risk Insight: Provides access to the revealing account-level payment performance details on small business loans, lines of credit, credit cards, and leases, plus a set of highly predictive origination scores. (Available through additional subscription – Conditions and fees apply)

21
4.5 Corporate Linkage Tab
In DNBi, you have access to the Interactive Family Tree which is a Java application which will provide a dynamic visual means of viewing the D&B family linkage information for the company you are reviewing. To view the Dynamic Family Tree, open a report and navigate to the Corporate Linkage tab. Click on the Link “View Dynamic Family Tree Information” and the java application will open in a new window. The menu bar across the top of the page allows you to expand or contract the layers of family tree members displayed. You can also click to close top or bottom levels shown to reduce the number of companies displayed in the tree. If the company options would display more than 10 companies, a list will appear on the right side showing all companies in the family tree and designate if they type of location (such as S for Single, B for Branch)
Figure 18

22
You can display the risk level associated with each of the displayed companies by clicking on the “Show Risk level” checkbox which will color code the company boxes displayed based on their current Commercial Credit Score when available. Click View Details inside any company box to order that company’s D&B report in DNBi and you will be returned to the main DNBi screen showing the report for the company selected Click Expand below to show any related subsidiaries or branches that are owned by the company in the box you are viewing and click ‘close level below’ to remove those boxes from view. Expand above does the same for entities which have ownership of the company of focus. Click “Center this” within the company box to make that company the center of focus and display the related company’s directly above and below it in the family tree. You can also click on Center this on the list of companys that appears on the right side to center any of those companies instead. Click Exit to close the Family Tree window and return to DNBi.

23
4.6 Print
Print the company information to keep a print record of the decision in your paper files.
• Print the entire report, or just the sections that matter most to you by using the preferences icon to the right of the Print icon. • Customized Company Summary can also be printed.
Figure 19

24
4.7 PDF
After August of 2007, you can convert a Live report or Snapshot to a PDF file. The PDF will be generated with sections you selected in the preferences window. You can print or save the PDF to your PC for future reference.
Figure 20

25
4.8 Email
You can also email the company information you’ve just viewed, along with your comments – so you can notify
colleagues of your decisions. The email will contain the report sections in your saved Preferences. If you would like to e-mail the entire report.
Figure 21
26
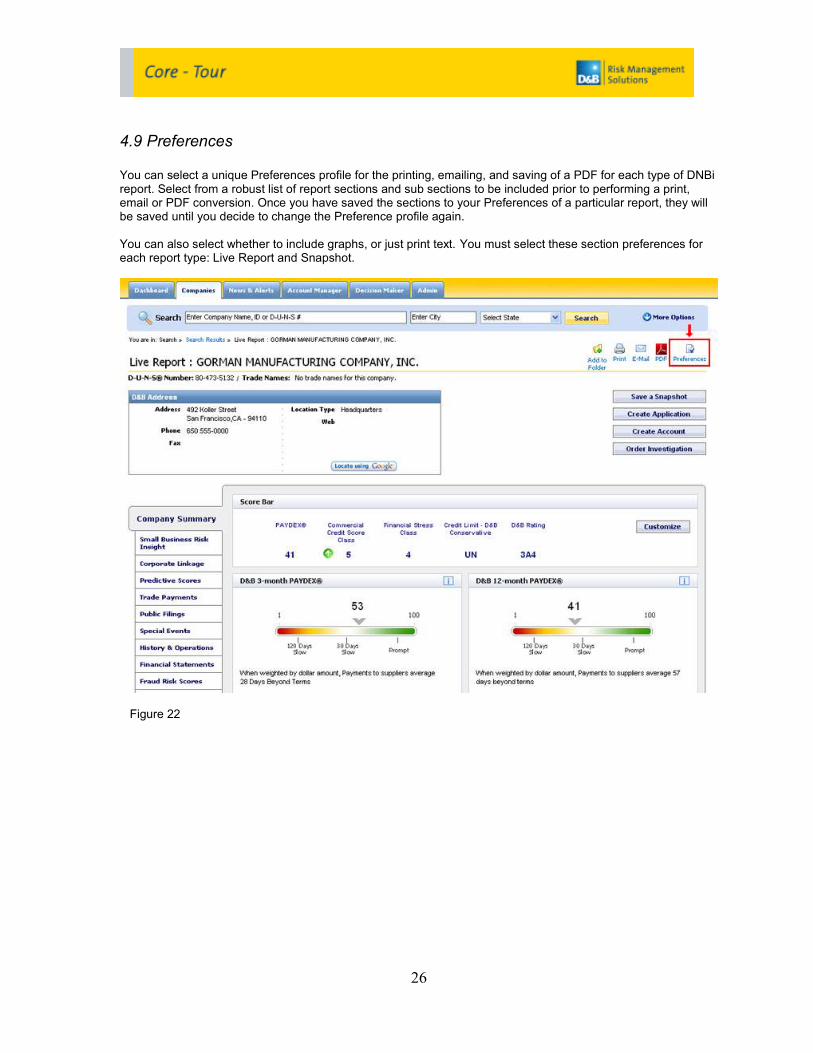
4.9 Preferences You can select a unique Preferences profile for the printing, emailing, and saving of a PDF for each type of DNBi report. Select from a robust list of report sections and sub sections to be included prior to performing a print, email or PDF conversion. Once you have saved the sections to your Preferences of a particular report, they will be saved until you decide to change the Preference profile again. You can also select whether to include graphs, or just print text. You must select these section preferences for each report type: Live Report and Snapshot.
Figure 22

27
4.10 Add to Folder
Finally, if you would like to monitor the company in the future, you can add it to your DNBi Portfolio by clicking on the “Add to Folder” button. You can save the company in an existing folder or create a new folder and set options for folder sharing. You can choose to create a folder to organize your portfolio for easy monitoring. Or, you can create a Smart Folder. A Smart Folder allows you to set rules that automatically populate the folder with companies added to your other folders. Simply choose the Smart Folder option when creating a new folder and build your rules for the folder. Once you save the company to a folder, it is registered for monitoring. To find the company in the future,
you can search for it using either the Quick Search or advanced search features, or locate it within its folder on the Companies tab.
Figure 23

28
5. Companies
5.1 Overview
The DNBi Companies section helps you organize your portfolio.
You can get a holistic view of your customer base by viewing all of the companies in your DNBi portfolio, providing you with current information on all of the companies you have reviewed and filed. You can view all of the companies in your DNBi portfolio by selecting “All Companies” folder. You can view the status of investigations you have requested via DNBi. Click to view the status of individual investigation requests or view the investigation response.
Figure 24

29
5.2 Creating Folders
If you need to segment your portfolio, you can create your own personal folders so that you can monitor and save similar companies in one place and always know where to go for information.
SHARING: You can choose to share a folder or keep it private. To manage sharing on folders you have created previously, click on the “Option” link and “>Show Sharing Options” link to select users or roles in the workspace who can see this folder. ALERTS: Choose an alert profile to apply to this folder and customize alerts on the companies tracked in each folder. Restricted / Unrestricted views: Your DNBi Admin user can apply a Restricted or Unrestricted option to a user’s profile. A Restricted user will be able to see, search and receive alerts only on the reports he/she has pulled. An Unrestricted user, on the other hand, will be able to see, search and receive alerts on all the reports pulled by every user in the workspace.
Figure 25

30
5.3 Using Folders
To view the companies in a particular folder, click on the folder name. You will automatically see detailed statistics on each of the companies in that folder, and you can get detailed information on any of the companies by clicking on the company name.
Figure 26

31
5.4 Customize Columns
You can also customize company information to display what is most important to you.
Choose the statistics you would like to see when viewing your companies, and click on “Update List” button to save your preferences.
Figure 27

32
5.5 Snapshots
Snapshots allow you to capture today’s information about a company and store it in your DNBi account,
along with your notes for future reference. You can save as many Snapshots as you need, and they will be stored indefinitely on D&B’s servers. The Snapshots folder contains each Snapshot you’ve taken, so you always have a solid historical record
to consult. You can: • View your Snapshots in chronological order • View Snapshot details • Delete Snapshots you no longer need
Figure 28

33
6. News and Alerts
6.1 Overview
News and Alerts is one of the most powerful benefits of DNBi. It is highly customizable and enables DNBi to actively monitor your portfolio for you, both online and via email
U.S. companies added to folders in DNBi are automatically registered for account monitoring; DNBi will keep you up to date when changes occur that would cause you to revisit your credit decisions; giving you
the early warning system you need to manage risk effectively. • Automated notices are shown whenever a significant change has taken place in a customer’s
financial condition or operating status • Severe Risk warnings are generated when a trained D&B analyst believes that a change is severe
enough to warrant an immediate change in your credit decision. These Alerts are seamlessly integrated into the DNBi site, and accessible from every major section of
DNBi, including your Dashboard. The News and Alerts section holds all of the alerts that have been generated for your customers.
• View them in chronological order, or sort by subject headers • Delete news/alerts you no longer need To view the alert details, click on the link corresponding to the alert you want to view.
Figure 29

34
6.2 Customization DNBi allows extensive customization of your Alerts.
You can customize the default settings for automated alerts by identifying the changes you want to know about. We will customize the Severe Only profile, however, you get three different profiles that you can tailor to your needs and assign to your folders. First, identify which changes you want to know about by customizing a profile. For example, you might want to be notified when a company’s Paydex score changes by more than 5 points. Next, you need to assign the profile to the folder(s) that holds the companies you want to be notified on. For Example; you can assign the Severe Only profile to the All Companies folder. This alert profile will then be applied to the companies in this folder. All Alerts are posted to DNBi automatically, but you also may elect to receive alerts by email as well. You can enter up to six different email addresses in each alert profile.
Figure 30

35
7. Trade Groups
7.1 Overview Trade groups for DNBi, provided by Smyth Solutions, are forums that allow credit professionals servicing the same customer segments to share and compare information about the payment history of their shared customers and prospects. Trade Groups for DNBi supplement the wealth of information provided by DNBi by allowing you to view and share payment information with your industry peers in a safe and monitored online environment. With Trade Groups for DNBi, you can: • Receive notifications of customer changes from other group members • Evaluate the latest payment information on customers provided by other group members • Examine current information on subjects of interest to your industry • Eliminate the cost and meeting time required of traditional credit groups by leveraging a virtual
environment.
Trade Groups for DNBi is an add-on service, additional fees apply.
Figure 31

36
7.2 Access Trade Groups’ real-time customer trade information is easily accessible through the DNBi Dashboard or through each of the company credit files. On the Dashboard, the links displayed allow you to request or submit trade information in real-time on present or prospective customers with other group members. Trade Groups also allow you to view and add companies to be discussed at your group’s next live or virtual meeting. Within the company credit file, you can directly access trade information, request trade information, or submit trade information on a particular company. In addition to the financial analysis and paytrend data collected by D&B within the DNBi company credit file, trade group members can view the payment experiences contributed by other trade group members. As an added incentive for joining Trade Groups through DNBi, you will be able to view all public trade experiences contributed by members of all Trade Groups for DNBi.
Figure 32
37
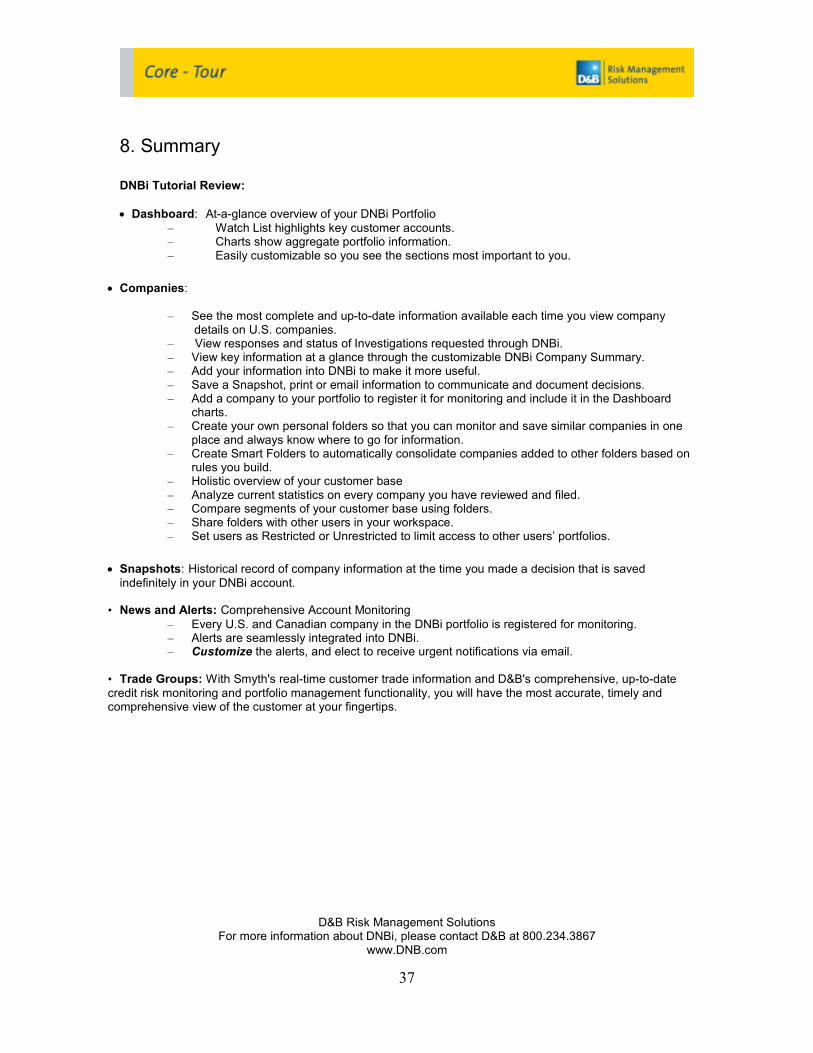
8. Summary
DNBi Tutorial Review:
• Dashboard: At-a-glance overview of your DNBi Portfolio
– Watch List highlights key customer accounts. – Charts show aggregate portfolio information. – Easily customizable so you see the sections most important to you.
• Companies:
– See the most complete and up-to-date information available each time you view company details on U.S. companies. – View responses and status of Investigations requested through DNBi. – View key information at a glance through the customizable DNBi Company Summary. – Add your information into DNBi to make it more useful. – Save a Snapshot, print or email information to communicate and document decisions. – Add a company to your portfolio to register it for monitoring and include it in the Dashboard
charts. – Create your own personal folders so that you can monitor and save similar companies in one
place and always know where to go for information. – Create Smart Folders to automatically consolidate companies added to other folders based on
rules you build. – Holistic overview of your customer base – Analyze current statistics on every company you have reviewed and filed. – Compare segments of your customer base using folders. – Share folders with other users in your workspace. – Set users as Restricted or Unrestricted to limit access to other users’ portfolios.
• Snapshots: Historical record of company information at the time you made a decision that is saved
indefinitely in your DNBi account.
• News and Alerts: Comprehensive Account Monitoring
– Every U.S. and Canadian company in the DNBi portfolio is registered for monitoring. – Alerts are seamlessly integrated into DNBi. – Customize the alerts, and elect to receive urgent notifications via email.
• Trade Groups: With Smyth's real-time customer trade information and D&B's comprehensive, up-to-date
credit risk monitoring and portfolio management functionality, you will have the most accurate, timely and comprehensive view of the customer at your fingertips.
D&B Risk Management Solutions For more information about DNBi, please contact D&B at 800.234.3867
www.DNB.com