Embed Size (px)
Citation preview

iii
Table of contents
Foreword . . . . . . . . . . . . . . . . . . . . . . . . . . . . . . . . . . . . . . . . . . . . . . . . . . . . . . . . . . . . . . . . . . . . . . . . . . . . . . . . . . . v
1. Introduction . . . . . . . . . . . . . . . . . . . . . . . . . . . . . . . . . . . . . . . . . . . . . . . . . . . . . . . . . . . . . . . . . . . . . . . . . . . . 11.1 The purpose of this paper . . . . . . . . . . . . . . . . . . . . . . . . . . . . . . . . . . . . . . . . . . . . . . . . . . . . . . . . . . . . . . 11.2 Outline of this paper . . . . . . . . . . . . . . . . . . . . . . . . . . . . . . . . . . . . . . . . . . . . . . . . . . . . . . . . . . . . . . . . . . 2
2. The context of situation testing in the United States . . . . . . . . . . . . . . . . . . . . . . . . . . . . . . . . . . . . . . . . . 22.1 The state of minority and immigrant relations . . . . . . . . . . . . . . . . . . . . . . . . . . . . . . . . . . . . . . . . . . . . . 2
2.1.1 The United States is a nation of immigrants . . . . . . . . . . . . . . . . . . . . . . . . . . . . . . . . . . . . . . . . . . . 22.1.2 Blacks . . . . . . . . . . . . . . . . . . . . . . . . . . . . . . . . . . . . . . . . . . . . . . . . . . . . . . . . . . . . . . . . . . . . . . . . . . 32.1.3 Hispanics . . . . . . . . . . . . . . . . . . . . . . . . . . . . . . . . . . . . . . . . . . . . . . . . . . . . . . . . . . . . . . . . . . . . . . . 4
2.2 Findings and hypotheses from non-testing research . . . . . . . . . . . . . . . . . . . . . . . . . . . . . . . . . . . . . . . . 62.2.1 Statistical studies of employment . . . . . . . . . . . . . . . . . . . . . . . . . . . . . . . . . . . . . . . . . . . . . . . . . . . 62.2.2 Public attitudes towards minorities . . . . . . . . . . . . . . . . . . . . . . . . . . . . . . . . . . . . . . . . . . . . . . . . . . 72.2.3 Victims' perceptions and reports . . . . . . . . . . . . . . . . . . . . . . . . . . . . . . . . . . . . . . . . . . . . . . . . . . . . 82.2.4 Research gaps for testing to address . . . . . . . . . . . . . . . . . . . . . . . . . . . . . . . . . . . . . . . . . . . . . . . . . 9
2.3 The development of situation testing in the U.S. . . . . . . . . . . . . . . . . . . . . . . . . . . . . . . . . . . . . . . . . . . 102.3.1 Three goals for situation testing . . . . . . . . . . . . . . . . . . . . . . . . . . . . . . . . . . . . . . . . . . . . . . . . . . . 102.3.2 Four studies matching the ILO research design . . . . . . . . . . . . . . . . . . . . . . . . . . . . . . . . . . . . . . . 11
3. Procedures in four U.S. audit studies . . . . . . . . . . . . . . . . . . . . . . . . . . . . . . . . . . . . . . . . . . . . . . . . . . . . . 123.1. Tester selection . . . . . . . . . . . . . . . . . . . . . . . . . . . . . . . . . . . . . . . . . . . . . . . . . . . . . . . . . . . . . . . . . . . . . 123.2 Tester training . . . . . . . . . . . . . . . . . . . . . . . . . . . . . . . . . . . . . . . . . . . . . . . . . . . . . . . . . . . . . . . . . . . . . . 143.3 Sampling job vacancies . . . . . . . . . . . . . . . . . . . . . . . . . . . . . . . . . . . . . . . . . . . . . . . . . . . . . . . . . . . . . . . 153.4 Field procedures . . . . . . . . . . . . . . . . . . . . . . . . . . . . . . . . . . . . . . . . . . . . . . . . . . . . . . . . . . . . . . . . . . . . 15
4. Empirical results from the four U.S. studies . . . . . . . . . . . . . . . . . . . . . . . . . . . . . . . . . . . . . . . . . . . . . . . 174.1 Discrimination rates in the ILO format . . . . . . . . . . . . . . . . . . . . . . . . . . . . . . . . . . . . . . . . . . . . . . . . . . 174.2 Discrimination rates in the authors' formats . . . . . . . . . . . . . . . . . . . . . . . . . . . . . . . . . . . . . . . . . . . . . . 194.3 Relating these rates to the overall labour market . . . . . . . . . . . . . . . . . . . . . . . . . . . . . . . . . . . . . . . . . . 204.4 The prevalence of reverse discrimination . . . . . . . . . . . . . . . . . . . . . . . . . . . . . . . . . . . . . . . . . . . . . . . . 214.5 Variations in the prevalence of discrimination . . . . . . . . . . . . . . . . . . . . . . . . . . . . . . . . . . . . . . . . . . . . 22
4.5.1 Variation between racial/ethnic groups . . . . . . . . . . . . . . . . . . . . . . . . . . . . . . . . . . . . . . . . . . . . . . 224.5.2 Variations within a metropolitan area . . . . . . . . . . . . . . . . . . . . . . . . . . . . . . . . . . . . . . . . . . . . . . . 234.5.3 Variations between metropolitan areas . . . . . . . . . . . . . . . . . . . . . . . . . . . . . . . . . . . . . . . . . . . . . . 26
4.6 Examples of discriminatory behaviour . . . . . . . . . . . . . . . . . . . . . . . . . . . . . . . . . . . . . . . . . . . . . . . . . . 274.6.1 Opportunities to interview . . . . . . . . . . . . . . . . . . . . . . . . . . . . . . . . . . . . . . . . . . . . . . . . . . . . . . . . 274.6.2 Job offers or referrals . . . . . . . . . . . . . . . . . . . . . . . . . . . . . . . . . . . . . . . . . . . . . . . . . . . . . . . . . . . 284.6.3 Compensation . . . . . . . . . . . . . . . . . . . . . . . . . . . . . . . . . . . . . . . . . . . . . . . . . . . . . . . . . . . . . . . . . . 284.6.4 Steering . . . . . . . . . . . . . . . . . . . . . . . . . . . . . . . . . . . . . . . . . . . . . . . . . . . . . . . . . . . . . . . . . . . . . . . 294.6.5 Access to additional opportunities . . . . . . . . . . . . . . . . . . . . . . . . . . . . . . . . . . . . . . . . . . . . . . . . . 294.6.6 The cumulative effect . . . . . . . . . . . . . . . . . . . . . . . . . . . . . . . . . . . . . . . . . . . . . . . . . . . . . . . . . . . . 29
4.7 Psychological processes of discrimination . . . . . . . . . . . . . . . . . . . . . . . . . . . . . . . . . . . . . . . . . . . . . . 30
5. Correspondence testing . . . . . . . . . . . . . . . . . . . . . . . . . . . . . . . . . . . . . . . . . . . . . . . . . . . . . . . . . . . . . . . . . 345.1 Research procedures . . . . . . . . . . . . . . . . . . . . . . . . . . . . . . . . . . . . . . . . . . . . . . . . . . . . . . . . . . . . . . . . . 345.2 Empirical findings . . . . . . . . . . . . . . . . . . . . . . . . . . . . . . . . . . . . . . . . . . . . . . . . . . . . . . . . . . . . . . . . . . . 36
6. Summary and conclusions . . . . . . . . . . . . . . . . . . . . . . . . . . . . . . . . . . . . . . . . . . . . . . . . . . . . . . . . . . . . . . . . . 386.1 Summary of empirical findings . . . . . . . . . . . . . . . . . . . . . . . . . . . . . . . . . . . . . . . . . . . . . . . . . . . . . . . . 386.2 Implications for public policy in the United States . . . . . . . . . . . . . . . . . . . . . . . . . . . . . . . . . . . . . . . . 39
Bibliography . . . . . . . . . . . . . . . . . . . . . . . . . . . . . . . . . . . . . . . . . . . . . . . . . . . . . . . . . . . . . . . . . . . . . . . . . . . . . . . 41
Appendix: Additional employment studies in the United States using situation testing . . . . . . . . . . . . . . . . 46

iv
Tables
1. Characteristics of four U.S. testing studies . . . . . . . . . . . . . . . . . . . . . . . . . . . . . . . . . . . . . . . . . . . . . . . . . . . 132. Discrimination rates calculated as the ILO specifies . . . . . . . . . . . . . . . . . . . . . . . . . . . . . . . . . . . . . . . . . . . 183. Discrimination rates calculated by the studies’ authors . . . . . . . . . . . . . . . . . . . . . . . . . . . . . . . . . . . . . . . . . 204. Effect of selected circumstances on the probability that a minority tester will experience
less favourable treatment . . . . . . . . . . . . . . . . . . . . . . . . . . . . . . . . . . . . . . . . . . . . . . . . . . . . . . . . . . . . . . . 245. Comparison of application processing for Black and White testers . . . . . . . . . . . . . . . . . . . . . . . . . . . . . . . 316. Results of correspondence tests as calculated by the study authors . . . . . . . . . . . . . . . . . . . . . . . . . . . . . . . 37
International Migration Papers . . . . . . . . . . . . . . . . . . . . . . . . . . . . . . . . . . . . . . . . . . . . . . . . . . . . . . . . . . . . . 47

v
1 Forty in the case of Convention No. 97, one hundred and twelve in the case of Convention No. 111, andseventeen in the case of Convention No. 143.
Foreword
The following study has been elaborated under the auspices of the ILO's Migration forEmployment Branch. The objectives of the Branch are to contribute to (i) the evaluation,formulation and application of international migration policies suited to the economic and socialaims of governments, employers' and workers' organizations, (ii) the increase of equality ofopportunity and treatment of migrants and the protection of their rights and dignity. Its means ofaction are research, technical advisory services and co-operation, meetings and work concernedwith international labour standards. The Branch also collects, analyses and disseminates relevantinformation and acts as the information source for ILO constituents, ILO units and other interestedparties.
The ILO has a constitutional obligation to protect the 'interests of workers when employed incountries other than their own'. This has traditionally been effected through the elaboration,adoption and supervision on international labour standards, in particular the Migration forEmployment Convention (Revised), 1949 (No. 97); the Discrimination (Employment andOccupation) Convention, 1958 (No. 111); the Migrant Workers (Supplementary Provisions)Convention, 1975 (No. 143); and the non-binding Recommendations supplementing them.International legal instruments of this kind aim to influence national laws and regulations in suchcountries as ratify the binding Conventions; and in this way they change not only legislation but theactual practices as well.
The key concern of ILO standards for migrant workers is non-discrimination or equality ofopportunity and treatment. Many countries broadly adhere to this objective in the economic andsocial spheres. Some countries ratify ILO Conventions1 and to their level best to fulfil theobligations deriving from them. One might expect, therefore, that discrimination would no longerbe part of the legislation or practices of these countries. Unfortunately, a great deal ofcircumstantial evidence exists that this assumption does not hold in certain respects and especiallynot at the workplace in private or public enterprises; and such evidence also exists for countriesnot having ratified ILO Conventions.
Therefore, the ILO has launched a global programme to combat discrimination against migrantworkers and ethnic minorities in the world of work. This programme, which focuses onindustrialized migrant-receiving countries, aims at tackling discrimination by informing policymakers, employers, workers and trainers engaged in anti-discrimination training on how legislativemeasures and training activities can be rendered more effective, based on an internationalcomparison of the efficacy of such measures and activities. The programme covers four maincomponents: (i) empirical verification of discrimination; (ii) research to assess the scope andefficacy of legislative measures designed to combat discrimination; (iii) research to document andto evaluate training and education in anti-discrimination or equal treatment; (iv) seminars todisseminate and draw conclusions from the research findings.

vi
1 F. Bovenkerk, M. Gras and D. Ramsoedh: Discrimination against migrant workers and ethnic minoritiesin access to employment in the Netherlands (Geneva, ILO, 1995); A. Goldberg, D. Mourinho: 'EmpirischerNachweis von Diskriminierung gegenüber ausländischen Arbeitnehmern beim Zugang zum Arbeitsmarkt', in: A.Goldberg, D. Mourinho und U. Kulke: Arbeitsmarkt-Diskriminierung gegenüber Ausländischen Arbeitnehmernin Deutschland (Geneva, ILO, 1995; English translation in preparation); Colectivo IOE: 'Discriminación contratrabajadores marroquíes en el acceso al empleo: Informe sobre España', in: Colectivo IOE y R. Pérez Molina: Ladiscriminación laboral a los trabajadores inmigrantes en España (Geneva, ILO, 1995; English translation inpreparation).
2 On the concept of disintegration see my contribution 'Labour market integration in Western and NorthernEurope: Which way are we heading', in W. R. Böhning and R. Zegers de Beijl: The integration of migrant workersin the labour market: Policies and their impact (ILO, Geneva, 1995).
Preliminary findings show discrimination in access to employment to be a phenomenon ofconsiderable and significant importance.1 The present paper by Marc Bendick Jr. documents theoccurrence of discrimination in the United States. Hispanics are discriminated against in everythird application procedure, whereas Blacks are discriminated against in one out of fiveapplication procedures. The paper convincingly shows that discrimination in access toemployment is widespread. It severely hampers minority groups' chances of finding employmentand thus contributes to societal exclusion and disintegration.2 The paper's conclusion, thataffirmative action programmes are indispensable to promote actively (im)migrants' equalparticipation in the labour force provides useful guidance to legislators and policy makers in allcountries with ethnic minority or migrant populations.
The Russell Sage Foundation, concerned as it is about the integration of migrants and ethnicminorities, generously financed the carrying out of this study, for which we are most grateful.
February 1996 W.R. Böhning

1 The author gratefully acknowledges helpful comments from R. Zegers de Beijl, E. Wanner, L. Brown, M.Egan, C. Jackson, M. Turner, D. Wissoker, C. Withers, and W. Zimmerman. However, all findings andconclusions are solely the responsibility of the author.
2 Ehrenberg and Smith (1994, p. 402). Bovenkerk (1992, p. 2) defines the concept as "unjustified unequaltreatment of groups or individual persons."
1. Introduction1
1.1 The purpose of this paper
Economists define employment discrimination as a process in the workplace in which membersof a demographic group - for example, racial and economic minorities or recent immigrants -experience differences in treatment or outcomes for reasons not based on productivity.2 Legaldefinitions reflect this same concept while specifying it in more detail. Thus, ILO's Discrimination(Employment and Occupation) Convention, 1958 (No. 111), Article 1, defines discrimination toinclude:
any distinction, exclusion or preference made on the basis of race, colour, sex, religion, politicalopinion, national extraction, or social origin, which has the effect of nullifying or impairing equalityof opportunity or treatment in employment or occupation (including access to vocational training,access to employment and to particular occupations, and terms and conditions of employment) ...Any distinction, exclusion or preference in respect of a particular job based on the inherentrequirements thereof shall not be deemed to be discrimination.
Similarly, in the United States, Title VII of the Civil Rights Act of 1964 (42 U.S. Code, Section2000e et seq., as amended), states that:
It shall be an unlawful employment practice for an employer ... to fail or refuse to hire or to dischargeany individual, or otherwise to discriminate against any individual with respect to his compensation,terms, conditions, or privileges of employment, because of such individual's race, colour, religion,sex or national origin ... An unlawful employment practice based on disparate impact is establishedunder this title only if ... the respondent fails to demonstrate that the challenged practice is job relatedfor the position in question and consistent with business necessity.
Situation testing is a powerful new tool for research on employment discrimination. Situationtesting (also called auditing) is a social science technique creating controlled, "laboratory-like"conditions in which to measure employers' candid responses to the personal characteristics of jobseekers. The technique involves sending matched pairs of research assistants to applysimultaneously for the same job vacancy. Within each pair, applicant characteristics related toproductivity (such as education, experience, and skills) are controlled by selecting, training, andcredentialing testers so that they appear equally qualified for the jobs they seek. Characteristicsnot related to productivity are then subjected to experimentation by pairing testers who differ inonly one personal characteristic, such as race. When testers within a pair receive substantiallydifferent responses to their applications, few assumptions and little analysis are required to inferthat these differences are a reaction to that personal characteristic.
In 1992, the International Labour Office (ILO) initiated a programme of situation testing inmultiple countries, repeating the same research procedures in each country to generate comparableresults. These procedures, developed for the ILO by F. Bovenkerk (Bovenkerk, 1992), arereferred to throughout this paper as the ILO research design.
When this ILO effort commenced, researchers in the United States were already involved insituation testing. Building on several decades of applying the technique to discrimination in

2
1 While developing their initial design, U.S. researchers were also aware of employment testing studiesconducted in the United Kingdom as early as the 1960s, especially the work of McIntosh and Smith (1974).
housing,1 testing work in the U.S. on employment began with development of a design comparableto that prepared for the ILO (Bendick, 1989a). Based on that design, a number of empirical studieswere completed between 1989 and 1992. Although undertaken independently from the ILO effort,methodological and substantive concerns common to both efforts resulted in a United States designthat closely parallelled the ILO research design. Accordingly, it is feasible for the United Statesto be represented in the ILO research by reporting results from existing studies rather thanconducting additional tests. This document is a "meta-analysis" that performs this reporting.
1.2 Outline of this paper
Chapter 2 of this report reviews the historical and social context in which situation testing foremployment discrimination has evolved in the United States and describes the overall scope ofsuch testing activities. Chapter 3 then focuses on four testing studies that match the ILO researchdesign in sufficient detail for their results to be utilized in the ILO's international comparison.Chapter 4 presents estimated rates of discrimination generated by these four studies and examplesof the discriminatory behaviour that these rates represent. Chapter 5 describes the implementationand findings of employment discrimination studies in the United States using correspondencetesting. Finally, Chapter 6 summarizes the findings of this paper and suggests their implicationsfor public policy.
2. The context of situation testing in the United States
2.1 The state of minority and immigrant relations
2.1.1 The United States is a nation of immigrants
Among market-oriented industrialized countries, the United States is one of the most ethnicallyand racially diverse. Within its population of approximately 250 million persons (U.S. Bureauof the Census, 1994, pp. 17, 18 and 53):
C The largest proportion consists of persons of European origin, primarily those whoseancestors immigrated to the United States between the seventeenth century and the firstdecades of the twentieth century. These groups account for approximately 76 per cent of thenational population.
C Blacks, who ancestors were imported involuntarily from Africa to work as slaves in thesouthern region of the United States until 1865, account for an additional 30 million persons,or twelve per cent of the population.
C Hispanics (immigrants or descendants of immigrants from Mexico, Central America, orSouth America) account for 22 million persons, or eight per cent of the population. SomeHispanics were already living in the Southwestern region of the United States when theseareas were annexed to the United States in 1848. Others have immigrated to the UnitedStates in more recent decades, including an estimated several million persons who are inthe United States without legal permission to immigrate (Chiswick, 1988).

3
1 For simplicity, two terms are used synonymously throughout this paper to refer to persons who are the"converse" of persons in these minority groups: "Whites" and "majority." Both terms are intended to refer toAmericans of European ancestry and thus to exclude the minority groups. Thus, for example, in reporting testingresults, when Hispanics and Whites are contrasted, Blacks are not included within Whites. However, in datagenerated by the U.S. Bureau of the Census, Hispanics are considered to belong to an ethnic group who may beof any race. Therefore, in some of the Census data quoted in this paper, Whites may include some WhiteHispanics.
C Persons of Asian origin total about 7 million persons, or three per cent of the population.Some of these groups, such as those of Chinese and Japanese ancestry, began to emigrate tothe United States during the nineteenth century. Others, often of Southeast Asian ancestrysuch as Vietnamese and Cambodians, have arrived in large numbers primarily since theUnited States' military involvement in Vietnam during the 1960s and 1970s.
C Native Americans (American Indians, Eskimos, and Aleuts) are the only groups whose
ancestors were not immigrants to the United States within recorded history. They accountfor about two million persons, or less than one per cent of the population.
In the 350 years since European immigration began to what is now the United States, successivewaves of migrants have gradually been assimilated into the nation's social and economicmainstream. For example, the largest numbers of immigrants from Southern and Eastern Europe(from nations such as Italy, Greece, and Russia) arrived in the United States during the lastdecades of the nineteenth century and first decades of the twentieth century. At that time, theyconstituted an "underclass" and encountered discrimination compared to persons of NorthernEuropean and Western European ancestry who had predominantly arrived decades earlier. Yetby the 1990s, several generations later, descendants of Southern and Eastern Europeans are foundthroughout all segments of life in the United States and at all levels of employment (Borjas, 1994a;Borjas, 1994b; Borjas and Freeman, 1992).
For other racial/ethnic groups and for immigrants of more recent origin, however, integrationinto United States society and labour market is far from complete. Because they are the largestrace/ethnic minority groups in the country and because they are the subject of situation testingdiscussed in this paper, two groups are particularly important to discuss: Blacks and Hispanics.
2.1.2 Blacks
The integration issue of longest standing and greatest prominence in economic and social lifein the United States involves Blacks (synonymously, Black Americans or African Americans).When slavery was abolished in 1865 as a result of the United States Civil War, those Blacks whohad been slaves faced a society where separation of the races remained the social norm, and theyentered the labour market with substantial deficits in education and occupational experiencecompared to the White population.1 In former slave-holding regions, these deficits were oftenperpetuated by state and local laws (called "Jim Crow" laws) mandating segregation in housing,education, public accommodations, and employment. In the rest of the nation, although segregationwas not generally reinforced by laws, Blacks remained primarily segregated into minorityresidential neighbourhoods, schools of lower quality, and a limited range of lower-levelemployment opportunities.
The 1960s brought to the United States a civil rights revolution in social customs, backed bynational laws rendering racial discrimination illegal in housing, education, public services, andemployment (Rutherglen, 1994). The thirty years since that time have witnessed dramatic

4
convergence between Blacks and Whites in many indicators of social and economic status and anincrease in Blacks in the "middle class." Despite these gains, however, for a substantial part ofthe Black population, patterns of de facto disadvantage persist in all principal indicators of labourmarket success. For example (Jaynes and Williams, 1989, pp. 294-315; U.S. Bureau of theCensus, 1994, pp. 396, 407, 426):
C Unemployment. Unemployment rates for Blacks average approximately double those ofWhites (in 1993, for example, 6.0 per cent for Whites and 12.9 per cent for Blacks).
C Earnings. In 1984, the hourly wage rate for Black men averaged 72 per cent of that ofWhite men, and their annual earnings averaged 56 per cent of that for White men. For Blackwomen, the corresponding figures, compared to White women, were 91.6 per cent of wagerates and 99.0 per cent of annual earnings.
C Access to training. As of 1990, 8.5 per cent of Black persons aged 18-64 had receivedformal work-related training provided by an employer, compared to 11.5 per cent forcomparable Whites.
C Occupations. In the 1980s, the proportion of employed Black men in managerial andprofessional positions achieved the level that had prevailed for White men three decadesearlier; for Black women, the corresponding lag compared to White women was twodecades. In 1993, Black persons represented 6.6 per cent of employment in managerial andprofessional occupations and 6.0 per cent of employment in the skilled construction crafts,while they accounted for 16.7 per cent of labourers and 17.3 per cent of non-supervisoryservice workers. The former figures are below the overall representation of Blacks in theUnited States' civilian labour force at that time, which was 10.2 per cent, and the latterfigures are above that figure.
Differences between Blacks and Whites in workplace qualifications partially explain suchdifferences. For example, in 1993, 70.4 per cent of the Black population aged 25 and older hadcompleted secondary school, compared to 81.5 per cent of the comparable White population (U.S.Bureau of the Census, 1994, p. 157). Nevertheless, the persistence of substantial differencesbetween Blacks and their White counterparts in labour market status, in combination with the longhistory of socially- and legally-sanctioned differences in their treatment, is consistent with thehypothesis that labour market discrimination against Blacks is also an important part of theexplanation.
2.1.3 Hispanics
The second largest minority group in the United States' labour market is Hispanics(synonymously, Hispanic Americans or Latinos). Persons of Hispanic origin have long constitutedpart of the population in the Southwestern region of the country, including states such as Californiaand Texas, that were part of Mexico until 1848. However, during the 1980s and 1990s, theirnumbers have increased rapidly, become more diverse in terms of cultural subgroups within theHispanic category (now including Mexicans, Cubans, Puerto Ricans, Central Americans, andothers), and have dispersed more widely throughout the nation. In 1990, Hispanics constituted62.5 per cent of the population in Miami, 39.9 per cent in Los Angeles, 27.6 per cent in Houston,24.4 per cent in New York City, and 19.6 per cent in Chicago (U.S. Bureau of the Census, 1994,p. 44).

5
In parallel with Blacks, Hispanics in the United States tend to experience substantially lesslabour market success than their White counterparts. For example (U.S. Bureau of the Census,1994, pp. 396, 407; U.S. Bureau of Labor Statistics, 1992, p. 73):
C Unemployment. Unemployment rates for Hispanics are persistently higher than for theirWhite counterparts, although not so high as for their Black counterparts – in 1993, forexample, 10.6 per cent for Hispanics, compared to 6.0 per cent for Whites and 12.9 per centfor Blacks.
C Earnings. In 1992, the median weekly earnings for Hispanic males employed full-time was$322 per week, which was 59.8 per cent of the comparable figure for Whites and 91.7 percent of the comparable figure for Blacks. For women, the parallel figure was $284 perweek, which was 76.5 per cent of the figure for their White counterparts and 88.8 per centof that for their Black counterparts.
C Access to training. As of 1990, 10.9 per cent of Hispanics aged 18 to 64 had receivedformal work-related training provided by an employer, compared to 11.5 per cent forcomparable Whites.
C Occupations. In 1993, Hispanics represented 4.0 per cent of employment in managerial andprofessional occupations and 7.0 per cent of employment in the skilled construction crafts,while they accounted for 13.7 per cent of labourers and 11.2 per cent of non-supervisoryservice workers. The former figures are below the overall representation of Hispanics inthe United States civilian labour force at that time, which was 7.8 per cent, and the latterfigures are above that figure.
Even more strongly than for Blacks, differences in employment qualifications between
Hispanics and their majority counterparts are important in explaining these outcomes:
C Educational credentials. In 1993, 53.1 per cent of Hispanic males aged 25 and older hadcompleted secondary school, compared to 81.5 per cent of Whites and 70.4 per cent ofBlacks; 9.5 per cent of these Hispanic men had received a post-secondary degree, comparedto 25.7 per cent of counterpart Whites and 11.9 per cent of Blacks (U.S. Bureau of theCensus, 1994, p. 157).
C Command of English. As of 1990, 12.1 million (or 7.9 per cent) of persons in the UnitedStates of typical working age (18 to 64) spoke Spanish at home. Among these persons, 49.6per cent spoke English not very well or not at all (U.S. Bureau of the Census, 1994, p. 53).Research has estimated that lack of command of English is, in the United States labourmarket, associated with a substantial penalty in earnings, even after controlling for othercharacteristics such as education; for example, one study estimates this penalty at 17 per centof wages (Grenier, 1984; see also Borjas, 1994b).
Differences in qualifications do not account for all differences between Hispanics and othergroups in labour market success, however. Hispanics were not enslaved in the United States, andthey have only occasionally been subject to state and local laws imposing segregation in themanner it was imposed on Blacks. Nevertheless, they have frequently been treated by the majoritypopulation as socially undesirable, found non-Hispanic residential neighbourhoods unwelcoming,and been restricted to inferior educational opportunities, often in minority-dominated schools. Itis reasonable to hypothesize that parallel discriminatory experiences in the labour market accountfor at least some of their employment difficulties.
6
1 The earliest prominent work in this tradition was that of Myrdal (1944).
2 The relatively few studies concerning Hispanics in the United States labour market are consistent with themore numerous studies concerning Blacks in suggesting that discrimination continues to operate. For example,Reimers (1985) estimated that Hispanic males earn about five per cent less than equally-qualified Whites, andDeFreitas (1985) concluded that they have a higher probability of experiencing unemployment.
3 For example, most of the data sets on which econometric analyses have been conducted do not include directmeasures of individuals' abilities or motivation. To the extent that such "omitted variables" are related toproductivity and are correlated with variables that are included in the statistical analysis – such as race – estimatesof the effect of race per se may be distorted (Ehrenberg and Smith, 1994, pp. 21-24; Cain, 1986).
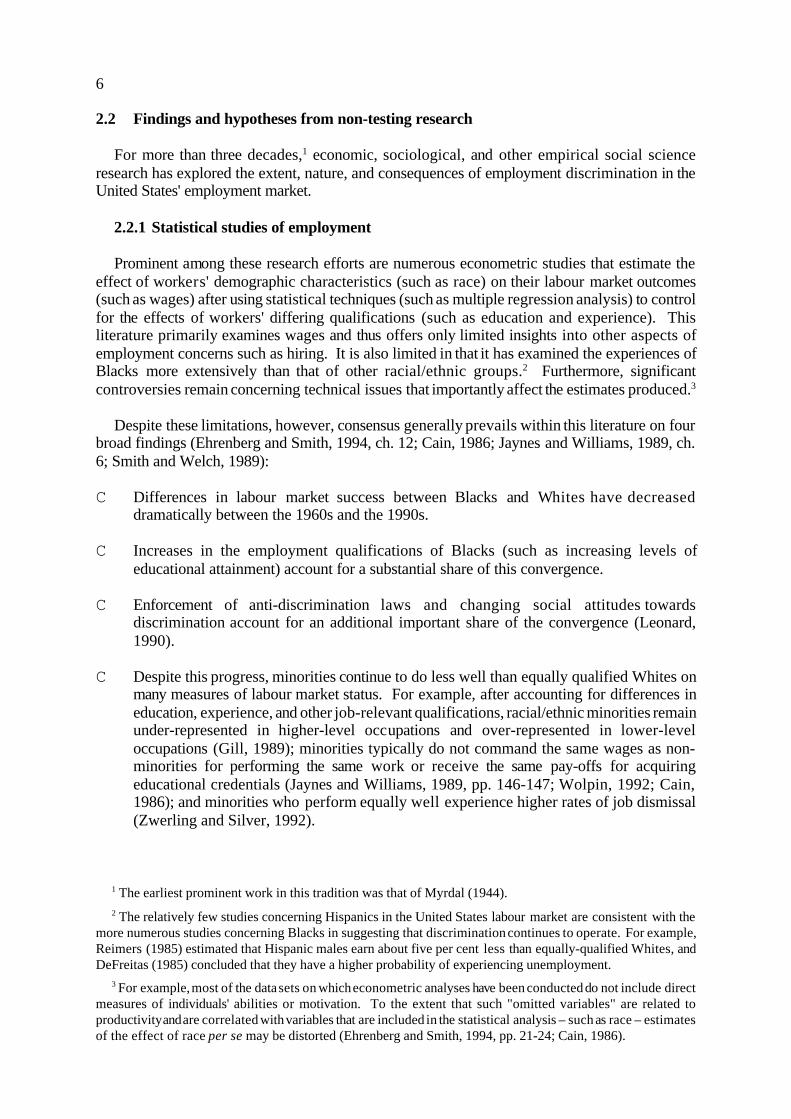
2.2 Findings and hypotheses from non-testing research For more than three decades,1 economic, sociological, and other empirical social science
research has explored the extent, nature, and consequences of employment discrimination in theUnited States' employment market.
2.2.1 Statistical studies of employment
Prominent among these research efforts are numerous econometric studies that estimate theeffect of workers' demographic characteristics (such as race) on their labour market outcomes(such as wages) after using statistical techniques (such as multiple regression analysis) to controlfor the effects of workers' differing qualifications (such as education and experience). Thisliterature primarily examines wages and thus offers only limited insights into other aspects ofemployment concerns such as hiring. It is also limited in that it has examined the experiences ofBlacks more extensively than that of other racial/ethnic groups.2 Furthermore, significantcontroversies remain concerning technical issues that importantly affect the estimates produced.3
Despite these limitations, however, consensus generally prevails within this literature on fourbroad findings (Ehrenberg and Smith, 1994, ch. 12; Cain, 1986; Jaynes and Williams, 1989, ch.6; Smith and Welch, 1989):
C Differences in labour market success between Blacks and Whites have decreaseddramatically between the 1960s and the 1990s.
C Increases in the employment qualifications of Blacks (such as increasing levels ofeducational attainment) account for a substantial share of this convergence.
C Enforcement of anti-discrimination laws and changing social attitudes towardsdiscrimination account for an additional important share of the convergence (Leonard,1990).
C Despite this progress, minorities continue to do less well than equally qualified Whites onmany measures of labour market status. For example, after accounting for differences ineducation, experience, and other job-relevant qualifications, racial/ethnic minorities remainunder-represented in higher-level occupations and over-represented in lower-leveloccupations (Gill, 1989); minorities typically do not command the same wages as non-minorities for performing the same work or receive the same pay-offs for acquiringeducational credentials (Jaynes and Williams, 1989, pp. 146-147; Wolpin, 1992; Cain,1986); and minorities who perform equally well experience higher rates of job dismissal(Zwerling and Silver, 1992).

7
1 Bovenkerk (1992, p. 14) applies the label "malignant discrimination" to what is referred to here asdiscrimination reflecting personal prejudice and the label "myopic discrimination" to what is characterized hereas statistical discrimination.
2 These same negative beliefs and attitudes may also prevail among members of one minority groupconcerning members of other minority groups.
1 See, for example, Arvey and Campion (1992) and Brief et al. (1994). Bovenkerk (1992, p. 4) labels this "adiscrepancy between what we say and what we do".
2.2.2 Public attitudes towards minorities
Additional evidence consistent with the hypothesis that racial/ethnic discrimination continuesto operate in the United States labour market is provided by studies of attitudes towards minoritygroups held by many members of the United States majority population. Theorists note that onepotential source of discrimination is personal prejudice, or preferences on the part of employers,customers, or fellow workers for not working with members of racial/ethnic minority groups(Becker, 1971). A second source of discrimination is stereotypes, that is, generalizationsconcerning the lack of qualifications or undesirability of members of a minority group that are usedto judge individuals from within that group; this latter process is sometimes labelled "statisticaldiscrimination” (Aigner and Cain, 1977).1 In both cases, perceptions and attitudes held bymembers of the White population may importantly influence opportunities outcomes for minorities.
Public opinion surveys indicate that substantial segments of the United States majoritypopulation continue to hold stereotyped beliefs and prejudiced attitudes towards minority groups.2
According to public opinion research, widely-held "ethnic images" of both Blacks and Hispanicsin the United States portray them, relative to majority-group members, as substantially lessintelligent, more lazy and welfare-dependent, and more prone to violence (Harris, 1989; Smith,1990; Jaynes and Williams, 1989, ch. 3).
In hiring decisions, the perceptions and attitudes held by company managers and other personneldecision-makers are particularly relevant. Research interviews with such decision-makers in theUnited States typically indicate that they readily generalize about racial and ethnic groups, and thecontent of these generalizations is predominantly highly adverse to minority job-seekers. In onestudy in Chicago, for example, common generalizations by employers concerning Black andHispanic workers emphasized their shortcomings in terms of work ethic, honesty, attitudes,communication skills, intelligence, educational preparation, and stability (Neckerman andKirschenman, 1991b; see also Tilly and Tilly, 1994, pp. 301-302). Among researchers,considerable controversy centres on the extent to which such attitudes are translated into actionssuch as hiring decisions.3 However, it is unlikely that such widely-held opinions have no influenceadverse to the employment prospects of minorities.
The hypothesis that prejudice and stereotyping operate to the detriment of racial and ethnicminorities in the workplace is further supported by the continued operation of race/ethnicdistinctions throughout other aspects of life in the United States. These circumstances include:
C widespread de facto segregation in housing and in housing-related social contacts (Masseyand Denton, 1993; Jaynes and Williams, 1989, chapter 2);
C incidents of discrimination experienced by minorities at the hands of law enforcementofficers and the legal system (Jaynes and Williams, 1989, chapter 9);
8
1 Because these questions refer to respondents' present employment, the responses reflect their experiencesat firms willing to hire minority workers. Presumably, the figures would be higher if firms that discriminate inhiring were also sampled.
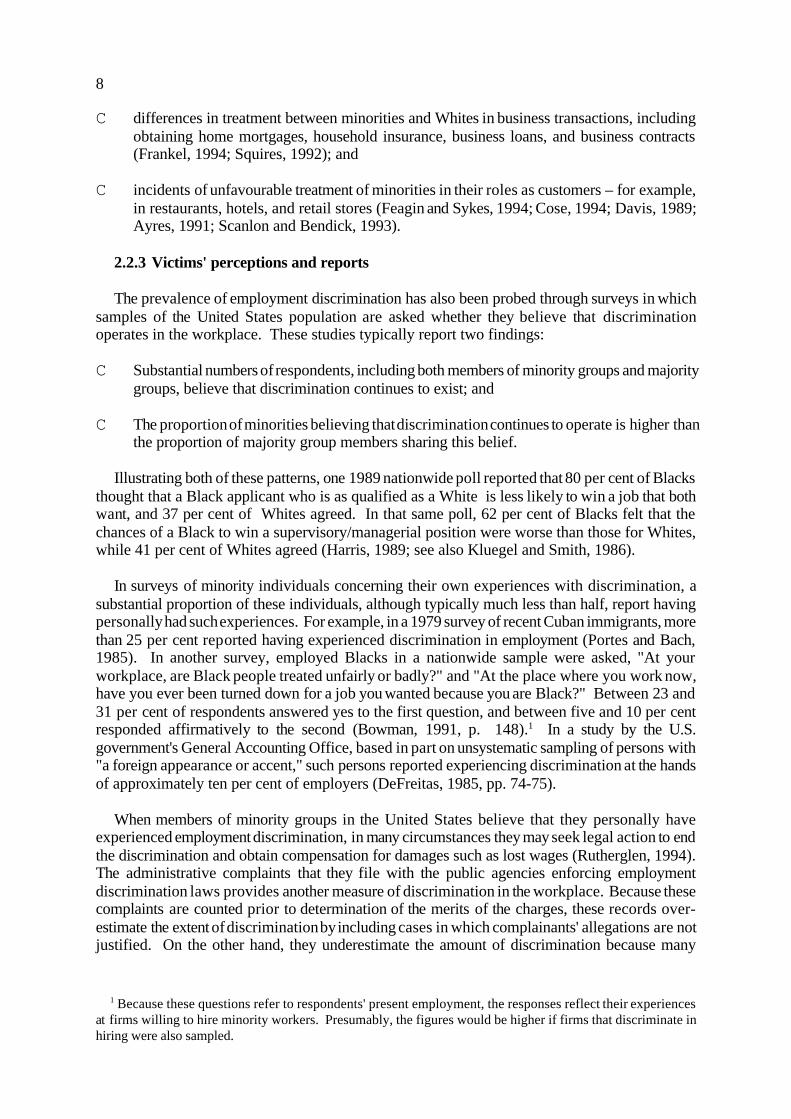
C differences in treatment between minorities and Whites in business transactions, includingobtaining home mortgages, household insurance, business loans, and business contracts(Frankel, 1994; Squires, 1992); and
C incidents of unfavourable treatment of minorities in their roles as customers – for example,in restaurants, hotels, and retail stores (Feagin and Sykes, 1994; Cose, 1994; Davis, 1989;Ayres, 1991; Scanlon and Bendick, 1993).
2.2.3 Victims' perceptions and reports
The prevalence of employment discrimination has also been probed through surveys in whichsamples of the United States population are asked whether they believe that discriminationoperates in the workplace. These studies typically report two findings:
C Substantial numbers of respondents, including both members of minority groups and majoritygroups, believe that discrimination continues to exist; and
C The proportion of minorities believing that discrimination continues to operate is higher thanthe proportion of majority group members sharing this belief.
Illustrating both of these patterns, one 1989 nationwide poll reported that 80 per cent of Blacksthought that a Black applicant who is as qualified as a White is less likely to win a job that bothwant, and 37 per cent of Whites agreed. In that same poll, 62 per cent of Blacks felt that thechances of a Black to win a supervisory/managerial position were worse than those for Whites,while 41 per cent of Whites agreed (Harris, 1989; see also Kluegel and Smith, 1986).
In surveys of minority individuals concerning their own experiences with discrimination, asubstantial proportion of these individuals, although typically much less than half, report havingpersonally had such experiences. For example, in a 1979 survey of recent Cuban immigrants, morethan 25 per cent reported having experienced discrimination in employment (Portes and Bach,1985). In another survey, employed Blacks in a nationwide sample were asked, "At yourworkplace, are Black people treated unfairly or badly?" and "At the place where you work now,have you ever been turned down for a job you wanted because you are Black?" Between 23 and31 per cent of respondents answered yes to the first question, and between five and 10 per centresponded affirmatively to the second (Bowman, 1991, p. 148).1 In a study by the U.S.government's General Accounting Office, based in part on unsystematic sampling of persons with"a foreign appearance or accent," such persons reported experiencing discrimination at the handsof approximately ten per cent of employers (DeFreitas, 1985, pp. 74-75).
When members of minority groups in the United States believe that they personally haveexperienced employment discrimination, in many circumstances they may seek legal action to endthe discrimination and obtain compensation for damages such as lost wages (Rutherglen, 1994).The administrative complaints that they file with the public agencies enforcing employmentdiscrimination laws provides another measure of discrimination in the workplace. Because thesecomplaints are counted prior to determination of the merits of the charges, these records over-estimate the extent of discrimination by including cases in which complainants' allegations are notjustified. On the other hand, they underestimate the amount of discrimination because many
9
2 Unpublished data, U.S. Equal Employment Opportunity Commission, May 1995. This volume of filingscorresponds to one new complaint per year for every 363 Black or Hispanic member of the United States labourforce.
2 Affirmative action is defined as “... any measure, beyond simple termination of a discriminatory practice,adopted to correct or compensate for past discrimination or prevent discrimination from recurring in the future”
incidents undoubtedly occur without victims filing formal charges. In 1994, a total of 67,003charges of race, ethnic, or national origin discrimination in employment were filed with the federalEqual Employment Opportunity Commission (EEOC) and its state and local counterpart agencies.1
2.2.4 Research gaps for testing to address
Together, these findings about employment patterns, public attitudes, and workers' perceptionsprovide considerable background on employment discrimination in the United States labourmarket. They suggest that it is reasonable to hypothesize that some discrimination againstracial/ethnic minorities continues to operate in that market today. However, they fail to providea generally accepted estimate of the extent of that discrimination.
A second shortcoming of available research is that it is largely indirect. For example, studiesof public attitudes examine potential precursors of discrimination, and statistical studies of wagesportray what may be the consequence of discrimination, but neither observes the process ofdiscrimination itself.
Among all types of employment discrimination, perhaps the greatest deficiencies in currentknowledge concern discrimination in hiring. If a job applicant is told that an advertised positionhas already been filled or that another applicant has been hired who is more qualified, thedisappointed job seeker typically does not have sufficient information to confirm or contradictthose statements. Thus, both statistical research and tabulations of complaints provide lesscredible estimates of discrimination in hiring than, for example, counterpart sources of informationconcerning discrimination in wages.
In short, prior to implementation of situation testing, research had left three needs largely unmetin terms of knowledge about employment discrimination in the United States labour market: theneed for quantitative estimates of the extent of discrimination; the need to examine discriminationdirectly rather than indirectly; and the need to focus on hiring.
2.3 The development of situation testing in the U.S.
2.3.1 Three goals for situation testing
Interest by researchers and research funders in filling these gaps in knowledge played some rolein originating situation testing in the United States. However, their interest would probably nothave sustained an extensive research programme had it not coincided with political developmentsthat increased the importance of the information that situation testing could generate.
Throughout the 1980s – most notably, with the election of Ronald Reagan as president in 1980– a politically more conservative approach began to dominate much of public policy in the UnitedStates. Prior to that time, generally liberal policies had, in varying degrees, shaped anti-discrimination efforts for several decades. Federal laws in the 1960s that had prohibited racialsegregation in employment, mandated equal employment opportunity for racial and ethnicminorities, and implemented pro-minority affirmative action in employment2 all reflected this

10
(U.S. Commission on Civil Rights, 1977, p. 1). Under U.S. law, affirmative action is required of certainemployers, such as firms holding federal contracts, and permitted on a voluntary basis for others (Rutherglen,1994, p. 23).
general trend. Court decisions throughout the 1960s and 1970s had generally ratified or expandedthe reach of anti-discrimination statutes. By the 1980s, however, conservative critics wereincreasingly attacking these public actions as inefficiently interfering with market outcomes andunjustly reducing employment opportunities for members of the majority population. These criticsoften argued that the problems of discrimination had been eliminated and that the time had comefor the nation to adopt a "colour blind" approach to the labour market (Rutherglen, 1994, pp. 30-34).
Reflecting this philosophy, the Reagan Administration reduced the aggressiveness ofenforcement activities by the federal government's Equal Employment Opportunity Commissionand appointed federal judges less sympathetic to anti-discrimination efforts. At the same time, thefederal Supreme Court produced a series of decisions constraining affirmative action inemployment and raising the standards of evidence required to attack discrimination throughlitigation (Boggs, Sellers and Bendick, 1993; Bendick, 1990).
Stung by such developments, advocates of continued anti-discrimination efforts repeatedlyemphasized their belief that discrimination had not been eliminated, so that these changes ofpolicies were, at best, premature. For example, in dissenting from one Supreme Court decision,three liberal judges of the United States Supreme Court stated (Wards Cove Packing Company v.Atonio, 109 Supreme Court 2215, p. 755):
Today a...majority of the Court takes three major strides backwards in the battle against racediscrimination.... One wonders whether the majority [of Supreme Court justices] still believes thatrace discrimination... against non-Whites is a problem in our society.
Supporters of continued activism against employment discrimination shared these justices'concern about the growing tendency to perceive racial/ethnic discrimination as a problem that hadbeen solved. They believed that situation testing would reveal that discrimination continues torequire public action and would do so in a dramatic form particularly useful in influencing publicopinion. At the same time, these advocates were aware that situation testing had been used forseveral decades as evidence in litigation concerning housing discrimination. As Supreme Courtrulings eroded the role of traditional forms of evidence in employment discrimination litigation,situation tests suggested itself as an alternative means of generating evidence for use in such cases(Boggs, Sellers and Bendick, 1993).
Thus, three objectives – generating additional knowledge through research, influencing publicopinion through dramatic findings, and providing evidence for enforcement litigation – convergedto support a programme of situation testing. By the late 1980s, the Rockefeller Foundation wasorganizing and financing these efforts, and several other large foundations subsequently joined insupport.
Research on employment testing began at The Urban Institute, a non-profit, non-partisanresearch organization which, with support from the Rockefeller Foundation, was already engagedin research on persistent poverty and the employment problems of the underclass in the UnitedStates. The first step was to develop a general research design for situation testing (Bendick,1989a). The Urban Institute then adapted and implemented that design in a study of discriminationagainst Hispanics sponsored by the federal government as part of an investigation of the impact

11
1 The appendix to this report briefly catalogues nine additional studies.
2 Unless noted otherwise, information throughout this chapter and the next is drawn from the followingsources: Urban Institute tests: Bendick (1989a), Cross et al. (1990), Turner, Fix and Struyk (1991), Fix and Struyk(1993), and Keeney and Wissoker (1994); Fair Employment Council tests: Bendick, Jackson, Reinoso and Hodges(1991), Bendick, Jackson and Reinoso (1994), and Fair Employment Council (1993). Additional information isbased on the author's personal knowledge.
on ethnic minorities of changes in United States immigration law. The results of that study werepublished in 1990 (Cross et al., 1990; Fix and Bean, 1990) and cited in Congressional debates atthat time. Shortly thereafter, The Urban Institute utilized financial support from foundations toconduct a parallel testing study on the employment experiences of Blacks (Turner, Fix and Struyk,1991; Fix and Struyk, 1993).
The work of the Urban Institute was designed primarily to promote the research and publicopinion objectives of situation testing. To develop testing as a form of evidence in anti-discrimination litigation, a new non-profit organization, the Fair Employment Council of GreaterWashington (FEC), was created in 1990. Since that time, the FEC has been methodically applyingtesting to litigation and establishing the relevant legal precedents (Boggs, Sellers and Bendick,1993; Yelnowsky, 1992; Welmer and Sudbury, 1992). However, the FEC has also completed anumber of research studies parallel to those of The Urban Institute and based on modifications ofthe same initial design. The first of these studies concerned Hispanics (Bendick, Jackson, Reynosoand Hodges, 1991), while the second concerned Blacks (Bendick, Jackson and Reynoso, 1994).
2.3.2 Four studies matching the ILO research design
The four studies just identified – one of Hispanics and one of Blacks by The Urban Institute andone of Hispanics and one of Blacks by the Fair Employment Council – are not the only situationtesting studies that have been conducted in the United States.1 However, those other testing studiesaddress forms of discrimination other than that against racial/ethnic minorities (for example, ageor sex discrimination) or apply methodologies that differ substantially from the ILO researchdesign. In contrast, these four studies parallel the ILO research design in sufficient detail for theirresults to be compared to those generated in other nations under the ILO's multi-national researchprogramme. Therefore, only these four studies will be discussed in the remainder of this paper.
3. Procedures in four U.S. audit studies
This section describes how face-to-face testing was implemented in the four U.S. audit studiesthat parallel the ILO research design as set forth in Bovenkerk (1992).2 Because these four studieswere implemented without direct contact with parallel ILO efforts, it should not be expected thatthey would have followed the ILO's specifications in every detail. Nevertheless, they followedthem sufficiently closely that the results of these studies, with some adjustments, are comparableto the results of other international tests conducted under the ILO research design.
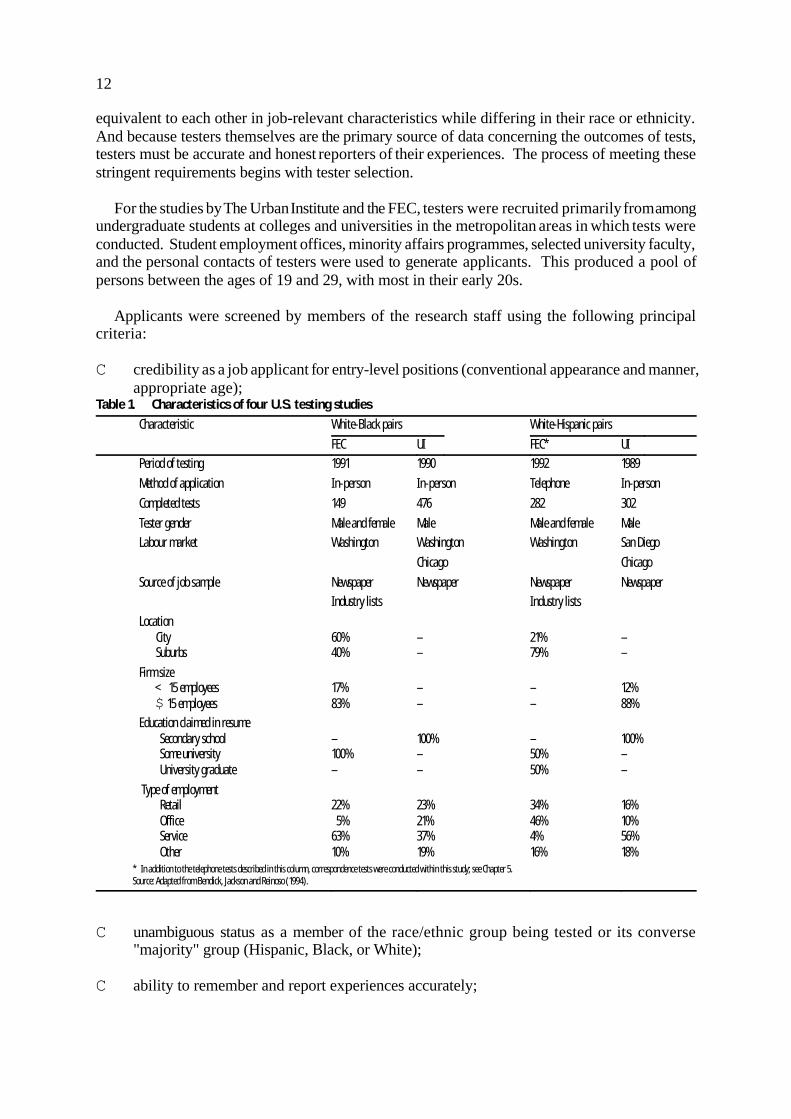
Table 1 briefly profiles the four studies described in this chapter.
3.1. Tester selection
For testing to produce analysable results, testers must be sufficiently credible applicants for thepositions they seek so that some of them receive job interviews and job offers. For testing toachieve its sought-for condition as a controlled experiment, the testers in each pair must be
12
equivalent to each other in job-relevant characteristics while differing in their race or ethnicity.And because testers themselves are the primary source of data concerning the outcomes of tests,testers must be accurate and honest reporters of their experiences. The process of meeting thesestringent requirements begins with tester selection.
For the studies by The Urban Institute and the FEC, testers were recruited primarily from amongundergraduate students at colleges and universities in the metropolitan areas in which tests wereconducted. Student employment offices, minority affairs programmes, selected university faculty,and the personal contacts of testers were used to generate applicants. This produced a pool ofpersons between the ages of 19 and 29, with most in their early 20s.
Applicants were screened by members of the research staff using the following principalcriteria:
C credibility as a job applicant for entry-level positions (conventional appearance and manner,appropriate age);
Table 1. Characteristics of four U.S. testing studies
Characteristic White-Black pairs White-Hispanic pairs
FEC UI FEC* UI Period of testing 1991 1990 1992 1989
Method of application In-person In-person Telephone In-person
Completed tests 149 476 282 302
Tester gender Male and female Male Male and female Male Labour market Washington Washington Washington San Diego
Chicago Chicago
Source of job sample Newspaper Newspaper Newspaper NewspaperIndustry lists Industry lists
Location City Suburbs
60%40%
––
21%79%
––
Firm size < 15 employees $ 15 employees
17%83%
––
––
12%88%
Education claimed in resume Secondary school Some university University graduate
–100%–
100%––
–50%50%
100%––
Type of employment Retail Office Service Other
22% 5%63%10%
23%21%37%19%
34%46%4%16%
16%10%56%18%
* In addition to the telephone tests described in this column, correspondence tests were conducted within this study; see Chapter 5. Source: Adapted from Bendick, Jackson and Reinoso (1994).
C unambiguous status as a member of the race/ethnic group being tested or its converse
"majority" group (Hispanic, Black, or White);
C ability to remember and report experiences accurately;

13
1 Tests might have been conducted in a "double blind" format – that is, with testers not being told thatdiscrimination was the subject of the study in which they were participating. This approach was implemented, forexample, in a testing study of race discrimination in automobile sales practices in the United States (Ayres, 1991).However, in employment testing, it is unrealistic to assume that testers would not infer the subject of the studyfrom the procedures they were following and the data they were asked to record. Instead of using a double-blinddesign, the U.S. studies sought to ensure the objectivity of tester-generated data by careful tester selection,extensive training, close supervision, data collection procedures that emphasize facts over judgements, and anorganizational culture of social science objectivity.
C absence of strong ideological beliefs about discrimination that might interfere withobjectivity; and
C willingness to follow research procedures exactly and work cooperatively.
From among applicants surviving this initial screening, the research staff formed teams consistingof one member of the relevant minority group and one White. In matching these teams, emphasiswas placed on:
C physical appearance (similar ages, height and weight, gender, and demeanour);
C communications style (articulateness, talkativeness, propensity to smile);
C general personality (shyness, neatness, maturity); and
C work histories (shared experiences in terms of past employment).
To complete large numbers of tests in a relatively short period, all four studies utilized multipleteams. The Urban Institute employed five teams of males in each of the two cities in which itconducted Black tests and four teams of males in each of the two cities in which it conductedHispanic tests. The Fair Employment Council employed six teams in its Black-White tests, threeteams of males and three teams of females; in its tests involving Hispanics (which were conductedby telephone), the FEC employed one pair of females and one pair of males.
The presence of female testers in two of the four United States studies represents a deviationfrom the ILO research design, which specified that all tester pairs should be male. The overallimpact of this deviation is unclear. In the two studies in which comparable data are available forboth genders, the estimated rate of discrimination was higher for males in tests involvingHispanics but higher for females in tests involving Blacks (see table 4 later in this paper).Additional testing studies will be required before confidence can be placed in the direction andmagnitude of adjustments for such interactions between gender and race/ethnicity. Accordingly,empirical results are reported in this paper without adjusting for the fact that part of the studysample in some studies was female.
3.2 Tester training
In all four studies, testers received training of approximately one week's duration. Trainingbegan with an explanation of testing,1 encompassed information on the job-seeking process andhow to be an effective applicant, and established systematic procedures for field work and datarecording. Role playing – practice interviews, filling in sample application forms – and exercisesin which testers observed the interview performance of their partners were part of this process.
14
2 Research staff identified the skills and other qualifications that were typical of entry-level occupations byconsulting published research (U.S. Department of Labor, 1990, U.S. Department of Labor, 1991) and byreviewing newspaper "help wanted" advertising for such positions.
1 All four studies excluded positions with government or non-profit organizations.
Training then concluded with a series of closely-critiqued practice tests in actual job-seekingsituations.
During training, members of the research staff worked with each tester to develop a fictionalbiography specifying personal histories, education, work experience, and job-relevant skills. These biographies were designed to make all testers strong candidates for the positions for whichthey were to apply.1 The biographies for each pair of testers were made equivalent, with onlyslight variations to keep their pairing from being apparent to potential employers. Testers' actualpersonal experiences were often incorporated into their testing biographies, with appropriateadaptations. Once the content of biographies was decided upon, one-page resumes were preparedfor the testers, neatly typed in standard but slightly differing formats (Swanson, 1991; Yate, 1988).
3.3 Sampling job vacancies
The ILO research design (Bovenkerk, 1992, p. 21-22) specifies the universe from whichvacancies were to be sampled as "all the vacancies for semi-skilled jobs in industry and theservice sector within the [geographic] area chosen for investigation". The focus should be jobs"one step up" from the lowest quality jobs (in which minority employment is assumed to beclustered, often with little competition from majority-group workers). In Bovenkerk's words(1992, p. 21), "The occupations should represent the type of jobs where the bulk of young adultsof the particular minority group would begin their upward working careers".
The ILO research design then calls for considering jobs typically addressed in local area dataand by the local labour exchange and selecting from among them a small number of specificoccupations to be tested. For example, Bovenkerk suggests that a sample of 175 tests might besplit among positions in the construction industry (bricklayer, carpenter); waiter; and lightproduction assembler.
In the four U.S. studies, a different procedure was followed which nevertheless generated agenerally comparable sampling frame. The goal of the process was a representative sample ofoccupations in the private sector2 that are permanent and full-time but "...are open to persons whoare recent high school graduates, have limited work experience, and no specific vocational skills.That is, they are 'generic' entry-level employment" (Bendick, 1989a, p. 16).
In the two studies conducted by The Urban Institute, vacancies were selected from positionsadvertised in the "help wanted" section of the Sunday edition of the largest-circulation newspaperin the metropolitan area. In the two studies conducted by the Fair Employment Council, this sourcewas used for part of the sampling frame, but additional vacancies were selected from "helpwanted" advertising in smaller newspapers circulated in suburban neighbourhoods within themetropolitan area; from private employment placement agencies listed in the local telephonedirectory; and from publicly-available lists of employers (for example, lists of hotels distributedby the local tourist bureau). In all cases, the specific vacancies to be tested were selected byrandom sampling within the sampling frame.

15
As the final section of table 1 reports, the resultant sample of vacancies tested emphasized jobsin the retail sector (for example, sales clerks, inventory stockers, or store manager trainees), inoffice positions (for example, receptionists, file clerks, or insurance claims processors), and inthe service sector (for example, hotel front desk clerks, waiters/waitresses, or delivery drivers).Jobs classified in table 1 as "other," which accounted for between 10 and 20 per cent of thesample in the different studies, included entry-level jobs in construction and manufacturing.
3.4 Field procedures
In all four studies, a research supervisor interacted closely with each pair of testers at all stagesof the job-seeking process. The supervisor selected vacancies to be tested using the samplingprocedures just described, assigned vacancies to tester teams, monitored the passage of each testerthrough the different stages of the application process, checked the completeness and accuracy ofdata as testers recorded their experiences, and provided immediate resolution of testers' questions.To maintain close supervision, when as many as half a dozen teams of testers were in the field full-time, one supervisor devoted virtually her or his full working time to this role (in some cases, withadditional assistance from a second supervisor).
All tests by The Urban Institute studies and some tests by the Fair Employment Council werecompleted by testers working full-time during university summer vacations; the remaining tests bythe FEC were completed by testers working part-time during their universities' academic year.Testers were paid for their work at a fixed rate per hour (for example, $8.00 per hour).
When a vacancy was assigned to a team of testers, half of the time the minority tester wasinstructed to contact the employer before his or her White counterpart, while the other half of thetime, they were instructed to do the reverse. The two applications were made on the same day,typically within approximately one hour of each other.
As soon as each stage of the application process (such as a telephone call or an interview) wascompleted, testers documented their experiences as soon as possible. Information was recordedon pre-structured data forms which emphasized factual questions (for example: How many minutesdid the interview last? What topics were discussed during the interview? Was the tester offereda job?) rather than subjective judgements concerning whether discrimination had occurred.Testers were instructed to enter these data prior to discussing their experiences with their testingpartners.
When a tester received a job offer, he or she was instructed to call the employer back withina few hours to refuse the offer. If asked, testers provided a reasonable explanation for their refusal(such as, "I took another job that paid slightly more.").
In the United States, it is common practice for employment application forms to request thenames and telephone numbers of references such as former employers. In both studies conductedby The Urban Institute, testers supplied such names and numbers, but the numbers did not work.In the Black-White tests by the FEC, the first telephone number provided for each tester connectedto a person (usually a local business owner, working as a volunteer) who supplied a favourablereference for the tester using a script prepared by FEC staff.

16
1 1,209 is the total of all tests in which both testers succeeded in presenting themselves to apply foremployment, as reported in row (1) of table 2. The number of "usable tests" as defined by the ILO, which isreported in row (3) of table 2, is 815.
1 The weights used in computing this weighted average are the number of usable tests, reported in row (3) oftable 2.
In the vast majority of the 1,209 tests initiated in the four studies,1 the testing process proceededsmoothly. Across the four studies, 67 per cent of the time that testers filed applications, at leastone tester was invited to a job interview; and at least one tester received a job offer an averageof 60 per cent of the time that at least one tester was interviewed. These rates suggest thatemployers generally perceived the testers to be credible, qualified job applicants. In only half adozen cases (less than one-half of one per cent of tests) did employers suspect that a tester was nota bona fide job applicant; and in no case where that occurred did it appear that the employersuspected that there was more than one false applicant or that the application was part of a test.
4. Empirical results from the four U.S. studies
4.1 Discrimination rates in the ILO format
The ILO research design (Bovenkerk, 1992, p. 12) states the fundamental research question ofthe ILO comparative study as follows: Do immigrants and ethnic minorities suffer from substantialdiscrimination in the labour market?
In mobilizing testing data to answer this question, the central measure of discrimination isdifferences in rates of job-seeking success: Who proceeds furthest in the job application process?Who receives a job offer? The "null hypothesis" of an absence of discrimination would beconfirmed if equally-qualified minority and majority testers met with success at equal rates, whilediscrimination is measured by the extent to which minorities are treated less favourably than theirWhite partners.
Of course, instances also arise in which minority job candidates are selected over majoritycandidates, reflecting either employer preferences in favour of minorities or reflecting randomeffects when two equally-qualified candidates compete for a single opening. Therefore, in testingstudies, outcomes are typically analysed by calculating the proportion of job applications in whichmajority applicants are successful, calculating the proportion of applications in which minoritiesare successful, and then subtracting the latter from the former to generate a net rate ofdiscrimination against minority job seekers.
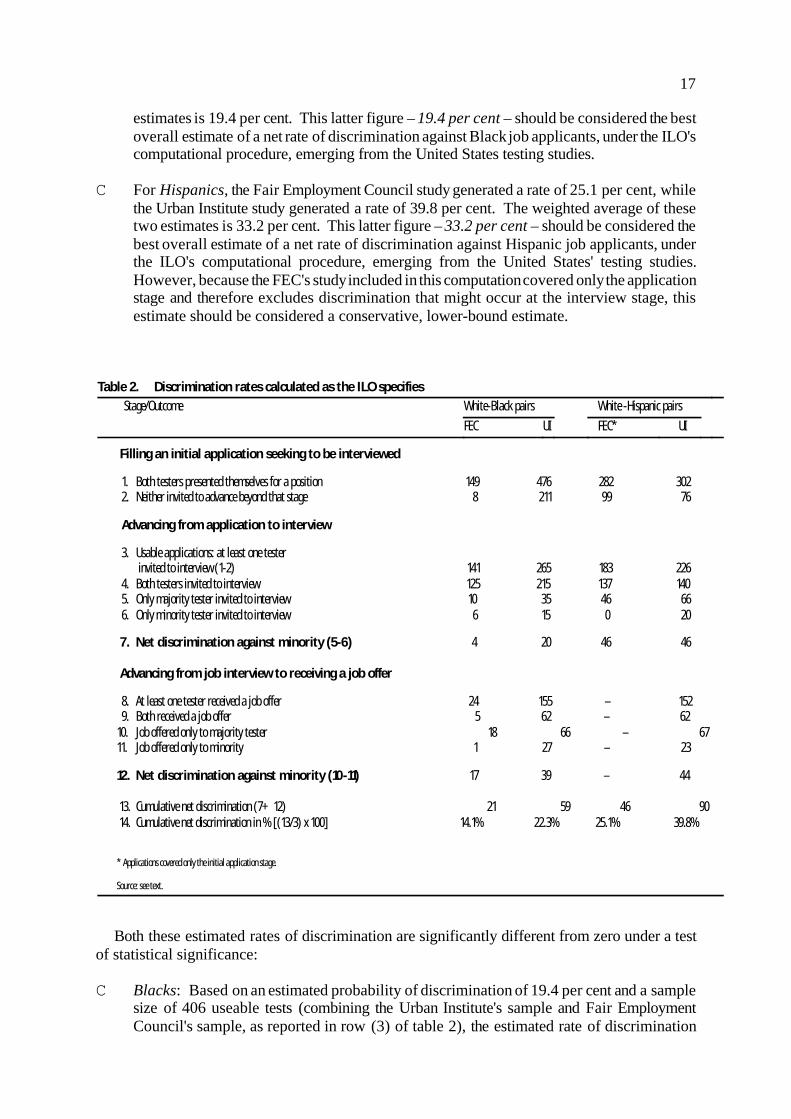
Table 2 presents a computation of these net rates of discrimination for the four United Statestesting studies described in section 3. To generate figures that are directly comparable to thoseproduced for other countries participating in the ILO's research programme, these computationsfollow the procedure specified by the ILO research design (Bovenkerk, 1992, p. 32). Row (14)of table 2 presents the estimated net rates of discrimination:
C For Blacks, the Fair Employment Council study generated a rate of 14.1 per cent, while theUrban Institute study generated a rate of 22.3 per cent. The weighted average2 of these two
17
estimates is 19.4 per cent. This latter figure – 19.4 per cent – should be considered the bestoverall estimate of a net rate of discrimination against Black job applicants, under the ILO'scomputational procedure, emerging from the United States testing studies.
C For Hispanics, the Fair Employment Council study generated a rate of 25.1 per cent, while
the Urban Institute study generated a rate of 39.8 per cent. The weighted average of thesetwo estimates is 33.2 per cent. This latter figure – 33.2 per cent – should be considered thebest overall estimate of a net rate of discrimination against Hispanic job applicants, underthe ILO's computational procedure, emerging from the United States' testing studies.However, because the FEC's study included in this computation covered only the applicationstage and therefore excludes discrimination that might occur at the interview stage, thisestimate should be considered a conservative, lower-bound estimate.
Table 2. Discrimination rates calculated as the ILO specifies Stage/Outcome White-Black pairs White -Hispanic pairs
FEC UI FEC* UI
Filling an initial application seeking to be interviewed
1. Both testers presented themselves for a position 149 476 282 2. Neither invited to advance beyond that stage 8 211 99
302 76
Advancing from application to interview
3. Usable applications: at least one tester invited to interview (1-2) 141 265 183 4. Both testers invited to interview 125 215 137 5. Only majority tester invited to interview 10 35 46 6. Only minority tester invited to interview 6 15 0
226 140 66 20
7. Net discrimination against minority (5-6) 4 20 46 Advancing from job interview to receiving a job offer
46
8. At least one tester received a job offer 24 155 – 152 9. Both received a job offer 5 62 – 62 10. Job offered only to majority tester 18 66 – 67 11. Job offered only to minority 1 27 – 23
12. Net discrimination against minority (10-11) 17 39 – 44
13. Cumulative net discrimination (7+12) 21 59 46 90 14. Cumulative net discrimination in % [(13/3) x 100] 14.1% 22.3% 25.1% 39.8%
* Applications covered only the initial application stage.
Source: see text.
Both these estimated rates of discrimination are significantly different from zero under a testof statistical significance:
C Blacks: Based on an estimated probability of discrimination of 19.4 per cent and a samplesize of 406 useable tests (combining the Urban Institute's sample and Fair EmploymentCouncil's sample, as reported in row (3) of table 2), the estimated rate of discrimination

18
1 Thus, as the studies' authors view it, the sample size of useable tests from the four studies taken together is1,209, while the ILO views the useable sample size as 815; see footnote 1, p. 16.
corresponds to 9.7 standard deviations of difference between 19.0 per cent and zero. Thisfigure translates into a probability that a rate of discrimination as high as that observedwould have arisen if the rate of discrimination is actually zero of less than one in a billion.
C Hispanics: Based on an estimated probability of discrimination of 33.2 per cent and asample size of 409 useable tests (combining both the Urban Institute's sample and the FairEmployment Council's sample, as reported in row (3) of table 2), the estimated rate ofdiscrimination corresponds to 14.4 standard deviations of difference between 39.8 per centand zero. This figure translates into a probability that a rate of discrimination as high as thatobserved would have arisen if the rate of discrimination is actually zero of less than one ina billion.
4.2 Discrimination rates in the authors' formats
Utilization of the computational procedure specified by the ILO allows United States estimatesto be compared directly to those generated in other nations participating in the ILO study. Whenthe authors of the four United States studies analysed their own data, they adopted computationalprocedures that differed somewhat from the ILO's. The approaches differed in a number of ways:
C Some of these differences reflected differences in how tests were conducted. For example,in its study of Blacks, the Fair Employment Council collected and analysed data not only onwhether testers received interviews or job offers (which is the focus in the ILO'scomputations) but also other differences in the treatment testers received even if both testersadvanced to the same stage in the application process. For example, both testers mightreceive job offers, but one tester might be offered a higher wage rate than the other.
C Additional differences reflect computational conventions. For example, the United Statesauthors generally included tests in the study sample when both testers had presentedapplications, whereas the ILO's computational procedure counted such tests only if at leastone tester was accorded an interview.1
C Data for the Fair Employment Council's test for Hispanics in table 3 are based on both thetelephone tests reported in table 2 and correspondence tests reported in chapter 5.
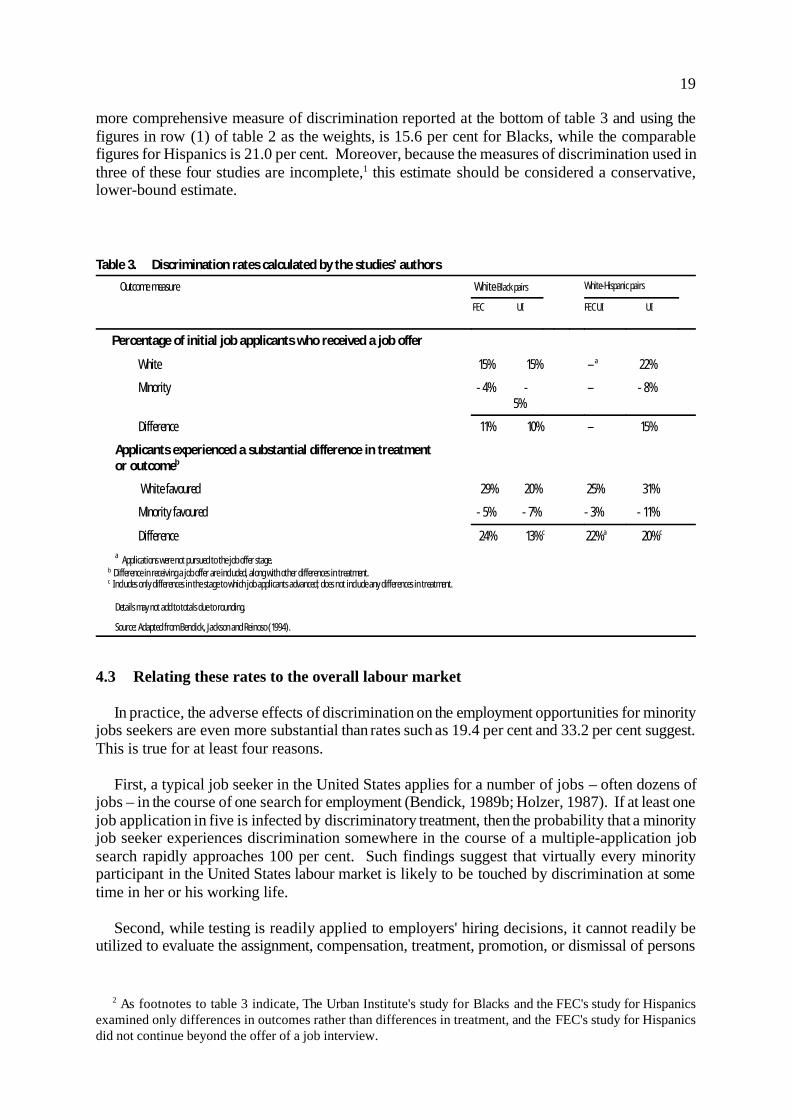
Table 3 presents estimated net rates of discrimination for the four United States studies usingcomputational procedures adopted by the authors of each of the studies themselves. Under thelabel "percentage of initial job applicants who received a job offer", the top section of the tablepresents a net rate of discrimination that is closest to the ILO's net rate of discrimination estimatedin row (14) of table 2. Under the label "applicants experienced a substantial difference intreatment or outcome", the bottom section of the table presents a measure based on a broaderdefinition of the ways that discrimination might occur.
The results in table 3 are of the same order of magnitude as those in table 2, in the sense thatthey are clearly greater than zero but less than 50 per cent. However, they differ in their exactmagnitude. The weighted average of the authors' estimates from the four testing studies, using the
19
2 As footnotes to table 3 indicate, The Urban Institute's study for Blacks and the FEC's study for Hispanicsexamined only differences in outcomes rather than differences in treatment, and the FEC's study for Hispanicsdid not continue beyond the offer of a job interview.
more comprehensive measure of discrimination reported at the bottom of table 3 and using thefigures in row (1) of table 2 as the weights, is 15.6 per cent for Blacks, while the comparablefigures for Hispanics is 21.0 per cent. Moreover, because the measures of discrimination used inthree of these four studies are incomplete,1 this estimate should be considered a conservative,lower-bound estimate.
Table 3. Discrimination rates calculated by the studies’ authors
Outcome measure White-Black pairs White-Hispanic pairs
FEC UI
FEC UI UI
Percentage of initial job applicants who received a job offer
White 15% 15% –a 22%
Minority - 4% -5%
– - 8%
Difference 11% 10% – 15%
Applicants experienced a substantial difference in treatment or outcomeb
White favoured 29% 20% 25% 31%
Minority favoured - 5% - 7% - 3% - 11%
Difference 24% 13%c 22%a 20%c a Applications were not pursued to the job offer stage. b Difference in receiving a job offer are included, along with other differences in treatment. c Includes only differences in the stage to which job applicants advanced; does not include any differences in treatment.
Details may not add to totals due to rounding.
Source: Adapted from Bendick, Jackson and Reinoso (1994).
4.3 Relating these rates to the overall labour market
In practice, the adverse effects of discrimination on the employment opportunities for minorityjobs seekers are even more substantial than rates such as 19.4 per cent and 33.2 per cent suggest.This is true for at least four reasons.
First, a typical job seeker in the United States applies for a number of jobs – often dozens ofjobs – in the course of one search for employment (Bendick, 1989b; Holzer, 1987). If at least onejob application in five is infected by discriminatory treatment, then the probability that a minorityjob seeker experiences discrimination somewhere in the course of a multiple-application jobsearch rapidly approaches 100 per cent. Such findings suggest that virtually every minorityparticipant in the United States labour market is likely to be touched by discrimination at sometime in her or his working life.
Second, while testing is readily applied to employers' hiring decisions, it cannot readily beutilized to evaluate the assignment, compensation, treatment, promotion, or dismissal of persons
20
1 Additional support for the proposition that discrimination tends to be more prevalent for better-paying jobsis provided by anecdotal evidence (Braddock and McPartland, 1987) and economic theory (Becker, 1971).
once they have been hired. Inequality of opportunities often arise after the initial hiring decision– as signalled, for example, by the approximately 85 per cent of race/ethnic complaints allegingemployment bias filed annually with the Equal Employment Opportunity Commission in the UnitedStates that did not involve hiring. Indeed, entry-level recruitment and hiring are believed to be thepersonnel processes in which minorities have made the most progress in many firms, with "glassceiling" problems in retention and advancement remaining substantially more intractable (Thomas,1991; Jackson and Associates, 1992; Tilly and Tilly, 1994, pp. 294-299). Thus, post-hiringpractices undoubtedly produce instances of discrimination in addition to those counted throughtesting studies of hiring alone.
Third, all four of the research studies listed in table 1 were designed to examine theimplications of discrimination for problems of long-term poverty. Accordingly, these studies wereconducted on samples that over-represented vacancies open to persons seeking to enter the"economic mainstream" – that is, jobs with relatively limited educational and skill prerequisitesthat nevertheless offer reasonable compensation, stability, and opportunities for advancement.While the effects of discrimination are serious for any worker, they are perhaps most destructivefor job seekers just entering the world of work; being denied access to the bottom rung of "careerladders" can trap persons in a lifetime of "dead end", low-paying, unstable employment (Freemanand Holzer, 1986; Bendick and Egan, 1988). Unfortunately, testing results demonstrating thatdiscrimination is present are based on samples disproportionately composed of just such career-entry opportunities.
Indeed, although United States testing evidence does not document this pattern definitively, itsuggests that the better the job, the greater the likelihood of discrimination. For example, in Black-White tests by the Fair Employment Council in which both applicants received a job offer, andtherefore we assume discrimination was not present, the average starting wage offered to theWhite tester was $5.45 per hour; in tests where White applicants received an offer but their Blackpartner did not, the starting wage offered to the White tester averaged $7.13 per hour, 30 per centhigher.1
Finally, testing is most readily applied to only a subset of all job vacancies – those which arerelatively accessible because they are advertised in newspapers or listed with employmentagencies. In the United States labour market, such vacancies account for only about one-third ofall employment opportunities, with the remaining two-thirds filled through more private means ofrecruitment such as word-of-mouth and personal referrals (Bendick, 1989b; Holzer, 1987;Bortnick and Ports, 1991; Powell and Smith-Doerr, 1994). It is widely assumed that at least someemployers utilize the latter recruitment techniques – those in which information about vacanciesis not publicized – partially to keep away minority and other "undesirable" applicants (Bendick,1989b; Hanson and Pratt, 1994; Neckerman and Kirschenman, 1991a). Therefore, the extent ofdiscrimination in the overall labour market is almost certainly higher than the rate among vacanciesthat have been subject to testing.
4.4 The prevalence of reverse discrimination
In discussions of employment discrimination in the United States, the issue of "reversediscrimination" is currently a central concern. This term refers to circumstances in which whitepersons suffer diminished opportunities in the labour market when minorities are hired, promoted,or otherwise advanced based on their race or ethnicity. Some commentators argue that anti-

21
discrimination activities in the United States over the past several decades have "over-tipped" thebalance in favour of minorities so that instances of reverse discrimination are now widespread.
Other commentators argue that instances of reverse discrimination remain relatively rare. Forexample, a recent study analysed several thousand civil suits concerning employmentdiscrimination decided by United States District and Appeals Courts between 1990 and 1994.This study concluded that reverse discrimination claims constituted only between one and threeper cent of all employment discrimination cases during that period; and that within those cases, theCourts found the claims to be without merit a high proportion of the time (Blumrosen, 1995).
In situation testing, reverse discrimination can be measured by counting the instances in whichminority testers are favoured over their equally-qualified White partners. In table 3, suchinstances are represented in the row labelled "minority favoured" in the section labelled"applicants experienced a substantial difference in treatment or outcome". The table provides anestimate of this figure from each of the four U.S. testing studies. For tests involving Blacks, theestimated rates are 5 per cent in the Fair Employment Council's study and 7 per cent in The UrbanInstitute's study, with a weighted average of 6.3 per cent. For tests involving Hispanics, thecomparable figures are 3 per cent in the Fair Employment Council's tests and 11 per cent in TheUrban Institute's research, with a weighted average of 7.4 per cent.
These estimated rates of reverse discrimination – 6.3 per cent for tests involving Hispanics and7.4 per cent for tests involving Blacks – can then be compared to the gross rates of discriminationagainst minorities estimated by the study authors, presented in the row of table 3 labelled "Whitefavoured" immediately above the row just examined. There, the weighted average of the twoestimates concerning discrimination against Blacks is 22.9 per cent, and the weighted average ofthe two estimates concerning discrimination against Hispanics is 28.3 per cent. To produce afigure comparable to that in the study by Blumrosen, the rate of reverse discrimination needs to bere-expressed as a proportion of all instances in which the two testers are treated differently (thatis, the sum of the gross rate of discrimination against minorities plus the rate of reversediscrimination). When reexpressed this way, the results are 21.5 per cent in the case of Blacksand 20.7 per cent in the case of Hispanics. In other words, in all cases where one tester or theother was favoured, that difference favoured the minority tester in approximately one time in five.Four times out of five when the two testers were treated differently, the minority tester bore thebrunt of unfavourable treatment.
Thus, empirical evidence from testing suggests that reverse discrimination, while not absentfrom the United States labour market, continues to be far less prevalent than is traditionaldiscrimination operating against minorities.
4.5 Variations in the prevalence of discrimination
All four United States studies consistently found that discrimination arises at some ratethroughout the entire labour market. No location is immune; no industry or occupation isdiscrimination-free. Nevertheless, certain segments of the labour market or certain labour marketcircumstances are commonly hypothesized to be more prone to discrimination than others.
4.5.1 Variation between racial/ethnic groups
The most obvious variation is between the two race/ethnic groups whose experiences wereexamined in United States situation tests. Under the computational procedures prescribed by theILO, the weighted average of the rate of discrimination against Blacks was 19.4 per cent, whereas

22
1 The regression equations underlying table 4 are reported for Blacks in Bendick, Jackson and Reinoso (1994,p. 36) and for Hispanics in Bendick, Jackson, Reinoso and Hodges (1991, p. 478). For somewhat parallel analyseson data from The Urban Institute, see Kenney and Wissoker (994).
that against Hispanics was 33.2 per cent, or 1.7 times the Black rate. Under the computationalprocedures adopted by the authors of the four testing studies reviewed, the weighted average ofthe rate of discrimination against Blacks was 15.6 per cent, whereas that against Hispanics was21.0 per cent, or 1.35 times the Black rate.
In reporting the results of U.S. testing studies within the framework of the ILO research design,Blacks represent what the ILO design characterizes as an "older, established" minority group, andHispanics represent what the ILO characterizes as "relative newcomers" (Bovenkerk, 1992, p. 16).Thus, one possible interpretation of the observed pattern is that discrimination is more prevalentagainst recently-arrived minority groups and perhaps may tend to diminish over time. However,Blacks and Hispanics in the American labour market differ in a number of ways other than thelength of time that their respective groups have been present in the United States. For example,as was discussed in section 2.1 of this paper, Hispanics on average have completed fewer yearsof education than Blacks, and a higher proportion of Hispanics have limited command of English.Thus, considerable caution must be exercised in drawing broad conclusions from these limitedobservations.
In fact, the most important finding of the study is not that the rate of discrimination against onegroup was somewhat greater than against the other but rather that substantial discrimination wasfound against both. Bovenkerk (1992, p. 16) argues that such findings demonstrate thatdiscrimination is "not just an isolated problem of one group only ... but is a general characteristicof how the labour market functions with respect to immigrants." Some commentators in the UnitedStates developed this line of reasoning into a broader concept sometimes labelled "managingdiversity." This concept argues that discrimination in the United States labour market todayreflects less the circumstances of specific minority groups than the inability of employers (who areprimarily non-disabled, non-elderly, White males) to deal comfortably with employees and jobapplicants who are "different" from themselves in any way. Under this line of reasoning, theproblems of discrimination experienced by racial and ethnic minority groups such as Blacks andHispanics are closely allied to those experienced by women, older workers, persons withdisabilities, and others (Thomas, 1991; Jackson, 1992; Egan and Bendick, 1991). The results ofU.S. testing studies seem broadly consistent with this line of reasoning.
4.5.2 Variations within a metropolitan area
Table 4 presents data drawn from two of the United States testing studies – those conductedby the Fair Employment Council – to which the statistical technique of multiple regression analysishas been applied to identify variations in rates of discrimination that can be observed within ametropolitan area.1 In both studies, the metropolitan area studied was Washington.
The first row of table 4 repeats the figure, which appeared earlier in table 3, for the averagerate of discrimination encountered by the two groups tested, as calculated by the studies’ authors– 24.2 per cent for Blacks and 22.4 per cent for Hispanics. The remaining rows of the table thenestimate how this probability varies under different conditions. The table reports the followingpatterns:
C Gender. It is often hypothesized that minority males are more subject to discrimination thanminority females (Neckerman and Kirschenman, 1991; Freeman and Holzer, 1986). In the

23
FEC’s Hispanic-White tests, male job seekers were much more likely to encounterdiscrimination than female ones (29.3 per cent versus 12.2 per cent). However, the FEC’sBlack-White tests found the opposite pattern (13.6 per cent for males, 31.6 per cent forfemales). Only further studies can determine whether these contradictory results are stable,implying that race and gender interact differently for the two minority groups. In any case,
Table 4. Effect of selected circumstances on the probability that a minority tester will experienceless favourable treatment
Characteristic of job or applicant (a) Tests with Black/White testers (%)
(b) Tests with Hispanic/White testers (%)
Average of all tests 24.2 22.4
Applicant is male Applicant is female
13.6 31.6
29.3 12.2
Job located in the city of Washington Job located in Maryland suburbs Job located in Virginia suburbs
18.9 20.6 37.2
37.2 18.5} }
Job advertised in metropolitan newspaper Job advertised in suburban newspaper Unsolicited application to an employer Application to an employment agency
14.7 –
34.3 66.7
19.7 22.3
– 33.7
Job typically not filled by a college graduate Job typically filled by a college graduate
– –
24.8 19.6
Jobs is a sales position Job is a hotel position Job is a restaurant position Job is an office position Job is a blue-collar position
30.0 16.6 23.5
41.9 –
} 25.0} } 21.8 13.6
Firm is large or part of a large franchise Firm is not large or franchised
21.9 21.5
– –
Advertisement not marked “equal opportunity” Advertisement marked “equal opportunity”
– –
22.0 23.0
Sources: Based on multiple regression analysis of tests by the Fair Employment Council; for Blacks, see Bendick, Jackson and Reinoso (1994, p. 36); for Hispanics, see Bendick, Jackson, Reinoso and Hodges (1991, p. 478).
both sets of findings document that race/ethnic discrimination is by no means confined tomales.
C City versus suburbs. It is often hypothesized that suburban areas in the United States areless welcoming to minorities, both as residents and as workers, than central cities (Hansonand Pratt, 1994). The results in the FEC's Black-White tests were consistent with thishypothesis (an 18.9 per cent rate of discrimination in the central city of Washington,compared to rates of 20.6 per cent and 37.2 per cent in its two surrounding suburban areas,in the states of Maryland and Virginia, respectively). However, in the FEC's Hispanic-White tests, the opposite proved true (37.2 per cent in city of Washington versus 18.5 percent in the suburbs). The difference between the two studies may reflect the fact that in theWashington area, a majority of the population in the city of Washington itself is Black.Furthermore, the distinction between city and suburb itself may be too broad; in the FEC'sBlack-White study, for example, rates of discrimination were very similar for the city of

24
1 In the Urban Institute's Black-White testing study, the authors found no statistically significant differencesbetween city and suburbs or between Census tracts with high and low minority populations (Turner, Fix and Struyk,1990, pp. 26-27).
1 Comparable results for Blacks cannot be reported because the Black-White testing studies conducted by boththe FEC and The Urban Institute examined jobs with little variation in their educational prerequisites, focusingprimarily on positions not requiring college graduation.
2 Economic theory (Becker, 1971) predicts that jobs that involve public contact (such as sales occupations)should be more prone to discrimination than those that do not (such as manual or office occupations). Theseresults are consistent with this prediction.
Washington and its Maryland suburbs (18.9 per cent and 20.6 per cent) but substantiallyhigher in the Virginia suburbs (37.2 per cent).1
C Job advertising. Jobs advertised in a major metropolitan newspaper (the Washington Post)were associated with rates of discrimination rates of 14.7 for Blacks and 19.7 per cent forHispanics, which were lower than the rates for jobs listed in locally-distributed suburbannewspapers (22.3 per cent, in Hispanic tests) or "walk-in" applications based on industrylists where there was no newspaper advertising (34.3 per cent, in Black tests). Thesepatterns are consistent with the hypothesis, stated earlier in this paper, that the more closelyinformation about a vacancy is held, the greater the likelihood of discrimination becauserestricting information is a means of discrimination.
C Employment agencies. Employment agencies are for-profit firms whose business is to placeworkers in other firms, either temporarily or permanently. Particularly in office and serviceemployment, these agencies control access to a substantial number of job opportunities(Bendick, 1989b). When FEC testers sought jobs through employment agencies, minoritytesters encountered less favourable treatment than their identically-qualified White testingpartners 33.7 per cent of the time in the case of Hispanics and 66.7 per cent of the time inthe case of Blacks. This outcome is consistent with the hypothesis that screening out"undesirable" applicants is one of the services many employment agencies provide to theirclient firms.
C Educational prerequisites. In the FEC's tests involving Hispanic and White applicants,discrimination proved somewhat more prevalent for jobs not typically filled by collegegraduates (24.8 per cent) than those typically filled by college graduates (19.6 per cent).2
C Occupations. In the studies reported in table 4, the number of tests completed withinindividual occupations was limited, and the ways that occupations were categorized wasrelatively informal. Accordingly, conclusions concerning the prevalence of discriminationin specific occupations should be drawn with caution. Only sales position (with a netdiscrimination rate of 30.0 per cent for Blacks and 25.0 per cent for Hispanics) exhibitedrates of discrimination consistently higher than the average for all occupations (24.2 per centfor Blacks, 22.4 per cent for Hispanics).3
C Firm size. It is sometimes hypothesized that large employers with professional humanresource departments and formal personnel policies are less likely to discriminate thansmall, owner-managed firms. However, in the FEC's tests involving Blacks and Whites,only a slightly lower rate of discrimination was observed in large firms than in small ones(21.9 per cent for large firms or firms affiliated with large franchise systems, 25.5 per centfor smaller firms). FEC testers experienced biased treatment from some of the United States'largest, best known retailers, hotels chains, real estate agencies, and service companies.
25
1 In contradiction of this finding, Konrad and Linnehan (1995), using non-testing methods of research,concluded that symbolic acts against discrimination, such as a firm's declaration that it is an equal opportunityemployer, do reduce discrimination.
C Equal opportunity labelling. Firms whose vacancy announcements carried statements suchas "an Equal Opportunity Employer" were approximately as likely to discriminate (inHispanic tests, 23.0 per cent) as firms that did not make such claims (in those same tests,22.0 per cent).1
4.5.3 Variations between metropolitan areas
Both of the testing studies conducted by the FEC were restricted to the Washington area andthus provide no data by which to test differences among metropolitan areas. However, the twostudies conducted by The Urban Institute were each carried out in two metropolitan areas, thusallowing some examination of the impact of general labour market circumstances on the level ofdiscrimination. For Hispanics in the Urban Institute studies, the estimated net rate ofdiscrimination was 16 per cent in San Diego and 25 per cent in Chicago. For Blacks, thecomparable rates were 14 per cent in Chicago and 26 per cent in Washington (Cross et al., 1990,p. 55; Turner, Fix and Struyk, 1990, p. 21).
One factor that might explain such patterns is the relative level of unemployment in the differentlabour markets. It might be hypothesized that "loose" labour markets, with an excess ofunemployed job seekers from which employers can choose, allow employers greater opportunitiesto exercise discrimination than "tight" labour markets, where employers might be more desperateto fill vacancies. At the time that The Urban Institute selected its study sites, the rate ofunemployment was substantially higher in Chicago, at approximately 7 per cent, than in either SanDiego or Washington, at approximately 3 per cent (Turner, Fix and Struyk, 1990, p. 7; Cross et al.,1990, p. A-4). Thus, while the higher rate of discrimination for Hispanics was observed in thecity with the lower unemployment rate, the opposite pattern held for Blacks. These data fail tosupport the hypothesis that there is a simple relationship between rates of discrimination and thetightness of the local labour market.
A second factor that might explain city-to-city differences in discrimination rates is the typesof employment that dominates each labour market. For example, Chicago is more oriented towardsmanufacturing than Washington, where business services and professional and managerialemployment is more prominent. In general, studies by both The Urban Institute and the FECreported higher rates of discrimination for higher skilled and "white collar" occupations than forpositions involving manual labour (table 4, above; Turner, Fix and Struyk, 1990, p. 27). Thus, theobserved patterns offer some support for this explanation of inter-city differences. However, suchpatterns were not terribly strong or consistent. For example, in its Black-White tests, The UrbanInstitute observed one of its highest rates of discrimination in "white collar positions" in the hotelindustry in Washington but one of its lowest in the same positions in the same industry in Chicago(Turner, Fix and Struyk, 1990, p. 28). Any conclusions drawn from these data must be consideredpreliminary at best.
Additional hypotheses concerning city-to-city differences in rates of discrimination have beenproposed on the basis of a variety of cultural and historical factors. For example (Turner, Fix andStruyk, 1990, pp. 25-28):
26
C In San Diego, which is located on the border between the United States and Mexico, asubstantial Hispanic population has been resident for many decades, while in Chicago, alarge Hispanic presence has developed only in recent years.
C Washington, with a large number of government and government contractor jobs, may havea local employment culture particularly oriented towards equal employment opportunitybecause of the additional equal employment opportunity and affirmative action requirementsthat involvement with government often imposes (Clark, 1989).
C Residential patterns are more segregated in Chicago, particularly for Blacks, than in eitherWashington or San Diego (Massey and Denton, 1993).
The number of such hypotheses, combined with the limited observations provided by coverageof only three cities in the Urban Institute tests, precludes their rigorous evaluation with the testingdata in hand. However, the observed patterns do not appear to provide clear support for anysimple hypotheses. For example, consider the hypothesis that discrimination will be moreprevalent in localities where a minority group has arrived more recently. The Urban Institute'sdata for Hispanics seems consistent with this hypothesis, in that it contrasts a 25 per centdiscrimination rate against Hispanics in Chicago to a 16 per cent rate in San Diego. However, alarge Black population has been present in the Washington area for longer than there has been acomparable Black population in Chicago, and The Urban Institute's data for that minority groupcontrasts a 26 per cent rate of discrimination in Washington to a 14 per cent rate in Chicago. Suchhypotheses cannot be serious scrutinized with testing results until additional testing studies areconducted in a broader range of locations. 4.6 Examples of discriminatory behaviour
The rates of discrimination discussed throughout this chapter typically reflect discriminationoperating in several different ways or at several different stages of the job seeking process. Thefollowing examples, taken primarily from studies by the Fair Employment Council, illustrate thosemechanisms at work. The quantitative importance of each mechanism is placed in perspective byreporting the rate at which that type of discrimination was encountered in the Black-White testsconducted by the Fair Employment Council (Bendick, Jackson and Reinoso, 1991, pp. 31-34).
4.6.1 Opportunities to interview
Although the testers in each pair presented their applications at virtually the same moment, onewas sometimes turned away "because the job is filled," while the other was interviewed. Overall,48.3 per cent of the FEC's White testers received interviews, compared to 39.6 per cent of theirBlack partners, a difference of 8.7 percentage points.
For example, the Washington Post carried an advertisement for a restaurant supervisor in theWashington suburbs. A Black tester for the FEC who went to the restaurant was told that he wouldbe called if the restaurant wished to pursue his application. Minutes later, a White tester withequivalent credentials followed the same application procedure. He was called later the same dayto schedule an interview, interviewed the day after that, and subsequently offered the position.Meanwhile, the Black tester made four follow-up calls to reiterate his interest in the position,including one immediately after the White tester refused the job offer. No response was receivedto these calls.

27
1 For this and the following types of discrimination, examples involving Hispanic testers are sometimes notavailable because the FEC's testing research involving Hispanics only proceeded to the stage of obtainingappointments to be interviewed, and documentation of The Urban Institute's research does not provide manyexamples.
A second example is provided by the experiences of an Hispanic tester for the FEC applyingfor a position by telephone. A vacancy for a receptionist in an optometrist's office was advertisedin a suburban newspaper in the Washington area. When the Hispanic tester called the next day toapply, her call was first put on hold, then she was called by the wrong name (Carmen, when shehad given her name as Juanita) and told that they were no longer taking applications. However,when her White testing partner called thirteen minutes later, she was given an appointment for aninterview the following morning.
4.6.2 Job offers or referrals
Although each pair of testers had been selected and trained to be equally poised and articulateand carried resumes describing equivalent education and experience, one tester was sometimesrejected while the other received a job offer. Some 46.9 per cent of the FEC's White testers whowere interviewed received job offers, compared to 11.3 per cent of their Black counterparts, adifference of 35.6 percentage points.
For example, a Black female tester sought entry-level employment through a large employmentagency in downtown Washington. After completing an application and being interviewed briefly,she was told that she would be called if a suitable vacancy became available. Shortly thereafter,her White testing partner arrived seeking similar opportunities. After she completed anapplication and was interviewed, she was told about a receptionist/sales position at an upscalehealth and grooming firm. She was coached on interviewing techniques and scheduled for aninterview later that day; in that interview, she was offered the position.1
4.6.3 Compensation
In 16.7 per cent of the FEC's tests in which both the Black tester and her/his White partnerwere offered the same job, the White was offered a higher starting wage; the reverse neveroccurred. In these cases, the starting wage offered White applicants averaged $5.45 per hour,compared to $5.30 for their Black partners, a gap of $.15 per hour.
For example, a major department store chain advertised in the Washington Post for salesassistants in the women's clothing department of a branch store in an affluent neighbourhood.When a pair of female testers applied for the position, both were interviewed by the store'spersonnel department, and both were offered permanent, full-time employment. However, thestarting salary offered to the Black tester was $6.50 per hour, while her White partner was offered$7.50 per hour.
4.6.4 Steering
In some cases, both applicants were offered jobs, but one in a well-paid, upwardly mobileposition and the other in a low-pay, dead end post. A total of 2.0 per cent of the FEC's Whitetesters were "steered" to an alternative job at a lower level than the position for which they
28
initially applied, compared to 5.4 per cent of the FEC's Black testers, a difference of 3.4percentage points.
For example, a major-brand automobile dealer in the Washington suburbs advertised in theWashington Post for a car salesperson. A Black male tester who applied was told that to enterthe auto sales business, he should accept a position as a porter/car washer. Arriving shortlythereafter with identical credentials, his White testing partner was immediately interviewed forthe sales position that had been advertised.
4.6.5 Access to additional opportunities
When applying for one position, a job candidate in the United States is sometimes consideredfor other vacancies, often unadvertised ones, at the same level or higher than the job originallyadvertised. This situation was experienced by 4.0 per cent of the FEC's White testers but only2.7 per cent of counterpart Black testers, a gap of 1.3 percentage points.
For example, a social matching (dating) service in the Washington suburbs advertised in theWashington Post for a receptionist/ typist. When a Black tester for the FEC applied for theposition, she was interviewed but heard nothing further. When her White testing partner appliedfor the receptionist position and was interviewed, the employer offered to create a new positionfor her, that of personal assistant to the manager. This new position would pay more than thereceptionist job, would lead to rapid promotions and increases in salary, and would also providetuition assistance for further education. Follow-up calls by the Black tester elicited no interest onthe part of the firm, either for the receptionist position or the newly created opportunity, even afterthe White tester refused the offer.
A second example is provided by a test by The Urban Institute concerning a position as a"busboy" at a restaurant. When the Hispanic applicant in this test appeared at the restaurant toapply, he was given a brief interview focusing on the requirements of the busboy position and itsrate of pay. In contrast, his White testing partner was given a longer interview, was introducedto several other employees, and was told that if he worked well, he could soon earn promotionsto higher-paying positions as a host or bartender (Cross et al., 1990, p. 58).
4.6.6 The cumulative effect
Among these five differences, only that for job offers is large enough to be statisticallysignificant (at the .01 level) in the sample of 149 tests completed for Blacks by the FairEmployment Council. However, when expressed as a proportion of the time Whites werefavoured over minorities when the mechanism potentially operated, the differences weresubstantial. In these terms, the figures in sections 4.6.1 through 4.6.5 translate into:
C a rate of Whites obtaining job interviews that is 22 per cent higher than the rate for theirequivalently-qualified Black counterparts;
C a rate for Whites of receiving job offers at the interview stage that is 415 per cent the ratefor Blacks;
C a 17 per cent probability that a White offered a job will receive a higher wage offer thana Black offered the same position;
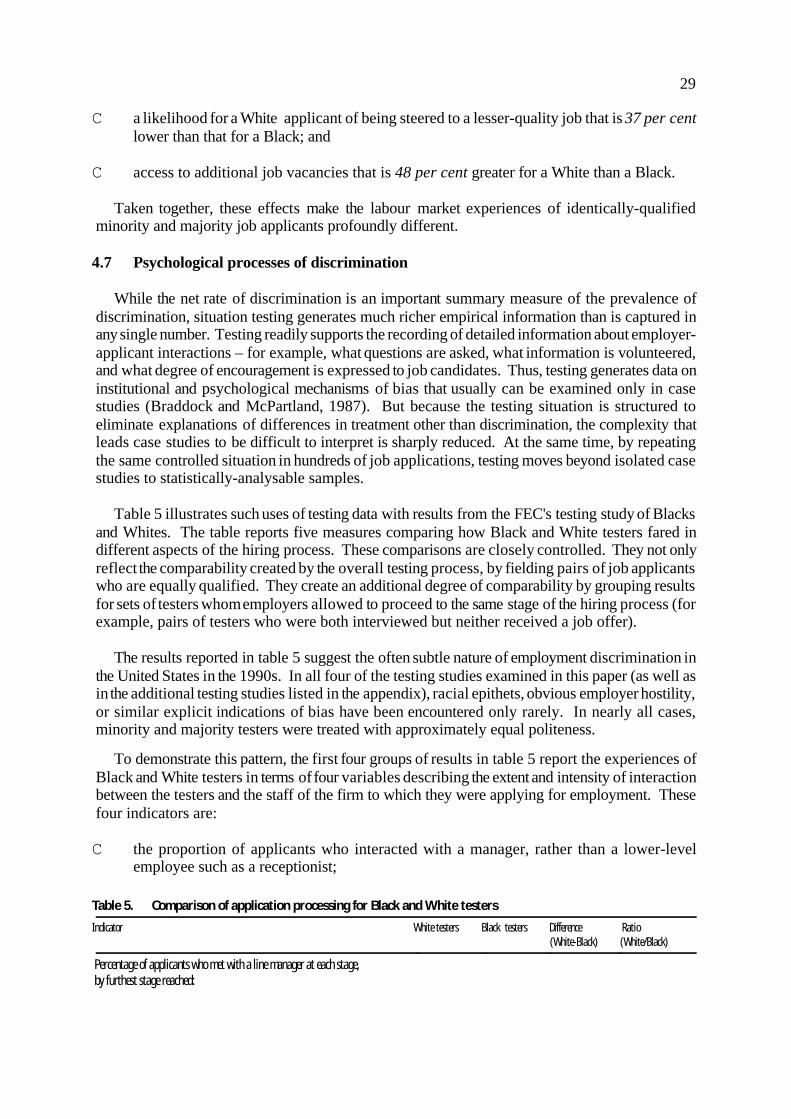
29
C a likelihood for a White applicant of being steered to a lesser-quality job that is 37 per centlower than that for a Black; and
C access to additional job vacancies that is 48 per cent greater for a White than a Black.
Taken together, these effects make the labour market experiences of identically-qualifiedminority and majority job applicants profoundly different.
4.7 Psychological processes of discrimination
While the net rate of discrimination is an important summary measure of the prevalence ofdiscrimination, situation testing generates much richer empirical information than is captured inany single number. Testing readily supports the recording of detailed information about employer-applicant interactions – for example, what questions are asked, what information is volunteered,and what degree of encouragement is expressed to job candidates. Thus, testing generates data oninstitutional and psychological mechanisms of bias that usually can be examined only in casestudies (Braddock and McPartland, 1987). But because the testing situation is structured toeliminate explanations of differences in treatment other than discrimination, the complexity thatleads case studies to be difficult to interpret is sharply reduced. At the same time, by repeatingthe same controlled situation in hundreds of job applications, testing moves beyond isolated casestudies to statistically-analysable samples.
Table 5 illustrates such uses of testing data with results from the FEC's testing study of Blacksand Whites. The table reports five measures comparing how Black and White testers fared indifferent aspects of the hiring process. These comparisons are closely controlled. They not onlyreflect the comparability created by the overall testing process, by fielding pairs of job applicantswho are equally qualified. They create an additional degree of comparability by grouping resultsfor sets of testers whom employers allowed to proceed to the same stage of the hiring process (forexample, pairs of testers who were both interviewed but neither received a job offer).
The results reported in table 5 suggest the often subtle nature of employment discrimination inthe United States in the 1990s. In all four of the testing studies examined in this paper (as well asin the additional testing studies listed in the appendix), racial epithets, obvious employer hostility,or similar explicit indications of bias have been encountered only rarely. In nearly all cases,minority and majority testers were treated with approximately equal politeness.
To demonstrate this pattern, the first four groups of results in table 5 report the experiences ofBlack and White testers in terms of four variables describing the extent and intensity of interactionbetween the testers and the staff of the firm to which they were applying for employment. Thesefour indicators are:
C the proportion of applicants who interacted with a manager, rather than a lower-levelemployee such as a receptionist;
Table 5. Comparison of application processing for Black and White testers
Indicator White testers Black testers Difference (White-Black)
Ratio (White/Black)
Percentage of applicants who met with a line manager at each stage,by furthest stage reached:
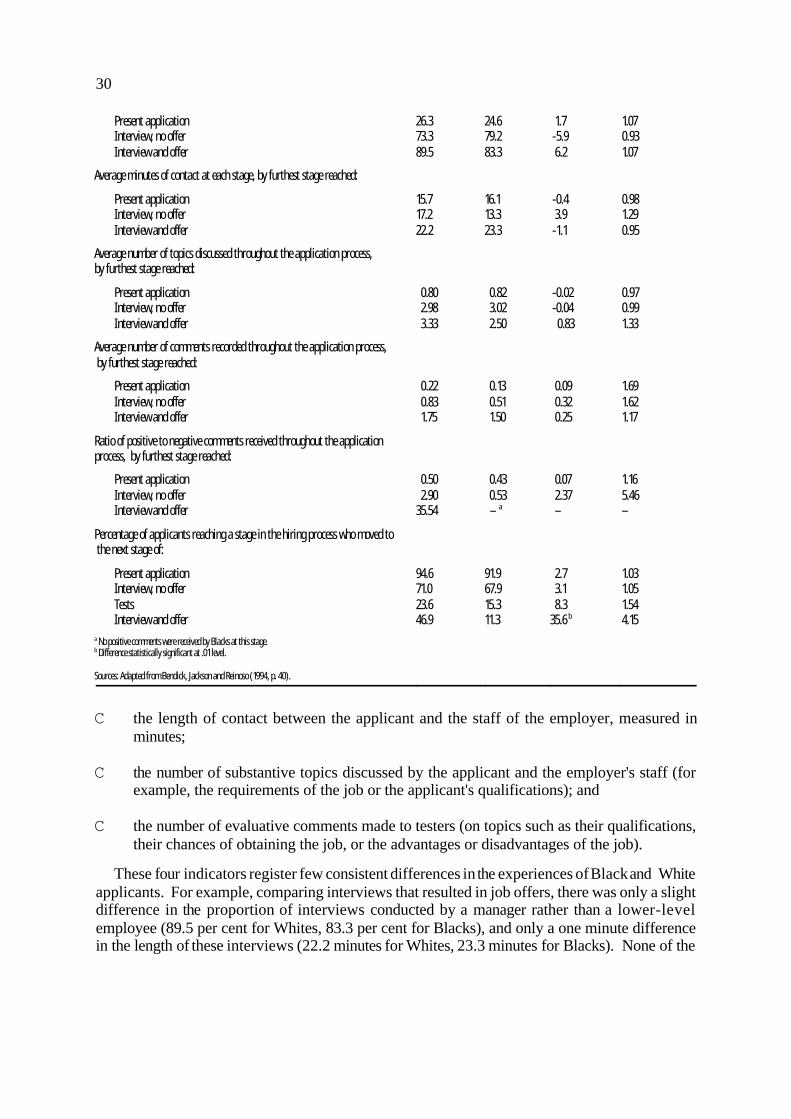
30
Present applicationInterview, no offerInterview and offer
26.373.389.5
24.679.283.3
1.7 -5.9 6.2
1.07 0.93 1.07
Average minutes of contact at each stage, by furthest stage reached:
Present applicationInterview, no offerInterview and offer
15.717.222.2
16.113.323.3
-0.4 3.9 -1.1
0.98 1.29 0.95
Average number of topics discussed throughout the application process, by furthest stage reached:
Present applicationInterview, no offerInterview and offer
0.80 2.98 3.33
0.82 3.02 2.50
-0.02 -0.04 0.83
0.97 0.99 1.33
Average number of comments recorded throughout the application process, by furthest stage reached:
Present applicationInterview, no offerInterview and offer
0.22 0.83 1.75
0.13 0.51 1.50
0.09 0.32 0.25
1.69 1.62 1.17
Ratio of positive to negative comments received throughout the applicationprocess, by furthest stage reached:
Present applicationInterview, no offerInterview and offer
0.50 2.9035.54
0.43 0.53 – a
0.07 2.37 –
1.16 5.46 –
Percentage of applicants reaching a stage in the hiring process who moved to the next stage of:
Present applicationInterview, no offerTestsInterview and offer
94.671.023.646.9
91.967.915.311.3
2.7 3.1 8.335.6 b
1.03 1.05 1.54 4.15
a No positive comments were received by Blacks at this stage.b Difference statistically significant at .01 level.
Sources: Adapted from Bendick, Jackson and Reinoso (1994, p. 40).
C the length of contact between the applicant and the staff of the employer, measured inminutes;
C the number of substantive topics discussed by the applicant and the employer's staff (forexample, the requirements of the job or the applicant's qualifications); and
C the number of evaluative comments made to testers (on topics such as their qualifications,their chances of obtaining the job, or the advantages or disadvantages of the job).
These four indicators register few consistent differences in the experiences of Black and Whiteapplicants. For example, comparing interviews that resulted in job offers, there was only a slightdifference in the proportion of interviews conducted by a manager rather than a lower-levelemployee (89.5 per cent for Whites, 83.3 per cent for Blacks), and only a one minute differencein the length of these interviews (22.2 minutes for Whites, 23.3 minutes for Blacks). None of the

31
1 On each of the four measures examined here, a result favouring Whites is signalled in the third column of table5 (labelled "Difference") by a figure with a positive sign, whereas a result favouring Blacks is signalled by a figurein that column with a minus sign. For each of the four indicators, results are reported separately for groupsreaching three different stages in the application process (for example, "job interview, no offer"), thus generating12 separate observations of tester-employer interaction. Among these twelve, seven favoured Whites, and fivefavoured Blacks. This is the basis for the statement in the text that the direction of differences is approximatelyas likely to favour Blacks as Whites.
2 For example, as was reported earlier in the fourth section of table 5, among testers who were interviewed andreceived a job offer, the average White tester received 1.75 comments (including both positive and negative ones),whereas his/her average Black counterpart received only 1.5 comments.
3 Job interviews that do not lead to an offer but nevertheless include positive comments are likely to leave jobseekers more optimistic and encouraged to continue their job search than similar interviews dominated by negativecomments. In the United States, minority workers who are unemployed become "discouraged workers" (that is,leave the labour force rather than actively seek employment) at a substantially higher rate than counterpart Whiteworkers. This difference is usually attributed to their relative chances of obtaining employment, as reflected, forexample, in higher unemployment rates for Blacks than Whites (Jaynes and Williams, 1989, p. 310). Testingfindings concerning the proportion of positive and negative comments received during interviews by job applicantsof different races provide an additional explanation of the same phenomenon.
differences on these four variables is statistically significant, and the direction of differences isapproximately as likely to favour Blacks as Whites.1
In contrast to these apparent similarities in the treatment of minority and majority applicantsduring the hiring process, the judgements made during the process showed substantial differencesthat consistently favoured the majority testers. These differences are displayed in the final twosections of table 5.
One indicator of employers' judgements of applicants is the content of comments made to Whitetesters by the staff screening or interviewing them. Interviewers made somewhat more commentsto White testers than to Black ones.2 In the fifth section of the table, these comments are dividedinto positive ones (for example, "You are just what we are looking for.") and negative ones (forexample, "This is a dead-end job; you wouldn't want it anyway."). The fifth section of table 5reports the ratios of positive to negative comments received by White and Black testers. In allcases, White testers received substantially more positive comments than negative ones, while thereverse was true for Black testers. Thus, for example, the average White tester who wasinterviewed but did not receive a job offer received 2.9 positive comments for every negative one,while a counterpart Black tester received only 0.5 positive comments for every negative one.3
A second measure of employers' judgements of minority and majority job candidates is the stageof the application process to which the candidates advance. The final section of table 5 reportsa modest (5 per cent) racial difference in the probability of obtaining an interview, and a largerdifference (54 per cent) in the probability of being allowed to take skills tests (for example, testsof typing speed). These differences represent limitations on the extent to which minority jobapplicants can display their qualifications.
Then, differences in minority/majority employment success are sealed in hiring decisions. Asreported earlier in table 3, in the FEC's Black-White tests, majority testers received job offers15 per cent of the time they entered the application process, while the comparable rate forminorities was 4 per cent. This finding is echoed in the final section of table 5, where it isreported that 46.9 per cent of White applicants who advanced to a job interview obtained a joboffer, while 11.3 per cent of their Black counterparts did so. The bottom row of the final columnof table 5 reports the ratio of these two percentages, which is 4.15. That ratio translates into
32
1 A second mechanism that may operate here is that the unconscious behaviour of interviewers may causeminority applicants to perform badly in interviews. In one social psychology experiment, White universitystudents were assigned to interview Black and White job applicants. When the applicant was Black, researchersobserved that the interviewers sat further away, terminated the interview 25 per cent sooner, and made 50 per centmore speech errors than when the applicant was White. Then, in a second experiment, interviewers were instructeddeliberately to duplicate the behaviour typical of interviews with either Blacks and Whites. The interviewperformance of job applicants subjected to the "Black" treatment was rated by neutral judges as more nervous andless effective than that of persons subjected to the "White" treatment, regardless of whether the applicant wasBlack or White (Word, Zanna and Cooper, 1974; see also Lord and Saentz, 1985).
saying that when equally-qualified Black and White testers were interviewed for the same jobs,the average White was more than four times as likely as his/her counterpart Black testing partnerto emerge from the interview with a job offer.
This juxtaposition of approximately even-handed treatment of job applicants with hiringjudgements that are far from even-handed seems paradoxical. In some cases, it undoubtedlyreflects the behaviour of employers who, although they know ahead of time that they would neverhire a minority candidate, feel forced by social pressure or potential legal penalties to "go throughthe motions" of interviewing minority applicants.
In other cases, however, the outcome seems to reflect more complex cognitive processes. Inparticular, it appears to reflect the effect of stereotyped beliefs held by employment decision-makers on the way job applicants are judged. Social psychological research suggests thatgeneralizations about a demographic group strongly influence how individuals from that group areperceived. This effect is particularly strong in situations where exposure to that individual is briefand accompanied by limited prior information. For example, in one social psychologicalexperiment, two groups of university students were shown different videotapes concerning a girlof primary school age. One group of students was shown a tape portraying the girl living in adepressed urban neighbourhood, while the other group saw a tape portraying her living in anaffluent suburb. Both groups were then shown identical videotapes of her performing on an oralachievement test. Students who had previously been exposed to the girl's "high class" backgroundjudged her to be of higher ability and reported her obtaining a higher test score than did studentswho had been exposed to her "low class" background (Darley and Gross, 1983; see also Kruegerand Rothbart, 1988).
This experimental situation is analogous in many ways to the process of screening applicationsfor entry-level employment in the United States. Hiring decisions for such positions are generallymade on limited information – typically, a one-page resume and an interview averaging perhapstwenty minutes. It is therefore not surprising that interviewers' judgements of individuals areinfluenced by generalizations about the applicants' demographic group that the interviewer mayhave formed over a lifetime.
In section 2.2.2 of this paper, we cited research documenting the negative content of stereotypesabout minority workers held by many members of the public in the United States, as well as byemployment decision-makers such as managers in business firms. When these persons bring suchattitudes into a job selection process, every minority candidate enters the process with asubstantial handicap. However well a minority individual may perform in the interview andhowever impressive his or her resume, those qualifications are likely to be discounted orincorrectly perceived based on the prior generalizations.1
Indeed, stereotypical thinking can even turn applicants' positive attributes into their opposite.For example, a standard piece of advice to job seekers in the United States is to dress well for

33
1 Unless otherwise indicated, the following description is based on Bendick, Jackson, Reinoso and Hodges(1991), pp. 470-472.
2 In contrast, these researchers assigned university graduate resumes to only 32 per cent of the vacanciestested by telephone in the same study (Bendick, Jackson, Reinoso and Hodges, 1991, p. 473).
employment interviews (Molloy, 1988). But when a Black male FEC tester wearing a dress shirtand tie was interviewed by a Washington-area employment agency, he was asked whether hisability to afford such nice clothes indicated that he participated in illegal activities.
5. Correspondence testing
5.1 Research procedures
The basic concept of correspondence testing is parallel to that for face-to-face testing:employers who have actual job vacancies to fill simultaneously encounter two equally-qualifiedapplicants who differ in one demographic characteristic; the employers' responses to the two jobseekers are recorded; and a net rate of discrimination is computed from the differences in thetreatment received by the two applicants. Correspondence testing offers several advantages overface-to-face testing, including a lower cost per test, the opportunity to test job vacancies for whichapplicants are instructed to reply only by mail, and avoidance of the effort and uncertainties inmatching the appearance and personalities of pairs of live testers. However, correspondencetesting also has some limitations. It cannot be applied to job vacancies where applicants areinstructed to apply only in person, and it generates more limited measures of employer responses(typically, only whether an employer makes a telephone call to the applicant to schedule aninterview).
The ILO research design (Bovenkerk, 1992, p. 27-29) calls for correspondence testing to beincluded in the ILO cross-national testing programme. Specifically, it calls for the minorityapplicant in these tests to be from the longer-established minority group and for the vacanciestested to be drawn from higher-level positions such as managerial and professional occupations.
One of the four United States studies reviewed in this report – that for Hispanics conducted bythe Fair Employment Council in the Washington metropolitan area in 1992 – included acorrespondence testing component approximating that called for by the ILO.1 This effort generateda total of 186 analysable tests. Among the vacancies studied in these tests, 77 per cent canreasonably be labelled higher-level positions, in the sense that, after considering the positiondescribed in the vacancy announcement, the FEC research staff deemed it appropriate to mailresumes describing university graduates.2 The results reported below are based on all 186 tests.
Each correspondence test began by identifying a job vacancy from one of three sources: "helpwanted" classified advertising in the Sunday edition of the region's major newspaper, theWashington Post; "help wanted" advertisements in local newspapers circulated in the Washingtonsuburbs; and employment agencies listed in the regional telephone directory.
The application for each tester consisted of a one-page resume and a short cover letter. Allthese materials were neatly typed, laid out in standard formats (Swanson, 1991; Yate, 1988), usedsimilar phrasing, and described a person in his/her early 20s with education, experience, and skillsdirectly relevant to the position advertised. Applications for both testers were mailedsimultaneously from different parts of the Washington metropolitan area.

34
In the mailed application materials, the ethnicity of the tester was communicated primarily bythe name used to sign the letter and appearing at the top of the resume (for example, Juanita YbarraAlvarez, an Hispanic name, rather than Julie Ann Mason, a White name). In addition, informationwithin the resumes was consistent with the ethnic identity of the applicant. For example, theHispanic applicant was described as growing up and being educated in Texas, a state near theMexican border, while the Anglo applicant was described as growing up and being educated inMichigan, a state near the Canadian border. In all other respects, the materials for the twoapplicants were equivalent in content and appearance. Both cover letters were in standard Englishwith no errors in grammar or spelling, and the resume made clear that the Hispanic applicant hadbeen born and educated in the United States.
Employers' reactions to each mailed application were measured by the number, promptness,and content of responses received by mail or telephone. A typical positive response consisted ofa message left on a tester's telephone answering machine requesting the tester to call to schedulea job interview. Overall, 18.8 per cent of White applications and 21.6 per cent of Hispanicapplications received some positive response, suggesting that the applications were consideredcredible by many of the employers receiving them. Testers did not respond to these messages inany way and, even if they were invited to do so, did not present themselves to be interviewed.
Although this study design matches that specified by the ILO in many ways, it deviates in twoimportant ones.
One is that the minority group in the study is not the "older established" minority group – which,in the context of United States testing studies, is Blacks – but the group of "relative newcomers"– which, in that context, is Hispanics. This difference is probably not critical, however. TheILO's main motivation for specifying the use of the longer-established minority group incorrespondence tests was to avoid presenting resumes for minorities reporting graduation fromuniversities in the country where the tests were being conducted, if that fact would be so unusualas to be conspicuous. In 1992, 6.5 per cent of students enrolled in colleges and universities in theUnited States are Hispanic (U.S. Bureau of the Census, 1994, p. 179). While their rate ofenrolment is lower than for the White population, it is not so low that employers would be startledto receive a resume from an Hispanic graduate of a United States college or university.
A more fundamental deviation from the ILO design is that, contrary to both the ILO'sspecifications and the United States studies' own basic design (Bendick, 1989a), the minority andmajority testers in this study were not given equivalent job qualifications. In mailed resumes, eachHispanic tester was given credentials that made him or her substantially more qualified for thevacancy advertised than her/his Anglo counterpart. For example, in applications for employmentin business offices, Hispanics were given typing speeds of 60 words per minute, compared to 45words per minute for the White testing partner; in resumes for sales or service positions, Hispanicapplicants were described as having managed a retail department, while their White counterpartswere reported to have worked as a member of the sales staff in a retail department.
5.2 Empirical findings
A consequence of the inequality in credentials just described is that the "neutral" or non-discriminatory level of employer response to the mailed resumes would not be equal responsesto minority and majority testers but more favourable responses to the minority. Unfortunately,there is no basis for quantifying exactly how much above "50/50" this neutral level is.Accordingly, it is inappropriate to analyse the results of these correspondence tests using thecomputational procedure specified by the ILO (Bovenkerk, 1992, p. 31).

35
Some sense of the results of these tests can be gained, however, from estimating rates ofdiscrimination using an alternative procedure, that adopted by the researchers who conducted thisstudy. That computation is shown in table 6. Consistent with the patterns observed in telephonetests within this same study (as well as in the other three audit studies discussed in this report), theresults from the correspondence tests portray an initial similarity in treatment combined withsubstantial differences in outcomes.
The section of table 6 above the dashed line presents three indicators of employer responsesto the applications they received. It reports that Hispanics received positive responses (mostcommonly, messages on a telephone answering machine; occasionally, by letter) at a slightlyhigher rate than Whites; that the two groups were identical in the number of attempts employersmade to contact applicants (an average of 1.4 attempts for both groups); and that Whites werecontacted slightly more rapidly than Hispanics (an average of 7.3 days after their applicationswere mailed, compared to 8.1 days for Hispanics). None of these differences was statisticallysignificant, the differences were in contradictory directions, and the results reflect bothdiscrimination and the counterbalancing effects of the Hispanics' superior credentials. Thus, thissection of the table provides few clear indications of the presence of discrimination.
That presence is not evident until we examine the section of table 6 below the dashed line,where the experiences of pairs of testers are analysed. The first row below the dashed linereports the proportion of tests in which, despite the Hispanic tester's superior credentials, theWhite tester received a positive response while the Hispanic tester did not. This outcome – whicharose in 12.4 per cent of mail tests – represents clear discrimination against the better-qualifiedHispanic applicant.
The next row of the table reports that for an additional 26.0 per cent of the sample, the better-qualified Hispanic received a positive response while the White did not. Because this outcomeis consistent with the relative strength of applicants' credentials, these cases can be assumed (inat least most cases) to reflect an absence of discrimination.
In the remaining 61.6 per cent of tests, as the final row of the table reports, both applicants weretreated the same – either both were contacted or both were not contacted. In some cases, suchoutcomes probably represent no discrimination. For example, if the job was filled before
Table 6. Results of correspondence tests as calculated by the study authors
White applicant Hispanic applicant
Difference(White - Hispanic)
Is difference statistically significant?
Proportion of applications to which employer made a positive response 18.8% 21.6% -2.8% No
For positive responses, average number of attempts employer made to contact applicant 1.4 1.4 — No
For positive responses, average days elapsed before applicant received the employer’s first response 7.3 8.1 -0.8 No
Discrimination against Hispanic ( White with weaker qualification was contacted and Hispanic with stronger qualifications was not 12.4%
Not discrimination (Hispanic with stronger qualifications was contacted and White with weaker qualifications was not) 26.0%

36
Possible discrimination against Hispanic(despite Hispanic’s stronger qualifications, both were contacted or both were not contacted) 61.6%
Source: Adapted from Bendick, Jackson, Reinoso and Hodges (1991), p. 476.
either resume was received, the Hispanic tester's superior qualifications were irrelevant. In othercases, they represent discrimination because the Hispanic should have received positive responsesfor some positions where the White would not.
In short, the findings in the bottom section of table 6 can be summarized as a discrimination rateof 12.4 per cent plus an additional unmeasured amount of discrimination with an upper bound of61.6 per cent. This level of discrimination is generally consistent with the rate estimated forHispanics in face-to-face tests; as reported in chapter 4, these rates are 33.2 per cent under theILO's method of calculation and 20.9 per cent under the method of calculation applied by the studyauthors.
In a sample of 186 useable tests, a discrimination rate of 12.4 per cent corresponds to 5.2standard deviations of difference. This figure translates into a probability that a rate ofdiscrimination as high as that observed would have arisen if the rate of discrimination is actuallyzero of less than one in a million. Thus, even if none of the 61.6 per cent of cases that areambiguous reflected discrimination, chance alone can be ruled out as an explanation of theobserved differences. These findings therefore clearly support the conclusion that substantialdiscrimination operates in the portion of the labour market examined in these correspondence tests.
An illustration of the typical differences in treatment revealed by correspondence testing isprovided by a test within this study conducted on a private employment agency in downtownWashington that specializes in clerical and paralegal personnel. The Fair Employment Councilsimultaneously mailed resumes to this firm for White and Hispanic females, both described ashaving been born in the United States, holding a degree from a United States university, andpossessing substantial office experience. On the first business day after the mailing, the Whitetester received a telephone message to call the agency. When she did not return the call, theagency called again three days later to repeat the message. The Hispanic tester – whose resumereported a higher university grade point average, faster typing speed, and more extensive computerskills – received no calls from the agency during the following three weeks during whichresponses were monitored.
6. Summary and conclusions
6.1 Summary of empirical findings
The ILO's research design (Bovenkerk, 1992, p.12) states that the fundamental researchquestion of the ILO study is: Do immigrants and ethnic minorities suffer from substantialdiscrimination in the labour market? The empirical answer to this question provided by testingresearch in the United States is an unequivocal yes. In the 1990s, racial and ethnic discriminationcontinues to handicap both Blacks and Hispanics seeking employment in the United States labourmarket. A majority of the employers examined by testing did not appear to discriminate, at leastin ways documentable through these tests. However, a substantial minority did.
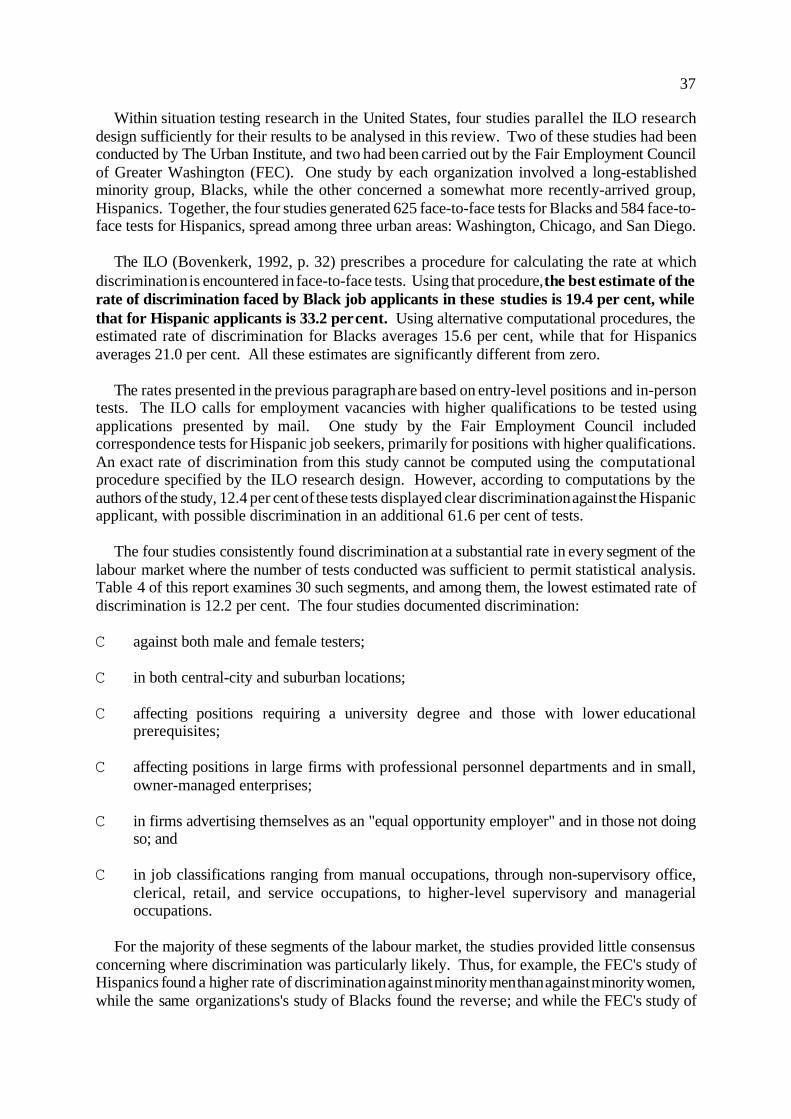
37
Within situation testing research in the United States, four studies parallel the ILO researchdesign sufficiently for their results to be analysed in this review. Two of these studies had beenconducted by The Urban Institute, and two had been carried out by the Fair Employment Councilof Greater Washington (FEC). One study by each organization involved a long-establishedminority group, Blacks, while the other concerned a somewhat more recently-arrived group,Hispanics. Together, the four studies generated 625 face-to-face tests for Blacks and 584 face-to-face tests for Hispanics, spread among three urban areas: Washington, Chicago, and San Diego.
The ILO (Bovenkerk, 1992, p. 32) prescribes a procedure for calculating the rate at whichdiscrimination is encountered in face-to-face tests. Using that procedure, the best estimate of therate of discrimination faced by Black job applicants in these studies is 19.4 per cent, whilethat for Hispanic applicants is 33.2 per cent. Using alternative computational procedures, theestimated rate of discrimination for Blacks averages 15.6 per cent, while that for Hispanicsaverages 21.0 per cent. All these estimates are significantly different from zero.
The rates presented in the previous paragraph are based on entry-level positions and in-persontests. The ILO calls for employment vacancies with higher qualifications to be tested usingapplications presented by mail. One study by the Fair Employment Council includedcorrespondence tests for Hispanic job seekers, primarily for positions with higher qualifications.An exact rate of discrimination from this study cannot be computed using the computationalprocedure specified by the ILO research design. However, according to computations by theauthors of the study, 12.4 per cent of these tests displayed clear discrimination against the Hispanicapplicant, with possible discrimination in an additional 61.6 per cent of tests.
The four studies consistently found discrimination at a substantial rate in every segment of thelabour market where the number of tests conducted was sufficient to permit statistical analysis.Table 4 of this report examines 30 such segments, and among them, the lowest estimated rate ofdiscrimination is 12.2 per cent. The four studies documented discrimination:
C against both male and female testers;
C in both central-city and suburban locations;
C affecting positions requiring a university degree and those with lower educationalprerequisites;
C affecting positions in large firms with professional personnel departments and in small,owner-managed enterprises;
C in firms advertising themselves as an "equal opportunity employer" and in those not doingso; and
C in job classifications ranging from manual occupations, through non-supervisory office,clerical, retail, and service occupations, to higher-level supervisory and managerialoccupations.
For the majority of these segments of the labour market, the studies provided little consensusconcerning where discrimination was particularly likely. Thus, for example, the FEC's study ofHispanics found a higher rate of discrimination against minority men than against minority women,while the same organizations's study of Blacks found the reverse; and while the FEC's study of

38
Blacks found a higher rate of discrimination in suburbs than in the central city, The UrbanInstitute's study for the same group found no statistically-significant pattern.
Some consistent empirical support was found, however, for two general patterns:
C Employment opportunities for which applicants were sought without public advertisingwere particularly prone to discrimination. Thus, in tests by the FEC in which theestimated rate of discrimination averaged 22 to 24 per cent for all vacancies, vacancies thatwere not advertised in widely-circulated newspapers and those that were filled throughprivate employment placement agencies exhibited rates of discrimination of between 33 and67 per cent.
C Employment opportunities which involve public contact (such as sales occupations) weresomewhat more prone to discrimination than those that did not (such as manual or officeoccupations).
6.2 Implications for public policy in the United States
Broad societal consensus in the United States holds that employment discrimination based onrace and ethnicity is socially and morally wrong, as well as harmful to the productivity of theeconomy. However, little consensus prevails concerning appropriate public and private responsesto discrimination. The empirical testing evidence presented in this paper suggests policyimplications on three important topics on which this lack of consensus prevails.
The first topic is directly related to the fundamental empirical question that the testing studieswere designed to address: the extent to which racial/ethnic discrimination continues to operate inthe United States labour market. Some commentators argue that, in the 1990s, race is of decliningsignificance as a category in United States society; that racial/ethnic discrimination in employmentnow occurs only in rare or isolated instances; and that therefore the country's public policy agendashould no longer accord to the issues of race and ethnicity the same level of attention that it hasbeen accorded over recent decades. Other commentators argue that discrimination remainspervasive and deeply-ingrained; that it would be naive to premise public policies on theassumption that race and ethnicity no longer importantly affect an individual's employmentopportunities; and that therefore issues of race and ethnicity must continue to occupy a centralplace in public policy debates (Assembly Committee on the Judiciary, 1995; Wilson, 1980;D'Souza, 1995). By reporting the net rate of discrimination against minorities at one employmentapplication in five for Blacks and one in three for Hispanics, the empirical testing evidencepresented in this paper is more supportive of the latter view than of the former.
A second topic on which little consensus prevails in the United States concerns the prevalenceof "reverse discrimination." This term refers to circumstances in which white persons sufferdiminished opportunities in the labour market when minorities are hired, promoted, or otherwiseadvanced more than their qualifications would justify. Some commentators argue that anti-discrimination activities in the United States over the past several decades have "over-tipped" thebalance in favour of minorities so that instances of reverse discrimination are now more commonthan are cases of discrimination against minorities; others argue that instances of reversediscrimination are relatively rare. By reporting that reverse discrimination constitute only one-fifth of all cases in which Whites and minorities are treated differently, the empirical testingevidence presented in this paper is more consistent with the latter position than with the former.
A third topic on which lack of consensus prevails in the United States is the appropriatenessof "affirmative action" against discrimination. Affirmative action refers to "...any measure, beyond
39
simple termination of a discriminatory practice, adopted to correct or compensate for pastdiscrimination or prevent discrimination from recurring in the future" (U.S. Commission on CivilRights, 1977, p. 1). Over the past several decades, a wide range of such activities have beenimplemented in the United States. Some have been relatively mild and non-controversial, suchas advertising job vacancies in newspapers circulated in minority communities, sending recruitersto conduct interviews at schools where large numbers of minority students are enrolled, orproviding "mentors" for newly-hired minority employees. Other affirmative action approachesare more dramatic and have sparked sharp controversy. For example, some employers havecalculated individuals' scores on employment screening tests using numerical norms that weredifferent for majority and minority test takers; other employers have established race-specificnumerical goals for hiring or promotion (for example, seeking to hire one minority job candidatefor each majority candidate hired) (Clark, 1989; Hartigan and Wigdor, 1989). Some commentatorsargue that discrimination such as testing has documented should be addressed with such affirmativeactions. Other commentators argue that the appropriate remedy is only vigorous enforcement ofprohibitions on discrimination. The testing findings presented in this paper are more consistentwith the former position than with the latter.
These findings indicate that in the United States labour market in the 1990s, racial and ethnicdiscrimination is often subtle and woven into apparently-neutral processes, so that it is difficultto isolate, document, and attack through conventional anti-discrimination enforcement alone. Inparticular, it often reflects stereotyped beliefs and biased attitudes held, consciously orunconsciously, by majority employment decision-makers. These beliefs and attitudes can often bechanged most effectively by the experience of working as peers with racial and ethnic minorities(Zahn-Waxler and Radke-Yarrow, 1990; Latane and Darley, 1970; Freedman and Fraser, 1966).In the absence of affirmative action, these beliefs and attitudes continue to exclude minorities andthereby prevent that experience from accumulating. Affirmative action may therefore serve as away to break a stalemate.
Bibliography
Aigner, D.; G. Cain. 1977. "Statistical theories of discrimination in labour markets", in Industrial and LabourRelations Review, 30 (2), pp. 175-87.
Arvey, R.; J. Campion. 1982. "The employment interview: Survey and review of recent research", in PersonnelPsychology, 35 (2), pp. 281-322.
Assembly Committee on the Judiciary. 1995. Discrimination and affirmative action: Are there any facts outthere?
California State Legislature, Sacramento.
Ayres, I. 1991. "Fair driving: Gender and race discrimination in retail car negotiations", in Harvard Law Review,104 (4), pp. 817-72.
Becker, G. 1971. The economics of discrimination, University of Chicago Press, Chicago.
Bendick, Jr., M. 1989a. Auditing race discrimination in hiring: A research design, Bendick and Egan EconomicConsultants, Inc., Washington.
Bendick, Jr., M. 1990. "The Croson decision mandates that set-aside programs be tools of business development",in George Mason University Civil Rights Law Journal, 1 (1), pp. 87-104.
Bendick, Jr. M. 1989b. "Matching workers and job opportunities", in D. Bawden and F. Skidmore (eds.) Rethinkingemployment policy, Urban Institute Press, Washington, pp. 81-108.
Bendick, Jr. M. 1995. "Research evidence on racial/ethnic discrimination and affirmative action in employment",in Assembly Committee on the Judiciary, op. cit.; pp. 58-78.

40
–; M. Egan. 1988. Jobs: Employment Opportunities in the Washington Metropolitan Area for Persons withLimited Employment Qualifications, Greater Washington Research Center, Washington.
–; C. Jackson; V. Reinoso. 1994. "Measuring employment discrimination through controlled experiments", inReview of Black Political Economy, 23 (1), pp. 25-48.
–; –; –; L. Hodges. 1991. "Discrimination against Latino job applicants: A controlled experiment", in HumanResource Management, 30 (4), pp. 469-84.
–; –; J. H. Romero. Forthcoming, 1996. “Employment discrimination against older workers: An experimental studyof hiring practices", in Journal of Aging and Social Policy.
Blumrosen, A. 1995. How the courts are handling reverse discrimination claims , Office of ContractCompliance
Programs, U.S. Department of Labour, Washington.
Boggs, R.; J. Sellers; M. Bendick, Jr. 1993. "Use of testing in civil rights enforcement", in M. Fix and R. Struyk(eds.) Clear and convincing evidence: measurement of discrimination in America , Urban Institute
Press,Washington, pp. 345-76.
Borjas, G. 1994a. "The economics of immigration", in Journal of Economic Literature, 22 (4), pp. 1667-717.
–. 1994b. "Long-run convergence of ethnic skill differentials: Children and grandchildren of the great migration",in Industrial and Labour Relations Review, 47 (4), pp. 553-73.
–; R. Freeman. 1992. Immigration and the work force, consequences for the United States and source areas,
University of Chicago Press, Chicago.
Bortnick, S.; M. Ports. 1991. "Job search methods and results: Tracking the unemployed", in Monthly LabourReview, 115 (12), pp. 29-35.
Bovenkerk, F. 1992. A manual for international comparative research on discrimination on the grounds of"race"
and ethnic origin, International Labour Office, Geneva.
Bowman, P. 1991. "Work life", in J. Jackson (ed.) Life in black America, Sage Publications, Newberry Park, Ca., pp. 124-55.
Braddock, J.; J. McPartland. 1987. "How minorities continue to be excluded from equal employmentopportunities:
Research on labour market and institutional barriers", in Journal of Social Issues, 43 (1), pp. 5-39.
Brief, A. et al. 1994. Releasing the beast: A study of compliance with orders to use race as a selection criterion,Tulane University, New Orleans.
Cain, G. 1986. "The economic analysis of labour market discrimination", in O. Aschenfelter; R. Layard (eds.):Handbook of Labour Economics, Elsevier Science Publishers, New York, pp. 693-785.
Chiswick, B. 1988. Illegal aliens, their employment and employers, Upjohn Institute for Employment Research,Kalamazoo, Mi.
Clark, L. 1989. "Insuring equal opportunity in employment through law", in D. Bawden; F. Skidmore (eds.), Rethinking employment policy, Urban Institute Press, Washington, pp. 173-204.
Cose, E. 1993. The rage of a privileged class, Harper Collins, New York.
Cross, H. et al. 1990. Employer hiring practices: Differential treatment of Hispanic and Anglo job seekers, TheUrban Institute, Washington.
41
Culp, J.; B. Dunson. 1986. "Brothers of a different color: A preliminary look at employer treatment of black andwhite youth", in R. Freeman; H. Holzer (eds.), The black youth employment crisis, University of ChicagoPress, Chicago, pp. 233-59.
Darley, J; P. Gross. 1983. "A hypothesis-conforming bias in labelling effects", in Journal of Personality andSocial
Psychology, 44 (1), pp. 20-33.
Davis, P. 1989. "Law as microaggression", in Yale Law Journal, 98 (4), pp. 1559-77.
DeFreitas, G. 1985. "Ethnic differentials in unemployment among Hispanic Americans", in G. Borjas; M. Tienda(eds.), Hispanics in the U.S. economy, Academic Press, New York, pp. 127-57.
–. 1991. Inequality at work, Hispanics in the U.S. labour force, Oxford University Press, New York.
D'Souza, D. 1995. The end of racism, Free Press, New York.
Egan, M.; M. Bendick, Jr. 1991. Managing Greater Washington's changing work force, Greater WashingtonResearch Center, Washington.
Ehrenberg, R.; R. Smith. 1994. Modern Labour Economics, Harper Collins College Publishers, New York.
Fair Employment Council. 1993. EEO testing manual, Fair Employment Council of Greater Washington, Washington.
Feagin, J.; M. Sykes, M. 1994. Living with racism, the black middle class experience, Beacon Press, Boston.
Fix, M. ; F. Bean. 1990. "The findings and policy implications of the GAO report and the Urban Institute hiring audit", in International Migration Review, 24 (1), pp. 817-27.
–; R. Struyk (eds.) 1993. Clear and convincing evidence: Measurement of discrimination in America, The UrbanInstitute Press, Washington.
Frankel, H. 1994. "Opportunity denied! New York State's study of racial and sexual discrimination related togovernment contracting", in The Urban Lawyer, 26 (3), pp. 413-470.
Freeman, R.; H. Holzer (eds.) 1986. The black youth employment crisis, University of Chicago Press, Chicago.
Freedman, J.; S. Fraser. 1966. "Compliance without pressure, the foot-in-the-door technique", in Journal ofPersonality and Social Psychology, 4 (2), pp. 195-202.
Galster, G. et al. 1994. Sandwich hiring audit pilot program, The Urban Institute, Washington.
Gill, A. 1989. "The role of discrimination in determining occupational structure", in Industrial and LabourRelations Review, 42 (4), pp. 610-23.
Grenier, G. 1984. "The effect of language characteristics on the wages of Hispanic-American males", in Journalof Human Resources, 19 (1), pp. 35-52.
Guion, R. 1966. "Employment test and discrimination hiring", in Industrial Relations, 5 (1), pp. 20-37.
Hanson, S.; G. Pratt. 1994. "Dynamic dependencies: A geographic investigation of local labour markets", in Economic Geography, 68 (4), pp. 610-23.
Harris, L. 1989. The unfinished agenda on race in America , NAACP Legal Defense Fund, New York.
Hartigan, J.; A. Wigdor. 1989. Fairness in employment testing, National Academy Press, Washington. Holzer, H. 1987. "Informal job search and black youth unemployment", in American Economic Review, 77 (3),446- 52.
42
Jackson, S. and Associates. 1992. Diversity in the workplace, Guilford Press, New York.
James, F.; S. Del Castillo. 1992. We may be making progress toward equal access to jobs: Evidence from recent audits, University of Colorado at Denver, Denver.
Jaynes, G.; R. Williams (eds.) 1989. A common destiny, blacks and American society, National Academy ofSciences Press, Washington.
Kenney, G.; D. Wissoker. 1994. "An analysis of the correlates of discrimination facing young Hispanic job-seekers",
in American Economic Review, 84 (3), pp. 674-83.
Kleugel, J.; E. Smith. 1986. Beliefs about equality, Americans' views of what is and what ought to be, Aldinede Guyter, Hawthorne, N.Y.
Konrad, A.; F. Linnehan. 1995. "Formalized HRM structures: Coordinating equal employment opportunity orconcealing organizational practices?", in Academy of Management Journal, 38 (3), pp. 787-820.
Krueger, J.; M. Rothbart. 1988. "Use of categorical and individuating information in making inferences about personality", in Journal of Personality and Social Psychology, 55 (1), pp. 187-95.
Latane, B.; J. Darley. 1970. The unresponsive bystander, why doesn't he help?, Appleton-Century-Crofts, NewYork.
Leonard, J. 1990. "The impact of affirmative action regulations and equal employment laws on black employment", in Journal of Economic Perspectives, 4 (4), pp. 47-63.
Lord, C.; D. Saentz. 1985. "Memory deficits and memory surfeits: Differential cognitive consequences oftokenism
for tokens and observers", in Journal of Personality and Social Psychology, 49 (4), pp. 918-26.
McIntosh, N.; D. Smith. 1974 The extent of racial discrimination, Political and Economic Planning, London.
McIntyre, S. et al. 1980. "Preferential treatment of preselection decisions according to race and sex", in Academy of Management Journal, 23 (3), pp. 738-49.
Massey, D.; N. Denton. 1993. American apartheid and the making of the underclass, Harvard University Press, Cambridge, Ma.
Molloy, J. 1988. Dress For Success, Warner Books, New York.
Myrdal, G. 1944. An American dilemma, the Negro problem and modern democracy, Harper and BrothersPublishers, New York.
Neckerman, K.; J. Kirschenman. 1991a. "Hiring strategies, racial bias, and inner-city workers", in Social Problems,38 (4), pp. 433-47.
–; –. 1991b. " 'We'd love to hire them, but...': The meaning of race for employers", in C. Jencks ; P. Peterson (eds.),The urban underclass, Brookings Institution, Washington, pp. 203-34.
Neumark, D.; R. Blank; K. Van Nort. 1995. Sex discrimination in restaurant hiring: An audit study, NationalBureau for Economic Research, Cambridge, MA.
Newman, J. 1978. "Discrimination in recruitment: An empirical analysis", in Industrial and Labour RelationsReview, 32 (1), pp. 15-23.
Portes, A.; R. Bach. 1985. Latin journey, Cuban and Mexican immigrants in the United States, University ofCalifornia Press, Berkeley.

43
Powell, W.; L. Smith-Doerr. 1994. "Networks and economic life", in N. Smelser; R. Swedberg (eds.), Thehandbook
of economic sociology, Princeton University Press, Princeton, pp. 368-402.
Reimers, C. 1985. "A comparative analysis of the wages of Hispanics, blacks, and non-Hispanic whites", in G.Borjas; M. Tienda (eds.), Hispanics in the U.S. economy, Academic Press, New York, pp. 27-75.
Rutherglen, G. 1994. Protecting aliens, immigrants, and ethnic minorities from discrimination in employment:The experience of the United States, World Employment Programme working paper, International LabourOffice, Geneva.
Scanlon, J.; M. Bendick, Jr. 1993. Racial and ethnic discrimination in restaurant franchising, Committee onSmall
Business, U.S. House of Representatives, Washington.
Smith, J.; F. Welch. 1989. "Black economic progress after Myrdal", in Journal of Economic Literature, 27 (2),pp. 519-564.
Smith, T. 1990. Ethnic images, National Opinion Research Center, Chicago.
Squires, G. (ed.) 1992. From redlining to reinvestment, Temple University Press, Philadelphia.
Swanson, D. 1991. The resume solution, how to write and use a resume that gets results, JIST Works,Indianapolis.
Thomas, R. 1991. Beyond race and gender, American Management Association, New York.
Tilly, C.; C. Tilly. 1994. "Capitalist work and labour markets", in N. Smelser; R. Swedberg (eds.), The handbookof economic sociology, Princeton University Press, Princeton, pp. 283-312.
Towers Perrin. 1990. Workforce 2000: Competing in a seller's market, Towers Perrin, Valhalla, N.Y. Turner, M.; M. Fix; R. Struyk. 1991. Opportunities diminished, opportunities denied, The Urban Institute,
Washington.
U.S. Bureau of the Census. 1994. Statistical abstract of the United States, U.S. Department of Commerce,Washington.
U.S. Bureau of Labor Statistics. 1992. Employment and earnings, U.S. Department of Labour, Washington.
U.S. Commission on Civil Rights. 1977. Statement on affirmative action, U.S. Commission on Civil Rights,Washington.
U.S. Department of Labor. 1990. Occupational outlook handbook, VGM Career Horizons, Lincolnwood, IL.
–. 1991. Dictionary of occupational titles, U.S. Department of Labor, Washington.
Welmer, J.; D. Sudbury. 1992. "Employment discrimination 'testers' – Will your hiring practices 'pass'?", in Employee Relations Law Journal, 17(4), pp. 623-633.
Wilson, W. 1980. The declining significance of race, University of Chicago Press, Chicago.
Wolpin, K. 1992. "The determinants of black-white differences in early employment careers: Search, layoffs,quits, and endogenous wage growth", in Journal of Political Economy, 100 (3), pp. 535-60.
Word, C.; M. Zanna; J. Cooper. 1974. "The nonverbal mediation of self-fulfilling prophesies in interracial interaction", in Journal of Experimental Social Psychology, 10 (1), pp. 109-120.
Yate, M. 1988. Resumes that knock 'em dead, Bob Adams, Inc., Holbrook, MA.

44
Yelnosky, M. 1993. "Filling an enforcement void: Using testers to uncover and remedy discrimination in hiringfor
lower-skilled, entry level jobs", in University of Michigan Journal of Law Reform, 26 (2), pp. 404-59.
Zahn-Waxler, C.; M. Radke-Yarrow. 1990. "The origins of empathic concern", in Motivation and Emotion, 13 (2),pp. 107-130.
Zimmerman, W. 1993. "Summary of the Urban Institute's and the University of Colorado's hiring audits", in Fixand Struyk (eds.), op. cit., pp. 407-14.
Zwerling, C.; H. Silver. 1992. "Race and job dismissal in a federal bureaucracy", in American Sociological Review, 57 (5), pp. 651-60.
Appendix: Additional employment studies in the United Statesusing situation testing
In addition to the four studies discussed throughout this report, several additional research studies applyingsituation testing to employment have been conducted in the United States.
C Race/ethnicity testing studies in earlier period. Prior to the testing activity discussed in this report, foursmall-scale studies had been completed (Culp and Dunson, 1986; Guion, 1966; McIntyre, et al., 1980;Newman, 1978). These efforts are not analysed in this paper because they were based on too smallsamples, implemented testing too unsystematically, or are too old to compare directly to data collectedunder the ILO design. However, in concluding that discrimination did exist, their findings are generallyconsistent with the findings from the four studies examined in this paper.
C The University of Colorado testing study of race/ethnicity discrimination. In 1991, a research team atthe University of Colorado, Denver, conducted a face-to-face testing study in the Denver labour market,completing 145 tests involving Black-White pairs and 140 involving Hispanic-White pairs (James andDelCastillo, 1992). They estimated a two per cent net rate of discrimination against Blacks compared toWhites and a 10 per cent rate in favour of Hispanics over Whites. Their study procedures generallyparalleled those of the Urban Institute and Fair Employment Council discussed in this report. However,their work appears to be contaminated by methodological flaws, including inappropriate pairing of testers,inadequate supervision of field work, and compensation arrangements giving minority testers greaterincentives to pursue job openings than White testers. These flaws led to differences in the level of effortexpended by paired testers (e.g. different numbers of follow-up calls) and also raised general concernsabout data validity and reliability (Zimmerman, 1993, pp. 409-410). Accordingly, this study was notincluded for discussion in chapters 2 and 3 of this report.
C Race/ethnicity testing using a "sandwich" approach . To examine the methodological feasibility of"sandwich testing" (assigning three testers to apply for the same position, one White between an earlierand a later minority applicant), the Urban Institute has conducted a small scale pilot study in Los Angeles(Galster et al., 1994). Since only half a dozen tests were completed, extensive analysis of the findings wasnot appropriate.
C Race/ethnicity tests conducted for litigation. The Fair Employment Council of Greater Washington andseveral other governmental or private organizations have conducted employment tests with the primarypurpose of bringing civil suits enforcing anti-discrimination laws against individual firms (Boggs, Sellerand Bendick, 1993). In addition to the FEC, the organizations involved include the MassachusettsCommission Against Discrimination (a government agency), the Chicago Legal Assistance Foundation, andthe Miami Branch of the NAACP (National Association for the Advancement of Colored People). Thesetesting efforts did not involve random sampling of firms, so it would be inappropriate to generalize fromthe rate of discrimination encountered in these tests to the general population of employers. Instead,testing was targeted to industries or firms where discrimination was believed to be prevalent. In addition,the results of these tests have not been reported in the social science research literature. However, theyfound discrimination in a number of firms, a finding that is consistent with the rates of discriminationestimated in the four studies reviewed in this paper. Furthermore, these activities extend the geographiccoverage of testing to additional labour markets, including Boston and Miami.
C Testing studies of age discrimination. The Fair Employment Council of Greater Washington hascompleted one study of age discrimination using correspondence testing. Pairs of resumes – one for a 32year old and one for a 57 year old – were mailed to approximately 2,000 of the largest private employersand employment placement agencies in the nation, applying for positions as executive secretary,management information specialist, or writer/editor. The older applicant was responded to by employersless favourably than the equally-qualified younger applicant at a net rate of 26.5 per cent of completed testsin which a job appeared to be vacant (Bendick, Jackson and Romero, in press).
C Testing studies of sex discrimination. One recent study tested for and documented discrimination on thebasis of gender in hiring decisions at restaurants in Philadelphia (Neumark, Blank and Van Nort, 1995; seealso Scanlon and Bendick, 1993).

46
International Migration Papers