Embed Size (px)
Citation preview

EYE ON THE M ARKET • M I CHAEL CEMB AL EST • J .P . MORG A N L ast u p dat e d 11/ 3/2 021
INVESTMENT AND INSURANCE PRODUCTS:
• NOT A DEPOSIT • NOT FDIC INSURED • NOT INSURED BY ANY FEDERAL GOVERNMENT AGENCY • NO BANK GUARANTEE • MAY LOSE VALUE
1
[2] Global infection, hospitalization and mortality trends
This section analyzes COVID infections and mortality reported to local, federal and intergovernmental agencies, and are heavily influenced by testing rates and differences in government reporting standards and capabilities. Serology tests suggest that the true number of COVID infections may be much higher than the number of reported infections. However, trends in reported infections are still important to monitor, since they influence government policy and the behavior of citizens and companies.
Table of contents: 1. Summary of infection and mortality trends by region ............................................................................................. 2
2. What’s new: In the US, COVID risks among the unvaccinated ................................................................................ 4
3. What’s new: Europe .................................................................................................................................................. 5
4. What’s new: South America, Central America, Caribbean ...................................................................................... 6
5. What’s new: Asia and India ....................................................................................................................................... 7
6. What’s new: MidEast, Israel, Africa .......................................................................................................................... 8
7. What’s new: Russia and Eastern Europe .................................................................................................................. 9
8. COVID at a glance: infections and mortality per mm in the developing world ..................................................... 10
9. Infection, mortality and hospitalization snapshots ................................................................................................ 11
10. Global testing data .................................................................................................................................................. 13
11. How lethal is COVID, and for whom? ...................................................................................................................... 14
Comments on infection data. Several countries show up with almost no COVID outbreak reported. In cases like New Zealand, Taiwan, Japan, Vietnam and South Korea, we interpret the lack of a material outbreak as possible based on the quality of data reporting and testing. Other countries which report low incidence of COVID include Nigeria, Kenya, Angola, DR Congo, Tanzania and Mozambique. As per various news reports1, there‘s a shortage of reliable data in many of these countries, and the lack of funds to carry out broad testing. On the other hand, while infections can be obscured, it’s harder to obscure a sharp rise in mortality; even when accounting for some under-reporting of deaths, Africa mortality rates are still much lower than expected. The few antibody surveys conducted in Africa reveal COVID prevalence that is similar to other European countries; in other words, COVID is spreading in Africa as it is elsewhere. The most likely explanation for lower relative mortality is age: Africa’s median age is 18, compared to 35 in North America and 42 in Europe. Since those over age 65 experience 80% of COVID mortality, age distributions are the most likely reason for lower African COVID mortality rates.
On data sources. We generally use infection and mortality data from Johns Hopkins, with any exceptions noted in chart sources. While JHU data usually match sources such as covidtracking.com and Worldometers, this is not always the case. Any large differences usually work themselves out over time; even so, such differences are a warning against over-extrapolating any short term trends seen in the data. There are also patterns in some countries in which tests and infections drop over the weekend, only to rise the following week. Other anomalies: countries and US states sometimes make large one-time additions or subtractions to infections or deaths data to reflect over- or underestimations made over the course of the entire pandemic. JHU and other data providers do not amortize such adjustments over time and simply reflect them on the day they are made; we do the same.
1 Examples include “In Africa, lack of coronavirus data raises fears of silent epidemic”, Reuters, July 8, 2020; and “Corona-free? How disinformation could be clouding the true pandemic picture in Africa”, Bulletin of Atomic Scientists, September 21, 2020.

EYE ON THE M ARKET • M I CHAEL CEMB AL EST • J .P . MORG A N Coronavirus
2
Summary of infection and mortality trends by region
Delta infections are starting to rise in the developed world. Pass-through to hospitalization and mortality has been lower than during prior COVID waves due to the effectiveness of vector and mRNA vaccines, and due to the lower age of many newly infected unvaccinated persons. In the Emerging countries for which we have more confidence in reported data, mortality is tracking infections due to lower rates of vaccination. Fourth chart shows how US states currently represent most of the Global Hotspots shown below.
0
1
2
3
4
5
6
7
8
050
100150200250300350400450500
02/20 05/20 08/20 11/20 03/21 06/21 09/21
Daily infections # per mm (LHS)
Daily deaths # per mm (RHS)
Developed regions
Source: JHU, IMF, JPMAM. Nov 2, 2021. 7 day smoothing.
0.0
0.5
1.0
1.5
2.0
2.5
3.0
3.5
0
20
40
60
80
100
120
140
160
02/20 05/20 08/20 11/20 03/21 06/21 09/21
Daily infections # per mm (LHS)
Daily deaths # per mm (RHS)
EM (LatAm, E Eur, EM Asia ex C/I, M East)
Source: JHU, IMF, JPMAM. Nov 2, 2021. 7 day smoothing.
0
100
200
300
400
500
600
02/20 05/20 08/20 11/20 03/21 06/21 09/21
Hotspots: AK MT NE ND OK WV WY UK
UK vs US Hotspots hospitalizations
Source: HHS, various country sources, IMF, JPMAM. Nov 2, 2021.
Current hospitalizations, # per mm, smoothing = 7 days
0200400600800
1,0001,2001,4001,6001,800
02/20 05/20 08/20 11/20 03/21 06/21 09/21
AKMTNDMNWYSGPUKROM
Global hotspots
Source: Johns Hopkins University, IMF, JPMAM. Nov 2, 2021.
Daily infections, # per mm, smoothing = 7 days
0100200300400500600700800900
1,000
02/20 05/20 08/20 11/20 03/21 06/21 09/21
UKHotspots: AK MT NE ND OK WV WYRussia regionEM Asia 5 (Indo, Thai, Mal, Phil, Viet)S AmericaSouthern Africa
Regions: high infections
Source: Johns Hopkins University, IMF, JPMAM. Nov 2, 2021.
Daily infections, # per mm, smoothing = 7 days
0.02.04.06.08.0
10.012.014.016.018.020.0
02/20 05/20 08/20 11/20 03/21 06/21 09/21
Hotspots: AK MT NE ND OK WV WYRussia regionUKS AmericaEM Asia 5 (Indo, Thai, Mal, Phil, Viet)Southern Africa
Regions: high mortality
Source: Johns Hopkins University, IMF, JPMAM. Nov 2, 2021.
Daily deaths, # per mm, smoothing = 14 days

EYE ON THE M ARKET • M I CHAEL CEMB AL EST • J .P . MORG A N Coronavirus
3
Alas
kaM
onta
naN
orth
Dak
ota
Min
neso
taW
yom
ing
SGP
UK
RO
MAU
TIo
wa
New
Ham
pshi
reN
ebra
ska
IRE
Col
orad
oC
ZEU
tah
NLD
New
Mex
ico
Idah
oW
est V
irgin
iaU
S ho
tM
ichi
gan
Ariz
ona
Wis
cons
inSo
uth
Dak
ota
Dev
Wor
ld e
x-U
S
0
100
200
300
400
500
600
700
800
900US States
Countries
25 highest infection rates vs Dev World ex-US
Source: Johns Hopkins University, IMF, JPMAM. November 2, 2021.
Daily infections, # per mm; US states, top 50 countries by GDP
Okl
ahom
aR
OM
Neb
rask
aU
S h
otW
est V
irgin
iaM
onta
naId
aho
Wyo
min
gN
orth
Dak
ota
Geo
rgia
RU
SK
entu
cky
Sou
th C
arol
ina
Kan
sas
Ala
bam
aP
enns
ylva
nia
Texa
sM
ichi
gan
Flor
ida
Ala
ska
Iow
aS
outh
Dak
ota
Ariz
ona
Nev
ada
Tenn
esse
e
Dev
Wor
ld e
x-U
S
0
5
10
15
20
25US States
Countries
25 highest mortality rates vs Dev World ex-US
Source: Johns Hopkins University, IMF, JPMAM. November 2, 2021.
Daily deaths, # per mm; US states, top 50 countries by GDP
0100200300400500600700800900
1,000
02/20 05/20 08/20 11/20 03/21 06/21 09/21
UK
US
Europe ex UK
CAN
US / Canada / Europe
Source: Johns Hopkins University, IMF, JPMAM. Nov 2, 2021.
Daily infections, # per mm, smoothing = 7 days
UK
Southern Africa
EM Asia 5 (Indo, Thai, Mal, Phil, Viet)
US
Europe
Hotspots: AK MT NE ND OK WV WY
S America
Russia region
Scandinavia
C America
E Europe
M East
CAN Europe ex UK
Dev Asia
NLD
73%
17%46%
67%
74%
56%
67%
34%
75%
51%
37%
36%79% 74%77%
76%0.0
2.0
4.0
6.0
8.0
10.0
12.0
14.0
16.0
18.0
0 100 200 300 400 500 600 700
Vaccination, mortality and infection trends by regionMortality per million people, 14 day avg; percentage = unique people vaccinated as % of population
Infections per million people, 7 day avgSource: Johns Hopkins University, IMF, JPMAM. November 2, 2021.
EYE ON THE M ARKET • M I CHAEL CEMB AL EST • J .P . MORG A N Coronavirus
4
What’s new: In the US, COVID risks among the unvaccinated
• US infections, mortality and hospitalizations are rolling over • Overall hospitalization is higher for some states than during the pre-vaccination winter 2020/2021 period
0
2
4
6
8
10
12
0
100
200
300
400
500
600
700
800
02/20 05/20 08/20 11/20 03/21 06/21 09/21
Daily infections # per mm (LHS)
Current hospitalizations # per mm (LHS)
Daily deaths # per mm (RHS)
US
Source: JHU, IMF, HHS, JPMAM. Nov 2, 2021. 7 day smoothing.
0100200300400500600700800900
1,000
02/20 05/20 08/20 11/20 03/21 06/21 09/21
Hotspots: AK MT NE ND OK WV WY
US ex Hotspots
US hotspot states
Source: Johns Hopkins University, IMF, JPMAM. Nov 2, 2021.
Daily infections, # per mm, smoothing = 7 days
0
5
10
15
20
25
30
0
200
400
600
800
1,000
02/20 05/20 08/20 11/20 03/21 06/21 09/21
Daily infections # per mm (LHS)
Current hospitalizations # per mm (LHS)
Daily deaths # per mm (RHS)
Hotspots: AK MT NE ND OK WV WY
Source: JHU, IMF, HHS, JPMAM. Nov 2, 2021. 7 day smoothing.
0
50
100
150
200
250
300
08/20 10/20 12/20 02/21 04/21 06/21 08/21 10/21
18-3940-59
Hotspots: AK MT NE ND OK WV WY: hosp by age
Source: HHS, JPMAM. November 2, 2021.
Prior day admissions, 14 day average
Age group:
0%
50%
100%
150%
200%
250%
AK MT WY VT ID WA OR ME CO WV UT HI ND MN NH
Current hospitalization levels vs winter 2020/2021 average15 largest ratios
Source: HHS, IMF, JPMAM. November 2, 2021.

EYE ON THE M ARKET • M I CHAEL CEMB AL EST • J .P . MORG A N Coronavirus
5
What’s new: Europe
• UK Delta variant wave less severe (mortality and hospitalization) since 94% of people over 50 are vaccinated • Infections are rising in Continental Western Europe; hospitalizations and mortality showing a very small rise,
reflective of high levels of vaccination
0
5
10
15
20
0
200
400
600
800
1,000
02/20 05/20 08/20 11/20 03/21 06/21 09/21
Daily infections # per mm (LHS)
Current hospitalizations # per mm (LHS)
Daily deaths # per mm (RHS)
United Kingdom
Source: JHU, IMF, OWID, JPMAM. Nov 2, 2021. 7 day smoothing.
0100200300400500600700800900
1,000
02/20 05/20 08/20 11/20 03/21 06/21 09/21
NLDBELDEUFRAITAESP
W Europe
Source: Johns Hopkins University, IMF, JPMAM. Nov 2, 2021.
Daily infections, # per mm, smoothing = 7 days
0
100
200
300
400
500
600
700
02/20 05/20 08/20 11/20 03/21 06/21 09/21
BELFRAITAESPNLD
W Europe
Source: various country sources, IMF, JPMAM. Nov 2, 2021.
Current hospitalizations, # per mm, smoothing = 7 days
0.0
5.0
10.0
15.0
20.0
25.0
30.0
02/20 05/20 08/20 11/20 03/21 06/21 09/21
BELDEUNLDITAESPFRA
W Europe
Source: Johns Hopkins University, IMF, JPMAM. Nov 2, 2021.
Daily deaths, # per mm, smoothing = 14 days
0
100
200
300
400
500
600
700
800
02/20 05/20 08/20 11/20 03/21 06/21 09/21
DENICENORFINSWE
Scandinavia
Source: Johns Hopkins University, IMF, JPMAM. Nov 2, 2021.
Daily infections, # per mm, smoothing = 7 days
0
200
400
600
800
1,000
1,200
1,400
02/20 05/20 08/20 11/20 03/21 06/21 09/21
AUT
IRE
SWI
PRT
W Europe
Source: Johns Hopkins University, IMF, JPMAM. Nov 2, 2021.
Daily infections, # per mm, smoothing = 7 days

EYE ON THE M ARKET • M I CHAEL CEMB AL EST • J .P . MORG A N Coronavirus
6
What’s new: South America, Central America, Caribbean • Case counts and mortality have been declining sharply from very high levels. Note that Gamma and Lambda
variants have been more prevalent than Delta variant
0
2
4
6
8
10
12
0
50
100
150
200
250
300
350
400
02/20 05/20 08/20 11/20 03/21 06/21 09/21
Daily infections # per mm (LHS)
Daily deaths # per mm (RHS)
S America
Source: JHU, IMF, JPMAM. Nov 2, 2021. 7 day smoothing.
0
200
400
600
800
1,000
1,200
02/20 05/20 08/20 11/20 03/21 06/21 09/21
CHLURUBRAVENCOLARGPARECU
South America
Source: Johns Hopkins University, IMF, JPMAM. Nov 2, 2021.
Daily infections, # per mm, smoothing = 7 days
0.02.04.06.08.0
10.012.014.016.018.020.0
02/20 05/20 08/20 11/20 03/21 06/21 09/21
BRACOLCHLARGVENURUPARECU
South America
Source: Johns Hopkins University, IMF, JPMAM. Nov 2, 2021.
Daily deaths, # per mm, smoothing = 14 days
0100200300400500600700800900
02/20 05/20 08/20 11/20 03/21 06/21 09/21
TTODOMCUBBAHJAM
Caribbean
Source: Johns Hopkins University, IMF, JPMAM. Nov 2, 2021.
Daily infections, # per mm, smoothing = 7 days
0100200300400500600700800900
1,000
02/20 05/20 08/20 11/20 03/21 06/21 09/21
BLZCOSGUAPANMEXHONSLV
Central America
Source: Johns Hopkins University, IMF, JPMAM. Nov 2, 2021.
Daily infections, # per mm, smoothing = 7 days

EYE ON THE M ARKET • M I CHAEL CEMB AL EST • J .P . MORG A N Coronavirus
7
What’s new: Asia and India • Infections remain low in Developed Asia outside Singapore • Malaysia infections and deaths rolling over after spiking in September
0
100
200
300
400
500
600
700
02/20 05/20 08/20 11/20 03/21 06/21 09/21
SGPKORJPNHKTAI
Developed Asia
Source: Johns Hopkins University, IMF, JPMAM. Nov 2, 2021.
Daily infections, # per mm, smoothing = 7 days
0
100
200
300
400
500
600
700
800
02/20 05/20 08/20 11/20 03/21 06/21 09/21
MALTHAVNMPHLMYAIDN
EM Asia
Source: Johns Hopkins University, IMF, JPMAM. Nov 2, 2021.
Daily infections, # per mm, smoothing = 7 days
0.0
2.0
4.0
6.0
8.0
10.0
12.0
14.0
02/20 05/20 08/20 11/20 03/21 06/21 09/21
MALPHLTHAVNMMYAIDN
EM Asia
Source: Johns Hopkins University, IMF, JPMAM. Nov 2, 2021.
Daily deaths, # per mm, smoothing = 14 days
0
100
200
300
400
500
600
700
02/20 05/20 08/20 11/20 03/21 06/21 09/21
BRULAOPAPCAMBHU
Other Asia
Source: Johns Hopkins University, IMF, JPMAM. Nov 2, 2021.
Daily infections, # per mm, smoothing = 7 days
050
100150200250300350400450500
02/20 05/20 08/20 11/20 03/21 06/21 09/21
IRNSRINEPINDPAKBAN
India region
Source: Johns Hopkins University, IMF, JPMAM. Nov 2, 2021.
Daily infections, # per mm, smoothing = 7 days
0.01.02.03.04.05.06.07.08.09.0
10.0
02/20 05/20 08/20 11/20 03/21 06/21 09/21
IRNSRIINDNEPPAKBAN
India region
Source: Johns Hopkins University, IMF, JPMAM. Nov 2, 2021.
Daily deaths, # per mm, smoothing = 14 days
EYE ON THE M ARKET • M I CHAEL CEMB AL EST • J .P . MORG A N Coronavirus
8
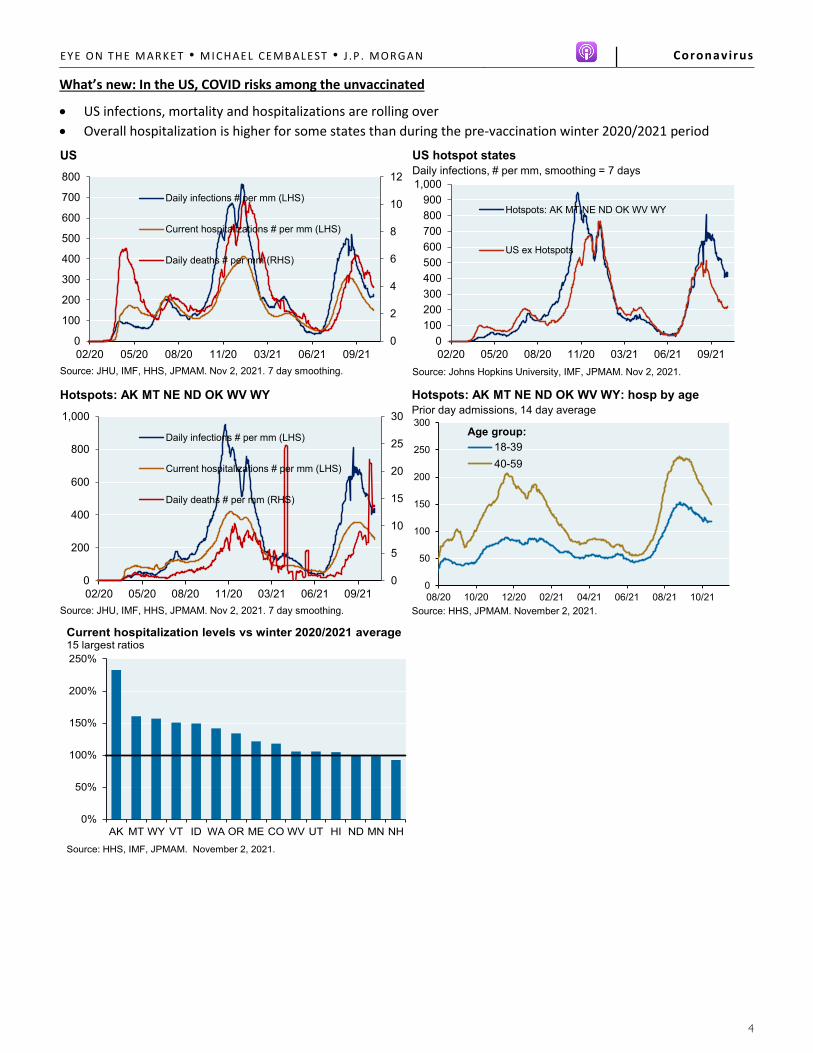
What’s new: MidEast, Israel, Africa • Israel infections and deaths are rolling over. Israel saw high levels of infection during the Delta wave despite
a 70% vaccination rate. See Section 1 on evidence of fading immunity in Israel • Africa infections have rolled over. While reported infections in Africa are lower than in India/LatAm, there
are questions about reliability of African data and many of its healthcare systems are less equipped to handle the increase in sick patients
0100200300400500600700800900
1,000
02/20 05/20 08/20 11/20 03/21 06/21 09/21
TURLEBUAEKWTSAU
Mideast
Source: Johns Hopkins University, IMF, JPMAM. Nov 2, 2021.
Daily infections, # per mm, smoothing = 7 days
0
1
2
3
4
5
6
7
8
0
200
400
600
800
1,000
1,200
1,400
02/20 05/20 08/20 11/20 03/21 06/21 09/21
Daily infections # per mm (LHS)
Current hospitalizations # per mm (LHS)
Daily deaths # per mm (RHS)
Israel
Source: JHU, IMF, OWID, JPMAM. Nov 2, 2021. 7 day smoothing.
0
10
20
30
40
50
60
70
80
02/20 05/20 08/20 11/20 03/21 06/21 09/21
ETHMLIKENUGANGACOTSEN
Northern Africa
Source: Johns Hopkins University, IMF, JPMAM. Nov 2, 2021.
Daily infections, # per mm, smoothing = 7 days
0
200
400
600
800
1,000
1,200
02/20 05/20 08/20 11/20 03/21 06/21 09/21
BOTSAFNAMZIMZMBMOZ
Southern Africa
Source: Johns Hopkins University, IMF, JPMAM. Nov 2, 2021.
Daily infections, # per mm, smoothing = 7 days
0
100
200
300
400
500
600
700
800
02/20 05/20 08/20 11/20 03/21 06/21 09/21
LBYTUNEGYMORALG
Mediterranean Africa
Source: Johns Hopkins University, IMF, JPMAM. Nov 2, 2021.
Daily infections, # per mm, smoothing = 7 days

EYE ON THE M ARKET • M I CHAEL CEMB AL EST • J .P . MORG A N Coronavirus
9
What’s new: Russia and Eastern Europe
0
200
400
600
800
1,000
1,200
1,400
02/20 05/20 08/20 11/20 03/21 06/21 09/21
LTUGEOUKRRUSBLRKAZKGZ
Russia region
Source: Johns Hopkins University, IMF, JPMAM. Nov 2, 2021.
Daily infections, # per mm, smoothing = 7 days
0.02.04.06.08.0
10.012.014.016.018.020.0
02/20 05/20 08/20 11/20 03/21 06/21 09/21
UKRLTUGEORUSBLRKAZKGZ
Russia region
Source: Johns Hopkins University, IMF, JPMAM. Nov 2, 2021.
Daily deaths, # per mm, smoothing = 14 days
0
200
400
600
800
1,000
1,200
1,400
02/20 05/20 08/20 11/20 03/21 06/21 09/21
SVNSLKBULROMCZEGRCHUNPOL
E Europe
Source: Johns Hopkins University, IMF, JPMAM. Nov 2, 2021.
Daily infections, # per mm, smoothing = 7 days

EYE ON THE M ARKET • M I CHAEL CEMB AL EST • J .P . MORG A N Coronavirus
10
COVID at a glance: infections and mortality per mm in the developing world
Normally we show infection and mortality data in linear terms. But when comparing across the Emerging World, the dispersions are too great to properly grasp on a linear axis so we use a log scale instead. As a reminder, on a log scale each increment represents an increase of 10x vs the prior value. To be clear, there are substantial uncertainties regarding the accuracy of COVID infections and deaths reported in some countries; this chart shows the data as reported by Johns Hopkins.
ANG
BEN
BOT
BFA
BDI
CABCAM
CAF
CHD
CON
DRC
COT
DJI
EQG
ERI
SWZ
ETH
GAB
GAM
GHA
GUIGBI
KEN
LIBMAD
MWIMLI
MOZ
NAM
NGR
NGA
RWA
SAO
SEN
SEYSLE
SAF
SSU
TZA
TOG
UGA
ZMB
ZIM
AFG
BAN
BHU
BRU
MYACAM
CHN
FIJ
IND
IDN
LAO
MAL
MDV
MUS
MON
NEP
PAK
PAP
PHL
SRITHA
TIM
TUR
VNM
ARG
BOL
BRA
CHLCOL
ECU
GUY
PAR
PER
SUR
URU
VEN
ATG
BAH
BAR
BLZ
COS
CUB
DCA
DOM
GRNGUA
HAI
HON
JAM
MEX
NIC
PAN
SLU
TTO
ALG
BHR
EGY
IRN
IRQ ISR
JOR
KWT
LEB
LBY
MRT
MOR
OMN QATSAU
SYR
TUN
UAE
GAZ
YEM
ALB
ARM
AZEBLR
BOS
BUL
CRO EST
GEO
KAZ
KGZ
LVALTU
MDAMNE
MKD
POL
ROM
RUS SRB
SLK
SVN
UKR
UZB
0.00
0.01
0.10
1.00
10.00
100.00
0.0 0.1 1.0 10.0 100.0 1,000.0
AfricaEM AsiaS AmericaC AmericaM EastE Europe
Infection and mortality trends in Africa, EM Asia, S America, C America, M East, E Europe
Source: Johns Hopkins University, IMF, JPMAM. November 2, 2021.
Mortality per million people, 14 day average, log scale
Infections per million people, 7 day average, log scale

EYE ON THE M ARKET • M I CHAEL CEMB AL EST • J .P . MORG A N Coronavirus
11
Infection, mortality and hospitalization snapshots The charts below show current rates of infection and mortality compared to the rate 21 days ago and the case fatality rate for the 50 largest countries based on GDP. These countries represent 94% of global GDP.
0
100
200
300
400
500
600
700
SG
P U
K R
OM
AU
T IR
E C
ZE N
LD U
S ho
t B
EL D
EN T
UR R
US
DEU U
S S
WI
NO
R P
OL
MAL
THA IR
N IS
R F
IN C
HL
SW
E F
RA P
RT ITA
AU
S C
AN
VNM
BR
A K
OR
ESP
PHL
CO
L N
ZL M
EX A
RG
PER IN
D E
GY
UA
E J
PN S
AF P
AK IDN
BA
N S
AU N
GA
TAI
CH
N
Infection rate 21 days agoCurrent infection rate
Infection levels for the largest 50 countries based on GDPSorted by trailing 7 day average infection rate per mm people
Source: Johns Hopkins University, IMF, JPMAM. Countries shown represent 94% of World GDP. November 2, 2021.
0
2
4
6
8
10
12
14
16
18
20
22
24
RO
M U
S ho
t R
US
US
TUR
SG
P U
K M
AL M
EX IRE
IRN
PO
L P
HL C
ZE A
UT
BR
A B
EL D
EU T
HA C
AN
NLD
PER
SW
I IS
R V
NM SAF
CO
L IT
A C
HL
FIN
ESP
SW
E A
US
EG
Y F
RA P
RT A
RG
IND
DEN
KO
R N
OR
UA
E ID
N J
PN S
AU P
AK B
AN
NG
A T
AI N
ZL C
HN
Mortality rate 21 days ago
Current mortality rate
Mortality levels for the largest 50 countries based on GDPSorted by trailing 14 day average mortality rate per mm people
Source: Johns Hopkins University, IMF, JPMAM. Countries shown represent 94% of World GDP. November 2, 2021.
0%
1%
2%
3%
4%
5%
6%
7%
8%
9%
10%
11%
12%
SAF
MEX
EGY
IDN
SAU
PHL
US h
otRO
MNG
AIN
DPE
RBR
ARU
SBA
NPA
KCO
LUS
ARG
IRN
CAN
ESP
UAE
MA
LTA
IVN
MJP
NAU
SIT
ATU
RPO
LTH
AKO
RSW
EIS
RPR
TFR
ACH
LFI
NDE
UUK BE
LSG
PIR
ESW
ICZ
EAU
TNL
DNO
RDE
NNZ
LCH
NCase fatality rates for the largest 50 countries based on GDPSorted by case fatality rate (mortality divided by reported infections)
Source: Johns Hopkins University, IMF, JPMAM. Countries shown represent 94% of World GDP. November 2, 2021.

EYE ON THE M ARKET • M I CHAEL CEMB AL EST • J .P . MORG A N Coronavirus
12
The charts below show current rates of infection, mortality and hospitalization compared to the rate 21 days ago for the 50 US states and DC.
0
100
200
300
400
500
600
700
800
900
AK
MT
ND
MN
WY IA NH
NE
CO
UT
NM ID WV MI
AZ
WI
SD
ME
AL
VT
PA
OH
KS
KY
WA
DE
OR IN RI
NY
NV
MA
NC IL OK
MO
SC
VA
CA
TN
AR
NJ
TX
DC
MD
GA
LA
CT
MS HI
FL
Infection rate 21 days agoCurrent infection rate
Infection levels for US statesSorted by trailing 7 day average infection rate per mm people
Source: Johns Hopkins University, IMF, JPMAM. November 2, 2021.
0
2
4
6
8
10
12
14
16
18
20
22
24
OK
NE
WV
MT ID WY
ND
GA
KY
SC
KS
AL
PA
TX MI
FL
AK IA SD
AZ
NV
TN
AR IN DE
CO
MS
NM
ME
VA
NC
WI
WA
UT
MN
MO
OR
LA
VT
CA
MD
NH IL HI
NJ
OH
NY
MA
CT RI
DC
Mortality rate 21 days ago
Current mortality rate
Mortality levels for US statesSorted by trailing 14 day average mortality rate per mm people
Source: Johns Hopkins University, IMF, JPMAM. November 2, 2021.
0
50
100
150
200
250
300
350
400
MT
WV
WY
ND
AK ID AZ
PA
OH
CO
SD MI
NE
NM
NV
KY IN MN
DE
MO WI
IA UT
WA
KS
ME
TN
OR
GA
NH
TX
AR
OK
NC
AL
VA
MD
SC
NY
CA
DC IL FL
MS
NJ
VT RI
CT HI
MA
LA
Hosp. rate 21 days ago
Current hosp. rateHospitalization levels for US statesSorted by trailing 7 day average current hospitalizations per mm people
Source: HHS, IMF, JPMAM. November 2, 2021.

EYE ON THE M ARKET • M I CHAEL CEMB AL EST • J .P . MORG A N Coronavirus
13
Global testing data The charts below track infection, hospitalization, testing2 and mortality data for the US in aggregate as well as a comparison of testing levels across the largest 50 countries by GDP. See section 3 for a chartpack which covers the full range of infection, hospitalizations and mortality for countries and US states.
2 40 states report the total number of “testing encounters” or “testing specimens”; the rest show the number of people tested each day that have never been tested before or include untested probable cases. We only compute testing rates for the 40 states that provide encounter or specimen data.
0
500
1000
1500
2000
2500
3000
3500
4000
0
50,000
100,000
150,000
200,000
250,000
300,000
02/20 05/20 08/20 11/20 03/21 06/21 09/21
Daily infections levels (LHS)
Current hospitalizations levels (LHS)
Daily deaths levels (RHS)
US
Source: JHU, IMF, HHS, JPMAM. Nov 2, 2021. 7 day smoothing.
0.0%2.0%4.0%6.0%8.0%
10.0%12.0%14.0%16.0%18.0%20.0%
02/20 05/20 08/20 11/20 03/21 06/21 09/21
US testing states
Positive testing rate
Source: Johns Hopkins University, JPMAM. Nov 2, 2021.
Daily infections, % of total tests, smoothing = 7 days
0
1,000
2,000
3,000
4,000
5,000
6,000
7,000
02/20 05/20 08/20 11/20 03/21 06/21 09/21
US testing states
US testing: 40 testing states
Source: Johns Hopkins University, IMF, JPMAM. Nov 2, 2021.
Daily tests, # per mm, smoothing = 7 days
0
5,000
10,000
15,000
20,000
25,000
30,000
35,000
40,000
AUT
UAE
DEN UK ISR
CZE
ITA
BEL
AUS
NZL
FRA US IRE
TUR
RUS
US h
otSG
PM
AL
CHL
ROM
PRT
SWI
CAN
NOR
SWE
ESP
NLD
FIN
DEU
POL
IRN
SAU
VNM
ARG
IND
KOR
COL
TAI
THA
IDN
PHL
SAF
JPN
BRA
PER
PAK
BAN
MEX
NGA
EGY
CHN
Testing rate 21 days ago
Current testing rate
Testing levels for the largest 50 countries based on GDPSorted by trailing 7 day average testing rate per mm people
Source: OWID, JHU, IMF, JPMAM. Countries shown represent 94% of World GDP. November 2, 2021.

EYE ON THE M ARKET • M I CHAEL CEMB AL EST • J .P . MORG A N Coronavirus
14
How lethal is COVID, and for whom? Let’s first compare it to the flu. A key issue to keep in mind: there’s a difference between case fatality rates (deaths as a % of reported cases) and infection fatality rates (deaths as a % of all infected people, whether symptomatic or not). The latter can only be derived through antibody testing and other sampling methods involving molecular assessments of infection. The IFR of the seasonal flu is reported to be well below 0.1% with other estimates ranging from 0.02% to 0.04%. In contrast, the IFR for COVID has been estimated at 0.23% by Stanford’s Metaresearch Innovation Center, and at 0.7%-0.9% by the CDC. Either way, COVID is significantly more lethal than the seasonal flu. Tracking “excess” abnormal death levels is another way to understand the incremental mortality impact of COVID (see second chart). In addition to higher mortality than the flu, COVID also appears to entail more longer-lasting medical complications (see web portal section 5).
Mortality by age in the US The first section in the table below shows the distribution of US COVID deaths by age bracket. People over the age of 85 represent around 30% of all COVID fatalities to-date. However, the number of people over age 85 is much smaller than other age cohorts; as a result, fatality risks are much greater for people in this age group. The second section reflects this by showing deaths to date per mm people in each age bracket (you can divide one number by another to obtain relative mortality probabilities). The third section looks specifically at mortality risk across age brackets relative to older populations. For example, a person aged 55-64 is only around 14% as likely to die from COVID compared to someone over the age of 75, and only around 8% as likely to die as someone over the age of 85. Differences across states are generally minor.
WHO Oxford CDC
Stanford Meta-Research
Innovation Center (global)
University of Wollongong
(global)CDC US
Pandemic Planning Scenario
CDC US Seroprevalence
Survey
Imperial College London
(global)
0.0%
0.2%
0.4%
0.6%
0.8%
1.0%
1.2%
Flu vs COVID-19 infection fatality rates%, estimated infection fatality rate
Source: CDC, WHO, Stanford, Oxford, Imperial College London, University of Wollongong. 2020.
Seasonal influenza COVID-1940,000
50,000
60,000
70,000
80,000
90,000
2017 2018 2019 2020 2021
Actual deaths from all causesThreshold for excess deaths
Tracking US excess deaths from COVIDTotal deaths per week
Source: CDC, JHU, JPMAM. October 23, 2021. Dots are estimated using most recent JHU data.
DISTRIBUTION OF ACTUAL MORTALITY: Mortality to-date by age group, % of total mortality< 1 yr 1-4 yrs 5-14 yrs 15-24 yrs 25-34 yrs 35-44 yrs 45-54 yrs 55-64 yrs 65-74 yrs 75-84 yrs > 85
United States 0.0% 0.0% 0.0% 0.2% 1.0% 2.6% 6.4% 14.1% 22.6% 26.1% 27.0%
MORTALITY RATES FOR EACH AGE BRACKET: COVID deaths to-date per mm population in each age group< 1 yr 1-4 yrs 5-14 yrs 15-24 yrs 25-34 yrs 35-44 yrs 45-54 yrs 55-64 yrs 65-74 yrs 75-84 yrs > 85
United States 36 4 4 41 164 457 1,147 2,452 5,286 12,046 30,076
RELATIVE MORTALITY RISK: risk of dying across age brackets< 1 yr 1-4 yrs 5-14 yrs 15-24 yrs 25-34 yrs 35-44 yrs 45-54 yrs 55-64 yrs 65-74 yrs 75-84 yrs > 85
Relative to 85+ 0.1% 0.0% 0.0% 0.1% 0.5% 1.5% 3.8% 8.2% 17.6% 40.1% 100.0%Relative to 75+ 0.2% 0.0% 0.0% 0.2% 1.0% 2.6% 6.6% 14.2% 30.6% 100.0%
Source: CDC, JPMAM. October 23, 2021.

EYE ON THE M ARKET • M I CHAEL CEMB AL EST • J .P . MORG A N Coronavirus
15
IMPORTANT INFORMATION The views, opinions and estimates expressed herein constitute Michael Cembalest’s judgment based on current market conditions and are subject to change without notice. Information herein may differ from those expressed by other areas of J.P. Morgan. This information in no way constitutes J.P. Morgan Research and should not be treated as such. The views contained herein are not to be taken as advice or a recommendation to buy or sell any investment in any jurisdiction, nor is it a commitment from J.P. Morgan or any of its subsidiaries to participate in any of the transactions mentioned herein. Any forecasts, figures, opinions or investment techniques and strategies set out are for information purposes only, based on certain assumptions and current market conditions and are subject to change without prior notice. All information presented herein is considered to be accurate at the time of production. This material does not contain sufficient information to support an investment decision and it should not be relied upon by you in evaluating the merits of investing in any securities or products. In addition, users should make an independent assessment of the legal, regulatory, tax, credit and accounting implications and determine, together with their own professional advisers, if any investment mentioned herein is believed to be suitable to their personal goals. Investors should ensure that they obtain all available relevant information before making any investment. It should be noted that investment involves risks, the value of investments and the income from them may fluctuate in accordance with market conditions and taxation agreements and investors may not get back the full amount invested. Both past performance and yields are not reliable indicators of current and future results. Non-affiliated entities mentioned are for informational purposes only and should not be construed as an endorsement or sponsorship of J.P. Morgan Chase & Co. or its affiliates.
For J.P. Morgan Asset Management Clients: J.P. Morgan Asset Management is the brand for the asset management business of JPMorgan Chase & Co. and its affiliates worldwide. To the extent permitted by applicable law, we may record telephone calls and monitor electronic communications to comply with our legal and regulatory obligations and internal policies. Personal data will be collected, stored and processed by J.P. Morgan Asset Management in accordance with our privacy policies at https://am.jpmorgan.com/global/privacy. ACCESSIBILITY For U.S. only: If you are a person with a disability and need additional support in viewing the material, please call us at 1-800-343-1113 for assistance. This communication is issued by the following entities: In the United States, by J.P. Morgan Investment Management Inc. or J.P. Morgan Alternative Asset Management, Inc., both regulated by the Securities and Exchange Commission; in Latin America, for intended recipients’ use only, by local J.P. Morgan entities, as the case may be.; in Canada, for institutional clients’ use only, by JPMorgan Asset Management (Canada) Inc., which is a registered Portfolio Manager and Exempt Market Dealer in all Canadian provinces and territories except the Yukon and is also registered as an Investment Fund Manager in British Columbia, Ontario, Quebec and Newfoundland and Labrador. In the United Kingdom, by JPMorgan Asset Management (UK) Limited, which is authorized and regulated by the Financial Conduct Authority; in other European jurisdictions, by JPMorgan Asset Management (Europe) S.à r.l. In Asia Pacific (“APAC”), by the following issuing entities and in the respective jurisdictions in which they are primarily regulated: JPMorgan Asset Management (Asia Pacific) Limited, or JPMorgan Funds (Asia) Limited, or JPMorgan Asset Management Real Assets (Asia) Limited, each of which is regulated by the Securities and Futures Commission of Hong Kong; JPMorgan Asset Management (Singapore) Limited (Co. Reg. No. 197601586K), which this advertisement or publication has not been reviewed by the Monetary Authority of Singapore; JPMorgan Asset Management (Taiwan) Limited; JPMorgan Asset Management (Japan) Limited, which is a member of the Investment Trusts Association, Japan, the Japan Investment Advisers Association, Type II Financial Instruments Firms Association and the Japan Securities Dealers Association and is regulated by the Financial Services Agency (registration number “Kanto Local Finance Bureau (Financial Instruments Firm) No. 330”); in Australia, to wholesale clients only as defined in section 761A and 761G of the Corporations Act 2001 (Commonwealth), by JPMorgan Asset Management (Australia) Limited (ABN 55143832080) (AFSL 376919). For all other markets in APAC, to intended recipients only. For J.P. Morgan Private Bank Clients: ACCESSIBILITY J.P. Morgan is committed to making our products and services accessible to meet the financial services needs of all our clients. Please direct any accessibility issues to the Private Bank Client Service Center at 1-866-265-1727. LEGAL ENTITY, BRAND & REGULATORY INFORMATION In the United States, bank deposit accounts and related services, such as checking, savings and bank lending, are offered by JPMorgan Chase Bank, N.A. Member FDIC. JPMorgan Chase Bank, N.A. and its affiliates (collectively “JPMCB”) offer investment products, which may include bank-managed investment accounts and custody, as part of its trust and fiduciary services. Other investment products and services, such as brokerage and advisory accounts, are offered through J.P. Morgan Securities LLC (“JPMS”), a member of FINRA and SIPC. Annuities are made available through Chase Insurance Agency, Inc. (CIA), a licensed insurance agency, doing business as Chase Insurance Agency Services, Inc. in Florida. JPMCB, JPMS and CIA are affiliated companies under the common control of JPMorgan Chase & Co. Products not available in all states. In Luxembourg, this material is issued by J.P. Morgan Bank Luxembourg S.A. (JPMBL), with registered office at European Bank and Business Centre, 6 route de Treves, L-2633, Senningerberg, Luxembourg. R.C.S Luxembourg B10.958. Authorised and regulated by Commission de Surveillance du Secteur Financier (CSSF) and jointly supervised by the European Central Bank (ECB) and the CSSF. J.P. Morgan Bank Luxembourg S.A. is authorized as a credit institution in accordance with the Law of 5th April 1993. In the United Kingdom, this material is issued by J.P. Morgan Bank Luxembourg S.A– London Branch. Prior to Brexit,(Brexit meaning that the UK leaves the European Union under Article 50 of the Treaty on European Union, or, if later, loses its ability to passport financial services between the UK and the remainder of the EEA), J.P. Morgan Bank Luxembourg S.A– London Branch is subject to limited regulation by the Financial Conduct Authority and the Prudential Regulation Authority. Details about the extent of our regulation by the Financial Conduct Authority and the Prudential Regulation Authority are available from us on request. In the event of Brexit, in the UK, J.P. Morgan Bank Luxembourg S.A.– London Branch is authorised by the Prudential Regulation Authority, subject to regulation by the Financial Conduct Authority and limited regulation by the Prudential Regulation Authority. Details about the extent of our regulation by the Prudential Regulation Authority are available from us on request. In Spain, this material is distributed by J.P. Morgan Bank Luxembourg S.A., Sucursal en España, with registered office at Paseo de la Castellana, 31, 28046 Madrid, Spain. J.P. Morgan Bank Luxembourg S.A., Sucursal en España is registered under number 1516 within the administrative registry of the Bank of Spain and supervised by the Spanish Securities Market Commission (CNMV). In Germany, this material is distributed by J.P. Morgan Bank Luxembourg S.A., Frankfurt Branch, registered office at Taunustor 1 (TaunusTurm), 60310 Frankfurt, Germany, jointly supervised by the Commission de Surveillance du Secteur Financier (CSSF) and the European Central Bank (ECB), and in certain areas also supervised by the Bundesanstalt für Finanzdienstleistungsaufsicht (BaFin). In Italy, this material is distributed by J.P. Morgan Bank Luxembourg S.A– Milan Branch, registered office at Via Catena Adalberto 4, Milan 20121, Italy and regulated by Bank of Italy and the Commissione Nazionale per le Società e la Borsa (CONSOB). In the Netherlands, this material is distributed by J.P. Morgan Bank Luxembourg S.A., Amsterdam Branch, with registered office at World Trade Centre, Tower B, Strawinskylaan 1135, 1077 XX, Amsterdam, The Netherlands. J.P. Morgan Bank Luxembourg S.A., Amsterdam Branch is authorised and

EYE ON THE M ARKET • M I CHAEL CEMB AL EST • J .P . MORG A N Coronavirus
16
regulated by the Commission de Surveillance du Secteur Financier (CSSF) and jointly supervised by the European Central Bank (ECB) and the CSSF in Luxembourg; J.P. Morgan Bank Luxembourg S.A., Amsterdam Branch is also authorised and supervised by De Nederlandsche Bank (DNB) and the Autoriteit Financiële Markten (AFM) in the Netherlands. Registered with the Kamer van Koophandel as a branch of J.P. Morgan Bank Luxembourg S.A. under registration number 71651845. In Denmark, this material is distributed by J.P. Morgan Bank Luxembourg, Copenhagen Br, filial af J.P. Morgan Bank Luxembourg S.A. with registered office at Kalvebod Brygge 39-41, 1560 København V, Denmark. J.P. Morgan Bank Luxembourg, Copenhagen Br, filial af J.P. Morgan Bank Luxembourg S.A.is authorised and regulated by Commission de Surveillance du Secteur Financier (CSSF) and jointly supervised by the European Central Bank (ECB) and the CSSF. J.P. Morgan Bank Luxembourg, Copenhagen Br, filial af J.P. Morgan Bank Luxembourg S.A. is also subject to the supervision of Finanstilsynet (Danish FSA) and registered with Finanstilsynet as a branch of J.P. Morgan Bank Luxembourg S.A. under code 29009. In Sweden, this material is distributed by J.P. Morgan Bank Luxembourg S.A. - Stockholm Bankfilial, with registered office at Hamngatan 15, Stockholm, 11147, Sweden. J.P. Morgan Bank Luxembourg S.A. - Stockholm Bankfilial is authorised and regulated by Commission de Surveillance du Secteur Financier (CSSF) and jointly supervised by the European Central Bank (ECB) and the CSSF. J.P. Morgan Bank Luxembourg S.A., Stockholm Branch is also subject to the supervision of Finansinspektionen (Swedish FSA). Registered with Finansinspektionen as a branch of J.P. Morgan Bank Luxembourg S.A.. In France, this material is distributed by JPMorgan Chase Bank, N.A. (“JPMCB”), Paris branch, which is regulated by the French banking authorities Autorité de Contrôle Prudentiel et de Résolution and Autorité des Marchés Financiers. In Switzerland, this material is distributed by J.P. Morgan (Suisse) SA, which is regulated in Switzerland by the Swiss Financial Market Supervisory Authority (FINMA). In Hong Kong, this material is distributed by JPMCB, Hong Kong branch. JPMCB, Hong Kong branch is regulated by the Hong Kong Monetary Authority and the Securities and Futures Commission of Hong Kong. In Hong Kong, we will cease to use your personal data for our marketing purposes without charge if you so request. In Singapore, this material is distributed by JPMCB, Singapore branch. JPMCB, Singapore branch is regulated by the Monetary Authority of Singapore. Dealing and advisory services and discretionary investment management services are provided to you by JPMCB, Hong Kong/Singapore branch (as notified to you). Banking and custody services are provided to you by JPMCB Singapore Branch. The contents of this document have not been reviewed by any regulatory authority in Hong Kong, Singapore or any other jurisdictions. This advertisement has not been reviewed by the Monetary Authority of Singapore. JPMorgan Chase Bank, N.A., a national banking association chartered under the laws of the United States, and as a body corporate, its shareholder’s liability is limited. JPMorgan Chase Bank, N.A. (JPMCBNA) (ABN 43 074 112 011/AFS Licence No: 238367) is regulated by the Australian Securities and Investment Commission and the Australian Prudential Regulation Authority. Material provided by JPMCBNA in Australia is to “wholesale clients” only. For the purposes of this paragraph the term “wholesale client” has the meaning given in section 761G of the Corporations Act 2001 (Cth). Please inform us if you are not a Wholesale Client now or if you cease to be a Wholesale Client at any time in the future. JPMS is a registered foreign company (overseas) (ARBN 109293610) incorporated in Delaware, U.S.A. Under Australian financial services licensing requirements, carrying on a financial services business in Australia requires a financial service provider, such as J.P. Morgan Securities LLC (JPMS), to hold an Australian Financial Services Licence (AFSL), unless an exemption applies. JPMS is exempt from the requirement to hold an AFSL under the Corporations Act 2001 (Cth) (Act) in respect of financial services it provides to you, and is regulated by the SEC, FINRA and CFTC under US laws, which differ from Australian laws. Material provided by JPMS in Australia is to “wholesale clients” only. The information provided in this material is not intended to be, and must not be, distributed or passed on, directly or indirectly, to any other class of persons in Australia. For the purposes of this paragraph the term “wholesale client” has the meaning given in section 761G of the Act. Please inform us immediately if you are not a Wholesale Client now or if you cease to be a Wholesale Client at any time in the future. This material has not been prepared specifically for Australian investors. It: may contain references to dollar amounts which are not Australian dollars; may contain financial information which is not prepared in accordance with Australian law or practices; may not address risks associated with investment in foreign currency denominated investments; and does not address Australian tax issues. With respect to countries in Latin America, the distribution of this material may be restricted in certain jurisdictions. We may offer and/or sell to you securities or other financial instruments which may not be registered under, and are not the subject of a public offering under, the securities or other financial regulatory laws of your home country. Such securities or instruments are offered and/or sold to you on a private basis only. Any communication by us to you regarding such securities or instruments, including without limitation the delivery of a prospectus, term sheet or other offering document, is not intended by us as an offer to sell or a solicitation of an offer to buy any securities or instruments in any jurisdiction in which such an offer or a solicitation is unlawful. Furthermore, such securities or instruments may be subject to certain regulatory and/or contractual restrictions on subsequent transfer by you, and you are solely responsible for ascertaining and complying with such restrictions. To the extent this content makes reference to a fund, the Fund may not be publicly offered in any Latin American country, without previous registration of such fund´s securities in compliance with the laws of the corresponding jurisdiction. Public offering of any security, including the shares of the Fund, without previous registration at Brazilian Securities and Exchange Commission–CVM is completely prohibited. Some products or services contained in the materials might not be currently provided by the Brazilian and Mexican platforms. References to “J.P. Morgan” are to JPM, its subsidiaries and affiliates worldwide. “J.P. Morgan Private Bank” is the brand name for the private banking business conducted by JPM. This material is intended for your personal use and should not be circulated to or used by any other person, or duplicated for non-personal use, without our permission. If you have any questions or no longer wish to receive these communications, please contact your J.P. Morgan representative. © 2020 JPMorgan Chase & Co. All rights reserved.