Embed Size (px)
Citation preview

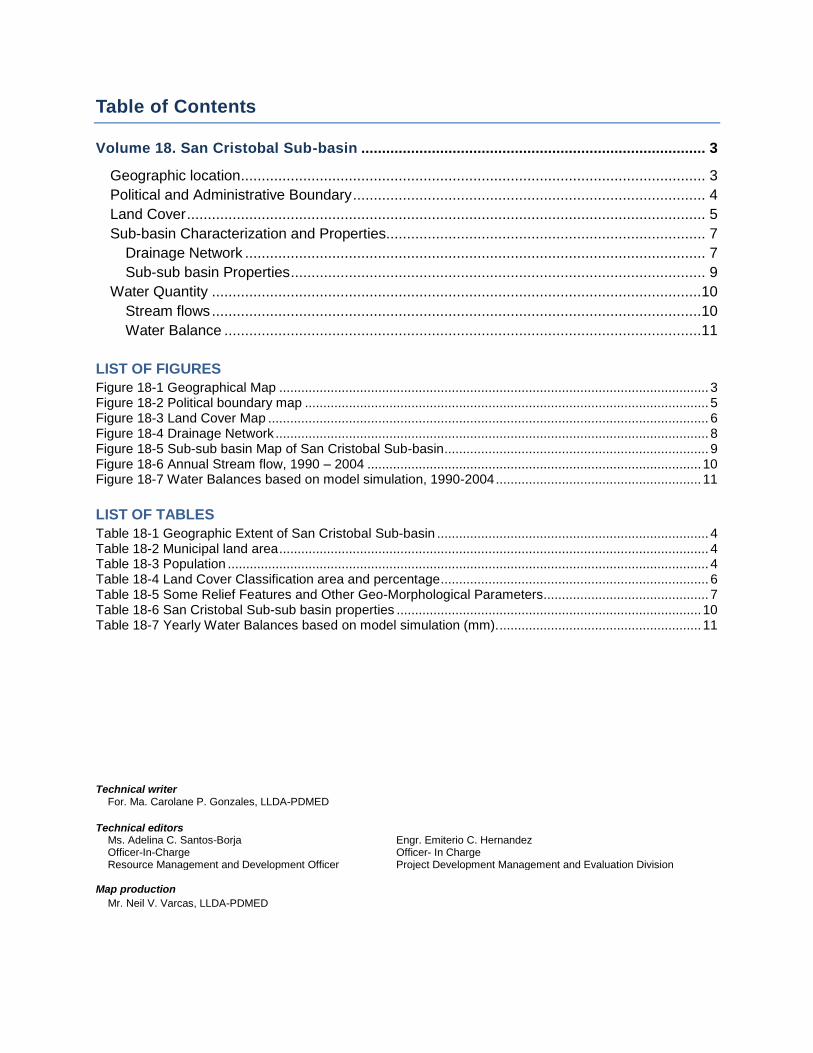
Table of Contents
Volume 18. San Cristobal Sub-basin ................................................................................... 3
Geographic location ................................................................................................................ 3
Political and Administrative Boundary ..................................................................................... 4
Land Cover ............................................................................................................................. 5
Sub-basin Characterization and Properties............................................................................. 7
Drainage Network ............................................................................................................... 7
Sub-sub basin Properties .................................................................................................... 9
Water Quantity ......................................................................................................................10
Stream flows ......................................................................................................................10
Water Balance ...................................................................................................................11
LIST OF FIGURES
Figure 18-1 Geographical Map ..................................................................................................................... 3 Figure 18-2 Political boundary map .............................................................................................................. 5 Figure 18-3 Land Cover Map ........................................................................................................................ 6 Figure 18-4 Drainage Network ...................................................................................................................... 8 Figure 18-5 Sub-sub basin Map of San Cristobal Sub-basin ........................................................................ 9 Figure 18-6 Annual Stream flow, 1990 – 2004 ........................................................................................... 10 Figure 18-7 Water Balances based on model simulation, 1990-2004 ........................................................ 11
LIST OF TABLES
Table 18-1 Geographic Extent of San Cristobal Sub-basin .......................................................................... 4 Table 18-2 Municipal land area ..................................................................................................................... 4 Table 18-3 Population ................................................................................................................................... 4 Table 18-4 Land Cover Classification area and percentage ......................................................................... 6 Table 18-5 Some Relief Features and Other Geo-Morphological Parameters ............................................. 7 Table 18-6 San Cristobal Sub-sub basin properties ................................................................................... 10 Table 18-7 Yearly Water Balances based on model simulation (mm). ....................................................... 11
Technical writer For. Ma. Carolane P. Gonzales, LLDA-PDMED
Technical editors Ms. Adelina C. Santos-Borja Officer-In-Charge Resource Management and Development Officer
Engr. Emiterio C. Hernandez Officer- In Charge Project Development Management and Evaluation Division
Map production
Mr. Neil V. Varcas, LLDA-PDMED

Volume 18. San Cristobal Sub-basin
Geographic location
The San Cristobal (Figure 18-1) Sub-basin is situated in the western part of the Laguna de Bay
Basin covering six towns/cities, namely: Calamba City, Cabuyao, Santa Rosa City, Silang, Tagaytay City, Talisay and Tanauan City. Calamba City, Cabuyao and Santa Rosa City are all in the Province of Laguna. Calamba City is bounded on the east by Laguna de Bay. Silang is situated on the eastern part of Cavite Province. Cabuyao is located at the northern part of the province and is 45 km away from Manila. Tagaytay City is located in the Province of Cavite and about 56 km south of Manila. Santa Rosa City, Laguna is located 40 km south of Manila. It is bounded on the northwest by Biñan, on the south and southwest by Cabuyao and on the west by the province of Cavite. Bordering the northeast is Laguna de Bay. Another LGU within the San Cristobal Micro-watershed is Talisay and Tanauan City, also in the province of Batangas.
Source: LLDA GIS
Figure 18-1 Geographical Map

Table 18-1 Geographic Extent of San Cristobal Sub-basin
CORNERS NORTHING (UTM) EASTING (UTM)
Upper Left 1562334.98913 304314.87500
Upper Right 1562334.98913 281913.90739
Lower Right 1576597.91657 281913.90739
Lower Left 1576597.91657 304314.87500 Source: LLDA GIS
Political and Administrative Boundary The total land area of the sub-basin is 14,065.926 hectares. Calamba City occupies 50.76% of
the total land area which can be found in the middle part of the sub-basin to the lakeshore of the
Laguna de Bay. Silang, Cabuyao, Tagaytay City, Santa Rosa City, Tanauan City and Talisay
share 21.31%, 11.85%, 10.69%, 4.76%, 0.60% and 0.03%, respectively. See Table 18-2 and
Figure 18-2 for municipal land area/map within San Cristobal Sub-basin.
Table 18-2 Municipal land area
Municipality/City No. Of
Barangays Area (sq.m) Percentage
Cabuyao 8 16,622,836 11.85
Calamba 26 71,232,654 50.76
Sta. Rosa 2 6,681,050 4.76
Tanauan 2 844,690 0.60
Silang 8 29,903,709 21.31
Tagaytay 11 15,003,024 10.69
Talisay 2 48,108 0.03
TOTAL 59 140,336,070 100 Source: NSO, 2007
As of year 2007, the total population making up the San Cristaobal sub-basin is estimated at
292,141. Among the three municipalities, Calamba has the highest population of 191,216
accounting for 65% of the total followed by Cabuyao which has the population of 67,047
representing 23% of the total (Table 18-3)
Table 18-3 Population
Municipality/City Population Percentage
Cabuyao 67047 23
Calamba 191216 65
Sta. Rosa 1237 0.42
Tanauan 407 0.14
Silang 21532 7
Tagaytay 10654 4
Talisay 48 0.02
TOTAL 292141 100

Source: LLDA GIS
Source: LLDA GIS Figure 18-2 Political boundary map
Land Cover There are nine (9) classes of land cover based on the result of the land cover validation done by LLDA, namely arable, brush, cloud, forest, grass, marsh, plantation, urban, and unclassified. Majority of the watershed is covered by grass land with about 5036.1 ha or 35.8 % followed by brush land with an area of 4023.2 ha or 28.6 %, arable with an area of 1936.4 ha or 13.8 % , urban with an area of 1827.6 or 13 %. The rest of the land cover is classified as plantation, marsh, cloud forest, and with an area of 1174 ha or 8 %, 37 ha or 0.3%, 8 ha or 0.1%, and 4.2 ha or 0.02%, respectively. The unclassified areas comprise of about `1.5 ha or 0.01% of the sub basin. Table 18-4 and Figure 18-3 show the estimated areas of the different land cover classes and the land cover map.

Table 18-4 Land Cover Classification area and percentage
Land cover Area (sq.m.) Percentage
Arable 1936.4 13.8
Brush 4023.2 28.6
cloud 8.0 0.1
Forest 4.2 0.03
Grass 5036.1 35.8
Marsh 37.0 0.3
Plantation 1174.0 8.4
Unclassified 1.5 0.01
Urban 1827.6 13.0
Total 14048 100.00% Source: LLDA GIS
Source: LLDA PDMED
Figure 18-3 Land Cover Map

Sub-basin Characterization and Properties Drainage Network The major surface water resource in the San Cristobal River and its tributaries. The San
Cristobal River System, one of the major tributaries draining into the Laguna de Bay, is among
the most polluted river affecting the lake's productivity and survival. Its basin represents a typical
agro-industrial condition/setting which if properly and scientifically managed could serve as a
model for development to other basins with similar or potential characteristics. It contributes
about 5 percent of the total freshwater discharge into the Lake.
The drainage map of the San Cristobal Sub-basin is shown in Figure 18-4 while the important
watershed characteristics and geomorphological features are in Table 18-5.
Table 18-5 Some Relief Features and Other Geo-Morphological Parameters
Parameters Values
Area (ha) 14065.926
Perimeter (m) 61936.562
Total number of streams 103
Total length of streams (m) 264480.222
Stream Density (stream/ha) 0.00732
Drainage Density (m/ha) 18.8029
Constance of Channel Maintenance (ha/m) 0.0532
Length of Overland Flow (m) 9.401450 Source: LLDA GIS

Source: LLDA GIS Figure 18-4 Drainage Network

Sub-sub basin Properties
Source: LLDA GIS
Figure 18-5 Sub-sub basin Map of San Cristobal Sub-basin

Table 18-6 San Cristobal Sub-sub basin properties
Sub-sub basin Name Area (Ha) Perimeter (m)
SSB-19A 1017.149 33292.437
SSB-19B 1236.248 24312.851
SSB-19C 276.796 7946.889
SSB-19D 3160.055 57768.765
SSB-19E 292.739 12616.751
SSB-19F 560.266 18727.885
SSB-19G 444.045 18176.377
SSB-19H 1032.396 23217.704
SSB-19I 997.950 26137.283
SSB-19J 368.966 13095.490
SSB-19K 355.435 12040.593
SSB-19L 1256.519 23314.229
SSB-19M 1100.018 22051.880
SSB-19N 558.656 17940.691
SSB-19O 329.502 11627.080
SSB-19P 808.549 20232.287
SSB-19Q 270.284 7376.881
Water Quantity Stream flows The stream flow from 1990 to 2004 in San Cristobal sub-basin is seen in Figure 18-6 with the
highest flow of 10.85393 cubic meters per second happened in 2000 and the lowest flow in
2004 with 3.808363 cubic meters per second as shown in Figure 18-6.
Figure 18-6 Annual Stream flow, 1990 – 2004

Water Balance The Sacramento Soil Moisture Accounting (SAC SMA) Hydrologic Model is used to simulate
watershed rainfall-runoff relationship and to generate the long-term water balance of the 24 sub-
basins of Laguna de Bay. The SAC SMA accounts for all water entering, stored in, and leaving
a drainage basin. Though many parameters are used in this water balance accounting process,
precipitation has the main impact on runoff.
For San Cristobal Sub-Basin, the long term water balances of the basin based on the hydrologic
simulation is shown in the Table 19-10Error! Reference source not found.. The 15-year average
would show that 0.9% of the total rainfall becomes surface run-off, and about 34.9% of rainfall is
lost as actual evapotranspiration. The base flow component of the total run-off is quite minimal,
with only about 14% of rainfall.
Table 18-7 Yearly Water Balances based on model simulation (mm).
YEAR Rainfall Actual Evapo-transpiration
Direct Runoff
Baseflow Change in
Storage
1990 2,386 714 1,380 398 (107)
1991 1,940 715 974 241 10
1992 1,923 677 937 234 75
1993 2,008 597 1,024 292 95
1994 1,581 731 693 281 (124)
1995 2,130 638 1,087 261 144
1996 1,908 736 972 232 (32)
1997 1,727 709 859 250 (91)
1998 2,459 622 1,334 227 276
1999 2,252 785 1,088 395 (15)
2000 3,238 809 1,917 481 32
2001 1,721 786 690 286 (42)
2002 1,699 649 817 220 12
2003 1,555 675 683 198 (2)
2004 1,602 683 637 231 50
Average 2,009 702 1,006 282 19
Figure 18-7 Water Balances based on model simulation, 1990-2004