Embed Size (px)
Citation preview

1
2
TABLE OF CONTENTS
LIST OF ACRONYMS .................................................................................................. 1
LIST OF DEFINITIONS ................................................................................................ 3
INTRODUCTION AND BACKGROUND ....................................................................... 2
STATE OF TOURISM 2018/19 REPORT STRUCTURE AND THEMES ................... 2
CHAPTER ONE: THE ECONOMIC VALUE OF TOURISM IN SOUTH AFRICA .......... 4
1.1 Contribution of Tourism to GDP in South Africa .............................................. 4
1.1.1 Total contribution of tourism to GDP in South Africa: 2013-2019 and
forecasts for 2030 ................................................................................................. 4
1.1.2 Direct contribution of tourism to GDP in South Africa: 2014-2018 ........... 5
1.1.3 Direct contribution of tourism to GDP compared to other industries in
South Africa: 2018 ................................................................................................ 6
1.1.4 Estimates of direct contribution of tourism to GDP in South Africa: 2013-
2019 and forecasts for 2030 ................................................................................. 7
1.2 Contribution of tourism to employment in South Africa .................................... 8
1.2.1 Total contribution of tourism to employment in South Africa: 2013-2019
and forecasts for 2030 .......................................................................................... 8
1.2.2 Direct Contribution of tourism to employment: 2014-2018 ....................... 9
1.2.3 Direct Contribution of tourism to employment in South Africa: 2013-2019 and forecasts for 2030 .................................................................................................... 10
1.2.4 Direct contribution of tourism to employment compared to other industries
in South Africa: 2018 ........................................................................................... 11
1.2.5 Demographic characteristics of people directly employed in the tourism
sector: 2018 ........................................................................................................ 12
1.3 Tourism Balance of Payments for South Africa: 2011-2018 ......................... 14 CHAPTER TWO: PERFORMANCE OF TOURISM RELATED INDUSTRIES IN SOUTH AFRICA ...................................................................................................... 16 2.1 Tourism industries ratios: 2018 ..................................................................... 16 2.2 Accommodation industry performance: 2018-2019 ....................................... 17
2.2.1 Average Stay units available: 2018-2019 .............................................. 17
2.2.2 Income from accommodation: 2018-2019 ............................................. 17
2.2.3 Average income per stay unit night sold ..................................................... 18
2.2.4 Industry occupancy rate: 2018-2019 ..................................................... 19
Airbnb Performance in South Africa: 2015-2019 ...................................................... 20 2.4 Food and Beverages industry: 2018-2019 .................................................... 21
2.4.1 Food and Beverages industry income: 2018-2019 ................................ 21
2.5 Airline Industry Performance: 2018-2019 ...................................................... 23
2.5.1 Aircrafts arriving to South Africa: 2018-2019 ......................................... 23
2.5.2 Passenger arrivals movements: 2018-2019 .......................................... 24

3
2.5.3 Passenger departure movements: 2018-2019 ...................................... 24
2.6 Car Rental Performance in South Africa: 2018-2019 ..................................... 25 2.7 The Travel & Tourism Competitiveness Index (TTCI) for South Africa: 2019 . 25
CHAPTER THREE: SOUTH AFRICAN INBOUND TOURISM PERFORMANCE ....... 27
3.1 Collection, processing of tourist arrivals in South Africa ................................ 27 3.2 Tourists Arrivals to South Africa: 2014-2019 ................................................. 29 3.3 Top international overseas and African tourist source markets: 2019 compared to 2018 ................................................................................................... 31 3.4 Main purpose of visit for International tourist arrivals: 2019 ........................... 33 3.5 Length of stay for international tourist arrivals 2019 compared to 2018 ......... 35 3.6 Total Foreign Direct Spend (excluding capital expenditure): 2019 compared to 2018 36 3.6.1 Total Foreign Direct Spend by top five African Source Markets .................... 36 3.6.2 Total Foreign Direct Spend by top five overseas Markets: 2019.................... 37 3.7 Provincial share of tourist arrivals: 2019 ........................................................ 37
CHAPTER FOUR: SOUTH AFRICA’S DOMESTIC TOURISM PERFORMANCE ...... 39
4.1 Domestic Day and Overnight Trips: 2015-2019 ............................................. 39 4.2 Domestic Tourism Purpose of Visit and length of Stay .................................. 40 4.3 Domestic Spend: 2019 ...................................................................................... 41 4.4 Provincial share of domestic trips: 2019 ........................................................ 42 4.5 Top 3 spenders by destination province: 2019 .............................................. 43 4.6 Reasons for not traveling: 2019 .................................................................... 44 4.7 Integration of Domestic Tourism Surveys in the Country ............................... 45
CHAPTER FIVE: GLOBAL TOURISM ECONOMIC IMPACT ..................................... 46
5.1 Travel and Tourism’s Total Contribution to Gross Domestic Product: 2013- 2019 46 5.2 Travel and Tourism’s Direct Contribution to Gross Domestic Product: 2013-2019 and forecasted data for 2030 .......................................................................... 47 5.3 Total Contribution of Travel & Tourism to employment: 2013-2019 and forecasts for 2030 .................................................................................................... 48 5.4 Travel and Tourism Direct Employment Contribution: 2013-2019 and forecasted data for 2030 .......................................................................................... 49 5.5 Travel and Tourism performance compared to other sectors: GDP growth ... 50
CHAPTER SIX: GLOBAL TOURISM PERFORMANCE ............................................. 52
6.1 GLOBAL TOURIST’S ARRIVALS: 2017 TO 2019 ......................................... 52 6.2 Global Tourist Arrivals by Region: 2018-2019 ............................................... 53 6.3 Top Global destination by regions: 2018 ....................................................... 53 6.4 International tourism expenditure by top ten countries for the period 2019 compared to 2018 ................................................................................................... 54 6.5. International tourism receipts: 2018 to 2019 ..................................................... 55 6.6 Top 10 countries by international tourist receipts and international tourist arrivals: 2018-2019 ............................................................................................................... 56 Table 22: Top Ten countries .................................................................................... 56
CHAPTER SEVEN: GLOBAL TOURISM RELATED INDUSTRIES PERFORMANCE 58
7.1 Global hotel industry performance: 2018-2019 .............................................. 58 7.2 Air Transport: 2018-2019 ................................................................................... 61 7.3 Top 20 international megahubs: 2019 ........................................................... 61 7.4 Air transport performance: 2019 compared to 2018 ...................................... 63
REFERENCES .......................................................................................................... 65

1
LIST OF ACRONYMS
ACSA Airports Company South Africa
ADR Average Daily Rate
ARR Average Room Rate
ASK Available Seat Kilometre
CPI Consumer Price Inflation
EC Eastern Cape
FS Free State
DHA Department of Home Affairs
EPWP Expanded Public Works Programme
EUR EURO
GDP Gross Domestic Product
GP Gauteng
GBP Great British Pound
IATA International Air Transport Association
ICCA International Congress and Convention Association
KZN KwaZulu-Natal
LP Limpopo
MICE Meetings, Incentives, Conferences and Exhibitions
MP Mpumalanga
MCS Movement Control System
NC Northern Cape
NDP National Development Plan
NW North West
PLF Passenger Load Factor
RPK Revenue Passenger Kilometres
RevPAR Revenue per Available Room
SA South Africa
SADC Southern African Development Community

2
SA Tourism South African Tourism
Stats SA Statistics South Africa
TSA: RMF Tourism Satellite Account: Recommended Methodological Framework
TSA Tourism Satellite Account
VFR Visiting friends and relatives
UAE United Arab Emirates
UNWTO World Tourism Organisation
WTTC World Travel and Tourism Council
3
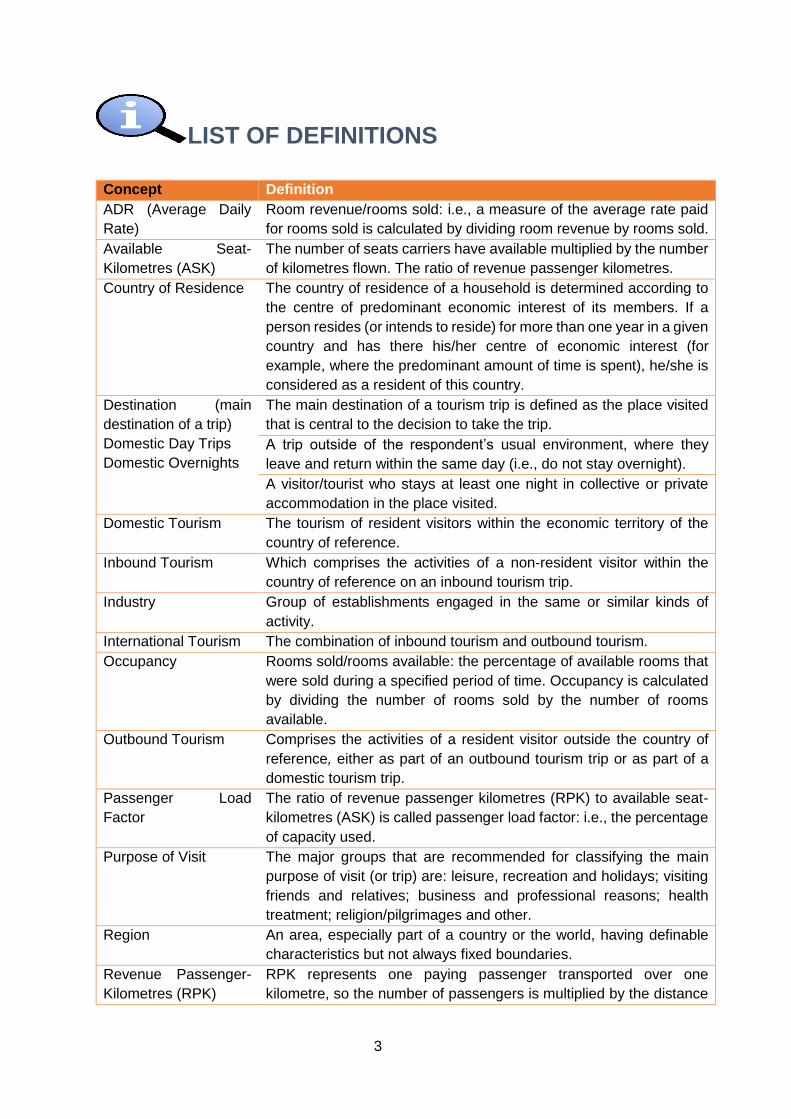
LIST OF DEFINITIONS
Concept Definition
ADR (Average Daily
Rate)
Room revenue/rooms sold: i.e., a measure of the average rate paid
for rooms sold is calculated by dividing room revenue by rooms sold.
Available Seat-
Kilometres (ASK)
The number of seats carriers have available multiplied by the number
of kilometres flown. The ratio of revenue passenger kilometres.
Country of Residence The country of residence of a household is determined according to
the centre of predominant economic interest of its members. If a
person resides (or intends to reside) for more than one year in a given
country and has there his/her centre of economic interest (for
example, where the predominant amount of time is spent), he/she is
considered as a resident of this country.
Destination (main
destination of a trip)
Domestic Day Trips
Domestic Overnights
The main destination of a tourism trip is defined as the place visited
that is central to the decision to take the trip.
A trip outside of the respondent’s usual environment, where they
leave and return within the same day (i.e., do not stay overnight).
A visitor/tourist who stays at least one night in collective or private
accommodation in the place visited.
Domestic Tourism The tourism of resident visitors within the economic territory of the
country of reference.
Inbound Tourism Which comprises the activities of a non-resident visitor within the
country of reference on an inbound tourism trip.
Industry Group of establishments engaged in the same or similar kinds of
activity.
International Tourism The combination of inbound tourism and outbound tourism.
Occupancy Rooms sold/rooms available: the percentage of available rooms that
were sold during a specified period of time. Occupancy is calculated
by dividing the number of rooms sold by the number of rooms
available.
Outbound Tourism
Comprises the activities of a resident visitor outside the country of
reference, either as part of an outbound tourism trip or as part of a
domestic tourism trip.
Passenger Load
Factor
The ratio of revenue passenger kilometres (RPK) to available seat-
kilometres (ASK) is called passenger load factor: i.e., the percentage
of capacity used.
Purpose of Visit The major groups that are recommended for classifying the main
purpose of visit (or trip) are: leisure, recreation and holidays; visiting
friends and relatives; business and professional reasons; health
treatment; religion/pilgrimages and other.
Region An area, especially part of a country or the world, having definable
characteristics but not always fixed boundaries.
Revenue Passenger-
Kilometres (RPK)
RPK represents one paying passenger transported over one
kilometre, so the number of passengers is multiplied by the distance

4
flown. This means that each long-haul passenger contributes more to
total traffic measured in RPKs than each short-haul passenger does.
RevPAR (Revenue per
available room)
Room revenue/rooms available (or = occupancy x ADR): the total
guest room revenue divided by the total number of available rooms.
Total foreign direct
spend in South Africa
(TFDS)
The total amount spent directly in South Africa by all foreign tourists
including amounts spent on goods for resale and capital investments.
Tourism Demand Is the sum of tourism consumption, tourism collective consumption
and tourism gross fixed capital formation.
Tourism Employment An activity in which a person performs work for pay, profit or family
gain. Such a person can be self-employed, an employer, an
employee or a working family member.
Tourism Gross
Domestic Product
Tourism GDP is the GDP generated in the economy by the tourism
industries and other industries in response to tourism internal
consumption.
Tourism Sector The tourism sector consists of the set of institutional units whose
principal economic activity is a tourism-characteristic activity. These
units might belong to the following institutional sectors: households;
non-financial corporations (private, foreign owned, publicly owned);
financial corporations; general government or non-profit institutions
serving households.
Tourist A visitor who stays at least one night in the place visited.
Traveller
A traveller is any person on a trip between two or more countries, or
between two or more localities within his/her country of usual
residence.
Usual Environment To be outside the 'usual environment' the person should travel more
than 40 kilometres from his/her place of residence (one way) AND
the place should NOT be visited more than once a week. This
includes place of work and place of study. Leisure and recreational
trips are included irrespective of frequency.
Visitor
Any person travelling to a place other than that of his/her usual
environment for less than 12 months, and whose main purpose of the
trip is other than the exercise of an activity remunerated from within
the place visited.
Note: The definitions were sourced from UNWTO, International Airport Transport Association,
STR Global Hotel and Statistics South Africa

2
INTRODUCTION AND BACKGROUND
Tourism is an important driver for economic growth and development in South Africa.
During the President’s 2020 State of the Nation Address, tourism was identified as one
of the key areas that contributes towards South Africa’s economy and has the potential
to have a more significant impact in the coming years for job creation (State of the Nation
Address, February 2020). Preliminary data for 2018 from the Tourism Satellite Account
(TSA) indicated that the tourism sector in South Africa directly employed 739 657
persons in 2018, an increase of 8, 5% (58 038) employees compared to 681 619 in 2017.
Tourism direct gross domestic product (TDGDP) increased from R118 977 million in
2017 to R130 163 million in 2018 which was a 9,4% increase. To access the growing
pool of tourists travelling globally and increase tourist arrivals to the country, South
Africa’s strategies in growing tourism should continue to be innovative and focused to
target potential tourists from the growing markets.
In 2011, the Department of Tourism together with key tourism stakeholders developed
the National Tourism Sector Strategy (NTSS). The NTSS is a detailed plan that is meant
to assist in accelerating the contribution of the tourism sector to the economic
development of the country (NTSS, 2011). The NTSS further identifies priority actions
for implementation in the short, medium and long term. The strategy has been reviewed
with targets covering the period 2015 to 2026.
To monitor the performance of the sector, the Department of Tourism produces an
Annual State of Tourism Report which could serve as a strategic tool to inform decision-
makers and businesses on the sector’s performance and developmental aspects.
STATE OF TOURISM 2018/19 REPORT STRUCTURE AND
THEMES
In order to develop the STR, a framework was developed which outlined the key themes,
sub-sections and the indicators that will be reported in this report. The framework
provides the sources for the secondary data that has been used in the 2018/19 STR.

3
The secondary data was sourced from different institutions such as the United Nations
World Trade Organisation (UNWTO), the World Travel and Tourism Council (WTTC),
the International Air Transport Association (IATA) and Euromonitor. These data sources
were used to report on the performance of the key tourism industries globally. In addition,
and specifically for the analysis of the South Africa tourism sector performance,
secondary data was sourced from organisations such as South Africa Tourism (SA
Tourism), Statistics South Africa (Stats SA), the Airports Company of South Africa
(ACSA).
As outlined above, this report follows the STR 2018/19 Framework and this includes the
analysis of key tourism indicators similar to those used in the previous 2017/18 STR, to
ensure consistency and continuity. This report includes the analysis of key indicators
such as, but not limited to:
Chapter One: South Africa’s Tourism Economic Value
Chapter Two: Performance of South Africa’s Tourism Related Industries
Chapter Three: South Africa’s Inbound Tourism Performance
Chapter Four: South Africa’s Domestic Tourism Performance
Chapter Five: Global Tourism Economic Impact
Chapter Six: Global Tourism Performance
Chapter Seven: Global Tourism Related Industries Performance

4
CHAPTER ONE: THE ECONOMIC VALUE
OF TOURISM IN SOUTH AFRICA
The tourism sector has made a significant impact on the country’s economy and job
creation over the years. Usually industries are classified according to their production,
however, the tourism sector output is determined by consumption spending of tourists
and other visitors within the country. Measuring tourism spending therefore requires
identifying visitors and their related expenditure patterns. In order to measure the
economic impact of the tourism sector, the UNWTO has developed the Tourism Satellite
Account: Recommended Methodological Framework (TSA: RMF), which is used as a
guide to measure the direct contribution of tourism to the economy. The Tourism Satellite
Account (TSA) for South Africa is compiled by Statistics South Africa (Stats SA) and it
measures the direct contribution of tourism to the economy by calculating the output of
each industry that is consumed by visitors (Hooper and van Zyl, 2011).
The following sub-sections of the report give an analysis of key indicators, which include
tourism’s contribution to South Africa’s Gross Domestic Product (GDP) and employment.
1.1 Contribution of Tourism to GDP in South Africa
1.1.1 Total contribution of tourism to GDP in South Africa: 2013-2019 and
forecasts for 2030
Stats SA’s TSA does not produce results for the tourism sector’s total contribution (direct
and indirect) to GDP and employment as there is no framework or methodology to guide
this measure. This data was therefore sourced from the WTTC country report for South
Africa: 2019. Figure 1 below shows that for the period 2018-2019, it was estimated that
the total (direct and indirect) contribution of tourism to GDP would decrease from R358,8
billion in 2018 to R354.9 billion in 2019 (7.0% of GDP), which was a decline of -1.1%.
Forecasted data for 2030 indicates that South Africa’s travel and tourism industry will be
about R497,1 billion, resulting in 8.16% share of total GDP.

5
Figure 1: Total contribution of Travel and Tourism to GDP in South Africa: 2013-
2019 and forecast for 2030
2013 2014 2015 2016 2017 2018 2019 2030F
Share of GDP 8,1% 8,1% 7,5% 7,6% 6,9% 7,1% 7,0% 8,1% Note: Real 2019 prices Source: WTTC, South Africa Report, 2020
1.1.2 Direct contribution of tourism to GDP in South Africa: 2014-2018 Figure 2 below presents the provisional results for 2017 and 2018 as per the TSA
published by Stats SA. The direct contribution of tourism towards the country’s GDP
increased from R118, 977 million in 2017 (2.6% of GDP) to R130, 163 million in 2018
(2.7% of GDP), which was a growth of 9, 4% compared to 2017.

6
Figure 2: Direct contribution of tourism to GDP: 2014-2018
2014 2015 2016 2017 2018
Share of GDP 2,9% 3,0% 2,7% 2,9% 2,6%
*Note: (f)=Final and (p)=preliminary Source: Tourism Satellite Account for South Africa, final 2016 and provisional 2017 and 2018, 2019
1.1.3 Direct contribution of tourism to GDP compared to other industries
in South Africa: 2018
Figure 3 below indicates the direct percentage contribution of industries towards South
Africa’s total GDP in 2018 as reported by Stats SA. As mentioned in the TSA, “the
tourism sector is not measured as a sector in its own right in the national accounts
because tourism is not a clearly defined industry in the International Standard Industrial
Classification of all Economic Activities (ISIC), but rather an amalgamation of industries
such as transportation, accommodation, food and beverage services, recreation and
entertainment, travel agencies, etc. (Stats SA, 2018). It is for this reason that the tourism
sector does not feature as a separate industry in the graph below. The results show that
the finance sector (20%), the government sector (18%), the trade sector (15.0%) and
the manufacturing sector (13%) are the leading contributors towards the country’s GDP.
The tourism sector’s direct percentage contribution to GDP in 2018 was 2.7%, which
was slightly larger than the agriculture sector’s contribution (2.6%) but smaller than that
of utilities (4.0%).

7
Figure 3 Direct contribution to GDP by industry: 2018
Source: Stats SA Media Presentation for the Tourism Satellite Account for South Africa, final 2016 and provisional 2017 and 2018, 2019
1.1.4 Estimates of direct contribution of tourism to GDP in South Africa:
2013-2019 and forecasts for 2030
The figure below provides estimates from WTTC on the direct contribution of travel and
tourism for the period 2013 and forecasts for 2030. The estimates are different from the
figures provided in the TSA however the trend is the same. According to WTTC, it was
estimated that the direct contribution of tourism to GDP went down from R138,9 billion
in 2018 to R136,9 billion in 2019 (3.1% of GDP), which was a decline of -1.5 %.
Forecasted data for 2030 indicates that South Africa’s travel and tourism industry will
generate R1287,9 billion resulting in 3.1% share of GDP in South Africa.

8
Figure 4: Direct contribution of Travel and Tourism to GDP in South Africa: 2013-
2019 and forecasts for 2030
2013 2014 2015 2016 2017 2018 2019 2030F
Share of GDP 3,0% 3,0% 2,8% 2,9% 2,6% 2,8% 2,7% 3,1% Note: Real 2019 prices Source: WTTC, South Africa report, 2020
1.2 Contribution of tourism to employment in South Africa
1.2.1 Total contribution of tourism to employment in South Africa: 2013-
2019 and forecasts for 2030
Data on the total contribution of the travel and tourism sector to employment for South
Africa was sourced from WTTC and is provided in the figure below.

9
Figure 5: Total contribution of travel and tourism to Employment in South Africa
2013-2019 and forecasts for 2030
2013 2014 2015 2016 2017 2018 2019 2030F
Share of GDP 9,2% 9,2% 8,8% 8,9% 8,5% 9,0% 9,1% 10,3% Source: WTTC South Africa report, 2020.
According to WTTC estimates, in 2019 the travel and tourism sector contributed about
1 482 200 jobs, which was a slight increase of 0.04% (contributing 9.1% to total
employment) compared to 1 482 600 workers (9.1 share % to the country’s total
employment) in 2018. Forecasted data for 2030 indicates that South Africa’s travel and
tourism sector will contribute a total of about 1 937 200 jobs with a 10.3% share of total
employment.
1.2.2 Direct Contribution of tourism to employment: 2014-2018
Direct tourism employment figures were sourced from the TSA published by Stats SA,
which provides final figures for the period 2014-2016 and preliminary figures for 2017
and 2018. In 2017, there was a total of 681 619 direct jobs, increasing to 739 657 direct
jobs in 2018 that were created by the tourism sector. And, this increase resulted in 58
038 additional jobs created only in 2018. Preliminary results for 2018 indicate that the
tourism sector directly contributed to about 4.5% to the country’s total employment,
which was an increase of 8.5% in the number of direct jobs in 2018 compared to 2017.

10
Figure 6: Direct Tourism Employment: 2014-2018
Source: Tourism Satellite Account for South Africa, final 201 and provisional 2017 and 2018, 2019
1.2.3 Direct Contribution of tourism to employment in South Africa: 2013-2019
and forecasts for 2030
According to WTTC, it was estimated that the direct contribution of tourism to
employment would decline from 761, 700 in 2018 to 759 900 in 2019 (4.7% of GDP),
which was a negative growth of -0.2%. Forecasted data for 2030 indicates that South
Africa’s travel and tourism will contribute about 995 500 direct jobs (approximately 5.3%
share of total employment).
Indicator 2014 (f) 2015 (f) 2016(p) 2017(p) 2018 (p)
% of total employment in South Africa 4,5% 4,3% 4,5% 4,2% 4,5%
% Growth 3,7% -1,8% 5,4% -3,4% 8,5%
620 000 640 000 660 000 680 000 700 000 720 000 740 000 760 000

11
Figure 7: Direct Contribution of tourism to employment in South Africa: 2013-2019
and forecasts for 2030
2013 2014 2015 2016 2017 2018 2019 2030F
Share of GDP 4,5% 4,6% 4,4% 4,6% 4,3% 4,6% 4,7% 5,3%
Source: WTTC South Africa report, 2020
1.2.4 Direct contribution of tourism to employment compared to other
industries in South Africa: 2018
Figure below indicates the direct contribution of South African industries towards the
country’s total employment in 2018. The results provided indicate that the community
and social services industry (23%), the trade industry (21%) and the finance industry
(15%) are the leading industries, thereby contributing more towards the country’s total
employment. The tourism sector’s direct contribution to total employment in 2018 was
4.5%, which was larger than the contribution of the mining sector (2%) but smaller than
the agriculture sector (5%). The trade and finance industries were the two industries that
contributed the most towards the country’s GDP in 2018.

12
Figure 8: Tourism Direct Employment compared to other industries: 2018
Source: Stats SA, Media Presentation for the Tourism Satellite Account for South Africa, final 2016 and provisional 2017 and 2018, 2019
1.2.5 Demographic characteristics of people directly employed in the
tourism sector: 2018
Tourism has become one of the major employers in South Africa. The figure below
indicates the gender and race of persons directly employed in the tourism sector during
2018. More than half of the people directly employed in the tourism sector were males
(60%) against 40% of women employed.

13
Figure 9: Direct tourism jobs by gender: 2018 (Preliminary)
Source: Stats SA, Tourism Satellite Account for South Africa, final 2016 and provisional 2017 and 2018, 2019
Figure 10 below also indicates that in 2018 more males across all race groups were
working in the tourism sector. In order to assess the progress that the sector has made
in the area of transformation, it is recommended that there should be further research
conducted to investigate the skill levels and positions of the different gender and race
groups employed in the tourism sector.

14
Figure 10: Demographic characteristics of people directly employed in the tourism sector: 2018 (Preliminary)
Source: Tourism Satellite Account for South Africa, final 2016 and provisional 2017 and 2018, 2019
1.3 Tourism Balance of Payments for South Africa: 2011-2018
The TSA measures the total spend of international visitors that includes same-day and
overnight visitors. Total spend by international visitors contributes to South Africa’s
export earnings while the total spend of South Africans travelling overseas contributes
towards total imports. Figure below shows that in 2018 the total international visitor
spend was about R120 037 million, which was a decline of -0.8% compared to 2017
(R121 400 million). In 2018, the value of outbound tourism was R83 673 million, which
was a 3.5% growth compared to 2017 (R80 838 million). Therefore, the value of exports
(inbound tourism expenditure) was higher than the value of imports (outbound tourism
expenditure) resulting in South Africa having a positive trade balance in 2018. The figure
also indicates that the outbound tourism expenditure is growing at a faster rate than
inbound tourism expenditure. These results show that there is a potential to grow

15
domestic tourism expenditure if the outbound expenditure could be diverted towards
domestic tourism.
Figure 11: Tourism exports, imports and net trade: 2011 to 2018
Source: Tourism Satellite Account for South Africa, final 2016 and provisional 2017 and 2018, 2019
2011 2012 2013 2014 2015 2016 2017 2018
Exports: Inbound expenditure 3,3% 19,1% 10,3% 13,3% 1,9% 11,6% -0,3% -0,8%
Imports: Outbound expenditure 1,8% -3,2% 6,8% 9,3% 6,3% 8,0% 3,0% 3,5%

16
CHAPTER TWO: PERFORMANCE OF TOURISM
RELATED INDUSTRIES IN SOUTH AFRICA
This chapter of the report focuses on the performance of some of the key tourism related
industries in South Africa. The performance of these industries is key for the tourism
sector’s contribution to the country’s GDP and total employment. The data for this
section is mainly sourced from Statistics South Africa (Stats SA) and Airports Company
South Africa (ACSA). In addition, the 2019 travel and tourism competitiveness index for
South Africa is also reported in this chapter and the information was sourced from World
Economic Forum (WEF)
2.1 Tourism industries ratios: 2018
The TSA defines tourism industry ratios as the proportion of an industry's output that is
consumed by visitors (Stats SA, TSA final 2016 and provisional 2017 and 2018,
published in 2019). These ratios are used to calculate employment for the tourism sector.
From the table below, it is seen that travel agencies and other reservations services
industry have the highest industry ratio of 98% as visitors are often the biggest consumer
of their services. The table also shows that 89% of expenditure from air passenger
transport is from visitors unlike the rail passenger transport, which indicated that only 7%
of the expenditure is from visitors. These ratios show the importance of the different
industries that are related to tourism.
Table 1: Tourism ratios by industry: 2018 (Preliminary)
INDUSTRY TOURISM INDUSTRY RATIO'S (%)
Accommodation 78
Food & beverage 37
Railway passenger transport 7
Road passenger transport 36
Water passenger transport 45
Air passenger transport 89
Transport equipment rental 65
Travel agencies and other reservations service industry 98
Cultural industry 37
Source: Tourism Satellite Account for South Africa, final 2016 and provisional 2018 and 2019, 2020

17
2.2 Accommodation industry performance: 2018-2019
The following sub-section of the report focuses on the performance of the
accommodation industry by analysing key indicators such as number of available stay
units, total income from accommodation and occupancy rate. The data was sourced from
Stats SA’s Accommodation Survey.
2.2.1 Average Stay units available: 2018-2019
Table below shows that there was an average of 127, 2 000 stay units available for the
total industry in 2019, which was a slight decrease of -0.07% compared to 2018. Caravan
parks had an average of 6, 67 000 of stay units available compared to an average of 6,
71 000 in 2018, which was a decrease of -0, 6%. Average stay units for guest houses
and guest farms remained flat during the period under review. Other accommodation
types had a -0, 03% in the average number of stay units available in 2019 compared to
2018.
Table 2: Average Number of stay units: 2018-2019
STAY UNITS (ACTUAL FIGURES) 2018 2019 % CHANGE
‘000
Hotels 79,8 79,7 -0,04%
Caravan parks and camping sites 6,71 6,67 -0,6%
Guest houses and guest farms 8,9 8,9 0,0%
Other accommodation 31,9 31,9 -0,03%
Total industry 127,3 127,2 -0,07% Source: Stats SA: Accommodation data cuts, February 2020
2.2.2 Income from accommodation: 2018-2019
The total income from accommodation in 2019 increased by 1,7% improving from
R24 854,4 million in 2018 to R25 288,5 million in 2019. Caravan parks and camping sites
had an increase of 12, 0% in income during 2019 compare to 2018. This could be an
indication that this category in the accommodation sector had a good year in 2019 even
though the average number of stay units for caravan parks and camping sites declined
in the same year.

18
Table 3: Accommodation Industry Total Income (million): 2018-2019
INCOME (CURRENT PRICES) 2018 2019 % CHANGE
Hotels R16 462,4 R16 572,40 0,7%
Caravan parks and camping sites R246,9 R276,60 12,0%
Guest houses and guest farms R1 096,6 R1 025,40 -6,5%
Other accommodation R7 048,5 R7 414,10 5,2%
Total industry R24 854,4 R25 288,5 1,7% Source: Stats SA: Accommodation data cuts, February 2020
2.2.3 Average income per stay unit night sold
The figure below gives the average income per night for stay unit sold for 2019 compared
to 2018. The total accommodation industry had a 2.2% increase in the average income
per stay unit night sold, improving from R1 103,1 in 2018 to R1 127,7 in 2019. Caravan
parks and camping sites had the highest increase of 8.8% in the average income per
night for stay unit sold in 2019 compared to 2018. These results are similar to the total
income received from accommodation establishments, which also indicated that caravan
parks and camping sites had a 12.0% increase in income in 2019 compared to 2018.
Guest houses and guest farms had a declining growth of -11.1%, dropping from R975,
5 in 2018 to R867, 1 in 2019.
Figure 7: Average income per stay unit night sold: 2018-2019

19
Accommodation Category
Hotels Caravan parks and camping sites
Guest houses and guest farms
Other Accommodation
Total industry
% change 2019 compared to 2018
2.2% 8.5% -11.1% 4.2% 2.2%
Source: Stats SA: Accommodation data cuts, February 2020
2.2.4 Industry occupancy rate: 2018-2019
The fluctuation in tourist numbers, seasonality, and economic impacts on tourists’ travel
and spending behaviour are some of the indicators that could influence the level of
occupancy and revenue generated in the accommodation industry. The average
seasonally adjusted occupancy rate for 2019 was 48,3%, which remained almost flat
compared to 2018 rate.
Table 4: Occupancy rate: 2018-2019
OCCUPANCY RATE (SEASONALITY ADJUSTED)
2018 2019 % CHANGE
Occupancy rate – hotels 51,0 50,2 -1,5%
Occupancy rate - caravan parks and camping sites
29,1 30,0 3,0%
Occupancy rate - guest houses and guest farms
34,2 36,0 5,4%
Occupancy rate - other accommodation 50,1 50,5 0,8%
Occupancy rate - total industry 48,4 48,3 -0,3% Source: Stats SA: Accommodation data cuts, February 2020
Top ten hotel chain development pipelines in Africa by number of rooms: 2019
The table below shows the number of hotels and rooms in the development pipeline in
Africa for the period 2019. Egypt ranked as number one with a total of 15 158 rooms
planned to be developed in 2019, which was almost double the number of rooms in the
pipeline in Nigeria (7 940). Morocco was ranked in third position with a total of 6 395
rooms to be developed, while South Africa occupied the tenth position with a total of
2 574 rooms in the development pipeline during 2019.
Table 5 Top ten hotel chain development pipelines in Africa by number of rooms: 2019
Hotels Country Hotels Rooms
1 Egypt 51 15 158
2 Nigeria 49 7 940
3 Morocco 36 6 395
4 Ethiopia 34 6 184

20
5 Kenya 27 4 232
6 Algeria 19 4 147
7 Cape Verde 11 3 479
8 Senegal 17 2 829
9 Tunisia 16 2 768
10 South Africa 18 2 574 Source: Bench Events, 2019
Airbnb Performance in South Africa: 2015-2019
Over the years, the tourism sector has seen a number of new accommodation platforms
being used by tourists namely; coach surfing, rent a home and Airbnb. This section
focuses on the performance of Airbnb in South Africa since the performance reports for
the other platforms are not available. Airbnb is an online marketplace that connects
people who want to rent out their homes or accommodation establishments with people
who are looking for accommodation in a destination for different purposes of visit
including tourism. It currently covers more than 81,000 cities and 191 countries
worldwide (Investopedia, 2019). Airbnb was introduced in South Africa in 2015
(Businesstech, 2015). The figure below indicates the performance of Airbnb in South
Africa.
Figure 13 below shows the retail value of Airbnb in South Africa for the period 2015-
2019. In 2019, the retail value of Airbnb in South Africa was R1 274 billion, which was
an increase of 10.9% compared to 2018 with a total of R1 149 billion.
Figure 8: Retail value of Airbnb in South Africa: 2015-2019
Source: Euromonitor, data downloaded on the 28th April 2020

21
2.4 Food and Beverages industry: 2018-2019
Food and beverage industry includes, amongst others, restaurants from fast food
services to fine dining as well as pubs, bars, nightclubs and lounges. This sub-section
provides a summary of the performance of the food and beverages industry focusing
mainly on income generated as an indicator. This section also provides a summary of
top five fast food franchises in South Africa based on their income.
2.4.1 Food and Beverages industry income: 2018-2019
Measured in constant prices, the average monthly income of the food and beverages
industry was about R 4 720 million in 2019 which led to a total annual income of about
R 56 640 million for the whole year. This was an increase from an average monthly
income of R4 608 million in 2018 and an increase of 2.4% of annual income from
R55 302 in 2018. Figure 14 below provides total annual income generated by the food
and beverages industry by category.
Figure 9: Total income generated by categories of the food and beverages industry: 2018-2019

22
Source: Stats SA: Accommodation data cuts, February 2020
As indicated in the table below, the contribution of income for food and beverages
industry is mainly from the restaurants and coffee shops which contributed more than
50% during 2018 and 2019. Take-away and fast food outlets contribution was 32.1% in
2018 which remained almost flat in 2018 (32.5%).
Table 6: Share of income by food and beverage industry: 2018-2019
TYPE OF FOOD AND BEVERAGE INDUSTRY 2018 2019
CATERING SERVICES 15,3% 15,0%
TAKE AWAY AND FAST FOOD OUTLETS 32,1% 32,5%
RESTAURANTS AND COFFEE SHOPS 52,9% 53,0% Source: Stats SA: Food & Beverage data cuts, February 2020
Top Ten Fast Food Brands in South Africa by total number of franchises:
2019
As already indicated take-away and fast food outlets contributed more than 32.1% to
income generated by food and beverages industry during in 2019. This can be an
indication of the importance of this sub-industry which is dominated by businesses that
are fast food franchises. The figure below ranks the top ten fast food outlets in South
Africa by total franchises in the country. According to Business Tech, Kentucky Fried
Chicken (KFC) was ranked as the number one fast food take away in South Africa
leading with a total number of franchises of 900, followed by Steers (600) and Debonairs
Pizza (569).
Figure 10: Top ten take-away outlets in South Africa by total franchises: 2019
Rank Name Number of Franchises
1 KFC 900
2 Steers 600
3 Debonairs Pizza 569
4 Wimpy 467
5 Nando's 340
6 McDonalds 264
7 Fishaways 254
8 King Pie 248
9 Romans Pizza 220
10 Chicken Licken 200 Source: BusinessTech. July 2019

23
2.5 Airline Industry Performance: 2018-2019
South Africa has three main international airports namely; O.R. Tambo International,
Cape Town International and King Shaka International Airports. There are also regional
airports, which are either privately owned or owned by government. Information relating
to the performance of privately owned airports in South Africa could not be sourced
therefore the performance of ACSA airports will be reported in this section of the report.
ACSA is responsible for managing nine of the state-owned airports which are:
O.R. Tambo International Airport
Cape Town International Airport
King Shaka International Airport
Bram Fischer International Airport
Upington Airport
Port Elizabeth Airport
East London Airport
George Airport, and
Kimberley Airport
The next section of the report provides the performance of aircraft and passenger
movements in ACSA airports within South Africa during 2018 and 2019.
2.5.1 Aircrafts arriving to South Africa: 2018-2019
The table below indicates the total number aircrafts arriving in ACSA airports for 2018
and 2019. There has been a decline of -1.6% in the total number of aircraft arriving in
2019 (256 280) compared to 2018 (260 321). The decline was mainly due to the number
of unscheduled and domestic aircraft arriving, which declined by -3.6% and -1.4%
respectively.
Table 7: Arriving Aircraft to South Africa: 2018-2019 ARRIVING AIRCRAFTS 2018 2019 DIFFERENCE %
CHANGE
INTERNATIONAL 38 887 39 431 544 1,4%
REGIONAL 12 348 12 300 -48 -0,4%
DOMESTIC 136505 134 607 -1 898 -1,4%
UNSCHEDULED 72 581 69 942 -2 639 -3,6%
TOTAL 260 321 256 280 -4 041 -1,6% Source: ACSA data, 2020

24
2.5.2 Passenger arrivals movements: 2018-2019
Table below shows the total passengers arriving in 2019 compared to 2018. Total
international passenger arrivals increased by 2, 9% in 2019 to 21 429 817 passengers,
compared to 20 818 200 in 2018. Unscheduled arrivals decreased by -7.0% in 2019
compared to 2018. Domestic passenger arrivals experienced an increase of 4.3% in
2019 compared to 2018.
Table 8: Arriving passengers to South Africa by region: 2018-2019 ARRIVING PASSENGERS 2018 2019 DIFFERENCE %
CHANGE
INTERNATIONAL 5 921 172 5 925 407 4 235 0,1%
REGIONAL 552 373 551 093 -1 280 -0,2%
DOMESTIC 14 283 966 14 896 859 612 893 4,3%
UNSCHEDULED 60 689 56 458 -4 231 -7,0%
TOTAL 20 818 200 21 429 817 611 617 2,9%
Source: ACSA data, 2020
2.5.3 Passenger departure movements: 2018-2019
Table below shows the total passengers departing in 2019 compared to 2018. Total
passengers departing increased by 2.8% in 2019 which was a total of 21 567 439
passengers in 2019 compared to 20 972 235 in 2018.
An increase of 0.2% in total international passengers departing was seen in 2019, with
growing numbers from 20 972 235 in 2018 to 21 567 439 in 2019. Regional arrivals also
increased by 1.0% in 2019 compared to 2018, while unscheduled passengers had a
decrease of -6.8%.
Table 9: Departing passengers from South Africa by region: 2018-2019
DEPARTING PASSENGERS 2018 2019 DIFFERENCE % CHANGE
INTERNATIONAL 6 024 950 6 039 107 14 157 0,2%
REGIONAL 545 891 551 244 5 353 1,0%
DOMESTIC 14 339 173 14 919 116 579 943 4,0%
UNSCHEDULED 62 221 57 972 -4 249 -6,8%
TOTAL 20 972 235 21 567 439 595 204 2,8% Source: ACSA data, 2020

25
2.6 Car Rental Performance in South Africa: 2018-2019
Figure 11: Car rental performance: 2018-2019
Source: Euromonitor, 2020
Car rental is an important industry for the tourism sector since tourists often use car
rentals to travel within the country. Recent data from Euromonitor indicates that the
rental value sales in South Africa for 2018 was R11.5 billion, which grew by 5.7% to
reach R12.1 billion in 2019. The figures below indicate that bookings from business
tourism continue to drive the growth of car rental in 2018 and 2019. The Travel & Tourism
Competitiveness Index (TTCI) ranked South Africa 43rd out of 140 countries in 2019 for
the presence of major car rental companies in the country (WEF, 2019).
2.7 The Travel & Tourism Competitiveness Index (TTCI) for
South Africa: 2019
The World Economic Forum (WEF) is responsible for developing the Travel and Tourism
Competitiveness Index (TTCI). The main aim of the TTCI is to measure a set of factors
and policies of countries that enable the sustainable development of the tourism sector.
This section of the report gives the TTCI results for South Africa for 2019 compared to
2017 since the report is published biennially (every two years).

26
Out of 140 countries, South Africa was ranked 61st position in 2019 compared to 53rd
position out of 136 countries in 2017. The Sub-Saharan region had an average score of
3.1. Within the sub-Saharan region, South Africa was the top scorer for cultural
resources and business travel pillars, which was due to the country’s stadiums and total
number of international association meetings hosted in 2019. South Africa also ranked
high in natural (15th) and cultural resources (23rd).
Figure 12: Tourism Competitiveness Index for South Africa: 2019
Source: WEF, 2019

27
CHAPTER THREE: SOUTH AFRICAN
INBOUND TOURISM PERFORMANCE
Tourism is regarded as an export industry since tourist arrivals from other countries
spend on tourism products and services such as accommodation, transport and other
related products within the country. By generating tourist exports through receipts,
countries increase their foreign currency earnings and contribution to the economy’s
growth.
This section provides an analysis of South African tourism inbound performance
focusing on key indicators such as total tourist arrivals and spend.
3.1 Collection and processing of tourist arrivals in South
Africa
In South Africa, the Department of Home Affairs (DHA) is responsible for collecting
migration information from ports of entry in South Africa. The figure below aims to
indicate the collection and processing of foreign arrivals data, which includes people
travelling for tourism purposes.

28
Figure 13: Data collection and processing of foreign arrivals (including tourists)
As seen in figure 18 above, travel information is firstly collected by immigration officers
at all land, air and sea ports of entry on all travellers arriving into or departing from South
Africa. The information is sourced directly from travel documents either by scanning
them or by capturing information from the travel documents onto the port’s electronic
database. Some of the information not indicated in the traveller’s document is sometimes
requested verbally and captured in the system accordingly. Each port of entry regularly
transmits the data to the national database i.e. DHA’s Movement Control System (MCS).
Statistics South Africa (Stats SA) then downloads the migration data covering a
particular calendar month from the system. The processing of the data to produce
amongst others, data on tourist arrivals may be time consuming therefore there is a two-
month lag period in the release of the monthly data by Stats SA.
According to the UNWTO and definitions published by Stats SA, a tourist is any visitor
travelling to a place other than that of his/her usual environment for more than one night
but less than twelve months, and whose main purpose of the trip is other than the
exercise of an activity remunerated from within the place visited. By applying the
definition of a tourist and the purpose of visit relating to tourism activities as defined by
UNWTO, Stats SA is able to separate the number of tourists from the total travellers to

29
South Africa using the purpose of visit and the length of stay (more than 24 hours). The
data is published in the monthly Tourism and Migration report with a two-month lag.
Stats SA can only provide data on tourist arrivals and SA Tourism conducts a Tourism
Departure Survey on a monthly basis to collect information on other key tourism
indicators such as spend, geographic spread and seasonality index of tourists visiting
the country. The methodology used for this survey can be sourced from SA Tourism’s
Annual Tourism Performance Reports.
3.2 Tourists Arrivals to South Africa: 2014-2019
South Africa is considered the largest destination in the Sub-Saharan region reaching a
record breaking of more than 10 million international tourist arrivals annually from 2016-
2019. In 2019, a total of 10 228 593 tourist arrivals was recorded which was a decline of
-2.2% (-243 512) compared to 2018. Figure below indicates tourist arrivals for the period
2014 to 2019. Tourist arrivals to the country recorded a decline of -6, 8% in 2015
compared to 2014. The performance recovered in 2016 with a double digit growth of 12,
8% compared to 2015. Tourist arrivals continued to grow in 2017 and 2018, however the
growth was slower during these two years.
Figure 14: Number of International tourist arrivals: 2014-2019

30
Source: Stats SA Tourism & Migration data, February 2020
Table below gives the total tourist arrivals to South Africa by region for the period 2019
compared to 2018. Total tourist arrivals (10 228 593) went down by -2.3% (-243 512) for
the January to December 2019 period compared to the same period in 2018 (10 472
105). Total tourist arrivals from the overseas market declined by -2.2% (-59 987), which
was influenced by declines recorded in Europe (-3.8%), Australasia (-2.4%) and North
America (-1.0%). Tourist arrivals from Middle East went up by 11.4% followed by Central
and South America (3.3%). The highest declining growth recorded in Europe was from
Sweden, with a decline of -14.3% (-6 953). With regards to volume, France showed the
highest decline of -11.4% (-21 213). The decrease from Australasia was driven by a
decline of -3.8% (-4 407) in tourist arrivals from Australia. As already indicated, Middle
East showed the highest growth in tourist arrivals, and with regards to volume, the growth
from Middle East was driven by an increase of 2 880 and 2 782 in tourist arrivals from
Israel and Saudi Arabia respectively. Tourist arrivals from Africa declined by -2.4% (-
185 514) and in terms of volume, the decrease was driven by negative growth in tourist
arrivals of -10.1% (-175 740) from Lesotho, followed by Mozambique (-27 701) and
Botswana (-20 251).
31
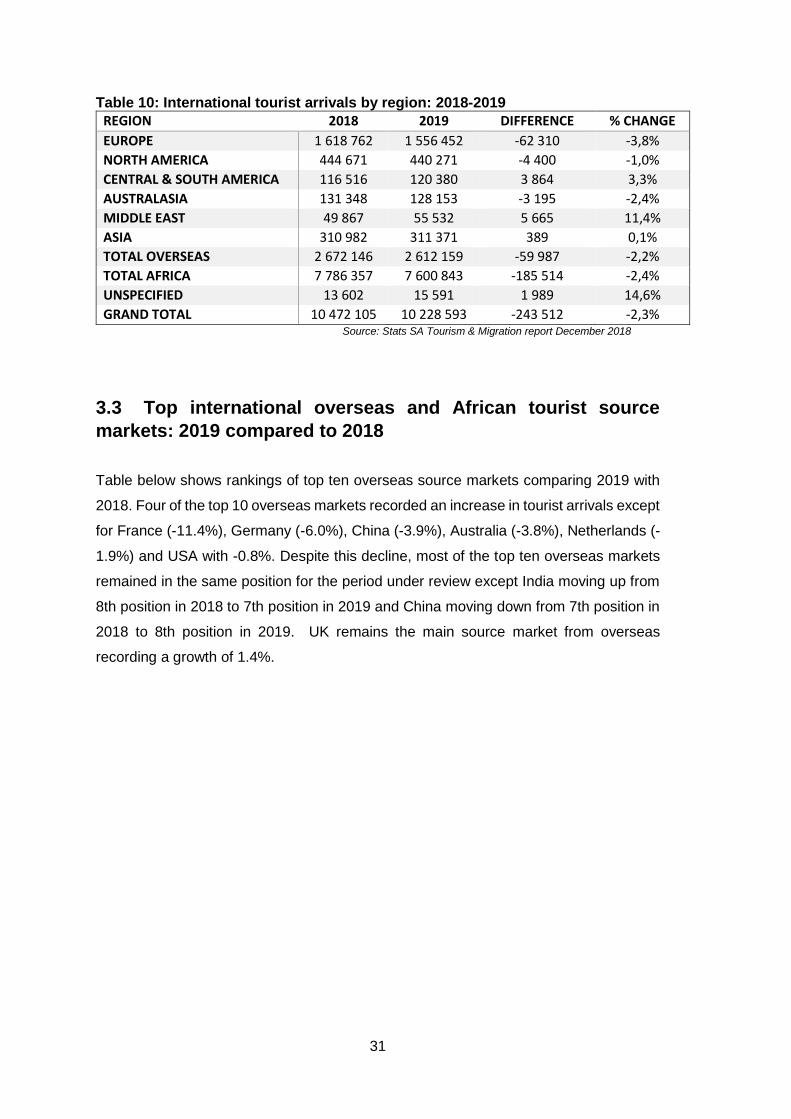
Table 10: International tourist arrivals by region: 2018-2019
REGION 2018 2019 DIFFERENCE % CHANGE
EUROPE 1 618 762 1 556 452 -62 310 -3,8%
NORTH AMERICA 444 671 440 271 -4 400 -1,0%
CENTRAL & SOUTH AMERICA 116 516 120 380 3 864 3,3%
AUSTRALASIA 131 348 128 153 -3 195 -2,4%
MIDDLE EAST 49 867 55 532 5 665 11,4%
ASIA 310 982 311 371 389 0,1%
TOTAL OVERSEAS 2 672 146 2 612 159 -59 987 -2,2%
TOTAL AFRICA 7 786 357 7 600 843 -185 514 -2,4%
UNSPECIFIED 13 602 15 591 1 989 14,6%
GRAND TOTAL 10 472 105 10 228 593 -243 512 -2,3% Source: Stats SA Tourism & Migration report December 2018
3.3 Top international overseas and African tourist source
markets: 2019 compared to 2018
Table below shows rankings of top ten overseas source markets comparing 2019 with
2018. Four of the top 10 overseas markets recorded an increase in tourist arrivals except
for France (-11.4%), Germany (-6.0%), China (-3.9%), Australia (-3.8%), Netherlands (-
1.9%) and USA with -0.8%. Despite this decline, most of the top ten overseas markets
remained in the same position for the period under review except India moving up from
8th position in 2018 to 7th position in 2019 and China moving down from 7th position in
2018 to 8th position in 2019. UK remains the main source market from overseas
recording a growth of 1.4%.

32
Table 11: Top ten overseas international tourist markets: 2019 compared to 2018
COUNTRY RANK-2019 TOURIST ARRIVALS
2019
RANK-2018 TOURIST ARRIVALS
2018
% CHANGE
FROM 2018 TO
2019
UK 1 436 559 1 430 708 1,40%
USA 2 373 694 2 376 892 -0,80%
GERMANY 3 322 720 3 343 229 -6,00%
FRANCE 4 165 038 4 186 251 -11,40%
THE NETHERLANDS 5 144 071 5 146 925 -1,90%
AUSTRALIA 6 111 439 6 115 846 -3,80%
INDIA 7 95 621 8 93 428 2,30%
CHINA 8 93 171 7 96 915 -3,90%
BRAZIL 9 77 261 9 70 539 9,50%
ITALY 10 64 764 11 63870 1,40%
Source: Stats SA Tourism & Migration report, February 2020
Table below ranks the top ten African source markets for the period 2019 and 2018.
Majority of the top ten African source markets remained at the same position for the
period under review except Malawi, moving up from 7th position in 2018 to 6th position
in 2019 and Namibia losing its 6th position in 2018 by dropping to 7th position in 2019.
Most of the top ten countries recorded a decline growth in tourist arrivals except for
Swaziland (3.8%), Zimbabwe (2.3%) and Malawi (0.9%). Zimbabwe’s growth translated
to an additional 49 864 tourist arrivals from this country, while Nigeria recorded the
highest decline (-27.4%) followed by Lesotho (-10.1%) and Zambia (-8.4%).
Table 12: Top ten African tourist source markets: 2019 compared to 2018
COUNTRY RANK-2019 TOURIST ARRIVALS
2019
RANK-2018 TOURIST ARRIVALS
2018
% CHANGE FROM 2018 TO 2019
ZIMBABWE 1 2 258 794 1 2 208 930 2,30%
LESOTHO 2 1 563 448 2 1 739 188 -10,10%
MOZAMBIQUE 3 1 333 195 3 1 360 896 -2,00%
SWAZILAND 4 917 631 4 883 735 3,80%
BOTSWANA 5 668 315 5 688 566 -2,90%
MALAWI 6 199 079 7 197 317 0,90%
NAMIBIA 7 184 431 6 200 367 -8,00%
ZAMBIA 8 152 064 8 165 968 -8,40%
ANGOLA 9 61 995 9 64 859 -4,40%
NIGERIA 10 39 041 10 53 769 -27,40%
Source: Stats SA Tourism & Migration report, February 2020

33
As already indicated, data for indicators such as purpose of visit, spend and provincial
share of tourist arrivals is collected by SA Tourism through the monthly Tourism
Departure Survey conducted at main land and air ports of entry to the country. The data
is collected from tourists when leaving the country to get more understanding of their
experience while travelling within South Africa. The sections below provide an analysis
of purpose of visit, geographic spread and total spend by international tourists for the
period 2018 compared to 2017 as reported by SA Tourism.
3.4 Main purpose of visit for International tourist arrivals: 2019
Tourists often travel to different destinations for different purposes. Understanding the
different purpose of visit categories that influence tourists’ travel is important when it
comes to marketing a destination. The purpose of visit for tourism includes, amongst
others, travelling to visit friends and relatives, holiday, shopping and business in line with
the definition of a tourist. The business category includes tourists travelling for business;
and Meetings, Incentives, Conferences and Exhibitions (MICE) purposes; and the
shopping category includes tourists who are shopping for personal and business
reasons. The main reasons for international tourists to visit South Africa in 2019 were
mainly for visiting friends and relatives (VFR) (41.4%); holiday (20.9%); and shopping
(22.9%), as indicated in the figure below. The share of tourists travelling for VFR went
up from 38,8% in 2018 to 41,4% in 2019.
Figure 20: Main purpose of visit for international tourist arrivals: 2019
Source: SA Tourism Performance Report: January-December, 2019

34
The results in the figure below give the main purpose of visit for tourists travelling from
Africa to the country in 2019 compared to 2018.
Figure 21: Purpose of Visit for tourist arrivals from Africa: 2019
Source: SA Tourism Performance Report: January-December, 2019
Tourists from the African region predominantly visited South Africa for VFR purposes
(48.3%), followed by shopping (29.9%) and holiday (10.2%) purposes in 2019. Less than
5% of tourists from the Africa region visited South Africa for business (3.2%), religion
(1.8 %) and medical (0.9%) purposes.
The figure below shows the main purpose of svisit for tourist from overseas regions
namely; Asia, Australasia, Central and South America, Europe, Middle East and North
America.

35
Figure 22: Main Purpose of Visit for Overseas Markets: 2019
Source: SA Tourism Performance Report: January-December, 2019
According to figure 22, more than half of tourists from Europe (60.2%), North America
(58.2%), Central and South America (56.4%) and Middle East (55.1%) main purpose for
visiting South Africa was holiday purposes. Compared to other regions, most tourists
from Asia, about 34.5%, travelled for business purposes to South Africa. Australasia was
leading with tourists (37.0%) visiting South Africa for VFR purposes. This analysis
highlights the importance of marketing agencies that should be diverse and
comprehensive in their marketing interventions, by considering different purposes of
travel for international markets.
3.5 Length of stay for international tourist arrivals 2019
compared to 2018
On average, the length of stay for international tourists was shorter in 2019 compared to
2018. The number of nights spent by international tourists went down slightly from 11.7
nights in 2018 to 11.4 nights in 2019. Increasing the length of stay of tourist arrivals could

36
be one of the key targets to increase the contribution of tourism to the economy of any
country as the longer the tourists stay in a country, the more likely they will spend more.
3.6 Total Foreign Direct Spend (excluding capital expenditure):
2019 compared to 2018
One of the indicators that is used to measure the importance of tourism to the economy
is how much tourists spend while they are travelling within the country, given that their
expenditure contributes to the country’s economy as well as job creation. Table 13 below
shows that the total foreign direct spend for international tourists was R81.2 billion in
2019, which was a decrease of -1.6% from R82.5 billion in 2018.
Table 13: Spend by region: 2019 compared to 2018
Source: SA Tourism 2019 data cuts
The importance of arrivals from Africa could be seen by their contribution to total foreign
direct spend, which was about 37,8% and the rest of the contribution was from overseas
markets. The contribution from Africa is driven by volume of tourist arrivals. On average,
tourists from the Africa continent spend less than tourists from overseas markets per trip.
Air-bound markets showed a much higher average spend per trip, with the Middle East
spending on average R27 000, Europe R22 900, North America R22 600, Australasia
R20 300, Asia R17 500, South America R17 200 and Africa R4 100. The average
expenditure for international tourist arrivals in South Africa remained flat at R8 300 per
trip during 2019 and 2018.
3.6.1 Total Foreign Direct Spend by top five African Source
Markets
The top five African markets by total foreign direct spend are provided in table 14 below.
In 2019, most of the total spend from African markets was from Zimbabwe, which was
R11.6 billion, followed by Mozambique (R3.1 billion) and Lesotho (R2.7 billion).
Region 2018 2019 %Change % share 2019
Africa R35 424 473 536 R30 725 408 594,00 -13,3% 37,8%
Asia R5 338 586 804,00 R4 739 510 598,00 -11,2% 5,8%
Australisia R2 307 862 394,00 R2 430 780 180,00 5,3% 3,0%
Central and South America R1 870 865 799,00 R1 453 584 118,00 -22,3% 1,8%
Europe R27 445 854 945,00 R31 405 697 854,00 14,4% 38,7%
Middle East R1 032 393 717,00 R1 290 219 864,00 25,0% 1,6%
North America R9 108 591 068,00 R9 141 305 111,00 0,4% 11,3%
Total Foreign Direct Spend R82 528 628 263,00 R81 186 506 319,00 -1,6% 100,0%

37
However, it should be noted that the total spend from Zimbabwe was driven by volume.
According to SA Tourism data, top spenders from the African market were from the
Democratic Republic of Congo with an average spend of R29 400 per trip in 2019, which
was up from an average spend of R25 700 per trip in 2018.
Table 14: Total Foreign Direct Spend by top five African Markets: 2019
Rank Country Total Foreign Direct Spend 2018 Total Foreign Direct Spend 2019
1 Zimbabwe R12 295 567 710 R11 620 335 773
2 Mozambique R3 618 520 675 R3 081 877 238
3 Lesotho R2 923 226 893 R2 661 393 409
4 Malawi R 2 887 019 478 R2 245 501 962
5 Zambia R 2 666 235 802 R2 047 820 855
Source: SA Tourism Performance Report: January-December 2019
3.6.2 Total Foreign Direct Spend by top five overseas Markets:
2019
The top five overseas markets by total foreign direct spend are provided in the table
below. Most of the total spend from overseas markets was from UK, with a total spend
of R6.2 billion, followed by the USA (R5.6 billion) and Germany (R5.5 billion). On average
tourists from the UK spent about R24 200 per trip during 2019, which was an increase
from an average spend of R19 700 per trip in 2018.
Table 15: Total Foreign Direct Spend by top five overseas Markets: 2019
Rank Country Total foreign Direct Spend - 2018
Total Foreign Direct Spend 2019
1 UK R6 346 022 R6 201 509
2 USA R5 425 705 R5 571 817
3 Germany R5 726 850 R5 485 719
4 France R2 767 299 R2 403 382
5 Netherlands R2 352 175 R2 171 930
Source: SA Tourism Performance Report: January-December 2019
3.7 Provincial share of tourist arrivals: 2019
The table below shows the provincial share of total foreign tourist trips. Provincial tourist
arrivals are counted by the number of trips taken by a foreign tourist e.g. the number of
trips for a tourist from the UK who visits three (3) provinces in South Africa will be counted
as three (3) to correctly report on trips for each province. It is for this reason that the total
number of tourists visiting provinces are higher than those reflected in the total tourist

38
arrivals from Stats SA, which their report captures the actual number of foreign tourists
into the country by considering one trip when tourists enter and leave South Africa.
Figure 23 below indicates that, in 2019, most international tourists visited Gauteng
(32.1%), followed by Limpopo (21.9%) and the Western Cape (19.6%). The three least
visited provinces were North West (6.0%), the Eastern Cape (4.1%) and Northern Cape
(1.2%). To increase the impact and benefit of international tourism, provincial marketing
agencies should continue to promote their respective provinces as destinations that offer
unique and diverse tourism experiences. Tourism planners should also consider
developing tourism products that would attract international tourists to the less visited
provinces or destinations.
Figure 23: Provincial share of tourist arrivals: 2019
Source: SA Tourism Performance Report: January-December 2019

39
CHAPTER FOUR: SOUTH AFRICA’S
DOMESTIC TOURISM PERFORMANCE
Domestic tourism plays a critical role in the success of any tourism destination and it
also forms the backbone of the sector. According to the Tourism Satellite Account (TSA)
released by Statistics South Africa (Stats SA), domestic tourism plays a critical role in
the tourism sector as it generates more than half the internal tourism revenue. South
Africa aims to increase the impact and spread of domestic tourism through multiple
marketing strategies, product development and packaging, and niche market creation.
The National Tourism Sector Strategy key pillars include the key elements that will drive
the development and growth of the domestic market.
The Department of Tourism developed a Domestic Tourism Strategy in 2012, to increase
domestic tourism expenditure (revenue), domestic tourism volume, enhance measures
and efforts aimed at addressing seasonality and equitable geographical spread, and
enhance the level of the culture of tourism/travel among South Africans. The next section
of the report analyses the performance of South Africa’s domestic tourism.
4.1 Domestic Day and Overnight Trips: 2015-2019
Figure 24 below shows the number of domestic day and overnight trips taken during the
period 2015-2019. In 2016, overnight trips were 24.3 million, which was a decline of
-0.4% compared to 2015. In 2017, the total overnight domestic trips recorded was 17.2
million, which was a decrease of -29.2% compared to 2016. Comparing 2018 with 2017,
total overnight domestic trips increased by 2.8% resulting in a total of 17.6 million
overnight domestic trips in 2018. In 2019, overnight domestic trips increased by 61.3%
compared to 2018. Domestic day trips also follow the same trend with an increase from
a total of 116, 0 million trips in 2018 to 236,5 million trips in 2019, which was a positive
growth of 103,9% as reported by SA Tourism.

40
Figure 24: Number of Domestic Trips (millions): 2015-2019
Source: SAT Tourism Provincial data cuts 2019
4.2 Domestic Tourism Purpose of Visit and length of Stay
In 2019, the majority (60,3%) of domestic tourists travelled for the main purpose of
visiting friends and relatives (VFR) followed by holiday (28,4%), religion (6,0%), business
(3,0%) and medical (1,7%).
Figure 25: Purpose of Visit Share: 2019 compared to 2018
Source: SAT Tourism Provincial data cuts 2019

41
4.3 Domestic Spend: 2019
The figure below gives the domestic tourism spend for the period 2015 to 2019. Domestic
tourism spend increased from about R23.6 billion in 2015 to R26.5 billion in 2016, that
was an increase of about 12.3%. Domestic tourism spend decreased in 2017 by -
16.6% (R4.4 billion) compared to 2016. Comparing 2018 with 2017, total domestic spend
was R26.4 billion, which was an increase of 19.5% (R4.3 billion). In 2019, domestic
tourism spend increased by 66.3%, from R26.4 billion in 2018 to R43.9 billion in 2019.
Figure 26: Total Domestic Spend: 2015-2019
Source: SAT Tourism Provincial data cuts 2019
Figure 27 below shows the share of domestic spend and average spend by domestic
tourists’ purpose of visit for the period 2019. The results indicate that domestic tourists
who travel for holiday purposes contributed 39% to the total domestic spend, followed
by VFR (38%), business (13%), religion (3%) and medical (1%). The average spend by
purpose of visit shows that domestic tourists travelling for business spend on average
more (R3 541), followed by holiday (R2 447) and VFR (R1 102). Travelling for medical
and religious purposes tend to generate the least average spend per trip of R814 and
R746 respectively.

42
These figures indicate the potential of generating greater revenue through holiday and
business travel as domestic tourists traveling for these purposes tend to spend more.
Furthermore, there is a huge potential that lies within the VFR market as this category
contributes more to the volume of domestic trips. Travellers could be encouraged to take
holiday trips and introduced to more tourist activities, thereby generating more spending
during their visitation period.
Figure 27: Share of domestic spend by purpose of visit and average spend by
purpose: 2019
Source: SA Tourism Performance Report: January-December 2019
4.4 Provincial share of domestic trips: 2019
The provincial distribution of domestic tourism trips for 2019 is indicated in table 17
below. Domestic tourists travelled more to Gauteng (20.3%), KwaZulu-Natal (18.8%),
Western Cape (13.5%) and Limpopo (12.7%) in 2019. Provinces that received less than
10% of domestic trips were Mpumalanga (7.7%), North West (7.3%), Eastern Cape
(6.4%) and Northern Cape (2.6%). These results indicate that domestic tourism
campaigns should focus largely on marketing the less visited provinces in order to
achieve a fair geographical spread of tourists across provinces.

43
Table 16: Provincial distribution of domestic trips: 2019
Province % Share
Gauteng 20,3%
KwaZulu-Natal 18,8%
Western Cape 13,5%
Limpopo 12,7%
Free State 10,7%
Mpumalanga 7,7%
North West 7,3%
Eastern Cape 6,4%
Northern Cape 2,6% Source: SAT Tourism Provincial data cuts 2019
4.5 Top three (3) spenders by destination province: 2019
The table below shows the top three provincial spenders in the nine provinces. Gauteng
was the top spender in most provinces except in Northern Cape and Eastern Cape. The
data also show that the province of destination is also one of the top three spenders.
Table 17: Top spenders by destination province: 2019
Destination Top Spender
Eastern Cape Eastern Cape
Free State
Kwazulu-Natal
Free State Free State
Gauteng
North west
Gauteng Gauteng
Limpopo
Kwazulu-Natal
Kwazulu-Natal Kwazulu-Natal
Gauteng
Mpumalanga
Limpopo Limpopo
Gauteng
North West
Mpumalanga Mpumalanga
Gauteng
Limpopo
Northern Cape Northern Cape
Free State
North west
North west Gauteng
North west
Mpumalanga
Western Cape Western Cape

44
Gauteng
Eastern Cape Source: SAT Tourism Provincial data cuts 2019
4.6 Reasons for not traveling: 2019
The figure below provides reasons as to why fewer domestic trips were taken in 2019.
As observed, 30.6% could not afford to travel, 20.9% had no reason to travel, 19.6%
indicated that they were unemployed or had no income, 13.7% indicated time constraints
and about 9.9% disliked traveling. According to the latest TSA results released by Stats
SA (2019), preliminary figures for 2018 show that domestic tourism (R 153 196 million)
contributed 56% to total tourism expenditure (R273 233 million), which was more than
inbound tourism (R121 400 million). An improvement in the performance of domestic
tourism in South Africa could therefore lead to a possible increase in the contribution of
tourism to the country’s GDP and an increase in the number of jobs created by the
sector. Locally based service providers could therefore encourage cost-effective
travelling packages for those who cannot afford to travel based on the prices of current
packages.
Figure 28: Percentage share of reasons for not taking a domestic trip: 2018
Source: SAT Tourism Provincial data cuts 2019

45
4.7 Integration of Domestic Tourism Surveys in South Africa
There are two main sources for domestic tourism performance statistics in the country,
namely; the SA Tourism Domestic Tourism Survey and the Stats SA Domestic Tourism
Survey. The two separate surveys are conducted for different purposes and use different
methodologies, which are highlighted in table 19 below, thereby causing considerable
confusion amongst users of domestic tourism statistics. To remedy this situation, it was
agreed that the two surveys would be aligned and integrated into a single Domestic
Tourism Survey (DTS) that would serve both Stats SA, SA Tourism and other key
stakeholders within the tourism sector. The integration of the two surveys is still
underway and is envisaged that SA Tourism will then discontinue their DTS going
forward once the harmonisation process is completed. The table below indicates the
difference between these two surveys. Most of the work done by the Department with
regards to domestic tourism uses results from SA Tourism hence the analysis in chapter
four above is based on SA Tourism DTS data.
Table 18: Summary of primary differences between Stats SA and SA Tourism
Domestic Tourism Surveys
Characteristic SA Tourism Stats SA
Type of Survey Household Household
Sample 15 594 persons/Adults (about 1300 per month)
28 000 households (continuous data collection and the 28 000 is divided into four quarters)
Respondents Adults: 18 years and above, respond to individual trips only
All ages and respondents can respond for other household members of all the age groups if they are not available during the interview.
Recall Period One-month recall period. (Respondent is asked about the trips taken in the previous month)
Up to three-month recall period but data collected monthly.
Characteristics of trips
SA Tourism collect detailed information for each trip undertaken (day/night)
Stats SA only collect detailed information for the most recent trip taken in three months under review when data is collected.
Reporting Annual Report Quarterly reports
Annual report Bi-annual report
46
CHAPTER FIVE: GLOBAL TOURISM
ECONOMIC IMPACT
The tourism sector has made a significant contribution to the world economy over the years
by contributing towards economic development and job creation. Countries across the world
have become dependent on the tourism sector for improving their economies including South
Africa. This section of the report details the value of the tourism sector to the global economy
by analysing key indicators which include the contribution of tourism to the global Gross
Domestic Product (GDP) and global total employment for the period 2013-2019. The figures
reported in this section are primarily sourced from the World Travel and Tourism Council
(WTTC). Forecasted data from the WTTC for 2030 has also been included in the analysis.
5.1 Travel and Tourism’s Total Contribution to Gross Domestic
Product: 2013- 2019
According to the World Travel and Tourism Council (WTTC, 2020), the total contribution of the
travel and tourism sector to the global economy was about US$8 572,4 billion in 2018 (10.2%
of global GDP) and it went up to US$8 875,5 billion in 2019 as indicated in figure one below.
Forecasted data for 2030 from WTTC indicates that travel and tourism’s total contribution to
GDP will be US$13 043,3 billion (11.3% of global GDP), which will increase by 3.7%.

47
Figure 29: Travel and Tourism sector total contribution to GDP 2013-2019 and forecast for 2030
2013 2014 2015 2016 2017 2018 2019 2030F
Share of GDP 9,5% 9,6% 9,8% 9,9% 10,0% 10,2% 10,3% 11,3%
Note: Real prices Source: WTTC World Report 2020 and excel data sheet, downloaded May2020
5.2 Travel and Tourism’s Direct Contribution to Gross Domestic
Product: 2013-2019 and forecasted data for 2030
Figure 30 below shows that the travel and tourism sector’s direct contribution to GDP was
about US$2 674,1billion (3.2% of global GDP) in 2018 and increased to US$2 766,7billion
(3.2% of GDP) in 2019. The direct contribution of the Travel and Tourism sector is estimated
to have grown by 3.5% from 2018 to 2019 globally. In 2030, WTTC forecasts that the travel
and tourism sector’s direct contribution to GDP will be US$4 012,7billion (3,5% of GDP). The
travel and tourism sector will continue to play a significant role in the global economy.
According to WTTC, “the travel and tourism sector has become a critical engine of economic
development for many countries and can also be used as a vehicle for sharing cultures and
building mutual understandings” (WTTC, 2020).

48
Figure 30: Travel and Tourism Sector’s Direct Contribution to GDP 2013-2019 and
forecasts for 2030
2013 2014 2015 2016 2017 2018 2019 2030F
Share of GDP 2,9% 3,0% 3,1% 3,1% 3,1% 3,2% 3,2% 3,5% Note: Real prices
Source: WTTC World Report 2020 and excel data sheet, downloaded May. 2020
5.3 Total Contribution of Travel & Tourism to employment: 2013-
2019 and forecasts for 2030
According to the WTTC, the travel and tourism sector’s growth in GDP has enabled job
creation (WTTC, 2020). Figure 31 below indicates that globally, the total contribution of the
travel and tourism sector to employment was about 324,208,000 jobs (10.3% of total
employment) in 2018 and went up to 329,578,000 jobs in 2019 (10.4% of total employment).
The travel and tourism sector’s total contribution to employment increased by 1.7% during this
period. By 2030, the travel and tourism sector’s total contribution to employment is expected
to generate a total of 424,542,000 jobs, which will contribute about 11.8% towards total
employment.
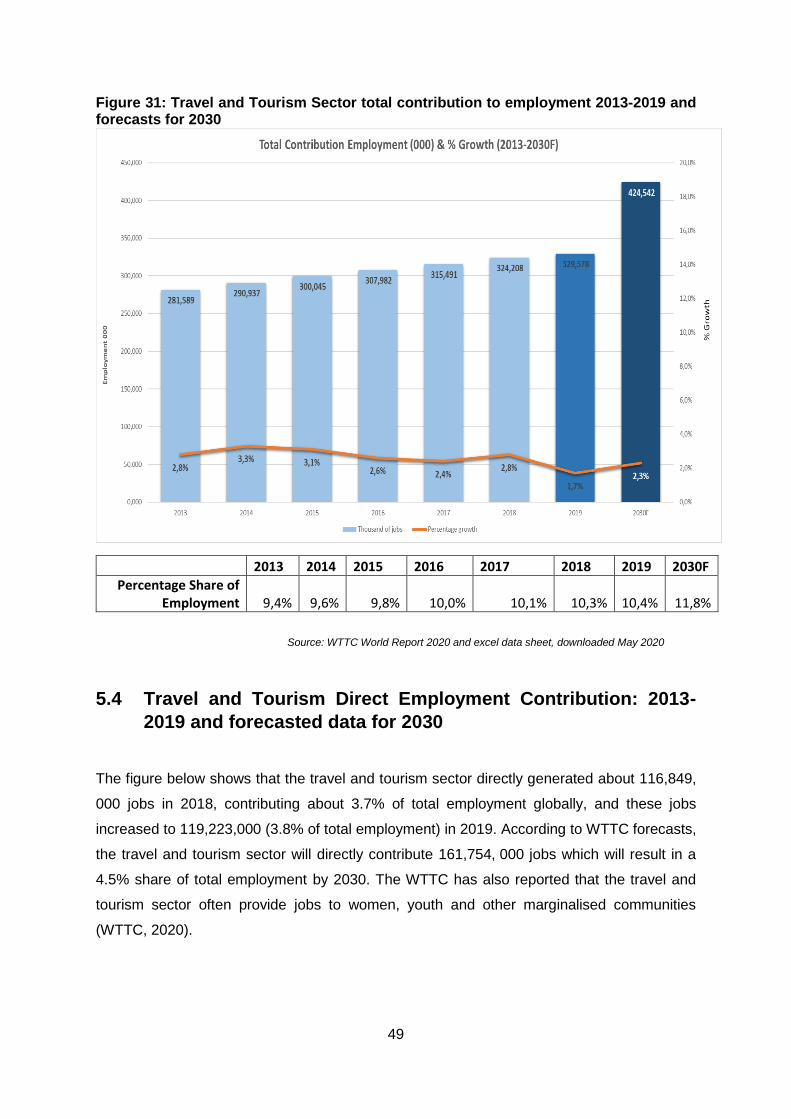
49
Figure 31: Travel and Tourism Sector total contribution to employment 2013-2019 and forecasts for 2030
2013 2014 2015 2016 2017 2018 2019 2030F
Percentage Share of Employment 9,4% 9,6% 9,8% 10,0% 10,1% 10,3% 10,4% 11,8%
Source: WTTC World Report 2020 and excel data sheet, downloaded May 2020
5.4 Travel and Tourism Direct Employment Contribution: 2013-
2019 and forecasted data for 2030
The figure below shows that the travel and tourism sector directly generated about 116,849,
000 jobs in 2018, contributing about 3.7% of total employment globally, and these jobs
increased to 119,223,000 (3.8% of total employment) in 2019. According to WTTC forecasts,
the travel and tourism sector will directly contribute 161,754, 000 jobs which will result in a
4.5% share of total employment by 2030. The WTTC has also reported that the travel and
tourism sector often provide jobs to women, youth and other marginalised communities
(WTTC, 2020).

50
Figure 32: Travel and Tourism Sector’s Direct Contribution to Employment 2013-2019
and forecasts for 2030
2013 2014 2015 2016 2017 2018 2019 2030F
Percentage Share of Employment 3,4% 3,5% 3,6% 3,6% 3,7% 3,7% 3,8% 4,5%
Note: Real prices
Source: WTTC World Report 2020 and excel data sheet, downloaded May, 2020
5.5 Travel and Tourism performance compared to other sectors:
GDP growth
Figure 33 below gives the global GDP growth of the different sectors for the period 2019. Data
from WTTC indicates that the Information and communication sector led GDP growth with an
increase of 4.8%. The travel and tourism sector’s growth was 3.5%, which was higher than
the construction sector (2.1%) and the retail and wholesale sector (2.4%).

51
Figure 33: Global Gross Domestic Product growth by Sector: 2019
Source: WTTC World Report 2020

52
CHAPTER SIX: GLOBAL TOURISM
PERFORMANCE
This section covers global performance of the tourism sector by analysing key indicators such
as tourist arrivals tourism receipts, tourism expenditure and key tourism outbound markets.
The data was mainly sourced from the UNWTO Tourism Barometer: Volume 18, Issue 2 of
May 2020.
6.1 GLOBAL TOURIST’S ARRIVALS: 2017 TO 2019
The following section compares the trends of global tourist arrivals for the period 2015 to 2019,
as reported by the UNWTO. Figure 34 below indicates that there was a total of 1.5 billion
global tourist arrivals recorded in 2019, which was an increase of 3.8% (54 million) compared
to 2018 (1.4 billion). The highest growth of 7.5% was in 2017, where tourist arrivals increased
from 1.2 billion in 2016 to 1.3 billion in 2017.
Figure 34: Global Tourist Arrivals: 2017-2019
Source: UNWTO World Tourism Barometer, May 2020

53
6.2 Global Tourist Arrivals by Region: 2018-2019
The table below shows tourist arrivals by region for the period 2018-2019. All regions had an
increase in international tourist arrivals. Middle East had the highest growth (6.8%), followed
by Africa (6.4%), Europe (4,0%), Asia and the Pacific (3,7%) and Americas (2.0%). The
statistics indicate that in 2019, tourist arrivals in Europe exceeded the 700 million mark, with
a share of 50.9% of the total global tourist arrivals (UNWTO, May 2019). Preliminary data from
UNWTO indicates that Africa’s growth was mainly driven by countries in North African region
such as Tunisia, with a double digit growth (13,6%) in tourist arrivals in 2019.
Table 19: Global arrivals by region 2019 compared to 2018
Region 2019 2018
% Change Share of Total (%) Million
World 1 462 1 408 3,8% 100%
Europe 744,3 715,9 4,0% 50,9%
Asia and the Pacific 360,6 347,7 3,7% 24,7%
Americas 220,2 215,9 2,0% 15,1%
Africa 73,2 68,8 6,4% 5,0%
Middle East 64,2 60,1 6,8% 4,4%
Source: World Tourism Barometer, May 2020
6.3 Top Global destinations by region: 2018
The figure below shows the top five destinations for international tourists by region for the
period 2018. Data sourced from UNWTO for 2019 is incomplete.
Table 20: Global Tourist Arrivals by Region: 2018
World Country Arrivals Americas Country Arrivals
1 France 89 400 1 USA 79 746
2 Spain 82 808 2 Mexico 41 313
3 USA 79 746 3 Canada 21 134
4 China 62 900 4 Argentina 6 942
5 Italy 61 567 5 Brazil 6 621
Europe Country Arrivals Africa Country Arrivals
1 France 89 400 1 Morocco 12 289
2 Spain 82 808 2 South Africa 10 472
3 Italy 61 567 3 Tunisia 8 299
4 Turkey 45 768 4 Mozambique 2 743
5 UK 36 316 5 Zimbabwe 2 567

54
Asia and the Pacific Country Arrivals Middle East Country Arrivals
1 China 62 900 1 UAE 15 920
2 Thailand 38 178 2 Saudi Arabia 15 352
3 Japan 31 192 3 Egypt 11 346
4 Hong Kong 29 263 4 Bahrain 4 367
5 Malaysia 25 832 5 Jordan 4 150 Source: World Tourism Barometer, May 2020
According to UNWTO 2020, the top destinations in the world for 2018 was France, followed
by Spain and the USA. France was also the top destination to travel to in the Europe region
in 2018. In Asia and Pacific region, China was the top destination, followed by Thailand and
Japan. In Africa, the top destination for global tourists was Morocco followed by South Africa.
The top destination in the Middle East region was UAE (United Arab Emirates), followed by
Saudi Arabia. Destinations need to remain competitive but at the same time be able to meet
the Sustainable Development Goals (SDGs) that aim for a better future for all (UNWTO, 2020).
6.4 International tourism expenditure by top ten countries for the
period 2019 compared to 2018
Table below indicates the top ten (10) source markets by expenditure for the period 2018-
2019.
Table 21: Top ten (10) source markets by expenditure for the period 2018-2019
2019 2018
Countries USD$ billion Percent Change
2018 2019 Real terns Actual
Position
1 1 China 277,3 245,6 -4,2% -11,4%
2 2 United States 144,5 152,3 5,4% 5,4%
3 3 Germany 95,6 91,9 1,4% -3,9%
4 4 United Kingdom 69,0 71,1 7,7% 3,0%
5 5 France 47,9 50,2 10,6% 4,8%
6 6 Australia 37,0 36,2 5,3% -2,2%
7 9 Russian Federation 34,3 36,2 5,5% 5,5%
8 8 Canada 34,4 34,8 3,5% 1,2%
9 7 Korea 35,1 32,3 -8,1% -8,0%
10 10 Italy 30,1 30,5 6,7% 1,3% Source: World Tourism Barometer, May 2020

55
According to UNWTO, China was the top spender globally in 2019 and 2018, with a total
spend of US$245.6 billion in 2019, which was almost one fifth of the total tourism spending. In
real terms, France had the highest expenditure growth of 10.6%. The Russian Federation
moved from 9th position in 2018 to the 7th position in 2019 with a total spend of US$36.2, while
Korea dropped from 7th position in 2018 to 9th position in 2019. The growth in international
tourism expenditure reported by countries for the period 2019 reflected an increasing demand
from major source markets, which is consistent with the 3.8% growth in international arrivals
recorded for the same period under review (UNWTO, 2020).
6.5. International tourism receipts: 2018 to 2019
International tourism receipts are defined as the amount that a country earns from tourists
visiting a region (UNWTO, 2018). Total international tourist receipts by region for 2018
compared to 2017 are indicated in the figure below.
Figure 35: International Tourism receipts
Regions Percent Change
Real terms Actual numbers 2019 % Share
Europe 4,0% 0,9% 50,9%
Asia and the Pacific 3,7% 1,7% 24,7%
Americas 2,0% 1,4% 15,1%
Middle East 6,8% 9,9% 4,4%
Africa 6,4% 1,8% 5,0%
World 3,8% 1,8% 100% Source: World Tourism Barometer, May 2020

56
The total international tourism receipts generated in 2019 went up by 3.8% in real terms, which
was an amount of about US$ 1 480 billion in 2019 compared to US$ 1 454 billion in 2018.
Europe received US$574.2 billion receipts with an increase of 4.0% (in real terms), followed
by Asia and the Pacific with US$443.8 billion, that was an increase of 3.7% (in real terms).
The Americas had an increase of 2.0% (in real terms), which amounts to US$342.6 billion in
2019 compared to 2018. The Middle East received US$80.0 billion, having the highest
increase of about 6.8% (in real terms), Africa received US$31.9 billion with an increase of
4.6% (in real terms).
6.6 Top 10 countries by international tourist receipts and
international tourist arrivals: 2018-2019
Table 22: Top Ten countries
2019 2018 Countries
USD$ billion 2019 Inbound Arrivals
(millions) 2018 2019 Position
1 1 United States 214,7 214,1 79,3
2 2 Spain 81,5 79,7 83,7
3 3 France 65,5 65,4 4 4 Thailand 56,4 60,5 39,8
5 6 United Kingdom 48,6 49,9 6 5 Italy 49,3 49,8 64,5
7 9 Japan 42,1 46,1 32,2
8 7 Australia 45,0 46,0 9,5
9 8 Germany 43,0 41,6 39,6
10 10 Macao (China) 40,7 39,5 65,7
Source: World Tourism Barometer, May 2020
Table 22 above indicates the top 10 earners for 2018 and 2019. In 2019, the four (4) best
performing countries in relation to tourism receipts were the USA (US$214.1 billion), Spain
(US$79.7 billion), France (US$65.4 billion) and Thailand (US$60.5 billion). The United
Kingdom moved from the 6th position in 2018 to the 5th position in 2019 and Japan moved from
9th position in 2018 to 7th position in 2019. Italy dropped one position from 5th position in 2018
to 6th position in 2019, including Germany from 8th position in 2018 to 9th position in 2019. The
UNWTO also reported that the top ten tourism earners for 2018 accounted for almost 50% of
total tourism receipts (UNWTO, 2020). The table also aims to indicate whether there is a
relationship between tourist arrivals and tourism receipts. When comparing countries that
were the highest earners for international tourism receipts to the top 10 inbound destinations,

57
the results indicate that there may be no relationship between international receipts earned
and inbound arrivals to a destination, however, this needs more statistical testing to be
concluded. In 2019, Thailand was ranked 4th and Italy 6th for total international tourists’ receipts
earned. However, Italy received more tourist arrivals than Thailand for the period. Similarly,
China received more tourist arrivals in comparison to Thailand, Italy, Germany and Japan but
is ranked lower than these countries in terms of the total international tourism receipts earned
in 2019.

58
CHAPTER SEVEN: GLOBAL TOURISM
RELATED INDUSTRIES’ PERFORMANCE
This section provides an overview of the global tourism-related industries’ performance,
focusing mainly on the global hotels, passengers and aircrafts movements and the meetings
industry. Data for this section was sourced from the UNWTO Barometer March/April 2018, the
International Airports Transport Association (IATA), the International Congress and
Convention Association (ICCA) and the Hotel News.
7.1 Global hotel industry performance: 2018-2019
The data for the performance of the hotel industry was sourced from Hotel News. The global
performance of the hotel industry by region for 2019 and 2018 is indicated in the table below.
Table: 23 Hotel performance indicators, 2019 compared to 2018
Region
Occupancy rate (%) Average Daily Rate (ADR) Revenue per available room (RevPAR) US$
2018 2019 % Change
US$ 2018
US$ 2019 % change
US$ 2018
US$ 2019
% Change
Asia and the Pacific
70,2% 68,7% -2,1% 100,7 98,7 -2,0% 70,7 68,4 -3,2%
Americas 65,7% 65,6% -0,2% 130,4 130,5 0,1% 85,7 85,7 -0,05%
Europe 72,0% 72,2% 0,3% 127,4 129,7 1,8% 91,7 93,7 2,2%
Africa & Middle East
63,0% 64,3% 2,1% 136,1 130,8 -3,9% 85,8 84,1 -2,0%
Source: Hotel News, 2020
Occupancy rate is one of the key indicators used to monitor the performance of a hotel, since
the indicator measures the percentage of available rooms in a hotel that was sold during a
specified period of time. Most regions recorded a decrease in occupancy rate except for Africa
and the Middle East having an increase of 2.1% during this period. Another key indicator used
to measure hotel performance is the Average Daily Rate (ADR) which provides the average
rate paid for rooms sold and is calculated by dividing room revenue by rooms sold. Europe
recorded the highest increase (1.8%) followed by Americas with a slight increase of 0.1% in
2019 compared to 2018.

59
Finally, the Revenue per available room (RevPar) is a measure that the hotel industry uses to
determine the revenue generation capability of a hotel. The RevPar is calculated by dividing
the total room revenue with the total number of available rooms in a hotel. RevPar differs from
the ADR in that the RevPAR is affected by the share of unoccupied available rooms, while
ADR shows only the average rate of rooms actually sold (UNWTO, 2019). Most regions
recorded a decline in RevPar, with Asia and the Pacific having the highest decline of -3.2%
followed by Africa and Middle East (-2.0%) and Americas (-0.05%). Europe was the only
region to record an increase of 2.2% in RevPar for the period under review.
Leading Hotel Companies as of June 2019
The table below shows the top ten global hotel companies according to number of properties
as of June 2019. The global hotel chain, Wyndham Hotel Group, leads the ranking of the top
hotel companies by a total of 9 157 properties. Choice Hotels International and Marriot
International recorded 7,045 and 7,003 properties respectively.
Table 24: Leading hotel companies worldwide as of June 2019
Rank Name Number of properties
1 Wyndham Hotel Group 9 157
2 Choice Hotels International 7 045
3 Marriot International 7 003
4 Hilton Worldwide 5 872
5 Intercontinental Hotels Group (IHG) 5 656
6 Best Western Hotels and Resorts 4 008
7 G6 Hospitality 1 391
8 Radisson Hotel Group 1 179
9 RLH Hotel Group 1 179
10 Hyatt Hotels Corp 865 Source: Statista, 2019
AirBnB Performance
The Figure below indicates the global performance of Airbnb. In 2018, AirBnB reported that
a total revenue of US$3.6 billion was generated which was an increase of 38% compared to
2017.There was a total of 14 384 Airbnb employees in 2018 (Stratos, 2020). There were
more than 100 000 cities with Airbnb listing as of January 2020. Globally, Airbnb had also
recorded a total of 10.4 million guests that stayed in Airbnb during December 2019.

60
Figure 36: Airbnb Performance
Source: Property Management, 2019
The figure below indicates the global performance of Airbnb by retail value for the period 2014-
2019. In 2019, the retail value of the Airbnb industry was a total of USD38 billion, which was
a growth of 60% compared to USD24 billion in 2018.
Figure 37: Retail value of Airbnb: 2015-2019
Source: Euromonitor, 2020

61
7.2 Air Transport: 2018-2019
Transportation has been identified as one of the key industries related to tourism since tourists
require transportation to travel to many destinations across the world.
7.3 Top 20 international megahubs: 2019
OAG, of whom is a provider of digital flight information, intelligence and analytics for airports,
and airlines has developed a connectivity index, which measures the ratio of scheduled seat
capacity to the number of destinations served (OAG, 2012). Table 25 below indicates the top
20 international megahub airports in 2019 with the highest connectivity index. The most
internationally connected airport in the world, in 2019, was London Heathrow (LHR) with a
connectivity index of 317 followed by Germany Frankfurt (FRA) that was ranked in 2nd place,
USA O’Hare (ORD) and Amsterdam Airport (AMS) were ranked as the 3rd and 4th most
connected airports respectively.
Table 25 Top 20 International Megahubs: 2019
RANK AIRPORT COUNTRY CONNECTIVITY INDEX
DOMINANT CARRIER
SHARE OF FLIGHT AT HUB
1 LHR United Kingdom
317 British Airways 51%
2 FRA Germany 309 Lufthansa 63%
3 ORD USA 290 United Airlines 46%
4 AMS Netherlands 279 KLM-Royal dutch Airlines
52%
5 MUC Germany 259 Lufthansa-German Airlines
59%
6 YYZ Canada 251 Air Canada 59%
7 CDG France 250 Air France 50%
8 ATL USA 247 Delta Air Lines 79%
9 SIN Singapore 240 Singapore Airlines
24%
10 HKG Hong Kong (SAR) China
234 Cathay Pacific Airways
26%
11 ICN Korea republic of
233 Korean Air 23%
12 KUL Malaysia 229 Air Asia 41%
13 LAX USA 219 American Airlines
22%
14 BKK Thailand 214 Thai Airways International
20%
15 MEX Mexico 191 Aeromexico 43%
16 CGK Indonesia 191 Garuda Indonesia
26%
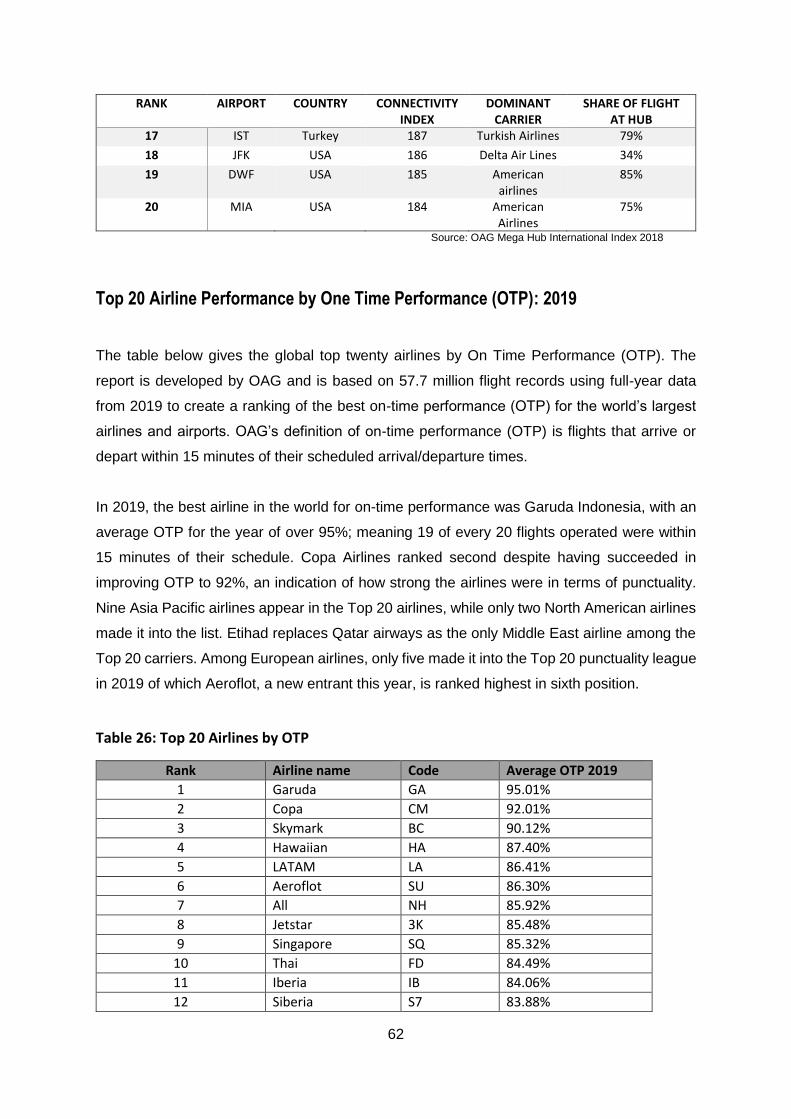
62
RANK AIRPORT COUNTRY CONNECTIVITY INDEX
DOMINANT CARRIER
SHARE OF FLIGHT AT HUB
17 IST Turkey 187 Turkish Airlines 79%
18 JFK USA 186 Delta Air Lines 34%
19 DWF USA 185 American airlines
85%
20 MIA USA 184 American Airlines
75%
Source: OAG Mega Hub International Index 2018
Top 20 Airline Performance by One Time Performance (OTP): 2019
The table below gives the global top twenty airlines by On Time Performance (OTP). The
report is developed by OAG and is based on 57.7 million flight records using full-year data
from 2019 to create a ranking of the best on-time performance (OTP) for the world’s largest
airlines and airports. OAG’s definition of on-time performance (OTP) is flights that arrive or
depart within 15 minutes of their scheduled arrival/departure times.
In 2019, the best airline in the world for on-time performance was Garuda Indonesia, with an
average OTP for the year of over 95%; meaning 19 of every 20 flights operated were within
15 minutes of their schedule. Copa Airlines ranked second despite having succeeded in
improving OTP to 92%, an indication of how strong the airlines were in terms of punctuality.
Nine Asia Pacific airlines appear in the Top 20 airlines, while only two North American airlines
made it into the list. Etihad replaces Qatar airways as the only Middle East airline among the
Top 20 carriers. Among European airlines, only five made it into the Top 20 punctuality league
in 2019 of which Aeroflot, a new entrant this year, is ranked highest in sixth position.
Table 26: Top 20 Airlines by OTP
Rank Airline name Code Average OTP 2019
1 Garuda GA 95.01%
2 Copa CM 92.01%
3 Skymark BC 90.12%
4 Hawaiian HA 87.40%
5 LATAM LA 86.41%
6 Aeroflot SU 86.30%
7 All NH 85.92%
8 Jetstar 3K 85.48%
9 Singapore SQ 85.32%
10 Thai FD 84.49%
11 Iberia IB 84.06%
12 Siberia S7 83.88%
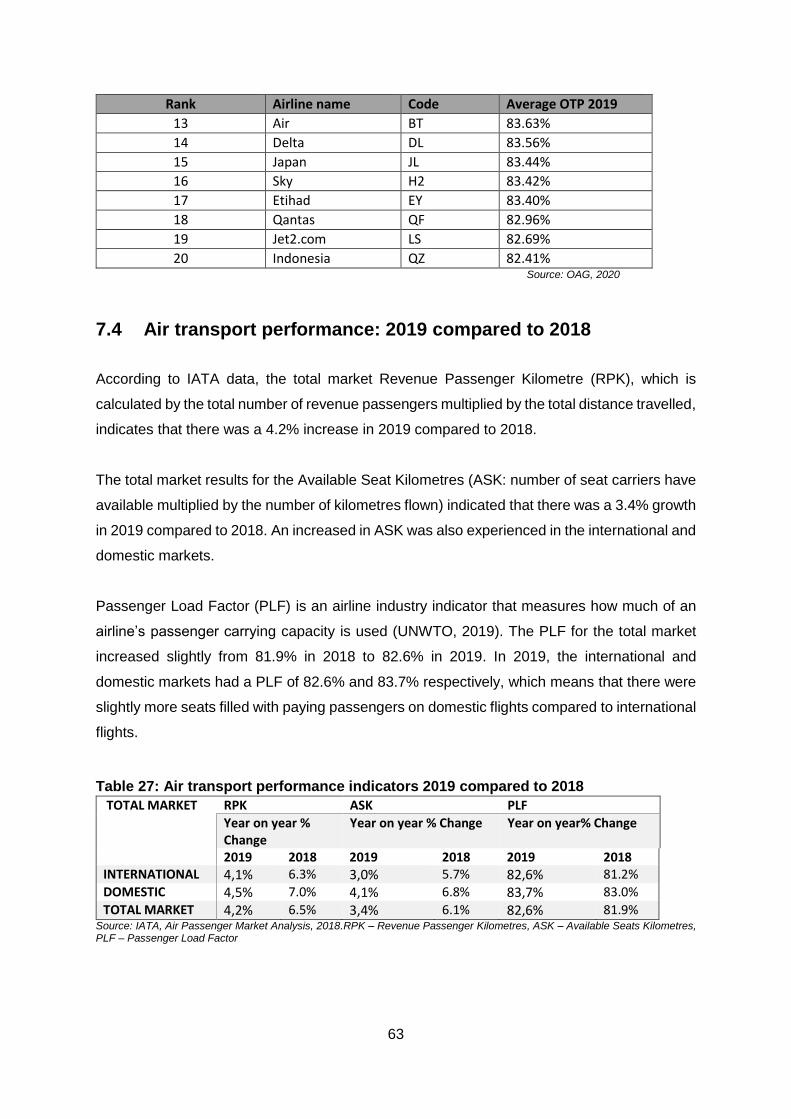
63
Rank Airline name Code Average OTP 2019
13 Air BT 83.63%
14 Delta DL 83.56%
15 Japan JL 83.44%
16 Sky H2 83.42%
17 Etihad EY 83.40%
18 Qantas QF 82.96%
19 Jet2.com LS 82.69%
20 Indonesia QZ 82.41% Source: OAG, 2020
7.4 Air transport performance: 2019 compared to 2018
According to IATA data, the total market Revenue Passenger Kilometre (RPK), which is
calculated by the total number of revenue passengers multiplied by the total distance travelled,
indicates that there was a 4.2% increase in 2019 compared to 2018.
The total market results for the Available Seat Kilometres (ASK: number of seat carriers have
available multiplied by the number of kilometres flown) indicated that there was a 3.4% growth
in 2019 compared to 2018. An increased in ASK was also experienced in the international and
domestic markets.
Passenger Load Factor (PLF) is an airline industry indicator that measures how much of an
airline’s passenger carrying capacity is used (UNWTO, 2019). The PLF for the total market
increased slightly from 81.9% in 2018 to 82.6% in 2019. In 2019, the international and
domestic markets had a PLF of 82.6% and 83.7% respectively, which means that there were
slightly more seats filled with paying passengers on domestic flights compared to international
flights.
Table 27: Air transport performance indicators 2019 compared to 2018
TOTAL MARKET RPK ASK PLF
Year on year % Change
Year on year % Change Year on year% Change
2019 2018 2019 2018 2019 2018 INTERNATIONAL 4,1% 6.3% 3,0% 5.7% 82,6% 81.2%
DOMESTIC 4,5% 7.0% 4,1% 6.8% 83,7% 83.0%
TOTAL MARKET 4,2% 6.5% 3,4% 6.1% 82,6% 81.9% Source: IATA, Air Passenger Market Analysis, 2018.RPK – Revenue Passenger Kilometres, ASK – Available Seats Kilometres, PLF – Passenger Load Factor

64
Global Top Ten Fast Food Brands: 2019
The figure below ranks the top ten fast food outlets worldwide in 2019 by brand value. Brand
value is based on the financial amount the brand is worth as stated on a balance sheet. In
2019, McDonald's was the most valuable fast food brand in the world with an estimated brand
value of about USD 30.4 billion followed by Starbucks (USD 45.9 billion) and KFC
(USD17.2billion).
Figure 38: Brand value of the 10 most valuable fast food brands worldwide in 2019 (in billion U.S. dollars)
Source: Statista, 2019
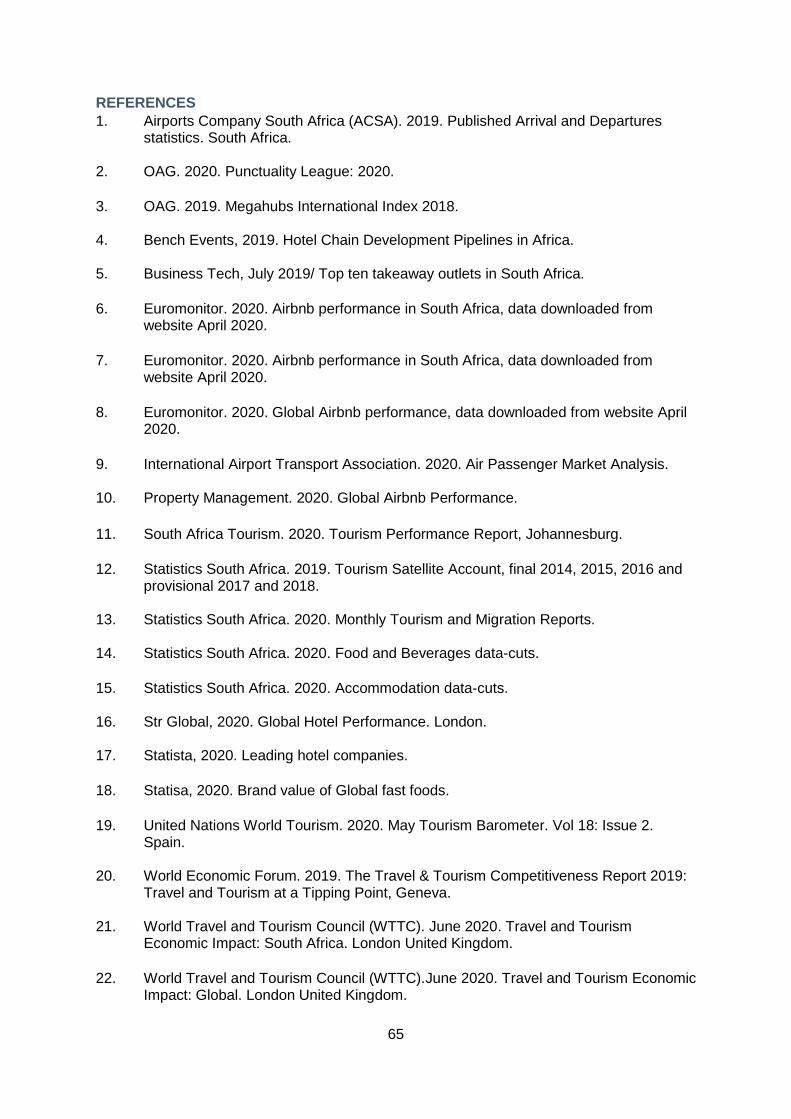
65
REFERENCES
1. Airports Company South Africa (ACSA). 2019. Published Arrival and Departures statistics. South Africa.
2. OAG. 2020. Punctuality League: 2020.
3. OAG. 2019. Megahubs International Index 2018.
4. Bench Events, 2019. Hotel Chain Development Pipelines in Africa.
5. Business Tech, July 2019/ Top ten takeaway outlets in South Africa.
6. Euromonitor. 2020. Airbnb performance in South Africa, data downloaded from website April 2020.
7. Euromonitor. 2020. Airbnb performance in South Africa, data downloaded from website April 2020.
8. Euromonitor. 2020. Global Airbnb performance, data downloaded from website April 2020.
9. International Airport Transport Association. 2020. Air Passenger Market Analysis.
10. Property Management. 2020. Global Airbnb Performance.
11. South Africa Tourism. 2020. Tourism Performance Report, Johannesburg.
12. Statistics South Africa. 2019. Tourism Satellite Account, final 2014, 2015, 2016 and provisional 2017 and 2018.
13. Statistics South Africa. 2020. Monthly Tourism and Migration Reports.
14. Statistics South Africa. 2020. Food and Beverages data-cuts.
15. Statistics South Africa. 2020. Accommodation data-cuts. 16. Str Global, 2020. Global Hotel Performance. London. 17. Statista, 2020. Leading hotel companies.
18. Statisa, 2020. Brand value of Global fast foods.
19. United Nations World Tourism. 2020. May Tourism Barometer. Vol 18: Issue 2. Spain.
20. World Economic Forum. 2019. The Travel & Tourism Competitiveness Report 2019:
Travel and Tourism at a Tipping Point, Geneva. 21. World Travel and Tourism Council (WTTC). June 2020. Travel and Tourism
Economic Impact: South Africa. London United Kingdom.
22. World Travel and Tourism Council (WTTC).June 2020. Travel and Tourism Economic Impact: Global. London United Kingdom.