Embed Size (px)
Citation preview

TABLE OF CONTENTS
INTRODUCTION
PUBLIC HEALTH INDICATORS
AIR QUALITY
Population Living in Areas Meeting Air Quality Standards
Common Air Pollutants
Ozone Levels Above 1-Hour Outdoor Air Quality Standard
Ozone Levels Exceeding 8-Hour Outdoor Air Quality Standard
Change in Emissions by Source Category
Vehicle Miles Traveled/Population and NOx
Public Transportation Use
HAZARDOUS MATERIALS EXPOSURE
Hazardous Waste Generated per Year
Reported Exceedances of Lead Poisoning Standard
Toxics Releases
DRINKING WATER QUALITY
Public Water Systems in Compliance
Surface Water Supply Systems with Source Protection Programs
Ground Water Systems with Wellhead Protection Programs
Municipal Waste Landfills in compliance with Ground Water Standards
Oil Contaminated Sites
WATER QUALITY (FISH AND SHELLFISH HARVESTING)
Shellfish Harvesting Waters
Maryland Waters Safe for Harvesting Finfish
ECOSYSTEM HEALTH INDICATORS
WATER QUALITY - ECOSYSTEM HEALTH
Designated Uses of Surface Waters
Dissolved Oxygen and Water Quality Impairment
Nutrient Inputs to Mainstem and Tributary Waters
Cropland Acres Under Nutrient Management Plans
Phosphorus Concentration in Maryland's Chesapeake Bay

Nitrogen Concentration in Maryland's Chesapeake Bay
Atmospheric Nitrogen Loading
Cropland Acres Under Integrated Pest Management
TIDAL AQUATIC SYSTEMS
Submerged Aquatic Vegetation Habitat Quality
Acres of Submerged Aquatic Vegetation
Benthic Index of Biotic Integrity - Chesapeake Bay
Fish Index of Biotic Integrity - Estuarine
Striped Bass Juvenile Index
American Shad Population
Blue Crab Population
Seed Oyster Production
NON-TIDAL AQUATIC SYTEMS
Miles of Streams Degraded by Abandoned Mine Drainage
Stream Miles Open to Migratory Fish
Physical Habitat Index (Non-Tidal)
Benthic Macroinvertebarate Index of Biotic Integrity (Non-Tidal)
Fish Index of Biotic Integrity (Non-Tidal)
Riparian Forest Buffers
TERRESTRIAL SYSTEM DEGRADATION, FRAGMENTATION, ISOLATION
Maryland Wetland Trends
Wetlands Restoration Initiative
Acres of Agricultural and Forest Lands
Protected Lands
Septic System Permits/Low Density Residential Development
Acres of Abandoned Mine Lands
Brownfields/Federal Facilities Approved for Redevelopment
Recycling Municipal Solid Waste
CONSERVATION OF BIOLOGICAL DIVERSITY
Forest Interior Breeding Bird Populations
Bald Eagle Population
Colonial Waterbird Population Trends
PUBLIC INTERFACE INDICATORS
PUBLIC UNDERSTANDING AND COMMUNITY SUPPORT
Envirothon Participants
Green Schools
Teaching Environmental Awareness in Maryland - TEAM DNR
ENVIRONMENTAL JUSTICE

PUBLIC COMMENTS TO PREVIOUS ENVIRONMENTAL INDICATORS STATUS REPORT
MARYLAND'S FY2000 ENVIRONMENTAL PARTNERSHIP AGREEMENT

INTRODUCTION
PUBLIC HEALTH INDICATORS
ECOSYSTEM HEALTHINDICATORS
PUBLIC INTERFACEINDICATORS
INTRODUCTION
A New State-Federal Partnership
This report is the second in a series that provides a concise characterization of some of Maryland's key environmental and public health conditions. The earlier report, issued in draft in 1997, was the first step in a strategic planning process through which the Maryland Departments of Environment (MDE) and Natural Resources (DNR) and the U.S. Environmental Protection Agency (EPA) have been redefining the federal-state relationship to promote a results-based approach to environmental protection issues. The resulting 1998 Environmental Performance Partnership Agreement (EnPA) and a subsequent one for Fiscal Year 1999, provide Maryland an important opportunity to refine environmental goals and outcomes, focus its programs toward results-based management, and improve the relationship between the State and EPA.
The EnPA process also helps fulfill Governor Parris N. Glendening’s mandate for improving state agency performance through the results-based strategic planning process known as Managing Maryland for Results. This process also is consistent with the directives that state agencies have received from the Maryland General Assembly to improve various units of measurement and to focus management towards environmental and public health outcomes.
For Maryland, broad programmatic goals for protection of public health and the natural environment may be defined by:
● Federal statutes, such as the Clean Water Act, Clean Air Act, Resource Conservation and Recovery Act, Superfund, Endangered Species Act, or Food Security Act;
● State statutes, such as the Critical Areas Act; Non-tidal Wetlands Protection Act; Lead Poisoning Prevention Act; Maryland Economic Growth, Resource Protection, and Planning Act; or the many sections of both the Environment and Natural Resources Article; and
● Executive Orders, executive policies, such as those ensuring Smart Growth, or directives from the Chesapeake Bay Executive Council.
The State is committed to achieving these goals through implementation of a variety of environmental protection, resource management, and public health protection programs. Using its strategic planning process, the State is evaluating progress toward meeting the goals established under this array of mandates, using a five-step process:
Step 1. Characterizing Maryland's environmental conditions using public and ecosystem health indicators related to the goals;
Step 2. Assessing the State's performance and effectiveness in addressing Maryland's environmental problems;
Step 3. Establishing priorities for targeting the State's resources needed to remedy problems
Step 4. Developing an annual workplan that spells out what actions the State and EPA will take in order to achieve the desired environmental outcomes; and,
Step 5. Implementing the workplan and evaluating its effectiveness.

Involving the Public. As Figure 1 (enpa_process.pdf) illustrates, the EnPA partners continue to seek broad stakeholder review and comment on the reports; they seek to engage a wide range of stakeholders, including environmental and public health advocacy groups, citizen groups, elected officials, agency advisory groups, business leaders, educators, scientists, natural resources users, among many others. The State is making the updated indicators document available to its stakeholders using a variety of outreach tools, which include direct mailings, State agency Internet Homepages (www.mde.state.md.us and www.dnr.state.md.us), public libraries, and organization newsletters, among others.
The Environmental Indicators
Background. Traditionally, government has used programmatic measures that focused on measuring and reporting activities related to, for example, issuing permits, inspecting industrial facilities, or counting the number of enforcement actions. While these measures are useful for making resource management decisions and for tracking personnel activity, their usefulness as measures of true environmental performance is very limited. Environmental performance indicators like the following more accurately portray the environmental and public health conditions in Maryland.
Environmental indicators describe and analyze scientifically-based information on environmental trends, conditions, and their significance. Indicators can simplify complex phenomena so that a reader may more easily understand what is happening in the environment. Use of environmental indicators to identify trends and conditions and assess their significance requires a strong commitment to long-term monitoring by local, state, and federal agencies. Such monitoring includes water quality and water quantity, aquatic and terrestrial biological species and communities, and atmospheric parameters. Monitoring is vital not only in describing trends and conditions, but also in describing and ranking existing and emerging problems, and in evaluating program effectiveness. Along with monitoring, it is critical that the State maintain accurate data bases and routinely evaluate the data to guide environmental management efforts and communicate status and trends.
Maryland has developed over 50 indicators that are organized into three broad categories: public health, ecosystem health, and interface with the public. These indicators provide a snapshot of the status of critical environmental and public health issues that Marylanders face today; however, it is not possible to include indicators for every environmental or health issue. Some important environmental or public health issues are not easy to capture in the context of an indicator. Information may simply be unavailable in some cases. However, the indicators presented in this report relay important information about some aspect of the environmental and public health protection issues facing the people of Maryland. These indicators also provide the kind of information of interest to government and the public, and will continue to be revised and updated in response to public input and stakeholder comments, as well as improved science and further environmental monitoring.
Presentation of Indicator Information. Several terms are used to discuss the indicators and the broad themes into which they have been grouped:
Goals are broad policy statements of desired outcomes and conditions (i.e., air that is safe to breathe,)
Indicators are units of measure that describe information on environmental trends or conditions relating to the goal,
Status is the current situation reflected by the indicator in relationship to the goal,
Stressors and sources refer to the underlying causes of the environmental condition,
Management Objectives describe the approach the State is taking to achieve the goal, and
Benchmarks present numerical or time-specific achievements used to measure progress toward meeting the goal, where these have been established through formal consultation, legislation or regulation.

INTRODUCTION
PUBLIC HEALTH INDICATORS
AIR QUALITY
HAZARDOUS MATERIALSEXPOSURE
DRINKING WATER QUALITY
WATER QUALITY(FISH AND SHELLFISH
HARVESTING)
ECOSYSTEM HEALTHINDICATORS
PUBLIC INTERFACEINDICATORS
PUBLIC HEALTH
The following section presents Maryland’s public health indicators. Most of these indicators first were presented in the 1997 report. In the public health area, researchers are challenged to demonstrate causal relationships between exposure to adverse environmental conditions and human health effects. For example, to analyze the effects of ozone levels on humans, scientists have used the number of hospital days for respiratory illness occurring on high-ozone days as an indicator of the relationship. Most often, epidemiological studies and statistical modeling are used to make the linkages between exposure and illness because it is very difficult to control for the large number of variables, such as:
● variability in data collection and reporting of hospital admissions, ● availability and effectiveness of health care among different socio-economic groups;● additive or synergistic health effects from exposure to pollutants or infectious agents,● differences in ozone exposure or dose due to geographic or demographic variations, etc.
While it is difficult to measure directly what changes in public health conditions result from environmental improvements or causes, it is reasonable to use reductions in emissions or ambient concentrations of pollutants known to adversely affect human health as indicators of improvements in conditions affecting public health.
The following indicators address public health protection issues related to ensuring that the air is safe to breathe, minimizing exposure to a variety of hazardous materials, protecting public drinking water, and assuring that fish and shellfish are safe to eat.

INTRODUCTION
PUBLIC HEALTH INDICATORS
AIR QUALITY
Population Living in Areas Meeting Air Quality Standards
Common Air Pollutants
Ozone Levels Above 1-Hour Outdoor Air Quality Standard
Ozone Levels Exceeding 8-Hour
Outdoor Air Quality Standard
Change in Emissions by Source Category
Vehicle Miles Traveled/Population
and NOx
Public Transportation Use
HAZARDOUS MATERIALSEXPOSURE
DRINKING WATER QUALITY
WATER QUALITY(FISH AND SHELLFISH
HARVESTING)
ECOSYSTEM HEALTHINDICATORS
PUBLIC INTERFACEINDICATORS
AIR QUALITY
The national ambient (outdoor) air quality standards are established for six common pollutants that are produced in substantial quantities throughout the country-ozone, carbon monoxide, sulfur dioxide (SO2),
particulate matter, oxides of nitrogen (NOx), and lead. The U.S. EPA has determined that these common pollutants have adverse health effects when outdoor air concentrations reach certain levels and has established the national standards at levels which protect public health and welfare with an adequate margin of safety. People who live in areas that meet federal air quality standards for a particular pollutant should suffer no adverse health effects from that pollutant.
Air pollution control programs have reduced most man-made air pollution substantially, and Maryland largely meets federal air quality standards, however studies show that maintaining these reductions and making further reductions in volatile organic compounds (VOC) and NOx will be necessary for Maryland to comply with the ozone standard. Exposure to ozone levels in the ambient air that are higher than the national standards for ozone has been linked to increased hospital admissions for respiratory ailments, such as asthma. Studies conducted in the northeastern United States and Canada show that ozone air pollution is associated with 10 to 20 percent of all the summertime respiratory-related hospital admissions. Repeated exposure to ozone can make people more susceptible to respiratory infection and lung inflammation, and can aggravate pre-existing respiratory diseases, such as asthma. Children run the greatest risk from exposure to ozone because they are active outside, playing and exercising during the summertime when ozone levels are at their highest.
Goal:
● Ensure the air is safe to breathe.
Stressors/Sources: Pollutant emission sources in Maryland and long range transport of pollutants from outside of Maryland affect Maryland's air quality. Emission reductions from sources in Maryland alone may not guarantee good air quality.
Sources of air pollution may be stationary and/or mobile. Ground-level ozone is formed from the chemical reaction of Volatile Organic Compounds (VOCs) and Nitrogen Oxides (NOx) in the presence of sunlight, especially when the temperature is over 90 degrees. The primary sources of VOC emissions are vehicle exhaust, paints and solvents, and industrial facilities. NOx is formed primarily as the result of combustion. Sources include power plants, industrial processes and vehicles. Levels of ground-level ozone are heavily influenced by meteorological conditions with the highest levels generally occurring during hot, stagnant weather patterns. Long-range transport of ozone-forming pollutants both from neighboring states and other areas of the country contributes to elevated levels of ozone in Maryland.
Carbon monoxide is primarily emitted by motor vehicles (cars, buses, and trucks) and some industrial processes. Sulfur dioxide is mostly emitted from industrial and utility sources. Particulate matter comes from industrial processes, motor vehicles, wood burning, and dust from roads, stockpiles, construction, and agricultural sites. Nitrogen oxides mostly result from burning fuels in utilities, industries, and motor vehicles. Lead is emitted by transportation sources using leaded fuels, coal combustion sources, and smelters. Lead emissions have dramatically decreased since 1980 due in large part to the elimination of the sale of leaded gasoline to the general public.
Management Objectives: Utilizing the most cost-effective methods for emissions controls in cooperation with other eastern states will ensure continued growth and prosperity in a healthful environment. These reductions are increasingly difficult to maintain as urban centers increase in population. As emissions controls become more stringent, the marginal cost of emissions reductions

increases and control technology becomes more complex. Control strategies include preventing and reducing emissions of air pollutants from industries, utilities, small businesses and mobile sources (e.g. automobiles) through a variety of regulatory and educational activities. Particular emphasis is given to steps to reduce formation of ozone, where standards are presently not met.
Because of the significance of automobiles as sources of VOC and NOx, much attention is focused on them. One approach, in support of the Governor's Smart Growth initiative, is to demonstrate the relationship between trends in vehicle miles traveled by Maryland citizens and trends in emissions of these pollutants, in order to make them aware of the effects of their daily travel habits. The educational approach continues with encouragement for citizens to investigate alternative ways to travel-car pooling, public transit, bicycling and walking-and to bring these considerations to bear on major decisions in their lives, like where to live and work and shop. Maryland's vehicle emissions inspection program (VEIP) takes a regulatory approach to emissions from individual automobiles.
The Indicators: These indicators focus on the results of Maryland's activities to ensure that the air is safe to breathe. We measure our progress in large part on federal health-based air quality standards. Maryland meets five of the six federal ambient air quality standards and is considered to be in attainment with respect to them. The exception is the low-level ozone standard.
The Air Quality indicators focus on changes in emissions by source category for ozone-forming compounds (VOC and NOx) and other common pollutants, days/number of times air pollution exceeds federal health-based air quality standards, and the percentage of Maryland population living in areas meeting federal air quality standards.
Because MDE has no authority over vehicle miles traveled, no benchmark is given for this indicator. The indicators are included here because they help to tell the story of air pollution and its causes and have a significant impact on the State's ability to meet its overall air quality goal through other means where authority is more clearly established.

INTRODUCTION
PUBLIC HEALTH INDICATORS
AIR QUALITY
Population Living in Areas Meeting Air Quality Standards
Common Air Pollutants
Ozone Levels Above 1-Hour Outdoor Air Quality Standard
Ozone Levels Exceeding 8-Hour
Outdoor Air Quality Standard
Change in Emissions by Source Category
Vehicle Miles Traveled/Population
and NOx
Public Transportation Use
HAZARDOUS MATERIALSEXPOSURE
DRINKING WATER QUALITY
WATER QUALITY(FISH AND SHELLFISH
HARVESTING)
ECOSYSTEM HEALTHINDICATORS
PUBLIC INTERFACEINDICATORS
Population Living in Areas Meeting Air Quality Standards Indicator Development and Data Responsibility: MDE's Air Quality Program, 410-631-3260
Data/Graphs:
Percent of MD Population Living in Attainment and Non-Attainment Areas for Common Air Pollutants
Goal: Ensure the air is safe to breathe.
Indicator: Percentage of Maryland population living in areas meeting federal air quality standards-attainment areas.
Status: 100% of Marylanders live in areas that meet standards for the following pollutants: carbon monoxide, sulfur dioxide, particulate matter, nitrogen dioxide, and lead. 87% of Marylanders live in areas where health based standards for the 1-hour ozone standard are exceeded. Areas in Maryland that do not meet the 8-hour ozone standard have not yet been identified.
Benchmark: By 2005, all Marylanders live in areas that meet the 1-hour ozone standard. All Marylanders continue to live in areas that meet federal air quality standards for carbon monoxide, sulfur dioxide, nitrogen dioxide, lead, and particulate matter.

Percent of Maryland Population Living in Attainment and Non-
Attainment Areas for Common Air Pollutants

INTRODUCTION
PUBLIC HEALTH INDICATORS
AIR QUALITY
Population Living in Areas Meeting Air Quality Standards
Common Air Pollutants
Ozone Levels Above 1-Hour Outdoor Air Quality Standard
Ozone Levels Exceeding 8-Hour
Outdoor Air Quality Standard
Change in Emissions by Source Category
Vehicle Miles Traveled/Population
and NOx
Public Transportation Use
HAZARDOUS MATERIALSEXPOSURE
DRINKING WATER QUALITY
WATER QUALITY(FISH AND SHELLFISH
HARVESTING)
ECOSYSTEM HEALTHINDICATORS
PUBLIC INTERFACEINDICATORS
Common Air Pollutants Indicator Development and Data Responsibility: MDE's Air Quality Program, 410-631-3260
Data/Graphs:
Maryland 1-Hour Exceedance by YearLead: Annual Arithmetic MeanNitrogen Dioxide: Annual Arithmentic AverageInhalable Particulate (PM-10): Annual Arithmentic MeanCarbon Monixide: Number of Exceedances of 8-Hour Standard
Sulfur Dioxide: Annual Arithmentic Average
Goal: Ensure the air is safe to breathe.
Indicator: Measured air quality data for common air pollutants:
● Ozone: Days in year the 1-hour standard was exceeded● Lead: The annual arithmetic mean at three locations● Nitrogen dioxide (NO2): The annual arithmetic average at two locations● Carbon Monoxide (CO): The number of exceedances of the 8-hour standard● Inhalable Particulate: The new standard is particulate matter of 10 microns or less in diameter
(PM - 10), particulates larger than PM - 10 are filtered out and do not enter the lungs: Annual arithmetic mean at five locations
● Sulfur dioxide: Annual arithmetic average at four locations
Status: All of Maryland meets federal air quality standards for all of the common air pollutants except ozone. The Baltimore and Washington, D.C. areas, Kent, Queen Anne's and Cecil Counties fail to meet the federal 1-hour ozone standard.
Benchmark: By 2005, meet the federal 1-hour ozone standard in all areas of Maryland and continue meeting air quality standards for all common air pollutants.

Maryland 1-Hour Exceedances by Year
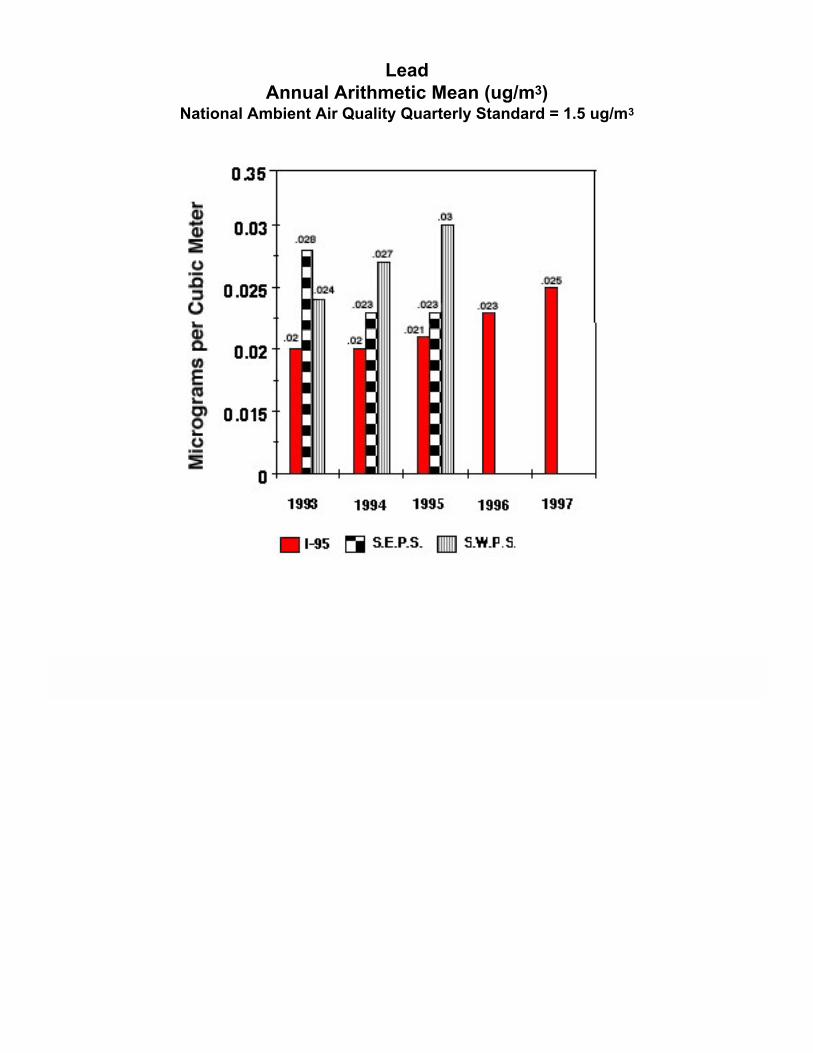
Lead
Annual Arithmetic Mean (ug/m3)
National Ambient Air Quality Quarterly Standard = 1.5 ug/m3

Nitrogen Dioxide
Annual Arithmetic Mean (ug/m3)
National Ambient Air Quality Quarterly Standard = 100 ug/m3
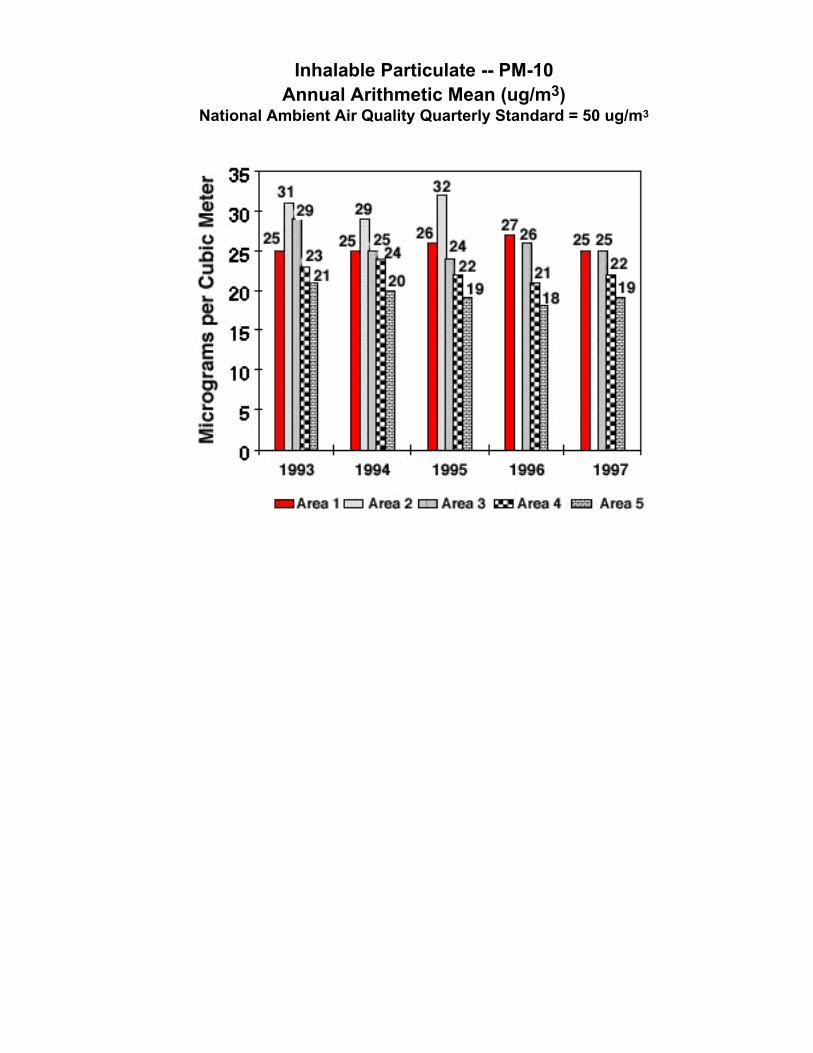
Inhalable Particulate -- PM-10
Annual Arithmetic Mean (ug/m3)
National Ambient Air Quality Quarterly Standard = 50 ug/m3

Carbon Monoxide
Number of Exceedances of 8-Hour Standard

Sulfur Dioxide
Annual Arithmetic Mean (ug/m3)
National Ambient Air Quality Quarterly Standard = 80 ug/m3

INTRODUCTION
PUBLIC HEALTH INDICATORS
AIR QUALITY
Population Living in Areas Meeting Air Quality Standards
Common Air Pollutants
Ozone Levels Above 1-Hour Outdoor Air Quality Standard
Ozone Levels Exceeding 8-Hour
Outdoor Air Quality Standard
Change in Emissions by Source Category
Vehicle Miles Traveled/Population
and NOx
Public Transportation Use
HAZARDOUS MATERIALSEXPOSURE
DRINKING WATER QUALITY
WATER QUALITY(FISH AND SHELLFISH
HARVESTING)
ECOSYSTEM HEALTHINDICATORS
PUBLIC INTERFACEINDICATORS
Ozone Levels Above 1-Hour Outdoor Air Quality StandardIndicator Development and Data Responsibility: MDE's Air Quality Program, 410-631-3260
Data/Graphs:
Maryland 1-Hour Ozone Exceedances by YearRatio of Days Ozone Levels Exceeded 1-Hour Ozone Standard to Days > 90 Degrees
Fahrenheit in Maryland Nonattainment Areas
Goal: Ensure the air is safe to breathe.
Indicators:
1. Number of days ozone levels exceeded the federal 1-hour ozone standard. 2. Ratio of days ozone levels exceeded the federal 1-hour ozone standard to days with temperatures
above 90o F.
Status: Ozone-levels exceeded the one hour standard 10 times in 1998. EPA changed the ozone standard from a 1-hour average level to an 8-hour average level because the 8-hour average level relates more directly to long-term exposure levels that have permanent adverse health effects. The revised 8-hour standard became effective in September 1997 while the existing 1-hour standard will remain in effect until EPA determines that an area has air quality meeting the 1-hour standard. All areas in Maryland must meet the 1-hour ozone standard.
The graph on the left shows that it is difficult to see a definitive trend in exceedence days. In the graph on the right, the ratio of exceedence days to days with temperatures above 90 degrees shows that during the 1980s, there was a strong correlation between days when the temperature was 90 degrees or above and exceedences of the ozone standard. In the 1990s, a temperature of 90 degrees or above indicates a less than 50% chance of exceeding the ozone standard.
Benchmark: By 2005, each ozone monitor in Maryland will not exceed the 1-hour ozone standard more than three times in a three-year period and all Marylanders live in areas that meet the 1-hour ozone standard.

Maryland 1-Hour Exceedances by Year
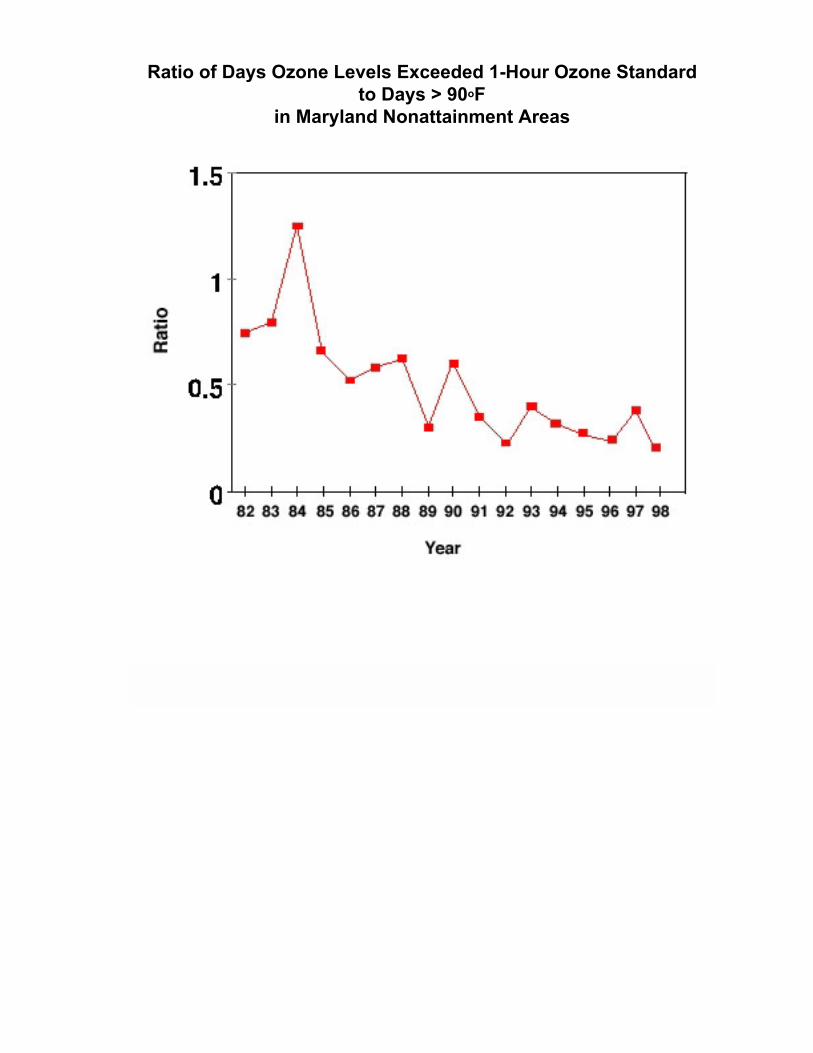
Ratio of Days Ozone Levels Exceeded 1-Hour Ozone Standard
to Days > 90oF
in Maryland Nonattainment Areas

INTRODUCTION
PUBLIC HEALTH INDICATORS
AIR QUALITY
Population Living in Areas Meeting Air Quality Standards
Common Air Pollutants
Ozone Levels Above 1-Hour Outdoor Air Quality Standard
Ozone Levels Exceeding 8-Hour
Outdoor Air Quality Standard
Change in Emissions by Source Category
Vehicle Miles Traveled/Population
and NOx
Public Transportation Use
HAZARDOUS MATERIALSEXPOSURE
DRINKING WATER QUALITY
WATER QUALITY(FISH AND SHELLFISH
HARVESTING)
ECOSYSTEM HEALTHINDICATORS
PUBLIC INTERFACEINDICATORS
Ozone Levels Exceeding 8-Hour Outdoor Air Quality StandardIndicator Development and Data Responsibility: MDE's Air Quality Program, 410-631-3260
Data/Graphs:
Fourth Highest 8-Hour Ozone Level in Maryland (3 Year Average)
Number of 8-Hour Ozone Levels Above the 8-Hour Ozone Standard
Goal: Ensure the air is safe to breathe.
Indicator: Number of times ozone levels exceed the 8-hour ozone national ambient (outdoor) air quality standard.
Status: Ozone levels exceeded the 8-hour ozone standard 54 times in 1996-1998. The revised 8-hour standard became effective on September 16, 1997 while the existing 1-hour standard will remain in effect until EPA determines that an area has air quality meeting the 1-hour standard. All areas in Maryland must meet the 1-hour ozone standard by 2005. EPA changed the ozone standard from a 1-hour average level to an 8-hour level because the 8-hour average level relates more directly to long-term exposure levels that have permanent adverse health effects.
Benchmark: Recommend to EPA designations and classifications for counties in Maryland that appropriately reflect the county's air quality with respect to the 8-hour ozone standard and the county's influence on the air quality of other counties in Maryland and other states.

Fourth Highest 8-Hour Ozone Level
in Maryland
(3 Year Average)
This graph is structured to show whether Maryland areas comply with the 8-hour
ozone standard. The test for compliance with the standard is whether the fourth
highest ozone level averaged over three years is less than the standard. The three
year average dampens the effect extreme weather conditions in a single year can
have on ozone levels.

Number of 8-Hour Ozone Levels
Above the 8-Hour Ozone Standard
This graph shows the number of times that ozone levels exceeded the 8-hour
standard during the calendar year.

INTRODUCTION
PUBLIC HEALTH INDICATORS
AIR QUALITY
Population Living in Areas Meeting Air Quality Standards
Common Air Pollutants
Ozone Levels Above 1-Hour Outdoor Air Quality Standard
Ozone Levels Exceeding 8-Hour
Outdoor Air Quality Standard
Change in Emissions by Source Category
Vehicle Miles Traveled/Population
and NOx
Public Transportation Use
HAZARDOUS MATERIALSEXPOSURE
DRINKING WATER QUALITY
WATER QUALITY(FISH AND SHELLFISH
HARVESTING)
ECOSYSTEM HEALTHINDICATORS
PUBLIC INTERFACEINDICATORS
Change in Emissions by Source CategoryIndicator Development and Data Responsibility: MDE's Air Quality Program, 410-631-3260
Data/Graphs:
VOC EmissionsNOx EmissionsCO EmissionsLead Emissions
SOx & PM-10 Emissions
Goal: Ensure the air is safe to breathe.
Indicator: Change in emissions by source category for ozone-forming compounds (VOC and NOx) and other common pollutants in the Baltimore nonattainment area.
Status: The emissions inventory includes point source emissions for sulfur oxides and particulate matter. For lead, carbon monoxide, and the ozone-forming compounds (VOC and NOx), the inventory includes area, on-road mobile, and non-road mobile emissions as well as point source emissions. The emissions for VOCs and NOx are particularly important because they combine to form ozone. The 1996 inventory of VOC and NOx emissions were reduced by at least 15% by 1996. Lead emissions have dramatically decreased since 1980 due in large part to the elimination of the sale of leaded gasoline to the general public.
Benchmark: Achieve reductions in NOx and/or VOC emissions that are necessary to meet the health-based air quality standards for ozone.
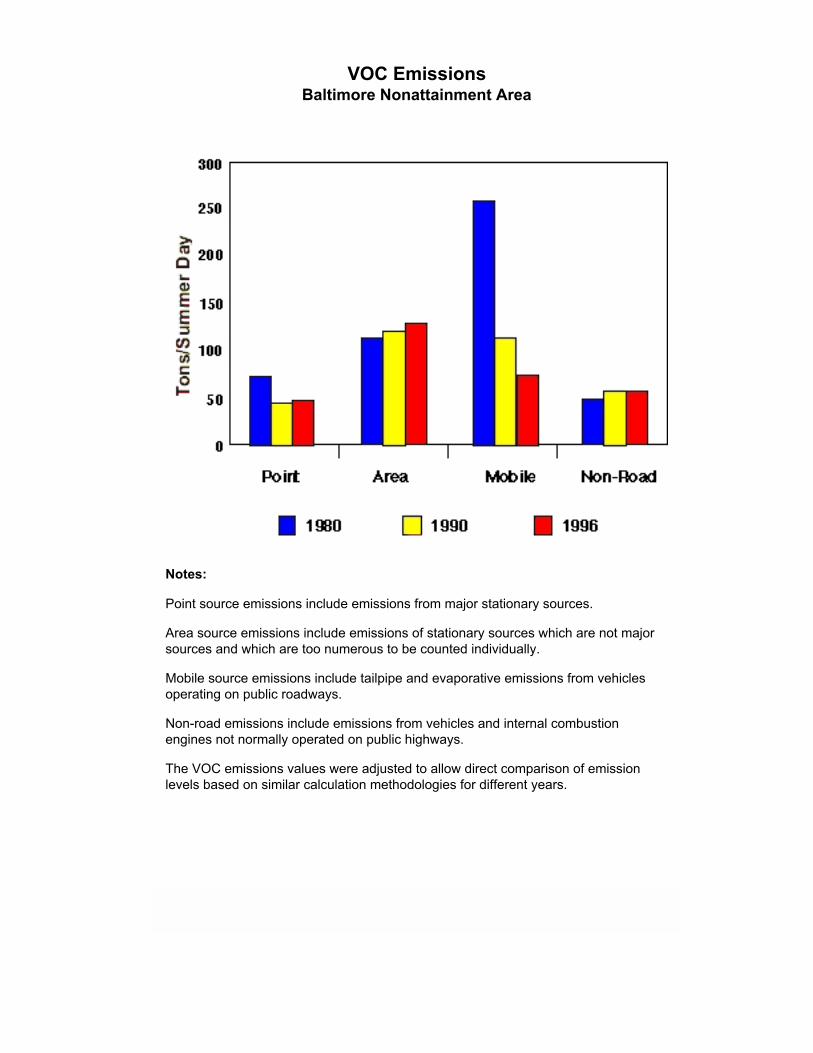
VOC Emissions
Baltimore Nonattainment Area
Notes:
Point source emissions include emissions from major stationary sources.
Area source emissions include emissions of stationary sources which are not major
sources and which are too numerous to be counted individually.
Mobile source emissions include tailpipe and evaporative emissions from vehicles
operating on public roadways.
Non-road emissions include emissions from vehicles and internal combustion
engines not normally operated on public highways.
The VOC emissions values were adjusted to allow direct comparison of emission
levels based on similar calculation methodologies for different years.

NOx Emissions
Baltimore Nonattainment Area
Notes:
Point source emissions include emissions from major stationary sources.
Area source emissions include emissions of stationary sources which are not major
sources and which are too numerous to be counted individually.
Mobile source emissions include tailpipe and evaporative emissions from vehicles
operating on public roadways.
Non-road emissions include emissions from vehicles and internal combustion
engines not normally operated on public highways.
The NOx emissions values were adjusted to allow direct comparison of emission
levels based on similar calculation methodologies for different years.
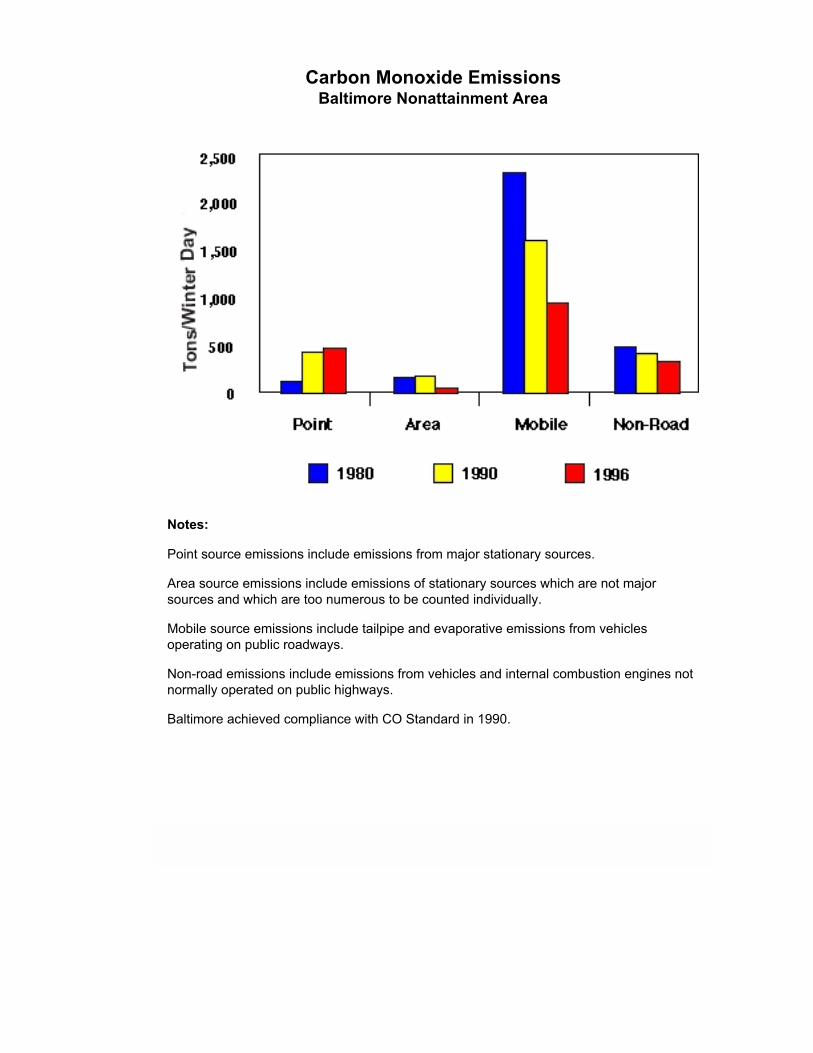
Carbon Monoxide Emissions
Baltimore Nonattainment Area
Notes:
Point source emissions include emissions from major stationary sources.
Area source emissions include emissions of stationary sources which are not major
sources and which are too numerous to be counted individually.
Mobile source emissions include tailpipe and evaporative emissions from vehicles
operating on public roadways.
Non-road emissions include emissions from vehicles and internal combustion engines not
normally operated on public highways.
Baltimore achieved compliance with CO Standard in 1990.
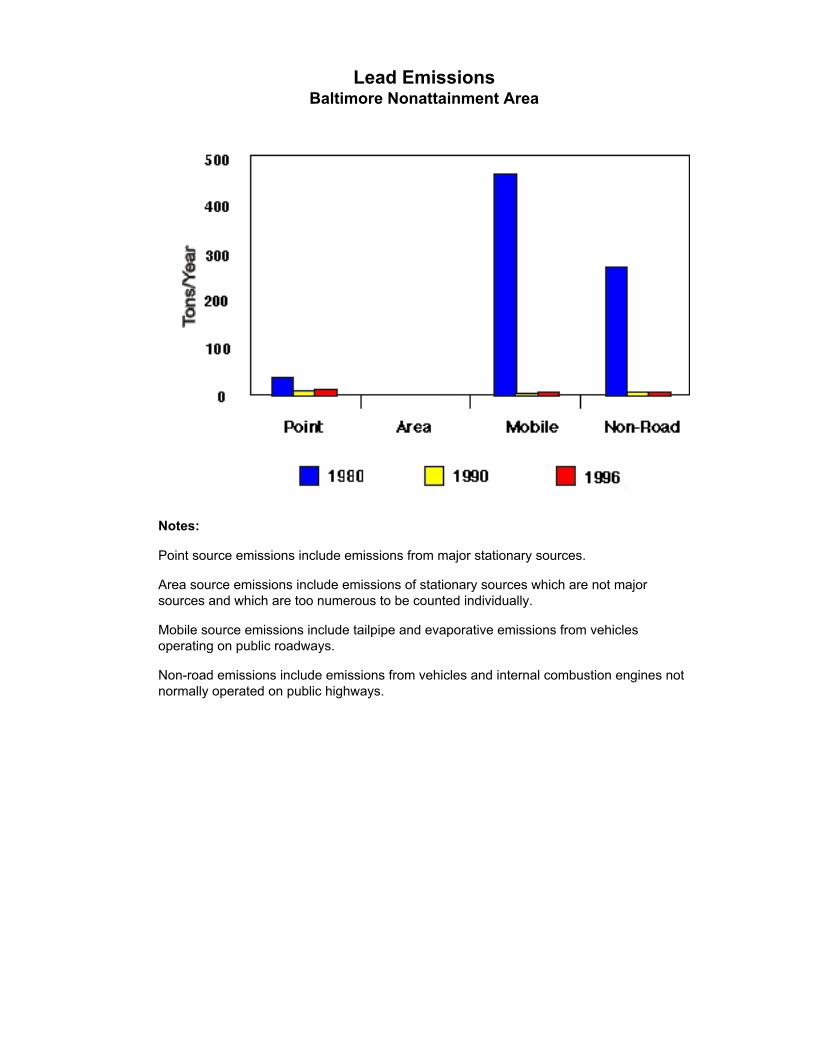
Lead Emissions
Baltimore Nonattainment Area
Notes:
Point source emissions include emissions from major stationary sources.
Area source emissions include emissions of stationary sources which are not major
sources and which are too numerous to be counted individually.
Mobile source emissions include tailpipe and evaporative emissions from vehicles
operating on public roadways.
Non-road emissions include emissions from vehicles and internal combustion engines not
normally operated on public highways.

SOx & PM-10 Emissions From Point Sources
Baltimore Nonattainment Area
Note: Point source emissions include emissions from major stationary sources.

INTRODUCTION
PUBLIC HEALTH INDICATORS
AIR QUALITY
Population Living in Areas Meeting Air Quality Standards
Common Air Pollutants
Ozone Levels Above 1-Hour Outdoor Air Quality Standard
Ozone Levels Exceeding 8-Hour
Outdoor Air Quality Standard
Change in Emissions by Source Category
Vehicle Miles Traveled/Population
and NOx
Public Transportation Use
HAZARDOUS MATERIALSEXPOSURE
DRINKING WATER QUALITY
WATER QUALITY(FISH AND SHELLFISH
HARVESTING)
ECOSYSTEM HEALTHINDICATORS
PUBLIC INTERFACEINDICATORS
Vehicle Miles Traveled/Population and NOxData Development and Indicator Responsibility: MDOT's State Highway Administration, 410-767-3781
Data/Graphs:
Vehicle Miles Traveled and PopulationVehicle Miles Traveled and NOx Emissions
Goal: Ensure the air is safe to breathe.
Indicator: Trends in Vehicle Miles Traveled (VMT) compared to population growth, total Nitrogen Dioxide (NOx) emissions, and NOx from vehicle emissions
Status: Vehicle population and VMT are both growing at a faster rate than population. Total emissions in NOx have been decreasing recently due to technological advances such as clean fuels and lower tailpipe standards. However, the number of trips per day made by each person is projected to increase 42% by 2020, resulting in an additional 5.9 million trips per day. Between 2005 and 2010, vehicle emissions will begin to increase again due to the 65% increase in VMT resulting from the increased trips.

Vehicles Miles Traveled and Population
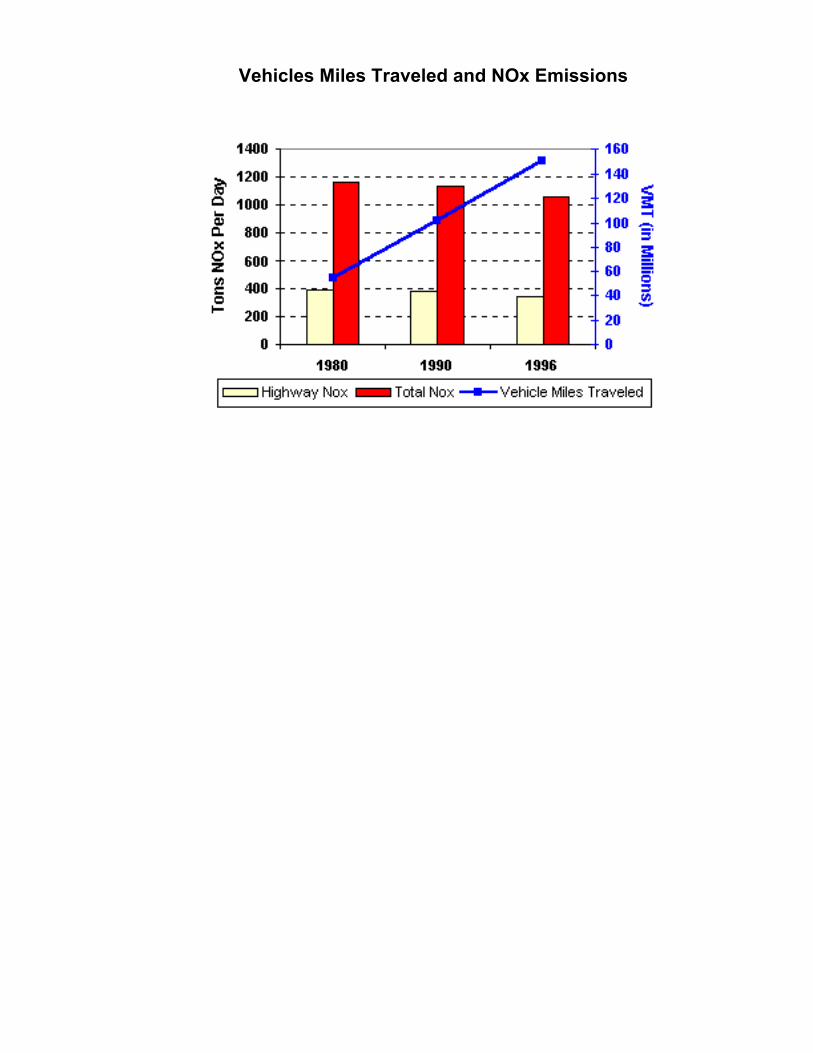
Vehicles Miles Traveled and NOx Emissions

INTRODUCTION
PUBLIC HEALTH INDICATORS
AIR QUALITY
Population Living in Areas Meeting Air Quality Standards
Common Air Pollutants
Ozone Levels Above 1-Hour Outdoor Air Quality Standard
Ozone Levels Exceeding 8-Hour
Outdoor Air Quality Standard
Change in Emissions by Source Category
Vehicle Miles Traveled/Population
and NOx
Public Transportation Use
HAZARDOUS MATERIALSEXPOSURE
DRINKING WATER QUALITY
WATER QUALITY(FISH AND SHELLFISH
HARVESTING)
ECOSYSTEM HEALTHINDICATORS
PUBLIC INTERFACEINDICATORS
Public Transportation UseData Development and Indicator Responsibility: MDOT's Mass Transit Administration, 410-767-3781
Data/Graph:
Transit Trips and Population
Goal: Ensure the air is safe to breathe.
Indicator: Trends in transit use plotted against population. The projected 2020 figure for transit trips reflects the goal of the Maryland Transit Advisory Panel for increased ridership.
Status: Each year the number of transit riders increases. However, the percentage of trips made by personal vehicles increases while the percentage of trips made by transit has decreased. The Maryland Transit Advisory Panel, chaired by former Senator Donald C. Fry, recently completed a comprehensive statewide study of transit use in Maryland. The panel consisted of 28 members representing business, political, transportation, environmental and government leaders from around the State. The panel agreed that the additional travel demand should not be accommodated solely by expanding the highway network.
Benchmark: By 2020, increase transit ridership in Maryland from 570,000 to 1,000,000 riders a day. The Maryland Transit Advisory Panel unanimously recommended this goal, and it has been adopted by Governor Parris N. Glendening.
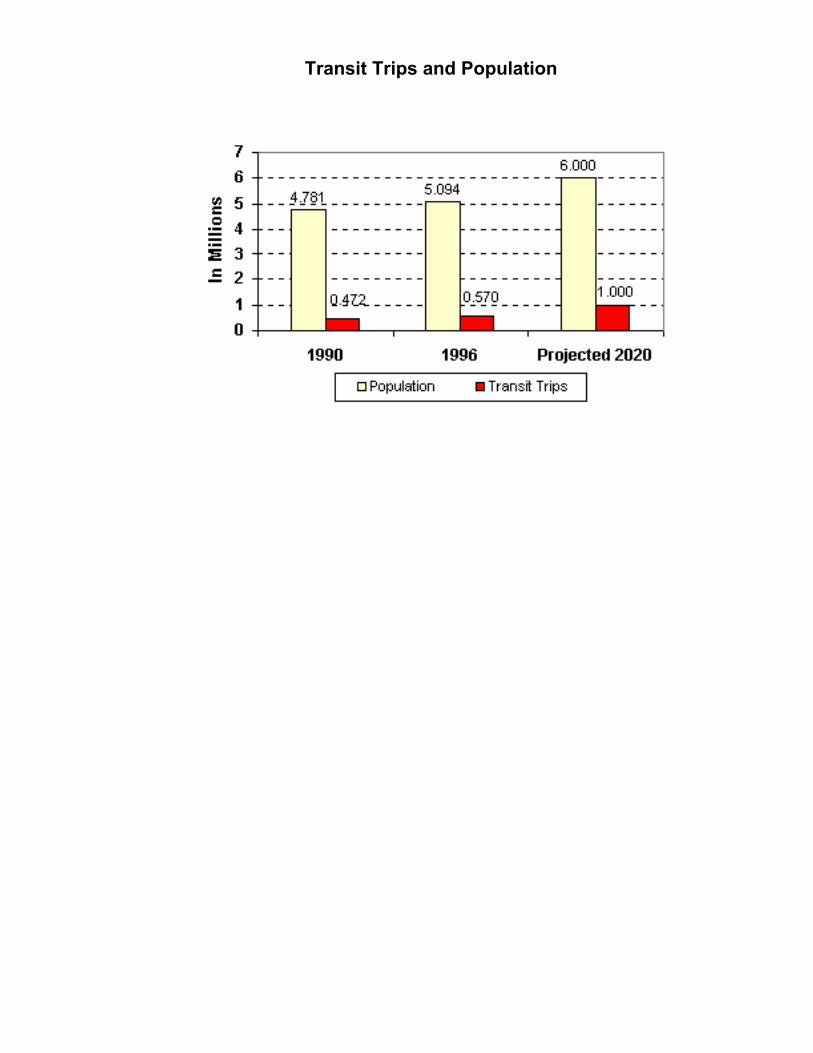
Transit Trips and Population
INTRODUCTION
PUBLIC HEALTH INDICATORS
AIR QUALITY
HAZARDOUS MATERIALSEXPOSURE
Hazardous Waste Generated per Year
Reported Exceedances of Lead Poisoning Standard
Toxics Releases
DRINKING WATER QUALITY
WATER QUALITY(FISH AND SHELLFISH
HARVESTING)
ECOSYSTEM HEALTHINDICATORS
PUBLIC INTERFACEINDICATORS
HAZARDOUS MATERIALS EXPOSURE
Hazardous waste and hazardous materials in the environment pose the potential to cause or contribute to an increase in mortality and serious illness in humans, to slow a child's development and cause learning disabilities and behavior problems. They also threaten the environment if mismanaged: some contaminants can remain in the water column or sediment for long periods of time and studies have shown that even relatively low concentrations of some toxic chemical contaminants can have a range of ecological impacts on the Chesapeake Bay. Chemical contaminants, including oil, can compromise the immune system of Bay organisms, cause cancer in aquatic organisms, harm marine life, and affect the Bay's food web.
Goal:
● Reduce the threat to public health from the presence of hazardous waste and hazardous materials in the environment.
Stressors/Sources: Hazardous waste is produced as a byproduct of many manufacturing operations and processes. Increases in business and industrial activity can cause an increase in the generation of hazardous waste; wastes may become newly regulated as hazardous, causing a statistical increase in the amount of hazardous waste generated even though the total amount of waste generated does not increase. Also, numerous commercial chemical products are regulated as hazardous waste once they are declared to be waste or intended to be discarded. Pollution prevention initiatives and hazardous waste recycling systems that can significantly reduce exposure to hazardous products and waste can also involve substantial initial capital expenditures, particularly for small to medium size businesses (in proportion to revenues).
Other hazards are created in consumer environments: lead paint is often a source of poisoning of children in older housing units, sometimes the only affordable housing for lower income citizens, where there is insufficient abatement and failure to notify tenants of danger or possible exposure.
Leaking or substandard underground storage tanks, or spills of oil, create groundwater contamination.
Chemical contaminants, including metals (e.g., copper, zinc, cadmium, mercury), pesticides, and organic compounds like polynuclear aromatic compounds (PNAs) and polychlorinated biphenyls (PCBs) from a variety of sources affect both water and air.
Management Objective: Reduce amounts of hazardous waste and hazardous materials potentiallysubject to release into the environment. Encourage waste recycling and other approaches to waste reduction.
The Indicators: The hazardous material exposure indicators focus on both the generation of hazardous wastes and the disposition of several hazardous materials in the environment.
Over the past year, MDE staff and members of the Maryland Environment 2000 (ME 2000) Steering Committee and the Controlled Hazardous Substances Advisory Council met a number of times to discuss the concerns raised by the public and stakeholder groups on the hazardous and toxic releases indicators in order to develop more meaningful ones or perhaps to merge them. In the end, the workgroup did not develop replacement indicators and agreed that until better ones could be developed, MDE should continue to report on both the hazardous waste generation and toxic releases indicators, with a caveat about stakeholder concerns.

Initial discussions focused on what the indicators should accomplish. The workgroup felt that the current hazardous waste indicator, which measures the total amount generated, does not take into account the actual disposition of the waste or the fact that increased production (economic activity) would result in an increase in the amount of waste generated. The workgroup members felt that hazardous waste, when properly managed, does not pose significant risk to public health or the environment; instead, risk resulted from improper disposal of wastes or transportation incidents associated with waste handling.
Two purposes for the hazardous waste indicator were discussed: one was primarily educational and the other, more difficult, was to try to demonstrate actual risk. Since the public is concerned with hazardous waste which ends up in the wrong places, the workgroup felt there was some value in demonstrating what was actually done with the waste generated in the state and how businesses were complying with the regulations. However, the workgroup could not develop a way to measure those wastes that were disposed of illegally, which would pose the greatest risk. Therefore, the workgroup decided that the best place to look was where there were already sources of data which could be measured, such as that reported to the State or Federal environmental agencies.
The best indicator the workgroup could imagine was one in which the amount of waste was compared to the amount of a product, so that an increase in production, where the wastes were properly handled, would not penalize a company because of the associated increase in waste. While this indicator is easily calculated for an individual generator with its own specific product (and in fact is sometimes used internally to help a company measure its own environmental performance), the workgroup could not find a way to normalize this number across industries. For example, the quarts of waste oil would increase with the number of oil changes a garage did, the amount of waste from fossil or nuclear plants increases with the amount of electricity produced, the amount of waste in a chemical manufacturing plant increases with the number of pounds produced, depending on the chemistry, just as the amount of trash a family has will change depending on the number of children or babies in the house. While these measurements are reflective of how changes in activity can affect changes in waste, they can only be used to effectively compare similar businesses to each other. The workgroup could not find a way to compare pounds of waste / pounds of product or per kilowatt hour, or per item processed, etc., and thereby use this as a statewide indicator.
Additional possible indicators were discussed:
● Incidents (transportation or otherwise) involving hazardous waste: This data was not thought to be useful for an indicator on its own but could be linked with the amount of hazardous waste managed by Toxic Release Inventory (TRI) facilities as evidence that a great deal of waste is being handled without incident. Although there is one commercial hazardous waste treatment facility in Maryland, and a number of facilities have received permits to treat some of the hazardous waste they generate, the majority of hazardous wastes are transported out of state for final disposition (recycling, incineration or other treatment, or disposal in a landfill).
● TRI pollution prevention data: The group decided that this information was substantially covered by the existing indicator on toxic releases to the air. TRI numbers include releases to the land, air, water or to treatment facilities (on-site or off-site).
● Number of companies with pollution prevention plans, who participate in Businesses for the Bay, or who participated in the Reilly 33/50 program: The workgroup felt that there is not enough information to create a meaningful indicator. There was a great deal of discussion about pollution prevention and representatives from the companies present said that many pollution prevention efforts have economic benefits and have been done for years, without being specifically labeled as such. If available, this information would also be industry specific and not be a good statewide indicator.
● Amount of hazardous waste incinerated, landfilled or transferred off-site: An indicator of the disposition of hazardous wastes was proposed to show how wastes were being managed by the generators. This would take the categories of wastes already reported biennially by generators and split them into their disposal methods. This idea was rejected by the workgroup as being more educational in nature than a way to track performance.
● Per cent compliance with MDE regulations by generator ID# large/small: The workgroup discussed this proposal at length and decided that this measure would not be a useful indicator for the entire state. While the Department targets businesses with a history or suspicion (based on complaints) of non-compliance, this would not represent a total picture, and the generators

inspected would not be consistent from year to year.
In a similar vein, the workgroup felt the current toxics releases indicator, which measures reported release of chemical contaminants, does not take into account releases that are not reported, changes in reporting requirements, or the fact that increased production would result in an increase in the amount of release. As with the hazardous waste indicator, numerous substitutes were discussed, but the workgroup could not develop a replacement indicator and agreed that until a better one could be developed, MDE should continue to report on this indicator, again with a caveat about stakeholder concerns.

INTRODUCTION
PUBLIC HEALTH INDICATORS
AIR QUALITY
HAZARDOUS MATERIALSEXPOSURE
Hazardous Waste Generated per Year
Reported Exceedances of Lead Poisoning Standard
Toxics Releases
DRINKING WATER QUALITY
WATER QUALITY(FISH AND SHELLFISH
HARVESTING)
ECOSYSTEM HEALTHINDICATORS
PUBLIC INTERFACEINDICATORS
Hazardous Waste Generated per Year Indicator Development and Data Responsibility: MDE's Hazardous Waste Program, 410-631-3343.
Data/Graphs:
Hazardous Waste Generated Annually
Goal: Reduce the threat to public health from the presence of hazardous waste and hazardous materials in the environment.
Indicator: Amount of hazardous waste generated in Maryland annually.
Status: In 1995, 91,030 tons of hazardous waste were generated in the State. Maryland anticipates a decline in hazardous waste generation as the number of generators decreases and more pollution prevention technologies and systems are developed and implemented. Data for 1997 is currently being compiled by the U.S. EPA.
Benchmark: Achieve continual decrease in aggregate amount of hazardous waste generated per year.
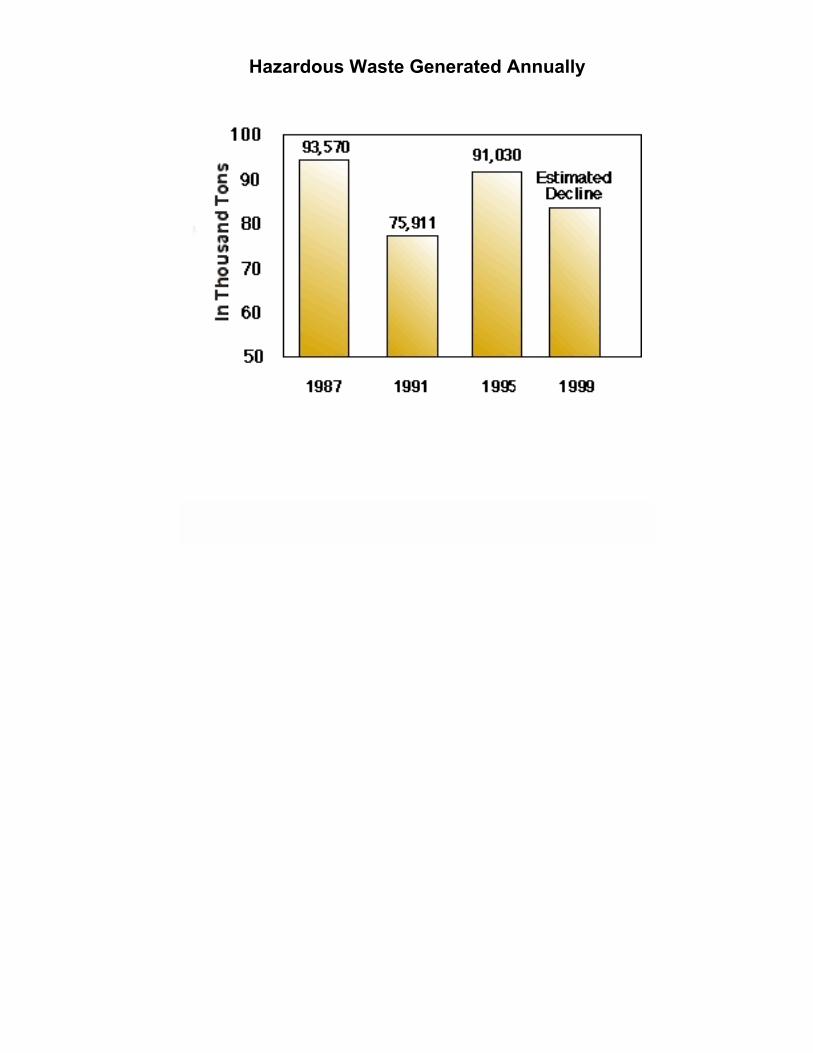
Hazardous Waste Generated Annually

INTRODUCTION
PUBLIC HEALTH INDICATORS
AIR QUALITY
HAZARDOUS MATERIALSEXPOSURE
Hazardous Waste Generated per Year
Reported Exceedances of Lead Poisoning Standard
Toxics Releases
DRINKING WATER QUALITY
WATER QUALITY(FISH AND SHELLFISH
HARVESTING)
ECOSYSTEM HEALTHINDICATORS
PUBLIC INTERFACEINDICATORS
Reported Exceedances of Lead Poisoning Standard Indicator Development and Data Responsibility: MDE's Environmental Lead Health Coordination Division, 410-631-3847
Data/Graphs:
Percentage of Children Exceeding Lead Poisoning Standard
Goal: Reduce the threat to public health from the presence of hazardous waste and hazardous materials in the environment.
Indicator: Reported occurrences of lead poisoning as a percentage of the total tested population.
Status: In 1996, there were 1,830 reported incidents of elevated blood-lead levels statewide (3.1% of the children screened exceeded the lead poisoning standard). In 1997, over 67,100 children 0-6 years of age were screened for lead poisoning (15.3% of all children aged 0-6 years in Maryland), and there were 1,233 reported occurrences of elevated blood-lead levels statewide (1.8% of the children screened exceeded the lead poisoning standard).
The reduction of lead risk in housing program was fully implemented in February 1996. As more properties undergo lead hazard treatments, the number of detected cases is expected to diminish. Maryland seeks to ensure that 100% of properties that require lead paint hazard treatments are completed by the year 2006.
Benchmark: No new occurrences of lead poisoning in children caused by lead-based paint.

Percentage of Children Screened
Exceeding Lead Poisoning Standards

INTRODUCTION
PUBLIC HEALTH INDICATORS
AIR QUALITY
HAZARDOUS MATERIALSEXPOSURE
Hazardous Waste Generated per Year
Reported Exceedances of Lead Poisoning Standard
Toxics Releases
DRINKING WATER QUALITY
WATER QUALITY(FISH AND SHELLFISH
HARVESTING)
ECOSYSTEM HEALTHINDICATORS
PUBLIC INTERFACEINDICATORS
Toxics Releases Indicator Responsibility and Data Development: MDE's Emergency Planning
and Right-to-Know Program, 410-631-3800
Data/Graph:
Maryland Toxics Release Inventory, 1988-1996
Goal: Improve and protect Maryland's water quality.
Indicator: Toxics Release Inventory (TRI).
Status: Maryland has achieved a 53% percent reduction in reported air and water emissions as of 1994 (including transfers to publicly owned wastewater treatment plants). Since TRI reporting requirements have changed over the years, these data have been edited to include only those chemicals and industries for which reporting was required in 1988.
Land releases and off-site transfers increased dramatically in 1991 due to a change in reporting requirements to include materials sent off-site for recycling and energy recovery. The additional increase in 1993-94 was due to one-time transfers from two large facilities in Baltimore. Transfers are expected to return to 1992 levels in 1995. The majority of the materials transferred are recycled and reused.
Benchmark: By 2000, Maryland's Chesapeake Bay Program goal is to achieve a 65% reduction of TRI chemicals into the environment from industries required to report in 1988.

Maryland Toxics Release Inventory, 1988-1996
Air, Water & Land Releases
INTRODUCTION
PUBLIC HEALTH INDICATORS
AIR QUALITY
HAZARDOUS MATERIALSEXPOSURE
DRINKING WATER QUALITY
Public Water Systems in Compliance
Surface Water Supply Systems with Source Protection Programs
Ground Water Systems with
Wellhead Protection Programs
Municipal Waste Landfills in
compliance with Ground Water
Standards
Oil Contaminated Sites
WATER QUALITY(FISH AND SHELLFISH
HARVESTING)
ECOSYSTEM HEALTHINDICATORS
PUBLIC INTERFACEINDICATORS
DRINKING WATER QUALITY
Under federal and state laws and regulations, MDE is responsible for ensuring that all public drinking water systems throughout Maryland meet strict drinking water quality standards. A public drinking water system is a water system that serves at least 25 individuals year round. Approximately 4.3 million Marylanders are served by public drinking water systems. If the system serves less than 25 people on a regular basis, it is considered a private system. Private systems may consist of an individual well that serves one home or be shared by a few homes or businesses. Private wells serve approximately 900,000 Marylanders. Individual wells, which serve one lot or home, are regulated by local governments through delegation from MDE.
MDE protects drinking water by implementing various programs that protect groundwater and surface water supplies from contaminants, establishes criteria for well construction, inspects facilities that treat and provide public drinking water, and assures compliance with all safe drinking water standards.
Goal:
● Ensure safe drinking water.
Stressors/Sources: The discharge of nutrients and contaminants from human activities to water bodies present risks. Changes in land use, for example: conversion of forested land into residential, commercial, or industrial-use land negatively effects water quality; in addition, the extension of suburban areas into the Piedmont, and Valley and Ridge provinces places greater stresses on downstream water supplies. Nutrients from human activities, on-site disposal and fertilizer, the affect of storm water runoff on agricultural and urban land within a watershe, along with the improper disposal of chemicals, spills and leaks from underground tanks, and leachate migration from landfills, and piped discharges, all pose direct threats to drinking water supplies. Naturally occuring mineral deposits, such as radon, radium, and arsenic, have also been identified in certain regions.
Management Objective: The key management objectives under this goal are: (1) ensure compliance of public water systems with all federal and State requirements; (2) ensure that private wells used by Marylanders comply with state regulations; (3) prevent pollutant contamination of potable surface waters; (4) fully develop and implement source protection programs for all public drinking water systems that receive water from surface sources; (5) prevent contamination of potable groundwater aquifers that are vulnerable to underground hydrological transport mechanisms; (6) develop locally-based wellhead protection programs to ensure long-term viability of supply sources; (7) ensure that municipal landfills operate in significant compliance with all State and federal laws and standards; (8) ensure that permitted solid waste facilities are designed and operated in significant compliance with all applicable water pollution control requirements; (9) initiate and complete cleanups of sites impacted by discharge of oil or other hazardous substances; and (10) manage the State's water resources to ensure adequate quantity for the future.
The Indicators: The indicators discussed here do not describe all sources of drinking water in Maryland, but they do provide information on public water systems which serve 4.3 million persons. Private wells provide water to approximately 900,000 Marylanders on a routine basis. The water from private wells is tested, and approved for use when a well is constructed. In addition, the welll construction requirements ensure that the quality of the water is protected for future use. Drinking Water Quality indicators focus on public water system data because it is readily available and represents trends in the water quality of smaller private wells. The Drinking Water Quality indicators focus on the percentage of all Marylanders who are currently served by public drinking water systems that receive water from systems that meet all applicable federal and state health standards (i.e., they are "in compliance"), the percentage of all

Marylanders who are currently served by public drinking water systems that receive water from vulnerable surface sources which have active source protection programs in place, and the number of municipal waste landfills in compliance with groundwater standards. Contamination of groundwater by oil is a public health concern primarily related to drinking water, so an indicator dealing with such sites is also included here.

INTRODUCTION
PUBLIC HEALTH INDICATORS
AIR QUALITY
HAZARDOUS MATERIALSEXPOSURE
DRINKING WATER QUALITY
Public Water Systems in Compliance
Surface Water Supply Systems with Source Protection Programs
Ground Water Systems with
Wellhead Protection Programs
Municipal Waste Landfills in
compliance with Ground Water
Standards
Oil Contaminated Sites
WATER QUALITY(FISH AND SHELLFISH
HARVESTING)
ECOSYSTEM HEALTHINDICATORS
PUBLIC INTERFACEINDICATORS
Public Water Systems in Compliance Indicator Development and Data Responsibility: MDE's Water Supply Program, 410-631-3702
Data/Graphs:
Percent of Marylanders Served by Safe Water
Number of Public Water Supply Systems Exceeding Public Health Standards
Goal: Ensure safe drinking water.
Indicator: Percentage of all Marylanders who are currently served by public drinking water systems that meet all applicable federal and state health standards (i.e., "in compliance").
Status: In Maryland, as in other states, water is provided to the public by a multitude of small systems. These systems serve relatively few people in contrast to those systems in larger metropolitan areas that each serve 50,000 or more. The seven largest systems in the state serve 3.475 million, while the remaining 1,000 systems serve 860,000 customers. 74% of Maryland's water systems serve fewer than 500 persons. This explains why compliance rates are actually quite high -- 99% for all standards except for lead and copper, which is currently at 96.2%. The Lead and Copper Rule was a new rule in 1995, and treatment improvements are in progress.
Benchmark: By year 2005, achieve a 99% compliance rate for the population served by the public water systems, and maintain that the level for all contaminants regulated prior to 1996.

Percent of Marylanders
Served by Safe Water
Note: The percentages above are time weighted for bacteriological standards and surface water
treatment rules. If a system's violation lasted for a full year then the total population served is shown
is out of compliance. If a system had a violation for one month then 1/12th of the population served
shown is out of compliance while 11/12th shown is in compliance.

Number of Public Water Supply Systems
Exceeding Public Health Standards

INTRODUCTION
PUBLIC HEALTH INDICATORS
AIR QUALITY
HAZARDOUS MATERIALSEXPOSURE
DRINKING WATER QUALITY
Public Water Systems in Compliance
Surface Water Supply Systems with Source Protection Programs
Ground Water Systems with
Wellhead Protection Programs
Municipal Waste Landfills in
compliance with Ground Water
Standards
Oil Contaminated Sites
WATER QUALITY(FISH AND SHELLFISH
HARVESTING)
ECOSYSTEM HEALTHINDICATORS
PUBLIC INTERFACEINDICATORS
Surface Water Supply Systems With Source Protection ProgramsIndicator Development and Data Responsibility: MDE's Water Supply Program, 410-631-3702
Data/Graph:
Number of Marylanders Served by Surface Systems with Source Protection
Goal: Ensure safe drinking water.
Indicator: Percentage of all Marylanders who are currently served by public drinking water systems that receive water from vulnerable surface sources which have active source protection programs in place.
Status: Formal source protection programs are in place for three larger systems: the City of Baltimore, WSSC's Patuxent Supply, and the City of Cumberland. Comprehensive risk assessments are underway in all three systems concurrent with development of improved watershed management practices. Significant local participation has been key to program successes. Coordination with other agencies and other states has begun for other water system watersheds.
Benchmark: By 2005, ensure that the 3.4 million Marylanders served by vulnerable surface water systems will have adequate protection.

Number of Marylanders Served
by Surface Systems with Source Protection

INTRODUCTION
PUBLIC HEALTH INDICATORS
AIR QUALITY
HAZARDOUS MATERIALSEXPOSURE
DRINKING WATER QUALITY
Public Water Systems in Compliance
Surface Water Supply Systems with Source Protection Programs
Ground Water Systems with
Wellhead Protection Programs
Municipal Waste Landfills in
compliance with Ground Water
Standards
Oil Contaminated Sites
WATER QUALITY(FISH AND SHELLFISH
HARVESTING)
ECOSYSTEM HEALTHINDICATORS
PUBLIC INTERFACEINDICATORS
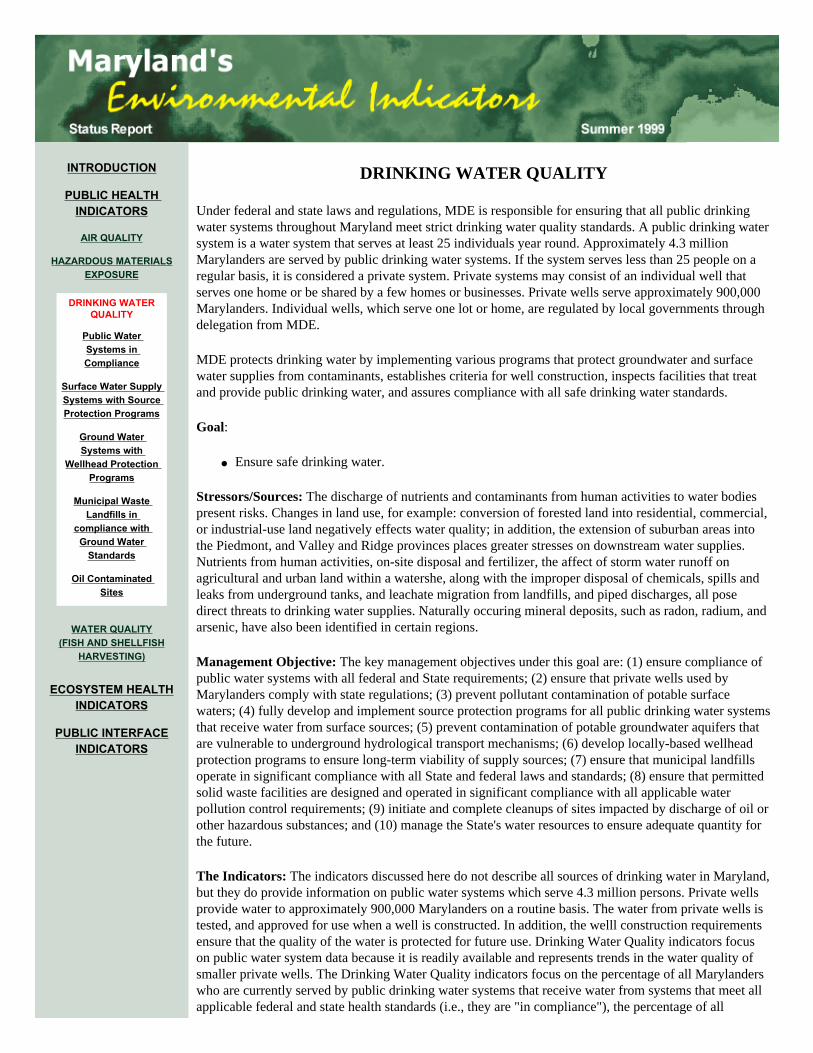
Ground Water Systems with Wellhead Protection Programs Indicator Development and Data Responsibility: MDE's Water Supply Program, 410-631-3702
Data/Graph:
Number of Marylanders Served by Ground Water Systems with Wellhead Protection Programs
Goal: Ensure safe drinking water.
Indicator: Percentage of all Marylanders who are currently served by public drinking water systems that receive water from vulnerable groundwater sources which have active wellhead protection programs in place.
Status: Communities have shown interest in voluntary partnerships. The adoption of local codes is a lengthy process. About 80 communities are working with the State to achieve protection programs that include public outreach meetings and education, new construction planning and review, and investigation of potential contaminant sources. New grant funding under the Drinking Water State Revolving Loan Fund has enabled MDE to facilitate development of local programs.
Benchmark: By 2005, establish active local programs that implement wellhead protection management practices for 182,000 Marylanders (or 66%) served by vulnerable sources.
Marylanders Served by Ground Water Systems
with Wellhead Protection Programs

INTRODUCTION
PUBLIC HEALTH INDICATORS
AIR QUALITY
HAZARDOUS MATERIALSEXPOSURE
DRINKING WATER QUALITY
Public Water Systems in Compliance
Surface Water Supply Systems with Source Protection Programs
Ground Water Systems with
Wellhead Protection Programs
Municipal Waste Landfills in
compliance with Ground Water
Standards
Oil Contaminated Sites
WATER QUALITY(FISH AND SHELLFISH
HARVESTING)
ECOSYSTEM HEALTHINDICATORS
PUBLIC INTERFACEINDICATORS
Municipal Waste Landfills in Compliance With Ground Water Standards Indicator Development and Data Responsibility: MDE's Solid Waste Program, 410-631-3318
Data/Graph:
Landfills and Ground Water Standards
Goal: Ensure safe drinking water.
Indicator: Number of municipal waste landfills in compliance with ground water standards.
Status: Between 1996 and 1998, the number of operating municipal waste landfills has declined from 26 to 22, while the number in compliance has grown from 18 (69% of operating landfills) to 21 (95% of operating landfills).
Benchmark: By 2000, achieve 100% compliance with new EPA groundwater standards for landfills.

Landfills and Ground Water Standards
INTRODUCTION
PUBLIC HEALTH INDICATORS
AIR QUALITY
HAZARDOUS MATERIALSEXPOSURE
DRINKING WATER QUALITY
Public Water Systems in Compliance
Surface Water Supply Systems with Source Protection Programs
Ground Water Systems with
Wellhead Protection Programs
Municipal Waste Landfills in
compliance with Ground Water
Standards
Oil Contaminated Sites
WATER QUALITY(FISH AND SHELLFISH
HARVESTING)
ECOSYSTEM HEALTHINDICATORS
PUBLIC INTERFACEINDICATORS
Oil-Contaminated Sites Indicator Development and Data Responsibility: MDE's Oil Control Program, 410-631-3386
Data/Graph:
Percentage of Oil Contaminated Sites Cleaned Up
Goal: Ensure safe drinking water.
Indicator: Oil-contaminated sites remediated.
Status: 13,977 sites have been remediated or are implementing long-term clean-up activities as of March 1999. 6,384, or 46%, of the identified sites had been remediated by March 1999.
Benchmark: By 2005, complete remediation of 85% of sites contaminated with oil.

Percentage of Oil Contaminated Sites Cleaned Up
Note: 2002 & 2005 - Projected Remediation.

INTRODUCTION
PUBLIC HEALTH INDICATORS
AIR QUALITY
HAZARDOUS MATERIALSEXPOSURE
DRINKING WATER QUALITY
WATER QUALITY(FISH AND SHELLFISH
HARVESTING)
Shellfish Harvesting Waters
Maryland Waters Safe for Harvesting
Finfish
ECOSYSTEM HEALTHINDICATORS
PUBLIC INTERFACEINDICATORS
WATER QUALITY (FISH AND SHELLFISH HARVESTING)
Shellfish strain water through their gills to trap microscopic plants and animals for food. If the water were contaminated with disease-causing bacteria or viruses, these could be consumed as food by shellfish. When eaten raw or partially cooked, these shellfish can make people sick. Assuring that oysters and clams are harvested only from areas that are safe and open to harvesting minimizes the risk of human illness. In shellfish waters approved for harvesting, harvesting is permitted any time. In conditionally approved areas, harvesting is permitted except for the three days following rain events greater than 1" in 24 hours. Run-off from such a rainfall event can carry potentially harmful bacteria into surface waters from adjacent land. Shellfish harvesting is not permitted at any time from restricted areas.
Certain fish in contaminated waters can accumulate high enough levels of toxic substances that, when consumed frequently over a lifetime, may increase the consumers' risk of adverse health effects. In waters covered by a fish consumption advisory, fishermen and consumers are advised to limit their consumption of certain fish species.
Goal:
● Ensure water is clean and safe for harvesting of fish and shellfish.
Stressors/Sources: The presence of humans in a watershed increases the potential for an adverse impact to shellfish water quality from sewage treatment facilities and bypasses from sewage pumping stations, failing septic systems, increased development, and farm animal operations. Where sewage outfalls already exist, closed safety zones surrounding these outfalls are mandated and necessary to protect human health.
In addition, past usage and inappropriate disposal of persistent organic substances have resulted in elevated levels of some hazardous substances in water bodies near major urban centers. Certain fish in these waters, due to their feeding habits, metabolic activity, age and fat content, may accumulate these substances to levels which may be harmful to people consuming them frequently throughout their lifetime. Current advisories are the result of contamination due to past use of Chlordane, which is now banned.
Management Objective: Maximize availability of shellfish waters for commercial and recreational harvesting and minimize public health risk associated with finfish contaminated with harmful levels of toxic substances.
The Indicators: The percentage of total shellfish harvesting acres that are approved (open), conditionally approved, restricted (closed), and the percentage of Maryland waters covered by fish consumption advisories.

INTRODUCTION
PUBLIC HEALTH INDICATORS
AIR QUALITY
HAZARDOUS MATERIALSEXPOSURE
DRINKING WATER QUALITY
WATER QUALITY(FISH AND SHELLFISH
HARVESTING)
Shellfish Harvesting Waters
Maryland Waters Safe for Harvesting
Finfish
ECOSYSTEM HEALTHINDICATORS
PUBLIC INTERFACEINDICATORS
Shellfish Harvesting Waters Indicator Development and Data Responsibility: MDE's Environmental Risk Assessment Program, 410-631-3906
Data/Graph:
Acres of Conditionally Approved, Restricted, and Fully Approved Shellfish Harvesting
Waters in Maryland
Goal: Ensure water is clean and safe for harvesting of fish and shellfish.
Indicator: Percentage of total shellfish harvesting acres that are approved (open), conditionally approved, restricted (closed).
Status: In 1998: 1,067,057 acres approved (90.6%); 40,575 acres conditionally approved (3.4%) -- for a total of 94.0% approved; and 70,711 acres restricted (6.0%).
Benchmark: Maintain current level of 94% approval of total shellfish harveting acres.

Acres of Conditionally Approved, Restricted, and Fully Approved
Shellfish Harvesting Waters in Maryland

INTRODUCTION
PUBLIC HEALTH INDICATORS
AIR QUALITY
HAZARDOUS MATERIALSEXPOSURE
DRINKING WATER QUALITY
WATER QUALITY(FISH AND SHELLFISH
HARVESTING)
Shellfish Harvesting Waters
Maryland Waters Safe for Harvesting
Finfish
ECOSYSTEM HEALTHINDICATORS
PUBLIC INTERFACEINDICATORS
Maryland Waters Safe for Harvesting FinfishIndicator Development and Data Responsibility: MDE's Environmental Risk Assessment
Program, 410-631-3906
Data/Graph:
Fish Consumption Advisories in Maryland Waters, 1999
Goal: Ensure water is clean and safe for harvesting of fish and shellfish.
Indicator: Percentage of Maryland waters covered by fish consumption advisories.
Status: As of 1996, 0.8% of estuarine waters, 0.5% of lake waters, and none of Maryland's rivers and streams are covered by fish consumption advisories.
Benchmark: Maintain percentage of waters covered by fish advisories below 1% of estuarine, lake, and fresh non-tidal streams.
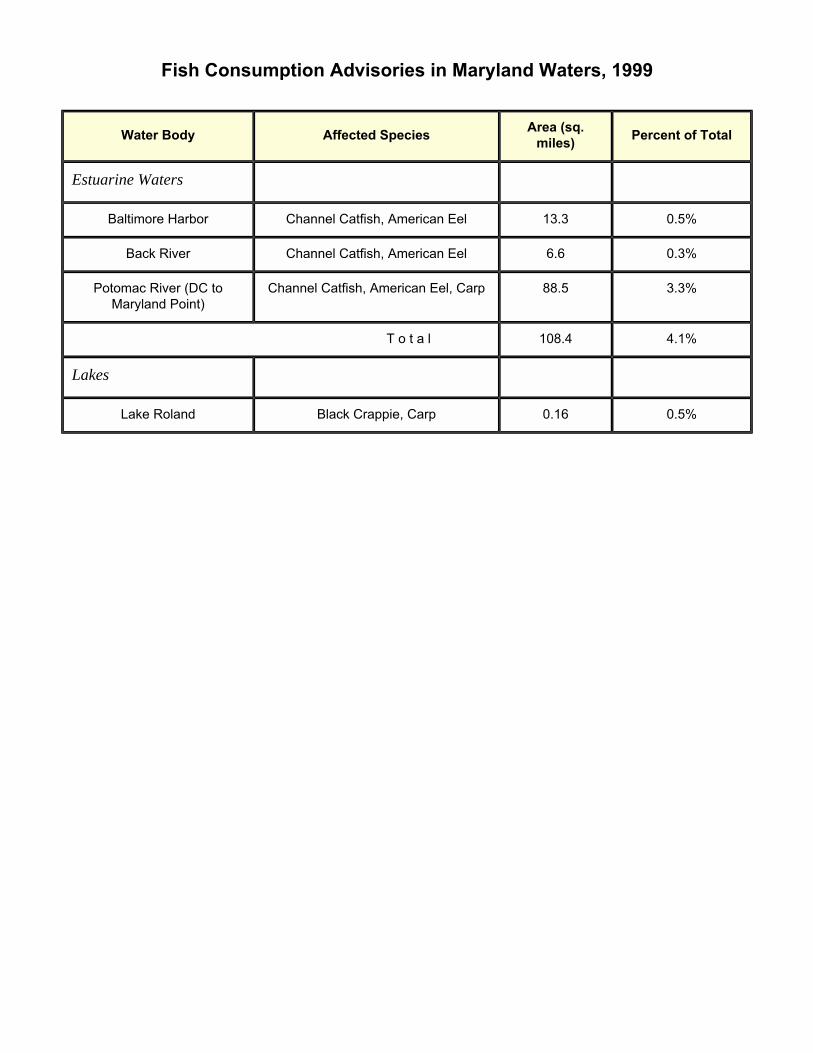
Fish Consumption Advisories in Maryland Waters, 1999
Water Body Affected SpeciesArea (sq.
miles)Percent of Total
Estuarine Waters
Baltimore Harbor Channel Catfish, American Eel 13.3 0.5%
Back River Channel Catfish, American Eel 6.6 0.3%
Potomac River (DC to
Maryland Point)
Channel Catfish, American Eel, Carp 88.5 3.3%
T o t a l 108.4 4.1%
Lakes
Lake Roland Black Crappie, Carp 0.16 0.5%

INTRODUCTION
PUBLIC HEALTH INDICATORS
ECOSYSTEM HEALTHINDICATORS
WATER QUALITY - ECOSYSTEM HEALTH
TIDAL AQUATIC SYSTEMS
NON-TIDAL AQUATIC SYTEMS
TERRESTRIAL SYSTEM DEGRADATION,
FRAGMENTATION, ISOLATION
CONSERVATION OF BIOLOGICAL DIVERSITY
PUBLIC INTERFACEINDICATORS
ECOSYSTEM HEALTH
Maryland has substantial experience in evaluating the conditions of the State’s biological resources. Through initiatives such as the multi-agency Chesapeake Bay Program and Maryland’s Power Plant Research Program, state and federal agencies have accumulated a wealth of data for monitoring trends in resource conditions and for developing management recommendations based on this abundance of scientifically credible data.
Ecosystems are hierarchical in nature. They exist at many levels and can be described at many scales. To attempt to evaluate ecosystem health therefore requires a multidimensional approach that includes indicators of attributes from multiple levels–from the individual organism to populations to assemblages of species. Indicators which measure human impacts in ecosystems must also be recognized within such a hierarchy.
An ecosystem approach to management is now being recognized as important at all levels of government and in the educational and private sectors. Approaches for evaluating trends in ecosystem health are being developed and tested at varying scales and locations throughout the United States, including Maryland. Issues of data availability and accessibility are also being confronted and resolved with the advent of new technologies and methodologies, such as remote sensing, geographic information systems and global positioning systems.
An ecosystem approach to management also requires a major commitment to a broad spectrum of scientific activities in inventory, assessment, and monitoring. A greater understanding of abiotic and biological processes is particularly important, including water cycle processes, sediment erosion-transport-deposition, geobiochemical processes (nitrate cycle, nutrient and toxics cycling), and human impacts on these processes.
In an effort to improve our indicators, Maryland is developing and evaluating new approaches to monitoring the health of the State’s ecosystems. These new approaches share one or more of the following approaches:
Movement toward composite indicators
Movement toward landscape indicators
Movement toward indicators contributing to ecological risk assessments
Movement toward accessible information on ecosystem health
The ecosystem health information presented here was compiled and assembled according to conventional science and the best available data at the time of indicator development. The data are legitimate and meaningful. However, our understanding of ecosystem health is improving and as it does, the State needs to be prepared to develop the new information bases and tools that will enable us to accurately assess conditions. EnPA establishes a framework for refinement of existing and the further development of new indicators. In the long term these new indicators are at least as important, if not more so, than the indicators for which we have collected data in the past. It is imperative for ecosystem recovery and sustainability that we pursue their development.

INTRODUCTION
PUBLIC HEALTH INDICATORS
ECOSYSTEM HEALTHINDICATORS
WATER QUALITY - ECOSYSTEM
HEALTH
Designated Uses of Surface Waters
Dissolved Oxygen and Water Quality
Impairment
Nutrient Inputs to Mainstem and
Tributary Waters
Cropland Acres Under Nutrient
Management Plans
Phosphorus Concentration in
Maryland's Chesapeake Bay
Nitrogen Concentration in
Maryland's Chesapeake Bay
Atmospheric Nitrogen Loading
Cropland Acres Under Integrated Pest Management
TIDAL AQUATIC SYSTEMS
NON-TIDAL AQUATIC SYTEMS
TERRESTRIAL SYSTEM DEGRADATION,
FRAGMENTATION, ISOLATION
CONSERVATION OF BIOLOGICAL DIVERSITY
PUBLIC INTERFACEINDICATORS
WATER QUALITY - ECOSYSTEM HEALTH
Maryland's water quality standards provide that surface waters should be protected for basic water uses such as water contact recreation, fishing, support of balanced and diverse populations of aquatic plants, animals and wildlife, and use as an agricultural and industrial water supply. For some defined uses, like trout fishing, shellfish harvesting and public water supplies, water quality conditions must be even higher. Waters that do not meet their designated uses represent a loss of a common resource that could result in economic and societal impacts and threaten human and ecosystem health.
Over the past 25 years, since passage of the landmark Federal clean water legislation, developing science has pointed more and more to the nutrients nitrogen and phosphorus as the pollutants of primary concern for the Chesapeake Bay system. This concern is based upon nutrient enrichment's broad ecological impacts more than on the public health issues associated with earliest pollution abatement efforts. Excessive nutrient loading causes rapid, uncontrolled growth of algae in surface water. These algal blooms cloud the water and block sunlight, which causes Bay grasses to die. When algae die and sink to the bottom water, decomposition of the resulting organic matter uses oxygen; if too much oxygen is used for decomposition, oxygen levels drop to the point that living resources are stressed or excluded. In yet another insult to water quality, chemical contaminants compromise the immune system of Bay organisms, cause cancer in aquatic organisms, harm marine life, and affect the Bay's food web.
Goals:
● Improve and protect quality of surface waters● Reduce or eliminate the discharge of chemical contaminants from all controllable sources
Stressors/Sources: Nutrients and bacteria from point and nonpoint source pollution affect portions of the State's surface waters. In some areas of the State, acidic waters from abandoned mines and atmospheric deposition, as well as toxic substances in urban watersheds and sediments may affect aquatic life and limit uses of these waters. Chemical contaminants enter the Bay from point sources, nonpoint sources and the atmosphere.
Since passage of the 1972 Clean Water Act, great strides have been made in reducing or eliminating the discharge of pollutants from industries and municipal wastewater treatment systems-point sources of pollution to the Bay and its tributary rivers. An estimated 55-74% of nutrient inputs to the Bay system are contributed by non-point sources, including contaminated run-off from urban areas, run-off from agricultural land uses, nutrient-enriched ground water, and deposition from the atmosphere. These sources are more complex and more difficult to control than point sources
Management Objectives: The Department of the Environment (MDE) implements a diversity of regulatory and planning programs to reduce the input of pollutants to surface and ground waters of the State. Reduction of nutrients from both point- and non-point sources is the focus of the permit requirements, along with control of bacterial pollution from sewage treatment plants and toxic materials from any source. The Department of Agriculture (MDA) also implements a number of water quality programs to reduce nutrient movement to ground and surface waters from agricultural activities. In 1998 MDA's Nutrient Management Programs changed from voluntary to regulatory.
DNR relies on a network of programs with state and local partners to prevent and reduce non-point source pollution; it also supports the State's participation in the multi-state cooperative Chesapeake Bay Program, which has set as a target a 40% reduction of nutrient inputs from controllable sources by the year 2000. The primary tools available to DNR to apply to achieving these goals are essentially non-regulatory and focus on increasing the extent of riparian forest, providing grants to State and local

agencies, working with the boating community and implementing shore erosion control. A related objective of the Department's is to improve the information available to support decision-making and track the progress of the various programs, through activities such as monitoring and modeling.
The Indicators: The indicators that follow reflect the current emphasis on protecting living resources in aquatic systems, particularly in the Chesapeake Bay. The focus is thus heavily on the nutrients nitrogen and phosphorus and the relationship between these and dissolved oxygen. One point of interest in examining these indicators is the difference apparent when data are aggregated at the statewide or large region level, such as overall loadings of nitrogen and phosphorus to the Chesapeake Bay system, and the variable situation found in similar data when their geographic distribution is displayed, as in the nitrogen and phosphorus concentration information, which is mapped for different points in the Bay and its tributaries.
Two of the indicators deal more with programmatic response to environmental conditions than with the conditions themselves-nutrient management plans and integrated pest management are measures used by farmers to improve water quality. (It should be noted that the status and trends depicted in the indicator for nutrient management plan implementation will change to reflect the transition of the program from voluntary to regulatory.)

INTRODUCTION
PUBLIC HEALTH INDICATORS
ECOSYSTEM HEALTHINDICATORS
WATER QUALITY - ECOSYSTEM
HEALTH
Designated Uses of Surface Waters
Dissolved Oxygen and Water Quality
Impairment
Nutrient Inputs to Mainstem and
Tributary Waters
Cropland Acres Under Nutrient
Management Plans
Phosphorus Concentration in
Maryland's Chesapeake Bay
Nitrogen Concentration in
Maryland's Chesapeake Bay
Atmospheric Nitrogen Loading
Cropland Acres Under Integrated Pest Management
TIDAL AQUATIC SYSTEMS
NON-TIDAL AQUATIC SYTEMS
TERRESTRIAL SYSTEM DEGRADATION,
FRAGMENTATION, ISOLATION
CONSERVATION OF BIOLOGICAL DIVERSITY
PUBLIC INTERFACEINDICATORS
Designated Uses of Surface WatersIndicator development and data responsibility: DNR, Tidewater Ecosystem Assessment Division, 410-260-8630.
Data/Graph:
Waters Meeting Designated Uses
Goal: Improve and protect surface water quality.
Indicator: Extent to which "designated uses" of Maryland surface waters are being met. Designated uses are established as part of water quality standards adopted the Federal Clean Water Act.
Status: Of the 8,842 miles of Maryland's rivers and streams identified for assessment, 67 percent fully support their designated uses; less than five percent of these waters do not fully support their uses while the status of the 29 percent of remaining waters is unknown. Of the 2,522 square miles of estuarine waters, nearly half (49 percent) fully support their designated uses and another half (49 percent) do not fully support their uses; the status of the remaining two percent is unknown. Of the 21,010 acres of lakes that are tracked in Maryland, 37 percent fully support their designated uses; 63 percent partially support their use. The support status of waters that are not directly monitored is listed as unknown.
Benchmark: Meet 100% of designated uses in all waters of the State.

Waters Meeting Designated Uses
INTRODUCTION
PUBLIC HEALTH INDICATORS
ECOSYSTEM HEALTHINDICATORS
WATER QUALITY - ECOSYSTEM
HEALTH
Designated Uses of Surface Waters
Dissolved Oxygen and Water Quality
Impairment
Nutrient Inputs to Mainstem and
Tributary Waters
Cropland Acres Under Nutrient
Management Plans
Phosphorus Concentration in
Maryland's Chesapeake Bay
Nitrogen Concentration in
Maryland's Chesapeake Bay
Atmospheric Nitrogen Loading
Cropland Acres Under Integrated Pest Management
TIDAL AQUATIC SYSTEMS
NON-TIDAL AQUATIC SYTEMS
TERRESTRIAL SYSTEM DEGRADATION,
FRAGMENTATION, ISOLATION
CONSERVATION OF BIOLOGICAL DIVERSITY
PUBLIC INTERFACEINDICATORS
Dissolved Oxygen and Water Quality ImpairmentIndicator development and data responsibility: DNR, Tidewater Ecosystem Assessment Division, 410-260-8630
Data/Graph:
Low Dissolved Oxygen and Water Quality Impairment
Goal: Improve and protect quality of surface waters.
Indicator: Extent to which dissolved oxygen levels below 5 mg/l (Maryland's water quality criteria) contribute to waters' not meeting designated uses.
Status: Of the waters in Maryland that do not fully support designated uses, low dissolved oxygen levels contribute to the impaired water status in 49.4% percent of the State's impaired river miles, 87.2% percent of the State's impaired estuarine waters and 98.5% percent of the State's impaired lake waters.
Draft Benchmark: Achieved dissolved oxygen water quality standard of 5 mg/l or better in all State waters.

Low Dissolved Oxygen and Water Quality Impairment

INTRODUCTION
PUBLIC HEALTH INDICATORS
ECOSYSTEM HEALTHINDICATORS
WATER QUALITY - ECOSYSTEM
HEALTH
Designated Uses of Surface Waters
Dissolved Oxygen and Water Quality
Impairment
Nutrient Inputs to Mainstem and
Tributary Waters
Cropland Acres Under Nutrient
Management Plans
Phosphorus Concentration in
Maryland's Chesapeake Bay
Nitrogen Concentration in
Maryland's Chesapeake Bay
Atmospheric Nitrogen Loading
Cropland Acres Under Integrated Pest Management
TIDAL AQUATIC SYSTEMS
NON-TIDAL AQUATIC SYTEMS
TERRESTRIAL SYSTEM DEGRADATION,
FRAGMENTATION, ISOLATION
CONSERVATION OF BIOLOGICAL DIVERSITY
PUBLIC INTERFACEINDICATORS
Nutrient Inputs to Mainstem and Tributary Waters Indicator Development and Data Responsibility: DNR, Watershed Management and Analysis, 410-260-8790
Data/Graphs:
Nitrogen LoadsPhosphorus Loads
Goal: Improve and protect quality of surface waters.
Indicator: Total nitrogen and phosphorus loads to the Chesapeake Bay as measured through Tributary Strategies implementation tracking, the 1997 (phase 4) Watershed model of the multi-state Chesapeake Bay Program, and DNR's Integrated Watershed Analysis and Management System (IWAMS).
Nutrient loads come from both point and nonpoint sources. Nonpoint sources include agriculture, developed land, septic tanks, forest lands and atmospheric sources. The controllable part of the nutrient load is the part caused by man's activities, including wastewater treatment discharges and both polluted runoff and groundwater from agricultural and developed lands. The controllable loads can be reduced through the implementation of identified "best management practices." Reductions due to air pollution controls, however, are currently not counted towards the attainment of the 40% reduction goal.
Status: A combination of voluntary and regulatory programs has reduced nitrogen by 17 million pounds and phosphorus by 1.9 million pounds from 1985 to 1996. The existing goal, or "cap," needs to be re-evaluated. In response to a 1997 Directive of the Executive Council of the Chesapeake Bay Program, new maximum loading goals to the Bay may be established.
Benchmark: By the year 2000, achieve a 40% reduction in controllable nutrient inputs from 1985 levels.


INTRODUCTION
PUBLIC HEALTH INDICATORS
ECOSYSTEM HEALTHINDICATORS
WATER QUALITY - ECOSYSTEM
HEALTH
Designated Uses of Surface Waters
Dissolved Oxygen and Water Quality
Impairment
Nutrient Inputs to Mainstem and
Tributary Waters
Cropland Acres Under Nutrient
Management Plans
Phosphorus Concentration in
Maryland's Chesapeake Bay
Nitrogen Concentration in
Maryland's Chesapeake Bay
Atmospheric Nitrogen Loading
Cropland Acres Under Integrated Pest Management
TIDAL AQUATIC SYSTEMS
NON-TIDAL AQUATIC SYTEMS
TERRESTRIAL SYSTEM DEGRADATION,
FRAGMENTATION, ISOLATION
CONSERVATION OF BIOLOGICAL DIVERSITY
PUBLIC INTERFACEINDICATORS
Cropland Acres Under Nutrient Management PlansIndicator development and data responsibility: MDA Nutrient Management Program 410/841-5959
Data/Graph:
Cropland Acres Under Nutrient Management Plans
Goal: Improve and protect the water quality of the Chesapeake Bay.
Indicator: Agricultural practices are responsible for a large portion of the nutrient pollution loads to Maryland waterways, including the Chesapeake Bay. Nutrient management plans are comprehensive plans for efficient use of nutrients from all sources - commercial fertilizer, animal manure, sewage sludge, and past crops. The plans almost always improve the farmer's profits and may lead to reductions in nutrient pollution loads to waterways.
Status: Between 1989 and 1998, nutrient management plans were developed for over 1.1 million acres of agricultural cropland in the state. (As noted in the introduction, above, the status and trends depicted in this indicator in the future will change from what is presented here, to reflect the transition of the program from voluntary to regulatory.)
Benchmark: By 2000, implement nutrient management plans for 1.285 million acres. Acreage goals for nutrient management are included in the tributary nutrient reducation strategies.

Cropland Acres Under Nutrient Management Plans
INTRODUCTION
PUBLIC HEALTH INDICATORS
ECOSYSTEM HEALTHINDICATORS
WATER QUALITY - ECOSYSTEM
HEALTH
Designated Uses of Surface Waters
Dissolved Oxygen and Water Quality
Impairment
Nutrient Inputs to Mainstem and
Tributary Waters
Cropland Acres Under Nutrient
Management Plans
Phosphorus Concentration in
Maryland's Chesapeake Bay
Nitrogen Concentration in
Maryland's Chesapeake Bay
Atmospheric Nitrogen Loading
Cropland Acres Under Integrated Pest Management
TIDAL AQUATIC SYSTEMS
NON-TIDAL AQUATIC SYTEMS
TERRESTRIAL SYSTEM DEGRADATION,
FRAGMENTATION, ISOLATION
CONSERVATION OF BIOLOGICAL DIVERSITY
PUBLIC INTERFACEINDICATORS
Phosphorus Concentration In Maryland's Chesapeake BayIndicator development and data responsibility: DNR, Tidewater Ecosystem Assessment Division, 410-260-8630
Data/Graph:
Status and Trends of Phosphorus Concentration in the Maryland Portion of the Chesapeake Bay
Goal: Improve and protect quality of surface waters.
Indicator: Unfortunately, there are no scientifically established goals for "good" and "poor" levels of phosphorus to use for assessing the current conditions (status). Instead, a benchmark scale was developed using Bay-wide data from 1985-1997 for use as a relative scale for each salinity zone (tidal fresh, oligohaline and mesohaline). Each station is scored based on this relative scale and the score is used to categorize the water quality as"good" (lowest concentrations), "fair" (moderate concentrations), and "poor" (high concentrations).
Status: Phosphorus concentrations (1995-1997) are relatively fair to good in most parts of the Maryland Bay with the exception of Back River. Phosphorus concentrations (1985-1997) are improving in many areas, but are still degrading in the Potomac, Bush, and lower mainstem.
Benchmark: Benchmark is under development by the Chesapeake Bay Program.
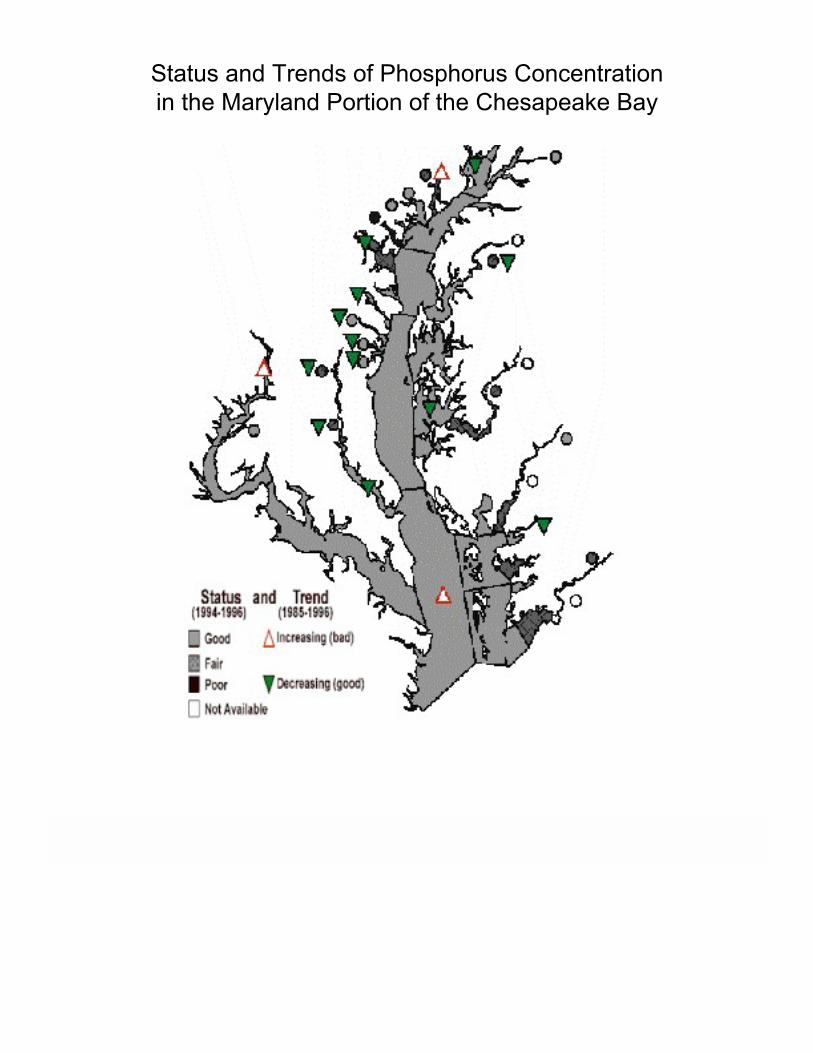
Status and Trends of Phosphorus Concentration
in the Maryland Portion of the Chesapeake Bay

INTRODUCTION
PUBLIC HEALTH INDICATORS
ECOSYSTEM HEALTHINDICATORS
WATER QUALITY - ECOSYSTEM
HEALTH
Designated Uses of Surface Waters
Dissolved Oxygen and Water Quality
Impairment
Nutrient Inputs to Mainstem and
Tributary Waters
Cropland Acres Under Nutrient
Management Plans
Phosphorus Concentration in
Maryland's Chesapeake Bay
Nitrogen Concentration in
Maryland's Chesapeake Bay
Atmospheric Nitrogen Loading
Cropland Acres Under Integrated Pest Management
TIDAL AQUATIC SYSTEMS
NON-TIDAL AQUATIC SYTEMS
TERRESTRIAL SYSTEM DEGRADATION,
FRAGMENTATION, ISOLATION
CONSERVATION OF BIOLOGICAL DIVERSITY
PUBLIC INTERFACEINDICATORS
Nitrogen Concentration in Maryland's Chesapeake BayIndicator development and data responsibility: DNR, Tidewater Ecosystem Assessment Division, 410-260-8630
Data/Graph:
Status and Trends of Nitrogen Concentration in the Maryland Portion of the Chesapeake Bay
Goal: Improve and protect quality of surface waters.
Indicator: Unfortunately, there are no scientifically established goals for "good" and "poor" levels of nitrogen to use for assessing the current conditions (status). Instead, a benchmark scale was developed using Bay-wide data from 1985-1996 for use as a relative scale for each salinity zone (tidal fresh, oligohaline and mesohaline). Each station is scored based on this relative scale and the score is used to categorize the water quality as"good" (lowest concentrations), "fair" (moderate concentrations), and "poor" (high concentrations).
Status: Nitrogen concentrations (1994-1996) are relatively fair to good in most parts of the Maryland Bay; exceptions are the Back, Patapsco,Chester, Nanticoke, Wicomico Rivers and Pocomoke Sound. Nitrogen concentrations (1985-1996) are improving in some Western Shore tributaries, but are degrading (increasing) in many areas of the Eastern Shore.
Benchmark: Benchmark is under development by the Chesapeake Bay Program.
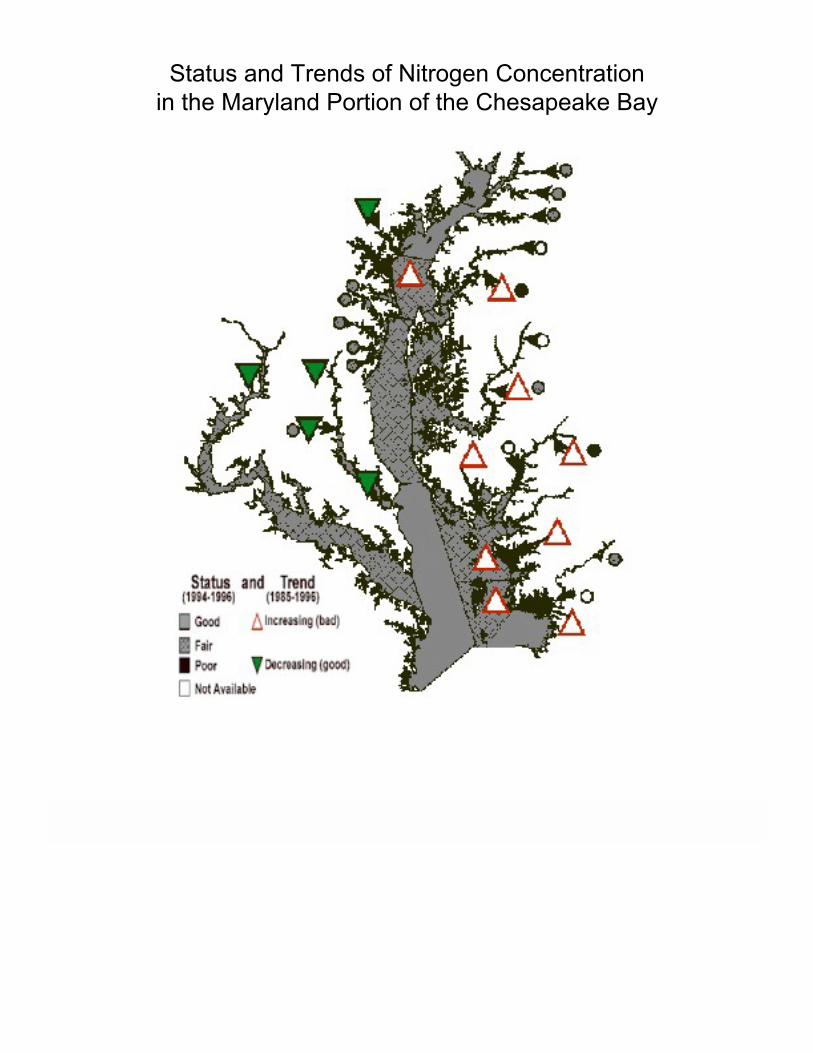
Status and Trends of Nitrogen Concentration
in the Maryland Portion of the Chesapeake Bay
INTRODUCTION
PUBLIC HEALTH INDICATORS
ECOSYSTEM HEALTHINDICATORS
WATER QUALITY - ECOSYSTEM
HEALTH
Designated Uses of Surface Waters
Dissolved Oxygen and Water Quality
Impairment
Nutrient Inputs to Mainstem and
Tributary Waters
Cropland Acres Under Nutrient
Management Plans
Phosphorus Concentration in
Maryland's Chesapeake Bay
Nitrogen Concentration in
Maryland's Chesapeake Bay
Atmospheric Nitrogen Loading
Cropland Acres Under Integrated Pest Management
TIDAL AQUATIC SYSTEMS
NON-TIDAL AQUATIC SYTEMS
TERRESTRIAL SYSTEM DEGRADATION,
FRAGMENTATION, ISOLATION
CONSERVATION OF BIOLOGICAL DIVERSITY
PUBLIC INTERFACEINDICATORS
Atmospheric Nitrogen LoadingIndicator development and data responsibility: MDE, Air Quality Program, 410-631-3260
Data/Graphs:
Overall Nitrogen Sources to the BayAtmospheric NOx Deposition to the Bay
Goal: Improve and protect the water quality of the Chesapeake Bay.
Indicator: Nitrogen oxides are largely formed as a result of combustion processes. Emission sources include vehicles, utilities, industries. Approximately 75% of the atmospheric nitrogen deposition reaching the Chesapeake Bay and its watershed originates from emission sources located within the designated Chesapeake Bay airshed. The EPA estimates that the remaining 25% originates from emission sources outside the airshed. Approximately 40% of the deposition originates from sources within Maryland, Pennsylvania, Virginia, and the District of Columbia.
Status: Atmospheric nitrogen currently is responsible for approximately 27% of the nitrogen reaching the Chesapeake Bay.
Benchmark: No specific benchmarks have been established for atmospheric nitrogen reductions; they await results from the Air Subcommittee of the Chesapeake Bay Program.
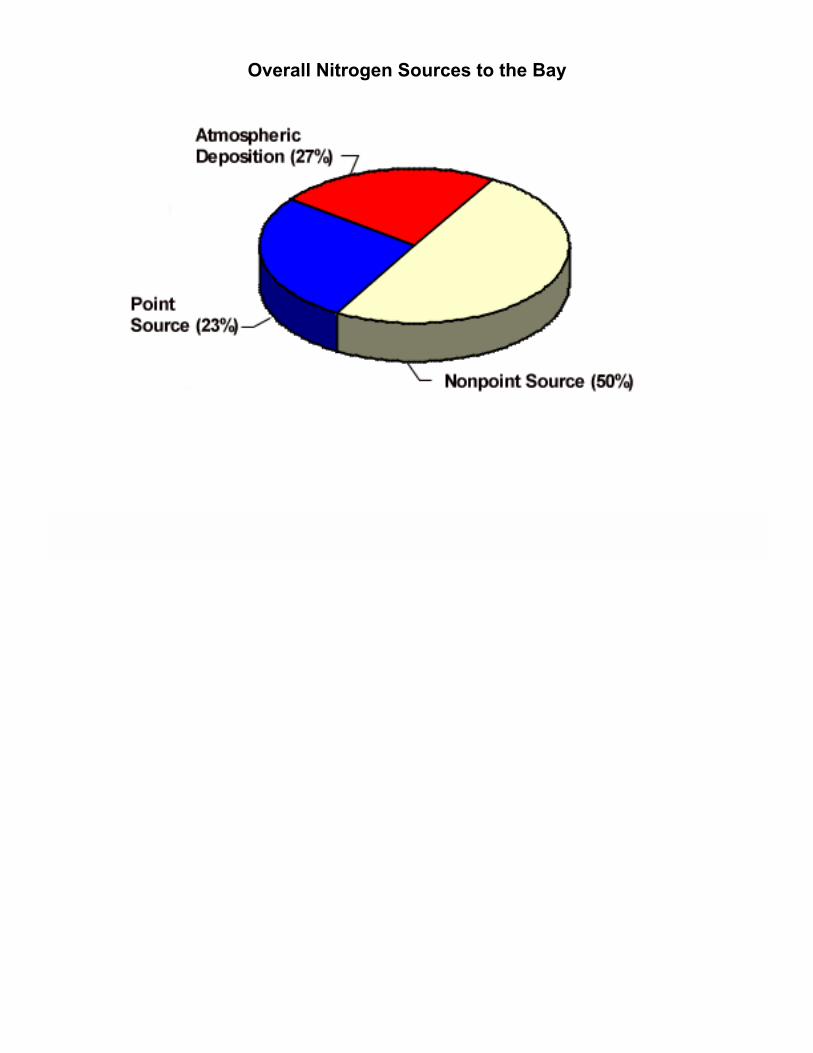
Overall Nitrogen Sources to the Bay
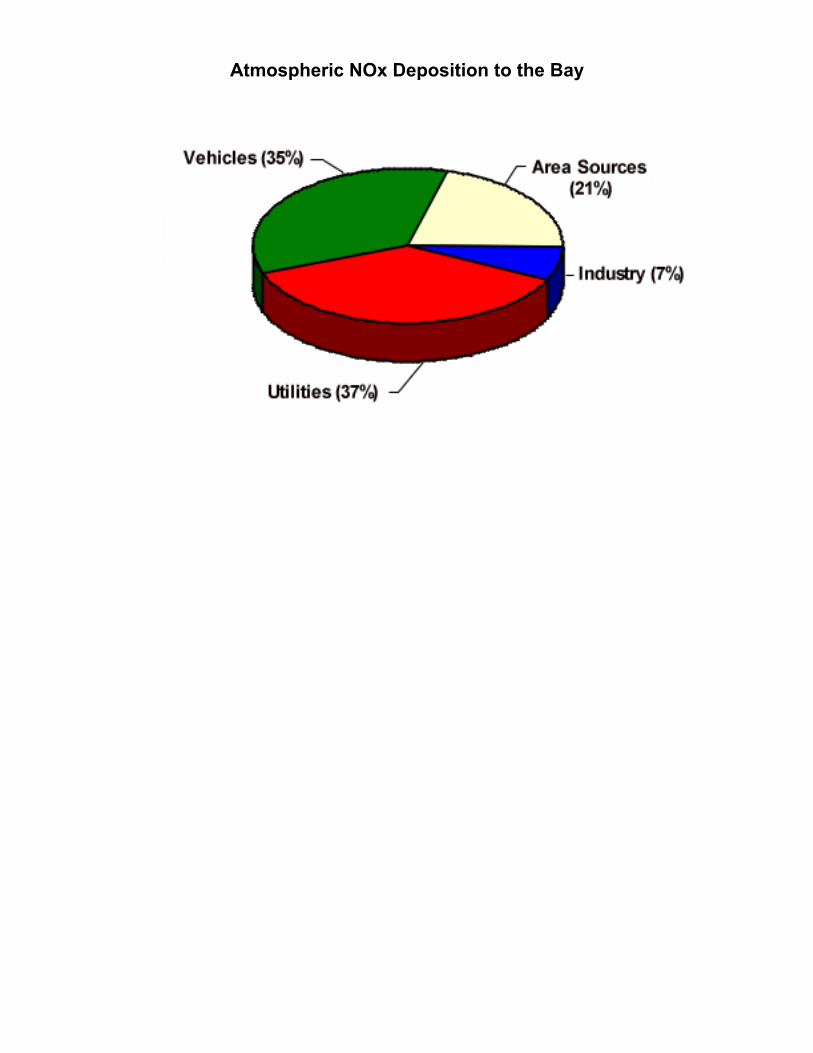
Atmospheric NOx Deposition to the Bay

INTRODUCTION
PUBLIC HEALTH INDICATORS
ECOSYSTEM HEALTHINDICATORS
WATER QUALITY - ECOSYSTEM
HEALTH
Designated Uses of Surface Waters
Dissolved Oxygen and Water Quality
Impairment
Nutrient Inputs to Mainstem and
Tributary Waters
Cropland Acres Under Nutrient
Management Plans
Phosphorus Concentration in
Maryland's Chesapeake Bay
Nitrogen Concentration in
Maryland's Chesapeake Bay
Atmospheric Nitrogen Loading
Cropland Acres Under Integrated Pest Management
TIDAL AQUATIC SYSTEMS
NON-TIDAL AQUATIC SYTEMS
TERRESTRIAL SYSTEM DEGRADATION,
FRAGMENTATION, ISOLATION
CONSERVATION OF BIOLOGICAL DIVERSITY
PUBLIC INTERFACEINDICATORS
Cropland Acres Under Integrated Pest Management (IPM) Indicator development and data responsibility: Chesapeake Bay Program Office, 1-800-968-7229
Data/Graph:
Cropland Acres Under IPM
Goal: Establish voluntary Integrated Pest Management (IPM) practices on the Chesapeake Bay watershed.
Indicator: IPM practices include measures that could allow farmers and landscapers to reduce the use of pesticides and may lead to reductions in the amounts of pesticides entering waterways. The indicator here tracks only "scouting," the regular monitoring of crops to determine if and when treatments are needed-based on biological and/or aesthetic thresholds-to keep pest numbers low enough to prevent intolerable damage or annoyance.
Several other IPM practices are currently being tracked, however those practices are not reflected in this indicator since they have not been previously tracked. The other practices include: adjusting crop row spacing, crop rotation, adjusting planting and harvest dates, soil testing to identify pest problems, cleaning equipment, calibrating sprayer, using spot treatments, considering weather forecasts prior to spraying, rotating mode of action (e.g., type of pesticide used) to suppress resistance.
Status: In 1997, IPM practices were used on over 1.3 million acres of agricultural cropland in the state. There are 1.62 million acres of cropland in the state, therefore, voluntary IPM practices had been established on 80% in 1997. The benchmark has been achieved.
Benchmark: By 2000, establish voluntary integrated pest management practices on 75% (1.215 million acres) of cropland in the state.
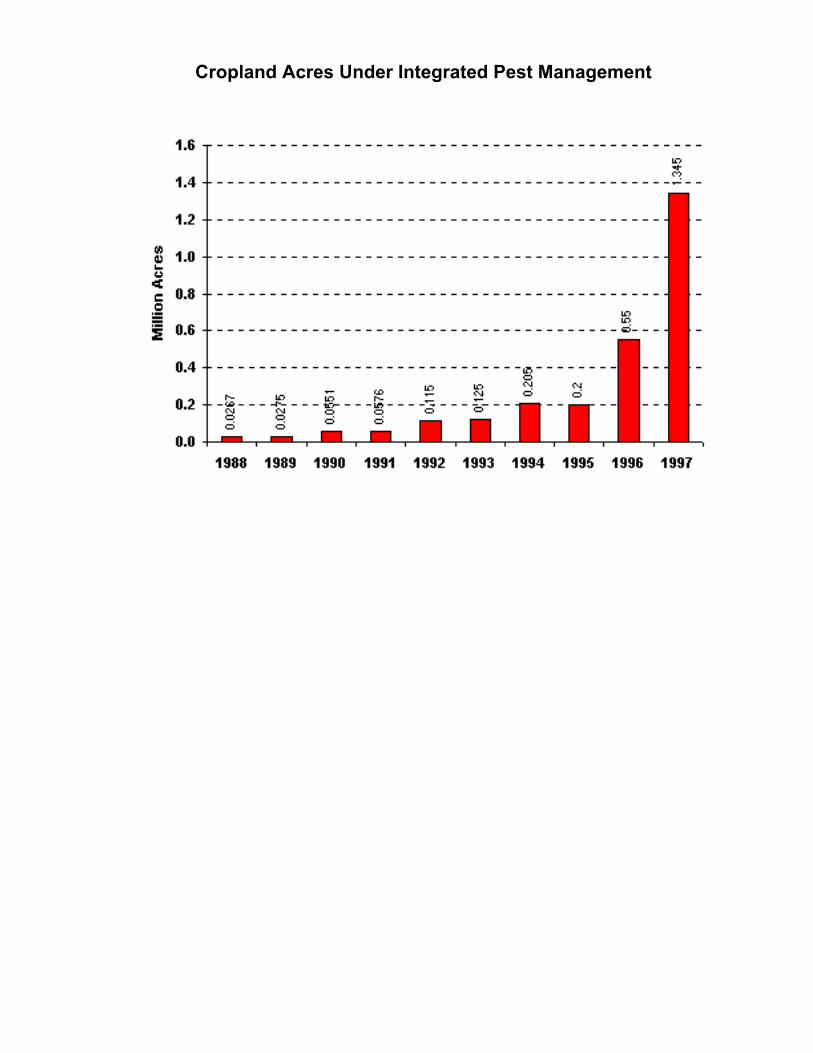
Cropland Acres Under Integrated Pest Management

INTRODUCTION
PUBLIC HEALTH INDICATORS
ECOSYSTEM HEALTHINDICATORS
WATER QUALITY - ECOSYSTEM HEALTH
TIDAL AQUATIC SYSTEMS
Submerged Aquatic Vegetation Habitat
Quality
Acres of Submerged Aquatic Vegetation
Benthic Index of Biotic Integrity - Chesapeake Bay
Fish Index of Biotic Integrity - Estuarine
Striped Bass Juvenile Index
American Shad Population
Blue Crab Population
Seed Oyster Production
NON-TIDAL AQUATIC SYTEMS
TERRESTRIAL SYSTEM DEGRADATION,
FRAGMENTATION, ISOLATION
CONSERVATION OF BIOLOGICAL DIVERSITY
PUBLIC INTERFACEINDICATORS
TIDAL AQUATIC SYSTEMS
Tidal aquatic systems include the entire range of plants and animals found in a water environment subject to the ebb and flow of the tide. The living organisms are dependent on the physical and chemical characteristics of their habitats as well as upon interactions among the biological elements of the system. Living organisms include plants, such as algae and the Bay grasses referred to as SAV that provide food and protective cover for many species; benthic, or bottom-dwelling, organisms; and animals which move freely through the water. The tidal system includes animals necessary in the food chain of higher levels of animals, as well as the fish, shellfish and crustaceans which play such an important part in Maryland's image and help to support its economy. Health of tidal aquatic systems depends upon successful functioning of all of these components in physically and chemically supportive habitats.
Ecological processes are of concern in dealing with entire systems, not just the individual component species: flows of energy and cycling of materials are sustaining ecological processes; biological processes of reproduction, growth and decay must be supported in suitable habitats; predator-prey relationships between species need to be in balance.
Goals
● Conserve natural ecological communities (whole groups of biological species) ● Maintain viable populations of native species ● Maintain natural evolutionary and ecological processes ● Ensure adequate protection of Maryland's valuable wetland resources
Stressors/Sources: Tidal aquatic systems are degraded chemically by the input of various pollutants, including organic materials and nutrients from industries and sewage treatment plants (points), and from non-point sources like urban and farm run-off and atmospheric deposition. Toxic materials from a variety of sources may also affect aquatic organisms. These aquatic systems are altered or degraded physically by erosion and efforts to control erosion, by sedimentation, temperature and salinity changes, dredging, filling and channel modifications. Some of these impacts are naturally occurring; some are due entirely to human activity; most are aggravated by human activities. Biological degradation occurs when the effects of chemical and physical degradation, and in some cases harvesting by humans or attack by disease organisms, interact with the living species present in the system, affecting some directly and impacting others through changes to the overall community composition or interference with ecological processes.
High nutrient levels have been identified as the major water quality problem causing degradation of tidal aquatic systems in Maryland. They cause algal blooms (cloudy water resulting from excessive microscopic plant growth)and epiphytic growth (small plants that grow on the SAV) which harm SAV by reducing the amount of light reaching the plants. Epiphytic growth also aggravate mechanical stress on the SAV, contributing to breakage under wave action. And as the algae decay, they use dissolved oxygen in the water, stressing or outright killing necessary benthic organisms and other desirable species.
Changes in the landscape, like increasing urban development and additions to the transportation system, often accelerate nutrient and toxics delivery to aquatic habitats and lead to physical degradation as well. For example, urban landscapes without adequate ground cover lack nutrient retention capacity and contribute excess nutrients downstream. Particularly important are the increases in hydraulic efficiency provided by paving large areas and providing storm sewers and ditches to speed the movement of water, and associated nutrients and contaminants, away from buildings or other human use areas. Activities on the land also cause increased inputs of sediment, further clouding the water and affecting light penetration; sedimentation also can blanket the bottom, affecting bottom-dwelling organisms and the habitat necessary to support them.

Desirable food species, including shad, crabs and striped bass, are or have been stressed at times by overharvesting; in some cases their reproduction has been affected by landscape change, while alterations in plant composition has disrupted the food supply, particularly for filter-feeders. Oysters, important to water quality in their role as filter-feeders as well as to the economy, have been severely hurt in recent years by the parasites MSX and Dermo and can be affected by salinity levels in the Bay. These, in turn, may vary with weather conditions, clearly outside the reach of any of the State's management programs.
Management Objectives: While the Maryland Department of Environment's management objectives are directed primarily toward regulating human activities to reduce the input of pollutants to aquatic systems, DNR's management objectives focus on three different types of activities. First is improving the scientific basis for decision-making, through activities like monitoring water quality and living resources and developing models of probable responses to intervention. The Department also works to protect and restore habitat for various living resources species through physical interventions like planting Bay grasses or moving oyster shell to provide appropriate bottom conditions for oyster development. Finally, both recreational and commercial fishing are regulated, based on estimates of species populations and monitoring of their health and reproduction. Cooperation in the inter-governmental Chesapeake Bay Program and other inter-agency cooperative efforts is an important element in DNR's work toward these objectives.
The Indicators: The indicators of tidal aquatic system health which follow were chosen in part because of the availability of the data necessary to support them. They essentially describe the condition of the system. Although they do not describe the entire system, they do include important components of it, and they both reflect the results of past management interventions and point to the need for additional attention. Note that chemical water quality indicators (largely stressors in themselves) are treated separately in another section, although they are clearly of great significance in influencing the indicators that follow.
There is always some element of judgment required in assigning particular indicators to particular broad themes-this is a reflection of the interconnectedness of elements when we deal with ecosystems. Some of the living resource indicators described below may, in other DNR applications, appear associated with other themes with which DNR programs deal. For a statewide picture of the overall health of Maryland's environment, however, they are also appropriate for inclusion below as indicators of Tidal Aquatic System health.

INTRODUCTION
PUBLIC HEALTH INDICATORS
ECOSYSTEM HEALTHINDICATORS
WATER QUALITY - ECOSYSTEM HEALTH
TIDAL AQUATIC SYSTEMS
Submerged Aquatic Vegetation Habitat
Quality
Acres of Submerged Aquatic Vegetation
Benthic Index of Biotic Integrity - Chesapeake Bay
Fish Index of Biotic Integrity - Estuarine
Striped Bass Juvenile Index
American Shad Population
Blue Crab Population
Seed Oyster Production
NON-TIDAL AQUATIC SYTEMS
TERRESTRIAL SYSTEM DEGRADATION,
FRAGMENTATION, ISOLATION
CONSERVATION OF BIOLOGICAL DIVERSITY
PUBLIC INTERFACEINDICATORS
Submerged Aquatic Vegetation Habitat QualityIndicator Development and Data Responsibility: DNR, Tidewater Ecosystem Assessment Division, 410-260-8630
Data/Graph:
Submerged Aquatic Vegetation Habitat Quality
Goal: Improve and protect quality of surface waters.
Indicator: SAV habitat quality status based a composite of available light, suspended solids, algae, dissolved inorganic nitrogen and phosphorus. This indicator identifies areas providing adequate habitat to 1 meter depth for SAV.
Status: Over the period 1996-1998, 62% of Maryland Chesapeake Bay segments have at least marginal (borderline) SAV habitat quality.
Benchmark: Achieve adequate SAV habitat quality for all Maryland Chesapeake Bay tidal waters.

SAV Habitat Quality
INTRODUCTION
PUBLIC HEALTH INDICATORS
ECOSYSTEM HEALTHINDICATORS
WATER QUALITY - ECOSYSTEM HEALTH
TIDAL AQUATIC SYSTEMS
Submerged Aquatic Vegetation Habitat
Quality
Acres of Submerged Aquatic Vegetation
Benthic Index of Biotic Integrity - Chesapeake Bay
Fish Index of Biotic Integrity - Estuarine
Striped Bass Juvenile Index
American Shad Population
Blue Crab Population
Seed Oyster Production
NON-TIDAL AQUATIC SYTEMS
TERRESTRIAL SYSTEM DEGRADATION,
FRAGMENTATION, ISOLATION
CONSERVATION OF BIOLOGICAL DIVERSITY
PUBLIC INTERFACEINDICATORS
Acres of Submerged Aquatic VegetationIndicator Development and Data Responsibility: DNR, Tidewater Ecosystem
Assessment Division, 410-260-8630
Data/Graph:
Acres of Submerged Aquatic Vegetation
Goal: Conserve natural ecological communities and maintain viable populations of native species.
Indicator: Acres of submerged aquatic vegetation
Status: Approximately 49% of the Tier 1 benchmark was achieved in 1998. The tier 1 benchmark of approximately 62,000 acres represents the area inhabited by SAV from 1971 to 1990. Tier 2 represents SAV restoration to a depth of one meter in all suitable areas. Tier 3 represents restoration to a depth of two meters in all suitable areas.
Benchmark: By 2005, increase submerged aqautic vegetation (SAV) coverage in Maryland to approximately 61,700 acres.

AAcres offSAV

INTRODUCTION
PUBLIC HEALTH INDICATORS
ECOSYSTEM HEALTHINDICATORS
WATER QUALITY - ECOSYSTEM HEALTH
TIDAL AQUATIC SYSTEMS
Submerged Aquatic Vegetation Habitat
Quality
Acres of Submerged Aquatic Vegetation
Benthic Index of Biotic Integrity - Chesapeake Bay
Fish Index of Biotic Integrity - Estuarine
Striped Bass Juvenile Index
American Shad Population
Blue Crab Population
Seed Oyster Production
NON-TIDAL AQUATIC SYTEMS
TERRESTRIAL SYSTEM DEGRADATION,
FRAGMENTATION, ISOLATION
CONSERVATION OF BIOLOGICAL DIVERSITY
PUBLIC INTERFACEINDICATORS
Benthic Index of Biotic Integrity-Chesapeake BayIndicator Development and Data Responsibility: DNR, Tidewater Ecosystem Assessment Division, 410-260-8630
Data/Graph:
Percentage of Total Area Meeting Benthic Community Restoration Goals
Goal: Conserve natural ecological communities and maintain viable populations of native species.
Indicator: Benthic communities from various places around the Bay are evaluated on measures of species diversity, species composition, productivity, and trophic composition. For each benthic community, a numeric rating is assigned for each attribute based on whether the community approximates (a score of 5), deviates slightly from (a score of 3) or deviates strongly from (a score of 1) a goal comprised of the characteristics of the attribute at reference sites. These are then averaged to determine the overall score used to classify the benthic community at a site. Scores within each of six regions are used to determine the percent of the region's area that meets the Restoration Goals.
Status: Status is assessed for six regions of the Maryland portion of the Bay. In 1997, the percent of total area which met Goals was:
● Upper Bay, 75%; ● Mainstem (except the deep trench), 56%; ● Potomac River, 26%; ● Patuxent River, 72%;● Upper Western Tributaries, 52%; ● Eastern Tributaries, 84%.
Benchmark: Meet community restoration goals in 100% of area of Bay and tributaries.

Benthic Communities in the Chesapeake Bay

INTRODUCTION
PUBLIC HEALTH INDICATORS
ECOSYSTEM HEALTHINDICATORS
WATER QUALITY - ECOSYSTEM HEALTH
TIDAL AQUATIC SYSTEMS
Submerged Aquatic Vegetation Habitat
Quality
Acres of Submerged Aquatic Vegetation
Benthic Index of Biotic Integrity - Chesapeake Bay
Fish Index of Biotic Integrity - Estuarine
Striped Bass Juvenile Index
American Shad Population
Blue Crab Population
Seed Oyster Production
NON-TIDAL AQUATIC SYTEMS
TERRESTRIAL SYSTEM DEGRADATION,
FRAGMENTATION, ISOLATION
CONSERVATION OF BIOLOGICAL DIVERSITY
PUBLIC INTERFACEINDICATORS
Fish Index of Biotic Integrity-EstuarineIndicator Development and Data Responsibility: DNR, Tidewater Ecosystem Assessment, 410-260-8630
Data/Graph:
Estuarine Fish Community Index of Biotic Integrity
Goal: Conserve natural ecological communities.
Indicator: Estuarine Fish Community Index of Biotic Integrity. The Estuarine Fish Index of Biotic Integrity (IBI) score represents a composite index that accounts for the total number of species, number of species that comprise 90%, number of species captured in the bottom trawl, total abundance with menhaden removed, abundance of estuarine fish, abundance of anadromous fish, proportion of planktivores, proportion of carnivores and proportion of benthivores.
Status: Only four of the thirteen tributaries sampled meet reference standards.
Benchmark: Achieve reference consitions in all sampled tributaries.

Estuarine Fish Community Index of Biotic Integrity
Fish community indicators for Chesapeake Bay tidal tributaries sampled between 1989 and 1997.
IBI scores were averaged to get an overall rating for each tributary.

INTRODUCTION
PUBLIC HEALTH INDICATORS
ECOSYSTEM HEALTHINDICATORS
WATER QUALITY - ECOSYSTEM HEALTH
TIDAL AQUATIC SYSTEMS
Submerged Aquatic Vegetation Habitat
Quality
Acres of Submerged Aquatic Vegetation
Benthic Index of Biotic Integrity - Chesapeake Bay
Fish Index of Biotic Integrity - Estuarine
Striped Bass Juvenile Index
American Shad Population
Blue Crab Population
Seed Oyster Production
NON-TIDAL AQUATIC SYTEMS
TERRESTRIAL SYSTEM DEGRADATION,
FRAGMENTATION, ISOLATION
CONSERVATION OF BIOLOGICAL DIVERSITY
PUBLIC INTERFACEINDICATORS
Striped Bass Juvenile IndexIndicator Development and Data Responsibility: Maryland DNR, Fisheries Service, 410-260-8268
Data/Graph:
Young-of-Year Striped Bass - Maryland (Geometric Mean)
Goal: Maintain viable populations of native species.
Indicator: The striped bass juvenile index is used as one of the parameters to estimate future population levels. Four river systems (Potomac, Choptank, Nanticoke, and Upper Bay), sampled once a month for three months (July to September), covering 22 sites.
Status: The 1998 Juvenile Index was 5.50, above the average for the period.
Benchmark: Maintain juvenile index at or above average catch per haul of 4.32, the Target Period Average (TPA). This is the average of indices from 1959-1972, a period of stable biomass and general stock health.

Young-of-the-Year Striped Bass - Maryland (Geometric Mean)
INTRODUCTION
PUBLIC HEALTH INDICATORS
ECOSYSTEM HEALTHINDICATORS
WATER QUALITY - ECOSYSTEM HEALTH
TIDAL AQUATIC SYSTEMS
Submerged Aquatic Vegetation Habitat
Quality
Acres of Submerged Aquatic Vegetation
Benthic Index of Biotic Integrity - Chesapeake Bay
Fish Index of Biotic Integrity - Estuarine
Striped Bass Juvenile Index
American Shad Population
Blue Crab Population
Seed Oyster Production
NON-TIDAL AQUATIC SYTEMS
TERRESTRIAL SYSTEM DEGRADATION,
FRAGMENTATION, ISOLATION
CONSERVATION OF BIOLOGICAL DIVERSITY
PUBLIC INTERFACEINDICATORS
American Shad PopulationIndicator Development and Data Responsibility: DNR, Fisheries Service, 410-260-8268
Data/Graph:
American Shad Adult Population (Estimated at 95% Confidence Interval)
Goal: Maintain viable populations of native species.
Indicator: Estimate of the adult American shad population in the Upper Bay. There is a 95% probability that the true number of Shad in the Upper Bay in a given year is within the range depicted in the shaded area.
Status: 1998 population estimate was about 488,000 adult shad. There is currently a moratorium on the harvest of American shad from the Chesapeake Bay.
Benchmark: Restore the American Shad population to a level that would support a limited fishery.

American Shad Adult Population
Estimated at 95% Confidence Interval
INTRODUCTION
PUBLIC HEALTH INDICATORS
ECOSYSTEM HEALTHINDICATORS
WATER QUALITY - ECOSYSTEM HEALTH
TIDAL AQUATIC SYSTEMS
Submerged Aquatic Vegetation Habitat
Quality
Acres of Submerged Aquatic Vegetation
Benthic Index of Biotic Integrity - Chesapeake Bay
Fish Index of Biotic Integrity - Estuarine
Striped Bass Juvenile Index
American Shad Population
Blue Crab Population
Seed Oyster Production
NON-TIDAL AQUATIC SYTEMS
TERRESTRIAL SYSTEM DEGRADATION,
FRAGMENTATION, ISOLATION
CONSERVATION OF BIOLOGICAL DIVERSITY
PUBLIC INTERFACEINDICATORS
Blue Crab PopulationIndicator Development and Data Responsibility: DNR, Fisheries Service, 410-260-8268
Data/Graph:
Overall Crabs Per Tow
Goal: Maintain viable populations of native species.
Indicator: The numbers graphed are from the summer trawl survey. They provide an indicator of relative abundance of blue crabs. The data are used, along with other survey results, to develop a Blue Crab Advisory Report on the status of the stock.
Status: As of 1998, blue crabs are fully exploited.
Benchmark: The Chesapeake Bay Blue Crab Target Setting Task Force will develop numerical targets that relate stock size to changes in exploitation.

Overall Crabs Per Tow

INTRODUCTION
PUBLIC HEALTH INDICATORS
ECOSYSTEM HEALTHINDICATORS
WATER QUALITY - ECOSYSTEM HEALTH
TIDAL AQUATIC SYSTEMS
Submerged Aquatic Vegetation Habitat
Quality
Acres of Submerged Aquatic Vegetation
Benthic Index of Biotic Integrity - Chesapeake Bay
Fish Index of Biotic Integrity - Estuarine
Striped Bass Juvenile Index
American Shad Population
Blue Crab Population
Seed Oyster Production
NON-TIDAL AQUATIC SYTEMS
TERRESTRIAL SYSTEM DEGRADATION,
FRAGMENTATION, ISOLATION
CONSERVATION OF BIOLOGICAL DIVERSITY
PUBLIC INTERFACEINDICATORS
Seed Oyster Production Indicator Development and Data Responsibility: DNR, Fisheries Service, 410-260-8259
Data/Graph:
Number of Seed Oysters Planted
Goal: Maintain viable populations of native species.
Indicator: Number of seed oysters planted from Maryland seed areas. A significant portion of Maryland's oyster fishery depends on seed oyster production in areas of the Bay that receive good spat sets in most years. Seed-bearing shell from these seed areas is transplanted to productive growing areas which have not received adequate recruitment. Spat set is stimulated in seed areas by placing clean shells on suitable bottom each summer.
Status: Seed oyster production since 1992 has been limited by Bay salinity and other factors. Bay-wide spat recruitment is limited by availability of suitable substrate.
Benchmark: Provide enough shell to produce 500,000 bushels of seed-bearing shell per year.

Number of Seed Oysters Planted

INTRODUCTION
PUBLIC HEALTH INDICATORS
ECOSYSTEM HEALTHINDICATORS
WATER QUALITY - ECOSYSTEM HEALTH
TIDAL AQUATIC SYSTEMS
NON-TIDAL AQUATIC SYSTEMS
Miles of Streams Degraded by
Abandoned Mine Drainage
Stream Miles Open to Migratory Fish
Physical Habitat Index (Non-Tidal)
Benthic Macroinvertebarate
Index of Biotic Integrity (Non-Tidal)
Fish Index of Biotic Integrity (Non-Tidal)
Riparian Forest Buffers
TERRESTRIAL SYSTEM DEGRADATION,
FRAGMENTATION, ISOLATION
CONSERVATION OF BIOLOGICAL DIVERSITY
PUBLIC INTERFACEINDICATORS
NON-TIDAL AQUATIC SYSTEMS
Non-tidal aquatic systems encompass the range of plants and animals found in free-flowing rivers, streams, lakes and some wetlands-those not subject to the influence of tides. Some anadromous species of fish migrate from tidal into non-tidal systems to spawn and are thus temporary components of these systems. As with tidal systems, non-tidal systems incorporate physical and chemical components of habitats, as well as the interactions among biological species. Because of its importance to physical and chemical habitat and its contribution in cycling nutrients to aquatic species, riparian or near-shore vegetation is included in our consideration of non-tidal aquatic systems.
Goals
● Conserve natural ecological communities and maintain viable populations of native species● Maintain natural ecological and evolutionary processes● Ensure adequate protection of Maryland's valuable wetland resources
Stressors/Sources: Non-tidal aquatic systems are degraded chemically by essentially the same mechanisms as tidal aquatic systems are: water pollution which results in depressed dissolved oxygen levels, toxic inputs, bacterial contaminants, changes to the food chain, and sediment. They are perhaps even more susceptible to physical degradation than tidal systems are: in addition to erosion and sedimentation, dredging and channel modifications (often in the name of flood control), physical degradation includes reductions in base flow, the amount of water flowing in streams between rain events, and thermal effects from removal of forests along shorelines. The systems are often fragmented by development of roads or other transportation facilities, reducing upstream-downstream movement of aquatic species. Hundreds of miles of streams tributary to the Chesapeake Bay are currently blocked by dams, culverts and other obstructions. Anadromous fish, such as shad and river herring, rely on access to freshwater streams with suitable bottom and current for spawning.
Loss of riparian forests to agricultural or residential uses results in a lack of buffering of both ground and surface water from impacts of adjacent land use activities, promoting the addition of sediments and nutrients to lakes and streams. It can also lead to additional adverse impacts on the living resources in the adjacent waters, including elevation of water temperature, reduction in stream bank stability, degradation of the aquatic food chain, and loss of habitat for aquatic as well as terrestrial species.
Water quality and physical habitat conditions in non-tidal streams and rivers are influenced by land use and land cover patterns in the watershed, such as increasing the area of impervious land cover like roads, roof-tops and parking lots. Increasing impervious surface not only hastens the run-off of stormwater into streams, with its associated contaminants; it also interferes with the percolation of rainwater and snow-melt into ground water, potentially reducing base flow in the streams. Encroachment by livestock into streams in agricultural areas represents a source of both physical and chemical degradation of these streams. Significant sources of environmental stress in some stream systems, especially in Western Maryland, abandoned mines contribute acid and metals from coal mines as well as suspended solids and sediments from both coal and non-coal mines.
Management Objectives: Through scientific monitoring and analysis, technical assistance and hands-on project implementation, DNR promotes development and implementation of watershed management strategies that will control and minimize water pollution, prevent the depletion of ground water supplies, minimize the area of impervious land cover, restore riparian forests and wetlands, keep livestock out of stream channels, and remove blockages to fish movements, thereby restoring access to historical spawning grounds for migratory and resident fish.

As part of its approach to regulating the range of human activities, including mining, which contribute to water pollution in non-tidal as well as tidal environments, MDE works to restore abandoned mine sites and to mitigate damage in streams adversely impacted by abandoned mine drainage.
The Indicators: The indicators discussed here by no means describe entire non-tidal aquatic ecosystems; they do represent a variety of the physical, chemical and biological characteristics of concern in dealing with these systems. The living resources indicators consider communities of living organisms as found throughout the water column, rather than any individual species. Their values reflect the physical and chemical water quality conditions described by other indicators, including those in the Water Quality section.
Only one indicator in this section deals with the land adjacent to streams-Riparian Forest Buffers. For this indicator there is a statewide benchmark, established through the Chesapeake Bay Program, thus a statewide report of an aggregated quantity is justified. Other landscape indicators which are of great importance to the health of non-tidal aquatic systems-impervious land cover or soil erodibility, for example-are more appropriately considered in fine spatial scale applications, such as the Clean Water Action Plan's Unified Watershed Assessment or an action strategy for a particular watershed.

INTRODUCTION
PUBLIC HEALTH INDICATORS
ECOSYSTEM HEALTHINDICATORS
WATER QUALITY - ECOSYSTEM HEALTH
TIDAL AQUATIC SYSTEMS
NON-TIDAL AQUATIC SYSTEMS
Miles of Streams Degraded by
Abandoned Mine Drainage
Stream Miles Open to Migratory Fish
Physical Habitat Index (Non-Tidal)
Benthic Macroinvertebarate
Index of Biotic Integrity (Non-Tidal)
Fish Index of Biotic Integrity (Non-Tidal)
Riparian Forest Buffers
TERRESTRIAL SYSTEM DEGRADATION,
FRAGMENTATION, ISOLATION
CONSERVATION OF BIOLOGICAL DIVERSITY
PUBLIC INTERFACEINDICATORS
Miles of Streams Degraded by Abandoned Mine DrainageIndicator Development and Data Responsibility: MDE Mining Program, 410-631-8055
Data/Graphs:
Stream Miles DegradedStream Miles Improved
Goal: Improve and protect Maryland's water quality
Indicator: Miles of streams degraded by acid mine drainage and miles of streams improved by programmed actions.
Status: An estimated 400 miles of streams were degraded by abandoned mine drainage in 1998. About 52 miles of impacted stream have been improved since 1972.
Benchmark: By 2000, reduce degraded stream miles to 390; achieve 20 restored stream miles over 1996 level.

Stream Miles Degraded

Stream Miles Improved

INTRODUCTION
PUBLIC HEALTH INDICATORS
ECOSYSTEM HEALTHINDICATORS
WATER QUALITY - ECOSYSTEM HEALTH
TIDAL AQUATIC SYSTEMS
NON-TIDAL AQUATIC SYSTEMS
Miles of Streams Degraded by
Abandoned Mine Drainage
Stream Miles Open to Migratory Fish
Physical Habitat Index (Non-Tidal)
Benthic Macroinvertebarate
Index of Biotic Integrity (Non-Tidal)
Fish Index of Biotic Integrity (Non-Tidal)
Riparian Forest Buffers
TERRESTRIAL SYSTEM DEGRADATION,
FRAGMENTATION, ISOLATION
CONSERVATION OF BIOLOGICAL DIVERSITY
PUBLIC INTERFACEINDICATORS
Stream Miles Open to Migratory FishIndicator development and data responsibility: Maryland DNR, Fisheries Service, 410-260-8341
Data/Graph:
Actual and Cumulative Stream Miles Reopened to Migratory Fish, 1989-1998
Goal: Maintain natural ecological and evolutionary processes.
Indicator: Stream miles reopened to migratory fish through a program of removing blockages. Both resident species and anadromous species of fish can be benefitted by removal of blockages or construction of projects to help move fish around obstructions.
Status: The construction of fish passages, through the completion of 50 projects between 1985 and 1998, has resulted in the reopening of 276.9 miles of streams in Chesapeake Bay watersheds and four miles of streams draining to the Coastal Bays.
Benchmark: By 2003, remove blockages and reopen 413 miles of the Chesapeake Bay's tributaries in Maryland.

Actual and Cumulative Stream Miles Reopened
to Migratory Fish, 1989-1998

INTRODUCTION
PUBLIC HEALTH INDICATORS
ECOSYSTEM HEALTHINDICATORS
WATER QUALITY - ECOSYSTEM HEALTH
TIDAL AQUATIC SYSTEMS
NON-TIDAL AQUATIC SYSTEMS
Miles of Streams Degraded by
Abandoned Mine Drainage
Stream Miles Open to Migratory Fish
Physical Habitat Index (Non-Tidal)
Benthic Macroinvertebarate
Index of Biotic Integrity (Non-Tidal)
Fish Index of Biotic Integrity (Non-Tidal)
Riparian Forest Buffers
TERRESTRIAL SYSTEM DEGRADATION,
FRAGMENTATION, ISOLATION
CONSERVATION OF BIOLOGICAL DIVERSITY
PUBLIC INTERFACEINDICATORS
Physical Habitat Index (Non-Tidal) Indicator Development and Data Responsibility: DNR, Monitoring and Non-Tidal Assessment Division,
410-260-8610
Data/Graph:
Estimated Percentage of Stream Miles Within Habitat Assessment Classes - Statewide
Goal: Conserve ecological communities
Indicators: A Physical Habitat Index (PHI) has been developed for small (first- to third-order) non-tidal streams. A decline in the PHI score reflects natural disturbances and alterations of the stream habitat relative to minimally-disturbed reference sites; it may represent impaired habitat for stream communities.
Eight physical habitat characteristics are measured, scored, weighted, and summed to calculate a PHI for each sampled stream. The coastal plain stream PHI has four characteristics in common with the non-coastal plain stream PHI. All components of the PHI are noted below.
● in-stream habitat structure ● velocity-depth diversity ● pool quality ● riffle quality ● embeddedness ● maximum depth ● number of root wads ● aesthetic quality
Status: The chart reflects three years of data and was compiled in 1998. A comprehensive DNR report covering the entire state, using three years of Maryland Biological Stream Survey (MBSS) data (1995, '96, '97), is scheduled for completion in June, 1999.
Benchmark: Achieve physical habitat index (PHI) scores of Good plus Fair in 75% of Maryland's stream miles.
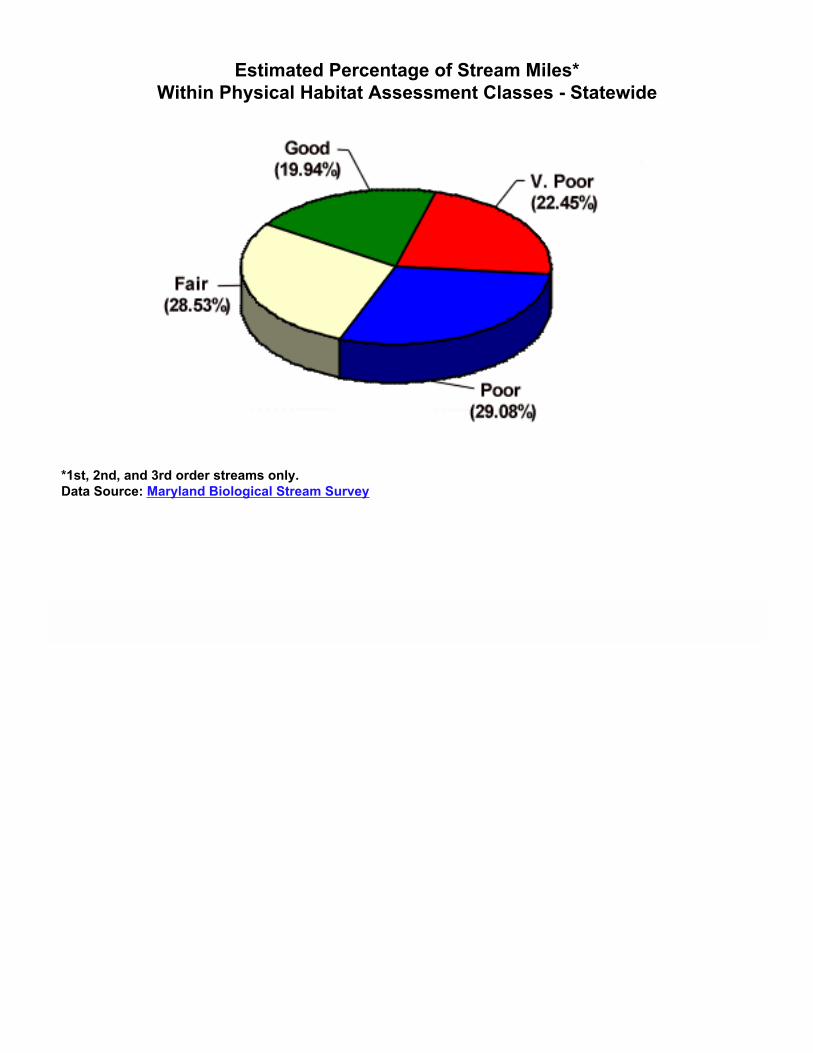
Estimated Percentage of Stream Miles*
Within Physical Habitat Assessment Classes - Statewide
*1st, 2nd, and 3rd order streams only.
Data Source: Maryland Biological Stream Survey

INTRODUCTION
PUBLIC HEALTH INDICATORS
ECOSYSTEM HEALTHINDICATORS
WATER QUALITY - ECOSYSTEM HEALTH
TIDAL AQUATIC SYSTEMS
NON-TIDAL AQUATIC SYSTEMS
Miles of Streams Degraded by
Abandoned Mine Drainage
Stream Miles Open to Migratory Fish
Physical Habitat Index (Non-Tidal)
Benthic Macroinvertebarate
Index of Biotic Integrity (Non-Tidal)
Fish Index of Biotic Integrity (Non-Tidal)
Riparian Forest Buffers
TERRESTRIAL SYSTEM DEGRADATION,
FRAGMENTATION, ISOLATION
CONSERVATION OF BIOLOGICAL DIVERSITY
PUBLIC INTERFACEINDICATORS
Benthic Macroinvertebrate Index of Biotic Integrity (Non-Tidal)Indicator Development and Data Responsibility: DNR, Monitoring and Non-Tidal Assessment Division, 410-260-8610
Data/Graph:
Estimated Percentage of Stream Miles Within Macroinvertebrate IBI Classes - Statewide
Goal: Conserve natural ecological communities.
Indicators: Benthic Indexes of Biological Integrity (BIBI) have been developed for the small (first- to third-order) non-tidal streams. The coastal plain stream BIBI includes seven characteristics of the benthic macroinvertebrate community. The non-coastal plain BIBI includes eight biological characteristics that are combined to assess the status of benthic macroinvertebrate communities in these streams:
All streams
● taxa number ● EPT taxa number ● % Ephemoptera
Coastal Plain, only
● % of Chironomidae that are Tanytarsini ● % clinger taxa ● % scrapers ● Florida Index
Non-Coastal Plain, only
● Ephemoptera taxa number ● Diptera taxa number ● % Tanytarsini (Diptera) ● % pollution intolerant taxa ● % collectors
Status: The BIBIs used in Maryland streams were recently developed. The chart reflects three years' data and was compiled in 1998. A decline in BIBI scores reflects natural variation and decreases in water quality and/or physical habitat conditions. BIBI scores generally declined across the state from west to east. A comprehensive DNR report covering the entire state, using three years of Maryland Biological Stream Survey (MBSS) data (1995, '96, '97), is scheduled for completion in June, 1999.
Benchmark: Attain BIBI scores of Good plus Fair for bethic macroinvertebrate community condition in 75% of Maryland's stream miles.

Estimated Percentage of Stream Miles*
Within Macroinvertebrate IBI Classes - Statewide
*1st, 2nd, and 3rd order streams only.
Data Source: Maryland Biological Stream Survey

INTRODUCTION
PUBLIC HEALTH INDICATORS
ECOSYSTEM HEALTHINDICATORS
WATER QUALITY - ECOSYSTEM HEALTH
TIDAL AQUATIC SYSTEMS
NON-TIDAL AQUATIC SYSTEMS
Miles of Streams Degraded by
Abandoned Mine Drainage
Stream Miles Open to Migratory Fish
Physical Habitat Index (Non-Tidal)
Benthic Macroinvertebarate
Index of Biotic Integrity (Non-Tidal)
Fish Index of Biotic Integrity (Non-Tidal)
Riparian Forest Buffers
TERRESTRIAL SYSTEM DEGRADATION,
FRAGMENTATION, ISOLATION
CONSERVATION OF BIOLOGICAL DIVERSITY
PUBLIC INTERFACEINDICATORS
Fish Index of Biotic Integrity (Non-Tidal)Indicator Development and Data Responsibility: DNR, Monitoring and Non-Tidal Assessment Division,
410-260-8610
Data/Graph:
Estimated Percentage of Stream Miles Within Fish IBI Classes - Statewide
Goal: Conserve natural ecological communities.
Indicators: Indexes of Biotic Integrity for fishes (FIBIs) have been developed for small (first- to third-order) non-tidal streams. Several characteristics of the fish community are measured, scored and summed to calculate an FIBI for each sampled stream:
● number of native species ● number of benthic species ● number of tolerant individuals ● % tolerant species ● % abundance of dominant species ● % generalists, omnivores and insectivores ● number of individuals/square meter ● biomass (grams/square meter) ● % lithophilic spawners ● % insectivores
Different combinations of these characteristics were combined to generate FIBIs for three regions in Maryland: coastal plain, eastern Piedmont, and highlands. A decline in FIBI scores reflects natural variation and decreases in water quality and/or physical habitat conditions.
Status: A report describing the results of FIBI assessments based on 1995 and 1996Maryland Biological Stream Survey (MBSS) sampling in 12 river basins is available from DNR. A comprehensive DNR report covering the entire state, using three years of MBSS data (1995, '96, '97), is scheduled for completion in June, 1999.
Benchmark: Achive FIBI of Good plus Fair in 75% of Maryland's stream miles.
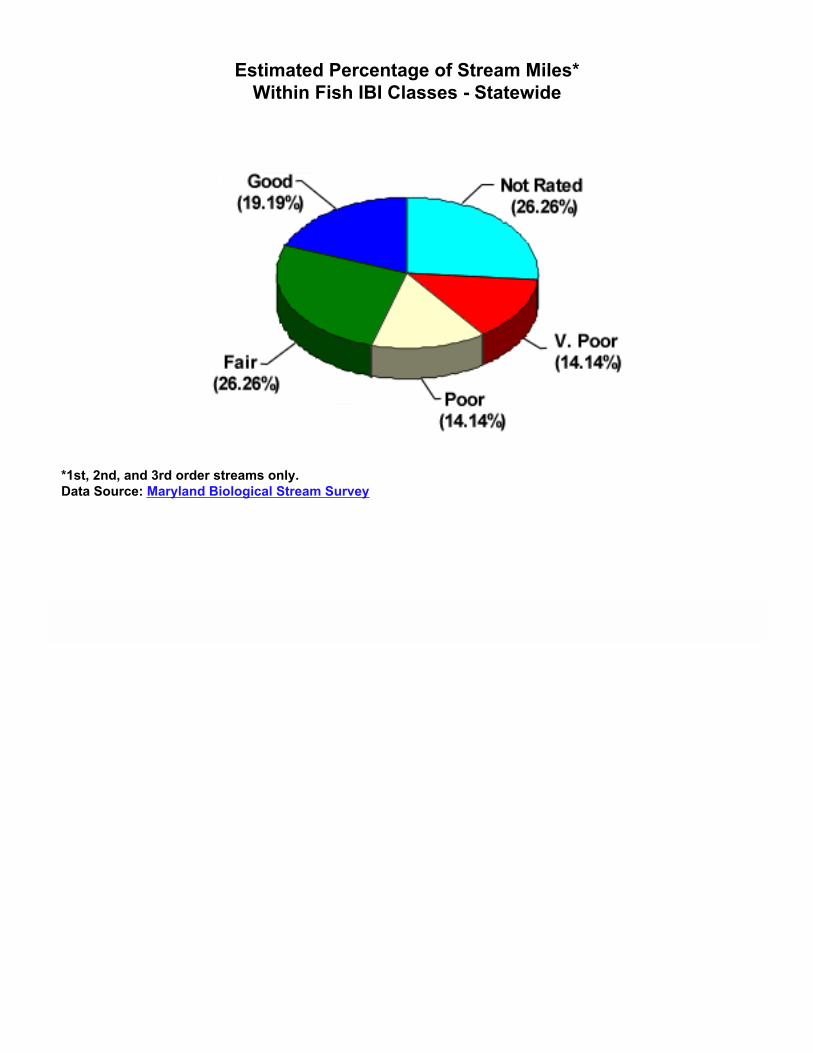
Estimated Percentage of Stream Miles*
Within Fish IBI Classes - Statewide
*1st, 2nd, and 3rd order streams only.
Data Source: Maryland Biological Stream Survey

INTRODUCTION
PUBLIC HEALTH INDICATORS
ECOSYSTEM HEALTHINDICATORS
WATER QUALITY - ECOSYSTEM HEALTH
TIDAL AQUATIC SYSTEMS
NON-TIDAL AQUATIC SYSTEMS
Miles of Streams Degraded by
Abandoned Mine Drainage
Stream Miles Open to Migratory Fish
Physical Habitat Index (Non-Tidal)
Benthic Macroinvertebarate
Index of Biotic Integrity (Non-Tidal)
Fish Index of Biotic Integrity (Non-Tidal)
Riparian Forest Buffers
TERRESTRIAL SYSTEM DEGRADATION,
FRAGMENTATION, ISOLATION
CONSERVATION OF BIOLOGICAL DIVERSITY
PUBLIC INTERFACEINDICATORS
Riparian Forest BuffersIndicator Development and Data Responsibility: DNR, Forest Service, 410-260-8531
Data/Graph:
Riparian Forest Buffers Reestablished
Goal: Maintain natural ecological and evolutionary processes.
Indicator: Miles of riparian forest buffers re-established on one side of a stream. Because property ownerships often end at a stream and only willing landowners are used for establishment of riparian forest buffers, one-side buffers are the units measured.
Status: Maryland has approximately 17,000 miles of streams depicted on United States Geological Survey (USGS) 7.5' quadrangle maps, plus an unmeasured number of miles of intermittent streams. A 1996 study carried out by Penn State University and submitted to the Chesapeake Bay Program Office found that nearly half of Maryland's streams lacked 100-foot buffers on both sides of the stream. Since then, 106 miles of forest buffer have been re-established.
Benchmark: By 2010, reestablish 600 miles of forest buffers, or 43 miles per year.

Riparian Forest Buffers Reestablished

INTRODUCTION
PUBLIC HEALTH INDICATORS
ECOSYSTEM HEALTHINDICATORS
WATER QUALITY - ECOSYSTEM HEALTH
TIDAL AQUATIC SYSTEMS
NON-TIDAL AQUATIC SYTEMS
TERRESTRIAL SYSTEM
DEGRADATION, FRAGMENTATION,
ISOLATION
Maryland Wetland Trends
Wetlands Restoration Initiative
Acres of Agricultural and Forest Lands
Protected Lands
Septic System Permits/Low Density
Residential Development
Acres of Abandoned Mine Lands
Brownfields/Federal Facilities Approved for Redevelopment
Recycling Municipal Solid Waste
CONSERVATION OF BIOLOGICAL DIVERSITY
PUBLIC INTERFACEINDICATORS
TERRESTRIAL SYSTEM DEGRADATION, FRAGMENTATION, ISOLATION
As urban development, road building and, to a lesser extent in recent years, expansion of agriculture and mineral extraction have converted more and more land to intensive human use, upland terrestrial habitats have been lost or fragmented into smaller and smaller pieces. Although the concern is usually associated with loss and fragmentation of forest, wetland and grassland losses are also considered here. Many bird and other wildlife species require large blocks of forest for successful breeding, or some life stage requires some specialized type of habitat more likely to be found in a large natural area than in a small patch. Connecting large patches of natural landscape with green corridors can help to maintain the viability of populations otherwise rendered vulnerable because of small numbers and/or isolation. In addition to their important habitat values, both forests and wetlands provide major water quality benefits which are difficult to replicate once the natural landscapes are lost.
There is an economic dimension to the loss and splitting up of resource lands also. The viability of both agriculture and forestry depends on the availability not just of suitable land but of uninterrupted tracts. Failure to protect substantial amounts of land from intensive development also increases the potential threat to maintaining biological diversity and the resource base needed to support natural resource based recreation. Increasing demands placed on existing public land resources for recreation can be detrimental to the maintenance of ecological functions at sites already acquired, while acquiring more natural area to meet the expanded need becomes more and more difficult-increased real estate values resulting from development pressure translate to less open space protected for each dollar spent.
Wetlands are a special system we have included as terrestrial, although clearly there is a strong tie to aquatic systems, particularly for those wetlands in the riparian zone. Some of the wetlands most susceptible to damage or destruction are those non-tidal wetlands which do not appear wet much of the time. For this reason, and because they support terrestrial fauna, we include wetlands here as part of the terrestrial system, recognizing their hydrologic connections to the aquatic systems considered elsewhere.
Goals
● Conserve natural ecological communities● Maintain natural evolutionary and ecological processes● Maintain viable populations of native species● Maintain Maryland's natural resource base
Stressors/Sources: Although natural processes like sea level rise and shoreline erosion contribute to the loss of wetlands, the primary stressors of natural terrestrial systems are largely human-induced. Human population growth, exacerbated by decreasing household sizes, continuing trends toward larger lot sizes, and out-migration from existing communities, has spurred the rapid conversion of natural areas to residential, commercial, and industrial uses. The actual loss of natural resource lands to intense human use is not the only problem here; the increasing fragmentation of the natural area that remains, into smaller and smaller patches, significantly stresses the maintenance of ecosystem health and the viability of important species.
Low density, sprawl, development, characteristic of much of what has occurred in recent years, is a stressor of aquatic systems as well as terrestrial: it is a major contributor of nutrients to local waterways. Research has revealed that low density development (1 unit per 5 acres) contributes nearly 17 times more phosphorus and 24 times more nitrogen per dwelling unit than high density development. Septic systems are the predominant form of sewage treatment in low density areas. Newer system designs, which allow for nutrient removal, are expensive and rarely utilized. Finally, low density development also requires the
increased use of automobiles, which consume gasoline and contribute nitrogen to the air that is subsequently deposited into waterways.
Failure to reuse previously disturbed lands, including mined areas and brownfields-older commercial or industrial sites and federal facilities sometimes left idle because of anticipated liability associated with potential contamination of the property-contributes to the increasing rate of consumption of open space, agricultural, and forest land. In addition to being wasteful of the land resource, abandoned mine lands constitute safety hazards for humans and environmental stressors through disturbance or destruction of terrestrial habitat for plant and animal species. Similarly, failure to reclaim potentially contaminated industrial sites, besides adding to land consumption pressures, does nothing to reduce exposure to materials which can harm living resources.
Management Objectives: The State's objectives, carried out by multiple agencies, include preventingfurther loss and fragmentation of terrestrial ecosystems and restoring ecosystem function where it has been disturbed. Actual expansion of riparian forest and wetlands is also among the management objectives. Both regulatory and voluntary or incentive-based approaches are taken to advance these objectives.
"Smart Growth" is a many-faceted approach to improving human use of the land and protecting natural resource values. Conservation and renewal of existing neighborhoods, encouraging new development which is more compact and readily serviced by existing public infrastructure-roads, water supply lines and sewers-cleanup and reuse of vacated former commercial or industrial sites and federal facilities, and reclamation of abandoned mine lands are all features of the Smart Growth initiative, along with expanded protection of open space.
DNR and MDE seek to work in collaboration with local and other State agencies with similar objectives, and with community groups and individuals, supporting their efforts through improved science and the means to apply scientific information to on-the-ground decisions. Through development of maps and data for dissemination to local governments, areas most sensitive to disturbance can be identified and avoided; through purchase of lands or easements on land, or grants to local governments to purchase land, important natural resource areas can be permanently set aside. Assistance is also provided to homeowners and other private sector landowners to improve management of their properties to support ecosystem concerns.
The Indicators: Terrestrial system indicators-those dealing with forest, grassland, most wetland environments, and the flora and fauna associated with them-are less well-developed than those for aquatic systems. Public attention has long been focused on aquatic systems, at least to some extent because of the early emphasis of much of the environmental movement on water pollution. Concern for terrestrial resources has grown along with the increasing attention being to devoted to land-based sources of water quality problems. What is happening to terrestrial ecosystems in their own right is an even more recent focus of interest; fewer data exist from which to construct indicators. Thus a number of the indicators which follow focus on human encroachments into natural areas, and the continuing stress of population and development on the natural resource base, and on activities undertaken to reduce this pressure, like decreasing the need for additional landfill space for solid waste.
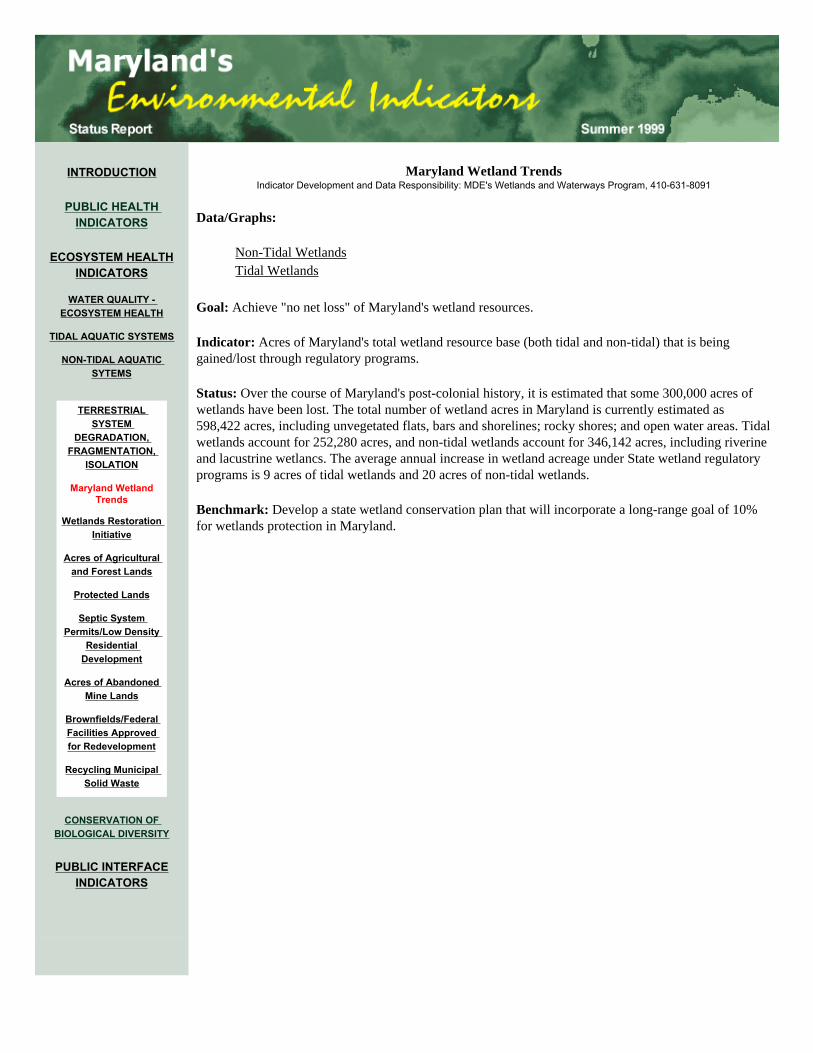
INTRODUCTION
PUBLIC HEALTH INDICATORS
ECOSYSTEM HEALTHINDICATORS
WATER QUALITY - ECOSYSTEM HEALTH
TIDAL AQUATIC SYSTEMS
NON-TIDAL AQUATIC SYTEMS
TERRESTRIAL SYSTEM
DEGRADATION, FRAGMENTATION,
ISOLATION
Maryland Wetland Trends
Wetlands Restoration Initiative
Acres of Agricultural and Forest Lands
Protected Lands
Septic System Permits/Low Density
Residential Development
Acres of Abandoned Mine Lands
Brownfields/Federal Facilities Approved for Redevelopment
Recycling Municipal Solid Waste
CONSERVATION OF BIOLOGICAL DIVERSITY
PUBLIC INTERFACEINDICATORS
Maryland Wetland TrendsIndicator Development and Data Responsibility: MDE's Wetlands and Waterways Program, 410-631-8091
Data/Graphs:
Non-Tidal WetlandsTidal Wetlands
Goal: Achieve "no net loss" of Maryland's wetland resources.
Indicator: Acres of Maryland's total wetland resource base (both tidal and non-tidal) that is being gained/lost through regulatory programs.
Status: Over the course of Maryland's post-colonial history, it is estimated that some 300,000 acres of wetlands have been lost. The total number of wetland acres in Maryland is currently estimated as 598,422 acres, including unvegetated flats, bars and shorelines; rocky shores; and open water areas. Tidal wetlands account for 252,280 acres, and non-tidal wetlands account for 346,142 acres, including riverine and lacustrine wetlancs. The average annual increase in wetland acreage under State wetland regulatory programs is 9 acres of tidal wetlands and 20 acres of non-tidal wetlands.
Benchmark: Develop a state wetland conservation plan that will incorporate a long-range goal of 10% for wetlands protection in Maryland.

Non-Tidal Wetlands

Tidal Wetlands

INTRODUCTION
PUBLIC HEALTH INDICATORS
ECOSYSTEM HEALTHINDICATORS
WATER QUALITY - ECOSYSTEM HEALTH
TIDAL AQUATIC SYSTEMS
NON-TIDAL AQUATIC SYTEMS
TERRESTRIAL SYSTEM
DEGRADATION, FRAGMENTATION,
ISOLATION
Maryland Wetland Trends
Wetlands Restoration Initiative
Acres of Agricultural and Forest Lands
Protected Lands
Septic System Permits/Low Density
Residential Development
Acres of Abandoned Mine Lands
Brownfields/Federal Facilities Approved for Redevelopment
Recycling Municipal Solid Waste
CONSERVATION OF BIOLOGICAL DIVERSITY
PUBLIC INTERFACEINDICATORS
Wetlands Restoration Initiative Indicator Development and Data Responsibility: MDE's Wetlands and Waterways Program, 410-631-8091
and the Wetlands Restoration Steering Committee, 410,631-8059
Data/Graph:
Progress Toward 60,000 Acre Goal
Goal: Ensure adequate protection and restoration of Maryland's wetlands resources.
Indicator: Acres of wetlands restored or created other than those required for mitigation under regulatory programs.
Status: A Wetlands Restoration Steering Committee has been appointed and is in the process of developing a strategy for the accomplishment of the management objective. The Maryland restoration program is being coordinated with the Chesapeake Bay Program wetland restoration initiative. An average annual increase of 85 acres of non-tidal wetlands is attributed to non-regulatory programs.
Benchmark: Restore and create 60,000 acres of tidal and non-tidal wetlands on a voluntary basis.
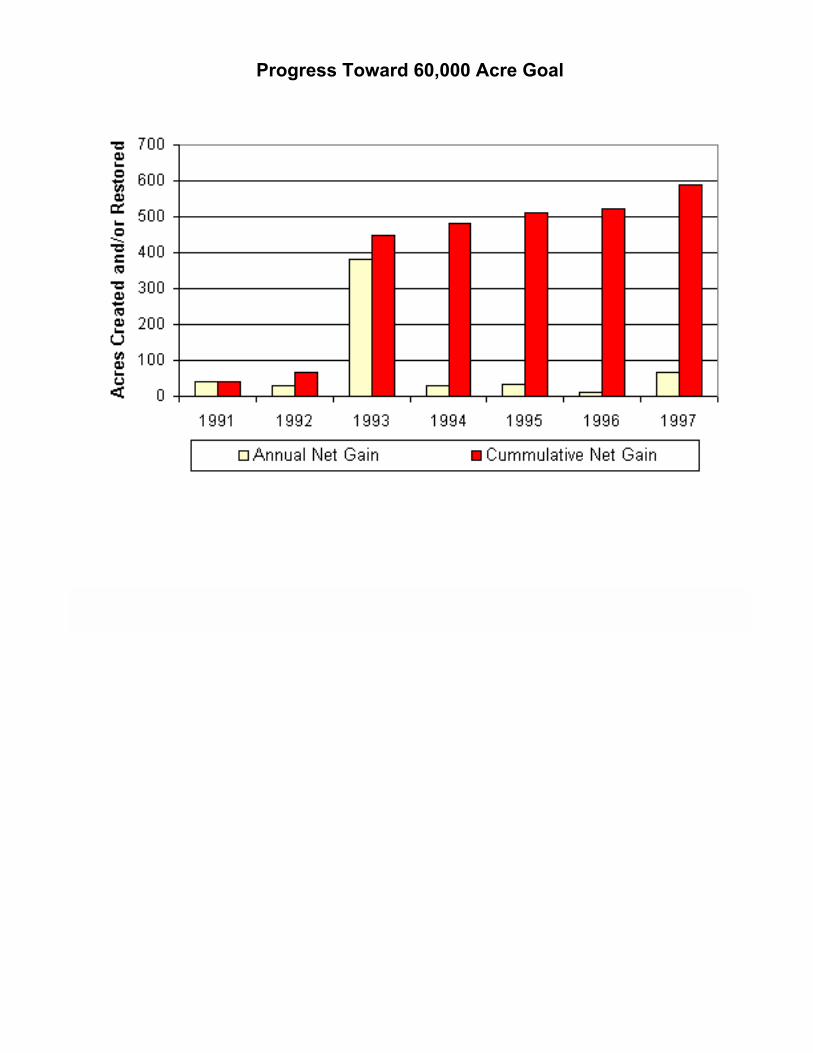
Progress Toward 60,000 Acre Goal

INTRODUCTION
PUBLIC HEALTH INDICATORS
ECOSYSTEM HEALTHINDICATORS
WATER QUALITY - ECOSYSTEM HEALTH
TIDAL AQUATIC SYSTEMS
NON-TIDAL AQUATIC SYTEMS
TERRESTRIAL SYSTEM
DEGRADATION, FRAGMENTATION,
ISOLATION
Maryland Wetland Trends
Wetlands Restoration Initiative
Acres of Agricultural and Forest Lands
Protected Lands
Septic System Permits/Low Density
Residential Development
Acres of Abandoned Mine Lands
Brownfields/Federal Facilities Approved for Redevelopment
Recycling Municipal Solid Waste
CONSERVATION OF BIOLOGICAL DIVERSITY
PUBLIC INTERFACEINDICATORS
Acres of Agricultural and Forest LandIndicator Development and Data Responsibility: Maryland Office of Planning, 410-767-4562
Data/Graph:
Acres of Resource Lands
Goal: Maintain Maryland's natural resource land base and encourage smart growth.
Indicator: Agricultural and forest lands are declining. These lands are important both for supporting valued sectors of the economy and for their aesthetic benefits to the public. Forest lands are particularly necessary for supporting a variety of species of both plants and animals native to Maryland, for their role protecting water quality, and for their effects on air quality.
The satellite and air photo data used to develop this indicator are not acquired on an annual basis, and their interpretation is time-consuming and expensive. For these reasons, changes in indicator values will not occur in annual increments.
Status: Statewide, the loss of forest land between 1973 and 1990, the latest period for which numbers are available, was 5.6%; agricultural land losses were over 4.7%. Significant losses of agricultural and forest land occurred in Central and Southern Maryland.
Benchmark: Reduced rate of agricultural and forest land conversions to non-resource use.

Acres of Resource Lands

INTRODUCTION
PUBLIC HEALTH INDICATORS
ECOSYSTEM HEALTHINDICATORS
WATER QUALITY - ECOSYSTEM HEALTH
TIDAL AQUATIC SYSTEMS
NON-TIDAL AQUATIC SYTEMS
TERRESTRIAL SYSTEM
DEGRADATION, FRAGMENTATION,
ISOLATION
Maryland Wetland Trends
Wetlands Restoration Initiative
Acres of Agricultural and Forest Lands
Protected Lands
Septic System Permits/Low Density
Residential Development
Acres of Abandoned Mine Lands
Brownfields/Federal Facilities Approved for Redevelopment
Recycling Municipal Solid Waste
CONSERVATION OF BIOLOGICAL DIVERSITY
PUBLIC INTERFACEINDICATORS
Protected Lands Indicator Development: Maryland DNR, Watershed Management and Analysis Division, 410-260-8790
Data/Graph:
Maryland Lands Protected Under Public Ownership or Easements
Goal: Maintain Maryland's natural resource land base.
Indicator: Acres of land in public ownership or under conservation or agricultural easement. These lands represent a public and private commitment to preventing urban type development and reserving portions of the landscape for natural resource and resource-based economic purposes.
Status: Land protected via public ownership or public easement programs in 1998 totaled over 846,100 acres, or over 13% of the total land base of the State. However, protected lands are not distributed evenly across the Maryland, or in proportion to the State's population, nor do they necessarily protect the areas with the greatest natural resource value. Natural lands accessible to the public are not being acquired at a rate proportional to population growth.
Benchmark: Protect open space at a level equal to or greater than the rate land is converted to non-open space uses.

Maryland Lands Protected
Under Public Ownership or Easements
Sources: DNR Lands--Acreage Report, 1998; Federal and Local Lands--
Office of Planning Open Space Acreage by Classification for Maryland, Dec. 1992;
MET Easements--Maryland Environmental Trust, Dec 1998; Agricultural Easements
--Maryland Agricultural Land Preservation Foundation, Summer 1998.

INTRODUCTION
PUBLIC HEALTH INDICATORS
ECOSYSTEM HEALTHINDICATORS
WATER QUALITY - ECOSYSTEM HEALTH
TIDAL AQUATIC SYSTEMS
NON-TIDAL AQUATIC SYTEMS
TERRESTRIAL SYSTEM
DEGRADATION, FRAGMENTATION,
ISOLATION
Maryland Wetland Trends
Wetlands Restoration Initiative
Acres of Agricultural and Forest Lands
Protected Lands
Septic System Permits/Low Density
Residential Development
Acres of Abandoned Mine Lands
Brownfields/Federal Facilities Approved for Redevelopment
Recycling Municipal Solid Waste
CONSERVATION OF BIOLOGICAL DIVERSITY
PUBLIC INTERFACEINDICATORS
Septic System Permits/Low Density Residential Development Indicator Development and Data Responsibility: Maryland Office of Planning, 410-767-4562
Data/Graph:
Ratio of Septic Permits to Total Building PermitsLow Density Residential Land
Goal: Reduce sprawl development.
Indicators:
1. Ratio of septic permits to total building permits, reflective of development occurring beyond the limits currently developed areas.
2. Acres of low density residential development, reflecting continuing high levels of land consumption for urban-type development.
Status: Large-lot development and concomitant use of septic tanks are both increasing.
Benchmark: A downward trend in the ratio of septic permits to total building permits issued, consistent witht he State's overall effort to encourage "Smart Growth."

Ratio of Septic Permits to Total Building Permits

Low Density Residential Land

INTRODUCTION
PUBLIC HEALTH INDICATORS
ECOSYSTEM HEALTHINDICATORS
WATER QUALITY - ECOSYSTEM HEALTH
TIDAL AQUATIC SYSTEMS
NON-TIDAL AQUATIC SYTEMS
TERRESTRIAL SYSTEM
DEGRADATION, FRAGMENTATION,
ISOLATION
Maryland Wetland Trends
Wetlands Restoration Initiative
Acres of Agricultural and Forest Lands
Protected Lands
Septic System Permits/Low Density
Residential Development
Acres of Abandoned Mine Lands
Brownfields/Federal Facilities Approved for Redevelopment
Recycling Municipal Solid Waste
CONSERVATION OF BIOLOGICAL DIVERSITY
PUBLIC INTERFACEINDICATORS
Acres of Abandoned Mine Lands Indicator Development and Data Responsibility: MDE, Mining Program, 410-631-8055
Data/Graphs:
Abandoned LandsRestoration Targets
Goal: Improve and protect Maryland's water quality.
Indicator: Extent to which terrestrial ecosystems disrupted prior to the enactment of stricter controls over mining have been restored to safe, productive use.
Status: An estimated 8,040 acres of abandoned mine lands currently exist in Maryland's two coal producing counties, i.e., Allegany and Garrett. About 1,460 acres have been reclaimed since 1972.
Benchmark: By 2000, reclaim 240 additional acres of abandoned mine sites, making the sites safe for humans and environmentally productive.

Abandoned Mine Lands

Restoration Targets
INTRODUCTION
PUBLIC HEALTH INDICATORS
ECOSYSTEM HEALTHINDICATORS
WATER QUALITY - ECOSYSTEM HEALTH
TIDAL AQUATIC SYSTEMS
NON-TIDAL AQUATIC SYTEMS
TERRESTRIAL SYSTEM
DEGRADATION, FRAGMENTATION,
ISOLATION
Maryland Wetland Trends
Wetlands Restoration Initiative
Acres of Agricultural and Forest Lands
Protected Lands
Septic System Permits/Low Density
Residential Development
Acres of Abandoned Mine Lands
Brownfields/Federal Facilities Approved for Redevelopment
Recycling Municipal Solid Waste
CONSERVATION OF BIOLOGICAL DIVERSITY
PUBLIC INTERFACEINDICATORS
Brownfields/Federal Facilities Approved for RedevelopmentIndicator Development and Data Responsibility: MDE, Environmental Restoration and Redevelopment Program, 410-631-3427
Data/Graphs:
Approved Brownfield SitesApproved Federal Facilities
Goals:
● Protect Maryland's natural resource land base ● Encourage smart growth.
Indicator: Acres of brownfields/federal facilities approved for development. Redevelopment approval results in environmental cleanups at properties that otherwise remain idle, and provide economic development benefits including new jobs and increased tax revenues, promoting growth management by using existing infrastructure and avoiding unnecessary development in undeveloped "greenfields."
Status:
● Six federal facilities approvals have been completed, representing 1,991 acres; ● 57 brownfields assessments have been completed to date, representing 408 acres; and ● 15 voluntary clean-up program sites have been completed, representing 227 acres.
Benchmark: By the year 2000, remediate 222 acres of brownfileds sites; by the year 2001, approve for remedial action and/or reuse one hundred percent of federal facilities slated for closure.

Approved Brownfield Sites

Approved Federal Facilities

INTRODUCTION
PUBLIC HEALTH INDICATORS
ECOSYSTEM HEALTHINDICATORS
WATER QUALITY - ECOSYSTEM HEALTH
TIDAL AQUATIC SYSTEMS
NON-TIDAL AQUATIC SYTEMS
TERRESTRIAL SYSTEM
DEGRADATION, FRAGMENTATION,
ISOLATION
Maryland Wetland Trends
Wetlands Restoration Initiative
Acres of Agricultural and Forest Lands
Protected Lands
Septic System Permits/Low Density
Residential Development
Acres of Abandoned Mine Lands
Brownfields/Federal Facilities Approved for Redevelopment
Recycling Municipal Solid Waste
CONSERVATION OF BIOLOGICAL DIVERSITY
PUBLIC INTERFACEINDICATORS
Recycling Municipal Solid Waste Indicator Development and Data Responsibility: MDE, Recycling Services Program, 410-631-3315.
Data/Graph:
Statewide Recycling Rate
Goal: Protect Maryland's natural resource land base.
Indicator: Statewide recycling rates. The recycling rate represents the tonnage of municipal solid waste recycled divided by the sum of the tonnage disposed plus the tonnage recycled.
In addition to increasing consumption of land for desired urban uses like housing and commercial/industrial development, population increase and present-day lifestyles have substantially increased the amount of material discarded by each household. The method of choice for disposing of this material has come to be the sanitary landfill, in most cases-another land-consuming activity. As recycling of municipal solid waste increases, devotion of land to development of landfills for solid waste disposal can be reduced.
Status: The 1998 Statewide recycling rate was 33%.
Benchmark: Maintain at least 33% statewide recycling rate.

Statewide Recycling Rate
INTRODUCTION
PUBLIC HEALTH INDICATORS
ECOSYSTEM HEALTHINDICATORS
WATER QUALITY - ECOSYSTEM HEALTH
TIDAL AQUATIC SYSTEMS
NON-TIDAL AQUATIC SYTEMS
TERRESTRIAL SYSTEM DEGRADATION,
FRAGMENTATION, ISOLATION
CONSERVATION OF BIOLOGICAL DIVERSITY
Forest Interior Breeding Bird Populations
Bald Eagle Population
Colonial Waterbird Population Trends
PUBLIC INTERFACEINDICATORS
CONSERVATION OF BIOLOGICAL DIVERSITY
In addition to their intrinsic interest, diverse natural communities in temperate zones are more resilient to the effects of human activities and natural hazards than less diverse communities. Interest in biological diversity has grown out of earlier concern for rare and endangered species as both professionals and lay environmental activists are taking a broader or more holistic look at maintaining entire ecosystems, attending to interactions among species, like predator-prey relationships and seed migration, as well as individual ecosystem components. Protecting Maryland’s communities of native species is a component of this issue. In this we include large acreages of widespread and abundant communities, contributing to the range of ecological processes, as well as smaller acreages of rare or highly diverse communities. Identifying the best examples of all of these communities is part of the job.
Lands representative of Maryland's biological diversity should be protected through public ownership or permanent easement in buffered core areas in order to preserve these diverse communities. Our land protection efforts, both fee acquisition and acceptance or purchase of conservation easements, have often not been directed by this concept, and the knowledge base to support this kind of decision-making is still being developed. The result is that DNR's public estate does not presently incorporate the most diverse and valuable natural areas in the State.
Attention to ecological processes also characterizes interest in biological diversity. Particular attention has been focused on the reproductive process as a result of declines in key species, like eagles, resulting from reproductive failures induced in the 1960's and ’70's by pesticide contamination. Nesting success is also an important focus of attention for other species.
Goals
● Maintain natural evolutionary and ecological processes● Conserve natural ecological communities● Maintain Maryland's natural resource land base ● Protect a core network of natural areas representative of Maryland’s biological diversity.
Stressors/Sources: Many species have particular habitat requirements for different life stages, like reproduction. As area-sensitive nesting species, many bird species are affected by habitat loss and fragmentation. For some species of birds, loss of interior forest, at least 300 feet from an adjacent type of land cover, eliminates the required habitat for nesting, while forest fragmentation results in reduced or no reproductive success, due to increased nestling predation and nest parasitism rates.
Water birds like herons nest in a few large colonies; these species as well as bald eagles require wooded shorelines and other wooded areas in close proximity to tidal waters to support large numbers of nests. Increased development of wooded shorelines and increased human activities within these areas can render the habitat unsuitable for nesting. As top predators, these birds also depend upon a stable and healthy prey base of fish and other aquatic animals.
Management Objectives: DNR is moving to an ecosystem approach to management in order to improve stewardship of the State's natural resources. It seeks to minimize or avoid the loss and isolation of native terrestrial habitats and to conserve habitats and processes necessary to support the diversity of native species, with particular emphasis on top predators in the food chain. Monitoring, data analysis and mapping are critical to the Department's ability to meet these objectives and to develop additional or more appropriate indicators to track future progress. Because the issue of protection of biological diversity and associated ecosystem concerns is new relative to the long-standing public concern with environmental pollution, public education and outreach are particularly important management

approaches.
DNR tries to incorporate in its land holdings exemplary representatives of all of the State’s major landscape types, geologically and biologically defined. Another reflection of this objective is the periodic designation, through legislation, of Wildlands, parts of DNR properties which do not receive active management in order that natural processes may proceed unimpeded.
The Indicators: Current indicators of biological diversity are derived from information which has been collected over several years for other purposes. Two indicators do cover a combination of species which have particular habitat needs, while the other deals with a single species which is a top predator in the landscape and highly symbolic nationally. As work that is currently under way is completed to identify biological community alliances, new indicators more representative of biological diversity can be developed.

INTRODUCTION
PUBLIC HEALTH INDICATORS
ECOSYSTEM HEALTHINDICATORS
WATER QUALITY - ECOSYSTEM HEALTH
TIDAL AQUATIC SYSTEMS
NON-TIDAL AQUATIC SYTEMS
TERRESTRIAL SYSTEM DEGRADATION,
FRAGMENTATION, ISOLATION
CONSERVATION OF BIOLOGICAL DIVERSITY
Forest Interior Breeding Bird Populations
Bald Eagle Population
Colonial Waterbird Population Trends
PUBLIC INTERFACEINDICATORS
Forest Interior Breeding Bird PopulationsIndicator Development and Data Responsibility: DNR, Wildlife and Heritage Division, 410-260-8540
Data/Graphs:
Maryland Breeding Bird Survey, 1966-1996Maryland Breeding Bird Survey, 1980-1996
Goals:
● Conserve natural ecological communities ● Maintain viable populations of native species.
Indicator: Number of forest interior breeding bird species with stable or increasing population trends. Declining populations of these species indicate that large, contiguous forested areas are being lost, degraded, or fragmented into smaller blocks of woodlands incapable of sustaining complete forest ecosystem functions.
Status: Eighteen of 21 species had stable or increasing long-term population trends during the period 1966-1996 and 18 of 21 species had stable or increasing recent, short-term population trends during 1980-1996.
Benchmark: Populations of all species of forest interior breeding birds remain stable or increase.
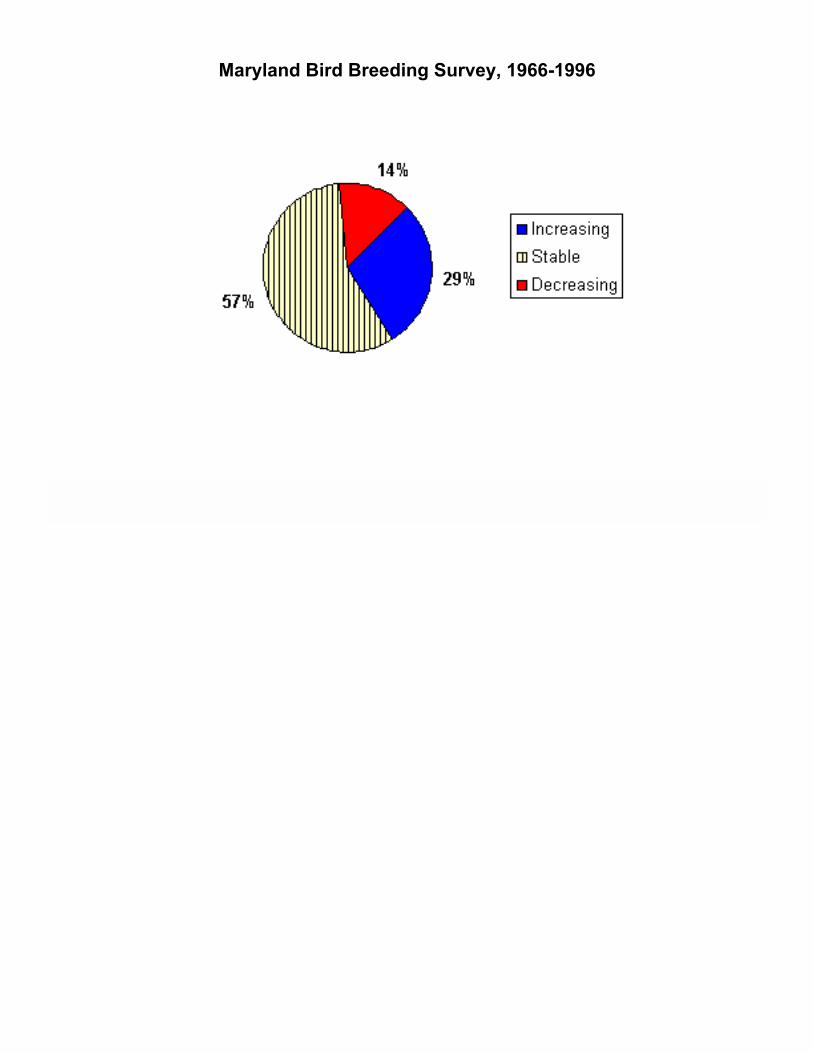
Maryland Bird Breeding Survey, 1966-1996

Maryland Bird Breeding Survey, 1980-1996

INTRODUCTION
PUBLIC HEALTH INDICATORS
ECOSYSTEM HEALTHINDICATORS
WATER QUALITY - ECOSYSTEM HEALTH
TIDAL AQUATIC SYSTEMS
NON-TIDAL AQUATIC SYTEMS
TERRESTRIAL SYSTEM DEGRADATION,
FRAGMENTATION, ISOLATION
CONSERVATION OF BIOLOGICAL DIVERSITY
Forest Interior Breeding Bird Populations
Bald Eagle Population
Colonial Waterbird Population Trends
PUBLIC INTERFACEINDICATORS
Bald Eagle PopulationIndicator Development and Data Responsibility: DNR, Wildlife and Heritage Division, 410-260-8540
Data/Graph:
Bald Eagle Nest Success
Goal: Maintain natural ecological and evolutionary processes.
Indicator: Number of successful bald eagle nesting pairs. As top predators susceptible to damage from contamination in the food chain, bald eagles tell an important part of the story about the health of the overall Chesapeake Bay system.
Status: There were 260 nesting pairs in 1999, of which 190 nested successfully. 1999 saw the first sighting of nesting pairs in Frederick County, bringing the total number of counties where nesting eagles have been sighted to 19. The new numbers meet minimum standards for designation as a fully recovered species, however the bald eagle remains for the time being on State and federal lists of threatened and endangered species.
Benchmark: The number of nesting pairs of bald eagles successfully fledging an average of one juvenile per nest remains at or above 200 annually.

Bald Eagle Nest Success
INTRODUCTION
PUBLIC HEALTH INDICATORS
ECOSYSTEM HEALTHINDICATORS
WATER QUALITY - ECOSYSTEM HEALTH
TIDAL AQUATIC SYSTEMS
NON-TIDAL AQUATIC SYTEMS
TERRESTRIAL SYSTEM DEGRADATION,
FRAGMENTATION, ISOLATION
CONSERVATION OF BIOLOGICAL DIVERSITY
Forest Interior Breeding Bird Populations
Bald Eagle Population
Colonial Waterbird Population Trends
PUBLIC INTERFACEINDICATORS
Colonial Waterbird Population TrendsIndicator Development and Data Responsibility: DNR, Wildlife and Heritage Division, 410-260-8540
Data/Graph:
Colonial Waterbird Population Trends, 1985-1995
Goal: Maintain natural ecological and evolutionary processes.
Indicator: Population trends for waterbirds which nest in large colonies. Declining populations of these species indicate that natural ecological processes have been compromised and the stability of the estuarine ecosystem may be in jeopardy
Status: Full surveys are conducted every five years, most recently in 1995. Eleven of 20 species had stable populations between 1985-1995; three species’ populations increased during 1985-1995; six populations decreased.
Benchmark: Populations of all species of colonial waterbirds remain stable or increase.
.
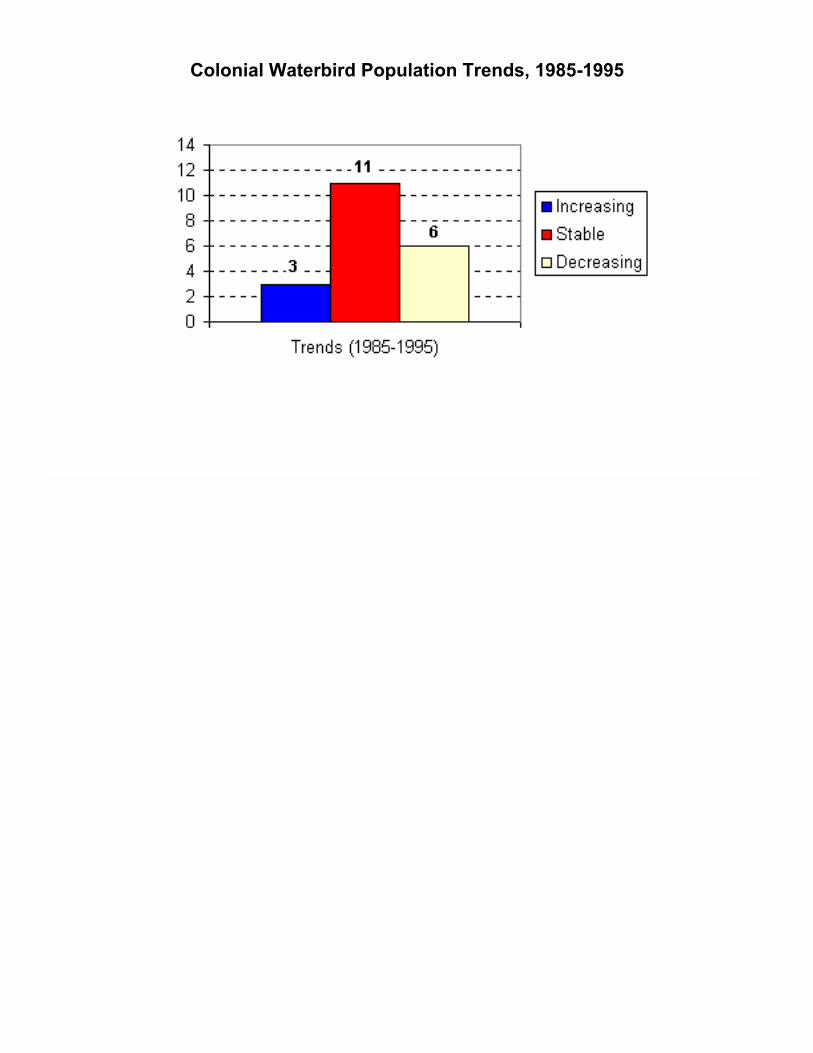
Colonial Waterbird Population Trends, 1985-1995

INTRODUCTION
PUBLIC HEALTH INDICATORS
ECOSYSTEM HEALTHINDICATORS
PUBLIC INTERFACEINDICATORS
PUBLIC UNDERSTANDING AND COMMUNITY SUPPORT
ENVIRONMENTAL JUSTICE
PUBLIC INTERFACE
The people of Maryland are at the heart of the State’s environmental management. Over the past three decades or so, the people have spoken clearly and repeatedly of their desire for protection of natural resources, clean-up of pollution, a healthy Chesapeake Bay. These desires find expression in a variety of State laws and regulations covering the range of goals and issues reflected in the Public Health and Ecosystem Health portions of this report.
A major tenet of the ecosystem-based management toward which the State is moving in its approach to the environment and natural resources is that people are part of the ecosystem–all of the people of Maryland are parts of the ecosystem(s) of the State, their health and quality of life affected by environmental conditions and many of their actions affecting other ecosystem components. Part of the job facing environmental managers at all levels of government is to bring together the social context with the science with which most of them have greater experience and comfort. A two-way communication system is called for–making environmental information available to the people, and hearing from the people their concerns and issues.
If indicators of public health and ecosystem health are constrained by the level of knowledge and the data available to measure what is happening "out there," indicators of social interaction with the environment are even less well developed. The indicators which follow provide a first cut at measuring our ability to convey information in a meaningful way, to children as well as adults, and how even-handed we are being in providing environmental programs to the people of Maryland.

INTRODUCTION
PUBLIC HEALTH INDICATORS
ECOSYSTEM HEALTHINDICATORS
PUBLIC INTERFACEINDICATORS
PUBLIC UNDERSTANDING AND COMMUNITY
SUPPORT
Envirothon Participants
Green Schools
Teaching Environmental Awareness in
Maryland - TEAM DNR
ENVIRONMENTAL JUSTICE
PUBLIC UNDERSTANDING AND COMMUNITY SUPPORT
More and more people are developing a stewardship ethic–a sense of personal responsibility for environmental protection and maintaining natural values–partly as a result of improved understanding and more experience in natural settings. And they are recognizing the need to act at the local level. One evidence of this is the welling up of volunteer effort, at both the State and local level, which is becoming more important as budget pressures tighten.
Education is a major component of Maryland’s efforts to improve environmental performance; it is a feature of many regulatory programs and a goal of most publications, press releases and briefings of decision-makers carried out by both the Maryland Department of Environment and the Department of Natural Resources. Education of all citizens, from children through adults, is a primary function of one of DNR’s operating units and underlies much of the programming of activities at State Parks. Clearly, environmental education goes beyond school and curriculum, although much of a family’s education may begin with the experiences of its school children.
Goals
● Increase community involvement in environmental management
Improve public education about environmental and natural resource issues
Stressors/Sources: Environmental issues are complex, and the science necessary to support effective approaches to dealing with them is still being developed. Decision-making in the arena of environmental improvement and natural resources management is thus, almost necessarily, seen as addressing "moving targets." The political instinct to place blame and look for immediate solutions to emerging problems, resource use conflicts between different interest groups, and public scares over perceived environmental catastrophes all illustrate the critical nature of this issue. Environmental issues, and educational efforts directed toward environment and natural resources, also must compete for public attention and educational resources with a myriad of other concerns and education needs. Improving public understanding and support for environmental programs thus must include translating emerging scientific understandings for the benefit of decision-makers, improving the communication of scientific information to the general public, improving teachers’ understanding of important issues, and developing improved environmental education programs and materials for school students.
Management Objectives: DNR and MDE’s management objectives target environmental education and include providing consistent information focused on environmental goals and outcomes, both to selected audiences and to a more general public through the mass media. Much of the Departments’ educational effort focuses on simply being available to numerous and diverse audiences, sometimes in their local settings, often at events they may be attending for recreational purposes. Development of written materials, particularly focused on lay or student audiences, permeates many other activities. Stimulating and supporting individual and civic interest and action needs to be part of how the State carries out the entire array of its environmental programs. The strategy is also to get people who have been reached by the information provided to expand their efforts in their own communities.
The Indicators: Public meetings held to discuss the initial Environmental Performance Partnership submissions in 1997, as well as those held more recently, elicited a number of comments on the need for indicators of environmental education efforts. One difficulty in arriving at outcome indicators is the time lapse between many education efforts, particularly those carried out through the school system, and the evidence–changed behaviors, community involvement–that the education has truly occurred. That is, programmatic efforts are several steps removed from the outcomes. One of the indicators that follows

attempts to overcome this difficulty, since the Green Schools program requires community activity concomitant with curricular activities. Green Schools is a new program, so the indicator as presented may change in future years.

INTRODUCTION
PUBLIC HEALTH INDICATORS
ECOSYSTEM HEALTHINDICATORS
PUBLIC INTERFACEINDICATORS
PUBLIC UNDERSTANDING AND COMMUNITY
SUPPORT
Envirothon Participants
Green Schools
Teaching Environmental Awareness in
Maryland - TEAM DNR
ENVIRONMENTAL JUSTICE
Envirothon ParticipantsIndicator Development and Data Responsibility: DNR, Education, Bay Policy and Growth Management, 410-260-8710
Data/Gaph:
Participation in Local Envirothon Activities
Goal: Improve public education about environmental and natural resource issues
Indicator: Number of students, statewide, participating in Envirothon, a national and statewide problem-solving competition to educate high school students about natural resource issues. Students receive training and testing in five areas: aquatics, forestry, wildlife, soils, and a topic which changes yearly and reflects an issue of national importance.
Students participate in a county level competition, with winners competing at the State level; the winning State team participates in a national competition. Maryland teams have place in the top five teams for the past five years.
Status: In 1998 there were 940 students participating in county Envirothon competitions.
Benchmark: By the year 2002, there will be an increase of 10% in the number of county participants.

Participation in Local Envirothon Activities

INTRODUCTION
PUBLIC HEALTH INDICATORS
ECOSYSTEM HEALTHINDICATORS
PUBLIC INTERFACEINDICATORS
PUBLIC UNDERSTANDING AND COMMUNITY
SUPPORT
Envirothon Participants
Green Schools
Teaching Environmental Awareness in
Maryland - TEAM DNR
ENVIRONMENTAL JUSTICE
Green SchoolsIndicator Development and Data Responsibility: DNR, Education, Bay Policy and Growth Management, 410-260-8710
Data/Graph:
Green Schools Participation
Goal: Improve public education about environmental and natural resource issues
Indicator: Green Schools Program participation. This new program was developed by a diverse team of educators representing the Maryland Association for Environmental and Outdoor Education, Office of the Governor, Maryland Association of Student Councils, and the Maryland Departments of Education, Natural Resources and Environment. Green Schools combines classroom studies with the use of the best management practices at schools and involves the community. The program provides non-competitive awards to recognize and celebrate the achievement of entire schools.
All public and non-public schools in Maryland are eligible to participate. No special curriculum is needed. Schools must demonstrate that they meet criteria in three areas:
● The school uses the environment as an integrating context or as an integral part of the school’s instruction program.
● Best environmental practices are modeled in the operation and design of the school facility.● The school extends its learning into the community through a variety of projects which address
local environmental issues.
Status: In 1999 there were 34 schools from 15 counties and Baltimore City selected from 62 applications to be Green Schools.
Benckmark: By 2002, 20% of Maryland Schoold will be Green Schools.

Green Schools Participation

INTRODUCTION
PUBLIC HEALTH INDICATORS
ECOSYSTEM HEALTHINDICATORS
PUBLIC INTERFACEINDICATORS
PUBLIC UNDERSTANDING AND COMMUNITY
SUPPORT
Envirothon Participants
Green Schools
Teaching Environmental Awareness in
Maryland - TEAM DNR
ENVIRONMENTAL JUSTICE
Teaching Environmental Awareness in Maryland–TEAM DNRIndicator Development and Data Responsibility: DNR, Education, Bay Policy and Growth Management, 410-260-8710
Data/Graph:
T.E.A.M. Classroom Programs
Goal: Improve public education about environmental and natural resource issues and increase community involvement.
Indicator: TEAM DNR is a new volunteer initiative to provide quality hands-on presentations to elementary school students around the State. The program is offered as a free service to schools. Each volunteer successfully completes a four month training program at DNR before entering the classroom. Many are retired teachers or other persons seeking to help educate students about the Chesapeake Bay. Their efforts provide an important link between DNR and schools. TEAM DNR has been well received by teachers and our requests for presentations continues to grow.
Status: During the first five months of 1999, TEAM volunteers have delivered more than 60 classroom presentations. Since the program’s inception, it has reached over 3000 students throughout the State.
Benchmark: By 2001, increase by 25% the number of programs delivered to Maryland schools.

T.E.A.M. Classroom Programs
INTRODUCTION
PUBLIC HEALTH INDICATORS
ECOSYSTEM HEALTHINDICATORS
PUBLIC INTERFACEINDICATORS
PUBLIC UNDERSTANDING AND COMMUNITY SUPPORT
ENVIRONMENTAL JUSTICE
Environmental JusticeIndicator Development and Data Responsibility: MDE’s Office of Communications, (410) 631-3003
What is Environmental Justice? There are many, and often changing, variations of the definition of Environmental Justice. MDE defines environmental justice as the equitable treatment of people of all races, income, and cultures with respect to the development, implementation, and enforcement of environmental laws, regulations, and policies. MDE maintains that no person or group of people should shoulder a disproportionate share of adverse environmental impacts resulting from the execution of environmental programs.
What is Maryland doing? MDE is committed to identifying opportunities to evaluate and enhance program delivery in Maryland consistent with environmental justice principles. Title VI of the Civil Rights Act of 1964 prohibits discrimination on the basis of race, color, or national origin in federally assisted programs. As recipients of federal grants and state funding, the Department recognizes its obligations under Title VI and is fully committed to complying with its provisions.
An activity running parallel to MDE’s development of Maryland’s Title VI Compliance program is the work being done by the Maryland Advisory Council on Environmental Justice (MACEJ). The MACEJ was established by the Maryland General Assembly in 1997 to advise the Governor and the General Assembly on matters relating to Environmental Justice and to make recommendations to State and Local governments regarding policies related to Environmental Justice.
MDE and the MACEJ have held a number of public meetings throughout the state to solicit thoughts and opinions about what environmental justice means to Maryland citizens and how environmental justice initiatives might help them. In addition, the MACEJ met with trade associations and MDE has engaged other governmental agencies to learn about their practices and procedures and to begin a dialogue on how to link environmental justice programs.
Based on this stakeholder input, MDE and the MACEJ developed Maryland’s Environmental Justice Compliance Plan to ensure the equitable treatment of all Marylanders and to enhance the public health. The plan will be particularly protective of the rights and needs of those in communities earmarked as affected by environmental injustices. The benefits of the plan include: 1) citizens in affected communities who know how to access, and understand information available at MDE; 2) targeted public participation enhancement in permitting matter facing affected communities: and 3) enhanced enforcement and compliance assistance in affected communities.
The MACEJ recently submitted its initial recommendations to the Governor and General Assembly. The recommendations include:
● MDE implementing a public outreach program;● MDE consider permitting implications in environmental justice communities;● MDE train permitting and enforcement personnel on environmental justice issues;● An Executive Order requiring other State agencies to consider impacts on environmental justice
communities; and● Ensuring that Maryland’s Smart growth programs and initiatives be sensitive to and include
environmental justice considerations.

INTRODUCTION
PUBLIC HEALTH INDICATORS
ECOSYSTEM HEALTHINDICATORS
PUBLIC INTERFACEINDICATORS
PUBLIC COMMENTS
PUBLIC COMMENTSIn this document, the Departments of Environment and Natural Resources have attempted to respond to each comment received on Maryland's Winter 1999 draft Environmental Indicators document which were received via mail, E-mail and at the six Environmental Partnership public meetings held in January/February, 1999. For each comment received, we have developed a response and indicate what action, if any, will be taken to revise the Indicators document.
Many comments focussed on edits/changes to specific Indicators, while some comments suggested finer grained or regional data, as opposed to statewide summary indicators. While this document will remain focussed on statewide summary indicators, it should be noted the goals and indicators report prepared for the Environmental Performance Partnership Agreement is not the only indicators work being done by MDE and DNR. For more information on these other indicators, please contact the Departments' Environmental Partnership representatives.
Percentage of Maryland Population Living in Areas that Meet Federal Air Quality Standards for Common Air Pollutants (p. 6/7)*
Q: Chart indicates % of population in areas that meet Federal air quality standards. Where is the chart that shows the percentage of the total population has actually been diagnosed as being afflicted because of air quality? If no one is afflicted, what is the purpose of the section?
Response: The health studies relating air pollution levels with specific health effects are contained in EPA’s documentation of their review of the health-based air quality standards, Air Quality Criteria for Ozone and Related Photochemical Oxidants (EPA 600P93004BF). Once the level of pollution causing adverse health effects is established as an air quality standard, direct comparison of pollutant levels to the air quality standard is the most effective way to establish whether an area meets the health-based standard and whether the air is safe to breathe. It is very difficult to obtain accurate information of how many people are actually afflicted because of air pollution. The American Lung Association and other interest groups commission studies on actual hospital admissions for various air pollution-aggravated illnesses in major metropolitan areas, but not on a regular or consistent basis. This data does not include people who are adversely affected but do not go to a hospital. Therefore, health data is not reliable as a primary indicator. Data from health studies will be incorporated in the text under Stressors/Sources when it is available for Maryland. Action: No action necessary.
Suggestion: Shorten Indicator title, perhaps to "Maryland population living in areas meeting air quality standards," this is still long but ... Response: Areas Meeting Air Quality Standards is a slightly shorter and simpler title. Action: Make suggested change.
Air Quality Data for Common Air Pollutants (p. 8/9)
Q: While Kent, Queen Anne's and Cecil Counties are listed as not meeting the ozone criteria there is no indication of why those areas are singled out. Under Stressors/Sources for particulate matter agricultural sites are listed. Specifically, what are those sites and what is the particulate matter involved? Under Management Objective, what are the proposed control strategies? Who established what the human body can take and why is that not reflected in the charts rather than what is generally found in the air? Response: All areas that are listed as not meeting the air quality standards have monitored data for ozone that show levels higher than the ozone standard.

These areas are separated into air quality planning areas for the purpose of developing air quality plans suited to the characteristics of the area, e.g. urban or rural. The planning areas generally follow the boundaries of metropolitan statistical areas. Counties that are not part of a metropolitan statistical area are grouped together based on similar geographic and demographic characteristics.
A variety of agricultural activities contribute to the development of particulate matter, especially fine particles. These include feed lots and fertilizer application which contribute to ammonia in the air. Grain storage and agricultural burning also produce fine dust.
The ozone attainment plan is being implemented in phases. Established programs include the enhanced VEIP program, Stage II vapor recovery, and open burning control. The National Low Emission Vehicle Program is an example of a regional program implemented to complete the ozone plan. Regional programs reduce pollution transported from one area. For a complete list of controls and descriptions in the ozone attainment plan, visit the air quality page of MDE’s website, http://www.mde.state.md.us.
The health studies relating air pollution levels with specific health effects are contained in EPA’s documentation of their review of the health-based air quality standards, Air Quality Criteria for Ozone and Related Photochemical Oxidants (EPA 600P93004BF). Once the level of pollution causing adverse health effects is established as an air quality standard, direct comparison of pollutant levels to the air quality standard is the most effective way to establish whether an area meets the health-based standard. See answer to question one about using charts based on afflicted populations. Action: No action necessary.
Q: Why don't you remove the tiny charts for lead, NO2, particulate, CO and SO2? These don't really provide any new information. The tiny charts are confusing and don't seem to add anything. If you do keep them in the document, please enlarge them and include definitions for all of the abbreviations (SEPS, SWPS, AREAS 1-6, and CBD-1). The numbers at the tops of the bars need to be larger and it would be useful to have the actual standards noted with a line or textual information (or both). Response: Air monitoring continues for lead, NO2, particulate matter, CO and SO2 even though levels of these pollutants are below national standards in Maryland. Control measures that keep these pollutant levels below the standards are still in effect. Therefore, it is appropriate to continue to report the results of the monitoring. Action: The charts will be enlarged so that numbers and labels are clearer. A line identifying the level of the standard will be added to each graph.
Suggestion: Please explain the group labels for lead, inhalable particulates and carbon monoxide. Also explain why only certain sites are presented. Response: Agree. Action: Definitions will be added. A footnote will be added noting that on all graphs except ozone, the abbreviations below the bars are station names. [Graphs no longer have bars labeled Areas 1 etc.] The monitor recording the highest level for each area is included in the graph.
Suggestion: Shorten Indicator title, perhaps to "Common Air Pollutants." Response: Agree. Action: Will change title to "Common Air Pollutants."
Number of Days Ozone Levels Were Above the 1-Hour National Ambient (outdoor) Air Quality Standard (p.10/11)
Suggestion: Explain in the text, the ratio of temperature to ozone graph. Does Maryland have a goal to keep this ratio below a certain level? Response: Levels of ground-level ozone are heavily influenced by meteorological conditions with the highest levels generally occurring during hot, stagnant weather patterns. Many meteorological factors such as wind speed and cloud cover are important, but temperatures above 90N F show the most direct correlation with pollution levels above the 1-hour ozone standard. Summers with significantly higher temperatures have significantly higher numbers of ozone exceedences. While the number of exceedences does not show a discernable trend, using a ratio of exceedence days to days with temperatures above 90N F does show that during the 1980’s, a temperature of 90N F or above indicated an exceedence was likely. In the 1990’s, a temperature of 90N F or above indicates only a 50% chance of an
exccedence day. Weather also plays a major role in the long range transport of precursor pollutants and ozone. The chart is intended as an interpretive aid to show trends in ozone levels in a way that minimizes the influence of weather. Maryland does not have an obligation to meet any ratios.
Suggestion: Shorten Indicator title, perhaps to "Ozone levels exceeding the 1-hour standard."
Response: Agree. Action: Change title to "Ozone Levels Above 1 Hour Outdoor Air Quality Standard".
Number of Times Ozone Levels Exceed the 8-Hour Ozone National Ambient (outdoor) Air Quality Standard (New) (p. 12/13)
Comment: The left graph is not user-friendly at all. The title is particularly confusing. Either delete it or change it, to perhaps AOzone levels exceeding 8-hour standard." What is the significance of the fourth highest 8-hour ozone level? Please explain. Response: The left graph is structured to show whether Maryland areas comply with the 8-hour ozone standard. The test for compliance with the standard is whether the fourth highest ozone level averaged over three years is less than the standard. The three year average dampens the effect extreme weather conditions in a single year can have on ozone levels. A standard line will be added to the chart. The chart on the right indicates what a chart of "Ozone levels exceeding 8-hour standard" would look like, a different concept from complying with the standard. Agree that title is confusing. Action: Changed Indicator title.
Change in Emissions by Source Category for Ozone-Forming Compounds (VOC and NOx) and Other Common Air Pollutants in the Baltimore Nonattainment Area (p. 14/15)
Suggestion: Shorten Indicator title, perhaps to AChange in emissions by source category." Response: Agree. Action: Change title to AChange in emissions by source category."
Q: Why don't you remove the tiny charts? These don't really provide any new information. The tiny charts are confusing and don't seem to add anything. If you do keep them in the document, please enlarge them and include definitions for all of the abbreviations. It would be useful to have the actual standards noted with a line or textual information (or both). Response: Agree. Action: The charts will be enlarged so that numbers and labels are clearer. New requirements for emissions inventories will focus on a number of new parameters important in the formation of ozone and particulate matter. The charts will be updated in the future to include newly required data. The charts show actual pollutant levels for the year indicated. A line identifying the level of the pollutant is not appropriate.
Shellfish Harvesting Waters (p. 16)
Q: Who did the statistical work on the amount of harvesting waters? Response: The statistics are based on total acres of Use II waters, those waters protected for propagation, storage, or harvesting of shellfish and includes areas that are actually harvested or have potential for harvesting oysters, softshell clams, hardshell clams, and brackish water clams (COMAR 26.08.02.03A). Action: No change
Comment on Usefulness: Percentages based upon areas which are not involved in shellfish harvest give a distorted view of the percent of approved vs. non approved areas. As an interesting side note the statement Shellfish harvesting is not permitted at any time from restricted areas certainly gives a good impression. However, the facts are that the enforcement of that shellfish harvesting restriction at the present time is impossible and the restrictions have been admittedly violated in the past. Yet, the emphasis on the consequences is a negative connotation instead of a positive presentation as to what can be done to prevent illness. (Typical bureaucratic writing) Response: See response to question above. Also, it is important that all USE II waters are protected to ensure the prospect of additional resources (potential oyster and clam habitat) occur in clean, safe waters. In response to enforcement, Maryland participates in the National Shellfish

Sanitation Program (NSSP), a cooperative program between the U.S. Food & Drug Administration (FDA), State Agencies, and the shellfish industry. A major component of Maryland's compliance with the NSSP is enforcement of areas closed to harvesting. Maryland is evaluated annually by FDA and found to be fully in compliance with the enforcement component of the NSSP. In addition, there has not been any human illness associated with consumption of Maryland shellfish in over 50 years. Maryland's success in this program has been a strong emphasis on prevention and strict control measures, to prevent pollution from reaching surface waters in the first place which results in limiting the risk to human health when consuming Maryland shellfish. Action: No change
Comment on Data: DNR has listed only 290,000 acres as natural oyster bars and there are approximately 10,000+ acres leased to private individuals. So how did MDE arrive at a figure of over a million acres? Response: DNR measures natural oyster bars and leased bottom, MDE protects all Use II waters (based on total acres of Use II waters). The MDE figure is surface water acreage. Oysters filter water so, the entire water body has to be considered not just the bottom. The data are accurate and account for surface acres of water bodies, not bottom acres of oyster/closed habitat. If the data were changed to focus on actual harvesting areas, the percentage would actually decrease dramatically since very few oyster bars exist in restricted waters. So, taking the view of MDE (plot water acres) actually gives a distorted (over-estimate) percentage of closed areas. Also, see response above. Action: No change
Management Objective: Should include methods to transport oysters to clean waters for a period of time necessary for them to rid themselves of the pollutants. This is only to shut down operation not to make it feasible to operate. As written this is most negative without recourse to corrective action. Response: MDE has had a relay policy (move oysters from polluted waters to clean waters for the purpose of natural cleansing) in place for many years and it is implied in the statement "to maximize availability of shellfish waters for commercial and recreational harvesting". There are several strategies used to increase the safety of shellfish harvests, including reducing pollution sources, such as septic leakage, improving treatment plants, and approving relay of polluted oysters to approved waters for cleansing and harvest. Action: No change.
Maryland Waters Safe for Harvesting Finfish (p. 17)
Q: Is more updated data available? The chart uses 1996 data. Response: The chart was accurate until April 1999 when a new advisory was issued. Action: Update the chart to reflect the April 1999 advisory for the next edition of the Indicators document.
Marylanders Served by Public Water Systems in Compliance (p. 18/19)
Suggestion: Shorten Indicator title, perhaps to "Public water systems in compliance."
Q: Why is this only concentrating on public water systems. Is it presumed that those with private wells are: 1) isolated from contamination, 2) able to live with the water conditions, or 3) not numerous enough to be of any consequence for statistical analysis? Response: The State does not have the regulatory authority to compel achievement of a specific numerical benchmark for all drinking water in Maryland. Extensive data is available on the water quality of public water systems in Maryland. There are over 1000 public water systems that serve approximately 84 % of the State’s population. There is limited data available on the water quality in private wells. Private wells are tested when the well is constructed, and if acceptable, a certificate of potability is issued. A well that fails water quality standards is evaluated for replacement or treatment as appropriate. The water quality of private wells is protected by the strict construction requirements of the State regulations. There is no routine monitoring requirement for private wells. Approximately 16 % of the State’s population use private wells as their source of water. Action: No change.
Comment on usefulness: This section was obviously written by someone in a "protected" environment whose concept that water is only good to be considered if coming from a public system is the all-driving force for the section. Response: See the previous response. Action: No change.

Comment on Data: Is data available for percentage of MD population on private wells? Is data available on longevity of individuals using water systems not in compliance with data cited?
Response: See the previous response for the first comment. Information on the longevity of individuals using water systems that are not in compliance is not available. Public water systems collect hundreds, and, for some, thousands of water samples a year. The vast majority of water systems have excellent water quality. Typically, when a water system fails to comply with a standard, the violation is short-lived since corrective actions may be implemented within hours or days of obtaining the testing results. In addition, drinking water standards are very stringent, and are established so that less than 1 person in a million would observe an increased risk to their health when the water is consumed over a 70 year lifetime. Action: No change.
Suggestion: Please make the numbers at the top of the bars in the left graph larger so they can be read. Response: Agree. Action: Will make suggested change.
Q: The right graph seems to contradict the left graph. Perhaps if you use a y axis break and include the total number (1077?) At the top and calculate the % based on the 1007 total, things make more sense. It currently looks like around 90% of the systems are exceeding health standards, which contradicts info in the associated graph.
Response: The two graphs represent different data. Action: No change.
Marylanders Served by Surface Systems with Source Protection Programs in Place (p. 20)
Suggestion: Shorten Indicator title, perhaps to ASurface water supply systems with source protection programs." Response: Agree. Action: Change title to "Surface Water Supply Systems with Source Protection Programs".
Comment: The status language does not relate at all to the graph. Response: Agree.
Action: Revise the first sentence to "Formal source protection programs are…"
Marylanders Served by Community Groundwater Systems with Active Local Wellhead Protection Programs (p. 21)
Suggestion: Shorten Indicator title, perhaps to "Community groundwater systems with wellhead protection." Response: Agree. Action: Will change title to "Community Groundwater Systems with Wellhead Protection Programs".
Comment: This Indicator should also focus on groundwater usage. Response: Disagree, these are separate subjects. Groundwater usage may be considered for a separate indicator in the future. Action: No change
Comment: The status language does not relate at all to the graph. Response: Agree. Action: Revise two sentences in the Status portion to "Communities have shown interest in wellhead protection programs.….About 80 communities are working with the State to achieve protection programs which include public outreach meetings and education, new development review, and investigation of potential contaminant sources…."
Number of Municipal Waste Landfills in Compliance with Groundwater Standards (p.22)
Suggestion: The Benchmark includes a term that should be defined with a footnote (Subtitle D design standards for landfills). Response/Action: Take the reference to Subtitle D out of the benchmark.
Q: What about closed or abandoned landfills? Closed landfills pose a much more significant threat to groundwater contamination. Response: These landfills are addressed through regulatory

requirements. The indicators are not intended to include all stressors to the environment. Action: Do not expand scope of Indicator at this time.
Oil Contaminated Sites Completed/Upgraded (p. 23)
Q: What does Completed/Upgraded mean? Please define. Response: "Completed" refers to contaminated sites that have undergone remediation and are considered not to need further remedial work. "Upgraded" refers to active underground tank sites that now meet the 1998 deadline to upgrade underground storage tanks to meet federal technical standards for protection against spills, overfills and corrosion.) Action: The title of the indicator has been changed to "Oil-Contaminated Sites Completed/Initiated", and the indicator does not address "upgraded" sites. The table of contents has been corrected to reflect this change.
Q: Why is contaminated oil (millions of gallons/month) transported from out of state into Pori at the Bethlehem Steel site? A portion of this oil is discharged into Humphries Creek. Response: The facility is of a type that is allowed to operate under Maryland law and regulation. It operates under various MDE permits. The Department is not aware of any illegal discharges of oil into Humphries Creek from this facility. If we receive specific complaints about such activity, we will investigate those complaints.
Suggestion: Use different shading or hatching for the bars showing projections (1999, 2002 & 2005). Response/Action: Will do.
Comment: The status is very confusing, please try to find a better way to explain what you are trying to convey here. Action: The status will be reworded as follows:
Status (as of March, 1999): 13,977 sites have been cleaned up or are implementing long-term clean-up activities; 6,384 oil contaminated sites have been cleaned up, which represents 46% of the 13,977 oil contaminated sites that have been identified.
Comment on data: The amounts lost and recovered during processing are secretly kept from the community. No creek is naturally discolored as one is from oil contamination. Response: From the comment, we cannot identify the site or facility to which the commenter is referring. If the commenter will provide more information, we will investigate the situation.
Amount of Hazardous Waste Generated per Year (p. 24/25/26)
Q: Why not compare the rate of generation per year with some measure of economic prosperity, i.e. rate of production or Gross National Product measurement. Response: Although the condition of the economy will have an effect on the amount of hazardous waste generated, it is not clear what that effect actually is. At first blush, one would think that, all things being equal, higher levels of consumption associated with a robust economy would lead to a corresponding increase in hazardous waste generation. However, all things are not equal. Technological improvements may be more likely in a robust economy, leading to a decrease in the amount of waste produced per unit of output. Alternatively, as production increases, older, less efficient facilities may be brought into operation as the capacity of newer, more efficient facilities is reached. This would cause an increase in the amount of waste produced per unit of output. Or, if the bulk of additional goods being purchased under the improved economic conditions are imports, there might be no change in the amount of waste generated domestically. Also, economic conditions within Maryland may not always mirror national trends. Maryland industries could be in a slump while the national economy is improving, causing a decline in the amount of hazardous waste generated in Maryland despite the improvement in the economy as a whole. Furthermore, a large amount of waste is generated as a result of site clean-ups (contaminated soil that has been excavated for disposal or treatment, for example.) The relationship between the amount of this waste that is generated in a given year and the condition of the economy is not clear.
Q: Why not include some pollution prevention with this Indicator. Response: This point was addressed briefly in the draft Indicators report. Pollution prevention efforts are difficult to

measure. Often, pollution prevention is a side-benefit of a change made because of its economic benefits. It is not clear what indicator should be used to serve as a surrogate for pollution prevention activity. It is also not clear that appropriate data are available to construct a surrogate for pollution prevention activity. In MDE's Managing for Results workplan, the Department has developed pollution prevention performance measures. In the future, these measures might provide the data to construct an Indicator.
Internal Comment: A correction is needed in the discussion of the Hazardous Waste indicator. On page 24 of the draft indicator document, it is stated in the last paragraph that "Maryland does not have commercial facilities for managing hazardous wastes ….". This is incorrect – there is a commercial hazardous waste treatment facility in Baltimore (Clean Harbors of Baltimore, Inc.) Also, a number of facilities have permits which allow them to treat some of their own hazardous wastes. Action: The text should be modified to read as follows: "Although there is one commercial hazardous waste treatment facility in Maryland, and a number of facilities have received permits to treat some of the hazardous waste they generate, the majority of hazardous wastes are transported out of state for final disposition (recycling, incineration or other treatment, or disposal in a landfill.)"
Reported Exceedences of Lead Poisoning Standard (p. 27)
Comment: The benchmark seems rather vague ("to the lowest possible level"). Why not use a firm number, like zero? Response: Agree. Action: The benchmark will be changed to "No new occurrences of lead poisoning caused by lead-based paint in children under 7 years of age."
Submerged Aquatic Vegetation (SAV) Habitat Quality (p. 29)
A little more detail on what are the "habitat requirements" would be welcome. I am guessing they are the Chesapeake Bay Program findings for nitrogen, phosphorus, and chlorophyll a, and Secchi disk readings. Since the actual requirements were found to differ by region, it might be too complex to list them all here, but at least enumerating them would helpful.
Response/Action: Due to space limitations on the draft version of the EnPA Goals and Indicators, this was omitted. The revised indicator will provide adequate detail explaining how the indicator was derived and the associated components.
Submerged Aquatic Vegetation (SAV) Acres (p. 30)
A measure of species richness might be a welcome addition to the SAV indicators. The Potomac River comes to mind, where for a time the acreage alone would have suggested an improving situation, even though it was based on a rapid expansion of a monoculture of hydrilla. A real abundance by species appears not to be feasible with available data, but the ground truthing efforts to verify the VIMS aerial surveys would at least indicate number of species. Here is a place where a breakdown by region would be helpful. The map for "SAV Habitat Quality" (p.29) does this. The bar chart on p. 30 would be more telling if it were broken into regions to reflect information in the map of p. 29. For example fresh, oligohaline, mesohaline for the Potomac and main stem Chesapeake Bay or something similar. If a metric for species richness were invented, a similar breakdown would be helpful. Responses/Action: A measure of species richness as an indicator is a good idea. Unfortunately we haven't figured out a good way to properly present this information at the large scale required for the EnPA format. Even in the areas with limited SAV, species richness is usually not a problem when broken down by Chesapeake bay salinity regimes (tidal fresh, olighaline, mesohaline, polyhaline).
Again, for the large scale EnPA format, bar charts showing SAV acreage by salinity region (1984-1998) would be unreadable with the 51 different regions.
Benthic Communities of the Chesapeake Bay (p. 31/32)
No comments received.

Fish Index of Biotic Integrity (IBI) - Chesapeake Bay (p. 33)
No comments received.
Striped Bass Juvenile Index (JI) (p. 34)
Suggestion: Although the text explains the units of the striped bass juvenile index, it would be advantageous for the units (juveniles per haul seine) to appear on the vertical axis of the graph itself. Response/Action: Axis has been labeled.
American Shad Population (p. 35)
Suggestion: Similarly, the information in the text explaining the estimated population of shad could appear as a text box on the graph itself. Response/Action: Axis has been labeled.
Blue Crab Population (p. 36)
Management Objective: What does a blue crab eat in the first few days immediately after hatching? Is that food supply in the water? What are the nutrient requirements to produce that food supply? Should be among the primary considerations when considering the "reproductive potential" of the crab population, yet, seemingly, are unknowns. Response: Female blue crabs migrate to the lower Bay and spawn from late May to September (peak activity in July). Blue crab larvae eat phytoplankton and a variety of zooplankton after hatching, although we have been unable to find out which species in particular. From literature on raising blue crab larvae in the lab, it seems polychaete larvae and dinoflagellates are important. Phytoplankton require dissolved nitrates and phosphates. Zooplankton require sufficient numbers of phytoplankton to feed on. Crab larvae spend 4 to 6 weeks as members of the plankton community and are carried by the currents away from the mouth of the bay, into the ocean, and then are transported back into the bay. Conservatively, 30-40% of the variation in harvest can be associated with variations in wind patterns on the inner shelf adjacent to the Bay. The post-larval stage or megalopae are recruited back into the Bay and also are influenced by environmental conditions. Megalopae recruitment significantly influences the size of the next year class. Since environmental factors have a primary influence on the Bay stock, our primary consideration for reproductive potential is protecting the number of mature blue crabs that spawn each year.
Seed Oyster Production (p. 37)
Comment: Indications of the numbers of seed oysters moved are like counting grains of corn planted in a field to determine the crop. The data needed should include the survival of the seed planted in terms of capture at the end of the period determined to be needed for their growth. Such survival rates would reflect, per my statistics, less than 6%.
Q: With a projection of 0.5 million seed needed to plant one acre and 290 thousand acres in oyster bars (1 million + per your statistics) is this adequate seed? Response: The quoted survival rate is way low and the 290,000 acres in oyster bars is the wrong acreage to use. The 200,000 bu - 500,000 bu of seed are not spread on 290,000 acres. That's like saying corn yields are X bu/acre and using the entire farm acreage of 500 acres when only 50 acres are planted with corn, while the other 450 acres are not planted. The calculation is bu/50 acres. Were we to take the commenter's advice and re-calculate farm yields for Maryland, farmers would look stupid. Bu/500acres = 1/10 the result above.
Benchmark: DNR has stated the productivity (private correspondence) of the C. Bay should be 4,000 lbs/acre/year if properly utilized. Does your benchmark for total productivity of all species even approach 100 lbs/acre/year and if not is a benchmark of project productivity in terms of bushels of oysters captured per year not a more realistic benchmark? Putting shell on the bottom is akin to throwing sawdust in a chicken house. If there are no spat for the shell or chickens to go in the house, neither will be productive. What is the benchmark for eyed larva per liter of water in

the summer time to produce a benchmark set of 1,000 spat per bushel on 500,000 bushels of shell? Does anyone know since the measure of eyed larva per liter of water has never been done? Response: Oysters alone produce >4,000 lbs/acre in the shell. Where did 4,000 lbs come from? Why is it a useful benchmark? Shell on the bottom yields results. We don't believe the sawdust analogy is appropriate, because we can control shell and seed; we can't control larvae in the water. Management Objective: Obviously was written by DNR. Diseased seed oysters have been moved throughout the bay for so long that the diseases are now evenly distributed. Movement has taken place for "greed purposes" even though the National Marine Fisheries research indicated in 1977 that such movement would decimate the supply. Response: Moving disease is a concern and measures are in place to minimize it. Disease is not evenly distributed throughout the bay. Disease has also moved naturally great distances, so seed programs can't be the "scapegoat".
General response about the oyster indicator: Overall, the seed indicator has its shortcomings. It doesn't account for 1) survival of the seed or 2) natural spat set and survival which really drives progress toward to the goal of maintaining a viable population. The first indicator we used, tracking spat set, had flaws too, so we tried the seed indicator. One reason was the goal. It suggested, "what is government doing to maintain a viable population?" So, we switched from natural set (nature) to seed (government). We'll continue considering a better indicator, and appreciate the comments.
Nutrient Inputs to Mainstem and Tributary Waters (p. 38)
Suggestion: The source of the nutrients as waterborne could be made clearer. This could be done in the title as "Waterborne nutrient inputs . . ." for example. This helps relate this indicator to the airborne nitrogen indicator. In addition, I sympathize with the difficulty of succinctly expressing the true meaning of the 40% reduction goal. However, as stated in the benchmark, one is led to believe that a 40% reduction in total nutrient loadings is sought. As I recall, it is a reduction in so-called "controllable" nutrient loadings that was finally arrived at. Response:
The Chesapeake Bay Program's Watershed model estimates loads from all sources and land uses (agriculture, developed land, septic tanks, forest) throughout the Bay's 64,000 square-mile watershed. These estimates together with measured loads from wastewater treatment plants and estimates of atmospheric deposition to non-tidal, inland water bodies, are used to determine nutrient loads. Atmospheric loads to land are included in the land use categories. The 40% reduction in nutrients from a 1985 base level, is a 40% reduction in "controllable" nutrient loads. Action: The text for the benchmark has been corrected to reflect this.
Nitrogen Concentration Trends in the Tidal Waters of Maryland's Chesapeake Bay (new) (p. 39/40)
No comments received.
Phosphorus Concentration Status and Trends in the Tidal Waters of Maryland's Chesapeake Bay (new) (p. 41/42)
No comments received.
Chesapeake Bay Program Toxics Releases -- Maryland (p. 43/44)
Q: Why is this Indicator located here rather than in the Air Quality Indicators section? The large majority of the releases displayed in the Indicator are releases to the air and a very small percentage of the releases are to water. Response: As a program with multi-media reporting requirements, an argument could be made for placing this indicator in the Air Quality Indicators section, the Hazardous Waste and Hazardous Materials Exposure section, or Ecosystem Health Indicators section. We believe it fits best in the Hazardous Materials Exposure Section. Action: Moved to Hazardous Materials Exposure Section.
Q. Why is this titled Chesapeake Bay Toxic Releases when you are reporting Maryland data only?

Response: Agree. Action: Indicator has been retitled.
Extent to Which Designated Uses of Maryland's Surface Waters are Being Met (p. 45/46)
Comment: Indicator Development and Data Responsibility is missing. Response/Action: DONE
Suggestion: Shorten Indicator title. Response/Action: DONE
Atmospheric Nitrogen Loading to the Chesapeake Bay (p. 47)
The two pie charts and expression in percentages are very informative. However, some expression of the absolute number of pounds per year should also be given. This could be done, e.g., within the title to each pie to give lbs/yr overall and lb/yr Nox. (Note: lower case "o" in NOx in title should be a cap.) This would help relate this indicator to the waterborne nutrient loading indicator, where pounds/year are given.
Information regarding the absolute number of pounds per year is not available from the air quality staff.
Contribution of Dissolved Oxygen Levels to Water Quality Impairment (p. 48)
Comment: Indicator Development and Data Responsibility is missing. Response/Action: Corrected.
Miles of Streams Degraded by Abandoned Mine Drainage (p. 49)
No comments received.
Miles of Streams Open to Migratory Fish (p. 50)
No comments received.
Physical Habitat Index (new) (p. 51/52)
No comments received.
Fish Index of Biotic Integrity (IBI) (p. 53/54)
No comments received.
Benthic Macroinvertebrate Communities (p. 55/56)
No comments received.
Riparian Forest Buffers (p. 57)
Comment: It is not clear whether the 600 miles refers to streams buffered on both sides or 600 miles one side (for a total of 300 miles of fully buffered stream). Inclusion of two-sided buffers seems a sensible element to add. For example, in many circumstances, a single-sided buffer may provide only marginal improvement in thermal stability or in unnatural solar influence on tropic structure. In addition, it should be made clear whether or not loss of existing buffers is included in the 600 mile goal. At present, the test seems to indicate that this goal does not reflect the change in net miles of buffer. If it does not, then this should be made clear and, furthermore, I suggest that the indicator be augmented to reflect the status of net miles of buffer. (Consider that the Charles County Development District is larger than the District of Columbia and requires only a 50 foot buffer for streams of order 1 and 2. The loss of many miles of 100 foot-buffered streams can be

expected.) Response: All miles-of-buffer numbers in this report are miles on one side of the stream. The description of the indicator has been amended to clarify this. Buffer plantings can occur only on the property of willing landowners who very often own only one side of a stream. Since the intent of the buffer planting program is to protect streams from impacts from adjacent land uses, DNR feels it is appropriate to track miles of buffer wherever they are established, recognizing that overall environmental values may be more fully protected by two-sided buffers. At present there is no mechanism for tracking buffer which might be lost to various types of development, although DNR's Forest Service has plans to examine, every five years, satellite imagery which would identify losses. Action: clarify wording of indicator.
Maryland Wetland Trends (regulatory) (p. 58)
Comment: The last three sentences of the status section, as well as the benchmark, are confusing. "I can't even venture to guess what is being said in the last part of the status." They both need to be greatly simplified. Response: The commentor was absolutely right. Regulatory and non-regulatory were mixed and the wording was confusing. Action: The last three lines have been revised.
Comment: The Management Objective is "no net loss." It is not clear how this fits with a Benchmark of "10% for wetlands protection," or indeed, just what the Benchmark means. Ten % of what? What kind of protection? The objective would appear to be to protect essentially all the wetlands (although allowing a small percentage to be destroyed and mitigated). The Benchmark should be more closely related to the management objective. Why not use a benchmark that measures gain/loss of wetlands? Or one that minimizes mitigated and maximizes preserved existing wetlands, since well developed natural wetlands are generally considered more beneficial environmentally than mitigated ones? Response: The Benchmark reflects an EPA grant to develop a comprehensive statewide wetlands plan with regulatory and non-regulatory components. The process will involve citizen and other agency input into the effectiveness of the existing regulatory program and will identify wetlands areas that require additional protection as well as areas that would be suitable as mitigation and wetland restoration sites. The plan will include the Maryland Wetland Restoration Initiative of 60,000 acres of wetland restoration which is 10% of the wetland base at the time the target was developed. Action: The Benchmark has been revised to reflect the 60,000 acre goal.
Management Objective: Why is there no objective to replenish the lost wetlands with fill dredged from the bay -- which was originally washed out from the wetlands. Also, each year there are untold tons of material which leaves the wetlands as particulate matter due to the decay of vegetation yet there are no management objectives to harvest the growth of the wetlands thus eliminating this loss. Why? Is the objective too remote from reality? Response: The primary source of dredge spoil is sediment washed into the Bay from eroding uplands. This material may or may not be used for wetland restoration. Poplar Island and Smith Island are two areas dredge spoil has been proposed for use in wetland restoration. A 100-acre wetland is planned on the dredge spoil disposal area at Hart-Miller Island. The decay and transport of organic material from wetlands is one of the natural ecological functions of wetlands. This detritus provides food for microbes which are food for larger invertebrates and so on up the food chain. Inappropriate and uncontrolled use of our wetland resource is one of the causes of the decline in the Bay. The goal is being achieved. Action: No change.
Regional Breakdown: Here is a place where a regional breakdown might prevent unintended misleading conclusions. In a recent report where EPA published an earlier FWS survey of wetland loss in the Chesapeake region (Chesapeake Bay Wetlands: The Vital Link Between the Watershed and the Bay, 1997), it was reported that forested wetlands were experiencing a particularly rapid loss and that development was the leading reason. Furthermore, it found an uneven spatial distribution of loss and identified hot spots. (Virginia was identified as a hot spot of lost forested wetland, for example). Therefore, reporting acres lost over the entire state does not inform of problem areas where resources might need concentrated, nor does it help to understand the impacts to different ecosystems occurring in, e.g., Appalachian plateau, ridge and valley, Peidmont, and coastal plain. Response: The statistics on impacts to wetlands are available by the 4 regions of the state (Eastern Shore, Southern Maryland, Central Maryland, and Western
Maryland), by wetland type, by watershed, and by type of authorization. We selected a single statewide goal for simplicity of presentation. For more information, please call MDE's Wetlands and waterways program at (410) 631-8091. Action: No change.
Regulated-Temporary Impacts: The wetland trends indicator relies on readily available regulatory data and may be sufficiently informative of loss of aquatic function. However, in public notices, temporary impacts to wetlands and wetland buffers are also reported and could be easily tracked. These temporary impacts may in fact have long-term ecological consequences. In the case of utility right-of-ways, for example, forested wetlands may be converted to shrub-scrub wetlands, with possible attendant long-term changes in hydrology and soils as plant communities respond. These temporary impacts may become effectively permanent because of disruptions for maintenance access and because right-of-ways provide conduits for chronic human disturbance (e.g., all terrain vehicles). By tracking regulatory-temporary wetland impacts, an alternative reflection of loss of overall aquatic function of Maryland's environment might result. Response: In addition to the items above, impacts are tracked as temporary or permanent, however, conversions of forested to scrub-shrub or emergent wetlands is not a temporary impact under the State regulatory program. Mitigation is required at a 1:1 ratio. In the case of gravity sewers, stream valleys and floodplains are impacted in addition to wetlands. It may be strongly argued that floodplains provide many ecological services in common with bona fide wetlands. Some measure of floodplain disturbance in an indicator may therefore be desirable but may not be reflected in the present indicator that ignores impacts deemed temporary in a regulatory sense. (Note also that stream-side rights-of-way, in general, will surely effect long term impacts as assured future changes in stream meanders will be discouraged with shoring if utilities are threatened. Stream meandering is a crucial element in maintaining floodplains and healthy physical in-stream habitat). In addition, impacts deemed temporary in a regulatory sense may have reduced or no mitigation requirements even though they may result in effectively permanent impacts. Action: The possibility of augmenting the wetland indicators to reflect regulatory-temporary changes in wetlands will be considered as an indicator in the future.
Potentially useful breakdown / Intermittent streams: Other losses related to wetlands may also merit consideration as an indicator. I was recently surprised that MDE permitted the filling of an intermittent stream of some value. This intermittent stream formed the headwaters of a Mattawoman Creek tributary. In a comprehensive 1971 icthyoplankton survey of habitat usage by anadromous fish, DNR measured this particular tributary to be the second most productive of river herring in the entire Potomac drainage. Surveys by Friends of Mattawoman Creek demonstrate that it remains highly productive today, with usage of both alewife and blueback herring. I imagine that the loss of this stream segment would show up as a loss of wetland acreage. However, streams are an example where measurement in terms of acreage is probably misleading when lumped together with acreage of lost wetlands. Small streams represent a quasi-one dimensional habitat, where length is a more informative metric than acreage. I would like to know how prevalent is the filling of intermittent streams and believe, therefore, that length of streams lost might make a telling indicator. Response: Streams do meander and expose sewers and other utilities that are not deep enough. The current program requires crossing to be at least three feet below the stream channel bottom and installations that closely parallel the steam are discouraged. Exposed utilities are relocated or the stream channel is restored to its original elevation, as appropriate. Floodplains have also been filled and piped, and blocked by residential and commercial development, channelization and other activities. New impacts are limited and existing blockages are removed whenever possible. Many counties have protective floodplain ordinances and some counties have active stream restoration programs. Linear feet of stream impacted is reported and could be tracked. The type of impact is not currently tracked and whether channel or floodplain is also not tracked. If it became a target, the appropriate mechanism would be instituted. The issue would be the selection of an appropriate target for stream protection. Action: To consider for the future.
Maryland Wetlands Restoration Initiative (voluntary) (new) (p. 59)
Q: The benchmark is rather confusing. Is it trying to say that the Benchmark is a net gain of 60,000 acres? Response: The Benchmark is 60,000 acres of wetland restoration or creation in addition to the wetlands restored or created in the regulatory program. The text which explains the

indicator supports the Benchmark. Action: No change.
Loss of Agricultural and Forest Land (p. 60)
Comment: The Indicator would be improved by including some measure of the quality of the forest, which will affect both its economic and environmental value. Information relating to trends in species composition, maturity, extent of forest management, and average size and range of sizes of individual ownerships would indicate a great deal more about forest land changes than a measure of forest acreage alone. The USDA Forest Service has collected information of this nature from time to time in the past. Response: This is a level of detail too fine for EnPA purposes. The scale at which data might be of value is also much finer than can be accommodated in a statewide report like EnPA. Action: None.
Comment: In recent years, change in size of ownership and ownership turnover have probably proceed at a faster rate and had more effect on fragmentation, forest management, and forest quality than actual conversion of forest to development. Response: DNR is undertaking a strategic forest lands study which will examine, among other factors, size of ownership as an element in protecting forest land for both economic and ecological benefits.
Q: If the goal is to avoid conversion of agricultural land to non-resource based uses then why by regulation is it required that two acres of agricultural land be lost for each acre of marsh land destroyed? Is the implication that marsh land is more valuable a use of land than that which produces food? Also, why is there no requirement for "townhouses" versus individual homes when housing development is deemed more valuable than food production? Is mandate a "dirty political word" when used against the housing developer while encouraged is ok? Response: Policies for preserving various types of resource lands have been promulgated over a number of years in response to changing public concerns. For this reason, they are not always 100% consistent. Action: None.
Q: What is the minimal level of Ag. to sustain our Ag. base, economically speaking Response: There is no real answer as to how much agricultural land is enough to support this industry, which continues to decline in number and employment, in Maryland as elsewhere in the United States. Maintenance of agriculture in Maryland is more a socio-cultural mandate than an economic necessity, although it is important to retaining diversity in the economy. Q: Ditto for forest land to sustain our environmental infrastructure. Response: DNR's Forest Service, the Department of Business and Economic Development, and the Eastern Shore Resource Conservation and Development Board are currently undertaking a forest product industries economic impact study; as of 1999, market forces support nearly 700 licensed forest products operators utilizing some 2.4 million acres of forests in the State and an unknown amount of out-of-state timber land. Q: How will the CWAP - UWA be factored into this process? Should the UWA be an indicator? Response: The Unified Watershed Assessment is a compilation of indicators, not a single indicator in itself; it uses many of the same indicators, disaggregated to 134 watersheds, that are summarized on a statewide basis for the Environmental Performance Partnership Agreement.
Comment: From the title of the indicator, "Loss of Ag. and Forest Land", one is primed to see plotted the acreage lost, not the acreage existing. Recommend changing either the vertical axis title to "Thousands of Acres Extant", or the legend similarly, or both. Response: some changes in wording have been made to the presentation of this indicator.
Comment: As presently configured, this important indicator provides limited information on issues relating to ecological quality. For example, the tenets of conservation biology stress the importance of habitat continuity to overall ecological health. Continuous habitat aids population viability by promoting the exchange of genes; by easing migration, which allows avoidance of locally adverse conditions or repopulation of locally displaced or depressed populations; by maintaining a semblance of natural complexity and attendant species richness; etc. Similarly, the concept of forest interior habitat arises because it is necessary for the viability of a number of plant and animal species.
Would it be possible to augment this indicator by adding another that includes a metric for forest

continuity? Or for forest interior? Extracting such information clearly requires intensive analysis. However, one approach for implementing such indicators might piggyback on the gap analysis program (GAP). If I recall correctly, GAP employs satellite data of sufficient spectral detail that the required specificity in land cover type is feasible, and at the required spatial resolution. The criteria for defining "continuity" or the related, but distinct, concept of "interior" would have to be devised, and algorithms created and coded to process the images according to these criteria. I would be surprised if candidate criteria and algorithms haven't already been reported in the literature.
Tracking species that may be especially dependent on a habitat type, e.g., forest interior dwellers (FID's), is a necessary component to understanding the status of habitat, and has the added benefit of helping to motivate a latently concerned public (see discussion of river herring below). However, the fate of species populations are often partially dependent on habitat over which MDE and EPA have no influence. For example, migratory FID bird populations are impacted by events in distant locations. By improving the Loss of Forest Land indicator to reflect aspects of ecological health of the forest, the interpretation of species tracking data may be enhanced. In addition, the groundwork may be laid for future improvements in the implementation of programs and concepts such as Green Infrastructure, the Forest Conservation Act, Smart Growth, Rural Legacy, etc. Response: The statewide summary indicators used for EnPA reporting certainly do not tell the whole story of what is happening to important segments of Maryland's natural systems. Several indicators which have been suggested appear more suited for characterizing specific smaller landscapes and allowing comparison between these smaller areas, as was done in the Unified Watershed Assessment prepared pursuant to the Clean Water Action Plan. Additional forest indicators, as proposed, are currently under development by DNR as part of a watershed-based statewide Atlas of environmental indicators.
Protected Lands (p. 61)
Comment: Public lands used for public recreation and publicly available open space and lands protected by conservation easements or productive forestry purposes should not be joined in the same category. Saving agricultural and forest lands under conservation easements and the loss of land for agricultural and forest industries (one of the stressors) relate to the previous Indicator. The objective is for protecting open space for citizens' recreation and natural areas for biodiversity. Private land under easement is not generally for the use of citizens (though society benefits from the restrictions on development), and protecting agricultural land does little for protecting biodiversity (productive forest land contributes much more to this). The Indicator needs to separate open-space land protected for citizens' use and enjoyment from land protected by easement for agriculture and forestry. Response: The main point of this indicator is that all of these lands are protected from urban development and thus retain a measure of natural productivity, whether for economic purposes (including agriculture, forestry and recreation) or for non-market natural resource values such as preservation of biological diversity. The graphic in the indicator distinguishes between lands protected by easement for conservation purposes, lands protected under easement for agriculture, and lands which are publicly owned. While much of DNR's land is available for public use, much of it is also managed simply for its natural resource values. Some is designated as Wildlands, minimally managed in order that natural processes may take their course; portions of wildlands may be open to some public access. Similar intermingling of public use and resource protection occurs on other publicly owned lands.
Septic System Permits/Low Density Residential Development (p. 62)
Q: Regarding the Goal, reduce sprawl development, sprawl development is mandated, if not encouraged, by requirement for specific size areas to install septic systems. Response: Point well taken. Action: Out of MDE/DNR/EPA purview.
Management Objective: There is nothing in the objective which requires the reduction of acreage required by the Health Department for septic systems in those areas remote from municipal or common systems, which are the same areas in which sprawl is occurring.
Why is there no coordination as part of the Benchmark?

If an estimate of the number of pounds/yr nutrient loading from septic systems is known, it would be very helpful to state it. (I have seen a figure of 7.7 million pounds/year). Including such an absolute quantity would help one understand the magnitude of this problem compared to the airborne and waterborne nutrient loadings. Response: The purpose for this indicator is to help to quantify the sprawl phenomenon, rather than to address the water quality impacts of septic system discharges. These discharges are included in the nitrogen loading information included in the indicator in the Water Quality section of this report. Models used to calculate these loadings use figures generally in the range of nine to ten pounds per person per year; they vary by watershed segment, primarily because of variations in soil conditions.
Comment: There is no phone number at the Office of Planning under Indicator development and Data responsibility. DONE
Q: Why hasn't the data been updated since 1990 and 1994 in the two graphs respectively?
Acres of Abandoned Mine Lands (p. 63)
No comments received.
Acres of Brownfields/Federal Facilities Approved for Development (p. 64)
Comment: The status needs to relate to the Indicator title and graph. Response: Agree. Action: The text will be revised as follows:
"Status:
• Six federal facilities approvals have been completed representing 1,991 acres;
• 57 brownfields assessments have been completed to date, representing 408 acres; and,
• 15 voluntary cleanup program sites have been completed, which represent a total of 227 acres."
Reduction in Required Landfill Capacity (p.65)
Q: What is the meaning of percent recycling rate? Weight (or volume?) recycled as a fraction of quantity generated? Percent of some demographic unit complying with some specification? Note that the MDE website also fails to describe the meaning of this metric. Response: The percentage recycling rate is calculated by dividing the weight of waste recycled by the sum of the weight of waste recycled and the weight of waste disposed. That is, % Recycling rate = (tons of waste recycled)/(tons of waste recycled + tons of waste disposed). The weight of waste disposed includes both waste disposed in-state and waste disposed out-of-state.
Comment: The Indicator graph does not relate to the Indicator title. Perhaps the title should be changed to "Maryland’s Recycling Rate." Response: Agree. Action: The title has been changed.
Q: Is there any reason why the Benchmark can’t be increased since it has been exceeded for two years in a row? Response: MDE has set the benchmark at 33% after consideration of what is reasonably attainable given the current level of resources available to the Department.
Forest Interior Breeding Bird Populations (p. 66)
Q: What are the 21 FID species? It would be helpful to the birding community if a list of the 21 FID species can be provided. Please send the list of these 21 species to me. Action: The list was sent. Recommendation: Declining populations of some species could be also caused by winter habitat loss in the tropics. Consult with Pax. River USGS ornithologists on this issue.

Comment: Another stressor is the increased deer population, which is seriously damaging the understory in many forested areas. Response: DNR has developed a deer management plan. We recognize that the state's deer population needs to be control and are taking steps
to address such.
Comment: The current status (18/21 = 85.7% of FIBBs stable or increasing) seems much better than all the "sky is falling" rhetoric we have been hearing from the birding community lately.
Response: Stabilizing FIBBs populations is the goal, and scientifically sound data will tell us how the populations are doing. The Breeding Bird Survey is coordinated by the U.S. Geological Survey's Biological Research Division and is the best available broad-based survey for breeding birds in the nation. Action: None required.
Comment: Promoting the objective of large contiguous forested areas is fine, as long as this does not include, or imply, forest management recommendations that effectively or significantly reduce the economic value of the forest land by imposing unrealistic requirements on the forest landowner. Otherwise it would be in conflict with the desire to prevent loss of forest land and economic loss to the forest industry. Response: DNR promotes the economic value of forests and has worked with the forest industry to develop conservation guidelines for forest
interior dwelling birds in concert with timber harvesting. Action: none required.
Bald Eagle Population (p. 67)
Q: Define "area relatively free from human activity" in as much as eagles are nesting within sight of homes, landing in trees in yards, and are nesting adjacent to normal farming activities in this area. Response: By relatively free from human activity, we mean areas that do not have lots of houses, or commercial areas or intensive recreation.
Stressors/Sources: Dependence upon fish population.
Management Objective: Nothing is indicated on controlling fish populations or increasing populations by controlling capture limits or methods. Have studies been instituted which either confirm or deny the loss of "fish food", "algae", suitability due to the reduction in the nutrient content in the water needed to produce it? Why? Response: Much of DNR's activity is directed toward maintaining or restoring fish populations, for a variety of reasons. Eagle food chain concerns addressed by DNR management programs have focused primarily on chemical contamination.
Comment: The Indicator states that "Nesting bald eagles require... suitable woodlands near tidal water...," and that "Wooded shorelines and other wooded areas in close proximity to tidal water are necessary...." While most nesting bald eagles in Maryland may in fact be near tidal waters, bald eagles also nest near fresh water lakes and rivers. Please delete the word tidal.
Colonial Waterbird Population Trends (p. 68)
Comment on usefulness: Good, but individual species populations vary greatly across Maryland. Population data on individual species should also be provided. Response: While DNR does track populations of individual species, in part to focus management attention, the emphasis in the EnPA reporting is on the communities and processes necessary to sustain ecosystem health more broadly defined.
Comment on data: The birding community should be provided the names of the 20 species of colonial waterbird. Please send the species list to me. Action: The list has been sent.
Globally Rare Species (p. 69/70)

Q: Could each species of plants and animals be identified in an effort to make this Indicator more informative? Response: It would be very cumbersome to list all the species. Also, since this is a very static indicator, as presented, we have decided to drop it. Action: Look for some other kind of indicator to track important aspects of biological diversity protection.
SUGGESTED INDICATORS TO CONSIDER
● Vehicle Miles Traveled (VMT). Response: Adding
● Public transportation ridership. Response: Adding
● Track volume of pesticide usage. Response: Needs investigation for utility and data.
● Track volume of fertilizer usage. Response: Needs investigation for utility and data.
● Use populations of certain duck species as indicator of the ecological health of the Bay. Response: Needs investigation for utility and data.
● Perhaps develop an Indicator on non-point source pollution, like sediment discharge. Siltation of waterways is a highly visible phenomenon that has led to a widespread conviction among the public that present prevention and enforcement practices are failing. Tidal Pomonkey Creek has been chronically impacted for years by a large residential development project, in spite of documentation and reports. Response: Needs investigation for utility and data.
● Because SAV habitat requirements have been added to the indicators suggests that some metric for water clarity, at least in near-shore tidal waters, should be feasible. Response: Needs investigation for utility and data.
● How about an Indicator that would track the amount of dredge spoil removed from the Bay, and the amount of nutrients and toxics released in the dredging process. Response: Needs investigation for utility and data.
● Stream Hydrology baseflow should be added. Stream hydrology sensitively reflects watershed land use and the effectiveness of the various attempts at stormwater management. Thus, such an indicator might prove particularly efficient in measuring the actual effectiveness some local, state and federal programs in protecting streams from the practices of forestry, agriculture, and urbanization. This indicator could rely on extent USGS gauging. Actual measurements of stream cross sections, as alternative, is probably too expensive on a statewide basis. I would recommend that the feasibility of including a measure of stream flashiness be examined as a component of this indicator. For example, anecdotal evidence indicates that the flooding frequency of fluvial Mattawoman Creek near Waldorf has increased significantly in the last decade or two. Analysis of actual hydrographs would be preferable. For example, current SWM regulations do not control for duration of peak flows, a serious inadequacy. However, if hydrographs are not available, then a statistical analysis of highs and lows, referenced in some way to total discharge, may provide the needed metric of flashiness. Response: These types of information are more appropriately used in specific watershed studies than in statewide summary reports on the status of the State's environment, like EnPA.
● In the category Terrestrial System Indicators, an indicator very basic to water quality and groundwater recharge is impervious area. I think we need to come to grips with this issue and should develop an indicator for Impervious Area. Response: Impervious surface is an indicator in the Clean Water Action Plan's Unified Watershed Assessment and will be included in DNR's Atlas of Environmental Indicators. In both cases, the indicator is summarized to 134 watersheds. A statewide summary statistic, such as those found in the

EnPA indicators, does not convey particularly relevant management information. No Action.
● Absent from the indicators is some measure that directly monitors surface water acidification apart from acid mines. Airborne pollutants and runoff may contribute to chronic or episodic acidification. Last spring, Friends of Mattawoman Creek measured instances of pH that were low enough to threaten blueback herring larvae (<6.2). In addition to direct physiological impacts, acidity contributes to other problems such as toxic concentrations of dissolved metals. Please consider stream pH as an indicator. Response: Stream water pH, while providing useful information of immediate acid-base status of a stream, varies throughout the day (down at night, up in sunlight), with season and during rain or snow melt events. Acid neutralizing capacity (a measure of positive stream chemistry balance in response to negative acidity input) of base flow is a more stable measure of a stream's ability to withstand episodic downward shifts in pH. Base flow ANC is a particularly good indicator of a stream's acid base status, and an ANC>200 Feq/L is taken to be the level where a stream pH is not susceptible to being overwhelmed by episodic inputs of acidic water. A stream with ANC between 200 Feq/L and 50 Feq/L could experience pH depressions during large storms of low pH rainfall. Streams with base flow ANC < 50 Feq/L may experience low pH and elevated trace element concentrations during rainfall or snow melt events. Any stream with ANC<0 Feq/L is considered chronically acidified and is likely to have greatly reduced species numbers and numbers of individuals.
Stream water ANC has been measured at randomly selected locations throughout the state in 1987 and 1996-1998. The results indicate that most chronically acidified streams are located in the Appalachian Plateau and the southern Coastal Plain (both western and eastern shore).
An analysis of the effects of Phase I of the Clean Air Act Amendments of 1990 indicates that sulfate deposition (sulfate is a major determinant of the acid in acid rain) has decreased in Maryland. (http://www.dnr.state.md.us/bay/waterqual/mbss/air). Comparison of measured loads with modeled estimates of the ability for watersheds to buffer acid inputs indicates that even after Phase II is initiated (CY2000), some streams in the most sensitive regions of the State will continue to be at risk of being episodically acidified.
Specific Response: Several (6) streams were sampled in the Mattawoman Creek watershed in 1987. Their ANC ranged from 53.5 - 257.7 Feq/L (average 108.5/Feq/L). Many of the streams sampled in the Mattawoman Creek Watershed during the more recent survey (1996-1998) have base flow ANC <200Feq/L.
OTHER ISSUES RAISED
● Many Indicators have identical, or nearly identical, Stressors/Sources and Management Objectives. To simplify the document, perhaps these can be merged into a summary of each section, (e.g. Air Quality, Non-Tidal Aquatic Systems). Response: The report has been restructured.
● Overwhelmed by the number of acronyms included in the draft Indicators document. It would be helpful to the reader if each acronyms was defined when used. Response: This has been done.
● To increase public participation, solicit comments from special interest groups such as environmental, economic development, and agricultural. Response: This has been done.

● Forgot to address important issues: 1) no goals to monitor number of invasive species from ballast water of ships, 2) no plans to establish minimum flow of water in tributaries that are being impacted by humans withdrawing water, 3) failure to recognize that dredging millions of cubic yards of the bay and its tributaries is a constant source of sediments and nutrients to the water column, 4) no mention of chlorides being added to our waterways from salting roads in winter, and trying to reduce their impact. Response: The Indicators Report is not designed to include every environmental issue facing Maryland. That is not to say that where we have not developed Indicators the issues are not important.
● River Herring: The use of individual species as indicators has many drawbacks. For example, it has been recently publicized that a rebounding striped bass abundance may mislead with regard to the true health of the population which shows signs of stress, possibly from malnutrition. More complex indicators may be warranted, such as ratios of predator to prey (striped bass to menhaden, for example). Hence, tidal and non-tidal fish IBI scores, a composite index which reflect extensive research efforts, are a welcome inclusion to the Indicators. In spite of the potential drawbacks of employing individual species, the Indicators presently track American shad and striped bass. Both of these species rely primarily on tidal habitat when in Maryland waters. Both of these species exhibit significant mortality from fishing pressure and their abundance may thus reflect strongly the effectiveness of fishery regulation, a legitimate use of the indicator.
However, strong fishing pressure may confound an interpretation of abundance as being indicative of habitat suitability. For example, if the American Shad intercept fishery is in fact finally attenuated, at a time when fish ladders and elevators are just coming on line, as now appears likely, the effectiveness of ladders may be difficult to assess from population alone. Note that fishways at Little Falls dam on the Potomac have in the past been ineffective but that a new one is being constructed presently. Have the elevators on the Susquehanna been proven to allow adult shad and fingerlings to return downstream? Response: The fish lifts on the Susquehanna only move fish upstream. Young-of-the-year shad juveniles must maneuver pass four hydroelectric dams during their outmigration. Passage through hydro turbines is of major concern. Studies indicate that juvenile survival through all four dams is around 74%. It has been assumed that adult mortality was 100%, but recent evidence suggests that some adult fish are passing through the dams and that mortality may be around 90%.
Because river herring (blueback and alewife herring) comprise a less intense fishery (no targeted intercept fishery, for example), they may represent an alternative migratory species that more specifically samples habitat. In addition, river herring differ importantly from American shad and striped bass in that they reflect on small non-tidal stream habitats, where they spawn. They thus automatically bridge the demarcation between tidal (nursery ground) and non-tidal (spawning ground) habitat that agency administrative organization finds difficult to span. Because they are expected to also use fish ways, herring might help to assess the success of these mechanical crutches with less confounding fishery influence.
Like FID birds, river herring suffer as a Maryland indicator from reliance on distant (marine) habitat. Therefore, inclusion of a semi-anadromous fish indicator might prove beneficial in interpreting trends. Yellow perch comes to mind as a possibility because, in principle, they also sample smaller non-tidal stream habitats.
Data in the form of catch-per-unit-effort for river herring juveniles ought to be readily available because of DNR's ongoing annual assessments of tidal nursery waters. These surveys also produce data for yellow perch and other candidate semi-anadromous fish. Response: Using river herring as an indicator would have the same problems associated with it as the shad indicator (especially in monitoring the success of fish passage). River herring are caught by commercial watermen in fyke nets, pound nets and gill nets in the Bay. Yellow perch have been considered as an indicator. One of the problems using yellow perch is that populations tend to

fluctuate by river system. Selecting river systems that represent the Bay ecosystem would be difficult. Using yellow perch relative abundance in relationship to the tributary strategies would be useful and will be evaluated in the development of a yellow perch fishery management plan(FMP). A Yellow Perch FMP is scheduled for completion in 2000.
Data on river herring juveniles and yellow perch juveniles are available through the MD Juvenile Seine Survey. The development of an anadromous juvenile index which includes striped bass, shad, and herring is feasible and will be evaluated.
* (Page notations refer to the hardcopy pagination.)