Embed Size (px)
Citation preview

ANNUAL REPORT | 2018

Table of ConTenTs
AnnuAl RepoRt - 2018 naTIonal fooDs lTD. 2
Table of Contents
To be the preferred supplier of branded fast moving consumer goods (FMCG) and stock feed products in Zimbabwe and selected regional markets.
CoMPaNY VIsIon
FinAnciAl highlights And vAlue Added stAtement
03 32
0433
0634
07
3511
14 36
67
68
22
71
23
24
gRoup stRuctuRe
diRectoRAte AndAdministRAtion
chAiRmAn’s stAtement
coRpoRAte goveRnAnce
sustAinABilitY in ouRBusiness
diRectoRs’ RepoRt
independent AuditoR’sRepoRt
stAtement oF diRectoRs’ ResponsiBilitY
consolidAted stAtement oF pRoFit oR loss And otheR compRehensiveincome
consolidAted stAtement oFFinAnciAl position
consolidAted stAtement oFchAnges in equitY
consolidAted stAtement oF cAshFlows
notes to the consolidAtedFinAnciAl stAtements
compAnY stAtementoF FinAnciAl position
shAReholdeRs’AnAlYsis
notice oF AnnuAlgeneRAl meeting
NUTRISTART - BRAND SPECIFICATIONS
The logo should be the most prominent feature in any format. The Brand shold always appear legible, not too small.The minimum size it can be is as indicated above.
Brand Minimum Size
Brand : GloriaDate : 27-03-2009
PO Box HG 739 Highlands, HarareTel 263-4-486 035 Fax 263-4-487077
National Foods Limited Brands Spec - Kenergy
KENERGY - BRAND SPECIFICATIONS
44 mm
16 mm
Brand : GloriaDate : 27-03-2009
PO Box HG 739 Highlands, HarareTel 263-4-486 035 Fax 263-4-487077
National Foods Limited Brands Spec - Bow Wow
BOW WOW - BRAND SPECIFICATIONS
The logo should be the most prominent feature in any format. The Brand shold always appear legible, not too small.The minimum size it can be is as indicated above.
Brand Minimum Size
43 mm
14 mm

AnnuAl RepoRt - 2018 NATIONAL FOODS LTD.AnnuAl RepoRt - 2018NATIONAL FOODS LTD.
Group sTruCTurefInanCIal HIGHlIGHTs
fiNaNCial HIgHlIgHts
ValUe aDDeD stAteMent
GroUP struCture
National FoodsProperties Limited
Property owningcompany
Botswana Milling and Produce Company(Proprietary) LimitedInvestment company
NF Transport Bulawayo(Private) LimitedDormant
Rice Mills(Private) LimitedDormant
Palte-Harris(Private) LimitedDormant
Red Seal ManufacturersProprietary Limited Property owningcompany
100%
100%
100%
100%
100%
100%
National Foods Limited Flour and maize milling. Prepacking and sale of dry groceries. Manufacturing of stockfeeds, vitamin and mineral premixes for stockfeed applications.Principal operating company
Speciality Animal FeedCompany LimitedDormant
Bakery Products(Private) LimitedDormant
Natpak Zimbabwe(Private) LimitedDormant
Pure Oil Industries(Private) LimitedEdible Oils
National Foods Logistics(Private) LimitedDistribution
100%
40%
50%
100%
100%
100%
100%
Harris Maize Milling and Produce Company (Private) LimitedDormant
2018 2017 2016 2015 2014
Volumes mt 543,000 507,000 560,000 494,000 538,000
Revenue US$'000 297,929 289,508 330,642 314,407 343,518
Profit from operating activities US$'000 19,467 16,497 18,974 17,608 22,621
Profit after tax for the year US$'000 17,175 13,705 14,274 12,736 16,783
Profit attributable to equity holders of the parent US$'000 17,175 13,705 14,274 12,736 16,783
Basic earnings per share US cents 25.11 20.04 20.87 18.62 24.54
Net asset value per share US cents 152 139 129 118 107
Market value per share US cents 546 380 210 300 215
Shares in issue at year end 000's 68,400 68,400 68,400 68,400 68,400
2018 2017
Value created: US$000 US$000
Revenue 297,929 289,508
Other Income / (Expense) 1,041 730
Equity accounted earnings 5,196 1,832
Suppliers for materials and services (260,297) (253,536)
Total wealth created 43,869 38,535
Distributed as follows:
Employees 14,813 15,606
Government 5,714 5,250
Income tax 4,036 3,326
PAYE 1,678 1,924
Providers of capital 11,728 8,229
Dividends paid to shareholders 8,276 7,127
Net Interest on borrowings 3,452 1,102
Reinvested in the Group to maintain and develop operations
11,614 9,450
Depreciation 2,667 2,887
Retained income 8,947 6,563
Total wealth distributed and reinvested in the Group 43,869 38,535
For the year ended 30 June 2018
Value added is a measure of the wealth the Group has been able to create in its operations by adding value to the cost of raw materials, products and services purchased. The statement summarises the total wealth created and shows how it was shared by employees and other parties who contributed to the Group’s operations. The calculation takes into account the amount retained and reinvested in the Group for the replacement of assets and further development of operations.
FY2018
FY2017
Employees 34%
Government 13%
Providers of Capital 27%
Reinvested in the Group to maintain and develop operations 26%
Employees 40%
Government 14%
Providers of Capital 21%
Reinvested in the Group to maintain and develop operations 25%
43
AnnuAl RepoRt - 2018 NATIONAL FOODS LTD.
DIreCToraTe anD aDmInIsTraTIon
NatioNal Foods Holdings limited
B o a R d o F d i R E C t o R st. Moyo ChairmanM. lashbrook* Chief Executive officer l. Nyandoro* Finance director N. doyle G. Gwainda J. schonken P. spies
a U d i t & R i s K C o M M i t t E EG. Gwainda Chairman N. doylet. MoyoJ. schonken alternate MemberP. spies alternate Member
R E M U N E R at i o N C o M M i t t E EJ. schonken ChairmanN. doyle P. spies alternate Member
C o M Pa N Y s E C R E ta R Y & G R o U P l E G a l a d V i s o Rl. Howes
t R a N s F E R s E C R E ta R i E sFirst transfer secretaries(Private) limitedP.o. Box 11, Harare.
R E G i s t E R E d o F F i C EGloria House10 stirling Road,WorkingtonP.o. Box 269, Harare.
P R i N C i Pa l B a N K E R sFirst Capital Bank limited (Formerly Barclays Bank of Zimbabwe limited)stanbic Bank limitedstandard Chartered Bank limited
a U d i t o R sErnst & YoungChartered accountants (Zimbabwe)Registered Public auditorsangwa CityCnr K. Nkrumah avenue/J. Nyerere WayP.o. Box 62, Harare.
l E G a ldube, Manikai & Hwacha
PRINcIPAl OPERATING Company
the principal operating company of National Foods Holdings limited is National Foods limited, which is incorporated in and operates throughout Zimbabwe.
NATIONAl FOODS limited E X E C U t i V E C o M M i t t E EM. lashbrook* Chief Executive officerl. Nyandoro* Finance directorR. Usayi * Human Resources directorR. Mann* operations directors. Musodza sales Executivel. Kutinyu Marketing Executive
M a N a G i N G E X E C U t i V E sM. Chawanda Flour MillingC. Nheta Maize Milling N. Weller MCG W. Bosch stockfeedsG. Rawlins snacks & treats
ASSOcIATE Companies PURE oil iNdUstRiEs (PRiVatE) liMitEdV. agarwal Managing directora. Jyoti Head of CommercialR. Musiyiwa Head of operations
NatioNal Foods loGistiCs (PRiVatE) liMitEdJ. Heath Managing directorM. Hall Finance directort. Mandava Managing ExecutiveK. dumba Human Resources director
*Executive Directors
DireCToraTe aND aDMiNisTraTioN (As At 30 June 2018)
6

AnnuAl RepoRt - 2018 NATIONAL FOODS LTD.AnnuAl RepoRt - 2018NATIONAL FOODS LTD.
TODD MOYO (CHaiRMaN)
CHaIrman’s sTaTemenT
ChairMaN’s stAteMent
i N t R o d U C t i o N
The Group recorded a reasonable performance
for the period, posting Profit before Tax of
$21.21m which was 23% above the same period
last year. EBITDA for the period increased by
14% compared to last year, weighed down by a
very disappointing performance from the Flour
division. Whilst record Flour volumes were
achieved, margins were significantly impacted by
the inability to increase prices as a consequence
of the price of bread which remained constant
for the greater part of the year. The Maize division
returned to profitability and, together with
improved rice margins, partially compensated
for the poor Flour performance. Our associate
Pure Oil produced an excellent result, delivering
attributable earnings of $5.2m, an increase of
182% over the prior period.
Volumes for the year increased by 7.1% compared
to last year, reaching 543,000 MT. The increase
was largely driven by the Flour division where
volumes increased by 28%, the highest in
the company’s history. Maize volumes grew
by 11%, while there were volume reductions
in stockfeed (13%) on the back of the Avian
Influenza outbreak and rice (25%) due to foreign
currency constraints. Improved and more robust
consumer demand was evident in the second
half of the year, with volumes in the final quarter
increasing by 33% over the previous year and
positive growth being registered across all of the
operating units.
The company’s position with its foreign creditors
deteriorated significantly over the year, with
$37.59m remaining outstanding to foreign
wheat suppliers at the end of the period. It is
crucial that a solution for this debt is found in
the immediate future, failing which there will be
disruptions to the supply of imported wheat and
consequent flour and bread shortages. Regular
and constructive engagements with the Reserve
Bank are underway to resolve this matter.
o V E R V i E W o F F i N a N C i a l P E R F o R M a N C E
Revenue for the period increased by only 3% compared
to last year, driven by a reduction in average selling
prices by 5%. The key Flour, Maize and Stockfeeds units
all saw declining selling prices for a variety of reasons.
In Flour, selling prices declined by 2.5% due to the
inability to increase prices against a largely static bread
price. Stockfeed prices declined by 5.3%, as a result of
an increased proportion of lower priced beef feed, as
poultry volumes declined following the Avian Influenza
outbreak. In the maize category, selling prices reduced
by 15% due to a significant reduction in raw maize prices
as the country was self-sufficient in maize for the first
time in many years.
Total gross margin dollars increased by 2.7% compared
to last year, with a mixed performance across the
various categories. Flour margins declined substantially,
reducing by 22.2% in absolute dollars per ton in
comparison to last year. International wheat prices
rose during the year and these increases could not be
recovered in flour prices due to the delays in agreeing
the increase in bread pricing with Government. Whilst an
increase in bread price was agreed towards the end of
the period, the margin impact of this has subsequently
been largely eroded by further inflationary pressures.
The viability of the mill-bake value chain remains
severely challenged and it is imperative that the sector
works with Government to find a sustainable solution
for both industry and the consumer.
Margins across the remaining categories largely met
expectation; in dollar per ton terms stockfeed margins
increased moderately, whilst maize margins measured
on the same basis were flat. Rice margins improved on
the back of relatively well priced raw materials in the
first half.
Operational expenditure increased by 2.3% to $47.95m
compared to the same period last year. Excluding costs
relating to the discontinued Depots incurred in the early
part of last year, costs increased by 7.6% versus the prior
period. Towards the end of the financial year inflationary
increases were seen particularly in distribution costs
(warehousing and delivery costs), driven by increased
fuel and vehicle maintenance costs, and to a lesser
extent plant repair and maintenance costs.
CHaIrman’s sTaTemenT
87

AnnuAl RepoRt - 2018 NATIONAL FOODS LTD.AnnuAl RepoRt - 2018NATIONAL FOODS LTD.
Working capital reduced from $79.0m at the start of the
year to $51.2m at year end. Prepayments for key raw
materials increased by $9.8m over the period whilst
foreign creditors increased by $36m, largely due to the
imported wheat position. There was a significant amount
of cash held at year end ($33.4m) which was being held
to secure key raw materials, as it is becoming increasingly
necessary to prepay to procure competitively.
capital expenditure for the period amounted to $4.44m,
well behind plan due to difficulties in sourcing foreign
currency which caused substantial delays in the various
capital projects that had been planned. The Group will
continue to reinvest in improving its operations in line
with the availability of foreign currency.
F l o U R M i l l i N G
Profitability for the division in the year under review
was extremely disappointing, declining by 37.3%. That
this occurred with record volumes is a reflection of the
severe margin compression in the category, the reasons
for which have been outlined elsewhere in this report.
Flour is the most significant category in our portfolio,
making it imperative that meaningful solutions to both
the viability of the mill-bake value chain and the foreign
wheat creditor position are found in the near future.
M a i Z E M i l l i N G
The Maize division achieved an improved result,
registering a small profit having achieved a loss of
$0.77m in the same period last year. Volumes increased
by 10.5%, a positive result given the excellent local
harvest. Government has agreed that the national food
security and commercial activities of the GMB will be
separated into autonomous units. It is hoped that this
will result in a more level competitive environment in the
category in future.
The company continues to focus intensely on innovation
within the maize category portfolio and it was
encouraging to note that the new Pearlenta High Fibre
products have been well received by health conscious
consumers.
s t o C K F E E d s
Volume performance for the Stockfeeds division
was disappointing, declining by 13% on prior year
due to the Avian Influenza outbreak which severely
compromised availability of day old chicks in the market
and consequently led to reduced feed volumes. Poultry
volumes recovered in the second half of the year as
day old chick availability improved. Beef and dairy
feed volumes were also softer following the excellent
2016-17 rains which improved pastures and reduced
supplementary feeding requirements over the past year.
M E d i U M - s C a l E C o N s U M E R G o o d s ( M C G )
This division produced a strong result for the period,
driven by rice and to a lesser extent salt which maintained
its market leading position. Mahatma and Red Seal
rice performed strongly in the market as national
rice supplies were constrained by foreign currency
availability. The fortunes of this unit will continue to
be driven by the ability to secure foreign currency to
import raw materials.
s N a C K s a N d t R E at s
This division manufactures extruded corn snacks and
loose biscuits under the Zapnax, Kings and Iris brands.
Volumes increased by 31% compared to the previous
period, with firm growth from Iris loose biscuits. Whilst
the unit is not yet a significant contributor to the Group
we believe that the snacks and biscuit categories have
growth potential and to this end have recently made
further investment in increasing capacity and capability
in this unit. The focus is to continue increasing volumes
on the back of improved capacity and distribution whilst
broadening the portfolio of products. cream biscuits
will be launched under the Iris brand during the first half
of next year.
P U R E o i l
Pure Oil produced an excellent result for the period,
delivering attributable earnings of $5.2m which
represented a 182% increase over the previous financial
year. In a relatively short period of time Pure Oil has
become the market leader in the cooking oil category
and has successfully kept the product on shelf in spite
of the challenges in securing foreign currency for raw
material imports.
Pure Oil will be entering the bakers’ fats and margarine
categories and these products will be introduced in the
first half of the next period.
N at i o N a l F o o d s l o G i s t i C s
National Foods logistics (Nat log) was created in
the second half of the financial year. Nat log will be
responsible for the distribution of National Foods’
product to the market and is a partnership with
Equity Distribution (Pvt) ltd, formerly National Foods’
outsource distribution service provider. The rationale
behind this investment is that distribution capability
has become a critical success factor for National Foods
and our objective is to improve customer service and
lower costs through investing in specialised truck and
warehouse capability. To this end Nat log has ordered
16 new trucks which will be commissioned early in the
new financial year. The results of Nat log will be equity
accounted by National Foods.
C o N t R a C t Fa R M i N G
The Group continues to support local farming, with
10,800 hectares of a variety of cereal crops having
been planted during the year through two substantial
contract farming schemes. National Foods directly
supported the production of 8,700 hectares of maize,
wheat, soya beans and sugar beans through the 2017-
2018 summer and 2018 winter seasons. In addition, Pure
Oil has supported an additional 2,100 hectares of soya
beans during the 2017-2018 summer season.
C o R P o R at E s o C i a l R E s P o N s i B i l i t Y ( C s R )
The Group’s cSR program focuses on improving well-
being and enhancing lives in the communities within
which the company operates, supporting 41 institutions.
This year the Group has again partnered with Kapnek
Trust in an initiative to establish further early childhood
development (EcD) classroom facilities in line with
the new education curriculum. Through this initiative 7
Primary schools, 4 in the Sanyati District and 3 in the
Ngezi District were assisted to successfully build or
rehabilitate facilities to enable EcD teaching.
F U t U R E P R o s P E C t s
The period under review witnessed significant political
changes in our country. Now that the critical election
phase is behind us it is imperative that attention is
urgently directed at resolving some of the serious
challenges facing the economy. The direct and
increasing impact that some of these issues are having
on National Foods has been discussed in this statement.
Provided that meaningful solutions to these challenges
can be found, we believe that there will be significant
opportunities to supply a broader range of categories as
economic conditions and the position of the consumer
improve further.
d i V i d E N d
The Board is pleased to declare a final dividend of 5.64
US cents per share payable in respect of all ordinary
shares of the company. This dividend is in respect of the
financial year ended 30 June 2018 and will be payable in
full to all the shareholders of the company registered at
the close of business on the 26th of October 2018.
The payment of this dividend will take place on or about
the 2nd of November 2018. The shares of the company
will be traded cum-dividend on the Zimbabwe Stock
Exchange up to the market day of 23 October 2018 and
ex-dividend as from the 24th of October 2018. This final
dividend brings the total dividend for the year to 12.53
US cents per share.
a C K N o W l E d G E M E N t a N d a P P R E C i at i o N
I would like to thank management and staff sincerely for
their continued commitment in what has been a very
challenging year. Finally, I wish to thank my fellow Board
members for their continued support and counsel.
Todd MoyoChairman
27 September 2018
CHaIrman’s sTaTemenT CHaIrman’s sTaTemenT
109

AnnuAl RepoRt - 2018 NATIONAL FOODS LTD.AnnuAl RepoRt - 2018NATIONAL FOODS LTD.
CorporaTe GoVernanCe CorporaTe GoVernanCe
CorPoraTe goVernAnCe
d i R E C t o R at E a N d E X E C U t i V E M a N a G E M E N t
The Boards of Directors of the Holding company and of
the Principal Operating company retain full and effective
control over the Group. The Boards meet regularly, no
less than four times a year to review strategy, planning,
operational performance, acquisitions and disposals,
stakeholder communications and other material matters
relating to performance of executive management.
The majority of Directors of the Holding company are
non-executive bringing objective judgement to bear on
issues of strategy and performance. The Group chairman
is an independent non-executive Director.
Managerial levels of authority have been established
for capital expenditure projects and the acquisition
and disposal of assets. However, decisions of a material
nature are taken by the Board of Directors and senior
management, who constitute key management and
whose remuneration is disclosed in Note 25.8. The
directors have access to the advice and services of the
company secretary who is responsible to the Board for
ensuring compliance with procedures and regulations.
Directors are entitled to seek independent professional
advice about the affairs of the Group, at the company’s
expense, if they believe that course of action would be in
the best interest of the Group.
F i N a N C i a l s tat E M E N t s
The Directors of the National Foods Holdings Group
are responsible for preparing financial statements and
other information presented in the annual report in a
manner that fairly presents the state of affairs and
results of the operations of the company and the Group.
The external auditors are responsible for carrying out
an independent examination of the financial statements
in accordance with International Standards on Auditing
and reporting their findings thereon. The annual financial
statements contained in this report have been prepared
in accordance with International Financial Reporting
Standards. They are based on appropriate accounting
policies and are supported by reasonable and prudent
judgements and estimates. The directors have no reason
to believe that the Group’s operations will not continue
as a going concern in the year ahead.
a U d i t a N d R i s K C o M M i t t E E
The Group has a risk and audit committee comprising
representation by non-executive directors and is chaired
by a non-executive director. As at 30 June 2018 the
committee comprised G. Gwainda (chairman), N. Doyle,
T Moyo, P. Spies and J. Schonken. The external auditors
have unrestricted access to this committee. The audit
committee reviews the effectiveness of internal controls
in the Group with reference to the findings of both the
internal and external auditors. Other areas covered
include the review of important accounting issues,
including specific disclosures in the financial statements
and a review of the major audit recommendations.
The board is accountable for the process of risk
management and for establishing appropriate risk
and control policies and to ensure that these are
communicated throughout the Group. Executive
managers are responsible for the identification and
evaluation of key risks applicable to their areas of
business. The Group conducts an on-going process for
identifying, evaluating and managing the significant risks
faced by the Group. This committee reports to the Board
on all areas of risk that have been identified in the Group.
i N t E R N a l C o N t R o l
The Group maintains internal controls and systems
designed to provide reasonable assurance as to the
integrity and reliability of the financial statements and to
adequately safeguard, verify and maintain accountability
for its assets. Such controls are based on established
policies and procedures and are implemented by trained
personnel with an appropriate segregation of duties. The
internal audit function operates under the direction of
the Group Audit committee, which approves the scope
of the work to be performed. Significant findings are
reported to both executive management and the audit
committee. Corrective action is taken to address internal
control deficiencies identified in the execution of the
work. Nothing has come to the attention of the Directors
that indicates any material breakdown in the functioning
of the key internal controls and systems during the period
under review. The Group has comprehensive risk and loss
control procedures in place.
d i R E C t o R s ’ a N d E X E C U t i V E R E M U N E R at i o N
REMUNERATION cOMMITTEE
The remuneration committee has been delegated by
the board with the responsibility of determining the
remuneration of the executive directors and other senior
management members. The chairman of the committee
is obliged to report to the board on its deliberations. The
committee is comprised of J. Schonken (chairman), N.
Doyle and P. Spies (Alternate).
i N t R o d U C t i o N
The primary objective of any system of
corporate governance is to ensure that
directors and managers, to whom the running
of large corporations has been entrusted by
the shareholders, carry out their responsibilities
faithfully and effectively, placing the interests
of the corporation and society ahead of their
own. This process is facilitated through the
establishment of appropriate reporting and
control structures within the organisation. The
Board believes that the Group’s governance
practices are strong and that in all material
respects, the Group conforms to the principles
embodied within the King IV Report and
combined code on corporate Governance and
is committed to ensuring that these principles
continue to be an integral part of the way in
which the Group’s business is conducted.
National Foods Holdings Group subscribes
to the principles of discipline, independence,
accountability, transparency, responsibility, integrity,
fairness and social responsibility, identified as the primary characteristics of good governance in the
Code of Corporate Practices and Conduct, contained
within the King iV Report on Corporate Governance
and the Combined Code on Corporate Governance.
1211

AnnuAl RepoRt - 2018 NATIONAL FOODS LTD.AnnuAl RepoRt - 2018NATIONAL FOODS LTD.
CorporaTe GoVernanCe (ConTInueD)
R E M U N E R at i o N P o l i C Y
The remuneration policy is formulated to attract, retain
and motivate top quality people in the best interests of
shareholders, and is based upon the following principles:
• Remuneration arrangements will be designed to
support National Foods Holdings Group’s business
strategy, vision and to conform to best practices.
• Total rewards will be set at levels that are competitive
within the context of the relevant areas of responsibility
and the industry in which the Group operates.
C o M P o s i t i o N o F E X E C U t i V E R E M U N E R at i o N
The remuneration packages of the executive directors
comprise an annual salary, benefits as well as short term
and long term incentive scheme.
M a N a G E M E N t R E P o R t i N G
There are comprehensive management reporting
disciplines in place which include the preparation of
annual budgets by all operating units. Individual budgets
are approved by the Principal Operating company board
of directors, while the Group budget is reviewed by the
directors of the Holding company. Monthly results and
the financial status of operating units are reported against
approved budgets and compared to the prior year. Profit
projections, cash flow forecasts, working capital and
borrowing levels are monitored on an on-going basis.
s t R at E G i C P l a N N i N G P R o C E s s
In line with its mission to build a world-class business,
the overall strategy for National Foods Holdings is clearly
focused. Annual strategic plans are compiled at both
Group and business unit level, with detailed plans for
action and allocated responsibilities. Progress is reviewed
regularly.
E t H i C s
Directors and employees are required to observe the
highest ethical standards, ensuring that the business
practices are conducted in a manner which, in all
reasonable circumstances is beyond reproach. In line with
the Zimbabwe Stock Exchange listing Requirements, the
Group operates a closed period prior to the publication
of its interim and year end financial results during which
period directors, officers and employees may not deal in
the shares of the Holding company. Where appropriate,
this is also extended to include other sensitive periods.
E q U a l o P P o R t U N i t Y
The Group is committed to providing equal opportunities
for its employees regardless of race, tribe, place of origin,
political opinion, colour, creed or sex.
13
sUsTaiNabiliTY In our BusIness
oUR sUstaiNaBilitY appRoaCH
In the current year, the Group made a decision to adopt
sustainability reporting in order to create and give value
to our stakeholders. The strategy follows the Global
Reporting Initiative (GRI) Standards which require us
to identify measure and disclose to our internal and
external stakeholders, our economic, environmental
and social impacts and opportunities arising from our
business activities. Our strategy will transform the way
we have been engaging and communicating with our
stakeholders. We expect our next annual report to be
fully compliant with GRI Standards.
Our sustainability strategy will enhance sustainable
decisions across the Group and transform our business
model. It is the Group’s intention to create value in the
places where we operate and operate in a sustainable
manner in response to climate change and Sustainable
Development Goals (SDGs) imperatives. Sustainability
is a key pillar for strengthening various capitals of the
Group and our goal is to ensure value proposition to the
business and all stakeholders.
s ta K E H o l d E R s a N d R E l at i o N s H i P s
The Group continues to build sustainable relations with
stakeholders and business partners to ensure sustainable
success and competitiveness in the market. Therefore,
the Group will enhance shared values with stakeholders
and business partners in a spirit of inclusivity and
responsiveness to foster strong relational capital and
trust for the Group.
s U P P lY C H a i N
Supply chain management remains a critical function
in the success of our products, brands and image. The
Group provides systems which ensure that all suppliers
are screened based on track record and consideration
of sustainability issues such as environmental, social
behavior, corruption, statutory compliance and human
rights practices. The Group endeavors to contribute
towards the empowerment of societies in places in
which we operate by creating economic opportunities
in the supply chain. The Group supports local farming
in the value chain through contract farming. The Group
also promotes local farmers by buying and using locally
produced raw materials wherever possible before opting
for imported options. This initiative is in line with the
Kilometer Zero Initiative that reduces carbon foot prints
and minimizes the effect of climate change.
C o M M U N i t Y i N V E s t M E N t a N d d E V E l o P M E N t
The Group supports and assists vulnerable groups,
disadvantaged communities and is involved in various
livestock and wildlife initiatives around the country. Our
corporate Social Responsibility (cSR) programme has
remained our strategic opportunity for bringing the
Group close to the community.
s U s ta i N a B i l i t Y d ata a s s U R a N C E
The data contained in this report was verified through our
Group internal audit service process. These are conducted
by Instinct Risk Advisory and enable stakeholders to
derive reasonable assurance on our performance.
MatERial issUEs & disClosURe
The Group evaluates economic, environmental and social
issues on their impact on the business and stakeholders.
This process involves management and staff going
through an evaluation of material issues brought to their
attention from both internal and external stakeholders.
Where material issues are considered to be of high
impact, management will devise appropriate remedies
and update stakeholders through the annual reports,
regular updates and press releases.
susTaInabIlITY In our busIness
14
AnnuAl RepoRt - 2018 NATIONAL FOODS LTD.AnnuAl RepoRt - 2018NATIONAL FOODS LTD.
oUR staKEHoldERs &
RelationsHips
The Group believes that sustainable relationships are
critical for long term value creation and business success.
Our stakeholders play a significant role in the value chain
of the Group and as such are considered as important
capital in our business model. Our stakeholders and the
relationships we have built over decades continue to
inform how we manage corporate and enterprise risk
management, and business development.
In the current year, the Group engaged with various
stakeholders whose issues shaped the contents of this
report. Our engagements are presented below:
MaNaGiNG oUR sUstainaBility FootpRint
o U R a P P R o a C H
The Group’s approach to managing our sustainability
footprint rests upon minimizing the negative impacts
on the business and our stakeholders, particularly
those relating to the environment and society. We do
this by setting targets, implementing remedial systems
and continuously monitoring processes. In line with
commitments made for compliance with regulators, laws
and best practices, the Group has systems for managing
environmental and social impacts on the business
environment and stakeholders.
For FY2018, the Group placed significant effort
in managing the sustainability footprint and the
performance as presented below:
Stakeholder Material Issues Raised Mitigation Measures Communication Channels
Employees/Staff• Engagement & inclusion• Working hours• Employee benefits
• Development, review, implementation and monitoring of the Human Resources Policy and Procedures
• Training
• Works council meetings• Face to face interactions• Noticeboards/NFl
communication via emails• line Manager engagements• cEO monthly lunches with staff• Executive committee
cascades on employee benefits
• code of conduct• code of Ethics
Suppliers• Timely payments• Ethical business practices
• Suppliers audits• Suppliers screening• Supplier contracts
• Face to face meetings• Tip Offs Anonymous
Industry
• Animal disease control• Training & Development• Fair pricing• Fair competition
• Interaction with the Department of Veterinary Services of Zimbabwe
• Interaction with the Ministry of Health (MoH)
• Zimbabwe Poultry Association (ZPA)
• Grain Millers Association of Zimbabwe (GMAZ)
• confederation of Zimbabwe Industries (cZI)
• Scaling Up Nutrition Network (SUN) & Food Nutrition council (FNc)
Government/ Regulators• Regulatory compliance• Transparent reporting
• compliance with regulations• Direct meetings and updates• Regulator audits
Shareholders and Potential Investors
• competitive Returns• Regulatory compliances
• Improved Profitability & returns year on year
• Enhanced governance oversight by the Board
• Integrated annual reports• Annual General Meetings• Bi-annual results releases• Website updates• Face to face meetings
Customers and Consumers
• Safe quality products• Nutritious options• competitive and affordable
pricing• Innovative products
• Rigorous quality checks and balances
• continuous product development
• compliance with legislation
• Food safety standards• Regular meetings with key
accounts contacts• consumer & consumers
surveys• consumer & customer
Immersions• Websites• Tip Offs Anonymous
local communities
• Economic development• Environmental protection• Employment opportunities• Supply opportunities
• compliance with legislation
• Regular interaction with local Authorities
• corporate social responsibility
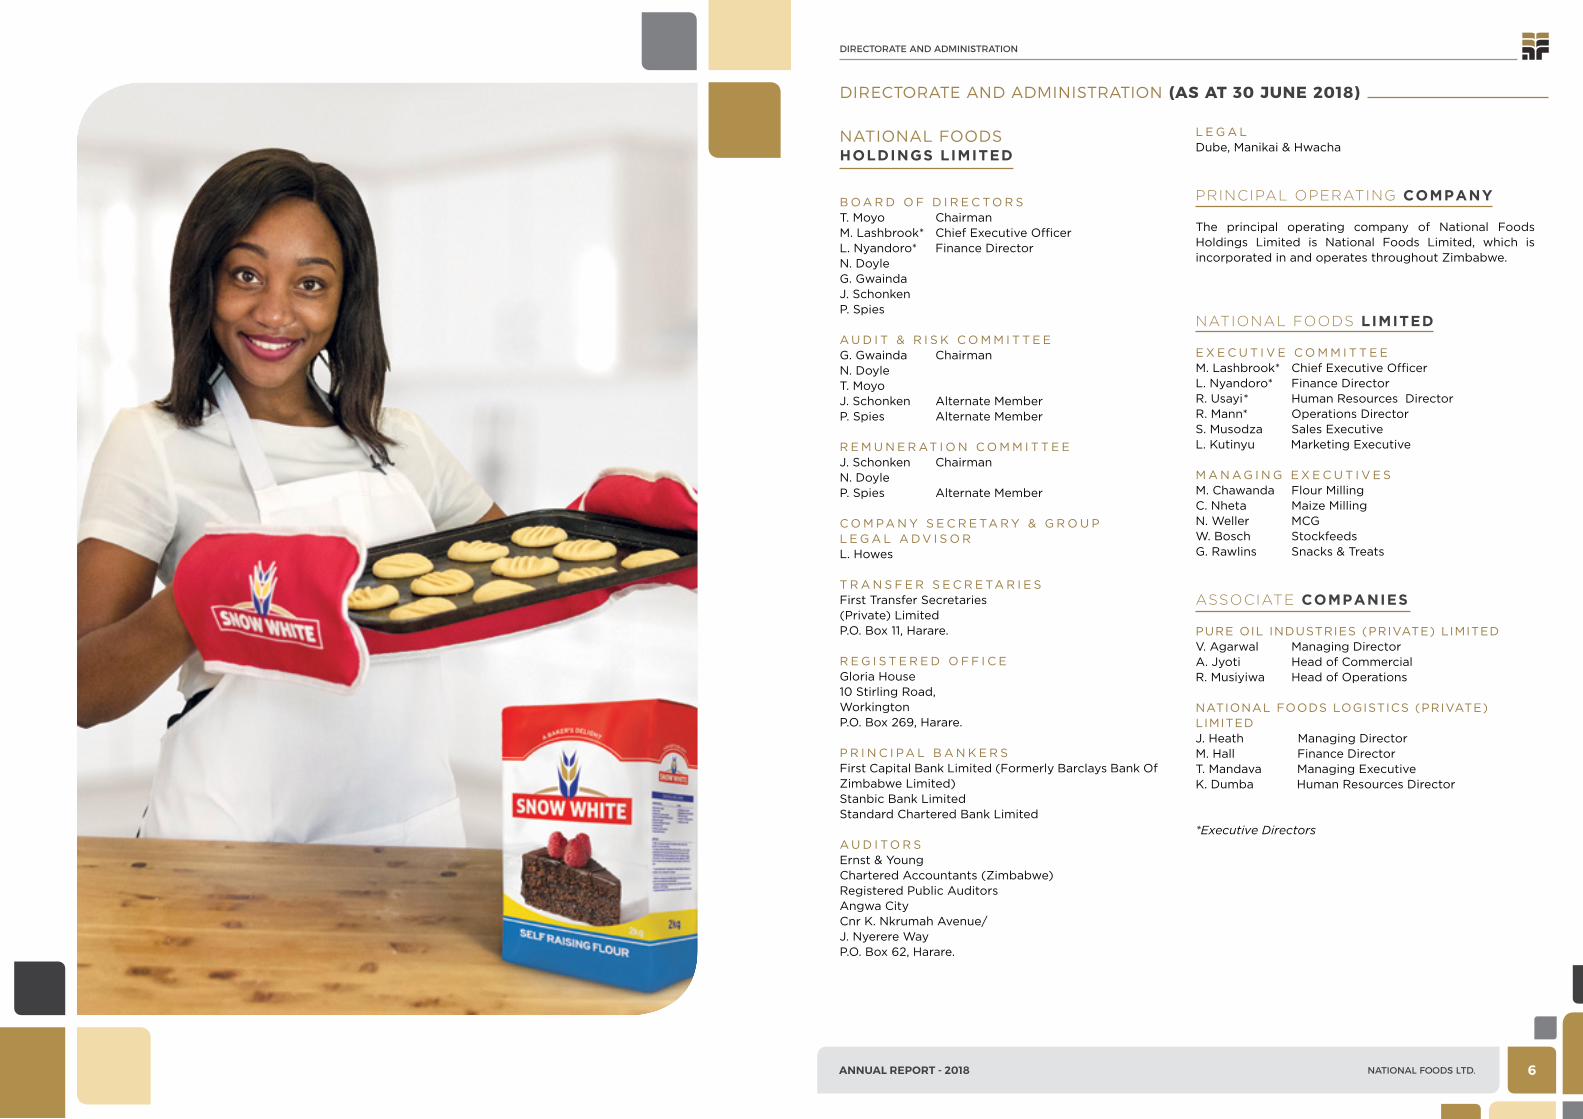
ENViRoNMENtal ResponsiBility
R aW M at E R i a l s
The Group tries by all means to minimize wastage in the
production of our primary products. For the current year,
we used the following raw materials:
Materials Unit 2018 2017
Maize Tons 161,710 145,925
Soya Tons 19,956 19,889
Wheat Tons 277,186 224,954
Maize Gem Meal Tons 14,260 22,931
Wheat feed Tons 40,655 35,003
Rice Tons 24,786 32,808
Salt Tons 21,743 19,057
560,296 500,561
P R o d U C t i o N Wa s t E R E C YC l i N G
As a result of minimize wastage in the production process,
material available for recycling is minimal. For the current
year, our recycling was as follows:
Recycling Unit 2018 2017
Average waste material recycled into other products
% 0.09 0.005
E N E R G Y C o N s U M P t i o N
The Group takes measures to manage energy
consumption within our operations. Our the current year
consumption was as follows:
Energy Type Unit 2018 2017
Electricity KWh 27,855 28,141
coal (Heating) Tons 443 333
Fuel for Generators
litres 244,849 170,509
C a R B o N F o o t P R i N t
The Group monitors impacts on climate change by
tracking its carbon footprint from various emission
sources in our manufacturing processes. For the the
current year, our carbon footprint calculations based on
fossil fuel consumption were as follows:
Emission Source
Unit 2018 2017
ElectricityKg cO2e/
KWh9,792,861 9,893,473
CoalKg cO2e/
Kg1,079,758 811,927
Fuel for Generators (Diesel)
Kg cO2e/litre
636,648 443,352
11,509,267 11,148,752
Wat E R M a N a G E M E N t
The Group draws water from various sources which it
monitors to ensure sustainable consumption. For the the
current year, our consumption was as follows:
Source Unit 2018 2017
Ground Water (Borehole)
m3 161,929 168,144
Surface Water (Municipal Water Supply)
m3 51,214 53,848
213,143 221,992
Wa s t E M a N a G E M E N t
Our approach to production waste disposal includes
final disposal and alternative use. During the current
year, waste material was managed through the following
disposals:
Waste by Type
Disposal Method
Unit 2018 2017
Solid Waste landfill Tons 274 393
Primary Production Waste
Sale to farmers
Tons 308 436
Paper Cut Offs
Recycling Tons 33 29
615 858
susTaInabIlITY In our busIness susTaInabIlITY In our busIness
15 16

AnnuAl RepoRt - 2018 NATIONAL FOODS LTD.AnnuAl RepoRt - 2018NATIONAL FOODS LTD.
soCial CoHesion
H U M a N C a P i ta l
Our staff are a critical capital that drives how we create
and sustain value for our stakeholders. The Group
continues to provide economic opportunities to society
through various employment opportunities that include
short term contracts, fixed term contracts and permanent
positions. During the year, our employment performance
is presented below:
NEW STAFF ENGAGEMENT
Gender Unit 2018 2017
Male Count 26 4
Female Count 24 4
50 8
STAFF TURNOVER
Gender Unit 2018 2017
Male Count 66 18
Female Count 11 2
77 20
NET STAFF cOMPlIMENT
Gender Unit 2018 2017
Male Count 1,178 1,203
Female Count 189 170
1,367 1,373
H E a lt H a N d s a F E t Y i N t H E W o R K P l a C E
The health and safety of our employees is a priority in
our workplace. The Group has embarked on a Vision Zero
Initiative (a drive towards eradicating all work related
injuries and illnesses). The Group thus continues to take
measures to minimize injuries through training activities.
During the year, safety incidents and training were as
follows:
Incidence Unit 2018 2017
Total number of work related injuries
Counts 11 18
lost days due to injuries Counts 291 154
Safety training (days) Days 138 121
s ta F F d E V E l o P M E N t
The Group strives to keep employees skills and knowledge
consistent with the latest developments in their related
areas of responsibility. During the current year, our
average employee training and education hours were as
follows:
Gender Unit 2018 2017
Male Hours 41 26
Female Hours 44 33
PRodUCt ResponsiBility
The Group pays great attention to product quality and
safety for the consumers. During the year, the Group
conducted a customer satisfaction survey which showed
brands like Gloria, Red Seal Roller Meal, King Kurls,
and National Foods Stockfeed maintaining a superior
performance in the market. The Group managed to
maintain its ISO9001:2015 certification on Quality
Management during the year for its Stockfeeds division.
The maize unit is currently implementing an integrated
ISO 9001:2015 and ISO 22000:2008 with the aim of
getting certification by June 2019.
CoMMUNitY iNVEstMENt &
deVelopment sUppoRt
The Group supports the disadvantaged and vulnerable
among our stakeholders and the greater community
through its corporate Social Responsibility (cSR)
Programme. Our cSR objective is to plough back into
the communities where we operate by enhancing lives,
improving wellbeing, and building lasting emotional
capital. NFl engages in proactive initiatives which have
a positive impact to the socio-economic well-being of
communities and through activities geared towards
the preservation and long term sustainability of the
environment. During the year under review, our support
through materials and finance was as follows:
ECoNoMiC ContRiBUtions
PaY M E N t t o G o V E R N M E N t
The Group makes payments to government through its
corporate taxes, value added tax, duty and levies. For
FY2018, we made the following payment to government:
Unit2018
(000)2017
(000)
Corporate Tax – Associates
US$ 4,472 1,588
Value Added Tax (VAT)
US$ 5,846 4,627
Import Duty US$ 915 1,200
Withholding Tax
US$ 152 147
levies US$ 49 52
11,434 7,614
P E N s i o N C o V E R a G E & C o N t R i B U t i o N s
The Group contributes to various pension funds managed
internally and externally. 84% of the employees are on
the National Foods Pension Fund. For FY2018, the Group
contributed to the following pensions:
Beneficiaries Products/Support Support Category
Kapnek Trust, Ngezi and Sanyati Schools Renovation of School Facilities Education
23 Orphanages (including Mola Hostels, Kambuzuma, Mother of Peace)
Roller meal, beans and salt Orphanages
Ekuphumeleni Nursing home and Shingirai Trust Roller meal, beans and saltcommunity empowerment and development
6 centres (including Zimcare Trust, Homefield & Emerald Hill) Roller meal, beans and salt Disability support
Mucheke old People, Malvern House and Place of Safety Roller meal, beans and salt Old People Homes
Harare Vocational Training centre (1) Roller mealArt, Social and Regional Support
Zambezi Society, Homefield, SPcA and Healing with Horses Provisions and animal feed Animal Welfare
Pension Unit2018
(000)2017
(000)
National Foods Pension
US$ 744 833
National Social Security
US$ 225 239
Group life Cover
US$ 74 79
1,043 1,151
susTaInabIlITY In our busIness susTaInabIlITY In our busIness
17 18
AnnuAl RepoRt - 2018NATIONAL FOODS LTD.
BUsiNEss assoCiatioN memBeRsHip
The Group participates in various business and industry
associations below:
• confederation of Zimbabwe Industries (cZI)
• Zimbabwe National chamber of commerce (ZNcc)
• Zimbabwe Poultry Producers Associations (ZPA)
• Business council for Sustainable Development
Zimbabwe (BcSDZ)
• Stockfeeds Manufacturers Association (SMA)
• Grain Millers Association of Zimbabwe (GMAZ)
• Food Nutrition council (FNc)
• Scaling Up Nutrition Network (SUN)
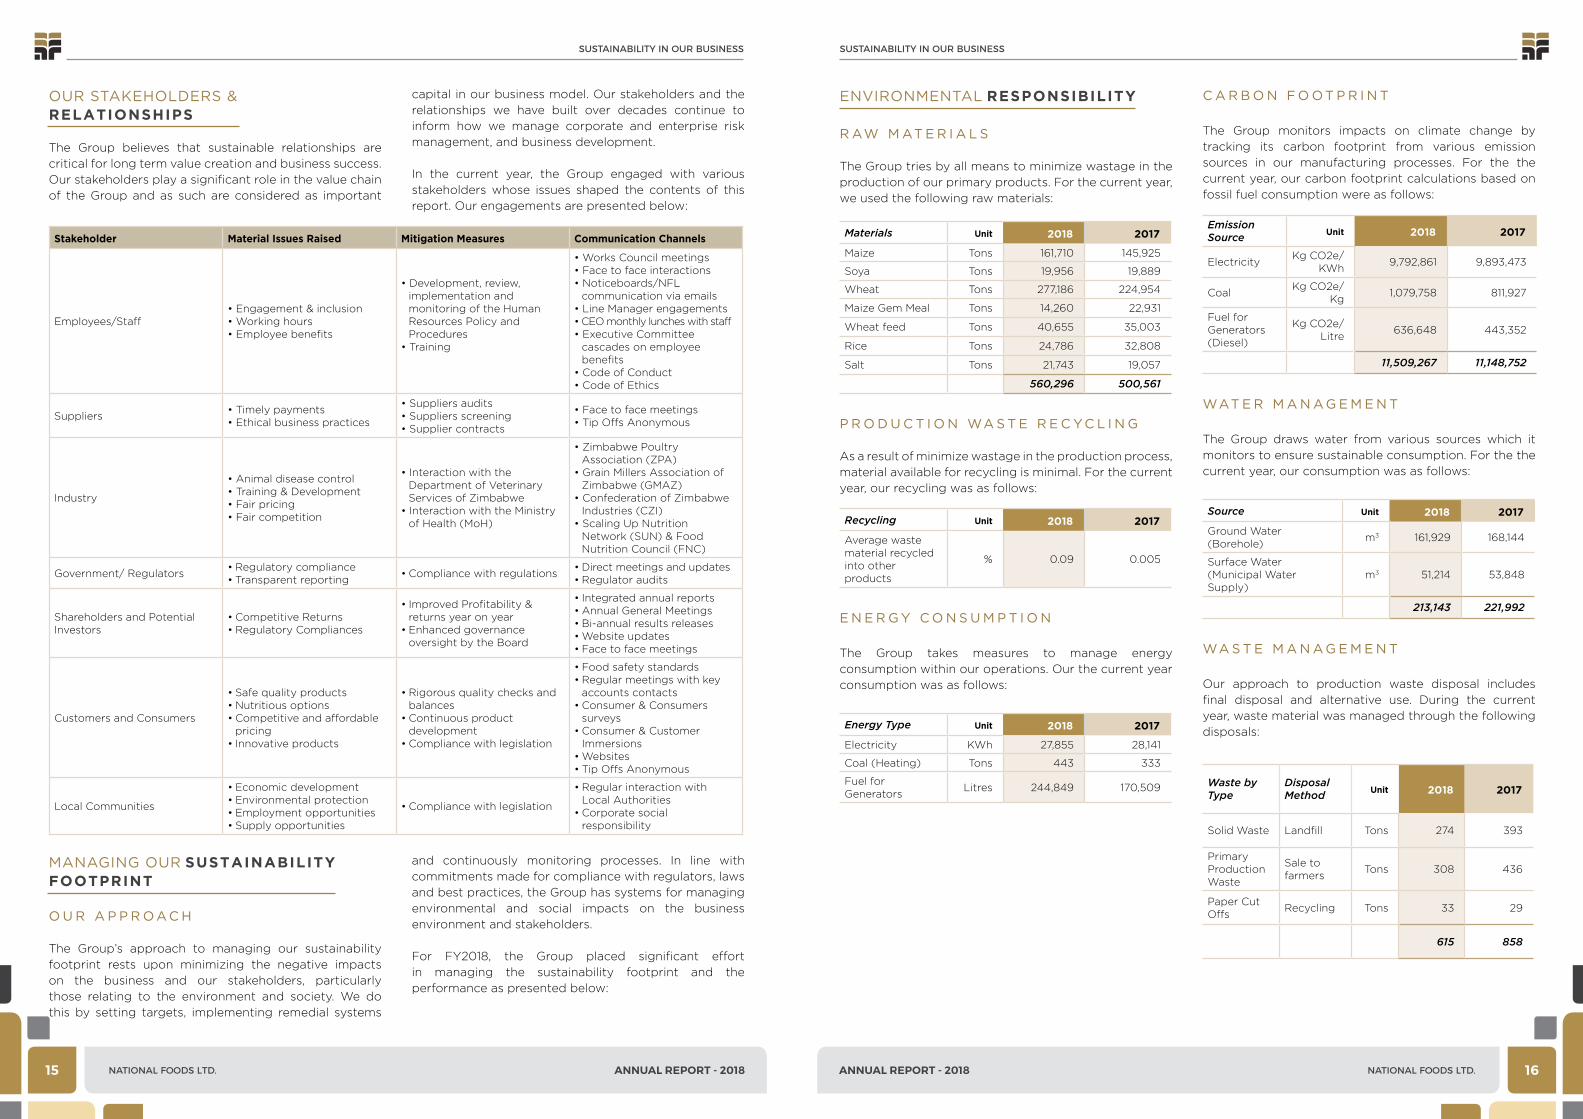
CERtiFiCatioNs & standaRds
The Group ascribes to the following standards and
certifications:
• ISO9001:2015 - Standards Association of Zimbabwe
(SAZ)
• Health Professions Association of Zimbabwe (HPAZ)
• KOSHER (Jewish community)
• HAlAAl (National Halaal Association of Zimbabwe
(NHAZ))
RECoGNitioN & aWaRds
• Product of the Year (1st Runner up) – Buy Zimbabwe
Awards
• company of the Year (1st Runner up) - Buy Zimbabwe
Awards
• Highest Earnings per Share (2nd Runner up) -
Zimbabwe Quoted companies Survey
• Product of the Year (1st Runner up) - National Quality
Awards
• company of the Year (1st Runner up) – National Quality
Awards
20
susTaInabIlITY In our busIness
19

AnnuAl RepoRt - 2018 NATIONAL FOODS LTD.
sTaTemenT of DIreCTors’ responsIbIlITY
sTaTeMeNT of DireCTor’s responsIBIlIty
The Directors of the company are required by the
companies Act to maintain adequate accounting
records and to prepare financial statements that
present a true and fair view of the state of affairs of the
company and the Group at the end of each financial
year and of the profit and cash flows for the period.
In preparing the accompanying financial statements,
International Financial Reporting Standards have been
followed. Suitable accounting policies have been used
and consistently applied, and reasonable and prudent
judgements and estimates have been made.
The financial statements have been prepared under the
historical cost convention, are in agreement with the
underlying books and records and have been properly
prepared in accordance with the accounting policies set
out in note 2 of the financial statements, and comply
with International Financial Reporting Standards and
the disclosure requirements of the companies Act
(chapter 24:03) and the relevant regulations made
thereunder.
The principal accounting policies of the Group are
consistent with those applied in the previous year except
when stated and conform to International Financial
Reporting Standards (IFRS). The Directors have satisfied
themselves that the Group is in a sound financial position
and has adequate resources to continue in operational
existence for the foreseeable future. Accordingly they are
satisfied that it is appropriate to adopt the going concern
basis in preparing the financial statements.
The Board recognises and acknowledges its responsibility
for the Group’s systems of internal financial control. The
Group maintains internal controls and systems that are
designed to safeguard its assets, prevent and detect
errors and fraud and ensure the completeness and
accuracy of the its records. The Group’s Audit committee
has met the external auditors to discuss their reports on
the results of their work, which include assessments of
relative strengths and weaknesses of key control areas.
Whilst in a growing group of the size, complexity and
diversity of National Foods it may be expected that
occasional breakdowns in established control processes
may occur, no breakdowns involving material loss have
been reported to the Directors in respect of the period
under review.
The financial statements for the year ended 30 June 2018,
which appear on pages 32 to 67 have been approved by
the Board of Directors and are signed on its
behalf by:
T.Moyo M.lashbrook
Chairman Chief Executive Officer27 September 2018
22

AnnuAl RepoRt - 2018 NATIONAL FOODS LTD.AnnuAl RepoRt - 2018NATIONAL FOODS LTD. 24
DIreCTor’s reporT
s H a R E C a P i ta l
During the year the authorised share capital remained
at 73 000 000 ordinary shares of (US$) 1 cent each.
No new shares were issued during the year (2017:Nil)
and the number of shares in issue was 68 400 108
(2017:68 400 108).
N at i o N a l F o o d s W o R K E R s t R U s t
National Foods Workers Trust (Private) limited
was established to provide a scheme for worker
participation in both the equity and profits of the
company. Through donations by the company to
the Trust, the Trust acquired a 10% shareholding in
National Foods Holdings limited. Dividends received
through its shareholding are administered by a
board of Trustees for the benefit of workers under
grades “A”, “B” and “c” of the Milling and commercial
Industries and grades 1-6 of the Textile Industry, being
the National Employment council for which the wide
categories of employees fall.
B o R R o W i N G P o W E R s
In terms of the Articles of Association, the borrowing
powers of the company and its subsidiaries
(excluding inter-company borrowings) are limited in
aggregate to the nominal amount of the share capital
of the company plus the total free reserves of the
company and its subsidiaries. The level of borrowings
throughout the year was adequately covered in this
respect.
R E s E R V E s
Movements in reserves are shown in the statement of
changes in equity.
d i V i d E N d s
The Board has declared a final dividend of (US$) 5.64
cents per share payable on or about 2 November 2018
to shareholders registered at the close of business
on 26 October 2018. The shares of the company will
be traded cum – dividend on the Zimbabwe Stock
Exchange up to the market day of 23 October 2018
and ex – dividend as from 24 October 2018. Together
with the interim dividend of (US$) 6.89 cents per
share, this final dividend brings the total dividend for
the year to (US$) 12.53 cents per share.
d i R E C t o R at E
No changes to the directorate in the current
year.
a U d i t o R s
Members will be asked to fix the remuneration of
Ernst & Young for the past audit and to confirm their
reappointment for the ensuing year.
a N N U a l G E N E R a l M E E t i N G
The forty ninth Annual General Meeting of the
company will be held at 10:30am on Monday 19th
November 2018 at the registered office of the
company 10 Stirling Road, Workington, Harare.
T.Moyo M.lashbrook
Chairman Chief Executive Officer27 September 2018
the directors have pleasure in presenting their report, together with the audited financial statements for the year ended 30 June 2018
2018 2017 2016 2015 2014
US$000 US$000 US$000 US$000 US$000
Profit before tax 21,211 17,226 19,041 17,253 21,745
income tax expense (4,036) (3,522) (4,768) (4,517) (4,962)
Profit for the year 17,175 13,704 14,273 12,736 16,783
Total comprehensive income for the year 17,175 13,707 14,271 12,734 16,783
GroUP fInAnCIAl results
23

AnnuAl RepoRt - 2018 NATIONAL FOODS LTD.AnnuAl RepoRt - 2018NATIONAL FOODS LTD. 2625

AnnuAl RepoRt - 2018 NATIONAL FOODS LTD.AnnuAl RepoRt - 2018NATIONAL FOODS LTD. 2827

AnnuAl RepoRt - 2018 NATIONAL FOODS LTD.AnnuAl RepoRt - 2018NATIONAL FOODS LTD. 3029

AnnuAl RepoRt - 2018 NATIONAL FOODS LTD.
Note 2018 2017
US$ US$
Revenue 4 297,929,498 289,508,168
Cost of sales (228,041,802) (221,488,438)
Gross profit 69,887,696 68,019,730
Other income 5.1 993,052 745,234
Distribution expenses (10,722,756) (9,847,356)
Selling and marketing expenses (4,133,040) (3,629,085)
Employee benefits expenses (16,490,935) (17,530,188)
Administrative expenses (17,399,672) (18,374,792)
Depreciation 5.3/8 (2,666,931) (2,886,852)
Profit from operating activities 5 19,467,414 16,496,691
Interest income 5.4 149,512 458,011
Interest expense 5.4 (3,601,787) (1,559,706)
Equity accounted earnings 11.3 5,195,938 1,831,471
Profit before tax 21,211,077 17,226,467
Income tax expense 6.1 (4,035,873) (3,521,844)
Profit for the year 5 17,175,204 13,704,623
Other comprehensive income
- to be recycled to profit and loss at a future point in time
Exchange differences on translation of foreign operation (690) 2,212
Total comprehensive income for the year 17,174,514 13,706,835
Profit for the year attributable to equity holders of the parent 17,175,204 13,704,623
Total comprehensive income for the year attributable to equity holders of the parent
17,174,514 13,706,835
Earnings per share
Basic and diluted earnings per share 7 25.11 cents 20.04 cents
Headline earnings per share 7 25.05 cents 20.06 cents
ConsolIDaTeD sTaTemenT of profIT or loss anD oTHer CompreHensIVe InCome
CoNsoliDaTeD sTaTeMeNT of ProfiT or loss aND oTher CoMPreheNsiVe iNCoMe for tHe yeAr ended 30 June 2018
32

AnnuAl RepoRt - 2018 NATIONAL FOODS LTD.AnnuAl RepoRt - 2018NATIONAL FOODS LTD.
ConsolIDaTeD sTaTemenT of fInanCIal posITIon
Note 2018 2017
US$ US$
ASSETS
Non-current assets
Property, plant and equipment 8 44,122,607 45,682,101
Intangible assets 10 1,516,422 1,516,422
Investment in associate 11.3 10,631,809 4,685,871
Other financial assets 12.1 988,933 1,395,088
57,259,771 53,279,482
Current assets
Cash & cash equivalents 19.4 33,403,229 3,682,942
inventories 13 41,746,879 44,469,365
trade and other receivables 14 62,515,892 51,497,325
Current portion of other financial assets 12.1 1,998,767 -
Current tax receivable 6.3 750,895 89,629
140,415,662 99,739,261
assets classified as held for sale 9 3,402,447 107,313
143,818,109 99,846,574
Total assets 201,077,880 153,126,056
EQUITY AND LIABILITIES
Equity
Issued share capital 15.1 684,001 684,001
Non-distributable reserves 15.3 (10,628) (9,938)
Distributable reserves 15.4 103,161,825 94,263,037
Total equity 103,835,198 94,937,100
Non-current liabilities
deferred tax liability 6.4 8,201,539 7,987,464
8,201,539 7,987,464
Current liabilities
Trade and other payables 17 52,786,808 16,603,855
Bank overdrafts 12.2 159,728 19,829,174
Borrowings 12.2 30,261,638 10,836,474
Provisions 18 347,241 400,898
Shareholders for dividends 16 5,315,577 2,525,725
88,870,992 50,196,126
liabilities relating to assets held for sale 9 170,151 5,366
89,041,143 50,201,492
Total equity and liabilities 201,077,880 153,126,056
CoNsoliDaTeD sTaTeMeNT of fiNaNCial PosiTioN As At 30 June 2018
T. Moyo
ChairmanHarare27 September 2018
M. lashbrook
Chief Executive Officer
ConsolIDaTeD sTaTemenT of CHanGes In equITY
Issued Share Capital
Non-Distributable
Reserves
Distributable Reserves
Total
US$ US$ US$ US$
Note 15.1 15.3 15.4
Balance at 30 June 2016 684,001 (12,150) 87,685,707 88,357,558
Profit for the year - - 13,704,623 13,704,623
Exchange differences on translation of foreign operation - 2,212 - 2,212
total comprehensive income - 2,212 13,704,623 13,706,835
dividends declared (Note 16) - - (7,127,293) (7,127,293)
Balance at 30 June 2017 684,001 (9,938) 94,263,037 94,937,100
Profit for the year - - 17,175,204 17,175,204
Exchange differences on translation of foreign operation - (690) - (690)
Total comprehensive income - (690) 17,175,204 17,174,514
Dividends declared (Note 16) - - (8,276,416) (8,276,416)
Balance at 30 June 2018 684,001 (10,628) 103,161,825 103,835,198
CoNsoliDaTeD sTaTeMeNT of ChaNGes iN eQUiTY for tHe yeAr ended 30 June 2018
3433

AnnuAl RepoRt - 2018 NATIONAL FOODS LTD.AnnuAl RepoRt - 2018NATIONAL FOODS LTD.
Note 2018 2017
US$ US$
OPERATING ACTIVITIES
cash generated from operations 19.1 22,240,522 20,194,935
Working capital changes 19.2 27,091,919 (35,352,258)
Operating cash flow 49,332,441 (15,157,323)
Interest received 5.4 48,069 410,643
Interest paid 5.4 (3,601,787) (1,559,706)
Income tax paid 19.3 (4,318,279) (3,839,050)
Net cash flows from operating activities 41,460,444 (20,145,436)
INVESTING ACTIVITIES
Purchase of property, plant and equipment to maintain operations (3,926,321) (2,630,301)
Purchase of property, plant and equipment to expand operations (518,251) (1,234,199)
Investment in associate 11.3 (750,000) -
loan to associate 12 (1,956,382) -
Purchase of other financial instruments 12.1 - (382,140)
Proceeds on disposal of property, plant and equipment 89,795 89,602
Debenture repayment 121,936 -
Proceeds on disposal of financial instruments 929,908 -
Net cash flows from investing activities (6,009,315) (4,157,038)
FINANCING ACTIVITIES
Proceeds from borrowings and overdrafts 13,789,526 24,616,961
Repayment of borrowings (14,033,804) (1,196,249)
Dividends paid 16 (5,486,564) (4,601,568)
Net cash flows from financing activities (5,730,842) 18,819,144
Increase / (Decrease) in cash and cash equivalents 29,720,287 (5,483,330)
Cash and cash equivalents at beginning of the year 3,682,942 9,166,272
Cash and cash equivalents at the end of the year 19.4 33,403,229 3,682,942
CoNsoliDaTeD sTaTeMeNT of Cash floWs for tHe yeAr ended 30 June 2018
ConsolIDaTeD sTaTemenT of CasH flows noTes To THe ConsolIDaTeD fInanCIal sTaTemenTs
NoTes To The CoNsoliDaTeD fInAnCIAl stAteMents
1. CORPORATE INFORMATION
The company and its subsidiaries are incorporated
in Zimbabwe except for Botswana Milling and
Produce company (Proprietary) limited and Red
Seal Manufacturers (Proprietary) limited which
are incorporated in Botswana. Refer to Directorate
and Administration Section for additional corporate
information.
The Group’s main activities comprise of the milling of flour
and maize, manufacture of stockfeeds, snacks and the
packaging and sale of other general household goods.
The consolidated financial statements of National Foods
Holdings limited for the year ended 30 June 2018 were
authorised for issue in accordance with a resolution of
the Directors on 27 September 2018.
1.1 Statement of compliance
The Group’s financial statements have been prepared
in accordance with International Financial reporting
Standards (IFRS) as issued by the International
Accounting Standards Board (IASB). The consolidated
financial statements have been prepared in compliance
with the Zimbabwe companies Act (chapter 24:03).
1.2 Going concern
The Directors have satisfied themselves that the Group
is in a sound financial position and has adequate
resources to continue in operational existence for the
foreseeable future. Accordingly, they are satisfied that
it is appropriate to adopt the going concern basis in
preparing the consolidated financial statements.
1.3 Basis of Preparation
The consolidated financial statements of the company
have been prepared in accordance with International
Financial Reporting Standards (IFRS) as issued by the
International Accounting Standards Board (IASB). The
consolidated financial statements have been prepared
on a historical cost basis. The consolidated financial
statements are presented in United States Dollars. All
values are rounded to the nearest dollar (US$), except
when otherwise indicated.
1.4 Basis of consolidation
The consolidated financial statements comprise the
financial statements of the company and its subsidiaries
as at 30 June 2018.
control is achieved when the Group is exposed, or has
rights, to variable returns from its involvement with
the investee and has the ability to affect those returns
through its power over the investee. Specifically, the
Group controls an investee if and only if the Group has:
• Power over the investee (i.e. existing rights that give
it the current ability to direct the relevant activities of
the investee)
• Exposure, or rights, to variable returns from its
involvement with the investee, and
• The ability to use its power over the investee to
affect its returns.
When the Group has less than a majority of the voting
or similar rights of an investee, the Group considers all
relevant facts and circumstances in assessing whether it
has power over an investee, including:
• The contractual arrangement with the other vote
holders of the investee
• Rights arising from other contractual arrangements
• The Group’s voting rights and potential voting rights.
The Group re-assesses whether or not it controls an
investee if facts and circumstances indicate that there
are changes to one or more of the three elements
of control. consolidation of a subsidiary begins
when the Group obtains control over the subsidiary
and ceases when the Group loses control of the
subsidiary. Assets, liabilities, income and expenses
of a subsidiary acquired or disposed of during the
year are included in the statement of comprehensive
income from the date the Group gains control until
the date the Group ceases to control the subsidiary.
Profit or loss and each component of other comprehensive
income (OcI) are attributed to the equity holders of the
parent of the Group and to the non-controlling interests,
even if this results in the non-controlling interests having
a deficit balance. When necessary, adjustments are made
to the financial statements of subsidiaries to bring their
accounting policies into line with the Group’s accounting
policies. All intra-group assets and liabilities, equity,
income, expenses and cash flows relating to transactions
between members of the Group are eliminated in full on
consolidation.
A change in the ownership interest of a subsidiary,
without a loss of control, is accounted for as an equity
transaction. If the Group loses control over a subsidiary,
it:
• Derecognises the assets (including goodwill) and
liabilities of the subsidiary
• Derecognises the carrying amount of any non-
controlling interest
• Derecognises the cumulative translation differences
recorded in equity
3635

AnnuAl RepoRt - 2018 NATIONAL FOODS LTD.AnnuAl RepoRt - 2018NATIONAL FOODS LTD.
• Recognises the fair value of the consideration received
• Recognises the fair value of any investment retained
• Recognises any surplus or deficit in profit or loss
• Reclassifies the parent’s share of components previously
recognised in other comprehensive income to profit or
loss or retained earnings, as appropriate.
2. ACCOUNTING POLICIES
2.1 Changes in accounting policy and disclosures
The accounting policies adopted are consistent with those
of the previous financial year except when stated.
2.2 Standards issued but not yet effectivecertain new accounting standards and interpretations
have been issued but are not yet effective and have
not been early adopted by the group. The group
intends to adopt these standards, when they become
effective. The group’s assessment of the impact of these
new standards and interpretations is set out below.
2.2.1 IFRS 9 Financial Instruments
In July 2014, the IASB issued the final version of IFRS
9 Financial Instruments that replaces IAS 39 Financial
Instruments: Recognition and Measurement and all
previous versions of IFRS 9. IFRS 9 brings together all
three aspects of the accounting for financial instruments
project: classification and measurement, impairment and
hedge accounting. IFRS 9 is effective for annual periods
beginning on or after 1 January 2018, with early application
permitted. The Group plans to adopt the new standard on
1 July 2018 and will not restate comparative information.
The Group is performing an impact assessment of the
classification and measurement principles of IFRS 9 as
well as the assessment on the impact of impairment.
Classification and measurement The classification and measurement of financial assets will
depend on how these are managed (the entity’s business
model) and their contractual cash flow characteristics.
These factors determine whether the financial assets
are measured at amortised cost, fair value through other
comprehensive income (‘FVOcI’) or fair value through
profit or loss (‘FVPl’). The combined effect of the
application of the business model and the contractual
cash flow characteristics tests may result in some
differences in the population of financial assets measured
at amortised cost or fair value compared with IAS 39.
Impairment The impairment requirements apply to financial assets
measured at amortised cost and FVOcI (other than
equity instruments), lease receivables, and certain loan
commitments and financial guarantee contracts. At initial
recognition, an impairment allowance (or provision in
the case of commitments and guarantees) is required
for expected credit losses (‘Ecl’) resulting from default
events that are possible within the next 12 months
(’12-month Ecl’). In the event of a significant increase
in credit risk, an allowance (or provision) is required for
Ecl resulting from all possible default events over the
expected life of the financial instrument (‘lifetime Ecl’).
Financial assets where 12-month Ecl is recognised are
in ‘stage 1’; financial assets that are considered to have
experienced a significant increase in credit risk are in
‘stage 2’; and financial assets for which there is objective
evidence of impairment, so are considered to be in
default or otherwise credit impaired, are in ‘stage 3’. The
assessment of credit risk and the estimation of Ecl are
required to be unbiased and probability-weighted and
should incorporate all available information relevant to
the assessment, including information about past events,
current conditions and reasonable and supportable
forecasts of economic conditions at the reporting
date. In addition, the estimation of Ecl should take
into account the time value of money. As a result, the
recognition and measurement of impairment is intended
to be more forward-looking than under IAS 39, and
the resulting impairment charge may be more volatile.
The group expects to apply the simplified approach to
recognise lifetime expected credit losses for its trade
receivables as required by IFRS 9. In general, the directors
anticipate that the application of the expected loss model
for IFRS 9 will result in earlier recognition of credit losses
for the respective items and will increase the amount of
loss allowance recognised for these items.
Transitional impact The requirements of IFRS 9 ‘Financial Instruments’ will
be adopted from 1 July 2018. The classification and
measurement and impairment requirements are applied
retrospectively by adjusting the opening Statement
of Financial Position at the date of initial application,
with no requirement to restate comparative periods.
The Group does not intend to restate comparatives.
The group is still assessing the quantitative impact for
which estimates are based on accounting policies,
assumptions, judgements and estimation techniques
that remain subject to change until the Group finalises
its financial statements for the year ending 30 June 2019.
2.2.2 IFRS 15 Revenue from Contracts with Customers IFRS 15 establishes a single comprehensive model for
entities to use in accounting for revenue arising from
contracts with customers. IFRS 15 will supersede the
current revenue recognition guidance including IAS
18 Revenue, IAS 11 construction contracts and the
related Interpretations when it becomes effective.
The core principle of IFRS 15 is that an entity should
recognise revenue to depict the transfer of promised goods
or services in an amount that reflects the consideration
to which the entity expects to be entitled in exchange
noTes To THe ConsolIDaTeD fInanCIal sTaTemenTs (ConTInueD) noTes To THe ConsolIDaTeD fInanCIal sTaTemenTs (ConTInueD)
for those goods or services. Specifically, the standard
introduces a 5-step approach to revenue recognition:
Step 1: Identify the contract(s) with a customer
Step 2: Identify the performance obligations in the
contract
Step 3: Determine the transaction price
Step 4: Allocate the transaction price to the
performance obligations in the contract
Step 5: Recognise revenue when (or as) the entity
satisfies a performance obligation
Under IFRS 15, an entity recognises when (or as)
a performance obligation is satisfied, i.e when
‘control’ of the goods or service underlying the
performance obligation is transferred to the customer.
Far more prescriptive guidance has been
added in IFRS 15 to deal with specific scenarios.
Furthermore, IFRS 15 requires extensive disclosures.
In April 2016, the IASB issued clarification to IFRS 15 in
relation to the identification of performance obligations,
principal vs agent considerations, as well as licensing
application guidance.
The group recognises revenue from the sale of
merchandise. Apart from providing more extensive
disclosures on the Group’s revenue transactions, the
directors do not anticipate that the application of IFRS
15 will have a significant impact on the financial position
and/or financial performance of the Group.
2.2.3 IFRS 16 LeasesIFRS 16 was issued in January 2016 and it replaces IAS
17 leases, IFRIc 4 Determining whether an Arrangement
contains a lease, SIc-15 Operating leases-Incentives and
SIc27 Evaluating the Substance of Transactions Involving
the legal Form of a lease. IFRS 16 sets out the principles
for the recognition measurement, presentation and
disclosure of leases and requires lessees to account for
all leases under a single on-balance sheet model similar
to the accounting for finance leases under IAS 17.
The standard includes two recognition exemptions
for lessees – leases of ’low-value’ assets (e.g. personal
computers) and shortterm leases (i.e. leases with a lease
term of 12 months or less). At the commencement date
of a lease, a lessee will recognise a liability to make lease
payments (i.e. the lease liability) and an asset representing
the right to use the underlying asset during the lease
term (i.e. the right-of-use asset). lessees will be required
to separately recognise the interest expense on the lease
liability and the depreciation expense on the right-of-
use asset. lessees will be also required to re measure
the lease liability upon the occurrence of certain events
(e.g. a change in the lease term, a change in future lease
payments resulting from a change in an index or rate used
to determine those payments). The lessee will generally
recognise the amount of the remeasurement of the lease
liability as an adjustment to the right-of-use asset. lessor
accounting under IFRS 16 is substantially unchanged from
accounting under IAS 17. lessors will continue to classify
all leases using the same classification principle as in IAS
17 and distinguish between two types of leases: operating
and finance leases. IFRS 16 also requires lessees and
lessors to make more extensive disclosures than under IAS
17. IFRS 16 is effective for annual periods beginning on or
after 1 January 2019. Early application is permitted, but not
before an entity applies IFRS 15. A lessee can choose to
apply the standard using either a full retrospective or a
modified retrospective approach. The standard’s transition
provisions permit certain reliefs. In 2018, the Group will
continue to assess the potential effect of IFRS 16.
2.2.4. IFRIC Interpretation 22 Foreign Currency Transactions and Advance Consideration The Interpretation clarifies that in determining the
spot exchange rate to use on initial recognition of the
related asset, expense or income (or part of it) on the
derecognition of a non-monetary asset or non-monetary
liability relating to advance consideration, the date of
the transaction is the date on which an entity initially
recognizes the non-monetary asset or non-monetary
liability arising from the advance consideration. If there are
multiple payments or receipts in advance, then the entity
must determine the transaction date for each payment or
receipt of advance consideration. Entities may apply the
amendments on a fully retrospective basis. Alternatively,
an entity may apply the Interpretation prospectively to all
assets, expenses and income in its scope that are initially
recognised on or after:
(i) The beginning of the reporting period in which the
entity first applies the interpretation or
(ii) The beginning of a prior reporting period presented
as comparative information in the financial statements of
the reporting period in which the entity first applies the
interpretation.
The Interpretation is effective for annual periods
beginning on or after 1 January 2018. Early application
of interpretation is permitted and must be disclosed.
However, the Group does not expect any effect on its
consolidated financial statements.
2.2.5 IFRIC Interpretation 23 Uncertainty over Income Tax TreatmentThe Interpretation addresses the accounting for income
taxes when tax treatments involve uncertainty that
affects the application of IAS 12 and does not apply to
taxes or levies outside the scope of IAS 12, nor does it
specifically include requirements relating to interest and
penalties associated with uncertain tax treatments. The
Interpretation specifically addresses the following:
• Whether an entity considers uncertain tax treatments
separately
3837

AnnuAl RepoRt - 2018 NATIONAL FOODS LTD.AnnuAl RepoRt - 2018NATIONAL FOODS LTD.
• The assumptions an entity makes about the examination
of tax treatments by taxation authorities
• How an entity determines taxable profit (tax loss), tax
bases, unused tax losses, unused tax credits and tax rates
• How an entity considers changes in facts and
circumstances.
An entity must determine whether to consider each
uncertain tax treatment separately or together with one
or more other uncertain tax treatments. The approach
that better predicts the resolution of the uncertainty
should be followed. The interpretation is effective for
annual reporting periods beginning on or after 1 January
2019, but certain transition reliefs are available. The Group
will apply interpretation from its effective date. The group
is currently assessing the impact of this change on its
consolidated financial statements.
2.3 Summary of Significant Accounting Policies2.3.1 Foreign currency translation The Group’s financial statements are presented in United
States Dollars (US$) (see 2.1), which is the Group’s
functional and presentation currency. Each entity in the
Group determines its own functional currency and items
included in the financial statements of each entity are
measured using that functional currency.
In preparing the financial statements of the individual
entities, transactions in currencies other than the entity’s
functional currency (foreign currencies) are recognised
at the rates of exchange prevailing at the dates of the
transactions. At the end of each reporting period,
monetary items denominated in foreign currencies are
retranslated at the rates prevailing at that date. Non-
monetary items that are measured in terms of historical
cost in a foreign currency are translated using the
exchange rates at the dates of the initial transaction and
are not subsequently retranslated.
Exchange differences arising from translation or
settlement of monetary items are recognised in profit or
loss in the period in which they arise.
For the purpose of presenting consolidated financial
statements, the assets and liabilities of the Group’s foreign
operations are expressed in United States Dollars using
exchange rates prevailing at the end of the reporting
period. Income and expense items are translated at the
average exchange rates for the period, unless exchange
rates fluctuated significantly during that period, in which
case the exchange rates at the dates of the transactions
are used.
Exchange differences arising, if any, are recognised in
other comprehensive income and accumulated in equity
(attributed to non-controlling interests as appropriate).
Upon disinvestment of a foreign entity, translation
differences related to that entity are recycled into profit
or loss.
2.3.2 Taxes 2.3.2.1 Current income tax
current tax assets and liabilities for the current and
prior periods are measured at the amount expected
to be recovered from or paid to the taxation
authorities. The tax rates and tax laws used to
compute the amount are those that are enacted or
substantively enacted by the end of the reporting
period in countries where the Group operates and
generates taxable income.
Current income tax relating to items recognised
directly in other comprehensive income or equity
is recognised in other comprehensive income or
equity and not in profit or loss for the period.
Management periodically evaluates positions taken
in the tax returns with respect to situations in which
applicable tax regulations are subject to interpretation
and establishes provisions where appropriate.
2.3.2.2 Deferred income tax Deferred income tax is provided using the liability
method on all temporary differences at the reporting
date between the tax base of assets or liabilities
and their carrying amounts in the statement of
financial position for financial reporting purposes.
Deferred income tax liabilities are recognised for all
taxable temporary differences, except:
• where the deferred income tax liability arises from
the initial recognition of goodwill or of an asset
or liability in a transaction that is not a business
combination and, at the time of the transaction, affects
neither the accounting profit nor taxable profit or loss; and
• in respect of taxable temporary differences
associated with investments in subsidiaries, associates
and interests in joint ventures, where the timing of
the reversal of the temporary differences can be
controlled and it is probable that the temporary
differences will not reverse in the foreseeable future.
Deferred income tax assets are recognised for all
deductible temporary differences, carry forward of
unused tax credits and unused tax losses, to the
extent that it is probable that taxable profit will be
available against which the deductible temporary
differences, and the carry forward of unused tax
credits and unused tax losses can be utilised except:
• where the deferred income tax asset relating to
the deductible temporary difference arises from
the initial recognition of an asset or liability in a
transaction that is not a business combination and,
at the time of the transaction, affects neither the
accounting profit nor taxable profit or loss; and
• in respect of deductible temporary differences
noTes To THe ConsolIDaTeD fInanCIal sTaTemenTs (ConTInueD)
associated with investments in subsidiaries, associates
and interests in joint ventures, deferred income
tax assets are recognised only to the extent that
it is probable that the temporary differences will
reverse in the foreseeable future and taxable profit
will be available against which the temporary differences
can be utilised.
The carrying amount of deferred income tax assets
is reviewed at the end of each reporting period
and reduced to the extent that it is no longer
probable that sufficient taxable profit will be available
to allow all or part of the deferred income tax asset
to be utilised. Unrecognised deferred income
tax assets are reassessed at the end of each reporting
period and are recognised to the extent that it has
become probable that future taxable profit will
allow the deferred tax asset to be recovered.
Deferred taxation is recognised in profit or loss
except to the extent that it relates to items that are
recognized outside profit or loss (whether in other
comprehensive income or directly in equity), in which
case tax is also recognized outside of profit or loss.
Deferred taxation relating to tax losses carried
forward is recognised to the extent that it is probable
that future taxable profit will be available against
which the unused tax losses can be utilised.
Deferred tax assets and liabilities are measured at
the tax rates that are expected to apply to the year
when the asset is realised or the liability is settled,
based on tax rates (and tax laws) that have been
enacted or substantively enacted at the end of the
reporting period.
Deferred tax assets and deferred income tax
liabilities are offset, only if a legally enforceable right
exists to set off current tax assets against current
income tax liabilities and the deferred income taxes
relate to the same taxable entity and the same taxation
authority.
2.3.2.3 Value Added Tax (VAT) Revenues, expenses and assets are
recognised net of the amount of VAT except:
• Where the VAT incurred on a purchase of assets or
services is not recoverable from the tax authorities,
in which case the VAT is recognised as part of the
cost of acquisition of the asset or as part
of the expense item as applicable; and
• receivables and payables that are stated with
the amount of VAT included. The net amount of
VAT recoverable from, or payable to, the taxation
authority is included as part of receivables or payables
in the statement of financial position.
2.3.3 Non-current assets held for sale and discontinued operations
Non-current assets and disposal groups classified
as held for sale are measured at the lower of their
carrying amounts and fair value less costs to sell.
Non-current assets and disposal groups are classified
as held for sale if their carrying amounts will be
recovered principally through a sale transaction
rather than through continuing use. This condition
is regarded as met only when the sale is highly
probable and the asset or disposal group is available
for immediate sale in its present condition.
Management must be committed to the sale, which
should be expected to qualify for recognition as a
completed sale within one year from the date of classification.
In the consolidated statement of comprehensive
income of the reporting period and the comparable
period of the previous year, income and expenses
from discontinued operations are reported separately
from income and expenses from continuing
operations, down to the level of profit after taxes,
even when the Group retains a non-controlling
interest in the subsidiary after sale. The resulting
profit or loss (after taxes) is reported separately in the
statement of comprehensive income.
Property, plant and equipment and intangible assets
once classified as held for sale are not depreciated or
amortised.
2.3.4 Intangible assetsGoodwill The Group recognises Goodwill acquired through
business combinations at cost, being the excess of
the aggregate of the consideration transferred and
the amount recognised for non-controlling interests
and any previous interest held over the net identifiable
assets acquired and liabilities assumed. The relationship
between the investment in subsidiary and its net book
value is considered in reviewing impairment indicators.
After initial recognition, the intangible assets is carried at
cost less any impairment losses.
2.3.5 Inventories Inventories are stated at the lower of cost and
estimated net realisable value. costs incurred in
bringing each product to its present location and
condition are accounted for as follows:
Raw materials: • Purchase cost on a first in, first out basis
Finished goods and work in progress: • cost of direct materials and labour and a proportion
of manufacturing overheads based on normal operating
capacity but excluding borrowing costs.
noTes To THe ConsolIDaTeD fInanCIal sTaTemenTs (ConTInueD)
4039

AnnuAl RepoRt - 2018 NATIONAL FOODS LTD.AnnuAl RepoRt - 2018NATIONAL FOODS LTD.
Consumable stores• Purchase cost of consumables (machinery spares,
stationery and other sundry items)
Net realisable value is the estimated selling price in the
ordinary course of business, less estimated costs of
completion and the estimated costs necessary to make
the sale.
2.3.6 Leases The determination of whether an arrangement is,
or contains a lease is based on the substance of
the arrangement at inception date of whether the
fulfilment of the arrangement is dependent
on the use of a specific asset or assets or the
arrangement conveying the right to use the asset.
leases are classified as finance leases whenever the
terms of the lease transfer substantially all the risks
and rewards of ownership to the lessee. All other
leases are classified as operating leases.
2.3.6.1 The Group as lessor Rental income from operating leases is recognised
on a straight-line basis over the term of the relevant
lease. Initial direct costs incurred in negotiating
and arranging an operating lease are added to the
carrying amount of the leased asset and recognised on
a straight-line basis over the lease term.
2.3.6.2 The Group as lessee Operating lease payments are recognised as an
expense on a straight-line basis over the lease term,
except where another systematic basis is more
representative of the time pattern in which economic
benefits from the leased asset are consumed.
2.3.7 Provisions Provisions are recognised when the Group has a
present obligation (legal or constructive) as a result
of a past event, it is probable that the Group will be
required to settle the obligation, and a reliable
estimate can be made of the amount of the obligation.
The amount recognised as a provision is the best
estimate of the consideration required to settle
the present obligation at the end of the reporting
period, taking into account the risks and uncertainties
surrounding the obligation. Where a provision is
measured using the cash flows estimated to settle
the present obligation, its carrying amount
is the present value of those cash flows.
When some or all of the economic benefits required
to settle a provision are expected to be recovered
from a third party, a receivable is recognised as
an asset if it is virtually certain that reimbursement will
be received and the amount of the receivable can be
measured reliably.
2.3.8 Retirement benefits Retirement benefits are provided for eligible
Group employees through various independently
administered defined contribution schemes, including
the National Social Security Authority.
contributions to these funds are recognised as an expense
in the period to which employees’ services relate. 2.3.9 Property, plant and equipment All items of property, plant and equipment are
shown at cost less accumulated depreciation and
accumulated impairment losses, if any. Cost includes
expenditures that are directly attributable to the
acquisition of the asset.
land is carried at cost whereas buildings are
carried at cost less accumulated depreciation
and accumulated impairment losses.
The assets’ residual values and useful lives are reviewed,
and adjusted if appropriate, at the end of each reporting
period.
No depreciation is provided on land or capital work-
in-progress. Depreciation commences when the
asset is available for use. Other fixed assets are
depreciated on a straight line basis, at such rates
as are considered appropriate to reduce their book
values to residual values over their estimated useful
lives, as follows:
Buildings 40 years
Plant, machinery and equipment 5 - 20 years
Motor vehicles 5 - 10 years
The assets’ residual values, useful lives and methods of
depreciation are reviewed at the end of each financial
year end and adjusted prospectively if appropriate.
The carrying values of plant and equipment are
reviewed for impairment when events or changes in
circumstances indicate that the carrying value may
not be recoverable in full.
An item of property, plant and equipment is
derecognised upon disposal or when no future
economic benefits are expected from its use or disposal.
Any gain or loss arising on derecognition of the
asset (calculated as the difference between the net
disposal proceeds and the carrying amount of the
asset) is included in profit or loss in the year the asset is
derecognised.
2.3.10 Revenue recognition Revenue is recognised to the extent that it is
probable that the economic benefits will flow to the
Group and the revenue can be reliably measured.
Revenue is measured at the fair value of the
noTes To THe ConsolIDaTeD fInanCIal sTaTemenTs (ConTInueD)
consideration received/receivable net of discounts,
rebates, VAT and other sales taxes or duty. Intra-group
revenue, which arises in the normal course of
business is excluded from revenue. The following
specific recognition criteria must also be met before
revenue is recognised:
2.3.10.1 Sale of goods Revenue from the sale of goods is recognised when
the significant risks and rewards of ownership of
the goods have passed to the buyer, usually on
delivery of the goods when the entity retains neither
continual managerial involvement to the degree usually
associated with ownership nor effective control over
the goods sold. Revenue from the sale of goods is
measured at the fair value of the consideration received
or receivable, net of returns and allowances, trade
discounts and volume rebates.
2.3.10.2 Rental income Rental income arising from operating leases on
properties is accounted for on a straight line basis over
the lease terms.
2.3.10.3 Interest income Interest income is recognised when it is probable
that the economic benefits will flow to the Group
and the amount of revenue can be measured
reliably. Interest income is accrued on a time basis,
by reference to the principal outstanding and at
the effective interest rate applicable, which is the
rate that exactly discounts estimated future cash
receipts through the expected life of the financial
asset to that asset’s net carrying amount on initial
recognition. 2.3.11 Borrowing costs Borrowing costs that are directly attributable to
the acquisition, construction or production of a
qualifying asset shall be capitalised as part of the cost
of that asset. A qualifying asset is an asset that
necessarily takes a substantial period of time to get
ready for its intended use or sale. All other borrowing
costs are recognised in profit or loss in the period
in which they are incurred. Borrowing costs consist
of interest and other costs that an entity incurs in
connection with the borrowing of funds.
2.3.12 Cost of salescost of sales comprises of raw materials, packaging and
consumables used and any other direct handling costs
incurred.
2.3.13 Impairment of non-financial assets The Group assesses at each reporting date whether
there is an indication that an asset may be impaired.
If any such indication exists, or when annual
impairment testing for an asset is required, the
Group makes an estimate of the asset’s recoverable
amount. An asset’s recoverable amount is the higher
of an asset’s or cash-generating unit’s fair value less
costs of disposal and its value in use and is determined
for an individual asset, unless the asset does not
generate cash inflows that are largely independent
of those from other assets or groups of assets.
Where the carrying amount of an asset exceeds its
recoverable amount, the asset is considered impaired
and is written down to its recoverable amount. In
assessing value in use, the estimated future cash
flows are discounted to their present value using a
pre-tax discount rate that reflects current market
assessments of the time value of money and the
risks specific to the asset. In determining fair value less
costs to sell, an appropriate valuation model is used.
Impairment losses of continuing operations are
recognised in profit or loss in those expense categories
consistent with the function of the impaired asset.
An assessment is made at each reporting date as
to whether there is any indication that previously
recognised impairment losses may no longer exist or
may have decreased. If such indication exists, the
Group makes an estimate of recoverable amount. A
previously recognised impairment loss is reversed
only if there has been a change in the estimates
used to determine the asset’s recoverable amount
since the last impairment loss was recognised. If
that is the case the carrying amount of the asset is
increased to its recoverable amount. That increased
amount cannot exceed the carrying amount
that would have been determined, net of depreciation,
had no impairment loss been recognised for the
asset in prior years. Such reversal is recognised
in profit or loss. After the reversal depreciation
charge is adjusted in future periods to allocate the
revised carrying amount, less any residual value, on a
systematic basis over the remaining useful life.
2.3.14 Financial assets The Group’s financial assets include trade and other
accounts receivable,loans receivable, cash and cash
equivalents and other financial instruments.
Financial assets in the scope of IAS 39 are classified as
either loans and receivables or financial assets held to
maturity. When financial assets are recognised initially,
they are measured at fair value. The Group determines the
classification of its financial assets on initial recognition
and, where allowed and appropriate, re-evaluates this
designation at each financial year end.
All regular purchases and sales of financial assets
are recognised on the trade date i.e. the date that
noTes To THe ConsolIDaTeD fInanCIal sTaTemenTs (ConTInueD)
4241

AnnuAl RepoRt - 2018 NATIONAL FOODS LTD.AnnuAl RepoRt - 2018NATIONAL FOODS LTD.
the Group commits to purchase the asset. Regular
purchases or sales are purchases or sales of financial
assets that require delivery of assets within the
period generally established by regulation or
convention in the marketplace.
2.3.14.1 Effective Interest Method The effective interest method is a method of
calculating the amortised cost of a debt instrument
and of allocating interest income over the relevant
period. The effective interest rate is the rate that
exactly discounts estimated future cash receipts
(including all fees on points paid or received that form
an integral part of the effective interest rate,
transaction costs and other premiums or discounts)
through the expected life of the debt instrument, or
(where appropriate) a shorter period, to the
net carrying amount on initial recognition.
Income is recognised on an effective interest basis for
debt instruments.
2.3.14.2 Loans and receivables loans and receivables are financial assets with fixed
or determinable payments that are not quoted
in an active market. Such assets are measured at
fair value on initial recognition, and are subsequently
carried at amortised cost using the effective
interest rate method, less any impairment losses if
any. Gains and losses are recognised in profit or loss
when the loans and receivables are derecognised
or impaired, as well as through the amortisation
process.
2.3.14.3 Held to Maturity Assets Held to maturity assets are non refundable financial
assets with fixed or determinable payments and fixed
maturity dates that’s the entity has the positive intent
and ability to hold to maturity. Subsequent to initial
recognition held to maturity assets are measured at
armotised cost using effective interest method less any
impairment.
2.3.14.4 Financial Assets at fair value through profit or loss
Financial assets at fair value through profit or loss
include financial assets held for trading and financial
assets designated upon initial recognition as at fair value
through profit or loss. Financial assets are classified as
held for trading if they are acquired for the purpose of
selling in the near-term. Derivatives, including separated
embedded derivatives are also classified as held for
trading unless they are designated as effective hedging
instruments or a financial guarantee contract. Financial
assets at fair value through profit or loss are carried
in the statement of financial position at fair value with
changes in fair value recognised in profit or loss.
2.3.14.5 Cash and cash equivalents cash and cash equivalents comprise cash at banks
and in hand and short term deposits with an original
maturity of three months or less. cash and cash
equivalents are classified as loans and receivables and
are initially measured at fair value, and subsequently
measured at amortised cost.
For the purpose of the consolidated statement of cash
flows, cash and cash equivalents consist of cash on
hand and deposits in banks.
2.3.14.6 Impairment of financial assets Financial assets, other than those at FVTPl, are
assessed for indicators of impairment at the end of
each reporting period. Financial assets are considered
to be impaired when there is objective evidence
that, as a result of one or more events that occurred
after the initial recognition of the financial asset,
the estimated future cash flows of the investment have
been affected. Objective evidence of impairment could
include;
• significant financial difficulty of the issuer or
counterparty; or
• default or delinquency in interest or principal
payments; or
• it becoming probable that the borrower will enter
bankruptcy or financial re-organisation.
For financial assets carried at amortised cost, the
amount of the impairment loss recognised is the
difference between the asset’s carrying amount and
the present value of estimated future cash flows, discounted
at the financial asset’s original effective interest rate.
The carrying amount of the financial asset is reduced
by the impairment loss directly for all financial
assets with the exception of trade receivables, where
the carrying amount is reduced through the use
of an allowance account. When a trade receivable
is considered uncollectible, it is written off against
the allowance account. Subsequent recoveries of
amounts previously written off are credited against
the allowance account. changes in the carrying
amount of the allowance account are recognised in
profit or loss.
If, in a subsequent period, the amount of the
impairment loss decreases and the decrease can be
related objectively to an event occurring after the
impairment was recognised, the previously
recognised impairment loss is reversed through profit
or loss to the extent that the carrying amount of
the financial asset at the date the impairment is
reversed does not exceed what the amortised cost
would have been had the impairment not been
recognised.
noTes To THe ConsolIDaTeD fInanCIal sTaTemenTs (ConTInueD)
2.3.14.7 Derecognition of financial assets The Group derecognises a financial asset only
when the contractual rights to the cash flows from
the asset expire, or when it transfers the financial
asset and substantially all the risks and rewards of
ownership of the asset to another entity. If the Group
neither transfers nor retains substantially all the
risks and rewards of ownership and continues to
control the transferred asset, the Group recognises
its retained interest in the asset and an associated
liability for amounts it may have to pay. If the Group
retains substantially all the risks and rewards of
ownership of a transferred financial asset, the Group
continues to recognise the financial asset and also
recognises a collateralised borrowing for the proceeds
received.
2.3.14.8 Classification of financial liabilities The Group’s financial liabilities include trade and other
accounts payable, bank overdraft and interest bearing
loans (which are all classified as loans and borrowings),
are initially measured at fair value including transaction
costs and subsequently amortised cost. Amortised cost
is calculated by taking into account any discount or
premium on acquisition and fees or costs that are an
integral part of the Effective interest rate. The Effective
interest rate amortisation is included as finance costs
in the statement of comprehensive income. Gains or
losses are recognised in profit or loss when the liabilities
are derecognised as well as through the amortisation
process.
2.3.14.9 Derecognition of financial liabilities The Group derecognises financial liabilities when, and
only when, the Group’s obligations are discharged,
cancelled or they expire.
2.3.14.10 Offsetting of financial instruments Financial assets and financial liabilities are offset and the
net amount is reported in the consolidated statement
of financial position if there is a currently enforceable
legal right to offset the recognised amounts and there
is an intention to settle on a net basis, to realise the
assets and settle the liabilities simultaneously.
2.3.14.11 Financial Guarantees Financial guarantee contracts are contracts that require
a payment to be made to reimburse the holder for a
loss it incurs because the specified debtor fails to make
a payment when due in accordance with the terms of
a debt instrument. Financial guarantee contracts are
recognised initially as a liability at fair value, adjusted
for transaction costs that are directly attributable to the
issuance of the guarantee. Subsequently, the liability
is measured at the higher of the best estimate of the
expenditure required to settle the present obligation
at the reporting date and the amount recognised less
cumulative amortisation.
2.3.15 Investment in associate The Group’s Investments in Associates are accounted for
using the equity method of accounting. Associates are
entities in which the Group exercises significant influence
and which are neither subsidiaries nor jointly controlled
operations. Under the equity method investments in
associates are initially carried in the statement of financial
position at cost. Subsequently, the investments in
associates are carried at cost plus post acquisition changes
in the Group’s share of reserves of the associates less
dividends received from the associates. Goodwill relating
to an associate is included in the carrying amount of the
investment. The statement of profit or loss and other
comprehensive income reflects the share of the results
of operations of the associates attributable to the Group.
Where there have been changes recognised directly
in the equity of the associate, the Group recognises
its share of any changes and discloses this, when
applicable, in the statement of changes in equity.
Unrealised gains and losses resulting from transactions
between the Group and the associate are eliminated
to the extent of the interest in the associate.
The financial statements of the associate are prepared for
the same reporting period as the parent company. Where
necessary, adjustments are made to bring the accounting
policies in line with those of the Group. After application
of the equity method, the Group determines whether it
is necessary to recognise an additional impairment loss
on the Group ‘s investment in its associate. The Group
determines at each reporting date whether there is any
objective evidence that the investment in the associate
is impaired. If this is the case the Group calculates the
amount of impairment as the difference between the
recoverable amount of the associate and its carrying
value and recognises the amount in profit or loss.
In the separate company financial statements, investments
in associates are also accounted for using the equity
method of accounting as the company opted for the early
adoption of Amendments to IAS 27 - Equity Method in
Separate Financial Statements issued on 12 August 2014.
Upon loss of significant influence over the associate, the
Group measures and recognises any retaining investment
at its fair value. Any difference between the carrying
amount of the associate upon the loss of significant
influence, and the fair value of the retaining investment
and the proceeds from the disposal is recognised in profit
or loss.
The following are the critical estimates that the directors
have made in the process of applying the entity’s
accounting policies and that have the most significant
effect on the amounts recognised in the consolidated
financial statements.
noTes To THe ConsolIDaTeD fInanCIal sTaTemenTs (ConTInueD)
4443
AnnuAl RepoRt - 2018NATIONAL FOODS LTD.
3. KEY ESTIMATES, UNCERTAINTIES AND JUDGEMENTS
3.1 Useful lives and residual values of property, plant and equipment The Group assesses useful lives and residual values
of property, plant and equipment each year taking
into consideration past experience, technology
changes and the local operating environment.
The useful lives are set out in note 2.3.9 and no
changes to those useful lives have been considered
necessary during the year. Residual values will
be reassessed each year and adjustments for
depreciation will be done in future periods if there is
indication of impairment in value. The carrying amount
of the Group’s property, plant and equipment is
US$44,122,607 (June 2017: US$45,682,101)
3.2 Provision for impairment of receivables Provision for impairment of receivables is a specific
provision made for trade and other receivables which
is reviewed on a monthly basis. In determining the
recoverability of a trade receivable the Group
considers any change in the credit quality of the
trade receivable from the date the credit was initially
granted up to the end of the reporting period as well
as the value of security held over that receivable. The
carrying amount of the Group’s provision for credit
losses as at 30 June 2018 was US$4,272,673 (June 2017:
US$3,976,132).
3.3 Provision for Obsolete stock The provision is mainly recognized for obsolete or
unsellable goods and is reviewed on a regular basis. In
determining the provision, the Group evaluates criteria
such as inventory in excess of forecasted demand, product
introductions, as well as changes in manufacturing
strategies. Appropriate provisions are then made to
reflect the risk of obsolescence.
3.4 Inventory3.4.1 Inventory Management ProcessThe Group’s main operations are milling of flour and
maize and the manufacture of stockfeed. This processes
involves procurement and storage of large quantities
of raw materials and finished goods mainly in the form
of wheat and maize stored in silos in various locations
across Zimbabwe. The determination of quantities in
silos is subject to an estimation process and involves silo
bleeding and calibration of silo scales. Management
constantly evaluates and improves the inventory
management process to ensure that there are adequate
controls that safeguard the existence, measurement and
accuracy of raw materials and finished goods.
3.4.2 Inventory valuationThe group’s determination of certain inventories on hand
relating to raw materials is based on extensive validation
and review of inputs and estimation processes in line with
the continuous change in market dynamics. The group
has in place models from which large pieces of data are
derived including operating and accounting computer
systems. The allocation of costs is based on operating
capacity, historical trends and unique production models.
noTes To THe ConsolIDaTeD fInanCIal sTaTemenTs (ConTInueD)
45

AnnuAl RepoRt - 2018 NATIONAL FOODS LTD.AnnuAl RepoRt - 2018NATIONAL FOODS LTD.
noTes To THe ConsolIDaTeD fInanCIal sTaTemenTs (ConTInueD)
2018 2017
US$ US$
4. REVENUE
The following is an analysis of the Group's revenue for the year
Revenue from the sale of goods 297,231,216 288,969,124
Revenue from rental income 698,282 539,044
297,929,498 289,508,168
5. PROFIT BEFORE TAX
Profit before tax is arrived at after taking into account the following:
5.1 Other income
Profit / (loss) on disposal of property, plant and equipment 48,478 (39,485)
Profit on disposal of assets held for sale - 25,617
Export incentives 82,449 -
Toll, handling and other services rendered 169,396 744,675
Re-measurement gain on disposal of listed investments 586,640 -
Fair value adjustments - (38,872)
Sale of scrap 62,238 14,345
Insurance and bad debt recoveries 43,851 38,859
993,052 745,234
5.2 After charging/(crediting) the following
Employee benefits expenses
-Salaries and wages 15,250,764 16,697,034
-Post Employment benefits: Defined contribution plan 743,843 833,154
-Voluntary retrenchment packages 479,034 -
Administrative expenses
-Repairs and maintenance 2,168,134 2,056,815
-Electricity and water 2,918,847 2,946,733
-Technical fees (management fees) 780,000 646,665
-Technical fees (other) 150,677 186,551
-Audit fees and expenses 252,365 454,810
-Net foreign exchange losses 800,319 2,476,879
-credit losses expense 479,383 471,606
-Operating lease charges 367,568 309,257
5.3 Depreciation
Buildings 591,026 566,747
Plant, machinery and equipment 1,821,001 2,133,353
Motor vehicles 254,904 186,752
2,666,931 2,886,852
5.4 Net interest expense
Interest income 149,512 458,011
Interest income from banks 12,001 245,230
Interest from financial assets 101,443 47,368
Interest income from trade and other receivables 36,068 165,413
Interest expense on bank overdrafts and other short term borrowings (3,601,787) (1,559,706)
(3,452,275) (1,101,695)
noTes To THe ConsolIDaTeD fInanCIal sTaTemenTs (ConTInueD)
2018 2017
US$ US$
6. TAXATION
6.1 Income tax recognised in profit or loss
Income tax
- On current profits at normal rates 3,657,013 3,713,958
- capital gains tax - 3,552
Deferred tax relating to current temporary differences (note 6.4) 378,860 (193,160)
Deferred tax relating to disposed assets held for sale - (2,506)
4,035,873 3,521,844
6.2 Reconciliation of income tax charge:
Profit before tax 21,211,077 17,226,467
Income tax computed at 25.75% 5,461,852 4,435,815
Non-deductible expenses for tax purposes 75,735 163,939
Equity accounted earnings (1,337,954) (471,604)
Effects of different tax rates of subsidiaries 966 (6,659)
Effect of income taxed at different tax rates (387) (264)
Effects of profit on disposed listed investments (151,060) -
Other reconciling items (13,279) (599,383)
4,035,873 3,521,844
Non-deductible expenses are mainly motor vehicle lease premiums and capital legal fees.
Other reconciling items include local and foreign bank interest received.
6.3 Current tax liabilities
Opening Balance (89,629) 31,911
charge to profit or loss 3,657,013 3,717,510
Paid (4,318,279) (3,839,050)
Closing Balance (750,895) (89,629)
6.4 Deferred tax liability
At beginning of the year 7,987,464 8,180,624
Deferred tax relating to current temporary differences (note 6.1) 378,860 (193,160)
Reclassification of deferred tax relating to assets held for sale (164,785) -
At end of the year 8,201,539 7,987,464
Analysis of deferred tax liability
Property, plant and equipment 9,272,220 8,997,639
Prepayments - 26,932
Unrealised exchange (losses)/gains (21,354) 2,192
Allowance for credit losses (1,100,213) (1,001,498)
Other 50,886 (37,801)
8,201,539 7,987,464
7. EARNINGS PER SHARE
Basic earnings per share amounts are calculated by dividing the net profit for the year attributable to ordinary equity holders of the parent by the weighted average number of ordinary shares outstanding during the year.
Headline earnings per share amounts are calculated by dividing the headline profit for the year attributable to ordinary equity hold-ers of the parent by the weighted average number of ordinary shares outstanding during the year.
The following reflects the income and share data used in the earnings per share computations:
4847

AnnuAl RepoRt - 2018 NATIONAL FOODS LTD.AnnuAl RepoRt - 2018NATIONAL FOODS LTD.
2018 2017
US$ US$
7.1 Weighted average number of shares in issue
Weighted average shares in issue for basic, diluted and headline earnings per share 68,400,108 68,400,108
7.2 Profit for the year
Net profit attributable to equity holders of the parent 17,175,204 13,704,623
There have been no other transactions involving ordinary shares or potential ordinary shares between the reporting date and the date of completion of these financial statements.
7.3 Headline earnings
Reconciliation between profit for the year and headline earnings
Net profit attributable to ordinary equity holders of the parent 17,175,204 13,704,623
(Profit) / loss on disposal of property, plant and equipment (48,478) 39,390
Tax effect of adjustment 4,796 -
(Profit) / loss on disposal of assets held for sale - (25,617)
Headline earnings 17,131,522 13,718,396
Basic and diluted earnings per share (cents) 25.11 20.04
Headline earnings per share (cents) 25.05 20.06
noTes To THe ConsolIDaTeD fInanCIal sTaTemenTs (ConTInueD)
8. PROPERTY, PLANT AND EQUIPMENT Land & Buildings
Plant, machinery &
equipment
Motor vehicles
Capital Work in progress
Total
US$ US$ US$ US$ US$
At 30 June 2018
Cost
At the beginning of the year 29,256,116 29,056,917 2,313,789 2,531,871 63,158,693
Additions 781,541 1,688,154 473,320 1,470,684 4,413,699
Disposals - (6,611) (87,866) - (94,477)
Re-classified to Assets-Held for sale (3,932,303) - - - (3,932,303)
Exchange differences (689) - - - (689)
capital WIP - - - 30,873 30,873
At end of the year 26,104,665 30,738,460 2,699,243 4,033,428 63,575,796
Depreciation
At beginning of year (4,777,506) (10,986,165) (1,712,921) - (17,476,592)
charge for the year (591,026) (1,821,001) (254,904) - (2,666,931)
Disposals - 6,611 46,549 - 53,160
Re-classified to Assets-Held for sale 637,174 - - - 637,174
At end of the year (4,731,358) (12,800,555) (1,921,276) - (19,453,189)
Carrying amount 21,373,307 17,937,905 777,967 4,033,428 44,122,607
noTes To THe ConsolIDaTeD fInanCIal sTaTemenTs (ConTInueD)
Land & Buildings
Plant, machinery &
equipment
Motor vehicles
Capital Work in progress
Total
US$ US$ US$ US$ US$
At 30 June 2017
Cost
At the beginning of the year 28,036,776 28,431,710 2,382,348 1,583,049 60,433,883
Additions 1,217,128 1,681,911 16,639 948,822 3,864,500
Disposals - (1,056,704) (85,198) - (1,141,902)
Exchange differences 2,212 - - - 2,212
At end of the year 29,256,116 29,056,917 2,313,789 2,531,871 63,158,693
Depreciation
At beginning of year (4,210,759) (8,982,265) (1,596,834) - (14,789,858)
charge for the year (566,747) (2,133,353) (186,752) - (2,886,852)
Disposals - 129,453 70,665 - 200,118
At end of the year (4,777,506) (10,986,165) (1,712,921) - (17,476,592)
Carrying amount 24,478,610 18,070,752 600,868 2,531,871 45,682,101
NFl currently has an idle plant in the form of the Mutare maize mill. However it has been demonstrated in prior years that the total NBV of this plant is negligible and should the need arise, this plant can be successfully resuscitated.
8.1 None of the asset categories above had been pledged to secure borrowings of the Group in the current year (2017: Nil).
9. ASSETS HELD FOR SALE
The Group intends to dispose of properties which are non-core to the business within the next six months. These properties will be disposed to a new company in which National Foods Holdings limited will retain a non-controlling interest through its wholly owned subsidiary, National Foods Properties limited for a consideration of $3,705,000. As such the relevant properties have been reclassified as assets held for sale.
2018 2017
US$ US$
Land & Buildings
At beginning of year 107,313 157,431
Re-classified from Property, plant and equipment 3,295,134 -
Disposals - (50,118)
At end of year 3,402,447 107,313
Deferred tax relating to assets held for sale
At beginning of year (5,366) (7,872)
Re-classified from Property, plant and equipment (164,785) -
Disposals - 2,506
At end of year (170,151) (5,366)
Total 3,232,296 101,947
5049

AnnuAl RepoRt - 2018 NATIONAL FOODS LTD.AnnuAl RepoRt - 2018NATIONAL FOODS LTD.
10. Intangible Assets2018 2017
US$ US$
Net carrying amount at the beginning of the year 1,516,422 1,516,422
Arising from acquisition of Breathaway Food caterers - -
Net carrying amount at the end of the year 1,516,422 1,516,422
Gross carrying amount 1,516,422 1,516,422
Accumulated amortisation and impairment losses - -
10.1 Impairment of Goodwill
The Group performed its annual impairment test as at 30 June 2018. Goodwill acquired through business combinations has been allocated to a Snacks & Treats unit. The recoverable amount of the cash generating units has been determined using value in use. The Group considers the relationship between the investment in subsidiary and its net book value among other factors, when reviewing for indicators of impairment. As a result of this analysis, no impairment of goodwill was recorded.
Key Assumptions used in value in use calculations and sensitivity to changes in assumptions
The calculation of value in use is most sensitive to the discount rates.
Discount rates
Discount rates represent the current market assessment of the risks specific to the asset/ cash generating units, taking into consideration the time value of money and the individual risks of the underlying assets that have not been incorporated in the cash flow estimates. The discount rate calculation is based on the specific circumstances of the Group and is derived from its weighted average cost of capital (WAcc). The WAcc takes into account both debt and equity. The cost of debt is based on the interest- bearing borrowings the Group is obliged to service. Adjustments to the discount rate are made to factor in the specific amount and timing of the future tax flows in order to reflect a pre tax discount rate.
Future cash flows have been projected for 5 years, with a growth rate of 0% used to project cash flows beyond period the 5 year period.
11. Investment in associate
The Group has the following investments:
11. 1 National Foods Logistics
The Group acquired a 50% interest in National Foods logistics as a partnership with Equity Distribution (Pvt) ltd, formerly National Foods’ outsource distribution service provider on 1 April 2018. National Foods logistics is a private entity that is not listed on any public exchange and will be responsible for the distribution of National Foods’ product to the market. The Group's interest is accounted for using the equity method in the consolidated financial statements.
11.1.1 Net assets acquired at acquisition date.National Foods logistics had nil assets as at the acquisition date. A cash consideration of US$750,000 was paid by the Group for a 50% stake in the associate.
11.1.2 Summarised financial information of associateThe following table illustrates the summarised financial information of National Foods logistic’s financial statements :
Year Ended 30 June 2018
Year Ended 30 June 2017
Income Statement US$ US$
Revenue 2,213,729 -
Profit after tax 75,000 -
Group’s share of profit - 50% 37,500 -
noTes To THe ConsolIDaTeD fInanCIal sTaTemenTs (ConTInueD)
Statement of Financial Position2018 2017
US$ US$
Non current assets 791,806 -
Current assets 4,244,457 -
Non current liabilities (2,001,701) -
current liablities (1,459,562) -
Equity 1,575,000 -
Group’s share of equity - 50% 787,500 -
Group’s carrying amount of investment 787,500 -
11.2 Pure Oil Industries
The Group has a 40% interest in Pure Oil Industries which is involved in the manufacturing of cooking oil and soap. Pure Oil is a private entity that is not listed on any public exchange and has a 31 March year end. The Group’s interest in Pure Oil is accounted for using the equiy method in the consolidated financial statements. Pure Oil is incorporated in Zimbabwe and its principal place of business is in Harare, Zimbabwe.
11.2.1 Summarised financial information of associate company
The following table illustrates the summarised financial information of Pure Oil's financial statements :
Income StatementYear ended 30
June 2018US$
Year ended 30 June 2017
US$
Revenue 107,345,175 110,821,220
Profit after tax 12,896,095 4,578,678
Group’s share of profit - 40% 5,158,438 1,831,471
Statement of Financial Position2018 2017
US$ US$
Non current assets 20,666,787 19,070,729
Current assets 31,808,036 18,607,782
Non current liabilities (3,611,249) (11,585,535)
current liablities (24,252,802) (14,378,298)
Equity 24,610,772 11,714,678
Group’s share of equity - 40% 9,844,309 4,685,871
Group’s carrying amount of investment 9,844,309 4,685,871
11.3 Reconciliation of movements in associates
Balance at the beginning of the year 4,685,871 2,854,400
Purchase at cost 750,000 -
Equity accounted earnings - Pure Oil 5,158,438 1,831,471
Equity accounted earnings - National Foods logistics 37,500 -
Balance at the end of the year 10,631,809 4,685,871
12. OTHER FINANCIAL ASSETS AND LIABILITIES
12.1 Other financial assets
Other non-current financial assets comprise of an investment in shares, debenture and loans receivable. The movement for the year is as follows:
noTes To THe ConsolIDaTeD fInanCIal sTaTemenTs (ConTInueD)
5251

AnnuAl RepoRt - 2018 NATIONAL FOODS LTD.AnnuAl RepoRt - 2018NATIONAL FOODS LTD.
Listed Investments 2018US$
2017US$
Opening Balance 343,268 -
Purchase of listed investments - 382,140
Fair value adjustments on listed investments - (38,872)
Re-measurement gain on disposal 586,640 -
Disposal of listed shares (929,908) -
closing balance - 343,268
2018US$
2017US$
Debenture and Loan Receivable
Opening Balance 1,051,820 115,921
loan receivable 1,956,382 888,531
Interest income 101,444 47,368
Debenture repayment (121,946) -
closing balance 2,987,700 1,051,820
Grand Total 2,987,700 1,395,088
The opening balance comprises of a 5% Debenture redeemable in 2018 and Depot loan Receivable
Increase in loan receivable relates to loan issued to National Foods logistics (2017: Gain, cash and carry)
The carrying amount of the financial assets approximates fair value.
listed investments are classified at Fair Value through Profit and loss
The debenture is classified as a Held to Maturity investment and the loan as loans and Receivables.
The loan given to Gain was for the purchase of immovable properties.
The interest rates attached to the debenture, Gain and National logistics loan receivables are disclosed below:
Rate of Interest Year Repayable
Gain loan receivable 988,933 6.98% 2021
National Foods logistics loan receivable 1,985,575 8.00% 2019
Debenture 13,192 5.00% 2018
12.1.1 Fair value of financial instruments
The carrying amounts of financial instruments as disclosed in the statement of financial position approximate their fair values.
The Group uses the following hierarchy for determining and disclosing the fair value of financial assets : level 1: quoted (unadjusted ) prices in active markets for identical assets or liabilities.level 2: other techniques for which all inputs which have a significant effect on the recorded fair value are observable either directly or indirectly.level 3: techniques which use inputs which have a significant effect on the recorded fair value that are not based on observable market data.
Level 1 Level 2 Level 3 Total
USD USD USD USD
30 June 2018
Debenture - 13,192 - 13,192
loan Receivable - 2,974,508 - 2,974,508
- 2,987,700 - 2,987,700
30 June 2017
listed investments 343,268 - 343,268
Debenture - 163,289 - 163,289
loan Receivable - 888,531 - 888,531
343,268 1,051,820 - 1,395,088
There were no transfers between levels.
noTes To THe ConsolIDaTeD fInanCIal sTaTemenTs (ConTInueD)
Valuation Technique- Loans and Receivables
Valuation TechniqueProjection of cash flows discounted at a market related interest rate.
Observable inputsi. Quoted prices for similar assets in an active market ii. Interest rates for similar assets in an active market
12.2 Other financial liabilities
12.2.1 Short term financing
Unsecured borrowings6.00%
(2017:7.00%)On demand 30,261,638 10,836,474
Total borrowings 30,261,638 10,836,474
Bank overdrafts6.50%
(2017:7.00%)On demand 159,728 19,829,174
Total other financial liabilities 30,421,366 30,665,648
12.2.2 Interest bearing borrowings movement
Opening balance 30,665,648 7,244,936
Drawdowns - continuing and discontinuing operations 13,789,526 24,616,961
Repayments - continuing and discontinuing operations (14,033,808) (1,196,249)
closing balance 30,421,366 30,665,648
12.2.3 Banking facilities
Total facilities available to the Group 85,010,983 34,336,474
Facilities utilised at year end (30,421,366) (30,665,648)
Unutilised borrowing capacity 54,589,617 3,670,826
Short term borrowings form part of the borrowings of the Group and are renewed on maturity in terms of on-going facilities negotiated with the relevant financial institutions. The facilities expire at different dates during the year and will be reviewed and renewed when they mature. Bank Overdrafts are secured by a cession of movable assets, receivables and inventory worth $6,500,000 (2017: US$13,500,00). The facilities can only be used for working capital purposes.
12.2.4 Borrowing powers
In terms of the Articles of Association, the borrowing powers of the company and its subsidiaries (excluding inter-company borrowings) are limited in aggregate to the nominal amount of the share capital of the company plus the total free reserves of the company and its subsidiaries. The level of borrowings throughout the year was adequately covered in this respect.
noTes To THe ConsolIDaTeD fInanCIal sTaTemenTs (ConTInueD)
5453

AnnuAl RepoRt - 2018 NATIONAL FOODS LTD.AnnuAl RepoRt - 2018NATIONAL FOODS LTD.
13. INVENTORIES2018 2017
US$ US$
Raw materials 28,578,371 28,992,245
Finished goods 8,107,530 10,988,164
consumable stores 5,060,978 4,488,956
41,746,879 44,469,365
The amount of inventory recognised as an expense is US$227,796,351 (2016: US$221,386,955) The amount of inventory write down recognised as an expense is US$9,511 (2017: US$101,483) The increase in the allowance for credit losses is US$235,940 (2017: US$0)
Inventories have been pledged to secure borrowing facilities of the Group. Refer to note 12.2.3.
14. TRADE AND OTHER RECEIVABLES 2018 2017
Trade receivables 38,198,041 38,878,630
Allowance for credit losses (4,272,673) (3,919,333)
Net trade receivables 33,925,368 34,959,297
Prepayments 23,547,427 15,111,526
Other receivables 5,043,097 1,483,301
Allowance for credit losses - (56,799)
62,515,892 51,497,325
Trade and other receivables have been pledged to secure borrowing facilities of the Group. Refer to note 12.2.3.
14.1 Trade receivables
Trade receivables disclosed above are classified as loans and receivables and are therefore measured at amortised cost.
The average credit period on sales of goods is 30 days. The Group has recognised an allowance for credit losses on specific debtors where indications are that these will not be recoverable. No general provision is recognised.
Before accepting a new customer the Group uses a credit scoring system to assess the potential customer's credit quality and defines credit limits by customer. limits and scoring are revised on an on going basis. Of the trade receivables balance at the end of the year US$ 29,366,175 (2017: US$ 27,649,894) is due from the Group's top ten customers, representing 87% (2017 : 71%) of the total balance of trade receivables.
14.2 Past due but not impaired
Trade receivables disclosed above include amounts that were past due at the end of the reporting period but against which the Group has not recognised an allowance for doubtful receivables because there has not been a significant change of the credit quality and thus the amounts are still considered recoverable.
2018 2017
US$ US$
Ageing of past due but not impaired
31 - 60 days 7,449,088 9,028,287
61 - 90 days 1,736,313 716,316
Over 90 days 3,161,409 7,666,482
Total 12,346,810 17,411,085
Average age (days) 76 92
14.3 Movement in the provision for impairment of receivables
Balance at the beginning of the year (3,976,132) (3,723,298)
Current year provisions (479,383) (471,606)
Utilised during the year 182,842 218,772
Balance at year end (4,272,673) (3,976,132)
noTes To THe ConsolIDaTeD fInanCIal sTaTemenTs (ConTInueD) noTes To THe ConsolIDaTeD fInanCIal sTaTemenTs (ConTInueD)
In determining the recoverability of a trade receivable, the Group considers any change in credit quality of the trade receivable from the date the credit was initially granted up to the end of the reporting period as well as the value of security held over the receivable. The risk of concentration of credit is limited as the Group constantly monitors the credit quality of top customers and maintains adequate security to cover the exposure.
14.4 Ageing of impaired trade and other receivables
2018 2017
US$ US$
0-30 days 48,449 -
31 - 60 days 49,507 36,850
61 - 90 days 27,977 50,020
Over 90 days 4,146,740 3,889,262
Total 4,272,673 3,976,132
Average age on impaired trade and other receivables (days) 523 501
14.5 Amounts due from Related Parties
Included in trade and other receivables are amounts due from related parties as disclosed under Note 26.4
15. ISSUED CAPITAL AND RESERVES
15.1 Issued capital
Authorised
73 000 000 ordinary shares of US 1 cent each 730,000 730,000
Issued and fully paid
68 400 108 ordinary shares (2017: 68 400 108) of US 1 cent each 684,001 684,001
Unissued shares
4 599 892 (2017: 4 599 892) ordinary shares of US 1 cent each 45,999 45,999
The unissued shares are under the control of the Directors for an indefinite period and are subject to the limitations of the companies Act (chapter 24:03) and the Zimbabwe Stock Exchange regulations.
15.2 Directors' shareholdings
At 30 June 2018, the Directors held directly or indirectly the following shares in the company:
2018 2017
Number of shares
Number of shares
M. lashbrook 13,231 56,231
15.3 Non-distributable reserves
Opening balance (9,938) (12,150)
Exchange differences on translation of foreign operation (690) 2,212
closing balance (10,628) (9,938)
Non-distributable reserves are as a result exchange differences on the translation of the financial results of subsidiaries with a different functional currency.
5655

AnnuAl RepoRt - 2018 NATIONAL FOODS LTD.AnnuAl RepoRt - 2018NATIONAL FOODS LTD.
2018 2017
US$ US$
15.4 Distributable reserves
Opening balance 94,263,037 87,685,707
Profit for the year 17,175,204 13,704,623
Dividend declared (8,276,416) (7,127,293)
closing balance 103,161,825 94,263,037
Retained in:
Holding company 24,683,808 24,683,808
Subsidiary companies 70,996,208 67,293,358
Associate companies 7,481,809 2,285,871
103,161,825 94,263,037
16. DIVIDEND
Declared and paid during the year:
Final dividend for 2017: US 5.21 cents per share (2016: US 5.61 cents per share) 3,563,649 3,837,246
Interim dividend for 2018: US 6.89 cents per share (2017: US 4.81 cents per share) 4,712,767 3,290,047
Total dividends declared and or paid 8,276,416 7,127,293
Increase in shareholders for dividends included in current liabilties (2,789,852) (2,525,725)
Total dividends paid 5,486,564 4,601,568
Proposed and approved (not recognised as a liability at 30 June 2018)
Final dividend for 2018: US 5.66 cents per share (2017: US 5.61 cents per share) 3,871,446 3,837,248
The shareholders for dividends balance relates to the dividends payable to foreign shareholders which were outstanding at reporting date. Shareholders for dividends as at 30 June 2018: US$5,315,577 (2017: US$2,525,725)
17. TRADE AND OTHER PAYABLES
Trade payables 47,281,593 12,198,814
Other payables 5,505,215 4,405,041
52,786,808 16,603,855
Other payables comprises of accruals and income received in advance
Terms and conditions of the above financial liabilities
Trade payables are non-interest bearing and are normally settled within a 30 - 60 day term.
Other payables are non-interest bearing and terms range between 30 and 90 days.
18. PROVISIONS
Leave pay provision
At beginning of the year 400,898 538,178
created during the year 98,991 107,278
Utilised during the year (152,648) (244,558)
At end of the year 347,241 400,898
Leave pay This is calculated on the basis of leave days accumulated at an expected rate of payment.
noTes To THe ConsolIDaTeD fInanCIal sTaTemenTs (ConTInueD) noTes To THe ConsolIDaTeD fInanCIal sTaTemenTs (ConTInueD)
2018 2017
US$ US$
19. CASH FLOW INFORMATION
19.1 Cash generated from operations
Profit before tax 21,211,077 17,226,467
Interest income (149,512) (458,011)
Interest expense 3,601,787 1,559,706
Depreciation (Note 8) 2,666,931 2,886,852
Inventory write-down (Note 13) 9,511 101,483
Allowance for obsolete inventory 235,940 -
Allowance for credit losses (Note 14.3) 479,383 471,606
Unrealised foreign exchange (gain) / loss (82,530) 78,380
Provision for leave pay (Note 18) 98,991 107,278
(Profit) / loss on disposal of property, plant and equipment (48,478) 39,390
Fair value adjustment on listed investments - 38,872
Re-measurement gain on disposal of listed investments (586,640) -
Profit on disposal of assets held for sale - (25,617)
Equity accounted earnings (5,195,938) (1,831,471)
22,240,522 20,194,935
19.2 Working capital changes
Decrease in inventories 2,477,035 4,470,883
(Increase) in accounts receivable (11,497,951) (20,550,960)
Increase / (Decrease) in accounts payable 36,112,835 (19,272,181)
27,091,919 (35,352,258)
19.3 Income tax paid
charge to profit or loss (4,035,873) (3,521,844)
Movement in tax liability (661,266) (121,540)
Movement in deferred tax liability 378,860 (195,666)
(4,318,279) (3,839,050)
19.4 Cash and cash equivalents at end of year
cash at bank 33,208,848 3,582,611
cash on hand 194,381 100,331
33,403,229 3,682,942
cash and cash equivalents consist of cash on hand, balances with banks and loans receivable. cash at bank accrues interest at floating rates based on daily bank deposit rates.
5857

AnnuAl RepoRt - 2018 NATIONAL FOODS LTD.
20. COMMITMENTS AND CONTINGENCIES
20.1 Operating lease commitments - Group as lessee
The Group entered into commercial leases on certain motor vehicles in 2018. The leases had a life of 3 years. There were no restrictions placed upon the Group by entering into these leases.
Future minimum rentals payable under non-cancellable operating leases as at 30 June 2018 were as follows:
2018 2017
US$ US$
Within one year 282,550 -
After one year but no more than 5 years 447,371 -
729,921 -
20.2 Operating lease commitments - Group as lessorThe Group receives monthly rental income from cancellable operating leases (note 23.1)
20.3 Capital expenditure commitments
Authorised and contracted for 9,898,000 -
Authorised but not contracted for 4,822,000 7,234,000
14,720,000 7,234,000
The capital expenditure is to be financed out of the Group's own resources and existing borrowing facilities.
21. PENSION SCHEMES
All eligible employees are members of the following Group schemes which are independently administered:
21.1 National Foods Pension Fund
This is a defined contribution fund, administered by an insurance company which covers eligible employees. contributions are at the rate of 17.5% of pensionable emoluments of which members pay 7%.
21.2 National Social Security Authority Scheme
This is a defined contribution scheme established under the National Social Security Authority Act (1989). contributions by employees are 3.5% per month of pensionable monthly emoluments, up to a maximum of $700 per month.
21.3 Pension costs recognised as an expense2018 2017
US$ US$
Defined contribution fund 596,079 664,623
National Social Security Authority Scheme 147,764 168,531
743,843 833,154
noTes To THe ConsolIDaTeD fInanCIal sTaTemenTs (ConTInueD)
60
455
7

AnnuAl RepoRt - 2018 NATIONAL FOODS LTD.AnnuAl RepoRt - 2018NATIONAL FOODS LTD.
22. FINANCIAL RISK MANAGEMENT OBJECTIVES AND POLICIES
22.1 Capital Management
The objective of the group is to ensure that the Group companies maintain healthy capital ratios in order to support the business and maximise shareholder value. The group is not subject to any externally imposed capital requirements. The Group manages its capital structure and makes adjustments to it in light of changes in the economic environment. To maintain or adjust the capital structure the Group may adjust the dividend payment to shareholders, return capital to shareholders or issue new shares. No changes were made to the objectives, policies or processes during the years ended 30 June 2018 and 30 June 2017.
The Group monitors capital using a gearing ratio, which is debt divided by the sum of total equity and debt. The target ratio is a debt equity ratio that is no higher than 30%
2018 2017
US$ US$
Interest bearing borrowings 30,421,366 30,665,648
less cash and cash equivalents (33,403,229) (3,682,942)
Net Debt (2,981,863) 26,982,706
Total Equity 103,835,198 94,937,100
Gearing ratio 22.7% 24.4%
22.2 Financial risk management
22.2.1 Treasury risk: A treasury management policy is in place to maximise returns on available surplus funds which are controlled by management.
22.2.2 Credit risk: Financial assets of the Group which are subject to credit risk consist mainly of cash resources and trade and other receivables. cash resources are placed with various approved financial institutions subject to approved limits. All these institutions are of a high standing. The Group’s maximum exposure to credit risk on cash resources as at 30 June 2018 and 2017 is the carrying amount as outlined in note 19.4.
Accounts receivable are disclosed net of allowances for credit losses. The management of credit risk of trade receivables is performed at an operational level through credit evaluations and collateral secured where necessary. collateral is in the form of bank guarantees and title deeds, with a value of US$6,500,000 (2017: US$13,500,000). With regards to the credit quality of financial assets that are neither past due nor impaired, the credit quality of a customer is assessed based on an extensive credit rating and individual credit limits are defined in accordance with this assessment. The Group's maximum exposure to credit risk on trade and other receivables as at 30 June 2018 and 2017 is the carrying amount as outlined in note 14.
22.2.3 Interest risk: Group policy is to adopt a non-speculative approach to manage interest rate risk whilst maximising profit. Funding instruments are at variable interest rates and mature within one year.
The following table demonstrates the profit before tax sensitivity to a reasonable possible change in interest rates on bank borrowings.
2018 2017
US$ US$
Effect on profit before tax
Increase of 3% (546,911) (130,094)
Decrease of 3% 546,911 130,094
22.2.4 Liquidity risk: The Group manages liquidity risk by maintaining adequate reserves, banking facilities and reserve borrowing facilities, by continuously monitoring forecast and actual cash flows, and by matching the maturity profiles of financial assets and liabilities. The ability of the company to settle its foreign creditors remained a key consideration, although with the support of the Reserve Bank of Zimbabwe, as well as some respite in respect of foreign liquidity on the back of tobacco inflows, the company’s position with its foreign creditors normalised by year end. Note 22.2.2 sets out details of additional undrawn facilities that the Group has at its disposal to further reduce liquidity risk.
The following tables detail the Group’s remaining contractual maturity for its financial liabilities with agreed repayment periods. The tables have been drawn up based on the undiscounted cash flows of financial liabilities based on the earliest date on which the Group can be required to pay.
noTes To THe ConsolIDaTeD fInanCIal sTaTemenTs (ConTInueD) noTes To THe ConsolIDaTeD fInanCIal sTaTemenTs (ConTInueD)
Less than 3 months
US$
3-12 Months US$
1 - 5 years US$
Total US$
Year ended 30 June 2018
Borrowings 12,910,983 17,350,655 - 30,261,638
Trade and other payables 52,786,808 - - 52,786,808
Bank overdrafts 159,728 - - 159,728
65,857,519 17,350,655 - 83,208,174
Year ended 30 June 2017
Borrowings 1,851,394 8,985,080 - 10,836,474
Trade and other payables 16,603,855 - - 16,603,855
Bank overdrafts 19,829,174 - - 19,829,174
38,284,423 8,985,080 - 47,269,503
22.2.5 Foreign currency risk
Foreign currency risk is managed at an operational level by the relevant head of department and monitored by Group Treasury. Exposure to losses on foreign currency denominated creditors is managed through prompt payment of outstanding balances and forward contracts when available.
The carrying amount of the Group's foreign currency denominated monetary assets and liabilities at the end of the reporting period is as follows:
2018 2017
US$ US$
Liabilities
South African Rand 1,068,429 111,086
Botswana Pula 92,227 48,424
Euro 19,231 -
The Group is mainly exposed to the South African Rand and Botswana Pula. The following table details the Group's sensitivity to a 10% strengthening in the US$ against the relevant currencies. The sensitivity analysis includes any outstanding foreign currency denominated monetary items and adjusts their translation at period end for a 10% strengthening of the US$. A positive number below indicates an increase in profit and equity where the US$ strengthens against the relevant currency. For a 10% weakening of the US$ against the relevant currencies there would be a comparable impact on the profit and equity in the opposite direction. The Group's exposure to foreign currency changes for all other currencies is not material.
Profit or (Loss)2018US$
Profit or (Loss)2017US$
South African Rand 97,130 10,099
Botswana Pula 8,384 4,402
Euro 1,748 -
The sensitivity is mainly attributable to receivables, payables and cash balances denominated in these currencies.
6261

AnnuAl RepoRt - 2018 NATIONAL FOODS LTD.AnnuAl RepoRt - 2018NATIONAL FOODS LTD.
noTes To THe ConsolIDaTeD fInanCIal sTaTemenTs (ConTInueD)
23. SEGMENTAL ANALYSIS
23.1 Operating segment information
For management purposes the Group is organised into business units based on their products and services and has resulted in three reportable operating segments as follows:
Milling, Manufacturing and Distribution
This segment comprises of the flour , maize and stock feeds operating segments. Management has applied the following judgements in aggregating these operating segments: - The operating segments exhibit similar long term average gross margins - The products constitute fast moving consumer goods - They are involved in the conversion of one form of raw material to a saleable purchased state - They involve the warehousing of products and distribution to the wholesale and retail market
Properties
This segment includes all properties owned by the Group. Properties are leased out to business units in the Milling, Manufacturing and Distribution segment as well as to third parties.
Profit before tax is used to measure segment performance.
Segment revenues and results
Year ended 30 June 2018
Milling, Manufacturing & Distribution
US$Properties
US$
Intersegment adjustments
US$Group
US$
Segment revenue
External customers 297,231,216 698,282 - 297,929,498
Inter-segment - 1,388,129 (1,388,129) -
Total revenue 297,231,216 2,086,411 (1,388,129) 297,929,498
Operating profit 18,742,348 725,066 - 19,467,414
Net interest expense (3,863,023) 410,748 - (3,452,275)
Equity accounted earnings 5,195,938 - - 5,195,938
Profit before tax 20,075,263 1,135,814 - 21,211,077
Segment assets 162,843,352 45,069,814 (6,835,286) 201,077,880
Segment liabilities (97,932,883) (6,145,085) 6,835,286 (97,242,682)
Net segment assets 64,910,469 38,924,729 - 103,835,198
Depreciation charge for the year 2,078,885 588,046 - 2,666,931
Capital expenditure 4,119,497 325,075 - 4,444,572
Number of employees 618 - - 618
Year ended 30 June 2017
Segment revenue
External customers 288,969,124 539,044 - 289,508,168
Inter-segment - 1,559,453 (1,559,453) -
Total revenue 288,969,124 2,098,497 (1,559,453) 289,508,168
noTes To THe ConsolIDaTeD fInanCIal sTaTemenTs (ConTInueD)
Milling, Manufacturing & Distribution
US$Properties
US$
Intersegment adjustments
US$Group
US$
Operating profit 15,740,943 755,748 - 16,496,691
Net interest expense (1,497,914) 396,219 - (1,101,695)
Equity accounted earnings 1,831,471 - 1,831,471
Profit before tax 16,074,500 1,151,967 - 17,226,467
Segment assets 108,101,139 44,351,375 673,542 153,126,056
Segment liabilities (51,263,560) (6,251,854) (673,542) (58,188,956)
Net segment assets 56,837,579 38,099,521 - 94,937,100
Depreciation charge for the year 2,323,702 563,150 - 2,886,852
Capital expenditure 3,007,018 857,482 - 3,864,500
Number of employees 629 - - 629
23.2 Geographical Information
The Group’s trading operations are entirely housed in Zimbabwe. The Botswana Milling and Produce company has no trading activities and holds non current assets worth US$ 14,632 (2017: US$ 15,322). As such no further geographical information has been presented. Red Seal Manufacturers has no trading activities.
23.3 Major customersRevenue information above is based on the location of the customers. Major customers are customers that each contribute at least 10% of the Group’s revenues as follows; customer A - 22%, customer B - 15% and customer c - 13% . Revenue from major customers amounted to $145,684,325 (2017 : $81,144,339) arising from sale of various goods.
24. EVENTS AFTER THE REPORTING DATE
There were no events after the reporting date that warranted disclosure.
25. RELATED PARTY TRANSACTIONS
25.1 The ultimate parent
The Group's ultimate holding company is Innscor Africa limited with a 37.73% interest in the Group.
25.2 The financial statements include the financial statements of National Foods Holdings limited, subsidiaries, associates and joint ventures listed in the following table:
Name Country of incorporation
2018 Equity
Interest
2017 Equity
interest
Subsidiaries, associates and joint ventures
National Foods limited (Formerly National Foods Operations limited) Zimbabwe 100% 100%
- National Foods logistics Zimbabwe 50% 0%
- Pure Oil Industries (Private) limited Zimbabwe 40% 40%
National Foods Properties limited (Formerly National Foods limited) Zimbabwe 100% 100%
Bakery Products (Private) limited Zimbabwe 100% 100%
Harris Maize Milling and Produce company (Private) limited Zimbabwe 100% 100%
Rice Mills (Private) limited Zimbabwe 100% 100%
Natpak Zimbabwe (Private) limited Zimbabwe 100% 100%
NF Transport Bulawayo (Private) limited Zimbabwe 100% 100%
Palte-Harris (Private) limited Zimbabwe 100% 100%
Speciality Animal Feed company limited Zimbabwe 100% 100%
Botswana Milling and Produce company (Proprietary) limited Botswana 100% 100%
- Red Seal Manufacturers (Proprietary) limited Botswana 100% 100%
6463

AnnuAl RepoRt - 2018 NATIONAL FOODS LTD.AnnuAl RepoRt - 2018NATIONAL FOODS LTD.
2018 2017
US$ US$
25.3 Transactions entered into with related parties
Purchase of trading stocks, raw materials and services
Innscor Africa limited Group companies 12,944,959 9,694,836
Pure Oil Industries (Private) limited 3,682,109 8,656,755
National Foods logistics 2,722,671
Sale of goods and Services
Innscor Africa limited Group companies 44,971,447 39,146,611
Interest and Management Fees
Innscor Africa limited Group companies
- Management fees 540,000 406,665
- Net interest received on call accounts - 8,422
Entities with Significant Influence
Purchase of trading stocks and raw materials
Tiger Brands limited - 834,071
Interest and Management Fees
Tiger Brands limited
- Technical fees 240,000 240,000
25.4 Balances (due to) or due from related parties
Innscor Africa limited Group companies 7,991,126 6,823,117
Tiger Brands limited - (3,733)
Pure Oil Industries (Private) limited (781,086) (866,282)
National Foods logistics 770,676 -
25.5 Terms and conditions of transactions with related parties
The sales to and purchases from related parties are made at terms equivalent to those that prevail in arms length transactions. Outstanding balances at year end are unsecured , interest free and settlement occurs in cash. There have been no guarantees provided or received for any related party receivables or payables. For the year ended 30 June 2018 the Group has not recorded any impairment of receivables relating to amounts owed by related parties (2017: US$ nil). This assessment is undertaken each financial year through examining the financial position of each related party and the market in which the related party operates.
25.6 Guarantees
The company acted as a guarantor to Pure Oil. The guarantee was issued by National Foods Holdings limited in favour of Stanbic Bank Zimbabwe limited in respect of any and all financial obligations and the indebtedness of Pure Oil Industries (Private) limited subject to a maximum limit of US$7 million.
noTes To THe ConsolIDaTeD fInanCIal sTaTemenTs (ConTInueD)
2018 2017
US$ US$
25.7 Directors emoluments
Aggregate amounts paid by the company and its subsidiaries to directors of the company
- for services as directors 56,636 52,416
56,636 52,416
25.8 Key management remuneration
Key management consists of the executive committee members (excluding the chief Executive Officer and Finance Director) and business units' managing executives.
Aggregate short term employee benefits paid by the company and its subsidiaries to key management of the company
3,571,875 2,683,287
Pension contributions 212,342 240,429
3,784,217 2,923,716
noTes To THe ConsolIDaTeD fInanCIal sTaTemenTs (ConTInueD)
6665

AnnuAl RepoRt - 2018 NATIONAL FOODS LTD.AnnuAl RepoRt - 2018NATIONAL FOODS LTD.
CoMPaNY sTaTeMeNT of fiNaNCial PosiTioN As At 30 June 2018
Note 2018 2017
US$ US$
ASSETS
Non-current assets
Investments A 25,367,809 25,367,809
Total assets 25,367,809 25,367,809
EQUITY AND LIABILITIES
Capital and reserves
share capital 15 684,001 684,001
distributable reserves 24,683,808 24,683,808
Total Equity 25,367,809 25,367,809
NOTES TO THE COMPANY FINANCIAL STATEMENTS
A. INVESTMENTS
Subsidiaries equity at US$ converted value 25,367,809 25,367,809
B. GuaranteesThe company acted as a guarantor to National Foods limited, a wholly owned subsidiary. The guarantee was issued by National Foods Holdings limited in respect of any and all financial obligations and the indebtedness of National Foods limited
T. Moyo
ChairmanHarare27 September 2018
M. lashbrook
Chief Executive Officer
CompanY sTaTemenT of fInanCIal posITIon
shareholDers’ AnAlysIs
Shareholding No. of shareholders
% Issued shares
%
1 - 1000 498 56.21 177,256 0.26
1001 - 10000 272 30.70 867,850 1.27
10001 - 50000 81 9.14 1,712,775 2.50
50001 and over 35 3.95 65,642,227 95.97
886 100 68,400,108 100
Shareholders
Bank And Nominees 48 5.42 337,319 0.49
Deceased Estates 8 0.90 28,822 0.04
External companies 2 0.23 25,622,013 37.46
Insurance companies/Societes 14 1.58 3,544,551 5.18
Pension Fund 135 15.24 3,867,946 5.65
Resident Inividuals 471 53.16 688,260 1.01
Non Residents 80 9.03 1,176,030 1.72
Investment, Trusts And companies 128 14.45 33,135,167 48.44
Total 886 100 68,400,108 100
Shareholding No. of shareholders
% Issued shares
%
1 - 1000 494 57.31 174,041 0.25
1001 - 10000 263 30.51 793,406 1.16
10001 - 50000 69 8.00 1,457,948 2.13
50001 and over 36 4.18 65,974,713 96.45
862 100 68,400,108 100
Shareholders
Bank And Nominees 38 4.41 280,734 0.41
Deceased Estates 7 0.81 8,407 0.01
External companies 2 0.23 25,661,682 37.52
Insurance companies/Societes 12 1.39 1,734,145 2.54
Pension Fund 104 12.06 3,352,309 4.90
Resident Inividuals 480 55.68 822,829 1.20
Non Residents 78 9.05 3,343,933 4.89
Investment, Trusts And companies 140 16.24 33,194,326 48.53
Other corporate holdings 1 0.12 1,743 0
Total 862 100 68,400,108 100
at 30 JUne 2018
at 30 JUne 2017
sHareHolDers’ analYsIs
6867

AnnuAl RepoRt - 2018NATIONAL FOODS LTD.
2018 No. of shares
%2017
No. of shares %
Innscor Africa limited 25,806,354 37.73 25,806,354 37.73
Tiger Foods Brands limited - NNR 25,618,474 37.45 25,618,474 37.45
National Foods Workers' Trust (Private) limited 6,734,978 9.85 6,734,978 9.85
Old Mutual life Ass co Zim ltd 2,875,049 4.20 1,269,411 1.86
Stanbic Nominees (Private) limited 1,390,135 2.03 1,408,052 2.06
National Social Security Authority 1,166,292 1.71 1,106,292 1.62
Stanbic Nominees (Private) limited - NNR 929,231 1.36 3,239,087 4.74
Standard chartered Nominees (Private) limited 484,870 0.71 334,733 0.49
local Authorities Pension Fund 300,000 0.44 300,000 0.44
Delta Beverages Pension Fund 185,976 0.27 113,136 0.17
maJoR sHaReHoldeRsThe top 10 shareholders of the companyat 30 June 2018 and 2017
sHareHolDers’ analYsIs
69
AnnuAl RepoRt - 2018NATIONAL FOODS LTD.
NoTiCe of aNNUal generAl MeetIng (AgM)
C h a N G e o f a D D r e s s
cHANGE OF NAME / AND OR ADDRESS
The attention of shareholders is drawn to the necessity of keeping the transfer secretaries advised of anychanges in name and / or address
Shareholder’s name in full(Block Capitals Please)
New Address(Block Capitals Please)
Shareholder’s signature
PROXY FORM - AGM MONDAY, 19TH NOVEMBER 2018 I / We of
Being the registered owner (s) of ordinary shares in the above names company hereby appoint
of or failing him / her
of
or failing him / her, THE cHAIRMAN OF THE MEETING as my / our proxy to vote for me / us and on my / our behalf at the Annual General Meeting of the company to be held on Monday, 19th November 2018, at 10.30am, and any adjournment thereof.
SIGNED this day of 2018
Signature of Member
-:NOTE1. A member of the company is entitled to appoint one or more proxies to act in the alternative to attend and vote and speak instead of him. A proxy need not be a member of the company.
2. Instruments of proxy must be deposited at the registered office of the company not less than forty eight hours before the time appointed for holding the meeting.
ProXY forM
6871
NOTICE IS HEREBY GIVEN that the forty-ninth Annual General
Meeting of National Foods Holdings limited is to be held at the
registered office, Gloria House, 10 Stirling Road, Workington,
Harare on 19th November 2018 at 10.30am, to conduct the
following business:
ORDINARY BUSINESS
1. To receive and consider the Financial Statements and
Reports of the Directors and Auditors for the financial
year ended 30 June 2018.
2. To re-elect the following retiring Directors, Messrs Noel
Doyle and Julian Schonken who retire by rotation and
being eligible, offer themselves for re-election.
3. To approve Directors’ fees for the financial year ended
30 June 2018.
4. To re-appoint Ernst & Young as Auditors of the company
until the conclusion of the next Annual General Meeting
and to approve their remuneration for the past audit.
SPECIAL BUSINESS
5. Approval of Share Buy Back
To consider, and if deemed appropriate, to pass with or
without amendment, the following ordinary resolution:-
That the company be authorised in advance, in terms of
section 79 of the companies Act [chapter 24:03] and
the Zimbabwe Stock Exchange listing Requirements,
to purchase its own shares, upon such terms and
conditions and in such amounts as the Directors of the
company may from time to time determine, but subject
to the following:-
i. This Authority shall expire on the date of the company’s
Next Annual General Meeting; and
ii. Acquisitions shall be of ordinary shares which, in
aggregate in any one financial year, shall not exceed 10%
(ten per cent) of the company’s issued ordinary share
capital as at the date of this resolution; and
iii. The maximum and minimum prices respectively, at
which such ordinary shares may be acquired shall be
not more than 5% (five percent) above and 5% (five
percent) below the weighted average of the market
price at which such ordinary shares are traded on the
Zimbabwe Stock Exchange, as determined over the 5
(five) business days immediately preceeding the date of
purchase of such ordinary shares by the company; and
iv. A press announcement will be published as soon as the
company has acquired ordinary shares constituting on
an accumulative basis in the period between annual
general meetings, 3% (three per cent) of the number of
ordinary shares in issue prior to the acquisition; and
v. If during the subsistence of this resolution the company
is unable to declare and pay a cash dividend then this
resolution shall be of no force and effect.
-:Note
In terms of this resolution, the Directors are seeking
authority to allow use of the company’s available cash
resources to purchase its own shares in the market
in terms of the companies Act and the regulations
of the Zimbabwe Stock Exchange. The Directors will
only exercise the authority if they believe that to do so
would be in the best interests of shareholders generally.
In exercising this authority the Directors will duly take
into account following such repurchase, the ability of
the company to be able to pay its debts in the ordinary
course of business, the maintenance of an excess of
assets over liabilities, and for the company and the
Group, the adequacy of ordinary capital and reserves as
well as working capital.
6. Loans to Executive Directors
To resolve as an ordinary resolution, with or without
amendment:- “That the company be and is hereby
authorised to make any loan to any Executive Director
or to enter into any guarantee or provide any security in
connection with a loan to such Executive Director for the
purpose of enabling him to properly perform his duty as
an officer of the company, as may be determined by
the Remuneration committee of the Board of Directors,
provided that the amount of the loan or the extent of
the guarantee or security shall not exceed the annual
remuneration of that Director”.
7. ANY OTHER BUSINESS
To transact any other business competent to be dealt
with at an Annual General Meeting.
Proxies
In terms of the companies Act (chapter 24:03), a
member entitled to attend and vote at a meeting is
entitled to appoint a proxy to attend and vote on a poll
and speak in his stead. A proxy need not be a member
of the company. Proxy forms should reach the office of
the company Secretary at least 48 (forty-eight) hours
before the commencement of the meeting.
BY ORDER OF THE BOARD
l.c. HOWES
Group company Secretary
Gloria House
10 Stirling Road
Workington
P.O Box 269
Harare
27 September 2018
noTICe of annual General meeTInG

P r o X Y f o r M
c o m pa n y s e c r e t a r y
g l o r i a h o u s e1 0 s t i r l i n g r o a d
w o r k i n g t o np. o . B o X 2 6 9
h a r a r e
c o m pa n y s e c r e t a r y
g l o r i a h o u s e1 0 s t i r l i n g r o a d
w o r k i n g t o np. o . B o X 2 6 9
h a r a r e
C h a N G e o f a D D r e s s

AnnuAl RepoRt - 2018NATIONAL FOODS LTD.
Harare: 10 Stirling Road, WorkingtonTel: (024) 2 753751/8, 753741/9Bulawayo: Stand No. 13747 Basch StreetTel: (029) 2 889201Contact: [email protected]


![Shan And National Competitor_Our Project on [Aroma Foods]](https://img.pdfslide.net/doc/110x75/55d073cbbb61eb6d478b46ff/shan-and-national-competitorour-project-on-aroma-foods.jpg)