Embed Size (px)
Citation preview
Table of Contents Unit Overview ................................................................................................................................. 3-5
Lessons by Day ................................................................................................................................... 6
Day 1: Earth as a System ................................................................................................................. 7-9
Day 2: Weather vs. Climate ......................................................................................................... 10-11
Day 3: Watershed ....................................................................................................................... 12-14
Day 4: Climate Science Data and Tools ......................................................................................... 15-17
Day 5: Onsite or Virtual Field Trip ................................................................................................ 18-20
Day 6: Climate Connections ......................................................................................................... 21-22
Day 7: Project Preparation .......................................................................................................... 23-24
Day 8: Evaluations ....................................................................................................................... 25-26
Teacher Resources ........................................................................................................................... 27
Climate Change Pre/Post Assessment ............................................................................................... 28-30
Worksheet 1.1—Earth as a System .................................................................................................... 31-32
Procedure 2.1—Carrying Capacity .......................................................................................................... 33
Worksheet 2.1—Weather vs. Climate Diagram ...................................................................................... 34
Procedure 3.1—Watershed Activity .................................................................................................. 35-36
Worksheet 3.1—Watershed Map ........................................................................................................... 37
Procedure 4.1—Historic Stream Flow Data ............................................................................................ 38
Worksheet 4.1—Sequoia-Kings Canyon Stream Flow Data ............................................................... 39-40
Worksheet 4.2—Yosemite Stream Flow Data.................................................................................... 41-45
Procedure 5.1—Stream Flow ............................................................................................................. 46-47
Worksheet 5.1—Measuring and Calculating Stream Flow ................................................................ 48-49
Procedure 6.1—Virtual Field Trip ...................................................................................................... 50-51
Project Assignment ................................................................................................................................. 52
Project Rubric .......................................................................................................................................... 53
Vocabulary List ................................................................................................................................... 54-56
Student Evaluation ............................................................................................................................. 57-58
Teacher Evaluation ............................................................................................................................ 59-60

9th Grade Earth Science Unit Overview
This lesson was created in partnership with the Teacher-Ranger-Teacher program through the National Park Service.
Rationale:
The Earth consists of four systems: the atmosphere, hydrosphere, geosphere, and biosphere, which are interconnected. Changes to one part of the system can have consequences on the others. Changes to global or regional climate can be caused by changes in the sun’s energy output or Earth’s orbit, tectonic events, ocean circulation, volcanic activity, glaciers, vegetation, and human activity. Water is essential for life on Earth. Relative water availability is a major factor in designating habitats for different living organisms. In the United States, things like agriculture and water rights are hot topics. Current models predict that average global temperatures are going to continue to rise even if regional climate changes remain complex and varied. These changes will have an impact on all of Earth’s systems. Studies have shown that climate change is driven not only by natural effects but also by human activities. Knowledge of the factors that affect climate, coupled with responsible management of natural resources are required for sustaining these Earth systems. Long-term change can be anticipated using science-based predictive models making science and engineering essential to understanding global climate change and its possible impacts. National Parks can serve as benchmarks for climate science trends and effects over time because they are protected areas void of human influence. Understanding current climate trends will help set students up to be successful in interpreting and engaging in discussions about climate change, which will lead to informed decision making.
Next Gen Science Standards: Students who demonstrate understanding can: HS-ESS2-2. Analyze geoscience data to make the claim that one change to Earth’s surface can create
feedbacks that cause changes to other Earth systems. HS-ESS2-4. Use a model to describe how variations in the flow of energy into and out of Earth’s systems
result in changes in climate. HS-ESS3-1. Construct an explanation based on evidence for how the availability of natural resources,
occurrence of natural hazards, and changes in climate have influenced human activity. HS-ESS3-5. Analyze geoscience data and the results from global climate models to make an evidence-
based forecast of the current rate of global or regional climate change and associated future impacts to Earth systems.
HS-ESS3-6. Use a computational representation to illustrate the relationships among Earth systems and how those relationships are being modified due to human activity.
HS-LS2-6. Evaluate the claims, evidence, and reasoning that the complex interactions in ecosystems maintain relatively consistent numbers and types of organisms in stable conditions, but changing conditions may result in a new ecosystem.
HS-LS2-7. Design, evaluate, and refine a solution for reducing the impacts of human activities on the environment and biodiversity.
HS-LS4-6. Create or revise a simulation to test a solution to mitigate adverse impacts of human activity on biodiversity.
9th Grade Earth Science Unit Overview
This lesson was created in partnership with the Teacher-Ranger-Teacher program through the National Park Service.
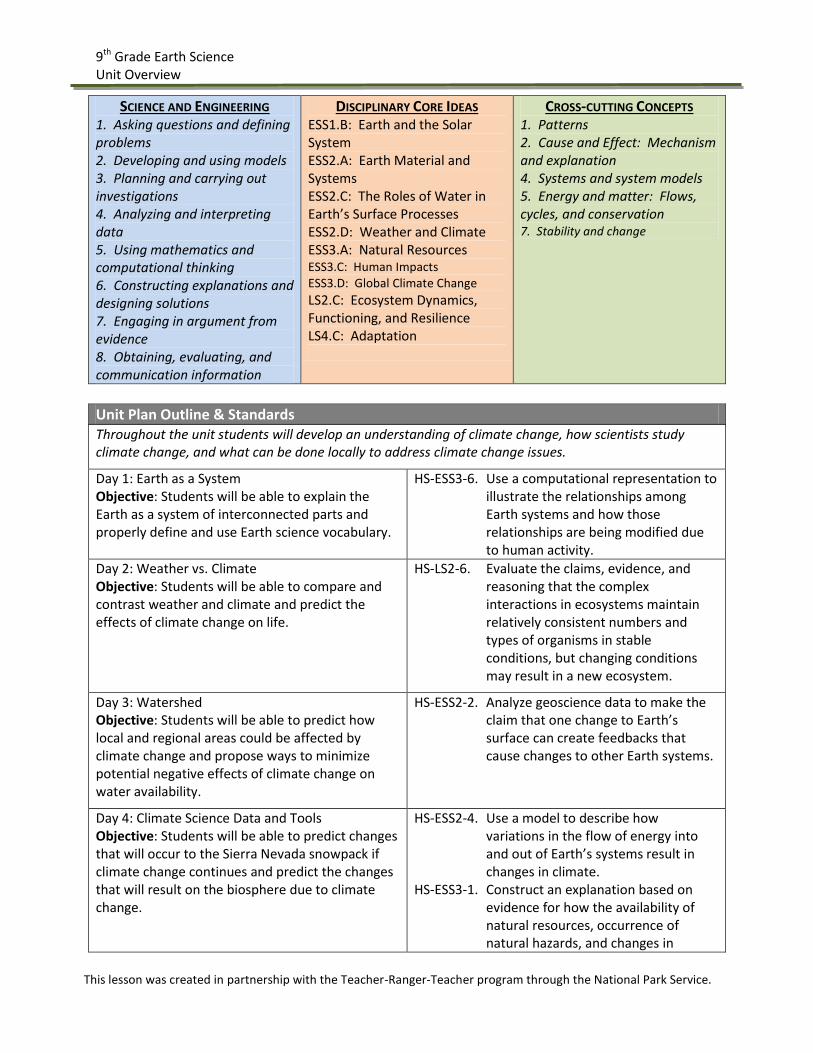
SCIENCE AND ENGINEERING 1. Asking questions and defining problems 2. Developing and using models 3. Planning and carrying out investigations 4. Analyzing and interpreting data 5. Using mathematics and computational thinking 6. Constructing explanations and designing solutions 7. Engaging in argument from evidence 8. Obtaining, evaluating, and communication information
DISCIPLINARY CORE IDEAS ESS1.B: Earth and the Solar System ESS2.A: Earth Material and Systems ESS2.C: The Roles of Water in Earth’s Surface Processes ESS2.D: Weather and Climate ESS3.A: Natural Resources ESS3.C: Human Impacts ESS3.D: Global Climate Change
LS2.C: Ecosystem Dynamics, Functioning, and Resilience LS4.C: Adaptation
CROSS-CUTTING CONCEPTS 1. Patterns 2. Cause and Effect: Mechanism and explanation 4. Systems and system models 5. Energy and matter: Flows, cycles, and conservation 7. Stability and change
Unit Plan Outline & Standards Throughout the unit students will develop an understanding of climate change, how scientists study climate change, and what can be done locally to address climate change issues.
Day 1: Earth as a System Objective: Students will be able to explain the Earth as a system of interconnected parts and properly define and use Earth science vocabulary.
HS-ESS3-6. Use a computational representation to illustrate the relationships among Earth systems and how those relationships are being modified due to human activity.
Day 2: Weather vs. Climate Objective: Students will be able to compare and contrast weather and climate and predict the effects of climate change on life.
HS-LS2-6. Evaluate the claims, evidence, and reasoning that the complex interactions in ecosystems maintain relatively consistent numbers and types of organisms in stable conditions, but changing conditions may result in a new ecosystem.
Day 3: Watershed Objective: Students will be able to predict how local and regional areas could be affected by climate change and propose ways to minimize potential negative effects of climate change on water availability.
HS-ESS2-2. Analyze geoscience data to make the claim that one change to Earth’s surface can create feedbacks that cause changes to other Earth systems.
Day 4: Climate Science Data and Tools Objective: Students will be able to predict changes that will occur to the Sierra Nevada snowpack if climate change continues and predict the changes that will result on the biosphere due to climate change.
HS-ESS2-4. Use a model to describe how variations in the flow of energy into and out of Earth’s systems result in changes in climate.
HS-ESS3-1. Construct an explanation based on evidence for how the availability of natural resources, occurrence of natural hazards, and changes in

9th Grade Earth Science Unit Overview
This lesson was created in partnership with the Teacher-Ranger-Teacher program through the National Park Service.
climate have influenced human activity.
Day 5: On-site or Virtual Visit Objective: Students will be able to complete a stream assessment lab activity, record and analyze appropriate data, and report findings through an appropriate medium.
HS-ESS2-2. Analyze geoscience data to make the claim that one change to Earth’s surface can create feedbacks that cause changes to other Earth systems.
Day 6: National Park Service Connections Objective: Students will be able to give at least one example of how climate change is impacting wildlife and state why National Parks are important to climate science.
HS-ESS3-6. Use a computational representation to illustrate the relationships among Earth systems and how those relationships are being modified due to human activity.
Day 7: Project Preparation Day 8: Presentations Objective: Students will be able to create a product that conveys climate change information and possible solutions.
HS-ESS3-5. Analyze geoscience data and the results from global climate models to make an evidence-based forecast of the current rate of global or regional climate change and associated future impacts to Earth systems.
HS-LS2-7. Design, evaluate, and refine a solution for reducing the impacts of human activities on the environment and biodiversity.
HS-LS4-6. Create or revise a simulation to test a solution to mitigate adverse impacts of human activity on biodiversity.
Day 8: Assessment and Evaluation Objective: Students will be able to demonstrate learning through performance on post-assessment and complete Unit Evaluation.
HS-ESS3-5. Analyze geoscience data and the results from global climate models to make an evidence-based forecast of the current rate of global or regional climate change and associated future impacts to Earth systems.
HS-LS2-7. Design, evaluate, and refine a solution for reducing the impacts of human activities on the environment and biodiversity.
HS-LS4-6. Create or revise a simulation to test a solution to mitigate adverse impacts of human activity on biodiversity.
Lessons by Day
Earth Science Date: Day 1: Earth as a System Grade(s):
This lesson was created in partnership with the Teacher-Ranger-Teacher program through the National Park Service.
Next Gen Science Standards: Students who demonstrate understanding can: HS-ESS3-6. Use a computational representation to illustrate the relationships among Earth systems and
how those relationships are being modified due to human activity.
SCIENCE AND ENGINEERING 1. Asking questions and defining problems 5. Using mathematics and computational thinking 8. Obtaining, evaluating, and communication information
DISCIPLINARY CORE IDEAS ESS3.D: Global Climate Change
CROSS-CUTTING CONCEPTS 1. Patterns 2. Cause and Effect: Mechanism and explanation 4. Systems and system models 5. Energy and matter: Flows, cycles, and conservation 7. Stability and change
Instructional Objective(s): Students will be able to: 1. Explain the Earth as a system of interconnected parts. 2. Properly define and use Earth science vocabulary.
Prerequisite Concepts and Skills: Administer the pre test evaluation prior to starting unit. Vocabulary geosphere, hydrosphere, biosphere, atmosphere, geosciences, solar output, reflection, transmission, thermal capacity, global, geography, carbon cycle.

Earth Science Date: Day 1: Earth as a System Grade(s):
This lesson was created in partnership with the Teacher-Ranger-Teacher program through the National Park Service.
Materials and Resources:
Teacher Students Downloaded video, Earth as a System http://www.teachersdomain.org/resource/ess05.sci.ess.earthsys.hologlobe/ (Alternate option is to show video directly from internet during class.)
Worksheet 1.1 – Earth as a System (one per student) (NPS provided master copy) Butcher paper/markers one set per group (Teacher provided) Post-it notes (3 per student) (Teacher provided)
Lesson Activities: 58 min
Teacher Activities Student Activities Time: Introduction: 1. Display the DoNow. 2. Take attendance while students complete the DoNow. 3. Prepare to show the Earth as a System introductory video on the internet.
1. DoNow: What is a system? Define and provide an example of a system. Diagram your system.
5 min
New Content: 1. Distribute worksheet 1.1. 2. Show the video “Earth as a System” (5:31). 3. Monitor discussion and distribute butcher paper and markers for posters. 4. Distribute post-it notes and instruct students on “gallery walk.” 5. Monitor progress.
1. Complete pre-video questions on worksheet 1.1 2. Watch the video “Earth as a System.” Complete post-video questions on worksheet 1.1. 3. In small groups, discuss what “Earth as a system” means? 4. Create an illustration that demonstrates, “Earth as a System.” Be sure to include the 4 spheres and give at least one example of how humans are impacting/influencing each one. 5. Gallery walk the posters created by all groups and make 2 positive comments and 1 suggestion on each.
5 min 10 min 8 min 15 min 10 min
Wrap-up 1. Provide exit ticket question. 2. Dismiss students.
1. Complete exit ticket and wait for dismissal. Exit ticket—How do you view the Earth differently after today’s activities?
5 min
Organizational and/or Behavioral Management Strategies:
Assessment and Evaluation:
Earth Science Date: Day 1: Earth as a System Grade(s):
This lesson was created in partnership with the Teacher-Ranger-Teacher program through the National Park Service.
Extensions:
Adaptations:
Teacher Reflections:

Earth Science Date: Day 2: Weather vs. Climate Grade(s):
This lesson was created in partnership with the Teacher-Ranger-Teacher program through the National Park Service.
Next Gen Science Standards: Students who demonstrate understanding can: HS-LS2-6. Evaluate the claims, evidence, and reasoning that the complex interactions in ecosystems
maintain relatively consistent numbers and types of organisms in stable conditions, but changing conditions may result in a new ecosystem.
SCIENCE AND ENGINEERING 7. Engaging in argument from evidence
DISCIPLINARY CORE IDEAS LS2.C: Ecosystem Dynamics, Functioning, and Resilience
CROSS-CUTTING CONCEPTS 7. Stability and Change
Instructional Objective(s): Students will be able to:
1. Compare and contrast weather and climate. 2. Predict the effects of climate change on life.
Prerequisite Concepts and Skills: Vocabulary weather, climate, atmospheric circulation, climate change, feedback loops, physical process, chemical process, carrying capacity, morphological, physiological, behavioral traits, adaptation, redistribution,
Materials and Resources:
Teacher Students Video Earth: Climate and Weather http://video.nationalgeographic.com/video/science/earth-sci/climate-weather-sci/ Or use the downloaded video, Climate vs Weather Presentation – Animal Traits (NPS provided) Procedure 2.1 (NPS provided)
Worksheet 2.1 (NPS provided master copy)
Earth Science Date: Day 2: Weather vs. Climate Grade(s):
This lesson was created in partnership with the Teacher-Ranger-Teacher program through the National Park Service.
Lesson Activities: 58 min
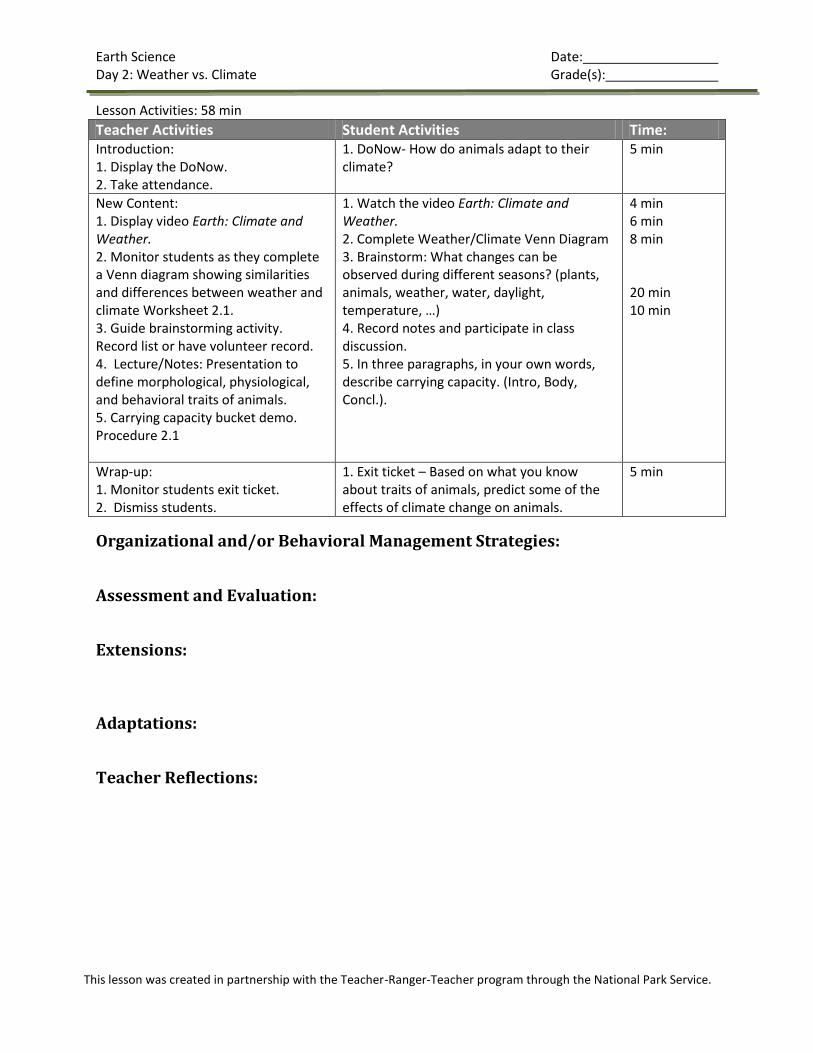
Teacher Activities Student Activities Time: Introduction: 1. Display the DoNow. 2. Take attendance.
1. DoNow- How do animals adapt to their climate?
5 min
New Content: 1. Display video Earth: Climate and Weather. 2. Monitor students as they complete a Venn diagram showing similarities and differences between weather and climate Worksheet 2.1. 3. Guide brainstorming activity. Record list or have volunteer record. 4. Lecture/Notes: Presentation to define morphological, physiological, and behavioral traits of animals. 5. Carrying capacity bucket demo. Procedure 2.1
1. Watch the video Earth: Climate and Weather. 2. Complete Weather/Climate Venn Diagram 3. Brainstorm: What changes can be observed during different seasons? (plants, animals, weather, water, daylight, temperature, …) 4. Record notes and participate in class discussion. 5. In three paragraphs, in your own words, describe carrying capacity. (Intro, Body, Concl.).
4 min 6 min 8 min 20 min 10 min
Wrap-up: 1. Monitor students exit ticket. 2. Dismiss students.
1. Exit ticket – Based on what you know about traits of animals, predict some of the effects of climate change on animals.
5 min
Organizational and/or Behavioral Management Strategies:
Assessment and Evaluation:
Extensions:
Adaptations:
Teacher Reflections:

Earth Science Date: Day 3: Watershed Grade(s):
This lesson was created in partnership with the Teacher-Ranger-Teacher program through the National Park Service.
Next Gen Science Standards: Students who demonstrate understanding can: HS-ESS2-2. Analyze geosciences data to make the claim that one change to Earth’s surface can create
feedback that causes changes to other Earth systems.
SCIENCE AND ENGINEERING 4. Analyzing and interpreting data
DISCIPLINARY CORE IDEAS ESS2.C: The Roles of Water in Earth’s Surface Processes ESS2.A: Earth Materials and Systems ESS2.C: The Roles of Water in Earth’s Surface Processes
CROSS-CUTTING CONCEPTS 7. Stability and change
Instructional Objective(s): Students will be able to:
1. Predict how local and regional areas could be affected by climate change. 2. Propose ways to minimize potential negative effects of climate change on water availability.
Prerequisite Concepts and Skills: Maps Vocabulary habitat, degradation, watershed, riparian, arable land, stream flow, peak flow

Earth Science Date: Day 3: Watershed Grade(s):
This lesson was created in partnership with the Teacher-Ranger-Teacher program through the National Park Service.
Materials and Resources:
Teacher Students Video – Power of Water Erosion http://videos.howstuffworks.com/discovery/31883-howstuffworks-show-episode-4-power-of-water-erosion-video.htm Or show downloaded video, Erosion Presentation – Water Power! (NPS provided) Procedure 3.1 watershed directions (NPS provided) Watershed interactive map http://www.arcgis.com/apps/OnePane/basicviewer/index.html?appid=387531ac0c094da5b6139b890958fca6
Colored pencils, crayons, or thin-tip markers for tracing watershed. (Teacher provided) Worksheet 3.1 (NPS provided master copy)
Lesson Activities: 58 min
Teacher Activities Student Activities Time: Introduction: 1. Display DoNow. 2. Take Attendance.
DoNow: How does water affect life and activities on the earth?
5 min
New Content: 1. Display Power of Water Erosion video and lead a discussion. How can water affect the other Earth systems? How can changes to the hydrosphere affect the biosphere? Have students think about if there were to be more or less water in an area, how would that effect the ecosystem? 2. Lecture/present Water Power! 3. Monitor student progress Procedure 3.1. 4. Trace several local watersheds on interactive online map to show students where water ends up.
1. Watch Power of Water Erosion video and participate in discussion. 2. Record notes and participate in class discussion 3. Trace watershed from Thousand Island Lakes and Lake Mary Worksheet 3.1. 4. Observe watershed tracing on interactive map.
8 min 10 min 10 min 10 min 10 min
Wrap-up: 1. Provide exit ticket question. 2. Dismiss students.
1. Complete exit ticket question and wait for dismissal. Predict the effects of climate change on water at the local, regional, and state level. Purpose ways that could help reverse its effects.
5 min
Organizational and/or Behavioral Management Strategies:
Assessment and Evaluation:

Earth Science Date: Day 3: Watershed Grade(s):
This lesson was created in partnership with the Teacher-Ranger-Teacher program through the National Park Service.
Extensions: Glaciers are also being impacted by climate change. Extend this lesson by watching the video and discussing visible changes. http://video.nationalgeographic.com/video/environment/global-warming-environment/glacier-melt/
Adaptations:
Teacher Reflections:

Earth Science Date: Day 4: Climate Science Data and Tools Grade(s):
This lesson was created in partnership with the Teacher-Ranger-Teacher program through the National Park Service.
Next Gen Science Standards: Students who demonstrate understanding can: HS-ESS2-4. Use a model to describe how variations in the flow of energy into and out of Earth’s systems
result in changes in climate. HS-ESS3-1. Construct an explanation based on evidence for how the availability of natural resources,
occurrence of natural hazards, and changes in climate have influenced human activity.
SCIENCE AND ENGINEERING 2. Developing and using models 4. Analyzing and interpreting data 5. Using mathematics and computational thinking 6. Constructing explanations and designing solutions
DISCIPLINARY CORE IDEAS ESS2.D: Weather and Climate ESS3.A: Natural Resources ESS3.C: Human Impacts
CROSS-CUTTING CONCEPTS 2. Cause and Effect: Mechanism and explanation 4. Systems and system models 5. Energy and matter: Flows, cycles, and conservation 7. Stability and change
Instructional Objective(s): Students will be able to:
1. Predict changes that will occur to the Sierra Nevada snowpack if the climate change continues. 2. Predict changes that will result on the biosphere due to climate change.
Prerequisite Concepts and Skills: Tables, graphs, charts, and background knowledge of Yosemite National Park. Vocabulary phenology, biodiversity, anthropogenic changes, snowpack, snow water equivalent, deduce, Infer, predict, pattern, temporal scale, spatial scale.
Materials and Resources:

Earth Science Date: Day 4: Climate Science Data and Tools Grade(s):
This lesson was created in partnership with the Teacher-Ranger-Teacher program through the National Park Service.
Teacher Students Video A Way Forward: Dealing with Climate Change http://video.nationalgeographic.com/video/environment/global-warming-environment/way-forward-climate/ Or show downloaded video, Climate Change Video CA Dept of Water Resources Snow Surveying [Note: wmv format] http://www.water.ca.gov/newsroom/video/education.cfm Procedure 4. 1 (NPS provided)
Large graph paper, i.e. butcher paper 1 per 2 students (Teacher provided) Markers 1 set per 2 students (Teacher provided) Optional: computers with Excel
Lesson Activities: 58 min
Teacher Activities Student Activities Time: Introduction: 1. Display DoNow. 2. Take Attendance.
DoNow: 1. How have climate changes influenced human activities? How could Mammoth Lakes be affected if the climate continues to change?
5 min
New Content: 1. Display video – A Way Forward. 2. Distribute stream flow historical data, graph paper, and markers or visit computer lab for students to pull up Excel. Snowpack is a natural water reservoir that slowly releases its water over time. This release directly impacts streams and rivers. Studying stream flow over a long period of time can show us how snowpack and streams are being affected by climate change. 3. Monitor student’s gallery walk. 4. Display video – CA DWR snow surveying. 5. Distribute article. Monitor student progress.
1. Watch video – A Way Forward. 2. Plot climate science data on large graph paper. Display your graph where instructed. 3. Gallery walk making comments and observations about climate change data. 4. Watch video – CA DWR snow surveying. 5. Read Weather and Climate Monitoring at Devil’s Postpile National Monument. Write thesis sentence for this article.
7 min 18 min 6 min 3 min 14 min
Wrap-up: 1. Monitor students as they complete Exit ticket. 2. Dismiss students.
Exit ticket – Why is the Sierra Nevada snowpack important to other areas of California and the United States?
5 min
Organizational and/or Behavioral Management Strategies:
Earth Science Date: Day 4: Climate Science Data and Tools Grade(s):
This lesson was created in partnership with the Teacher-Ranger-Teacher program through the National Park Service.
Assessment and Evaluation:
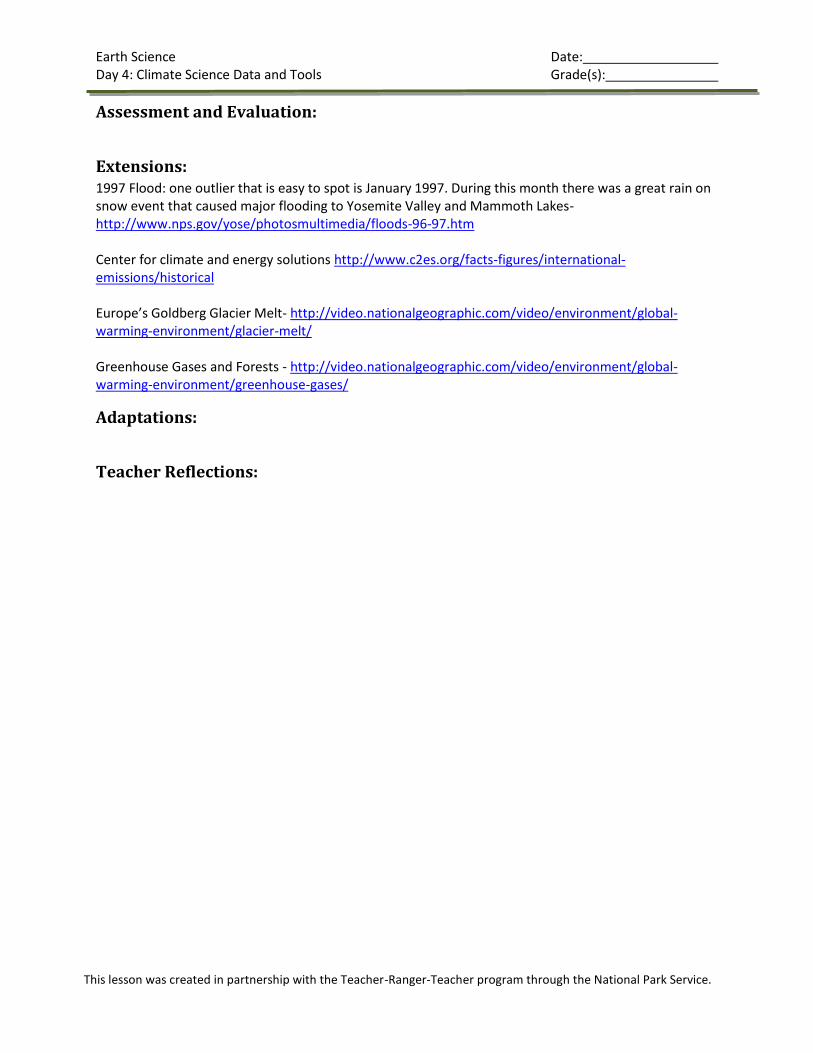
Extensions: 1997 Flood: one outlier that is easy to spot is January 1997. During this month there was a great rain on snow event that caused major flooding to Yosemite Valley and Mammoth Lakes- http://www.nps.gov/yose/photosmultimedia/floods-96-97.htm Center for climate and energy solutions http://www.c2es.org/facts-figures/international-emissions/historical Europe’s Goldberg Glacier Melt- http://video.nationalgeographic.com/video/environment/global-warming-environment/glacier-melt/ Greenhouse Gases and Forests - http://video.nationalgeographic.com/video/environment/global-warming-environment/greenhouse-gases/
Adaptations:
Teacher Reflections:

Earth Science Date: Day 5: Onsite or Virtual Field Trip Grade(s):
This lesson was created in partnership with the Teacher-Ranger-Teacher program through the National Park Service.
Next Gen Science Standards: Students who demonstrate understanding can: HS-ESS2-2. Analyze geosciences data to make the claim that one change to Earth’s surface can create
feedbacks that cause changes to other Earth systems.
SCIENCE AND ENGINEERING 2. Analyzing and interpreting data
DISCIPLINARY CORE IDEAS ESS2.A: Earth Materials and Systems ESS2.D: Weather and Climate
CROSS-CUTTING CONCEPTS 7. Stability and change
Instructional Objective(s): Students will be able to:
1. Complete a stream assessment lab activity. 2. Record and analyze appropriate data and report findings through an appropriate medium.
Prerequisite Concepts and Skills: Tables, charts, graphs Vocabulary channel morphology, floodplain development, benthic cover, riffle zone, biomass, species richness, tolerance.
Materials and Resources:
Teacher Students Option 1: Schedule a field trip with Devils Postpile National Monument or your local NPS site to bring students on a hydrology program. Visit www.nps.gov to find sites in your area. Option 2: Take students out to a local stream for a teacher led lesson on hydrology (Procedure 5.1). Visit
Stream Flow River Study Trunk (NPS provided, except for oranges) Worksheet 5.1 (NPS provided master copy)

Earth Science Date: Day 5: Onsite or Virtual Field Trip Grade(s):
This lesson was created in partnership with the Teacher-Ranger-Teacher program through the National Park Service.
www.nps.gov/DEPO for information on having the equipment mailed to you. Option 3: Schedule a ranger from Devils Postpile National Monument to come into your classroom to discuss hydrology. Option 4: Set up a virtual lesson with Devils Postpile National Monument or another NPS site to bring a lesson on hydrology into the classroom. Contact Devils Postpile National Monument for further information. Procedure 5. 1 (NPS provided master copy)
Lesson Activities: 58 min
Teacher Activities Student Activities Time: Introduction: 1. Display DoNow. 2. Take attendance. *If time allows, display hydrology podcast
1. DoNow: Why would scientists want to know the flow-rate of particular streams and rivers? *Watch podcasts on how scientists study hydrology.
5 min *5 min
New Content: 1. Instruct students on how to travel to the stream assessment site. 2. Monitor students safety during travel. 3. Monitor students as they take stream assessment readings, procedure 5.1.
1. Walk or ride to the stream assessment location. 2. Follow instructions to perform stream assessment. Record data and observations on worksheet 5.1. 3. Return to school.
10 min 30 min 10 min
Wrap-up: 1. Assign post-lab questions and write-up for homework. 2. Dismiss students.
3 min
Organizational and/or Behavioral Management Strategies:
Assessment and Evaluation:
Extensions:
Earth Science Date: Day 5: Onsite or Virtual Field Trip Grade(s):
This lesson was created in partnership with the Teacher-Ranger-Teacher program through the National Park Service.
Adaptations:
Teacher Reflections:

Earth Science Date: Day 6: Climate Connections Grade(s):
This lesson was created in partnership with the Teacher-Ranger-Teacher program through the National Park Service.
Next Gen Science Standards: Students who demonstrate understanding can: HS-ESS3-6. Use a computational representation to illustrate the relationships among Earth systems and
how those relationships are being modified due to human activity.
SCIENCE AND ENGINEERING 5. Using mathematics and computational thinking 6. Constructing explanations and designing solutions
DISCIPLINARY CORE IDEAS ESS3.C: Human Impacts ESS3.D: Global Climate Change
CROSS-CUTTING CONCEPTS 4. Systems and system models 7. Stability and change
Instructional Objective(s): Students will be able to:
1. Give at least one example of how climate change is impacting wildlife. 2. State why National Parks are important to climate science.
Prerequisite Concepts and Skills: Prerequisite Concepts National Park Service background information Vocabulary thermoregulation, greenhouse effect, biological extinction, model, local, regional, renewable resources, nonrenewable resources, irreplaceable resources,
Materials and Resources:
Teacher Students Skype/Facetime/Google+ hangout with webcam Procedure 6.1 (NPS provided)
Lesson Activities: 58 min

Earth Science Date: Day 6: Climate Connections Grade(s):
This lesson was created in partnership with the Teacher-Ranger-Teacher program through the National Park Service.
Teacher Activities Student Activities Time: Introduction: 1. Display DoNow. 2. Take Attendance.
1. DoNow – Describe some ways animals will respond to climate change.
5 min
New Content: 1. Display a video: Options: 1. See if the park giving the virtual lesson has a podcast for you to watch. 2. Show a podcast from the list in extensions. 2. Monitor student progress. 3. Guide students in creating questions for skype session. 4. Set up video chat with NPS.
1. Watch the video Pika in Peril. 2. Discuss the video as a class. 3. With a partner, write 5 questions about the climate science being studied at a National Park. 4. Ask questions and record answers with NPS staff via video chat.
5 min 5 min 10 min 30 min
Wrap-up: 1. Monitor students as they complete exit tickets. 2. Dismiss students.
Exit ticket – Why are National Parks important to climate science and why is climate science important to the National Park Service?
3 min
Organizational and/or Behavioral Management Strategies:
Assessment and Evaluation:
Extensions: If you aren’t able to schedule a virtual field trip, play NPS podcasts or videos on climate change instead. Video—Great Smokey Mountains National Park: Phenology and Citizen Science http://nature.nps.gov/multimedia/CCRP_Phenology1/index.cfm Podcast—Devils Postpile National Monument :Cold Air Pooling http://www.nps.gov/depo/photosmultimedia/videos.htm Video—Rocky Mountains National Park: Pika in Peril http://video.nationalgeographic.com/video/news/animals-news/pika-in-peril-missions-wcvin/
Adaptations:
Teacher Reflections:

Earth Science Date: Day 7: Project Preparation Grade(s):
This lesson was created in partnership with the Teacher-Ranger-Teacher program through the National Park Service.
Next Gen Science Standards: Students who demonstrate understanding can: HS-ESS3-5. Analyze geoscience data and the results from global climate models to make an evidence-
based forecast of the current rate of global or regional climate change and associated future impacts to Earth systems.
HS-LS2-7. Design, evaluate, and refine a solution for reducing the impacts of human activities on the environment and biodiversity.
HS-LS4-6. Create or revise a simulation to test a solution to mitigate adverse impacts of human activity on biodiversity.
SCIENCE AND ENGINEERING 3. Planning and carrying out investigations 4. Analyzing and interpreting data 5. Using mathematics and computational thinking 6. Constructing explanations and designing solutions
DISCIPLINARY CORE IDEAS ESS3.D: Global Climate Change LS2.C: Ecosystem Dynamics, Functioning, and Resilience LS4.C: Adaptation
CROSS-CUTTING CONCEPTS 2. Cause and Effect: Mechanism and explanation 7. Stability and change
Instructional Objective(s): Students will be able to:
1. Create a product that conveys climate change information and possible solutions.
Prerequisite Concepts and Skills: None

Earth Science Date: Day 7: Project Preparation Grade(s):
This lesson was created in partnership with the Teacher-Ranger-Teacher program through the National Park Service.
Materials and Resources:
Teacher Students Project assignment sheet (NPS provided) Rubric (NPS provided)
Computer access
Lesson Activities: 58 min *Depending on how deeply you would like to explore the activities of the lesson, this lesson could take anywhere between one and three 58 minute sessions for all students to have a chance to present their projects. Lesson Activities: 58 min
Teacher Activities Student Activities Time: Introduction: 1. Distribute Assignment. 2. Take attendance.
DoNow: Quietly read through the assignment and decide what type of project you will complete.
5 min
New Content: 1. Monitor students as they work on their projects either individually or in groups.
1. Complete project paying attention to requirements and guidelines.
50 min
Wrap-up: 1. Assign the completion of the project for homework. 2. Dismiss students.
1. Prepare for dismissal. 3 min
Organizational and/or Behavioral Management Strategies:
Assessment and Evaluation:
Extensions:
Adaptations:
Teacher Reflections:

Earth Science Date: Day 8: Evaluations Grade(s):
This lesson was created in partnership with the Teacher-Ranger-Teacher program through the National Park Service.
Next Gen Science Standards: Students who demonstrate understanding can: HS-ESS3-5. Analyze geoscience data and the results from global climate models to make an evidence-
based forecast of the current rate of global or regional climate change and associated future impacts to Earth systems.
HS-LS2-7. Design, evaluate, and refine a solution for reducing the impacts of human activities on the environment and biodiversity.
HS-LS4-6. Create or revise a simulation to test a solution to mitigate adverse impacts of human activity on biodiversity.
SCIENCE AND ENGINEERING 4. Analyzing and interpreting data 5. Using mathematics and computational thinking 6. Constructing explanations and designing solutions
DISCIPLINARY CORE IDEAS ESS3.D: Global Climate Change LS2.C: Ecosystem Dynamics, Functioning, and Resilience LS4.C: Adaptation
CROSS-CUTTING CONCEPTS 2. Cause and Effect: Mechanism and explanation 7. Stability and change
Instructional Objective(s): Students will be able to:
1. Demonstrate learning through performance on post-assessment. 2. Complete Unit Evaluation.
Prerequisite Concepts and Skills: None

Earth Science Date: Day 8: Evaluations Grade(s):
This lesson was created in partnership with the Teacher-Ranger-Teacher program through the National Park Service.
Materials and Resources:
Teacher Students Assessment (NPS provided master copy)
Unit Evaluation (NPS provided master copy)
Lesson Activities: 58 min
Teacher Activities Student Activities Time: Introduction: 1. Instruct students to clear desks of all non-essential items for assessment. 2. Take attendance.
1. Prepare for assessment. 3 min
New Content: 1. Distribute assessment. 2. Monitor student progress.
1. Follow teacher instructions and complete assessment.
45 min
Wrap-up: 1. Collect assessments. 2. Distribute evaluations. 3. Dismiss students.
1. Turn in completed assessments. 2. Complete unit evaluation.
2 min 8 min
Organizational and/or Behavioral Management Strategies:
Assessment and Evaluation:
Extensions:
Adaptations:
Teacher Reflections:

Earth Science Teacher Resources
This lesson was created in partnership with the Teacher-Ranger-Teacher program through the National Park Service.
Teacher Resources

Earth Science Name______________ Date__________________ Climate Change Pre-Assessment
This lesson was created in partnership with the Teacher-Ranger-Teacher program through the National Park Service.
Pre-Assessment
1. Global warming is
a. an increase in the average global temperature.
b. a myth.
c. caused by a decrease in atmospheric concentration of greenhouse gasses.
d. irreversible.
2. One possible cause of global warming over the past 100 years is
a. an increase in solar output.
b. an increase in volcanic activity.
c. an increase in burning of fossil fuels.
d. an increase in land area covered by forests.
3. In California, most fresh water available during summer months for irrigation and human usage comes from
a. monsoonal rain storms.
b. snowmelt in the Sierra Nevada mountain range.
c. the Colorado River.
d. desalination of ocean water.
4. Stream flow measures
a. the volume of water that passes a given point in one second.
b. how many species of fish can be found in a given area of a stream.
c. the amount of trash that flows into the watershed.
d. how fast water is moving at a given point in a stream.
5. The amount of water stored in snow is called
a. snowpack.
b. the summer water reserve.
c. Sierra cement.
d. snow-water equivalent.
6. The atmospheric conditions at a given place and time are called
a. climate.
b. temperature.
c. weather.
d. clouds.
7. Most of the CO2 emitted into the atmosphere is due to
a. natural processes.
b. burning of fossil fuels.
c. deforestation.
d. agriculture industry.

Earth Science Name______________ Date__________________ Climate Change Pre-Assessment
This lesson was created in partnership with the Teacher-Ranger-Teacher program through the National Park Service.
8. Since the industrial revolution, most of the increase in CO2 concentration in the atmosphere is due to
a. natural processes.
b. burning of fossil fuels.
c. deforestation.
d. agriculture industry.
9. If California’s average winter temperature continues to warm, what is a potential consequence?
a. Mammoth Mountain Ski Area will close.
b. Glacial coverage in the Sierra Nevada mountain range will increase.
c. Water available during the summer for agriculture in the Central Valley will increase due to winter
storms bringing rain instead of snow.
d. The snowfall season in the Sierra Nevada mountain range will be shorter, limiting the amount of
water available for the rest of California.
Countries with the highest CO2 emissions
Country
CO2 emissions per
year (106 Tons)
(2006)
Percentage of
global total
Avg. emission
per km2 of its land
(tons)
CO2 emissions per
year (Tons per
person) (2007)
China 6,103 21.5% 636 4.9
United States 5,752 20.2% 597 19.3
Russia 1,564 5.5% 91 11.6
India 1,510 5.3% 459 1.4
Japan 1,293 4.6% 3421 9.8
Germany 805 2.8% 2254 9.6
United Kingdom 568 2.0% 2338 8.9
Canada 544 1.9% 54 16.5
South Korea 475 1.7% 4758 10.5
Italy 474 1.7% 1573 7.7
10. According to the chart above, the country with the highest CO2 emissions per km2 of land area is
a. United States
b. China
c. South Korea
d. United Kingdom

Earth Science Name______________ Date__________________ Climate Change Pre-Assessment
This lesson was created in partnership with the Teacher-Ranger-Teacher program through the National Park Service.
11. According to the chart above, the country with the highest total CO2 emissions is
a. United States
b. China
c. South Korea
d. United Kingdom
12. According to the chart above, the country with the highest CO2 emissions per person is
a. United States
b. China
c. South Korea
d. United Kingdom
13. What is one possible effect of local warming on migration patterns?
a. Migrating animals will begin their migration earlier in the spring.
b. Migrating animals will become extinct.
c. Migrating animals will move to lower elevations during the summer where the temperature is
warmer.
d. Migrating animals will stop their migration altogether.

Earth Science Name Date Worksheet 1.1 – Earth as a System
This lesson was created in partnership with the Teacher-Ranger-Teacher program through the National Park Service.
Earth as a System
Pre-video questions
1. How is the Earth unique among the other planets in our solar system?
Define each term 2. Biosphere –
3. Geosphere –
4. Atmosphere –
5. Hydrosphere –
Post-video questions
6. What does “geologically active planet” mean?
7. What is the source of the earth’s energy?
8. How does the hydrosphere influence weather?
9. What is the difference between highlands and lowlands?
10. The earth’s crust is divided into _______________.
11. Oceanic plates are being forced _______________ continental plates. This cause the ______________
plate to ____________.
Earth Science Name Date Worksheet 1.1 – Earth as a System
This lesson was created in partnership with the Teacher-Ranger-Teacher program through the National Park Service.
12. Where do most volcanoes and earthquakes occur?
13. How do weather and climate affect the biosphere?
14. In a paragraph, describe how the atmosphere, biosphere, geosphere, and hydrosphere all interact to
make up the planet we inhabit.
Earth Science Procedure 2.1—Carrying Capacity
This lesson was created in partnership with the Teacher-Ranger-Teacher program through the National Park Service.
Carrying Capacity Procedure
Background Carrying capacity is the number of living things, plants and animals, which can be supported by an area of land or water at one time. Carrying capacity is usually limited by some aspect of a species’ habitat requirements. In a particular area, only a certain amount of individuals will successfully get everything that they need in order to survive. The birth rate of a particular animal will grow exponentially until the carrying capacity is reached. The carrying capacity therefore helps keep a species in check because a population can only get so large before individuals start to die off. Procedure Show the students an empty bucket that represents a particular piece of land. The water that you put in the bucket represents the living organisms that live on that land. Once the bucket is full, it has reached its carrying capacity. Additional organisms would have to find a different piece of land to insure that they can get everything that they need to survive (food, water, shelter, and space). Brainstorm with the group different ecosystems and their characteristics. Link ecosystems back to climate. Climate plays a big role in the ecosystem—the plants and animals found in a certain ecosystem are adapted to the temperatures, moisture, etc. How are changes in climate going to affect ecosystems? What sort of changes might we see as we move into the future as climate change continues? Will the same animals be able to continue living in their same ecosystems even if the climate changes? Extension Show the Pikas in Peril video to show how we are already starting to see impacts that climate change is having on sensitive species, such as the pika.

Earth Science Name____________________ Date_________ Worksheet 2.1—Weather vs. Climate
This lesson was created in partnership with the Teacher-Ranger-Teacher program through the National Park Service.
Weather Climate
Weather and climate

Earth Science Procedure 3.1—Watershed Activity
This lesson was created in partnership with the Teacher-Ranger-Teacher program through the National Park Service.
Watershed Activity Procedure
Background Information The areas in and around Mammoth Lakes have a unique hydrologic story. Due to the topography of the Eastern Sierra Mountains, water either ends up traveling west towards the San Francisco Bay or east to Los Angeles. The hydrologic divide, which can be seen at the Minaret Vista, is the imaginary line that separates the two flows. Water that falls in the town of Mammoth Lakes goes east while water that falls in Devils Postpile National Monument heads west. The middle fork of the San Joaquin River (SJR) starts at Thousand Island Lake and continues south where it passes through Devils Postpile National Monument. Later the middle fork converges with the north and south forks continuing roughly northwest to the Central Valley. Most of the surface water in the upper (SJR) is stored and diverted at Millerton Lakes’ Friant Dam, near Fresno. From Friant Dam, water is pumped north through the Madera Canal and south through the Friant-Kern canal to irrigation districts and other water retailers, which then delivers the water to end users in the southern portion of the watershed. Water flowing in the (SJR) rarely ends up all the way to the San Francisco Bay because there is such a need in the Central Valley, specifically for crop irrigation. The 400-mile-long Central Valley supplies fully one-quarter of the food that America eats. Water that falls into the Owens River draining into Crowley Lake flows through Owens Valley, the arid basin between the eastern slope of the Sierra Nevada and the Inyo and White Mountains. The Owens Valley watershed consists of several sub-watersheds (Mono Basin, Upper Owens, Owens Gorge, Middle Owens, Lower Owens, and Owens Lake). The river, until recently, terminated at Owens Lake due to the diversion of the LA aqueduct to Los Angeles to help provide essential drinking water to southern California residences. The first LA aqueduct was completed in 1913 and the second in 1970. In winter 2006, the Los Angeles Department of Water and Power restored 5% of the pre-aqueduct flow to the river, by court order, allowing the Owens River Gorge, the river bed in the valley, and Owens Lake to contain a small amount of water. Both watersheds are essential not only to the residences of Mammoth Lakes or to California as a whole, but to the entire United States because of its agricultural purpose. Both watersheds are also examples of things that can go wrong when all or most of the water is depleted. Devastation especially to fish and amphibian populations are two of the many side effects that can be observed from water diversion. Wetlands provide many natural services from a rest spot for migratory birds to acting as a sponge, cleaning river water as it flows by. Humans should strive to find a balance between meeting the needs of the people and of the habitat so that neither one suffers.

Earth Science Procedure 3.1—Watershed Activity
This lesson was created in partnership with the Teacher-Ranger-Teacher program through the National Park Service.
Procedure
Encourage students to use additional maps and resources to label as many points on the map that they can. By connecting the pictures of mountains together, they create the hydrologic divide. Have them highlight this line using a marker or highlighter. Point Labels:
1. Thousand Island Lake
2. Devils Postpile National Monument
3. Middle Fork of the San Joaquin River
4. Owens River
5. Crowley Lake
After labeling all points and tracing the hydrologic divide, students will be able to see the two watersheds in this area and understand where each one flows to.

Earth Science Name Date Worksheet 3.1—Watershed Activity
This unit was created in partnership with the Teacher-Ranger-Teacher program through the National Park Service.

Earth Science Procedure 4.1—Historic Stream Flow Data
This lesson was created in partnership with the Teacher-Ranger-Teacher program through the National Park Service.
Historic Stream Flow Data Procedure
This data is from 1960-2013 from Pohono Bridge in Yosemite Valley. Optional activities for the data include having students graph in Excel, identify the months with the highest average stream flow, look for outliers/abnormalities, identify the year with the highest total stream flow, find patterns and trends, and make predictions/hypothesis about why the trends exists or what could happen in the future. Use the Excel spreadsheet labeled ‘Stream Flow Data’ to find the monthly averages and example graphs.

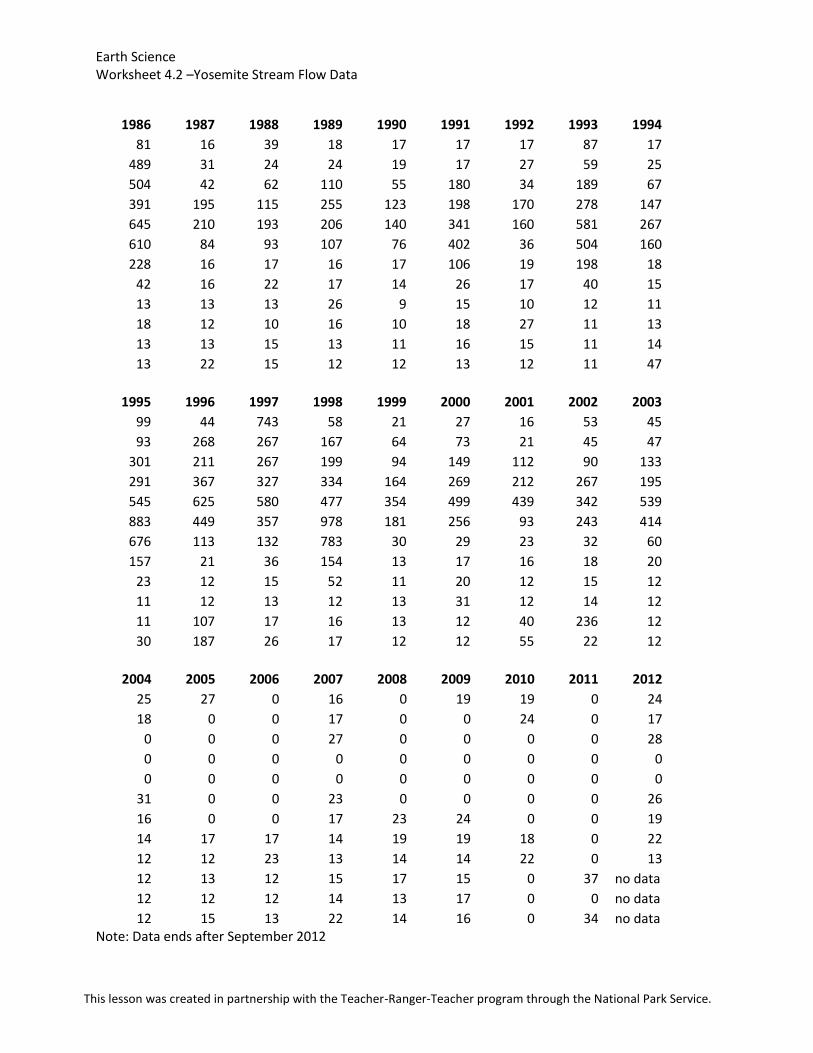
Earth Science Worksheet 4.2 –Yosemite Stream Flow Data
This lesson was created in partnership with the Teacher-Ranger-Teacher program through the National Park Service.
Sequoia-Kings Canyon Stream Flow Data
1960 1961 1962 1963 1964 1965 1966 1967
January 2 0.4 3 135 1 157 27 139
February 27 1 117 383 1 81 25 140
March 61 13 49 90 24 76 81 227
April 183 88 422 212 130 205 220 250
May 236 120 368 528 270 359 265 774
June 116 64 447 517 196 456 102 885
July 2 1 109 232 14 218 24 740
August 1 5 2 22 3 50 20 203
September 2 4 2 2 9 10 12 61
October 1 1 3 2 11 10 11 10
November 2 1 1 29 19 51 46 17
December 2 1 3 2 184 29 732 18
1968 1969 1970 1971 1972 1973 1974 1975 1976
25 462 168 40 18 20 98 18 15
48 274 63 33 19 59 42 30 17
69 294 103 72 83 94 181 71 33
156 546 151 131 92 245 257 80 64
259 1178 450 243 157 858 567 545 171
141 1087 269 302 77 715 516 550 27
25 672 48 66 16 161 101 96 18
21 183 17 18 11 23 23 17 17
12 22 12 12 15 13 14 11 45
27 21 11 13 18 12 14 30 13
15 14 30 15 12 31 18 12 12
23 27 25 20 18 25 15 16 10
1977 1978 1979 1980 1981 1982 1983 1984 1985
14 80 40 528 17 74 202 107 30
17 158 53 430 33 131 316 98 41
22 272 31 292 53 169 413 151 69
68 283 211 465 209 630 284 209 323
79 665 555 513 297 675 811 537 395
98 869 299 765 176 558 1271 226 232
17 426 56 501 17 336 786 99 24
17 94 17 101 16 79 354 22 14
9 123 12 7 11 157 73 10 9
12 12 29 13 12 125 19 15 11
11 11 12 12 38 145 137 51 25
72 12 17 16 32 215 192 20 88
Earth Science Worksheet 4.2 –Yosemite Stream Flow Data
This lesson was created in partnership with the Teacher-Ranger-Teacher program through the National Park Service.
1986 1987 1988 1989 1990 1991 1992 1993 1994
81 16 39 18 17 17 17 87 17
489 31 24 24 19 17 27 59 25
504 42 62 110 55 180 34 189 67
391 195 115 255 123 198 170 278 147
645 210 193 206 140 341 160 581 267
610 84 93 107 76 402 36 504 160
228 16 17 16 17 106 19 198 18
42 16 22 17 14 26 17 40 15
13 13 13 26 9 15 10 12 11
18 12 10 16 10 18 27 11 13
13 13 15 13 11 16 15 11 14
13 22 15 12 12 13 12 11 47
1995 1996 1997 1998 1999 2000 2001 2002 2003
99 44 743 58 21 27 16 53 45
93 268 267 167 64 73 21 45 47
301 211 267 199 94 149 112 90 133
291 367 327 334 164 269 212 267 195
545 625 580 477 354 499 439 342 539
883 449 357 978 181 256 93 243 414
676 113 132 783 30 29 23 32 60
157 21 36 154 13 17 16 18 20
23 12 15 52 11 20 12 15 12
11 12 13 12 13 31 12 14 12
11 107 17 16 13 12 40 236 12
30 187 26 17 12 12 55 22 12
2004 2005 2006 2007 2008 2009 2010 2011 2012
25 27 0 16 0 19 19 0 24
18 0 0 17 0 0 24 0 17
0 0 0 27 0 0 0 0 28
0 0 0 0 0 0 0 0 0
0 0 0 0 0 0 0 0 0
31 0 0 23 0 0 0 0 26
16 0 0 17 23 24 0 0 19
14 17 17 14 19 19 18 0 22
12 12 23 13 14 14 22 0 13
12 13 12 15 17 15 0 37 no data
12 12 12 14 13 17 0 0 no data
12 15 13 22 14 16 0 34 no data Note: Data ends after September 2012

Earth Science Worksheet 4.2 –Yosemite Stream Flow Data
This lesson was created in partnership with the Teacher-Ranger-Teacher program through the National Park Service.
Yosemite Stream Flow Data
1960 1961 1962 1963 1964 1965 1966 1967
Jan 26 42 67 127 98 556 150 231
Feb 107 114 249 1001 114 427 144 232
March 359 183 229 345 174 474 462 631
April 1137 786 1826 575 679 1030 1568 488
May 1449 1003 2015 2519 1442 2410 1888 2807
June 788 631 2355 2478 984 2553 564 4239
July 147 115 661 898 218 1140 153 2533
August 40 67 125 185 63 409 80 518
Sept 19 26 39 68 23 91 22 156
Oct 19 20 53 47 17 41 17 58
Nov 43 25 32 238 114 211 95 44
Dec 69 62 36 157 1348 166 493 76
1968 1969 1970 1971 1972 1973 1974 1975 1976
96 493 580 257 140 189 411 106 57
268 338 380 309 161 203 267 152 79
325 409 528 379 715 240 535 290 196
868 1624 805 860 744 1001 966 361 385
1289 5305 2224 1771 1762 3711 3229 2799 911
619 4052 1501 2035 1209 2256 2330 3389 240
115 1587 395 570 196 398 535 712 93
44 316 80 117 49 187 195 127 55
18 83 29 40 158 34 42 67 86
25 127 18 25 69 44 31 211 40
214 122 103 87 104 508 42 184 21
135 212 212 127 193 304 69 94 15
1977 1978 1979 1980 1981 1982 1983 1984 1985
17 222 303 967 53 327 358 522 136
28 244 215 666 175 934 411 412 168
52 603 457 527 212 647 625 697 260
343 928 948 1411 1009 2136 595 1207 1394
379 3196 3341 2644 1668 3858 3223 2939 1747
537 4039 1746 3012 841 3031 6308 1518 687
69 1724 390 1549 148 1476 3460 595 161
15 396 94 288 39 427 1045 170 59
7 426 36 79 21 358 322 83 57
6 64 78 43 52 436 204 82 114
16 52 107 42 327 418 573 182 97
132 85 117 57 304 379 672 152 211

Earth Science Worksheet 4.2 –Yosemite Stream Flow Data
This lesson was created in partnership with the Teacher-Ranger-Teacher program through the National Park Service.
1986 1987 1988 1989 1990 1991 1992 1993 1994
316 28 171 89 74 18 73 240 37
1035 72 239 150 105 21 172 232 61
1459 163 474 691 409 225 290 723 274
1724 1012 881 1623 1103 626 1185 1405 787
3129 1127 1115 1535 901 1690 1165 3713 1188
2743 430 640 943 558 1674 386 2932 554
682 94 189 190 239 370 316 1109 97
185 36 63 56 44 52 51 220 26
65 23 33 69 20 27 30 66 12
53 49 14 103 18 26 19 33 87
30 171 31 86 19 98 66 27 197
26 116 59 83 17 58 70 35 179
1995 1996 1997 1998 1999 2000 2001 2002 2003
379 225 2461 175 174 90 45 228 264
445 775 557 284 310 217 85 237 277
1017 760 936 615 378 420 526 380 508
1439 1706 1637 1023 919 1497 1033 1639 866
3067 3126 2922 2096 2948 2997 2348 2091 2724
4822 1897 1511 4699 1928 1874 431 1243 2209
3398 636 426 3110 403 325 130 205 361
783 156 137 531 95 31 36 40 121
203 49 54 234 46 44 20 22 46
57 32 29 76 25 29 14 16 20
35 356 32 99 31 45 90 246 27
152 514 65 156 26 43 185 112 137
2004 2005 2006 2007 2008 2009 2010 2011 2012
175 315 557 75 73 309 158 515 81
195 364 506 145 147 328 219 461 109
1035 636 578 529 444 715 460 658 275
1549 1163 1456 891 1164 1573 970 1702 1332
1621 4411 4771 1103 2222 3074 2022 2983 1396
785 3467 3682 300 1227 1228 3460 4433 344
186 1463 1113 81 270 400 965 2231 94
45 232 180 29 40 72 121 473 64
19 59 62 24 15 27 36 153 22
76 39 40 17 15 226 335 184 16
168 48 44 17 198 62 323 69 43
142 408 56 22 77 80 625 41 300

Earth Science Worksheet 4.2 –Yosemite Stream Flow Data
This lesson was created in partnership with the Teacher-Ranger-Teacher program through the National Park Service.
0
1000
2000
3000
4000
5000
6000
Jan Feb March April May June July August Sept Oct Nov Dec
1960-1969 Stream Discharge ft3/s Pohono Bridge, Yosemite Valley
1960 1961 1962 1963 1964
1965 1966 1967 1968 1969
0
500
1000
1500
2000
2500
3000
3500
4000
4500
Jan Feb March April May June July August Sept Oct Nov Dec
1970-1979 Stream Discharge ft3/s Pohono Bridge, Yosemite Valley
1970 1971 1972 1973 1974
1975 1976 1977 1978 1979

Earth Science Worksheet 4.2 –Yosemite Stream Flow Data
This lesson was created in partnership with the Teacher-Ranger-Teacher program through the National Park Service.
0
1000
2000
3000
4000
5000
6000
7000
Jan Feb March April May June July August Sept Oct Nov Dec
1980-1989 Stream Discharge ft3/s Pohono Bridge, Yosemite Valley
1980 1981 1982 1983 1984
1985 1986 1987 1988 1989
0
1000
2000
3000
4000
5000
6000
Jan Feb March April May June July August Sept Oct Nov Dec
1990-1999 Stream Discharge ft3/s Pohono Bridge, Yosemite Valley
1990 1991 1992 1993 1994
1995 1996 1997 1998 1999

Earth Science Worksheet 4.2 –Yosemite Stream Flow Data
This lesson was created in partnership with the Teacher-Ranger-Teacher program through the National Park Service.
0
1000
2000
3000
4000
5000
6000
Jan Feb March April May June July August Sept Oct Nov Dec
2000-2009 Stream Discharge ft3/s Pohono Bridge, Yosemite Valley
2000 2001 2002 2003 2004
2005 2006 2007 2008 2009

Earth Science Procedure 5.1—Stream Flow
Text and images on pages 1 and 2 of this activity are used with permission from the University of Wisconsin Extension and the Wisconsin Department of Natural Resources.
Stream Flow Procedure
Why are we concerned? Stream flow, or discharge, is the volume of water moving past a cross-section of a stream over a set period of time. It is usually measured in cubic feet per second (cfs). Stream flow is affected by the amount of water within a watershed, increasing with rainstorms or snowmelt, and decreasing during dry periods. Flow is also important because it defines the shape, size and course of the stream. It is integral not only to water quality, but also to habitat. Food sources, spawning areas and migration paths of fish and other wildlife are all affected and defined by stream flow and velocity. Velocity and flow together determine the kinds of organisms that can live in the stream (some need fast-flowing areas; others need quiet, low-velocity pools). Different kinds of vegetation require different flows and velocities, too. Stream flow is affected by both forces of nature and by humans. In undeveloped watersheds, soil type, vegetation, and slope all play a role in how fast and how much water reaches a stream. In watersheds with high human impacts, water flow might be depleted by withdrawals for irrigation, domestic or industrial purposes. Dams used for electric power generation may affect flow, particularly during periods of peak need when stream flow is held back and later released in a surge. Drastically altering landscapes in a watershed, such as with development, can also change flow regimes, causing faster runoff with storm events and higher peak flows due to increased areas of impervious surface. These altered flows can negatively affect an entire ecosystem by upsetting habitats and organisms dependent on natural flow rates. Tracking stream flow measurements over a period of time can give us baseline information about the stream’s natural flow rate.
Safety considerations You will need to enter the stream channel to make width and depth measurements and to calculate velocity. Be aware of stream velocity, water depth, and bottom conditions at your stream-monitoring site. Do not attempt to measure stream flow if water velocity appears to be fast enough to knock you down when you are working in the stream. If you are unsure of water depth across the width of the stream, be sure to proceed with caution as you move across the stream, or choose an alternate point from which to measure stream flow.
DEFINITION OF TERMS Discharge: Another term for stream flow, or the volume of water moving past a designated point over a set period of time. Flow Regime: The pattern of stream flow over time, including increases with stormwater runoff inputs and decreases to a base-flow level during dry periods. Impervious Surface: A surface that does not allow water (e.g., rain) to pass through (infiltrate). Rating Curve: A graphical representation of the relationship between the stage height and the discharge (flow). Run: An area of a stream that has swift water flow and is slightly deeper than a riffle (a run will be about knee/thigh deep). Stage Height: Height of the water in a stream above a baseline. Watershed: An area of land that drains to a main water body.

Earth Science Procedure 5.1—Stream Flow
Text and images on pages 1 and 2 of this activity are used with permission from the University of Wisconsin Extension and the Wisconsin Department of Natural Resources.
Determining Stream Flow (Area x Velocity = Flow) The method you are going to use in determining stream flow is known as a velocity-area approach. The task is to find out the volume of water in a 20-ft. (at least) section of stream by determining both the stream’s velocity and the area of the stream section. You will first measure the width of the stream, and then measure water depth at a number of locations across the width to find the average depth at your monitoring site. Then by multiplying the average depth by the width, you can determine the average cross-sectional area (ft2) of the stream. Water velocity (ft/sec) is determined simply by measuring the number of seconds it takes a float to travel along the length of stream you are studying. Since water velocity varies at different depths, (surface water moves more quickly than subsurface water because water moving against rough bottom surfaces is slowed down by friction) you will need to multiply velocity by a correction factor to adjust your measurement to account for the effect of friction. The actual equation you will use to determine flow is this: Flow=Area x Corrected Velocity. This method was developed and adapted from several sources (see bibliography). Alternative methods that may be better
for your monitoring site are featured in the sidebar below.
Stream Flow Monitoring Methods: Professional and Home-Made The type of monitoring station used by professionals depends on the conditions at the site including size, slope, accessibility, and sedimentation of the stream. Flow can also be measured at spillways, dams, and culverts or by using a weir or flume, which are man-made structures within a stream that provide a fixed stage-flow relation. Another method, using a home-made combination staff/crest gage, allows volunteer monitors to measure the water level (stage) both at the time of inspection and at the highest level reached since last inspected. This tool is made of PVC pipe, granulated cork and other materials. For more information, including how to make your own, visit: www.epa.gov/owow/monitoring/volunteer/newsletter/volmon07no2.pdf

Earth Science Name Date Worksheet 5.1—Measuring and Calculating Stream Flow
This lesson was created in partnership with the Teacher-Ranger-Teacher program through the National Park Service.
Measuring and Calculating Stream Flow
Materials 2 flags to mark the start and end of the stream monitoring section Measuring Tape Orange or other float device Appropriate footwear (boots, waders, or water
shoes)
Personal Flotation Device (when requested by teacher)
Stopwatch Calculator
Safety DO NOT ENTER A STREAM THAT IS MOVING FAST OR IF THE WATER LEVEL IS ABOVE YOUR THIGH. IF AT ANY TIME YOU
FEEL YOU MAY LOSE YOUR BALANCE, EXIT THE STREAM. IF REQUESTED BY YOUR TEACHER, WEAR A PERSONAL FLOTATION DEVICE. WEAR APPROPRIATE FOOTWEAR IN AND OUT OF THE STREAM.
Procedure Set-up
1. Locate a straight section of stream at least 20 feet long. Mark the start and end of the length of stream with
flags.
2. Measure the width of the stream and record data in Table 1.1
3. Measure the depth (in tenths of an inch) of the stream at 1 foot intervals. Record data in Table 1.2
4. Observe the bottom of the stream. Circle below the best description of the stream bottom.
1. Rough, loose rocks, coarse gravel, weeds
2. Smooth mud, sand, bedrock
Measuring Velocity 5. Release your float 3-4 feet upstream of the “Start” flag.
6. Measure the time it takes for the float to travel the distance between flags. With the students in small
groups, have one student in the water ready to release the float object, one on shore watching the starting
line, another watching the finish line, one using the stop watch, and all others in the water behind the finish
line to catch the object. Only time the distance between flags. Record in data Table 1.1
7. Repeat step 4 and 5 at three additional locations across the stream. Record data in Table 1.1
Data and Calculations Table 1.1
Width of Stream Float Distance Measured
Time to travel distance
Location 1
Location 2
Location 3
Location 4
Average Travel Time
Earth Science Name Date Worksheet 5.1—Measuring and Calculating Stream Flow
This lesson was created in partnership with the Teacher-Ranger-Teacher program through the National Park Service.
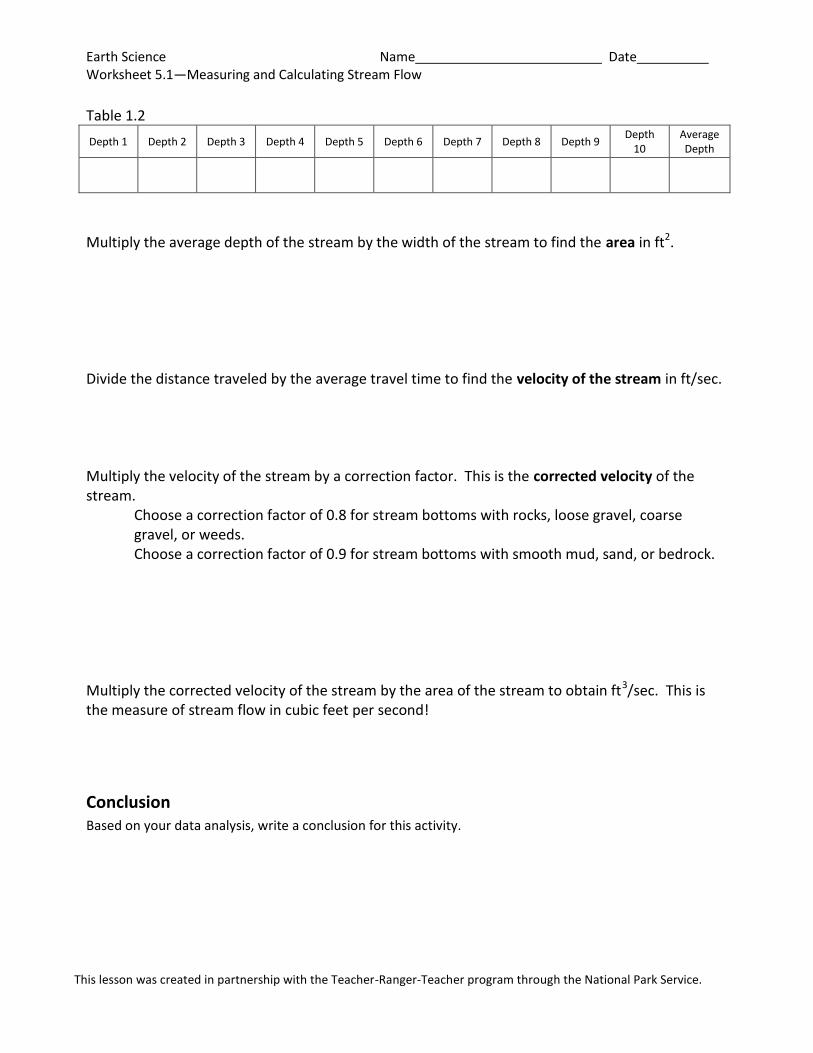
Table 1.2
Depth 1 Depth 2 Depth 3 Depth 4 Depth 5 Depth 6 Depth 7 Depth 8 Depth 9 Depth
10 Average Depth
Multiply the average depth of the stream by the width of the stream to find the area in ft2. Divide the distance traveled by the average travel time to find the velocity of the stream in ft/sec. Multiply the velocity of the stream by a correction factor. This is the corrected velocity of the stream.
Choose a correction factor of 0.8 for stream bottoms with rocks, loose gravel, coarse gravel, or weeds. Choose a correction factor of 0.9 for stream bottoms with smooth mud, sand, or bedrock.
Multiply the corrected velocity of the stream by the area of the stream to obtain ft3/sec. This is the measure of stream flow in cubic feet per second!
Conclusion Based on your data analysis, write a conclusion for this activity.

Earth Science Procedure 6.1—Virtual Field Trip
This lesson was created in partnership with the Teacher-Ranger-Teacher program through the National Park Service.
Virtual Field Trip Procedure
Contact park at least 2 month prior to your program.
Discuss topic and desired content with park staff.
Make sure that either Google Plus or Skype are set up on your computer.
Double check contact information for park’s account and that both parties have added each other prior to the session.
Google Plus
Open Google email: make sure that you have sent an email back and forth with the teacher. Go to the “search people” box right above your contacts and search for the name of the teacher. Once found, move your mouse over the name and select the option to “show in chat list.” You will then have to click on “invite to chat” in the same window. The teacher on the other end has to accept your chat invitation before you can video call them. They will get an announcement right above their contact list saying “____ wants to be able to chat with you. Okay? Yes/no.”
Place call to audience: click on the name of the user in your contact list and a small chat window will pop up at the bottom of your screen. In this window, you’ll have an option to click on the video camera to send a video chat request.
Skype Open Skype: Double-click on the Skype icon. Enter your user id and password at the applicable prompts.
Make sure you are online: You will see a green circle with a checkmark as well as the word “online” in the lower left corner of the Skype window.
Place Call to Audience: To connect with a Skype user, either double-click on the user name or highlight the user name and click the green telephone icon on the bottom of the window.
Start Video: When the person answers the Skype call, “Start my Video” so that the user can see your video.
Using Chat: Place your cursor in the text box at the bottom of the chat window and start typing your message; then click “Enter” on your keyboard. You will then see your chat message display under a gray heading. The person on the other end will reply and their text will display under a blue heading. The chat feature is very useful if you are having microphone issues as you can communicate with the user via text.
Test video: Once you are sure that your audio is working properly, make sure that your video is working.
Earth Science Procedure 6.1—Virtual Field Trip
This lesson was created in partnership with the Teacher-Ranger-Teacher program through the National Park Service.
Select Tools -> Options -> Video Settings and you should see your video on the right side of the window.
Test your audio: Once you are online, ensure that your headset/microphone is working properly. Double click on the “Skype Test Call” and follow the automated operator’s instructions. You can then adjust volume and re-test (if necessary). If your audio is not working, open the Tools->Options->Audio Settings in the Skype window. Ensure that the microphone is the “Windows Default Device”; then, click “Save”. If your audio is still not working, reboot your computer. Upon rebooting, you may see a screen that requires you to select “microphone” and then click on “Okay.” You can now re-test your audio.

Earth Science Project Assignment
This lesson was created in partnership with the Teacher-Ranger-Teacher program through the National Park Service.
Climate Change Project Assignment
Imagine you are a scientist studying regional climate change in the Eastern Sierra. You have to present your findings to your peers and make predictions about the future. You have complete creative freedom to decide how you will present your findings. In the past, scientists have used essays, brochures, presentation software, videos, and science presentation boards. One of these options would be a good possibility.
Assignment: Demonstrate mastery of your understanding of the effects of climate change through completion and presentation of a project. Your project must include:
1. Evidence for local climate change.
2. Your lab report from the stream assessment activity.
3. A connection to the larger community, i.e. how climate in the Eastern Sierra affects California,
United States, and the world.
4. Your prediction of potential consequences if the climate continues to change at its current rate.
5. A section presenting “What you can do” to minimize the negative effects of climate change.
6. A 5 minute presentation to your peers.

Project Rubric
This lesson was created in partnership with the Teacher-Ranger-Teacher program through the National Park Service.
4- Meets all expectations
3- Meets most expectations
2- Fails to meet some expectations
1- Does not meet expectations
Format
Includes at least 5
appropriate pictures, charts,
graphs, or tables.
Includes 1-2 page written
abstract.
Includes less than 2-4
pictures, charts, graphs, or
tables.
Written abstract is ¾ -1 page
in length.
Includes 1 picture, chart,
graph, or table.
Written abstract is less than
¾ of a page.
Fails to include pictures,
charts, graphs, or tables.
Fails to include a written
abstract.
Presentation
4-6 minutes long.
Appropriate presentation
method chosen.
Maintain eye contact where
appropriate.
2-4 minutes long
Appropriate presentation
method chosen.
Occasionally fails to make
eye contact.
1-2 minutes long
Fails to choose appropriate
presentation method.
Occasionally makes eye
contact
Presentation is less than 1
minute.
Fails to choose appropriate
presentation method.
No eye contact.
Evidence for climate change
Accurate climate science is
included.
Conclusions are based on
climate science data.
There are 1 or 2 minor
inaccuracies in climate
science data.
Conclusions are not based
on the included data
There are multiple
inaccuracies in climate
science data.
Conclusions are not based
on any data
Climate science data is
wrong or omitted.
Conclusions are missing.
Lab report
Includes Introduction,
Hypothesis, Materials and
Methods, Data and Analysis,
Results, and Conclusion.
Missing 1 section of the lab
report
Missing 2-3 sections of the
lab report
Lab report is incomplete or
omitted.
Local to global connections
Clear connections are mad
between local, regional, and
global climatology and
environment.
Clear connections are made
but local, regional, or global
is omitted.
Local connections are
omitted.
Local, regional, and global
connections are omitted.
Predictions and suggestions
Predictions are based on
multiple pieces of evidence
from current data.
Suggestions for “What can
you do?” could minimize the
negative effects of
predictions.
Predictions are based on 1
piece of evidence.
1 suggestion for “What can
you do?” to minimize the
effects of climate change
predictions.
Predictions are not based on
data from the project.
Suggestion does not relate to
the negative effects of
climate change predictions.
Predictions are not related to
climate change.
No suggestion is made for
“What can you do?” to
minimize the negative
effects of climate change
predictions.
Earth Science Vocabulary
This lesson was created for the Teacher-Ranger-Teacher program through the National Park Service.
1. geosphere – layer of Earth under both atmosphere and oceans; It is composed of the core, the
mantle, and the crust.
2. hydrosphere – the water portion of Earth
3. biosphere – all life on Earth; the parts of the solid Earth, hydrosphere, and atmosphere in which
living organisms can be found.
4. atmosphere – the gaseous portion of a planet; the planet’s envelope of air
5. geoscience – the sciences that deal with the earth
6. climate – the average course or condition of the weather at a place usually over a period of years as
exhibited by temperature, wind velocity, and precipitation
7. weather – the state of the atmosphere with respect to heat or cold, wetness or dryness, calm or
storm, clearness or cloudiness
8. climate change – any significant change in the climate lasting for decades or longer
9. habitat – an ecological areas that is inhabited by a particular species because they are able to find
everything that they need to survive (food, water, shelter, and space)
10. ecosystem – a community of living organisms (biotics) in conjunction with the non-living
components (abiotics) of their environment
11. arable land – land that can be used for growing crops
12. positive feedback loop – the process in which the effects of a disturbance on a system cause an
increase in the magnitude of the disturbance
13. negative feedback loop – the process in which the effects of disturbance on a system decrease its
magnitude
14. coevolution – the change in one biological object triggered by the change of a related object
15. natural resources – materials and components that can be found within the environment
16. fossil fuels –
17. renewable resources – a natural resource that can be replenished over time either through
biological reproduction or other naturally occurring processes
18. nonrenewable resources – a resource that does not renew itself at a sufficient rate for sustainable
economic extraction in meaningful human timeframes
19. irreplaceable resources – a resource that can’t be replaced
Earth Science Vocabulary
This lesson was created for the Teacher-Ranger-Teacher program through the National Park Service.
20. photosynthesis – a process used by plants and other organisms to convert light energy, from the
sun, into chemical energy that can be used to fuel the organisms’ activities
21. cellular respiration – the biochemical pathway by which cells release energy from the chemical
bonds of food molecules and provide that energy for the essential processes of life.
22. biomass – biological material derived from living, or recently living organisms
23. carbon cycle – the biochemical cycle by which carbon is exchanged among the biosphere,
pedosphere, geosphere, hydrosphere, and atmosphere of the Earth
24. biodiversity – the degree of variation between of life forms within a given species, ecosystem,
biome, or planet
25. adaptation – the ability of a species to survive in a particular ecological niche, especially because of
alterations of form or behavior brought about through natural selection
26. orbit – the gravitational curved path of an object around a point in space
27. axis of rotation – a circular movement of an object around a center of rotation
28. temporal scales – time scale
29. spatial scales – space scale
30. local – community in an immediate area
31. regional – clusters of like areas based on physical characteristics
32. global – the Earth as a whole
33. latitude – a geographic coordinate that specifies the north-south position of a point on the Earth’s
surface
34. geography – the study of lands, inhabitants, and the phenomena of the Earth
35. greenhouse effect – a process by which thermal radiation from a planetary surface is absorbed by
atmospheric greenhouse gases, and is re-radiated in all directions
36. absorption – a physical or chemical phenomenon or a process in which atoms, molecules, or ions
enter some bulk phase- gas, liquid, or solid material
37. reflection – the change in direction of a wavefront at an interface between two different media so
that the wavefront returns into the medium from which it originated
38. transmission – the act of passing something on in another place
39. redistribution – to relocate

Earth Science Vocabulary
This lesson was created for the Teacher-Ranger-Teacher program through the National Park Service.
40. thermal capacity – the quantity of heat necessary to produce a unit change of temperature in a unit
mass of a substance
41. deduce – to arrive at a fact or conclusion by reasoning
42. infer – deduce or conclude information from evidence and reasoning rather than from explicit
statements
43. predict – to foretell on the basis of observation, experience, or scientific reason
44. pattern – to repeat
45. model – a small object, usually built to scale, that represents in detail another, usually larger object
46. watershed – an area of land where all of the water that is under it or drains off of it goes into the
same place
47. solar output – the amount of radiation emitted by the sun
48. snowpack – forms from layers of snow that accumulate in geographic regions and high altitudes
where the climate includes cold weather for extended periods of time throughout the year
49. snow-water equivalent – the amount of water contained within the snowpack
Earth Science Student Evaluation
This lesson was created for the Teacher-Ranger-Teacher program through the National Park Service.
Student Evaluation
Student Name _________________ Teacher Name _________________ Class or Section ___ Period 1 ___Period 2 ___Period 3 ___Period 4 ___Period 5 ___Period 6 This unit was directly related to our course curriculum. (1-strongly disagree, 4-strongly agree) 1 2 3 4 I learned new information about climate change. 1 2 3 4 The unit was relevant to my life. 1 2 3 4 My teacher explained necessary vocabulary so I could understand the content. 1 2 3 4 There were enough hands-on activities in this unit. 1 2 3 4 The hands-on activities in this unit were directly related to the content we studied. 1 2 3 4 I can now use stream flow data to provide evidence for climate change. 1 2 3 4 I could safely measure stream flow without assistance from a teacher. 1 2 3 4 I can explain to friends and family how National Parks are “science labs” for climate change. 1 2 3 4

Earth Science Student Evaluation
This lesson was created for the Teacher-Ranger-Teacher program through the National Park Service.
I have a better understanding of Devils Postpile National Monument. 1 2 3 4 This unit has increased my interest in National Parks. 1 2 3 4 I now know about climate science measurements in at least one other National Park. 1 2 3 4 The onsite visit to Devils Postpile was educational and clearly connected to the content in this unit. 1 2 3 4 I would recommend this unit to be taught to other classes similar to mine. 1 2 3 4

Earth Science Teacher Evaluation
This lesson was created for the Teacher-Ranger-Teacher program through the National Park Service.
Teacher Evaluation
Teacher Name:________________________________________ Grade:_____________________ School:___________________________ Mark one per row.
Highly (4) Effective
Effective (3) Developing (2) Ineffective (1)
Lesson Plan
Creative, relevant, builds knowledge base, includes all essential elements
Useful activities, objectives, etc
Missing one element
Missing essential elements
Standards Correlation
Standards-born lesson incorporating common core standards for science
Connects to skills in science common core standards
Missing parts of the common core standards
Does not correlate to standards
Materials
Above and beyond needed materials
Sufficient materials
Most required materials available
Some materials needed
Reaching toward unit objectives
Lessons directly promote skills and understanding linking to unit
Lessons promote some unit skills
Lessons promote learning but not necessarily in relation to unit objectives
Does not tie into unit goals
1-strongly disagree 4-Strongly agree This unit was grade-level appropriate. 1 2 3 4 The unit aligns with the science common core standards. 1 2 3 4 Within the lesson plans, the objectives were clear. 1 2 3 4 Within the lesson plans, the procedure was clear and easy to follow. 1 2 3 4 Students were receptive and enjoyed the unit. 1 2 3 4

Earth Science Teacher Evaluation
This lesson was created for the Teacher-Ranger-Teacher program through the National Park Service.
I would be interested in having Devils Postpile National Monument mail me the needed materials, even if I had to pay my own postage to send it back. 1 2 3 4 Which parts of the unit were the most useful? Which parts of the unit did you use? What did you like least from the unit? What other resources could help make this unit work? What was the most effective part of this lesson?
What would you change or improve upon if you taught this again? How did you receive feedback from students? (Used student evaluations, took a class poll, etc) Comments: