Embed Size (px)
Citation preview
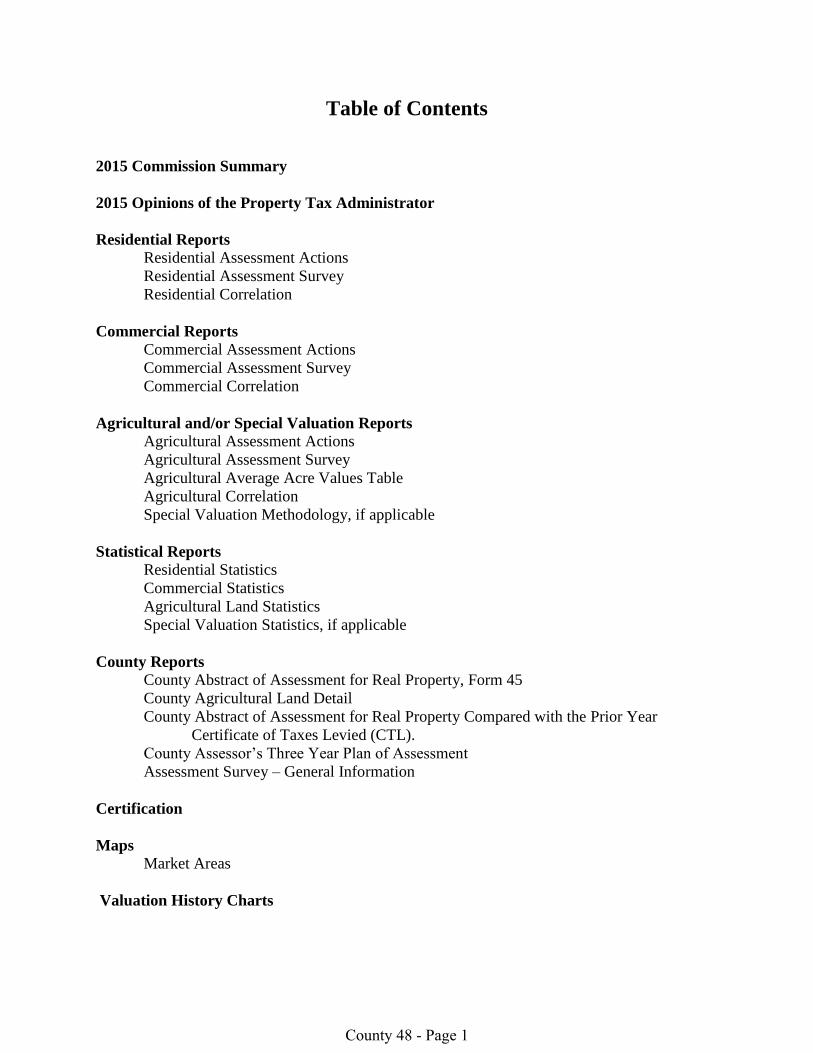
Table of Contents
2015 Commission Summary
2015 Opinions of the Property Tax Administrator
Residential Reports
Residential Assessment Actions
Residential Assessment Survey
Residential Correlation
Commercial Reports
Commercial Assessment Actions
Commercial Assessment Survey
Commercial Correlation
Agricultural and/or Special Valuation Reports
Agricultural Assessment Actions
Agricultural Assessment Survey
Agricultural Average Acre Values Table
Agricultural Correlation
Special Valuation Methodology, if applicable
Statistical Reports
Residential Statistics
Commercial Statistics
Agricultural Land Statistics
Special Valuation Statistics, if applicable
County Reports
County Abstract of Assessment for Real Property, Form 45
County Agricultural Land Detail
County Abstract of Assessment for Real Property Compared with the Prior Year
Certificate of Taxes Levied (CTL).
County Assessor’s Three Year Plan of Assessment
Assessment Survey – General Information
Certification
Maps
Market Areas
Valuation History Charts
County 48 - Page 1

Su
mm
ary
County 48 - Page 2
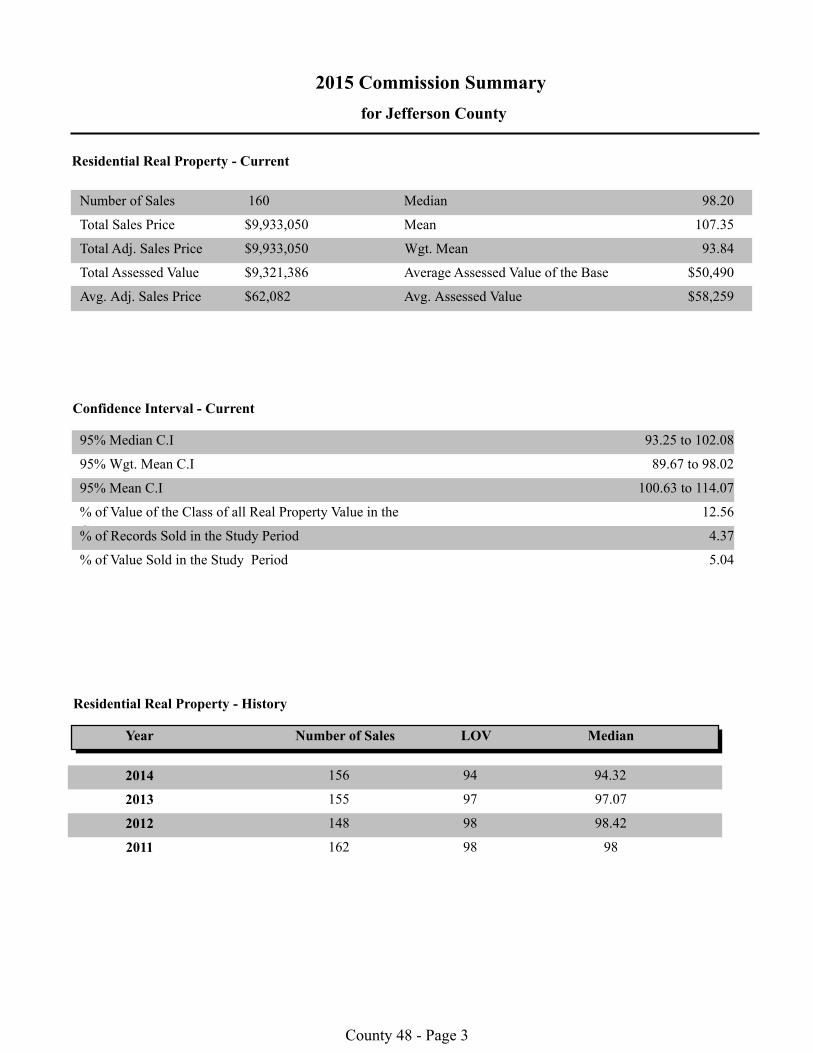
2015 Commission Summary
for Jefferson County
Residential Real Property - Current
Number of Sales
Total Sales Price
Total Adj. Sales Price
Total Assessed Value
Avg. Adj. Sales Price Avg. Assessed Value
Median
Wgt. Mean
Mean
95% Median C.I
95% Wgt. Mean C.I
95% Mean C.I
93.25 to 102.08
89.67 to 98.02
100.63 to 114.07
% of Value of the Class of all Real Property Value in the
County % of Records Sold in the Study Period
% of Value Sold in the Study Period
Average Assessed Value of the Base
12.56
4.37
5.04
$50,490
Residential Real Property - History
Year
2014
2013
2011
Number of Sales LOV
Confidence Interval - Current
Median
2012
160
107.35
98.20
93.84
$9,933,050
$9,933,050
$9,321,386
$62,082 $58,259
98 162 98
98.42 98 148
97 97.07 155
94.32 156 94
County 48 - Page 3
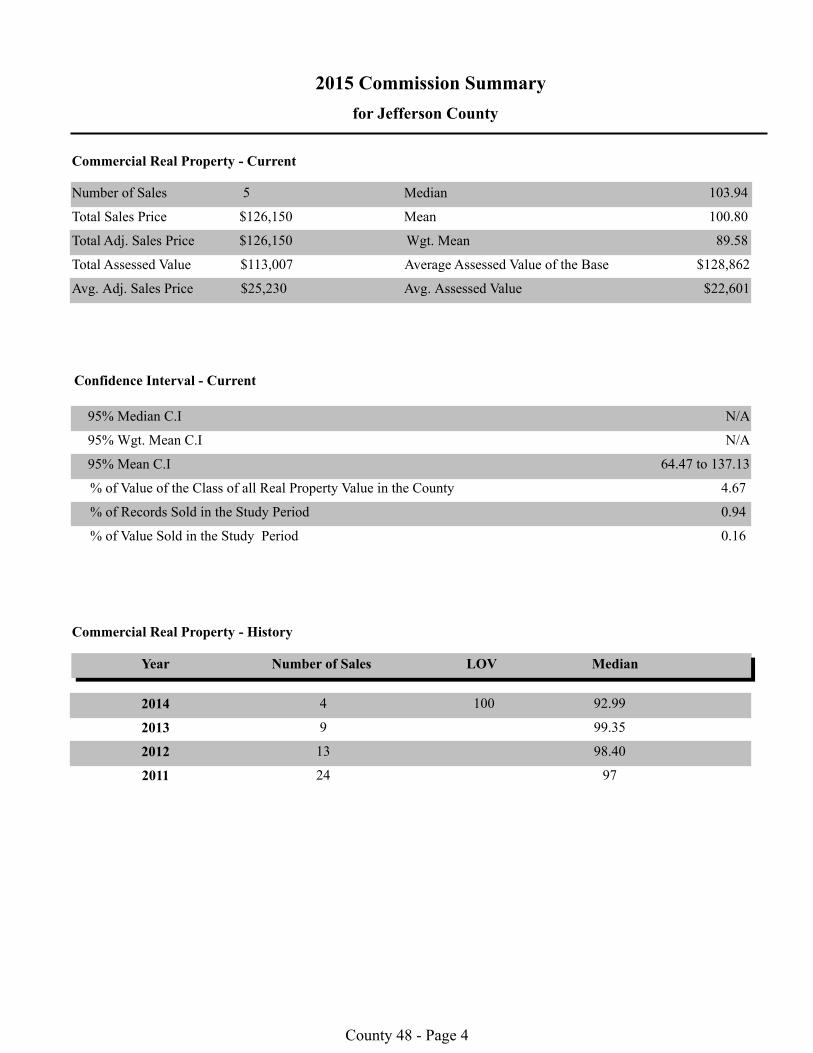
2015 Commission Summary
for Jefferson County
Commercial Real Property - Current
Number of Sales
Total Sales Price
Total Adj. Sales Price
Total Assessed Value
Avg. Adj. Sales Price Avg. Assessed Value
Median
Wgt. Mean
Mean
95% Median C.I
95% Wgt. Mean C.I
95% Mean C.I
% of Value of the Class of all Real Property Value in the County
% of Records Sold in the Study Period
% of Value Sold in the Study Period
Average Assessed Value of the Base
Commercial Real Property - History
Year
2014
Number of Sales LOV
5
N/A
N/A
64.47 to 137.13
4.67
0.94
0.16
$128,862
Confidence Interval - Current
Median
2011
2012
$126,150
$126,150
$113,007
$25,230 $22,601
100.80
103.94
89.58
97 24
13 98.40
2013 9 99.35
92.99 100 4
County 48 - Page 4

Op
inio
ns
County 48 - Page 5
2015 Opinions of the Property Tax Administrator
for Jefferson County
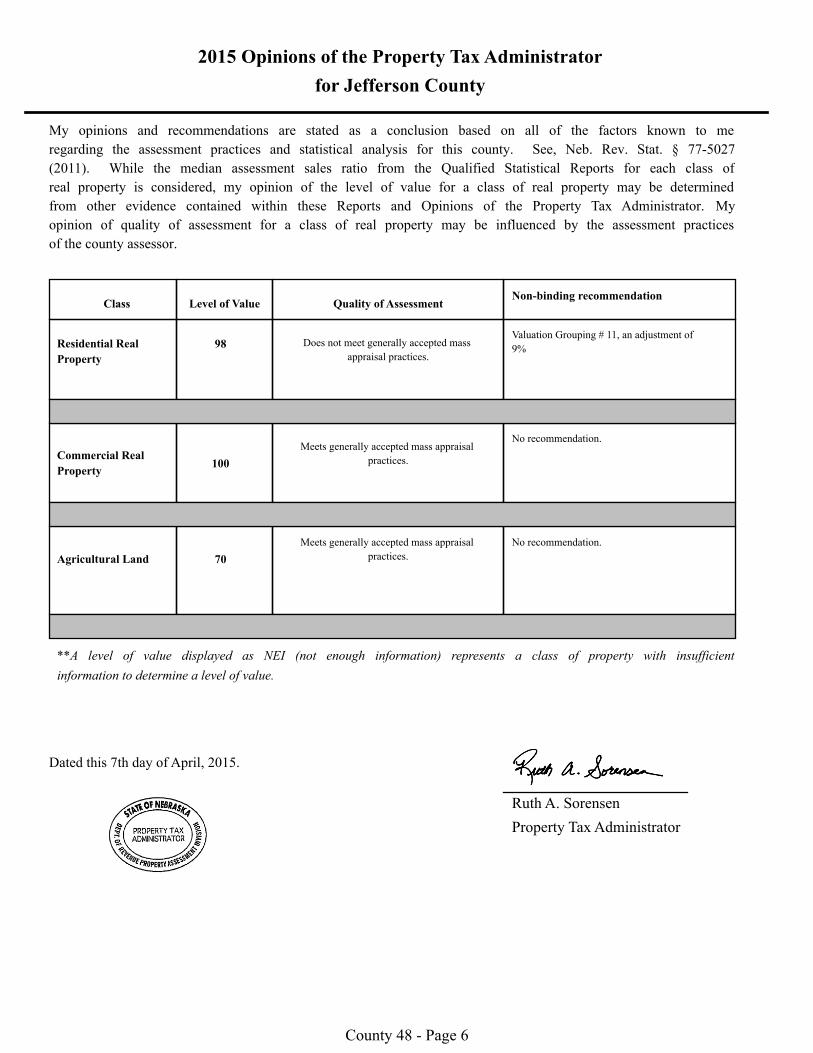
My opinions and recommendations are stated as a conclusion based on all of the factors known to me
regarding the assessment practices and statistical analysis for this county. See, Neb. Rev. Stat. § 77-5027
(2011). While the median assessment sales ratio from the Qualified Statistical Reports for each class of
real property is considered, my opinion of the level of value for a class of real property may be determined
from other evidence contained within these Reports and Opinions of the Property Tax Administrator. My
opinion of quality of assessment for a class of real property may be influenced by the assessment practices
of the county assessor.
Residential Real
Property
Commercial Real
Property
Agricultural Land
Class Level of Value Quality of Assessment
100
70
98
Meets generally accepted mass appraisal
practices.
Does not meet generally accepted mass
appraisal practices.
Meets generally accepted mass appraisal
practices.
Valuation Grouping # 11, an adjustment of
9%
No recommendation.
No recommendation.
Non-binding recommendation
**A level of value displayed as NEI (not enough information) represents a class of property with insufficient
information to determine a level of value.
Dated this 7th day of April, 2015.
Ruth A. Sorensen
Property Tax Administrator
County 48 - Page 6
Resid
entia
l Rep
orts
County 48 - Page 7
2015 Residential Assessment Actions for Jefferson County
For 2015, Jefferson County has followed their 3 Year Plan which includes the following actions:
The county completed all residential pickup work.
The county conducted a thorough sale verification and analysis process.
The county revalued the parcels in neighborhood #3 of Fairbury. In addition, the county updated
the costs to 2013 for all of the small towns; in Valuation group #12, including Daykin, Diller,
Endicott and Jansen and in Valuation group #15, including Harbine, Reynolds, and Steele City.
The county also did an inspection and review process of those 2 valuation groups that utilized
Pictometry and Google Earth to discover noticeable changes to the property. When changes
were discovered they went to the house with the existing record to verify or update the
measurements, description of property characteristics, observations of quality and condition and
take new photos. Other houses in the surrounding area were viewed to observe changes in the
condition at that time.
County 48 - Page 8
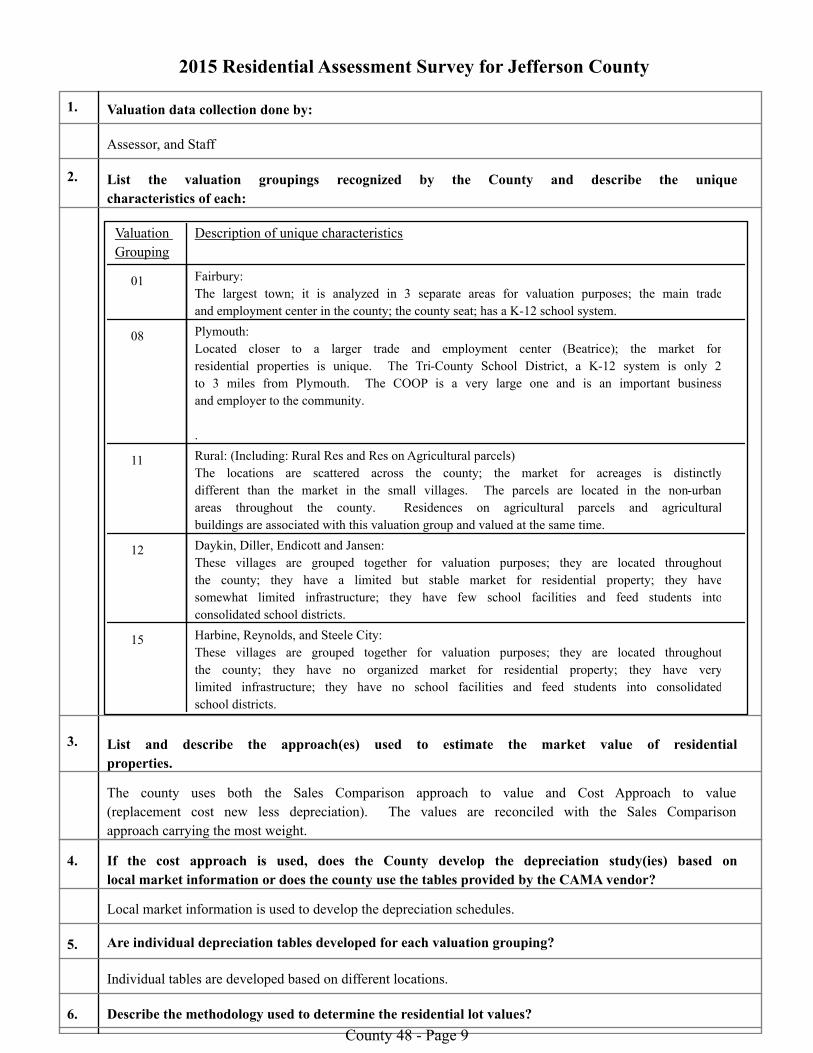
2015 Residential Assessment Survey for Jefferson County
1. Valuation data collection done by:
Assessor, and Staff
List the valuation groupings recognized by the County and describe the unique
characteristics of each:
2.
Description of unique characteristicsValuation
Grouping
01 Fairbury:
The largest town; it is analyzed in 3 separate areas for valuation purposes; the main trade
and employment center in the county; the county seat; has a K-12 school system.
08 Plymouth:
Located closer to a larger trade and employment center (Beatrice); the market for
residential properties is unique. The Tri-County School District, a K-12 system is only 2
to 3 miles from Plymouth. The COOP is a very large one and is an important business
and employer to the community.
.
11 Rural: (Including: Rural Res and Res on Agricultural parcels)
The locations are scattered across the county; the market for acreages is distinctly
different than the market in the small villages. The parcels are located in the non-urban
areas throughout the county. Residences on agricultural parcels and agricultural
buildings are associated with this valuation group and valued at the same time.
12 Daykin, Diller, Endicott and Jansen:
These villages are grouped together for valuation purposes; they are located throughout
the county; they have a limited but stable market for residential property; they have
somewhat limited infrastructure; they have few school facilities and feed students into
consolidated school districts.
15 Harbine, Reynolds, and Steele City:
These villages are grouped together for valuation purposes; they are located throughout
the county; they have no organized market for residential property; they have very
limited infrastructure; they have no school facilities and feed students into consolidated
school districts.
3. List and describe the approach(es) used to estimate the market value of residential
properties.
The county uses both the Sales Comparison approach to value and Cost Approach to value
(replacement cost new less depreciation). The values are reconciled with the Sales Comparison
approach carrying the most weight.
4. If the cost approach is used, does the County develop the depreciation study(ies) based on
local market information or does the county use the tables provided by the CAMA vendor?
Local market information is used to develop the depreciation schedules.
5. Are individual depreciation tables developed for each valuation grouping?
Individual tables are developed based on different locations.
6. Describe the methodology used to determine the residential lot values? County 48 - Page 9
Current local sales are used to determine lot and land values. The unit of comparison used for
residential lot studies and application is by the square foot.
7. Describe the methodology used to determine value for vacant lots being held for sale or
resale?
There are only a scattering of vacant lots found throughout the county. In most of the towns, there
is no organized development taking place. There is some development in Fairbury but it is not a
common practice for developers to maintain a surplus of vacant lots. To date, no developer has
requested a discounted cash flow analysis of the valuation of their lots, and the county does not
currently use discounted cash flow techniques to value any vacant lots.
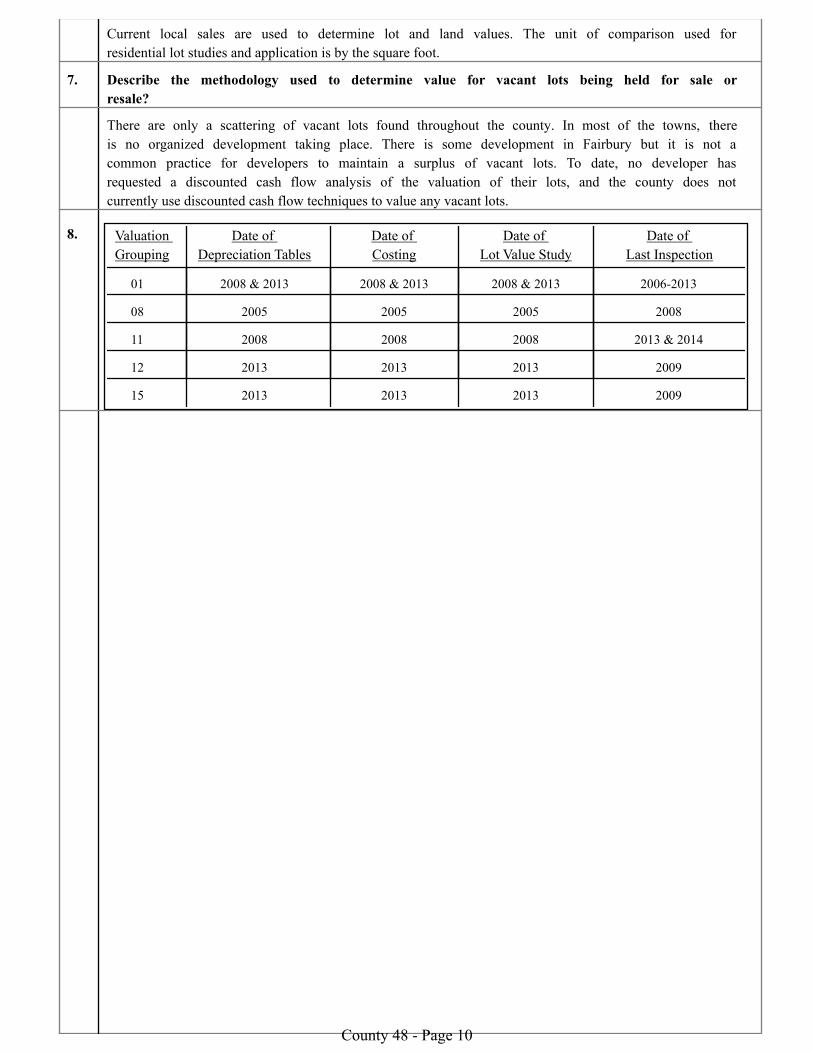
8. Valuation
Grouping
Date of
Costing
Date of
Lot Value Study
Date of
Last Inspection
Date of
Depreciation Tables
01 2008 & 2013 2008 & 2013 2008 & 2013 2006-2013
08 2005 2005 2005 2008
11 2008 2008 2008 2013 & 2014
12 2013 2013 2013 2009
15 2013 2013 2013 2009
County 48 - Page 10
----The depreciation tables are redone whenever the costs are updated. They tend to be the same
or nearly the same date as the cost tables.
----2005 for Plymouth, and Diller; 2008 for Fairbury and rural residential; and Dec 2001 for the
remainder of County.
----The County is in the process of changing to Dec 2013 costing and adjusting depreciation.
during 2014 they recosted valuation groupw 12 and 15 which inclueds all of the smaller towns.
Depreciations were adjusted to maintain values. Lot values were affirmed but not changed.
----Lot sales are analyzed (if sales occur) on an ongoing basis. When the valuation groups are
reviewed and re-appraised they verify whether the lot values are holding or if the values need to be
adjusted before the improvements are appraised. Going forward, this practice will continue and
the lots will be either affirmed or updated whenever the class or subclass is inspected, reviewed
and recosted.
----The county has developed the valuation groups partly based on the original assessor locations
and partly on the way they organize their work. They typically inspect, review and analyze each
town separately. The county has identified characteristics that make each town unique. Those
characteristics vary, but are usually related to the population, schools, location, businesses and
services in each town. In Valuation groups #12 and #15 where multiple towns are grouped
together, the characteristics are considered to be similar. Valuation group #15 has multiple cost
dates because some of the small towns were costed at different dates in the past.
----Within the Valuation Group #1 (Fairbury), The work is organized into 3 neighborhoods that are
intended to break the town into manageable appraisal zones. Neighborhood #3 was reviewed
during 2013 and 2014 and will have new values for use in 2015, so there are 2 cost dates for
Valuation Group #1, (Fairbury).
----When the dates for inspection and review, costing, depreciation tables and lot value study are
reviewed; typically, residences on agricultural parcels and agricultural buildings are associated
with #11, the “Rural” valuation group.
---There has been some inspection and review conducted in various areas in Fairbury every year.
The Rural and ag res have been inspected and reviewed over the past 2 years. The costs will be
converted to 2013 and all parcels will ve revalued during 2015 for use in 2016.
County 48 - Page 11
2015 Residential Correlation Section
for Jefferson County
County Overview
Jefferson County is an agriculturally based county with an array of nine villages and small
towns. Eight of them range in population from 49 to 409 and exist primarily to support
agriculture. Fairbury, with a population of 3,942, is the largest town and county seat. It hosts
additional nonagricultural employers and has a more diversified business climate. According to
the 2010 Census data cited in the Departments CTL based municipality charts; the county
population is 7,547, with 5,206 or 68.98% living within the villages and towns and 2,341 or
31.02% living outside of the municipal areas. The 2015 Abstract Form 45, reports 3,540
residential and 15 recreational parcels, for a class total of 3,555. There are an additional 524
residences located on agricultural parcels.
Description of Analysis
Jefferson County has divided their residential analysis and valuation work into 5 valuation
groups. These groups are centered on two individual towns, a group of smaller towns, a group of
small villages and rural residential parcels. The characteristics of each Valuation Group are
described in in the Residential Survey. The county believes that each grouping is unique with
differing combinations of population, schools, commercial activity, healthcare services and
employment outside the agricultural sector.
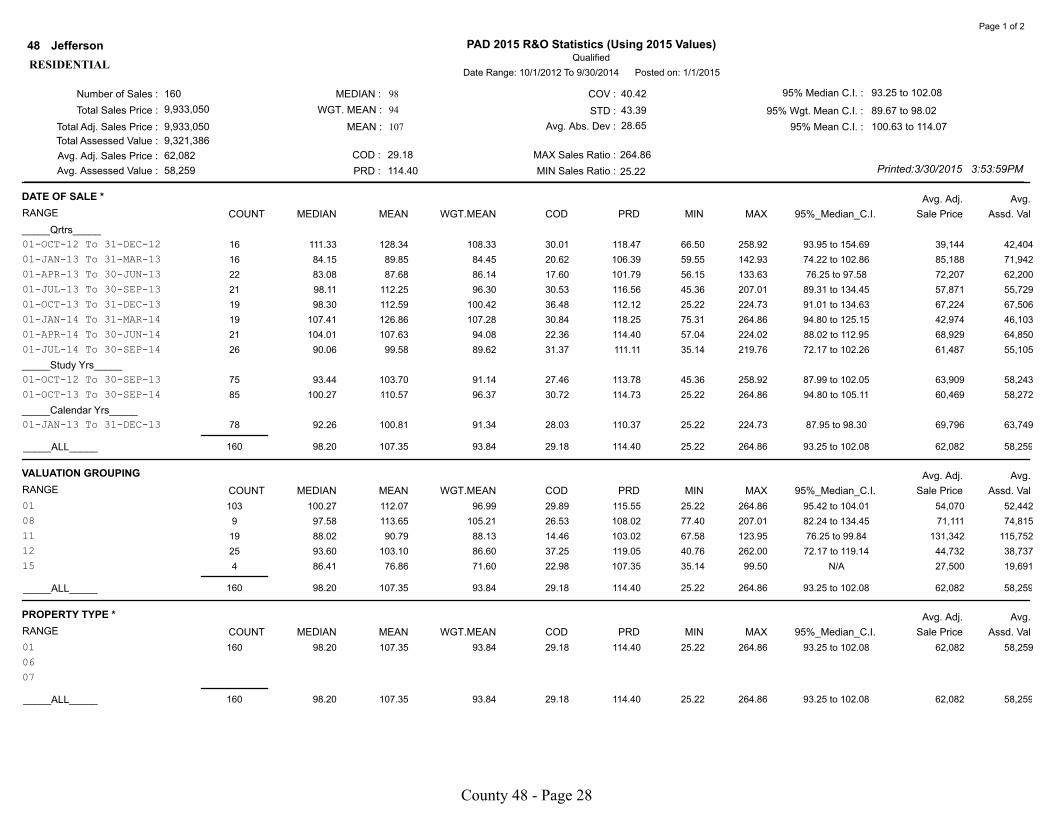
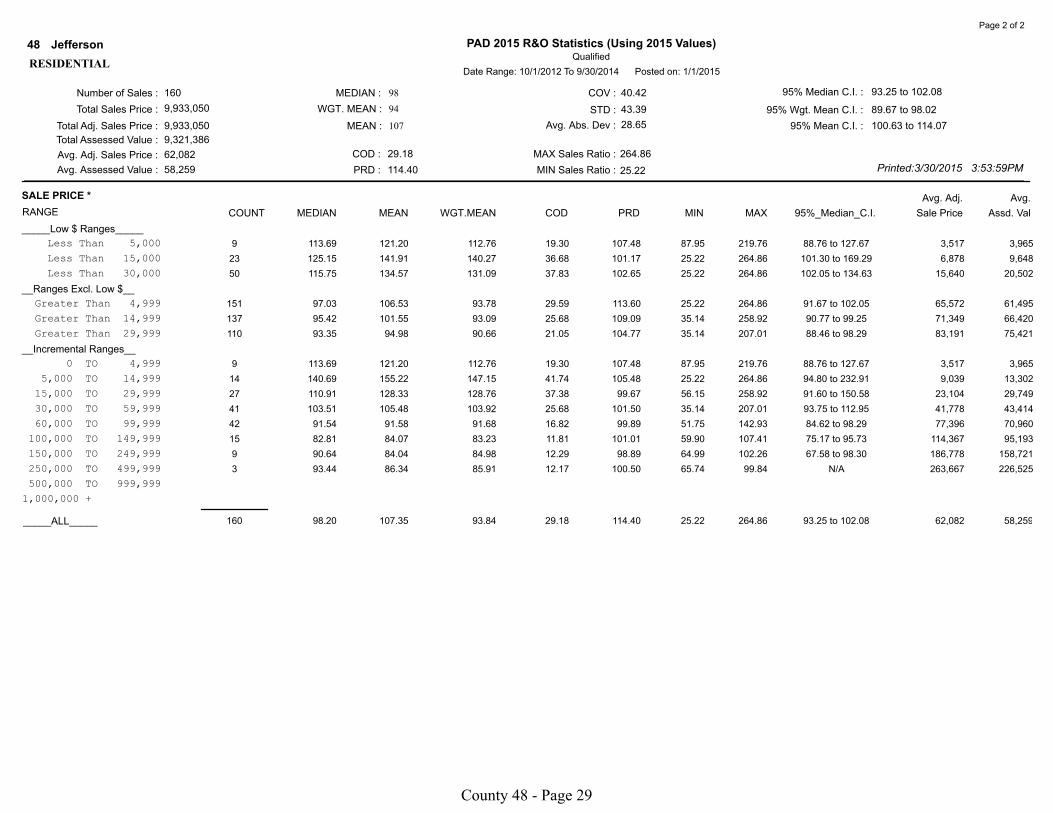
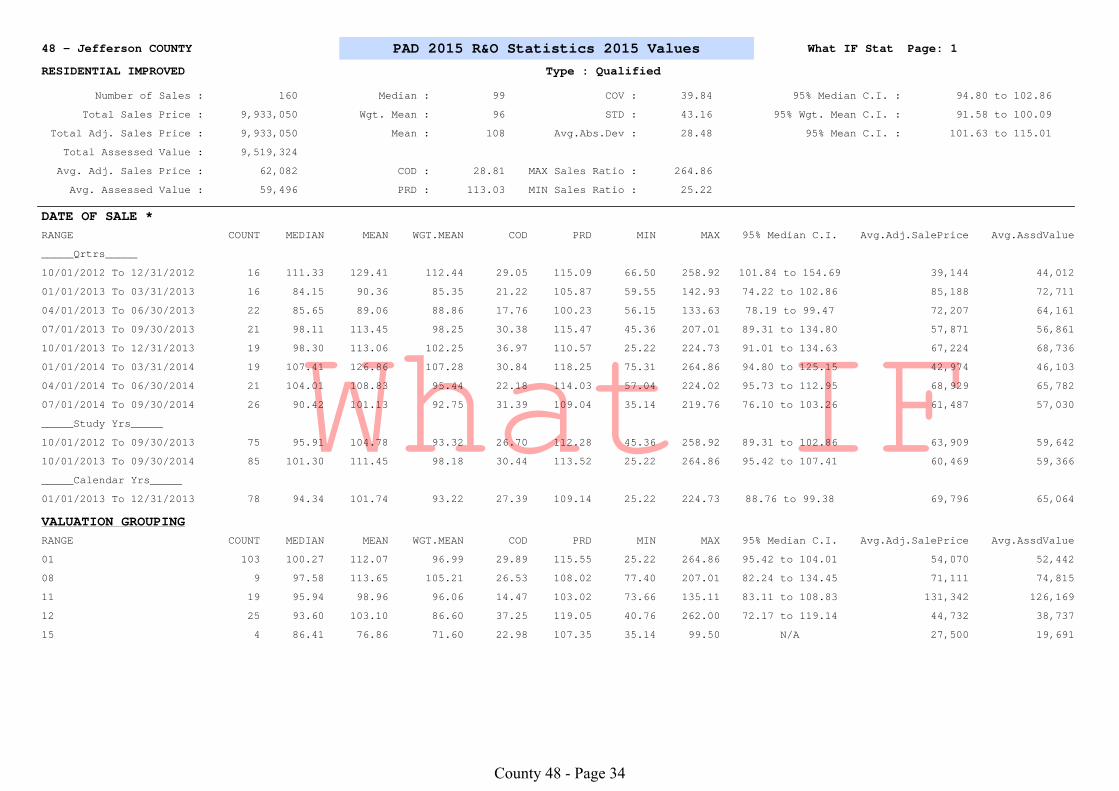
For 2015, the median ratio for the 160 qualified residential sales is 98% and is within the
acceptable range; the COD at 29.18 is well above the acceptable range and the PRD at 114.40 is
also well above the acceptable range. In the analysis of residential sales the impact of small
dollar sales needs to be examined. A review of the COD and PRD for the total sample can often
lead to the conclusion that the quality of assessment is not good. It is useful to evaluate the COD
and PRD of a slightly trimmed sample of the sales to evaluate the quality of assessment of the
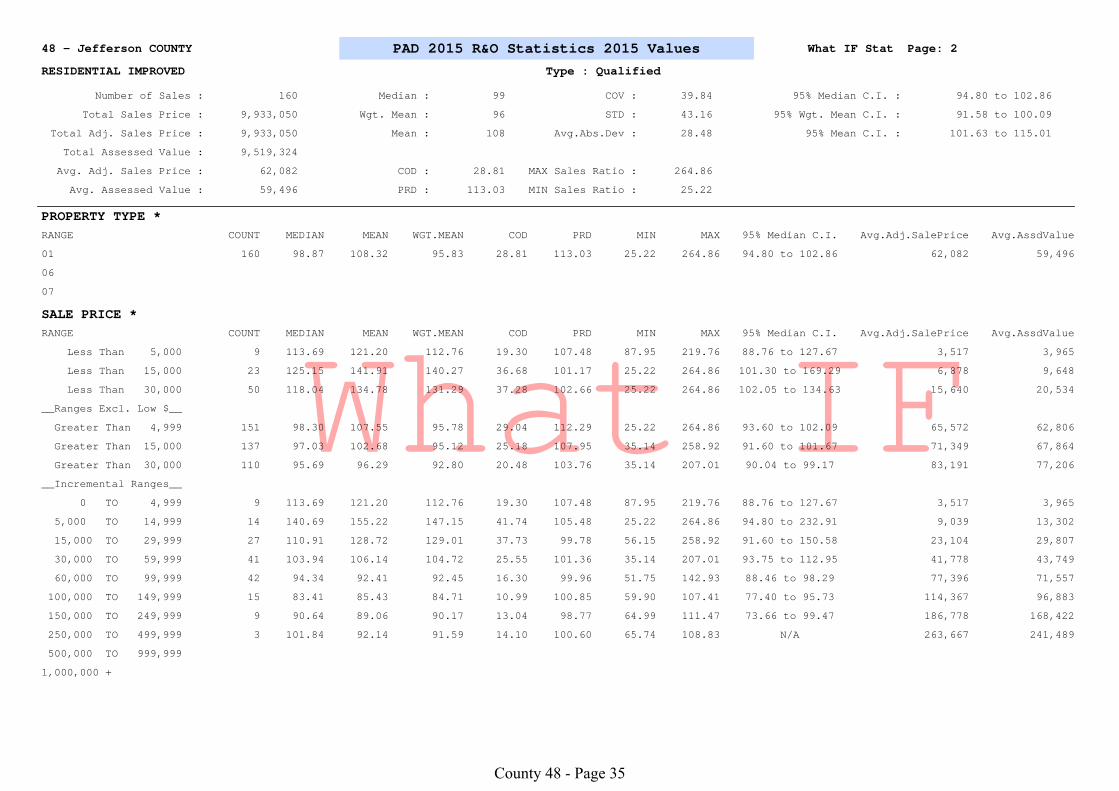
bulk of the parcels. The section of the statistical report that examines the “Sale Price” ranges
offers the opportunity to do so. By reviewing the analysis of the 110 sales with prices greater
than $29,999, the assessment level and quality of about 69% of the sales is reported. That gives a
statistical perspective of the quality of assessment of the majority of the parcels that is not
impacted by the volatility if the selling prices of low price property. The median ratio for the
trimmed sample is 93% and only had a fractional change since the median is not as volatile a
statistic. However, the trimmed COD is 21.05%, the PRD is 104.77. These statistics are still
above the desired ranges. When the sales of parcels for less than $30,000 are excluded it
demonstrates how the county’s predominant residential parcels are valued. It also shows that the
more volatile low dollar sales are responsible for a disproportionate impact on the assessment
statistics depicting quality of assessment, particularly the COD and the PRD. In this case the
trimmed group was large including 31% of the qualified sales. Even with the exclusion of nearly
one third of the sales, the indications of the quality of assessment were still outside the desired
range.
County 48 - Page 12
2015 Residential Correlation Section
for Jefferson County
Sales Qualification
During the past year, the Department reviewed the documentation of three years of the county’s
sale verification process posted in the comments in the sales file. The county has posted
comments when required on nearly all of the sales reviewed. In most cases, the comments were
complete enough to conclude why the sale was not used or adjusted for the ratio study. There
was no reason to conclude that the county had selectively excluded sales to influence the
measurement process. The county qualified 53% of all of the residential sales, so the Department
believes that all available sales were used in the measurement process.
Equalization and Quality of Assessment
The quality statistics for the county and for the individual valuation groups are troubling. There
are questions if the values are equalized throughout the residential class. The quality of
assessment reported for 2014 was questionable and the statistics that measure quality of
assessment for 2015 are also questionable. While many of the practices have been acceptable, the
assessment performance statistics are not. The rural residential valuation grouping is valued
below the acceptable range creating inequity among the residential class of property. Therefore,
the assessment practices are not in compliance with generally accepted mass appraisal standards.
Level of Value
The apparent level of value for the residential class based solely on the median calculation is
98%. The calculated median for Valuation Grouping #11 (rural residential) is 88.02% and below
the desired range. In 2013 it measured about 93% and in 2014, it measured 92%. With a COD of
14.46 and a PRD of 103.02, there seems to be acceptable uniformity in Valuation Grouping #11
even though the residential class and other subclasses do not. The past measurements
demonstrate a consistent pattern of increasing values and decreasing ratios indicating the
undervaluation of Valuation Grouping #11. The Department believes that the residential class,
based on a review of the current and past valuation statistics has a level of value of 98% and
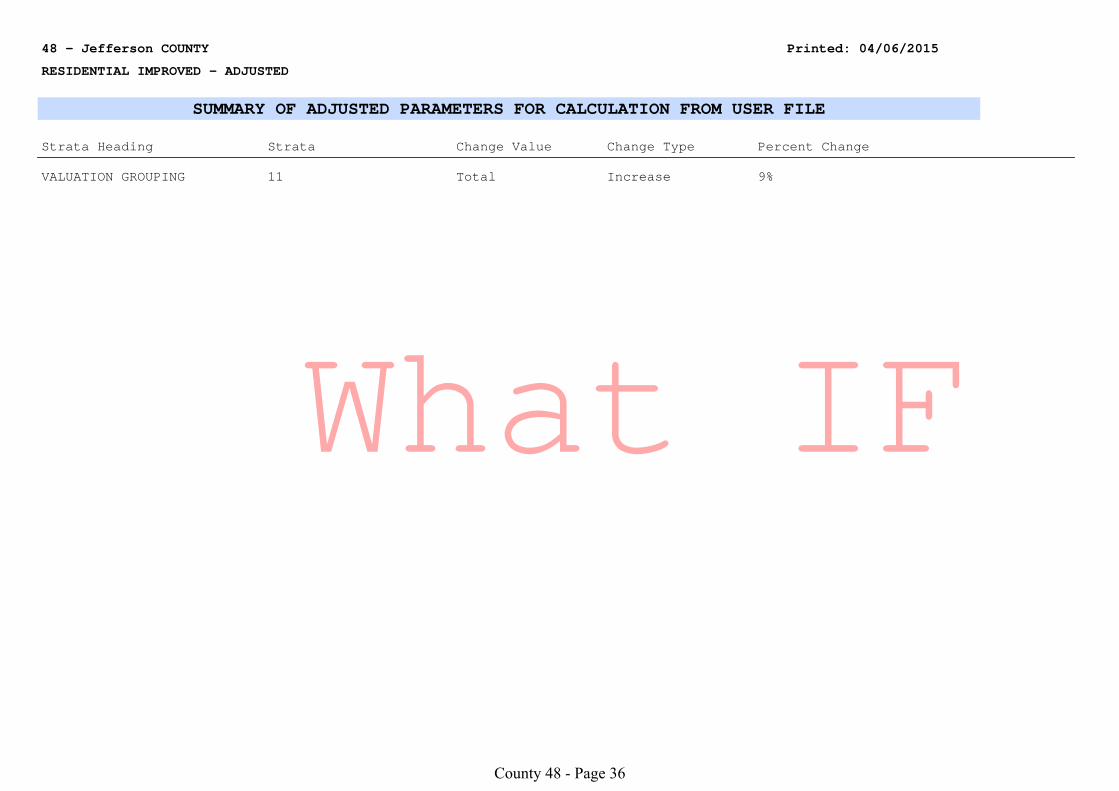
within the range but that Valuation Grouping #11 needs to be adjusted by plus 9% to achieve
amidrange level of value for that subclass.
County 48 - Page 13

Com
mercial R
eports
County 48 - Page 14
2015 Commercial Assessment Actions for Jefferson County
For 2015, Jefferson County has followed their 3 Year Plan which includes the following actions:
The county completed all commercial pickup work.
The county conducted a thorough sale verification and analysis process.
There was no planned inspection and review of commercial parcels during 2014.
County 48 - Page 15
2015 Commercial Assessment Survey for Jefferson County
1. Valuation data collection done by:
Assessor and Staff
List the valuation groupings recognized in the County and describe the unique characteristics
of each:
2.
Description of unique characteristicsValuation
Grouping
19 Includes all Assessor Locations:
All commercial sales in Jefferson County are grouped together for analysis and valuation.
3. List and describe the approach(es) used to estimate the market value of commercial
properties.
The cost approach is the primary method and is used on all parcels. If sufficient data is available, a
Market Approach (sales comparison approach) is used and the two values are correlated for a final
value.
3a. Describe the process used to determine the value of unique commercial properties.
The assessor relies heavily on the experience of the current staff when unique commercial property
is appraised. The assessor and staff members are familiar with the appraisal techniques, sales and
procedures used in other counties. There is an exchange of information among other assessors that
have similar parcels. This process helps to determine a value and to value unique property similarly
to other like property in nearby jurisdictions.
----If it is necessary for an unusual property, the county would contract with an outside appraiser.
4. If the cost approach is used, does the County develop the depreciation study(ies) based on
local market information or does the county use the tables provided by the CAMA vendor?
The local market
5. Are individual depreciation tables developed for each valuation grouping?
Yes; but there is only one valuation group in commercial. There will be individual depreciation
developed for various uses or groups of like uses and locations within the valuation group. Among
the commercial property, the depreciation tends to be driven by both use and location as well as
quality and condition.
6. Describe the methodology used to determine the commercial lot values.
The county uses sales of vacant land calculated by square foot for the common unit of comparison.
7. Date of
Depreciation Tables
Valuation
Grouping
Date of
Costing
Date of
Lot Value Study
Date of
Last Inspection
19 2008 2008 2008 2009
County 48 - Page 16
----The depreciation tables are redone whenever the costs are updated. They tend to be the same or
nearly the same date as the cost tables.
----The 2008 costs are used for the commercial parcels throughout the county.
----Lot sales are analyzed (if sales occur) on an ongoing basis. When the commercial parcels are
reviewed and re-appraised they verify whether the lot values are holding or if the values need to be
adjusted before the improvements are appraised. Going forward, this practice will continue and the
lots will be either affirmed or updated whenever the class or subclass is inspected, reviewed,
recosted, and reappraised.
County 48 - Page 17
2015 Commercial Correlation Section
for Jefferson County
County Overview
Jefferson County is an agriculturally based county with an array of nine municipalities; eight
villages and small towns, and the town of Fairbury. Most of the commercial properties in the
county either directly service or support agriculture or the people involved in agriculture.
Fairbury, the county seat, is the predominant location for much of the commercial and industrial
property. The Department’s “2014 County and Municipal Valuations by Property Type” reports
that 39% of the commercial valuation is reported in Fairbury, 14% is in Plymouth, 9% in
Daykin, 6% in the remaining small towns and 32% is in the non-municipal areas. Fairbury has
about 17% of the industrial valuation, Plymouth over 7% and the remaining nearly 76% is in the
non-municipal areas of the county. The 2015 Abstract Form 45, reports 509 commercial and 25
industrial parcels, for a class total of 534.
Description of Analysis
Jefferson County uses only one valuation group to analyze and value their commercial property.
They do look at individual towns as subclasses and develop separate economic depreciation in
separate locations.
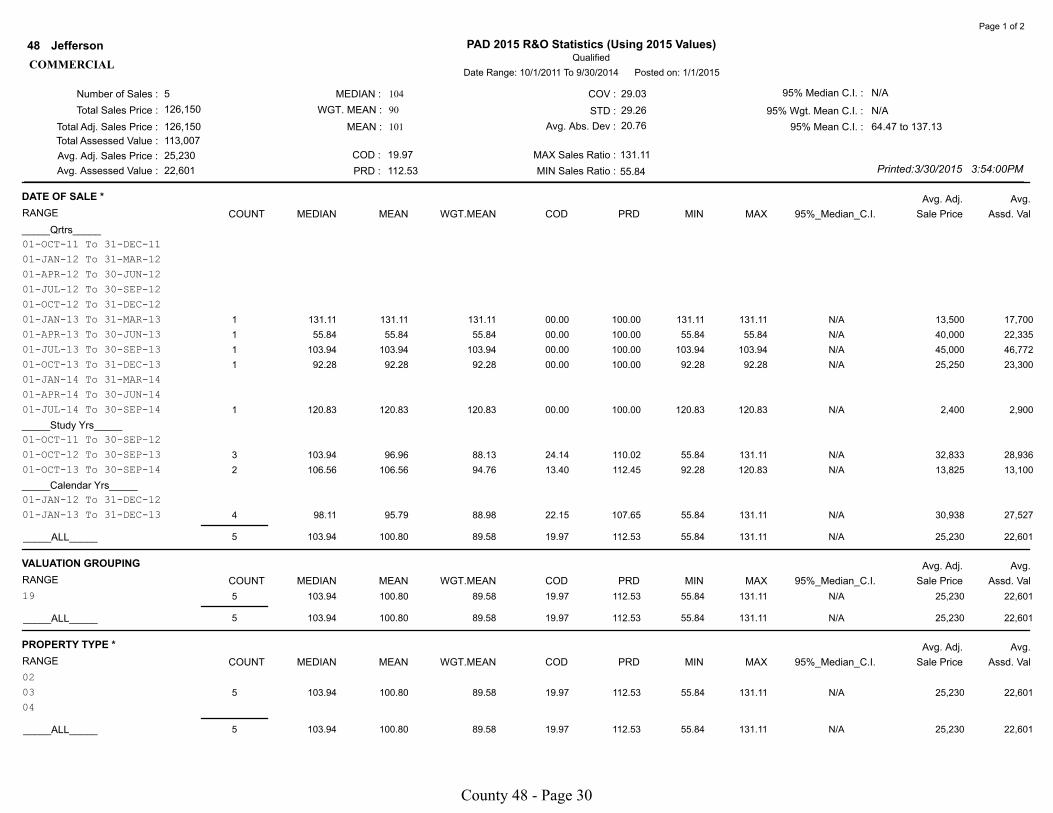
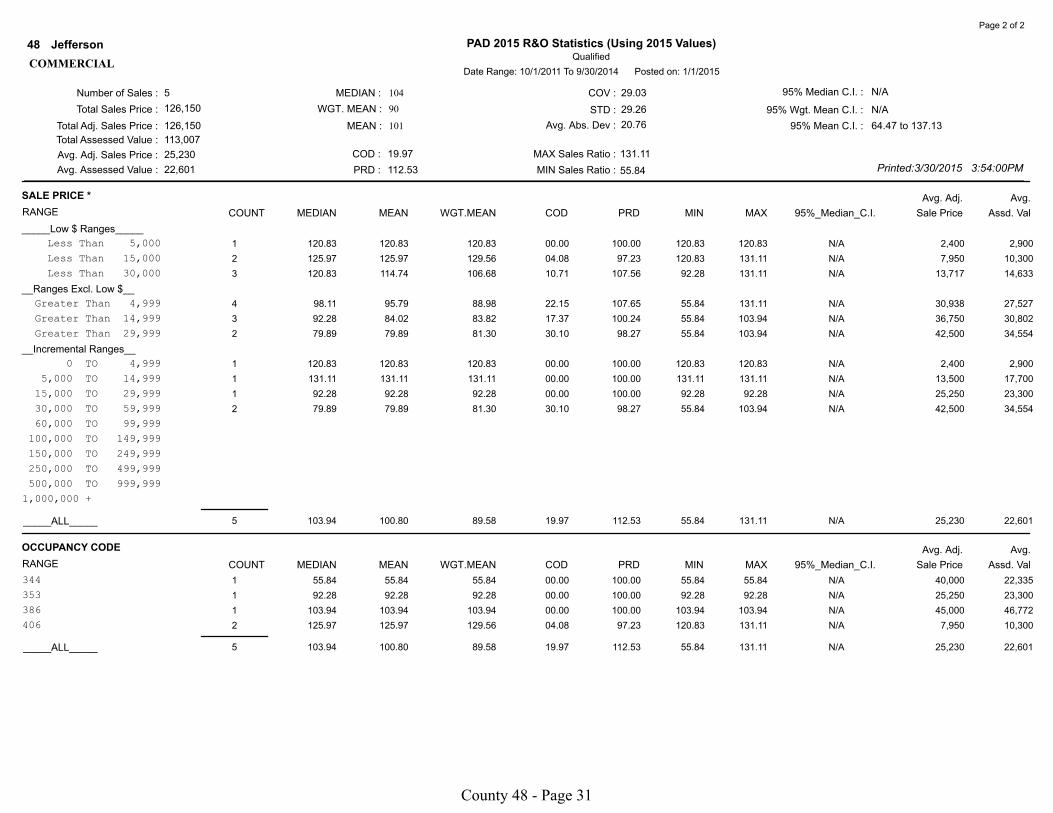
The key statistics that are prepared and considered for measurement are as follows: there are 5
qualified sales; the median ratio is 104%; the COD is 19.97; and the PRD is 112.53. Of the 5
qualified sales, 3 are in Fairbury, 1 in Diller and 1 in Reynolds. When the 4 different occupancy
codes are reviewed, there are 2 sales in code 406 (storage warehouse); 1 sales in code 344 (office
building); 1 sale in code 353 (retail store); and 1 sale in code 386 (mini warehouse). Since there
are only 4 occupancy codes, there are still many property types with no representation and those
that are represented are insufficient for preparing a viable statistical analysis. In short, there are
not sufficient sales to represent or measure either the overall class or any subclass of the
commercial property.
Sales Qualification
The Division has reviewed the county’s sale verification process and finds that the county has
retained an unusually low number of the sales as qualified compared to surrounding
counties. There is little possibility that the statistical measurement is representative of the
commercial class since there are not sufficient sales to measure the commercial class or any
subclass regardless of the verification process.
County 48 - Page 18
2015 Commercial Correlation Section
for Jefferson County
Equalization and Quality of Assessment
The Department analyzes each county every other year to systematically review assessment
practices. With the information available it was confirmed that the assessment practices are
reliable and applied consistently. While the department will continue to observe the sale
qualification process, when it comes to the actual valuation process it is believed the commercial
properties are being treated in a uniform and proportionate manner.
Level of Value
The statistical calculations alone are not representative of the commercial class and are not
considered adequate to indicate the actual level of value. The information available allows that
the county has probably achieved an acceptable level of value. The level of value is called at the
statutory level of 100%.
County 48 - Page 19

Agricultural and/or
Special Valuation R
eports
County 48 - Page 20
2015 Agricultural Assessment Actions for Jefferson County
For 2015, Jefferson County has followed their 3 Year Plan which includes the following actions:
The county completed all pickup work of new improvements on agricultural parcels. They also
update the land use on all parcels where changes have been reported or observed.
The county conducted a thorough sale verification and analysis process. Following that, they
implemented new values for agricultural land throughout the county.
The county has completed the inspection and update process for all agricultural improvements so
no additional inspections and reviews were conducted during 2014.
County 48 - Page 21
2015 Agricultural Assessment Survey for Jefferson County
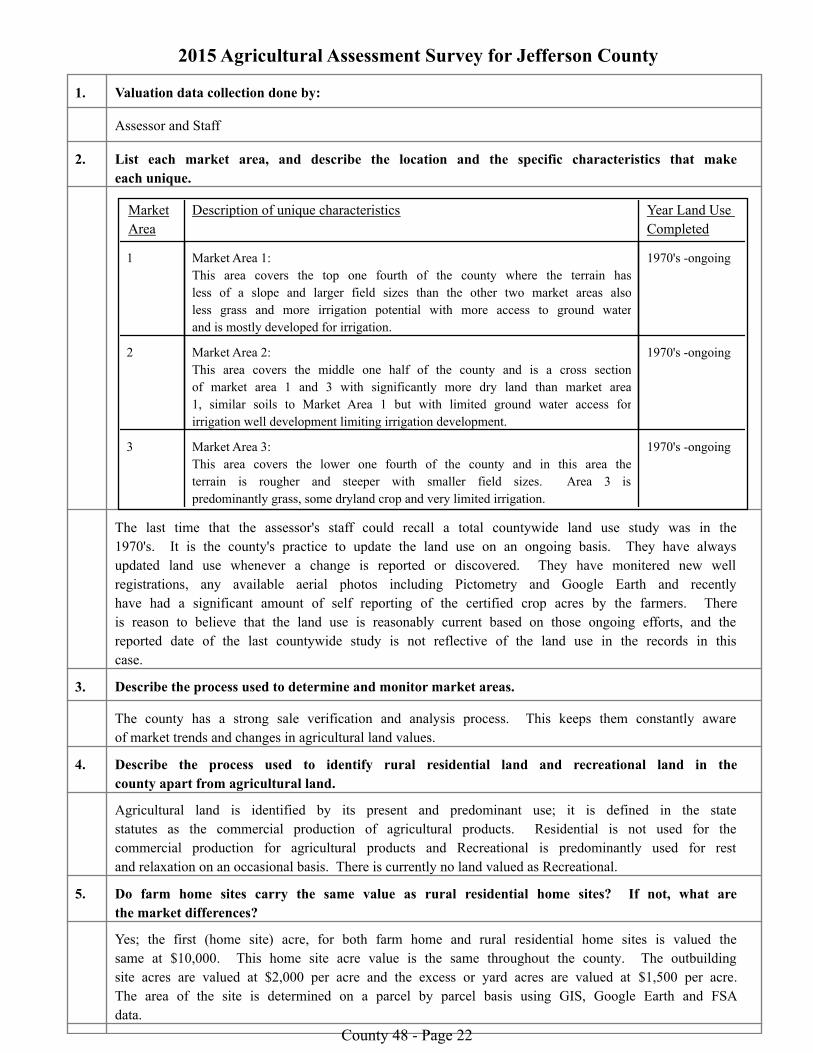
1. Valuation data collection done by:
Assessor and Staff
List each market area, and describe the location and the specific characteristics that make
each unique.
2.
Year Land Use
Completed
Description of unique characteristicsMarket
Area
1 Market Area 1:
This area covers the top one fourth of the county where the terrain has
less of a slope and larger field sizes than the other two market areas also
less grass and more irrigation potential with more access to ground water
and is mostly developed for irrigation.
1970's -ongoing
2 Market Area 2:
This area covers the middle one half of the county and is a cross section
of market area 1 and 3 with significantly more dry land than market area
1, similar soils to Market Area 1 but with limited ground water access for
irrigation well development limiting irrigation development.
1970's -ongoing
3 Market Area 3:
This area covers the lower one fourth of the county and in this area the
terrain is rougher and steeper with smaller field sizes. Area 3 is
predominantly grass, some dryland crop and very limited irrigation.
1970's -ongoing
The last time that the assessor's staff could recall a total countywide land use study was in the
1970's. It is the county's practice to update the land use on an ongoing basis. They have always
updated land use whenever a change is reported or discovered. They have monitered new well
registrations, any available aerial photos including Pictometry and Google Earth and recently
have had a significant amount of self reporting of the certified crop acres by the farmers. There
is reason to believe that the land use is reasonably current based on those ongoing efforts, and the
reported date of the last countywide study is not reflective of the land use in the records in this
case.
3. Describe the process used to determine and monitor market areas.
The county has a strong sale verification and analysis process. This keeps them constantly aware
of market trends and changes in agricultural land values.
4. Describe the process used to identify rural residential land and recreational land in the
county apart from agricultural land.
Agricultural land is identified by its present and predominant use; it is defined in the state
statutes as the commercial production of agricultural products. Residential is not used for the
commercial production for agricultural products and Recreational is predominantly used for rest
and relaxation on an occasional basis. There is currently no land valued as Recreational.
5. Do farm home sites carry the same value as rural residential home sites? If not, what are
the market differences?
Yes; the first (home site) acre, for both farm home and rural residential home sites is valued the
same at $10,000. This home site acre value is the same throughout the county. The outbuilding
site acres are valued at $2,000 per acre and the excess or yard acres are valued at $1,500 per acre.
The area of the site is determined on a parcel by parcel basis using GIS, Google Earth and FSA
data. County 48 - Page 22
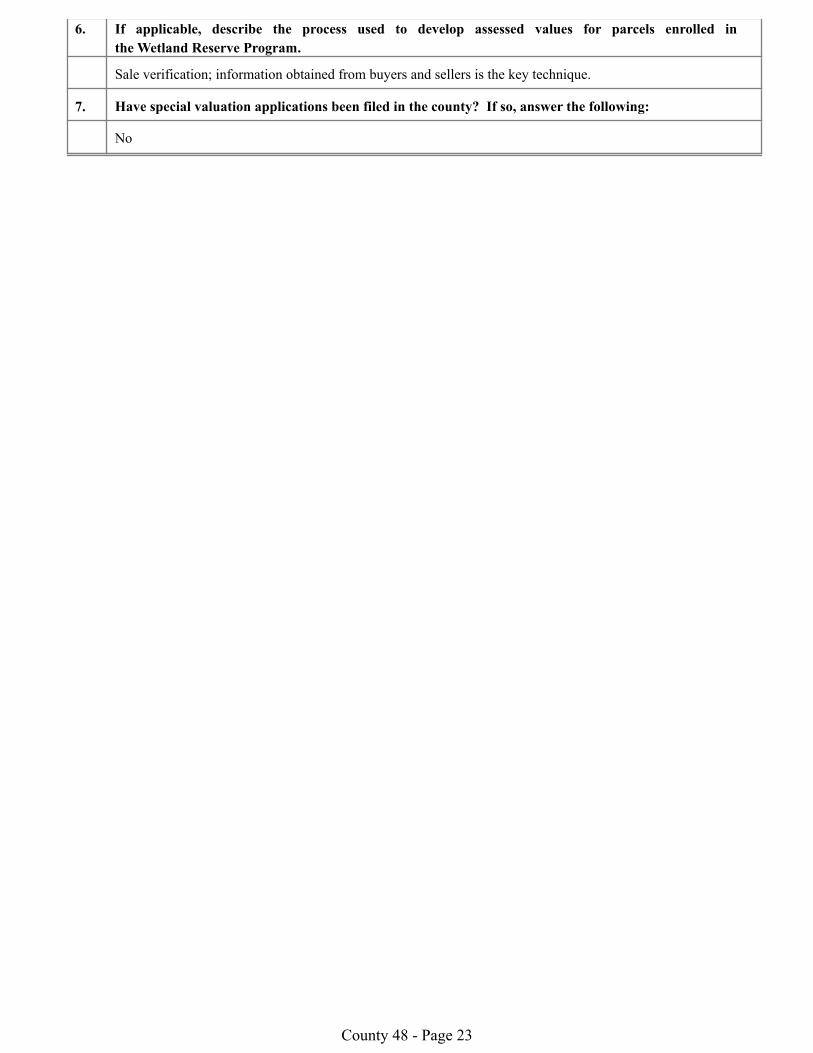
6. If applicable, describe the process used to develop assessed values for parcels enrolled in
the Wetland Reserve Program.
Sale verification; information obtained from buyers and sellers is the key technique.
7. Have special valuation applications been filed in the county? If so, answer the following:
No
County 48 - Page 23
2 3 4 5 6 7 8 9 10 11 12
Mkt
Area1A1 1A 2A1 2A 3A1 3A 4A1 4A
WEIGHTED
AVG IRR
1 5,055 7,206 4,335 5,845 4,885 n/a 4,461 3,190 6,121
1 6,400 6,300 6,200 6,100 5,800 n/a 5,400 5,250 6,174
1 6,743 6,796 6,150 6,164 5,301 5,315 4,899 4,876 6,125
2 6,194 6,199 5,987 5,895 5,492 4,800 4,394 4,156 5,832
1 6,500 6,500 6,450 6,200 5,700 5,499 5,500 5,500 6,218
2 4,620 7,173 3,602 4,050 4,035 n/a 3,696 3,190 5,277
1 6,743 6,796 6,150 6,164 5,301 5,315 4,899 4,876 6,125
1 6,500 6,500 6,450 6,200 5,700 5,499 5,500 5,500 6,218
2 5,900 5,900 5,700 5,350 4,950 n/a 4,700 4,700 5,357
3 4,875 5,435 3,495 3,500 3,340 n/a 3,060 3,190 4,155
1 6,743 6,796 6,150 6,164 5,301 5,315 4,899 4,876 6,125
2 5,900 5,900 5,700 5,350 4,950 n/a 4,700 4,700 5,3571 13 14 15 16 17 18 19 20 21
Mkt
Area1D1 1D 2D1 2D 3D1 3D 4D1 4D
WEIGHTED
AVG DRY
1 3,370 5,124 2,820 3,895 3,255 n/a 2,985 1,595 4,062
1 3,855 3,815 3,715 3,665 3,514 n/a 3,223 3,155 3,705
1 4,200 4,200 3,720 3,600 3,235 3,235 2,565 2,565 3,434
2 4,696 4,692 4,223 4,144 4,039 3,525 3,520 3,344 4,291
1 4,200 4,200 4,050 4,050 3,750 3,550 3,550 3,550 3,988
2 3,080 5,102 2,176 2,530 2,524 n/a 1,850 1,275 3,463
1 4,200 4,200 3,720 3,600 3,235 3,235 2,565 2,565 3,434
1 4,200 4,200 4,050 4,050 3,750 3,550 3,550 3,550 3,988
2 3,400 3,400 3,250 3,150 3,000 2,802 2,800 2,750 3,150
3 3,250 3,608 2,185 2,060 1,965 n/a 1,330 1,271 2,402
1 4,200 4,200 3,720 3,600 3,235 3,235 2,565 2,565 3,434
2 3,400 3,400 3,250 3,150 3,000 2,802 2,800 2,750 3,15022 23 24 25 26 27 28 29 30
Mkt
Area1G1 1G 2G1 2G 3G1 3G 4G1 4G
WEIGHTED
AVG GRASS
1 1,607 2,046 1,822 1,909 1,075 n/a 1,592 965 1,410
1 1,460 1,441 1,380 1,320 1,326 n/a 1,200 1,200 1,288
1 1,401 2,037 1,680 1,992 1,617 1,342 1,437 1,003 1,484
2 1,626 1,852 1,461 1,888 1,821 515 1,580 1,084 1,429
1 1,528 1,740 1,502 1,522 1,514 1,409 1,495 1,387 1,482
2 1,644 1,792 1,466 1,470 1,475 n/a 1,318 1,179 1,375
1 1,401 2,037 1,680 1,992 1,617 1,342 1,437 1,003 1,484
1 1,528 1,740 1,502 1,522 1,514 1,409 1,495 1,387 1,482
2 1,475 1,520 1,403 1,380 1,456 n/a 1,360 1,316 1,368
3 1,933 1,959 1,399 1,585 1,376 n/a 1,314 1,216 1,326
1 1,401 2,037 1,680 1,992 1,617 1,342 1,437 1,003 1,484
2 1,475 1,520 1,403 1,380 1,456 n/a 1,360 1,316 1,368
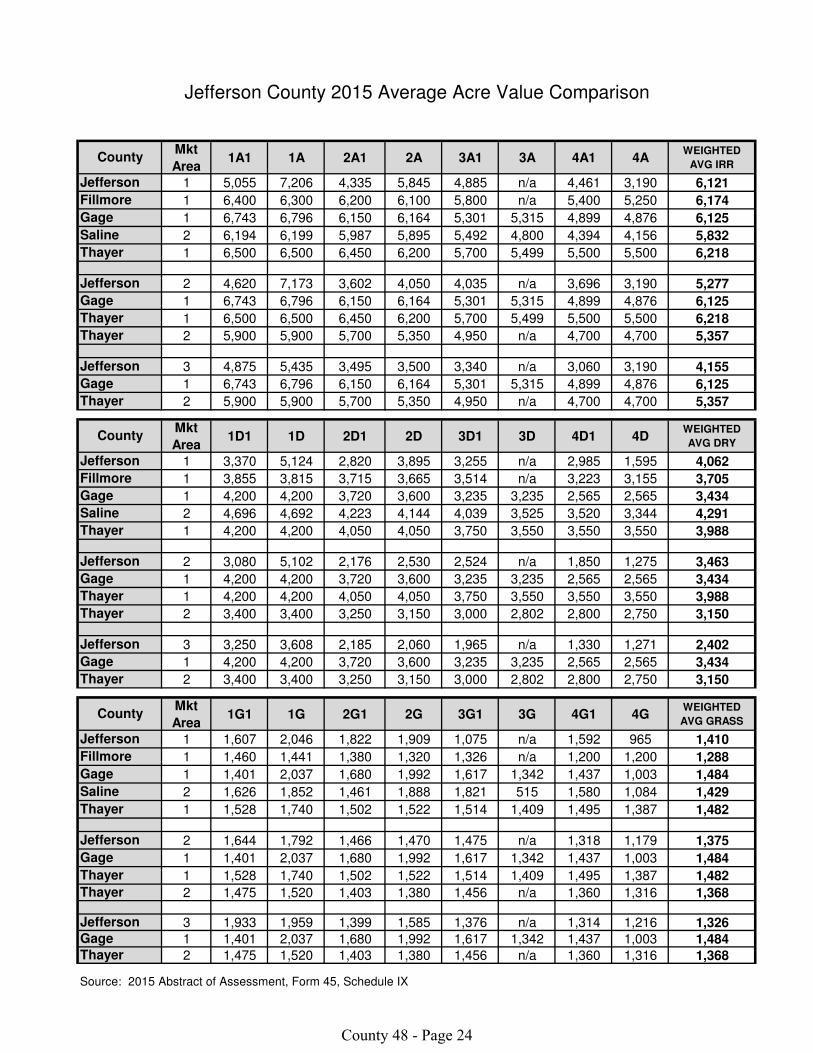
Source: 2015 Abstract of Assessment, Form 45, Schedule IX
Thayer
Thayer
Jefferson
Gage
Thayer
Gage
Saline
Thayer
Jefferson
Gage
Gage
Thayer
County
Jefferson
Fillmore
Jefferson
Gage
Thayer
Thayer
Jefferson
Jefferson
Fillmore
Gage
Saline
Thayer
Jefferson
Gage
Thayer
County
Thayer
Jefferson
Gage
Thayer
Thayer
Jefferson County 2015 Average Acre Value Comparison
County
Jefferson
Fillmore
Gage
Saline
County 48 - Page 24
2015 Agricultural Correlation Section
for Jefferson County
County Overview
Jefferson County is an agriculturally based county with an array of villages and small towns that
exist primarily to support agriculture. The prevalent crops are row crops with corn, soybeans,
and some grain sorghum. The county land use is approximately 26% irrigated land, 42% dry
land, 31% grass land and 1% other uses. Jefferson County is bordered on the north by Saline
County, on the south by The State of Kansas, on the east by Gage County, and on the west by
Thayer County. The agricultural land is valued using three market areas that are more fully
described in the survey. Area 1, (the north fourth of the county) is about 58% irrigated crop
land; Area 2, (the middle half of the county) has a mix of uses but is about 53% dry crop land;
and Area 3, (the south fourth of the county) is about 59% grass land. The 2015 Abstract Form
45, reports 2,907 parcels of agricultural land. There are an also 837 sets of farm site
improvements located on agricultural parcels.
Description of Analysis
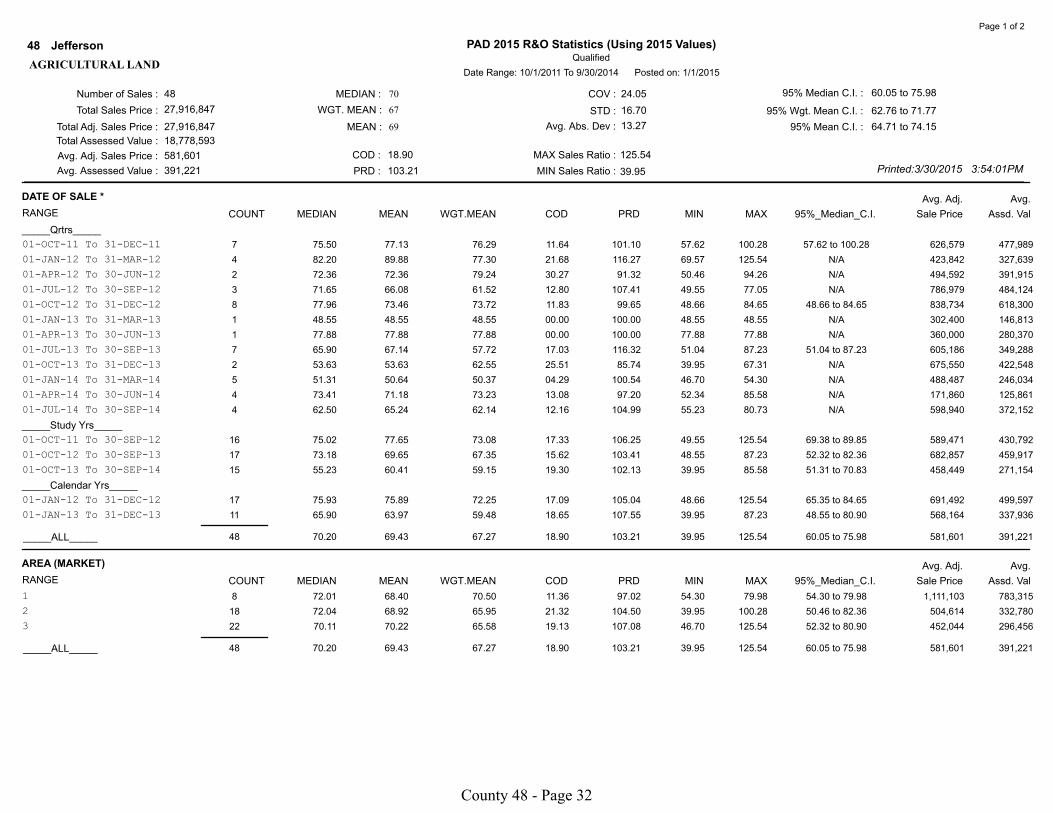
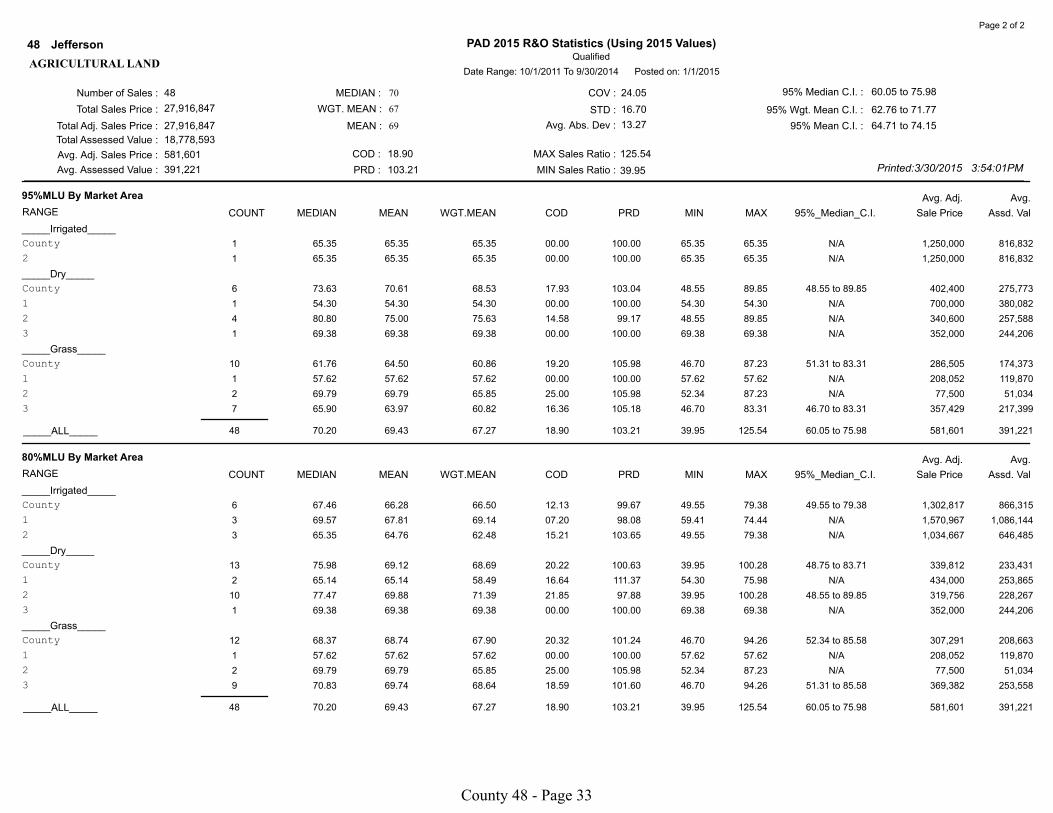
There was a total sample of 48 qualified sales; 36 Jefferson County sales supplemented with 8
additional qualified sales used to determine the level of value of agricultural land in the county.
The sample after supplementation was relatively adequate, proportional among study years and
nearly representative based on major land uses. Each of the 3 market areas were individually
within the 10 percentage point tolerance but the grass in the sales file for the countywide acres
was overrepresented. Any comparable sales used were selected from a similar agricultural area,
5 sales within six miles of the subject county, and due to a lack of available comparable sales, 3
sales were needed from beyond 6 miles but within 12 miles.
In this study, the 80% Majority Land Use Tables suggest that the dry land values for the county
with 13 sales rounded to 76% are high and the dry land values for Area 2 with 10 sales rounded
to 77% are also high. In these samples the distribution among the study years for dry land for
the 10 sales in Area 2 is biased toward the earliest 2 study years likely causing a higher median.
The Area 2 dry land median of 77.47% with 10 sales has only 2 sales in the most recent study
year, and 4 sales in the middle study year and 4 sales in the earliest study year. The bias in Area
2 drives the results in the countywide statistic. The Grass values for the countywide analysis
with 12 sales rounded to 68% appear to be low, but Area 3 (the primary area of grass) with 9 of
those 12 sales rounds to 71% and well within the range. Area 2 with only 2 sales rounds to a
median of 70% and only the countywide median is below the range. All that is really
demonstrated is that the small size of the sample spread over 3 market areas produces statistical
indicators that are not very reliable and should be used with caution.
The calculated median ratio is 70%; the COD is 18.90 and the PRD is 103.21. The 2014 abstract
reports; overall agricultural land increased by 12.02%; irrigated land increased by over 7%, dry
County 48 - Page 25
2015 Agricultural Correlation Section
for Jefferson County
land increased by over 16%, and grass land increased by nearly 18%. The county has sound
assessment practices relating to the verification of sales and analysis of agricultural values.
Sales Qualification
The Department’s review of the county’s sale verification process reported in the residential
correlation was done for all 3 classes of property at the same time. The findings, that there was
no reason to conclude that the county had selectively excluded sales to influence the
measurement process applies to the agricultural sales too. The measurement was done with all
available qualified sales.
Equalization and Quality of Assessment
The county has sound assessment practices relating to the verification of sales and unique
practices for the analysis of agricultural values. Each year, the county verifies all of the new
sales that take place. They update any changes to land use that are discovered or reported. They
completely analyze and revalue all agricultural land within their own classification and valuation
system. Jefferson County has an analysis process that breaks each sale down to the individual
soil type. Values are prepared for each soil type but the majority of the values are the same
across most LCGs. The major exception is the soils that classify as 1A, 1D, and 1G. There are 2
different values found in this group of soil types. The soil that drives this group is Crete (CE and
CEA) which are two of the dominant soils in the county. The county’s analysis continues to
establish it as the most desired soil and thus the highest valued soil in the county. The quality of
assessment for agricultural land while unique is still deemed acceptable.
Level of Value
For 2015, the apparent level of value of agricultural land is 70% and the quality of the
assessment process is acceptable. When the 80% MLU tables are reviewed, the indication that
dry land for the county and particularly for Area 2 is high is weak. The data in Area 2 with 10 of
the 13 total dry sales is biased in its distribution of sales among study years. This bias would
tend to produce a higher median ratio and probably has. The indication that grass land
throughout the county is a little low is disputed by the indicated level of value for the
predominant grass market area. The class of agricultural land is in the range and any indications
that any subclass of agricultural land is outside the range is weak. There are no recommended
adjustments to the class or to any subclass of agricultural land.
County 48 - Page 26

Statistical Reports
County 48 - Page 27
Number of Sales :
Total Sales Price :
Total Adj. Sales Price :
Total Assessed Value :
Avg. Adj. Sales Price :
Avg. Assessed Value :
MEDIAN :
WGT. MEAN :
MEAN :
COD :
PRD :
COV :
STD :
Avg. Abs. Dev :
MAX Sales Ratio :
MIN Sales Ratio :
95% Median C.I. :
95% Wgt. Mean C.I. :
95% Mean C.I. :
160
9,933,050
9,933,050
9,321,386
62,082
58,259
29.18
114.40
40.42
43.39
28.65
264.86
25.22
93.25 to 102.08
89.67 to 98.02
100.63 to 114.07
Printed:3/30/2015 3:53:59PM
Qualified
PAD 2015 R&O Statistics (Using 2015 Values)Jefferson48
Date Range: 10/1/2012 To 9/30/2014 Posted on: 1/1/2015
98
94
107
RESIDENTIAL
Page 1 of 2
Avg. Adj.
RANGE Assd. ValSale Price95%_Median_C.I.MAXMINPRDCODWGT.MEANMEANMEDIANCOUNT
Avg.DATE OF SALE *
_____Qrtrs_____
01-OCT-12 To 31-DEC-12 16 111.33 128.34 108.33 30.01 118.47 66.50 258.92 93.95 to 154.69 39,144 42,404
01-JAN-13 To 31-MAR-13 16 84.15 89.85 84.45 20.62 106.39 59.55 142.93 74.22 to 102.86 85,188 71,942
01-APR-13 To 30-JUN-13 22 83.08 87.68 86.14 17.60 101.79 56.15 133.63 76.25 to 97.58 72,207 62,200
01-JUL-13 To 30-SEP-13 21 98.11 112.25 96.30 30.53 116.56 45.36 207.01 89.31 to 134.45 57,871 55,729
01-OCT-13 To 31-DEC-13 19 98.30 112.59 100.42 36.48 112.12 25.22 224.73 91.01 to 134.63 67,224 67,506
01-JAN-14 To 31-MAR-14 19 107.41 126.86 107.28 30.84 118.25 75.31 264.86 94.80 to 125.15 42,974 46,103
01-APR-14 To 30-JUN-14 21 104.01 107.63 94.08 22.36 114.40 57.04 224.02 88.02 to 112.95 68,929 64,850
01-JUL-14 To 30-SEP-14 26 90.06 99.58 89.62 31.37 111.11 35.14 219.76 72.17 to 102.26 61,487 55,105
_____Study Yrs_____
01-OCT-12 To 30-SEP-13 75 93.44 103.70 91.14 27.46 113.78 45.36 258.92 87.99 to 102.05 63,909 58,243
01-OCT-13 To 30-SEP-14 85 100.27 110.57 96.37 30.72 114.73 25.22 264.86 94.80 to 105.11 60,469 58,272
_____Calendar Yrs_____
01-JAN-13 To 31-DEC-13 78 92.26 100.81 91.34 28.03 110.37 25.22 224.73 87.95 to 98.30 69,796 63,749
_____ALL_____ 160 98.20 107.35 93.84 29.18 114.40 25.22 264.86 93.25 to 102.08 62,082 58,259
Avg. Adj.
RANGE Assd. ValSale Price95%_Median_C.I.MAXMINPRDCODWGT.MEANMEANMEDIANCOUNT
Avg.VALUATION GROUPING
01 103 100.27 112.07 96.99 29.89 115.55 25.22 264.86 95.42 to 104.01 54,070 52,442
08 9 97.58 113.65 105.21 26.53 108.02 77.40 207.01 82.24 to 134.45 71,111 74,815
11 19 88.02 90.79 88.13 14.46 103.02 67.58 123.95 76.25 to 99.84 131,342 115,752
12 25 93.60 103.10 86.60 37.25 119.05 40.76 262.00 72.17 to 119.14 44,732 38,737
15 4 86.41 76.86 71.60 22.98 107.35 35.14 99.50 N/A 27,500 19,691
_____ALL_____ 160 98.20 107.35 93.84 29.18 114.40 25.22 264.86 93.25 to 102.08 62,082 58,259
Avg. Adj.
RANGE Assd. ValSale Price95%_Median_C.I.MAXMINPRDCODWGT.MEANMEANMEDIANCOUNT
Avg.PROPERTY TYPE *
01 160 98.20 107.35 93.84 29.18 114.40 25.22 264.86 93.25 to 102.08 62,082 58,259
06 0 00.00 00.00 00.00 00.00 00.00 00.00 00.00 N/A 0 0
07 0 00.00 00.00 00.00 00.00 00.00 00.00 00.00 N/A 0 0
_____ALL_____ 160 98.20 107.35 93.84 29.18 114.40 25.22 264.86 93.25 to 102.08 62,082 58,259
County 48 - Page 28
Number of Sales :
Total Sales Price :
Total Adj. Sales Price :
Total Assessed Value :
Avg. Adj. Sales Price :
Avg. Assessed Value :
MEDIAN :
WGT. MEAN :
MEAN :
COD :
PRD :
COV :
STD :
Avg. Abs. Dev :
MAX Sales Ratio :
MIN Sales Ratio :
95% Median C.I. :
95% Wgt. Mean C.I. :
95% Mean C.I. :
160
9,933,050
9,933,050
9,321,386
62,082
58,259
29.18
114.40
40.42
43.39
28.65
264.86
25.22
93.25 to 102.08
89.67 to 98.02
100.63 to 114.07
Printed:3/30/2015 3:53:59PM
Qualified
PAD 2015 R&O Statistics (Using 2015 Values)Jefferson48
Date Range: 10/1/2012 To 9/30/2014 Posted on: 1/1/2015
98
94
107
RESIDENTIAL
Page 2 of 2
Avg. Adj.
RANGE Assd. ValSale Price95%_Median_C.I.MAXMINPRDCODWGT.MEANMEANMEDIANCOUNT
Avg.SALE PRICE *
_____Low $ Ranges_____
Less Than 5,000 9 113.69 121.20 112.76 19.30 107.48 87.95 219.76 88.76 to 127.67 3,517 3,965
Less Than 15,000 23 125.15 141.91 140.27 36.68 101.17 25.22 264.86 101.30 to 169.29 6,878 9,648
Less Than 30,000 50 115.75 134.57 131.09 37.83 102.65 25.22 264.86 102.05 to 134.63 15,640 20,502
__Ranges Excl. Low $__
Greater Than 4,999 151 97.03 106.53 93.78 29.59 113.60 25.22 264.86 91.67 to 102.05 65,572 61,495
Greater Than 14,999 137 95.42 101.55 93.09 25.68 109.09 35.14 258.92 90.77 to 99.25 71,349 66,420
Greater Than 29,999 110 93.35 94.98 90.66 21.05 104.77 35.14 207.01 88.46 to 98.29 83,191 75,421
__Incremental Ranges__
0 TO 4,999 9 113.69 121.20 112.76 19.30 107.48 87.95 219.76 88.76 to 127.67 3,517 3,965
5,000 TO 14,999 14 140.69 155.22 147.15 41.74 105.48 25.22 264.86 94.80 to 232.91 9,039 13,302
15,000 TO 29,999 27 110.91 128.33 128.76 37.38 99.67 56.15 258.92 91.60 to 150.58 23,104 29,749
30,000 TO 59,999 41 103.51 105.48 103.92 25.68 101.50 35.14 207.01 93.75 to 112.95 41,778 43,414
60,000 TO 99,999 42 91.54 91.58 91.68 16.82 99.89 51.75 142.93 84.62 to 98.29 77,396 70,960
100,000 TO 149,999 15 82.81 84.07 83.23 11.81 101.01 59.90 107.41 75.17 to 95.73 114,367 95,193
150,000 TO 249,999 9 90.64 84.04 84.98 12.29 98.89 64.99 102.26 67.58 to 98.30 186,778 158,721
250,000 TO 499,999 3 93.44 86.34 85.91 12.17 100.50 65.74 99.84 N/A 263,667 226,525
500,000 TO 999,999 0 00.00 00.00 00.00 00.00 00.00 00.00 00.00 N/A 0 0
1,000,000 + 0 00.00 00.00 00.00 00.00 00.00 00.00 00.00 N/A 0 0
_____ALL_____ 160 98.20 107.35 93.84 29.18 114.40 25.22 264.86 93.25 to 102.08 62,082 58,259
County 48 - Page 29
Number of Sales :
Total Sales Price :
Total Adj. Sales Price :
Total Assessed Value :
Avg. Adj. Sales Price :
Avg. Assessed Value :
MEDIAN :
WGT. MEAN :
MEAN :
COD :
PRD :
COV :
STD :
Avg. Abs. Dev :
MAX Sales Ratio :
MIN Sales Ratio :
95% Median C.I. :
95% Wgt. Mean C.I. :
95% Mean C.I. :
5
126,150
126,150
113,007
25,230
22,601
19.97
112.53
29.03
29.26
20.76
131.11
55.84
N/A
N/A
64.47 to 137.13
Printed:3/30/2015 3:54:00PM
Qualified
PAD 2015 R&O Statistics (Using 2015 Values)Jefferson48
Date Range: 10/1/2011 To 9/30/2014 Posted on: 1/1/2015
104
90
101
COMMERCIAL
Page 1 of 2
Avg. Adj.
RANGE Assd. ValSale Price95%_Median_C.I.MAXMINPRDCODWGT.MEANMEANMEDIANCOUNT
Avg.DATE OF SALE *
_____Qrtrs_____
01-OCT-11 To 31-DEC-11 0 00.00 00.00 00.00 00.00 00.00 00.00 00.00 N/A 0 0
01-JAN-12 To 31-MAR-12 0 00.00 00.00 00.00 00.00 00.00 00.00 00.00 N/A 0 0
01-APR-12 To 30-JUN-12 0 00.00 00.00 00.00 00.00 00.00 00.00 00.00 N/A 0 0
01-JUL-12 To 30-SEP-12 0 00.00 00.00 00.00 00.00 00.00 00.00 00.00 N/A 0 0
01-OCT-12 To 31-DEC-12 0 00.00 00.00 00.00 00.00 00.00 00.00 00.00 N/A 0 0
01-JAN-13 To 31-MAR-13 1 131.11 131.11 131.11 00.00 100.00 131.11 131.11 N/A 13,500 17,700
01-APR-13 To 30-JUN-13 1 55.84 55.84 55.84 00.00 100.00 55.84 55.84 N/A 40,000 22,335
01-JUL-13 To 30-SEP-13 1 103.94 103.94 103.94 00.00 100.00 103.94 103.94 N/A 45,000 46,772
01-OCT-13 To 31-DEC-13 1 92.28 92.28 92.28 00.00 100.00 92.28 92.28 N/A 25,250 23,300
01-JAN-14 To 31-MAR-14 0 00.00 00.00 00.00 00.00 00.00 00.00 00.00 N/A 0 0
01-APR-14 To 30-JUN-14 0 00.00 00.00 00.00 00.00 00.00 00.00 00.00 N/A 0 0
01-JUL-14 To 30-SEP-14 1 120.83 120.83 120.83 00.00 100.00 120.83 120.83 N/A 2,400 2,900
_____Study Yrs_____
01-OCT-11 To 30-SEP-12 0 00.00 00.00 00.00 00.00 00.00 00.00 00.00 N/A 0 0
01-OCT-12 To 30-SEP-13 3 103.94 96.96 88.13 24.14 110.02 55.84 131.11 N/A 32,833 28,936
01-OCT-13 To 30-SEP-14 2 106.56 106.56 94.76 13.40 112.45 92.28 120.83 N/A 13,825 13,100
_____Calendar Yrs_____
01-JAN-12 To 31-DEC-12 0 00.00 00.00 00.00 00.00 00.00 00.00 00.00 N/A 0 0
01-JAN-13 To 31-DEC-13 4 98.11 95.79 88.98 22.15 107.65 55.84 131.11 N/A 30,938 27,527
_____ALL_____ 5 103.94 100.80 89.58 19.97 112.53 55.84 131.11 N/A 25,230 22,601
Avg. Adj.
RANGE Assd. ValSale Price95%_Median_C.I.MAXMINPRDCODWGT.MEANMEANMEDIANCOUNT
Avg.VALUATION GROUPING
19 5 103.94 100.80 89.58 19.97 112.53 55.84 131.11 N/A 25,230 22,601
_____ALL_____ 5 103.94 100.80 89.58 19.97 112.53 55.84 131.11 N/A 25,230 22,601
Avg. Adj.
RANGE Assd. ValSale Price95%_Median_C.I.MAXMINPRDCODWGT.MEANMEANMEDIANCOUNT
Avg.PROPERTY TYPE *
02 0 00.00 00.00 00.00 00.00 00.00 00.00 00.00 N/A 0 0
03 5 103.94 100.80 89.58 19.97 112.53 55.84 131.11 N/A 25,230 22,601
04 0 00.00 00.00 00.00 00.00 00.00 00.00 00.00 N/A 0 0
_____ALL_____ 5 103.94 100.80 89.58 19.97 112.53 55.84 131.11 N/A 25,230 22,601
County 48 - Page 30
Number of Sales :
Total Sales Price :
Total Adj. Sales Price :
Total Assessed Value :
Avg. Adj. Sales Price :
Avg. Assessed Value :
MEDIAN :
WGT. MEAN :
MEAN :
COD :
PRD :
COV :
STD :
Avg. Abs. Dev :
MAX Sales Ratio :
MIN Sales Ratio :
95% Median C.I. :
95% Wgt. Mean C.I. :
95% Mean C.I. :
5
126,150
126,150
113,007
25,230
22,601
19.97
112.53
29.03
29.26
20.76
131.11
55.84
N/A
N/A
64.47 to 137.13
Printed:3/30/2015 3:54:00PM
Qualified
PAD 2015 R&O Statistics (Using 2015 Values)Jefferson48
Date Range: 10/1/2011 To 9/30/2014 Posted on: 1/1/2015
104
90
101
COMMERCIAL
Page 2 of 2
Avg. Adj.
RANGE Assd. ValSale Price95%_Median_C.I.MAXMINPRDCODWGT.MEANMEANMEDIANCOUNT
Avg.SALE PRICE *
_____Low $ Ranges_____
Less Than 5,000 1 120.83 120.83 120.83 00.00 100.00 120.83 120.83 N/A 2,400 2,900
Less Than 15,000 2 125.97 125.97 129.56 04.08 97.23 120.83 131.11 N/A 7,950 10,300
Less Than 30,000 3 120.83 114.74 106.68 10.71 107.56 92.28 131.11 N/A 13,717 14,633
__Ranges Excl. Low $__
Greater Than 4,999 4 98.11 95.79 88.98 22.15 107.65 55.84 131.11 N/A 30,938 27,527
Greater Than 14,999 3 92.28 84.02 83.82 17.37 100.24 55.84 103.94 N/A 36,750 30,802
Greater Than 29,999 2 79.89 79.89 81.30 30.10 98.27 55.84 103.94 N/A 42,500 34,554
__Incremental Ranges__
0 TO 4,999 1 120.83 120.83 120.83 00.00 100.00 120.83 120.83 N/A 2,400 2,900
5,000 TO 14,999 1 131.11 131.11 131.11 00.00 100.00 131.11 131.11 N/A 13,500 17,700
15,000 TO 29,999 1 92.28 92.28 92.28 00.00 100.00 92.28 92.28 N/A 25,250 23,300
30,000 TO 59,999 2 79.89 79.89 81.30 30.10 98.27 55.84 103.94 N/A 42,500 34,554
60,000 TO 99,999 0 00.00 00.00 00.00 00.00 00.00 00.00 00.00 N/A 0 0
100,000 TO 149,999 0 00.00 00.00 00.00 00.00 00.00 00.00 00.00 N/A 0 0
150,000 TO 249,999 0 00.00 00.00 00.00 00.00 00.00 00.00 00.00 N/A 0 0
250,000 TO 499,999 0 00.00 00.00 00.00 00.00 00.00 00.00 00.00 N/A 0 0
500,000 TO 999,999 0 00.00 00.00 00.00 00.00 00.00 00.00 00.00 N/A 0 0
1,000,000 + 0 00.00 00.00 00.00 00.00 00.00 00.00 00.00 N/A 0 0
_____ALL_____ 5 103.94 100.80 89.58 19.97 112.53 55.84 131.11 N/A 25,230 22,601
Avg. Adj.
RANGE Assd. ValSale Price95%_Median_C.I.MAXMINPRDCODWGT.MEANMEANMEDIANCOUNT
Avg.OCCUPANCY CODE
344 1 55.84 55.84 55.84 00.00 100.00 55.84 55.84 N/A 40,000 22,335
353 1 92.28 92.28 92.28 00.00 100.00 92.28 92.28 N/A 25,250 23,300
386 1 103.94 103.94 103.94 00.00 100.00 103.94 103.94 N/A 45,000 46,772
406 2 125.97 125.97 129.56 04.08 97.23 120.83 131.11 N/A 7,950 10,300
_____ALL_____ 5 103.94 100.80 89.58 19.97 112.53 55.84 131.11 N/A 25,230 22,601
County 48 - Page 31
Number of Sales :
Total Sales Price :
Total Adj. Sales Price :
Total Assessed Value :
Avg. Adj. Sales Price :
Avg. Assessed Value :
MEDIAN :
WGT. MEAN :
MEAN :
COD :
PRD :
COV :
STD :
Avg. Abs. Dev :
MAX Sales Ratio :
MIN Sales Ratio :
95% Median C.I. :
95% Wgt. Mean C.I. :
95% Mean C.I. :
48
27,916,847
27,916,847
18,778,593
581,601
391,221
18.90
103.21
24.05
16.70
13.27
125.54
39.95
60.05 to 75.98
62.76 to 71.77
64.71 to 74.15
Printed:3/30/2015 3:54:01PM
Qualified
PAD 2015 R&O Statistics (Using 2015 Values)Jefferson48
Date Range: 10/1/2011 To 9/30/2014 Posted on: 1/1/2015
70
67
69
AGRICULTURAL LAND
Page 1 of 2
Avg. Adj.
RANGE Assd. ValSale Price95%_Median_C.I.MAXMINPRDCODWGT.MEANMEANMEDIANCOUNT
Avg.DATE OF SALE *
_____Qrtrs_____
01-OCT-11 To 31-DEC-11 7 75.50 77.13 76.29 11.64 101.10 57.62 100.28 57.62 to 100.28 626,579 477,989
01-JAN-12 To 31-MAR-12 4 82.20 89.88 77.30 21.68 116.27 69.57 125.54 N/A 423,842 327,639
01-APR-12 To 30-JUN-12 2 72.36 72.36 79.24 30.27 91.32 50.46 94.26 N/A 494,592 391,915
01-JUL-12 To 30-SEP-12 3 71.65 66.08 61.52 12.80 107.41 49.55 77.05 N/A 786,979 484,124
01-OCT-12 To 31-DEC-12 8 77.96 73.46 73.72 11.83 99.65 48.66 84.65 48.66 to 84.65 838,734 618,300
01-JAN-13 To 31-MAR-13 1 48.55 48.55 48.55 00.00 100.00 48.55 48.55 N/A 302,400 146,813
01-APR-13 To 30-JUN-13 1 77.88 77.88 77.88 00.00 100.00 77.88 77.88 N/A 360,000 280,370
01-JUL-13 To 30-SEP-13 7 65.90 67.14 57.72 17.03 116.32 51.04 87.23 51.04 to 87.23 605,186 349,288
01-OCT-13 To 31-DEC-13 2 53.63 53.63 62.55 25.51 85.74 39.95 67.31 N/A 675,550 422,548
01-JAN-14 To 31-MAR-14 5 51.31 50.64 50.37 04.29 100.54 46.70 54.30 N/A 488,487 246,034
01-APR-14 To 30-JUN-14 4 73.41 71.18 73.23 13.08 97.20 52.34 85.58 N/A 171,860 125,861
01-JUL-14 To 30-SEP-14 4 62.50 65.24 62.14 12.16 104.99 55.23 80.73 N/A 598,940 372,152
_____Study Yrs_____
01-OCT-11 To 30-SEP-12 16 75.02 77.65 73.08 17.33 106.25 49.55 125.54 69.38 to 89.85 589,471 430,792
01-OCT-12 To 30-SEP-13 17 73.18 69.65 67.35 15.62 103.41 48.55 87.23 52.32 to 82.36 682,857 459,917
01-OCT-13 To 30-SEP-14 15 55.23 60.41 59.15 19.30 102.13 39.95 85.58 51.31 to 70.83 458,449 271,154
_____Calendar Yrs_____
01-JAN-12 To 31-DEC-12 17 75.93 75.89 72.25 17.09 105.04 48.66 125.54 65.35 to 84.65 691,492 499,597
01-JAN-13 To 31-DEC-13 11 65.90 63.97 59.48 18.65 107.55 39.95 87.23 48.55 to 80.90 568,164 337,936
_____ALL_____ 48 70.20 69.43 67.27 18.90 103.21 39.95 125.54 60.05 to 75.98 581,601 391,221
Avg. Adj.
RANGE Assd. ValSale Price95%_Median_C.I.MAXMINPRDCODWGT.MEANMEANMEDIANCOUNT
Avg.AREA (MARKET)
1 8 72.01 68.40 70.50 11.36 97.02 54.30 79.98 54.30 to 79.98 1,111,103 783,315
2 18 72.04 68.92 65.95 21.32 104.50 39.95 100.28 50.46 to 82.36 504,614 332,780
3 22 70.11 70.22 65.58 19.13 107.08 46.70 125.54 52.32 to 80.90 452,044 296,456
_____ALL_____ 48 70.20 69.43 67.27 18.90 103.21 39.95 125.54 60.05 to 75.98 581,601 391,221
County 48 - Page 32
Number of Sales :
Total Sales Price :
Total Adj. Sales Price :
Total Assessed Value :
Avg. Adj. Sales Price :
Avg. Assessed Value :
MEDIAN :
WGT. MEAN :
MEAN :
COD :
PRD :
COV :
STD :
Avg. Abs. Dev :
MAX Sales Ratio :
MIN Sales Ratio :
95% Median C.I. :
95% Wgt. Mean C.I. :
95% Mean C.I. :
48
27,916,847
27,916,847
18,778,593
581,601
391,221
18.90
103.21
24.05
16.70
13.27
125.54
39.95
60.05 to 75.98
62.76 to 71.77
64.71 to 74.15
Printed:3/30/2015 3:54:01PM
Qualified
PAD 2015 R&O Statistics (Using 2015 Values)Jefferson48
Date Range: 10/1/2011 To 9/30/2014 Posted on: 1/1/2015
70
67
69
AGRICULTURAL LAND
Page 2 of 2
Avg. Adj.
RANGE Assd. ValSale Price95%_Median_C.I.MAXMINPRDCODWGT.MEANMEANMEDIANCOUNT
Avg.95%MLU By Market Area
_____Irrigated_____
County 1 65.35 65.35 65.35 00.00 100.00 65.35 65.35 N/A 1,250,000 816,832
2 1 65.35 65.35 65.35 00.00 100.00 65.35 65.35 N/A 1,250,000 816,832
_____Dry_____
County 6 73.63 70.61 68.53 17.93 103.04 48.55 89.85 48.55 to 89.85 402,400 275,773
1 1 54.30 54.30 54.30 00.00 100.00 54.30 54.30 N/A 700,000 380,082
2 4 80.80 75.00 75.63 14.58 99.17 48.55 89.85 N/A 340,600 257,588
3 1 69.38 69.38 69.38 00.00 100.00 69.38 69.38 N/A 352,000 244,206
_____Grass_____
County 10 61.76 64.50 60.86 19.20 105.98 46.70 87.23 51.31 to 83.31 286,505 174,373
1 1 57.62 57.62 57.62 00.00 100.00 57.62 57.62 N/A 208,052 119,870
2 2 69.79 69.79 65.85 25.00 105.98 52.34 87.23 N/A 77,500 51,034
3 7 65.90 63.97 60.82 16.36 105.18 46.70 83.31 46.70 to 83.31 357,429 217,399
_____ALL_____ 48 70.20 69.43 67.27 18.90 103.21 39.95 125.54 60.05 to 75.98 581,601 391,221
Avg. Adj.
RANGE Assd. ValSale Price95%_Median_C.I.MAXMINPRDCODWGT.MEANMEANMEDIANCOUNT
Avg.80%MLU By Market Area
_____Irrigated_____
County 6 67.46 66.28 66.50 12.13 99.67 49.55 79.38 49.55 to 79.38 1,302,817 866,315
1 3 69.57 67.81 69.14 07.20 98.08 59.41 74.44 N/A 1,570,967 1,086,144
2 3 65.35 64.76 62.48 15.21 103.65 49.55 79.38 N/A 1,034,667 646,485
_____Dry_____
County 13 75.98 69.12 68.69 20.22 100.63 39.95 100.28 48.75 to 83.71 339,812 233,431
1 2 65.14 65.14 58.49 16.64 111.37 54.30 75.98 N/A 434,000 253,865
2 10 77.47 69.88 71.39 21.85 97.88 39.95 100.28 48.55 to 89.85 319,756 228,267
3 1 69.38 69.38 69.38 00.00 100.00 69.38 69.38 N/A 352,000 244,206
_____Grass_____
County 12 68.37 68.74 67.90 20.32 101.24 46.70 94.26 52.34 to 85.58 307,291 208,663
1 1 57.62 57.62 57.62 00.00 100.00 57.62 57.62 N/A 208,052 119,870
2 2 69.79 69.79 65.85 25.00 105.98 52.34 87.23 N/A 77,500 51,034
3 9 70.83 69.74 68.64 18.59 101.60 46.70 94.26 51.31 to 85.58 369,382 253,558
_____ALL_____ 48 70.20 69.43 67.27 18.90 103.21 39.95 125.54 60.05 to 75.98 581,601 391,221
County 48 - Page 33
What IF
48 - Jefferson COUNTY PAD 2015 R&O Statistics 2015 Values What IF Stat Page: 1
RESIDENTIAL IMPROVED Type : Qualified
Number of Sales : 160 Median : 99 COV : 39.84 95% Median C.I. : 94.80 to 102.86
Total Sales Price : 9,933,050 Wgt. Mean : 96 STD : 43.16 95% Wgt. Mean C.I. : 91.58 to 100.09
Total Adj. Sales Price : 9,933,050 Mean : 108 Avg.Abs.Dev : 28.48 95% Mean C.I. : 101.63 to 115.01
Total Assessed Value : 9,519,324
Avg. Adj. Sales Price : 62,082 COD : 28.81 MAX Sales Ratio : 264.86
Avg. Assessed Value : 59,496 PRD : 113.03 MIN Sales Ratio : 25.22
DATE OF SALE *
RANGE COUNT MEDIAN MEAN WGT.MEAN COD PRD MIN MAX 95% Median C.I. Avg.Adj.SalePrice Avg.AssdValue
_____Qrtrs_____
10/01/2012 To 12/31/2012 16 111.33 129.41 112.44 29.05 115.09 66.50 258.92 101.84 to 154.69 39,144 44,012
01/01/2013 To 03/31/2013 16 84.15 90.36 85.35 21.22 105.87 59.55 142.93 74.22 to 102.86 85,188 72,711
04/01/2013 To 06/30/2013 22 85.65 89.06 88.86 17.76 100.23 56.15 133.63 78.19 to 99.47 72,207 64,161
07/01/2013 To 09/30/2013 21 98.11 113.45 98.25 30.38 115.47 45.36 207.01 89.31 to 134.80 57,871 56,861
10/01/2013 To 12/31/2013 19 98.30 113.06 102.25 36.97 110.57 25.22 224.73 91.01 to 134.63 67,224 68,736
01/01/2014 To 03/31/2014 19 107.41 126.86 107.28 30.84 118.25 75.31 264.86 94.80 to 125.15 42,974 46,103
04/01/2014 To 06/30/2014 21 104.01 108.83 95.44 22.18 114.03 57.04 224.02 95.73 to 112.95 68,929 65,782
07/01/2014 To 09/30/2014 26 90.42 101.13 92.75 31.39 109.04 35.14 219.76 76.10 to 103.26 61,487 57,030
_____Study Yrs_____
10/01/2012 To 09/30/2013 75 95.91 104.78 93.32 26.70 112.28 45.36 258.92 89.31 to 102.86 63,909 59,642
10/01/2013 To 09/30/2014 85 101.30 111.45 98.18 30.44 113.52 25.22 264.86 95.42 to 107.41 60,469 59,366
_____Calendar Yrs_____
01/01/2013 To 12/31/2013 78 94.34 101.74 93.22 27.39 109.14 25.22 224.73 88.76 to 99.38 69,796 65,064
VALUATION GROUPING
RANGE COUNT MEDIAN MEAN WGT.MEAN COD PRD MIN MAX 95% Median C.I. Avg.Adj.SalePrice Avg.AssdValue
01 103 100.27 112.07 96.99 29.89 115.55 25.22 264.86 95.42 to 104.01 54,070 52,442
08 9 97.58 113.65 105.21 26.53 108.02 77.40 207.01 82.24 to 134.45 71,111 74,815
11 19 95.94 98.96 96.06 14.47 103.02 73.66 135.11 83.11 to 108.83 131,342 126,169
12 25 93.60 103.10 86.60 37.25 119.05 40.76 262.00 72.17 to 119.14 44,732 38,737
15 4 86.41 76.86 71.60 22.98 107.35 35.14 99.50 N/A 27,500 19,691
County 48 - Page 34
What IF
48 - Jefferson COUNTY PAD 2015 R&O Statistics 2015 Values What IF Stat Page: 2
RESIDENTIAL IMPROVED Type : Qualified
Number of Sales : 160 Median : 99 COV : 39.84 95% Median C.I. : 94.80 to 102.86
Total Sales Price : 9,933,050 Wgt. Mean : 96 STD : 43.16 95% Wgt. Mean C.I. : 91.58 to 100.09
Total Adj. Sales Price : 9,933,050 Mean : 108 Avg.Abs.Dev : 28.48 95% Mean C.I. : 101.63 to 115.01
Total Assessed Value : 9,519,324
Avg. Adj. Sales Price : 62,082 COD : 28.81 MAX Sales Ratio : 264.86
Avg. Assessed Value : 59,496 PRD : 113.03 MIN Sales Ratio : 25.22
PROPERTY TYPE *
RANGE COUNT MEDIAN MEAN WGT.MEAN COD PRD MIN MAX 95% Median C.I. Avg.Adj.SalePrice Avg.AssdValue
01 160 98.87 108.32 95.83 28.81 113.03 25.22 264.86 94.80 to 102.86 62,082 59,496
06
07
SALE PRICE *
RANGE COUNT MEDIAN MEAN WGT.MEAN COD PRD MIN MAX 95% Median C.I. Avg.Adj.SalePrice Avg.AssdValue
Less Than 5,000 9 113.69 121.20 112.76 19.30 107.48 87.95 219.76 88.76 to 127.67 3,517 3,965
Less Than 15,000 23 125.15 141.91 140.27 36.68 101.17 25.22 264.86 101.30 to 169.29 6,878 9,648
Less Than 30,000 50 118.04 134.78 131.29 37.28 102.66 25.22 264.86 102.05 to 134.63 15,640 20,534
__Ranges Excl. Low $__
Greater Than 4,999 151 98.30 107.55 95.78 29.04 112.29 25.22 264.86 93.60 to 102.09 65,572 62,806
Greater Than 15,000 137 97.03 102.68 95.12 25.18 107.95 35.14 258.92 91.60 to 101.67 71,349 67,864
Greater Than 30,000 110 95.69 96.29 92.80 20.48 103.76 35.14 207.01 90.04 to 99.17 83,191 77,206
__Incremental Ranges__
0 TO 4,999 9 113.69 121.20 112.76 19.30 107.48 87.95 219.76 88.76 to 127.67 3,517 3,965
5,000 TO 14,999 14 140.69 155.22 147.15 41.74 105.48 25.22 264.86 94.80 to 232.91 9,039 13,302
15,000 TO 29,999 27 110.91 128.72 129.01 37.73 99.78 56.15 258.92 91.60 to 150.58 23,104 29,807
30,000 TO 59,999 41 103.94 106.14 104.72 25.55 101.36 35.14 207.01 93.75 to 112.95 41,778 43,749
60,000 TO 99,999 42 94.34 92.41 92.45 16.30 99.96 51.75 142.93 88.46 to 98.29 77,396 71,557
100,000 TO 149,999 15 83.41 85.43 84.71 10.99 100.85 59.90 107.41 77.40 to 95.73 114,367 96,883
150,000 TO 249,999 9 90.64 89.06 90.17 13.04 98.77 64.99 111.47 73.66 to 99.47 186,778 168,422
250,000 TO 499,999 3 101.84 92.14 91.59 14.10 100.60 65.74 108.83 N/A 263,667 241,489
500,000 TO 999,999
1,000,000 +
County 48 - Page 35
What IF
48 - Jefferson COUNTY Printed: 04/06/2015
RESIDENTIAL IMPROVED - ADJUSTED
SUMMARY OF ADJUSTED PARAMETERS FOR CALCULATION FROM USER FILE
Strata Heading Strata Change Value Change Type Percent Change
VALUATION GROUPING 11 Total Increase 9%
County 48 - Page 36
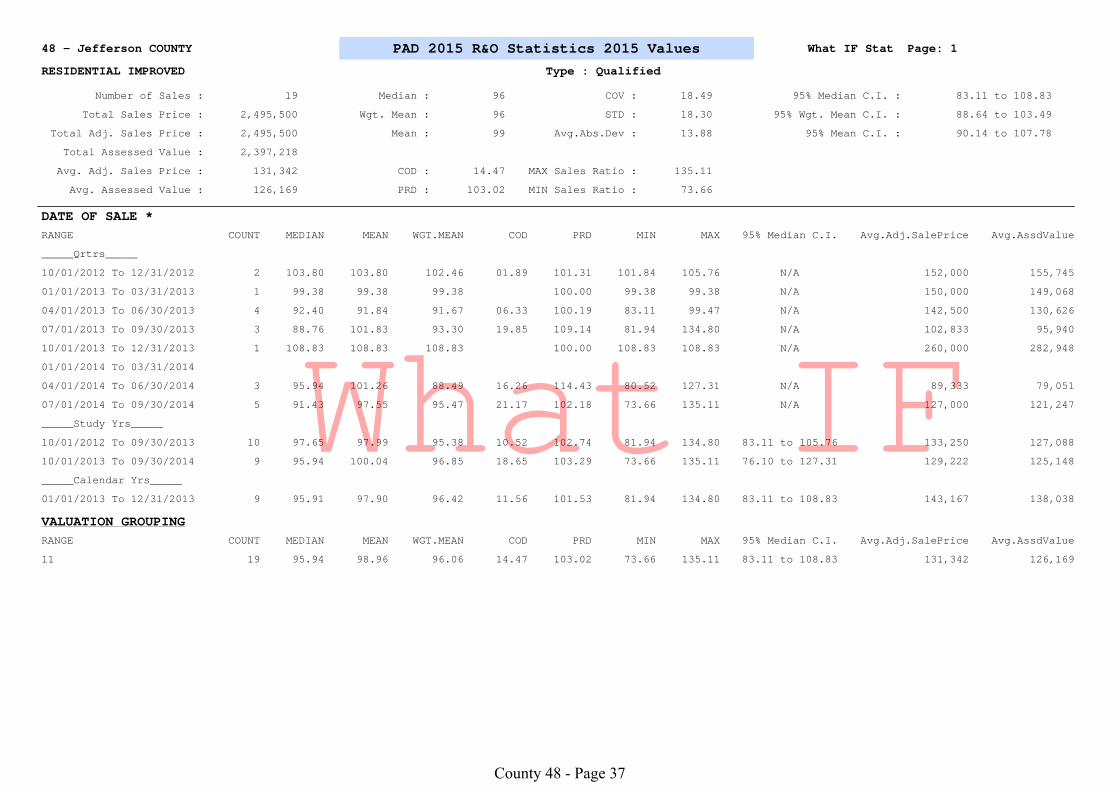
What IF
48 - Jefferson COUNTY PAD 2015 R&O Statistics 2015 Values What IF Stat Page: 1
RESIDENTIAL IMPROVED Type : Qualified
Number of Sales : 19 Median : 96 COV : 18.49 95% Median C.I. : 83.11 to 108.83
Total Sales Price : 2,495,500 Wgt. Mean : 96 STD : 18.30 95% Wgt. Mean C.I. : 88.64 to 103.49
Total Adj. Sales Price : 2,495,500 Mean : 99 Avg.Abs.Dev : 13.88 95% Mean C.I. : 90.14 to 107.78
Total Assessed Value : 2,397,218
Avg. Adj. Sales Price : 131,342 COD : 14.47 MAX Sales Ratio : 135.11
Avg. Assessed Value : 126,169 PRD : 103.02 MIN Sales Ratio : 73.66
DATE OF SALE *
RANGE COUNT MEDIAN MEAN WGT.MEAN COD PRD MIN MAX 95% Median C.I. Avg.Adj.SalePrice Avg.AssdValue
_____Qrtrs_____
10/01/2012 To 12/31/2012 2 103.80 103.80 102.46 01.89 101.31 101.84 105.76 N/A 152,000 155,745
01/01/2013 To 03/31/2013 1 99.38 99.38 99.38 100.00 99.38 99.38 N/A 150,000 149,068
04/01/2013 To 06/30/2013 4 92.40 91.84 91.67 06.33 100.19 83.11 99.47 N/A 142,500 130,626
07/01/2013 To 09/30/2013 3 88.76 101.83 93.30 19.85 109.14 81.94 134.80 N/A 102,833 95,940
10/01/2013 To 12/31/2013 1 108.83 108.83 108.83 100.00 108.83 108.83 N/A 260,000 282,948
01/01/2014 To 03/31/2014
04/01/2014 To 06/30/2014 3 95.94 101.26 88.49 16.26 114.43 80.52 127.31 N/A 89,333 79,051
07/01/2014 To 09/30/2014 5 91.43 97.55 95.47 21.17 102.18 73.66 135.11 N/A 127,000 121,247
_____Study Yrs_____
10/01/2012 To 09/30/2013 10 97.65 97.99 95.38 10.52 102.74 81.94 134.80 83.11 to 105.76 133,250 127,088
10/01/2013 To 09/30/2014 9 95.94 100.04 96.85 18.65 103.29 73.66 135.11 76.10 to 127.31 129,222 125,148
_____Calendar Yrs_____
01/01/2013 To 12/31/2013 9 95.91 97.90 96.42 11.56 101.53 81.94 134.80 83.11 to 108.83 143,167 138,038
VALUATION GROUPING
RANGE COUNT MEDIAN MEAN WGT.MEAN COD PRD MIN MAX 95% Median C.I. Avg.Adj.SalePrice Avg.AssdValue
11 19 95.94 98.96 96.06 14.47 103.02 73.66 135.11 83.11 to 108.83 131,342 126,169
County 48 - Page 37
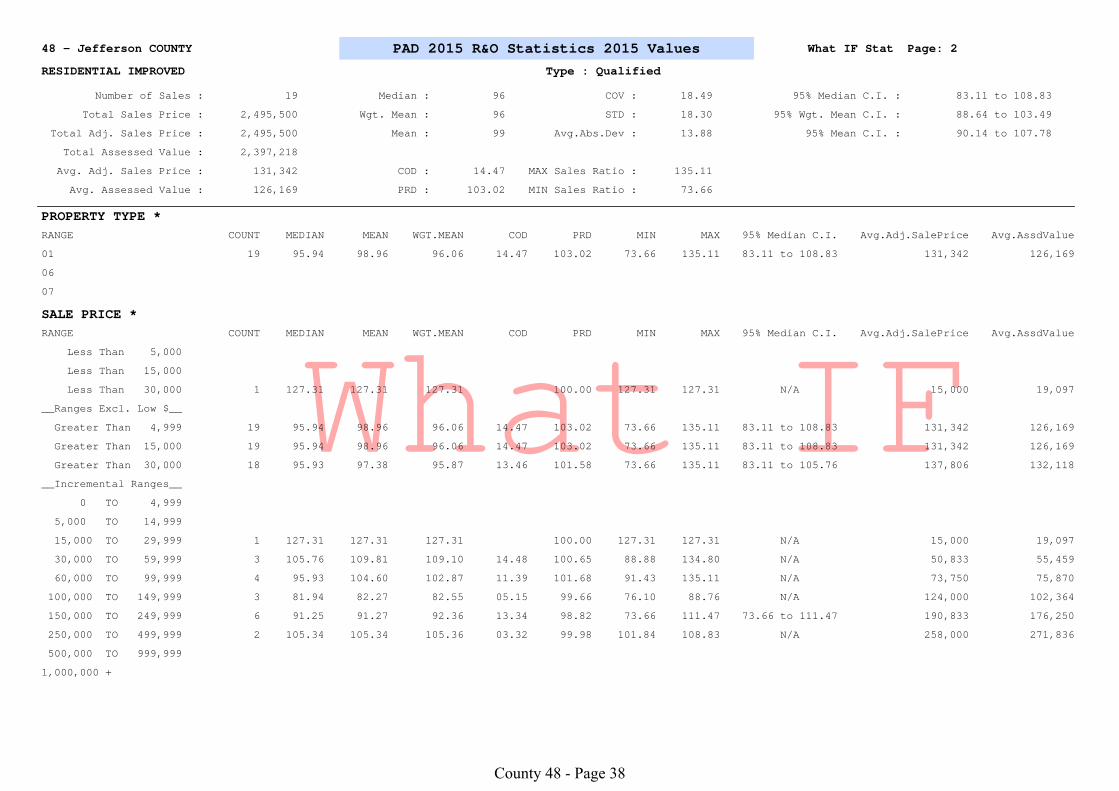
What IF
48 - Jefferson COUNTY PAD 2015 R&O Statistics 2015 Values What IF Stat Page: 2
RESIDENTIAL IMPROVED Type : Qualified
Number of Sales : 19 Median : 96 COV : 18.49 95% Median C.I. : 83.11 to 108.83
Total Sales Price : 2,495,500 Wgt. Mean : 96 STD : 18.30 95% Wgt. Mean C.I. : 88.64 to 103.49
Total Adj. Sales Price : 2,495,500 Mean : 99 Avg.Abs.Dev : 13.88 95% Mean C.I. : 90.14 to 107.78
Total Assessed Value : 2,397,218
Avg. Adj. Sales Price : 131,342 COD : 14.47 MAX Sales Ratio : 135.11
Avg. Assessed Value : 126,169 PRD : 103.02 MIN Sales Ratio : 73.66
PROPERTY TYPE *
RANGE COUNT MEDIAN MEAN WGT.MEAN COD PRD MIN MAX 95% Median C.I. Avg.Adj.SalePrice Avg.AssdValue
01 19 95.94 98.96 96.06 14.47 103.02 73.66 135.11 83.11 to 108.83 131,342 126,169
06
07
SALE PRICE *
RANGE COUNT MEDIAN MEAN WGT.MEAN COD PRD MIN MAX 95% Median C.I. Avg.Adj.SalePrice Avg.AssdValue
Less Than 5,000
Less Than 15,000
Less Than 30,000 1 127.31 127.31 127.31 100.00 127.31 127.31 N/A 15,000 19,097
__Ranges Excl. Low $__
Greater Than 4,999 19 95.94 98.96 96.06 14.47 103.02 73.66 135.11 83.11 to 108.83 131,342 126,169
Greater Than 15,000 19 95.94 98.96 96.06 14.47 103.02 73.66 135.11 83.11 to 108.83 131,342 126,169
Greater Than 30,000 18 95.93 97.38 95.87 13.46 101.58 73.66 135.11 83.11 to 105.76 137,806 132,118
__Incremental Ranges__
0 TO 4,999
5,000 TO 14,999
15,000 TO 29,999 1 127.31 127.31 127.31 100.00 127.31 127.31 N/A 15,000 19,097
30,000 TO 59,999 3 105.76 109.81 109.10 14.48 100.65 88.88 134.80 N/A 50,833 55,459
60,000 TO 99,999 4 95.93 104.60 102.87 11.39 101.68 91.43 135.11 N/A 73,750 75,870
100,000 TO 149,999 3 81.94 82.27 82.55 05.15 99.66 76.10 88.76 N/A 124,000 102,364
150,000 TO 249,999 6 91.25 91.27 92.36 13.34 98.82 73.66 111.47 73.66 to 111.47 190,833 176,250
250,000 TO 499,999 2 105.34 105.34 105.36 03.32 99.98 101.84 108.83 N/A 258,000 271,836
500,000 TO 999,999
1,000,000 +
County 48 - Page 38

What IF
48 - Jefferson COUNTY Printed: 04/06/2015
RESIDENTIAL IMPROVED - ADJUSTED
SUMMARY OF ADJUSTED PARAMETERS FOR CALCULATION FROM USER FILE
Strata Heading Strata Change Value Change Type Percent Change
VALUATION GROUPING 11 Total Increase 9%
County 48 - Page 39

County R
eports
County 48 - Page 40
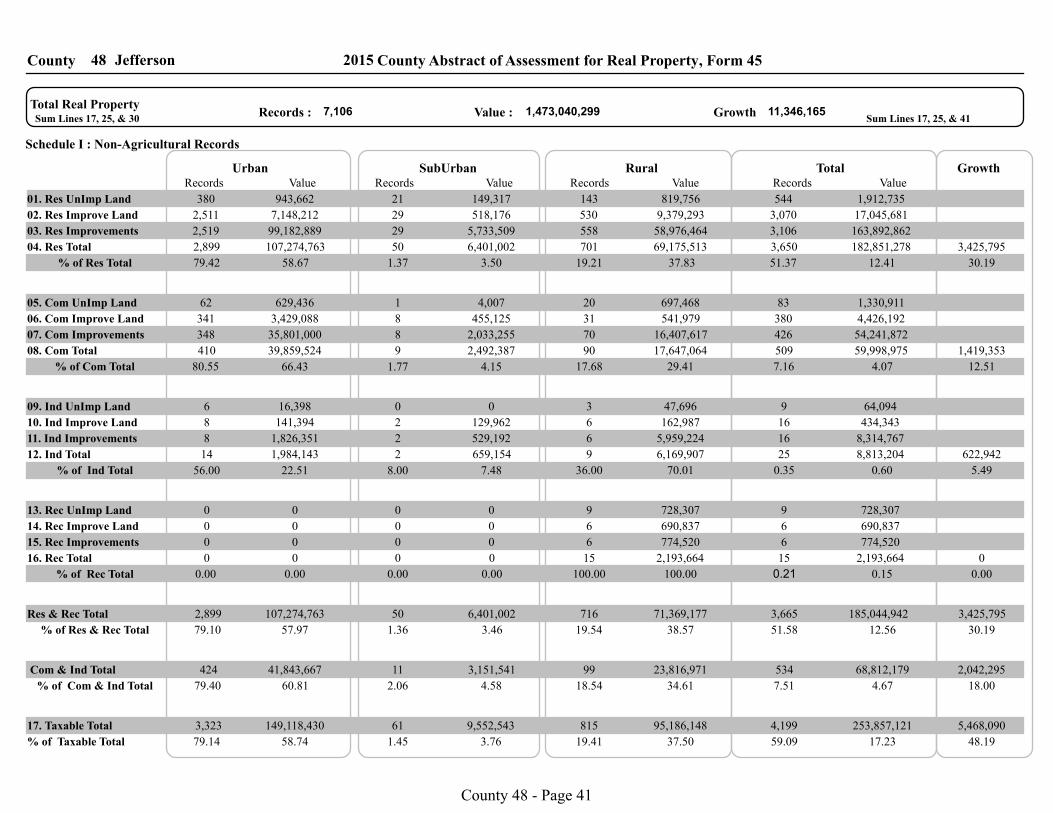
JeffersonCounty 48 2015 County Abstract of Assessment for Real Property, Form 45
01. Res UnImp Land
02. Res Improve Land
380 943,662 21 149,317 143 819,756 544 1,912,735
2,511 7,148,212 29 518,176 530 9,379,293 3,070 17,045,681
2,519 99,182,889 29 5,733,509 558 58,976,464 3,106 163,892,862
3,650 182,851,278 3,425,795
1,330,911 83 697,468 20 4,007 1 629,436 62
341 3,429,088 8 455,125 31 541,979 380 4,426,192
54,241,872 426 16,407,617 70 2,033,255 8 35,801,000 348
509 59,998,975 1,419,353
03. Res Improvements
04. Res Total
05. Com UnImp Land
06. Com Improve Land
07. Com Improvements
08. Com Total
7,106 1,473,040,299 11,346,165 Total Real Property
Growth Value : Records : Sum Lines 17, 25, & 30 Sum Lines 17, 25, & 41
09. Ind UnImp Land
10. Ind Improve Land
11. Ind Improvements
12. Ind Total
13. Rec UnImp Land
14. Rec Improve Land
15. Rec Improvements
16. Rec Total
17. Taxable Total
6 16,398 0 0 3 47,696 9 64,094
8 141,394 2 129,962 6 162,987 16 434,343
8 1,826,351 2 529,192 6 5,959,224 16 8,314,767
25 8,813,204 622,942
0 0 0 0 9 728,307 9 728,307
0 0 0 0 6 690,837 6 690,837
0 0 0 0 6 774,520 6 774,520
15 2,193,664 0
4,199 253,857,121 5,468,090
Urban SubUrban Rural Total GrowthRecords Value Records Value Records Value Records Value
Schedule I : Non-Agricultural Records
% of Res Total
% of Com Total
% of Ind Total
% of Rec Total
% of Taxable Total
% of Res & Rec Total
Res & Rec Total
% of Com & Ind Total
Com & Ind Total
79.42 58.67 1.37 3.50 19.21 37.83 51.37 12.41
19.41 37.50 59.09 17.23
424 41,843,667 11 3,151,541 99 23,816,971 534 68,812,179
3,665 185,044,942 2,899 107,274,763 716 71,369,177 50 6,401,002
57.97 79.10 12.56 51.58 3.46 1.36 38.57 19.54
0.00 0.00 0.15 0.21 0.00 0.00 100.00 100.00
60.81 79.40 4.67 7.51 4.58 2.06 34.61 18.54
36.00 70.01 0.35 0.60 7.48 8.00 22.51 56.00
66.43 80.55 4.07 7.16 4.15 1.77 29.41 17.68
3.76 1.45 58.74 79.14
701 69,175,513 50 6,401,002 2,899 107,274,763
90 17,647,064 9 2,492,387 410 39,859,524
9 6,169,907 2 659,154 14 1,984,143
15 2,193,664 0 0 0 0
3,323 149,118,430 61 9,552,543 815 95,186,148
12.51
5.49
0.00
30.19
48.19
18.00
30.19
2,042,295
3,425,795
County 48 - Page 41
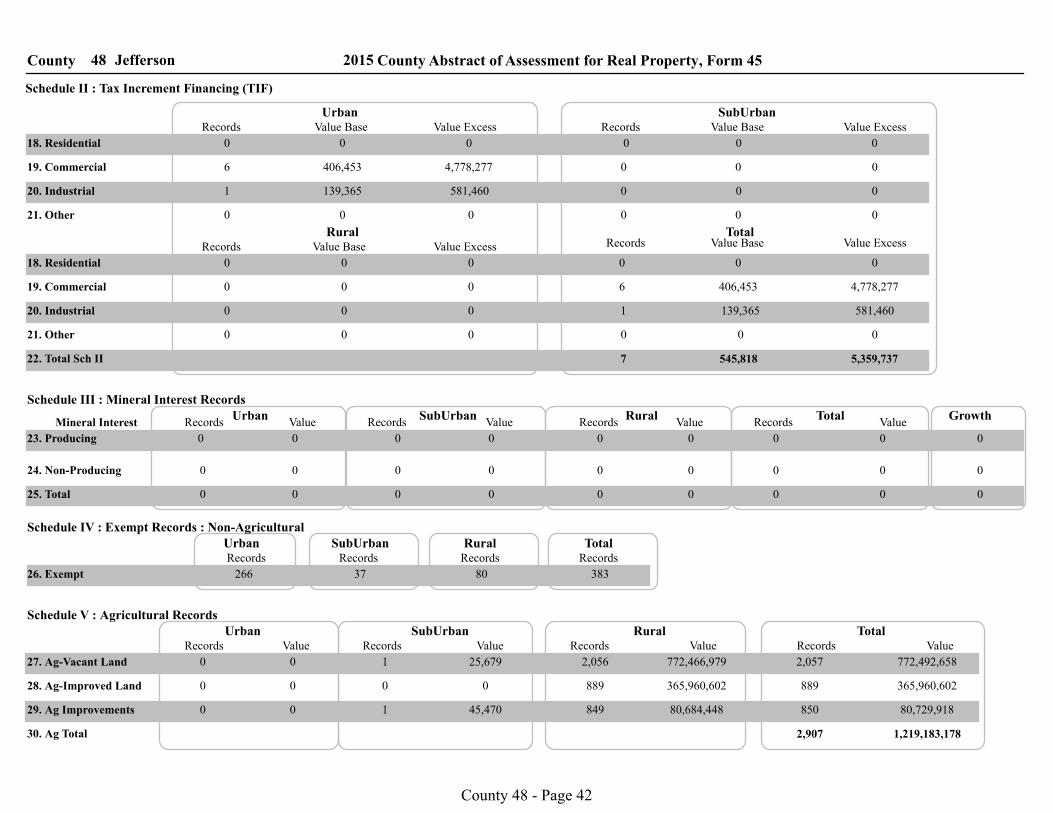
JeffersonCounty 48 2015 County Abstract of Assessment for Real Property, Form 45
18. Residential
Records
TotalRural
SubUrban Urban
Schedule II : Tax Increment Financing (TIF)
Value Base Value Excess Value ExcessValue BaseRecords
0 0 0 0 0 0
19. Commercial
20. Industrial
21. Other
22. Total Sch II
6 406,453 4,778,277
1 139,365 581,460
0 0 0 0 0 0
0 0 0
0 0 0
Value ExcessValue BaseRecordsValue ExcessValue BaseRecords
21. Other
20. Industrial
19. Commercial
18. Residential 0 0 0 0 0 0
0 0 0 6 406,453 4,778,277
0 0 0 1 139,365 581,460
0 0 0 0 0 0
7 545,818 5,359,737
23. Producing
GrowthValueRecords
TotalValueRecords
RuralValueRecords
SubUrbanValueRecords
UrbanSchedule III : Mineral Interest Records
0 0 0 0 0 0 0 0 0
0 0 0 0 0 0 0 0 0
0 0 0 0 0 0 0 0 0
Mineral Interest
24. Non-Producing
25. Total
Schedule IV : Exempt Records : Non-Agricultural
Schedule V : Agricultural Records
Records Records Records RecordsTotalRural SubUrban Urban
26. Exempt 266 37 80 383
30. Ag Total
29. Ag Improvements
28. Ag-Improved Land
ValueRecordsTotal
ValueRecordsRural
Records Value SubUrban
ValueRecords
27. Ag-Vacant Land
Urban
0 0 1 25,679 2,056 772,466,979 2,057 772,492,658
0 0 0 0 889 365,960,602 889 365,960,602
0 0 1 45,470 849 80,684,448 850 80,729,918
2,907 1,219,183,178
County 48 - Page 42
JeffersonCounty 48 2015 County Abstract of Assessment for Real Property, Form 45
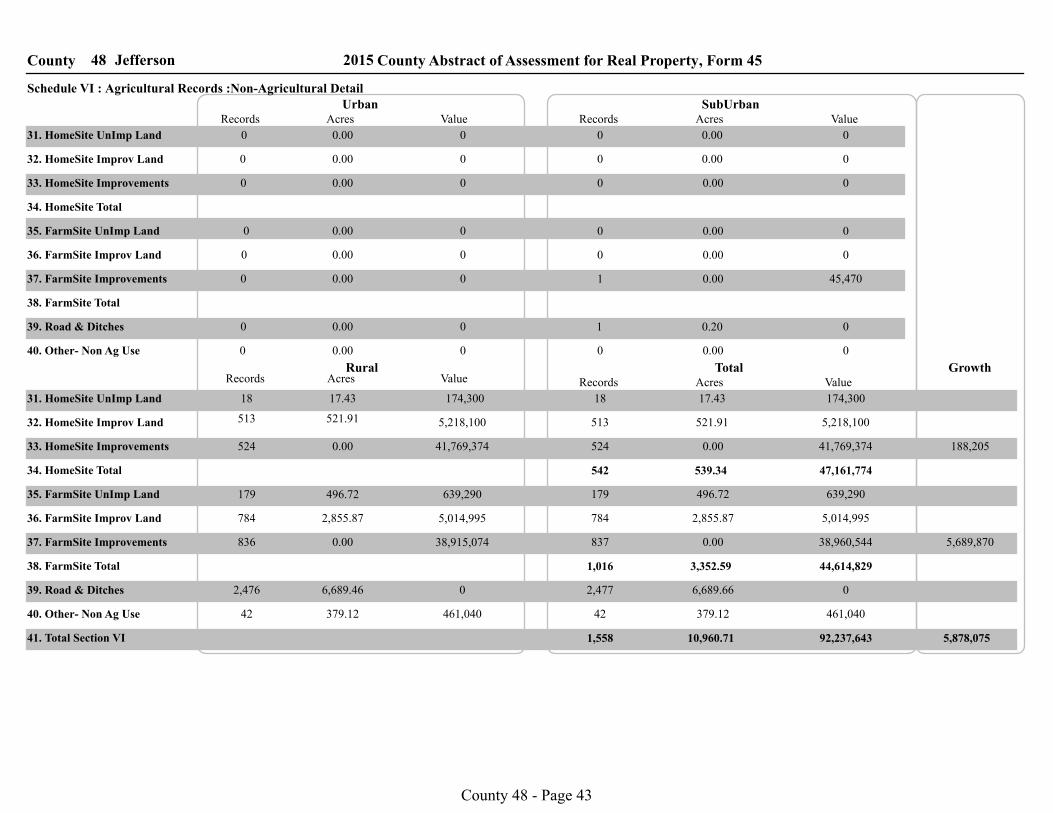
31. HomeSite UnImp Land
Records
TotalRural
SubUrban UrbanSchedule VI : Agricultural Records :Non-Agricultural Detail
Acres Value ValueAcresRecords
32. HomeSite Improv Land
33. HomeSite Improvements
34. HomeSite Total
ValueAcresRecordsValueAcres
34. HomeSite Total
33. HomeSite Improvements
32. HomeSite Improv Land
31. HomeSite UnImp Land
35. FarmSite UnImp Land
36. FarmSite Improv Land
37. FarmSite Improvements
38. FarmSite Total
37. FarmSite Improvements
36. FarmSite Improv Land
35. FarmSite UnImp Land
39. Road & Ditches
38. FarmSite Total
39. Road & Ditches
Records
40. Other- Non Ag Use
40. Other- Non Ag Use
41. Total Section VI
0 0.00 0 0 0.00 0
0 0.00 0
0 0.00 0 0
0 0.00 0 0
0 0.00 0 0
0 0.00 0 1
0 0.00 0 1
0 0.00 0 0 0.00 0
0 0.20
45,470 0.00
0 0.00
0.00 0
0 0.00
0 0.00 0
18 174,300 17.43 18 17.43 174,300
513 521.91 5,218,100 513 521.91 5,218,100
524 0.00 41,769,374 524 0.00 41,769,374
542 539.34 47,161,774
496.72 179 639,290 179 496.72 639,290
784 2,855.87 5,014,995 784 2,855.87 5,014,995
836 0.00 38,915,074 837 0.00 38,960,544
1,016 3,352.59 44,614,829
2,476 6,689.46 0 2,477 6,689.66 0
42 379.12 461,040 42 379.12 461,040
1,558 10,960.71 92,237,643
Growth
5,689,870
188,205
5,878,075
County 48 - Page 43
JeffersonCounty 48 2015 County Abstract of Assessment for Real Property, Form 45
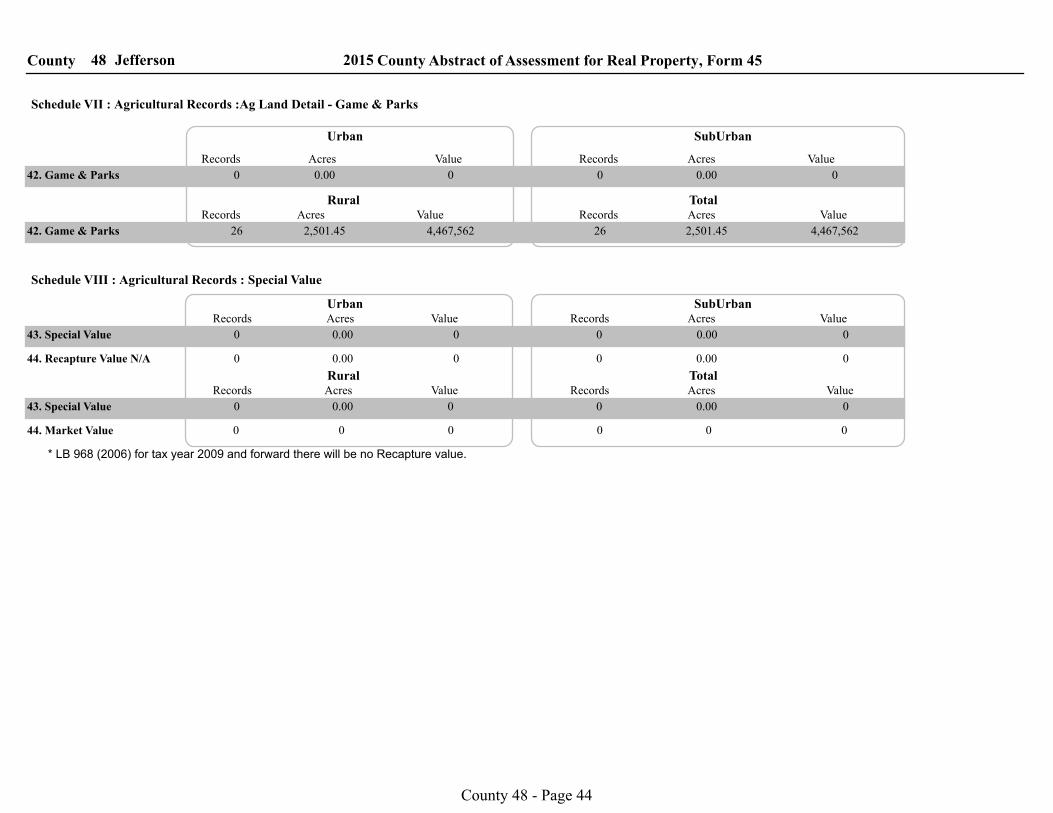
42. Game & Parks
ValueAcresRecords
SubUrban
ValueAcresRecords
Urban
0 0.00 0 0 0.00 0
42. Game & Parks
ValueAcresRecordsTotal
ValueAcresRecordsRural
Schedule VII : Agricultural Records :Ag Land Detail - Game & Parks
26 2,501.45 4,467,562 26 2,501.45 4,467,562
Schedule VIII : Agricultural Records : Special Value
43. Special Value
ValueAcresRecords SubUrban
ValueAcresRecords Urban
43. Special Value
ValueAcresRecordsTotal
ValueAcresRecordsRural
44. Recapture Value N/A
44. Market Value
0 0.00 0 0 0.00 0
0 0.00 0 0 0.00 0
0 0.00 0 0 0.00 0
* LB 968 (2006) for tax year 2009 and forward there will be no Recapture value.
0 0 0 0 0 0
County 48 - Page 44
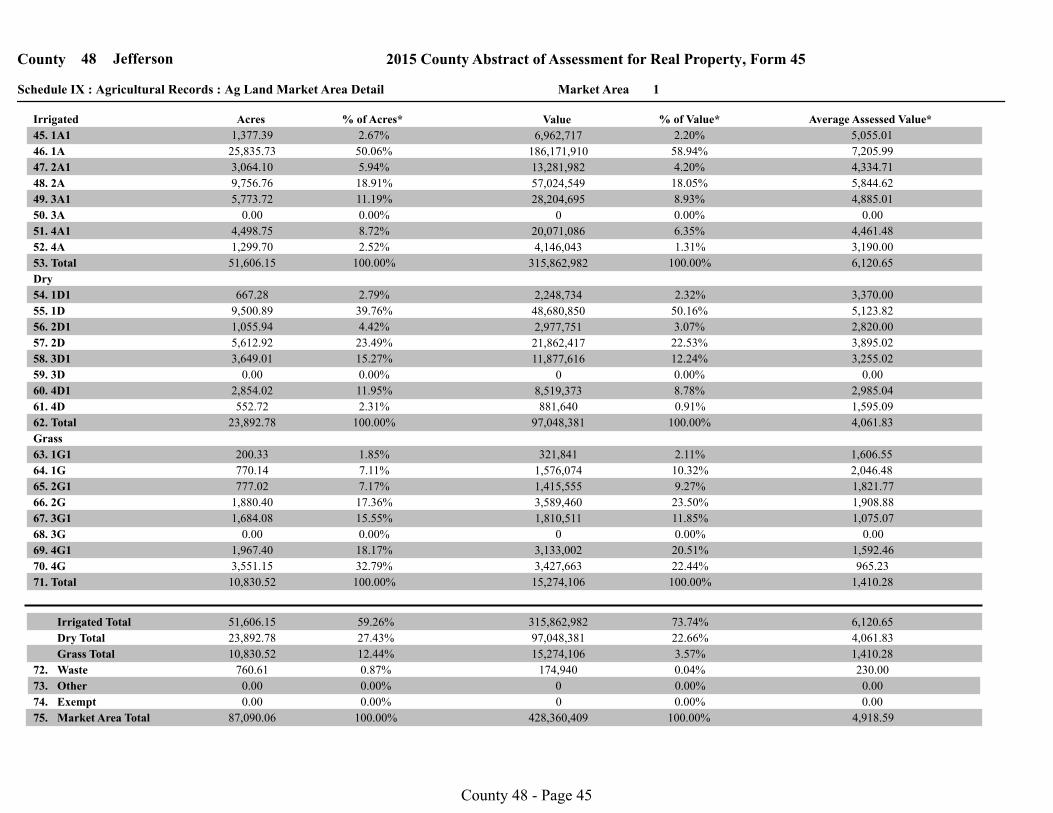
1Market AreaSchedule IX : Agricultural Records : Ag Land Market Area Detail
2015 County Abstract of Assessment for Real Property, Form 45Jefferson48County
45. 1A1
ValueAcres
46. 1A
47. 2A1
48. 2A
49. 3A1
50. 3A
51. 4A1
52. 4A
53. Total
54. 1D1
55. 1D
56. 2D1
57. 2D
58. 3D1
59. 3D
60. 4D1
61. 4D
62. Total
63. 1G1
64. 1G
65. 2G1
66. 2G
67. 3G1
68. 3G
69. 4G1
70. 4G
71. Total
Waste
Other
Exempt
Irrigated
Dry
Grass
Market Area Total 428,360,409 87,090.06
0 0.00
0 0.00
174,940 760.61
15,274,106 10,830.52
3,427,663 3,551.15
3,133,002 1,967.40
0 0.00
1,810,511 1,684.08
3,589,460 1,880.40
1,415,555 777.02
1,576,074 770.14
321,841 200.33
97,048,381 23,892.78
881,640 552.72
2,854.02 8,519,373
0 0.00
11,877,616 3,649.01
21,862,417 5,612.92
2,977,751 1,055.94
48,680,850 9,500.89
2,248,734 667.28
315,862,982 51,606.15
4,146,043 1,299.70
20,071,086 4,498.75
0 0.00
28,204,695 5,773.72
57,024,549 9,756.76
13,281,982 3,064.10
186,171,910 25,835.73
6,962,717 1,377.39
% of Acres* % of Value*
2.67%
50.06%
39.76%
2.79%
1.85%
7.11%
18.91%
5.94%
23.49%
4.42%
17.36%
7.17%
11.19%
0.00%
0.00%
15.27%
15.55%
0.00%
2.52%
8.72%
11.95%
2.31%
32.79%
18.17%
100.00%
100.00%
100.00%
Grass Total
Dry Total
Irrigated Total 51,606.15
23,892.78
10,830.52
315,862,982
97,048,381
15,274,106
59.26%
27.43%
12.44%
0.87%
0.00%
0.00%
100.00%
Average Assessed Value*
58.94%
2.20%
18.05%
4.20%
8.93%
0.00%
6.35%
1.31%
100.00%
2.32%
50.16%
10.32%
2.11%
3.07%
22.53%
9.27%
23.50%
12.24%
0.00%
11.85%
0.00%
8.78%
0.91%
20.51%
22.44%
100.00%
100.00%
5,055.01
7,205.99
5,123.82
3,370.00
1,606.55
2,046.48
5,844.62
4,334.71
2,820.00
3,895.02
1,908.88
1,821.77
4,885.01
0.00
3,255.02
0.00
1,075.07
0.00
4,461.48
3,190.00
2,985.04
1,595.09
965.23
1,592.46
6,120.65
4,061.83
1,410.28
0.00% 0.00
0.00% 0.00
100.00% 4,918.59
4,061.83 22.66%
1,410.28 3.57%
6,120.65 73.74%
230.00 0.04%72.
73.
74.
75.
County 48 - Page 45
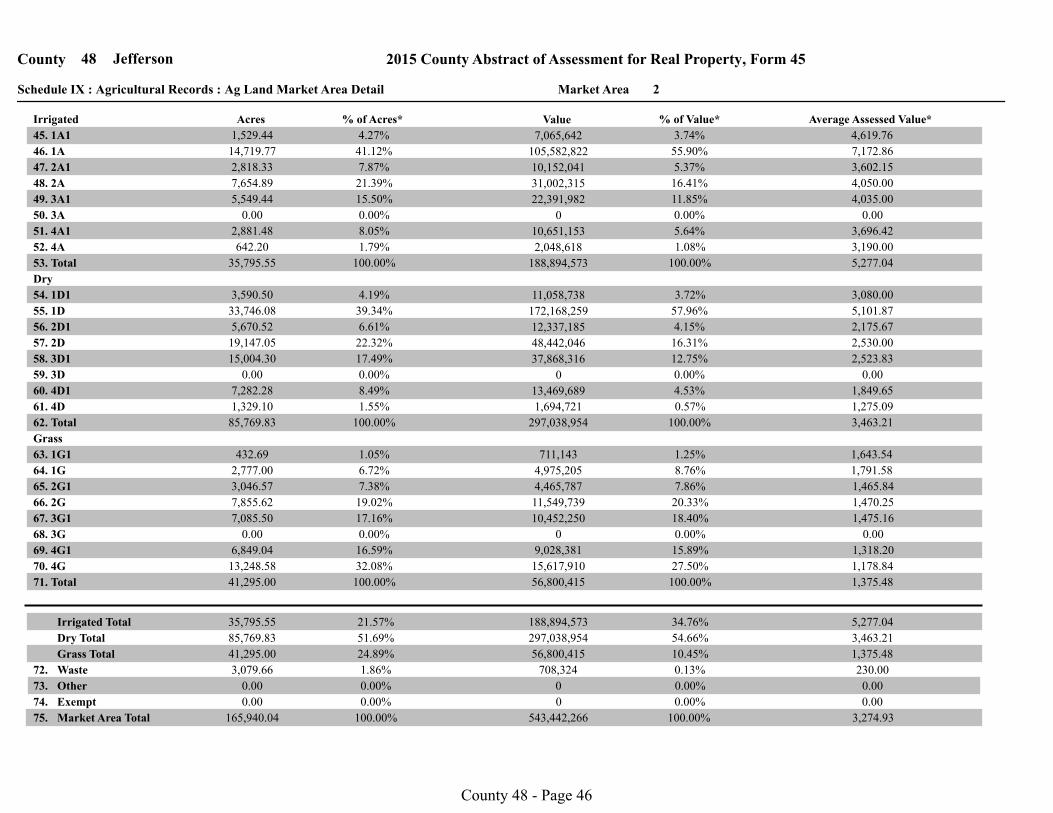
2Market AreaSchedule IX : Agricultural Records : Ag Land Market Area Detail
2015 County Abstract of Assessment for Real Property, Form 45Jefferson48County
45. 1A1
ValueAcres
46. 1A
47. 2A1
48. 2A
49. 3A1
50. 3A
51. 4A1
52. 4A
53. Total
54. 1D1
55. 1D
56. 2D1
57. 2D
58. 3D1
59. 3D
60. 4D1
61. 4D
62. Total
63. 1G1
64. 1G
65. 2G1
66. 2G
67. 3G1
68. 3G
69. 4G1
70. 4G
71. Total
Waste
Other
Exempt
Irrigated
Dry
Grass
Market Area Total 543,442,266 165,940.04
0 0.00
0 0.00
708,324 3,079.66
56,800,415 41,295.00
15,617,910 13,248.58
9,028,381 6,849.04
0 0.00
10,452,250 7,085.50
11,549,739 7,855.62
4,465,787 3,046.57
4,975,205 2,777.00
711,143 432.69
297,038,954 85,769.83
1,694,721 1,329.10
7,282.28 13,469,689
0 0.00
37,868,316 15,004.30
48,442,046 19,147.05
12,337,185 5,670.52
172,168,259 33,746.08
11,058,738 3,590.50
188,894,573 35,795.55
2,048,618 642.20
10,651,153 2,881.48
0 0.00
22,391,982 5,549.44
31,002,315 7,654.89
10,152,041 2,818.33
105,582,822 14,719.77
7,065,642 1,529.44
% of Acres* % of Value*
4.27%
41.12%
39.34%
4.19%
1.05%
6.72%
21.39%
7.87%
22.32%
6.61%
19.02%
7.38%
15.50%
0.00%
0.00%
17.49%
17.16%
0.00%
1.79%
8.05%
8.49%
1.55%
32.08%
16.59%
100.00%
100.00%
100.00%
Grass Total
Dry Total
Irrigated Total 35,795.55
85,769.83
41,295.00
188,894,573
297,038,954
56,800,415
21.57%
51.69%
24.89%
1.86%
0.00%
0.00%
100.00%
Average Assessed Value*
55.90%
3.74%
16.41%
5.37%
11.85%
0.00%
5.64%
1.08%
100.00%
3.72%
57.96%
8.76%
1.25%
4.15%
16.31%
7.86%
20.33%
12.75%
0.00%
18.40%
0.00%
4.53%
0.57%
15.89%
27.50%
100.00%
100.00%
4,619.76
7,172.86
5,101.87
3,080.00
1,643.54
1,791.58
4,050.00
3,602.15
2,175.67
2,530.00
1,470.25
1,465.84
4,035.00
0.00
2,523.83
0.00
1,475.16
0.00
3,696.42
3,190.00
1,849.65
1,275.09
1,178.84
1,318.20
5,277.04
3,463.21
1,375.48
0.00% 0.00
0.00% 0.00
100.00% 3,274.93
3,463.21 54.66%
1,375.48 10.45%
5,277.04 34.76%
230.00 0.13%72.
73.
74.
75.
County 48 - Page 46
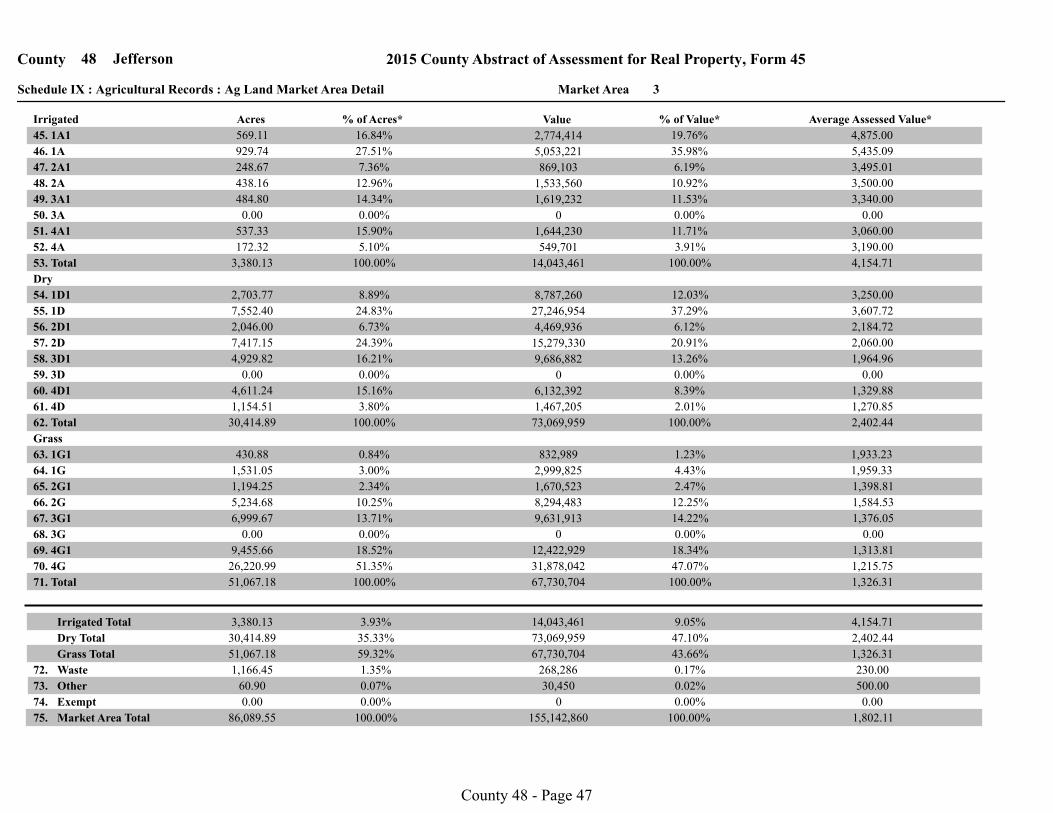
3Market AreaSchedule IX : Agricultural Records : Ag Land Market Area Detail
2015 County Abstract of Assessment for Real Property, Form 45Jefferson48County
45. 1A1
ValueAcres
46. 1A
47. 2A1
48. 2A
49. 3A1
50. 3A
51. 4A1
52. 4A
53. Total
54. 1D1
55. 1D
56. 2D1
57. 2D
58. 3D1
59. 3D
60. 4D1
61. 4D
62. Total
63. 1G1
64. 1G
65. 2G1
66. 2G
67. 3G1
68. 3G
69. 4G1
70. 4G
71. Total
Waste
Other
Exempt
Irrigated
Dry
Grass
Market Area Total 155,142,860 86,089.55
0 0.00
30,450 60.90
268,286 1,166.45
67,730,704 51,067.18
31,878,042 26,220.99
12,422,929 9,455.66
0 0.00
9,631,913 6,999.67
8,294,483 5,234.68
1,670,523 1,194.25
2,999,825 1,531.05
832,989 430.88
73,069,959 30,414.89
1,467,205 1,154.51
4,611.24 6,132,392
0 0.00
9,686,882 4,929.82
15,279,330 7,417.15
4,469,936 2,046.00
27,246,954 7,552.40
8,787,260 2,703.77
14,043,461 3,380.13
549,701 172.32
1,644,230 537.33
0 0.00
1,619,232 484.80
1,533,560 438.16
869,103 248.67
5,053,221 929.74
2,774,414 569.11
% of Acres* % of Value*
16.84%
27.51%
24.83%
8.89%
0.84%
3.00%
12.96%
7.36%
24.39%
6.73%
10.25%
2.34%
14.34%
0.00%
0.00%
16.21%
13.71%
0.00%
5.10%
15.90%
15.16%
3.80%
51.35%
18.52%
100.00%
100.00%
100.00%
Grass Total
Dry Total
Irrigated Total 3,380.13
30,414.89
51,067.18
14,043,461
73,069,959
67,730,704
3.93%
35.33%
59.32%
1.35%
0.00%
0.07%
100.00%
Average Assessed Value*
35.98%
19.76%
10.92%
6.19%
11.53%
0.00%
11.71%
3.91%
100.00%
12.03%
37.29%
4.43%
1.23%
6.12%
20.91%
2.47%
12.25%
13.26%
0.00%
14.22%
0.00%
8.39%
2.01%
18.34%
47.07%
100.00%
100.00%
4,875.00
5,435.09
3,607.72
3,250.00
1,933.23
1,959.33
3,500.00
3,495.01
2,184.72
2,060.00
1,584.53
1,398.81
3,340.00
0.00
1,964.96
0.00
1,376.05
0.00
3,060.00
3,190.00
1,329.88
1,270.85
1,215.75
1,313.81
4,154.71
2,402.44
1,326.31
0.00% 0.00
0.02% 500.00
100.00% 1,802.11
2,402.44 47.10%
1,326.31 43.66%
4,154.71 9.05%
230.00 0.17%72.
73.
74.
75.
County 48 - Page 47
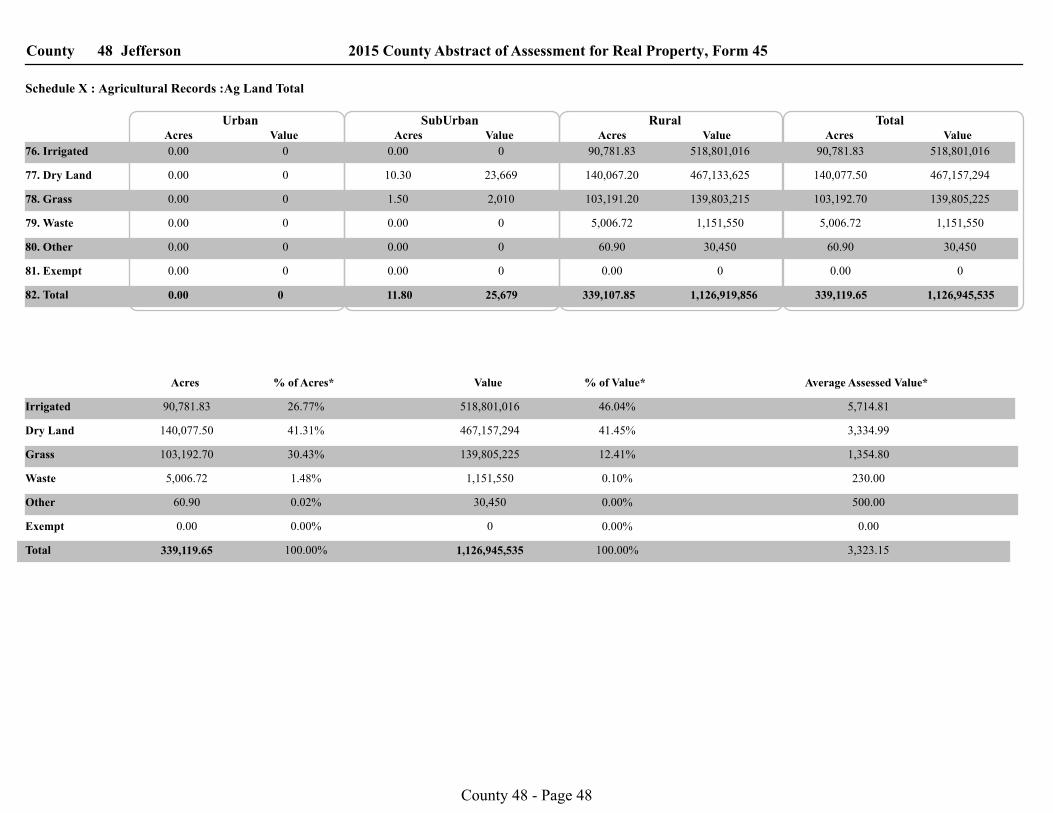
County 2015 County Abstract of Assessment for Real Property, Form 45Jefferson48
Schedule X : Agricultural Records :Ag Land Total
76. Irrigated
TotalValueAcresAcres Value
RuralAcres Value ValueAcres
SubUrban Urban
77. Dry Land
78. Grass
79. Waste
80. Other
81. Exempt
82. Total
0.00 0 0.00 0 90,781.83 518,801,016 90,781.83 518,801,016
0.00 0 10.30 23,669 140,067.20 467,133,625 140,077.50 467,157,294
0.00 0 1.50 2,010 103,191.20 139,803,215 103,192.70 139,805,225
0.00 0 0.00 0 5,006.72 1,151,550 5,006.72 1,151,550
0.00 0 0.00 0 60.90 30,450 60.90 30,450
0.00 0
0.00 0 11.80 25,679
0.00 0 0.00 0 0.00 0
339,107.85 1,126,919,856 339,119.65 1,126,945,535
Irrigated
Dry Land
Grass
Waste
Other
Exempt
Total 1,126,945,535 339,119.65
0 0.00
30,450 60.90
1,151,550 5,006.72
139,805,225 103,192.70
467,157,294 140,077.50
518,801,016 90,781.83
% of Acres*Acres Value % of Value* Average Assessed Value*
3,334.99 41.31% 41.45%
0.00 0.00% 0.00%
1,354.80 30.43% 12.41%
5,714.81 26.77% 46.04%
500.00 0.02% 0.00%
3,323.15 100.00% 100.00%
230.00 1.48% 0.10%
County 48 - Page 48
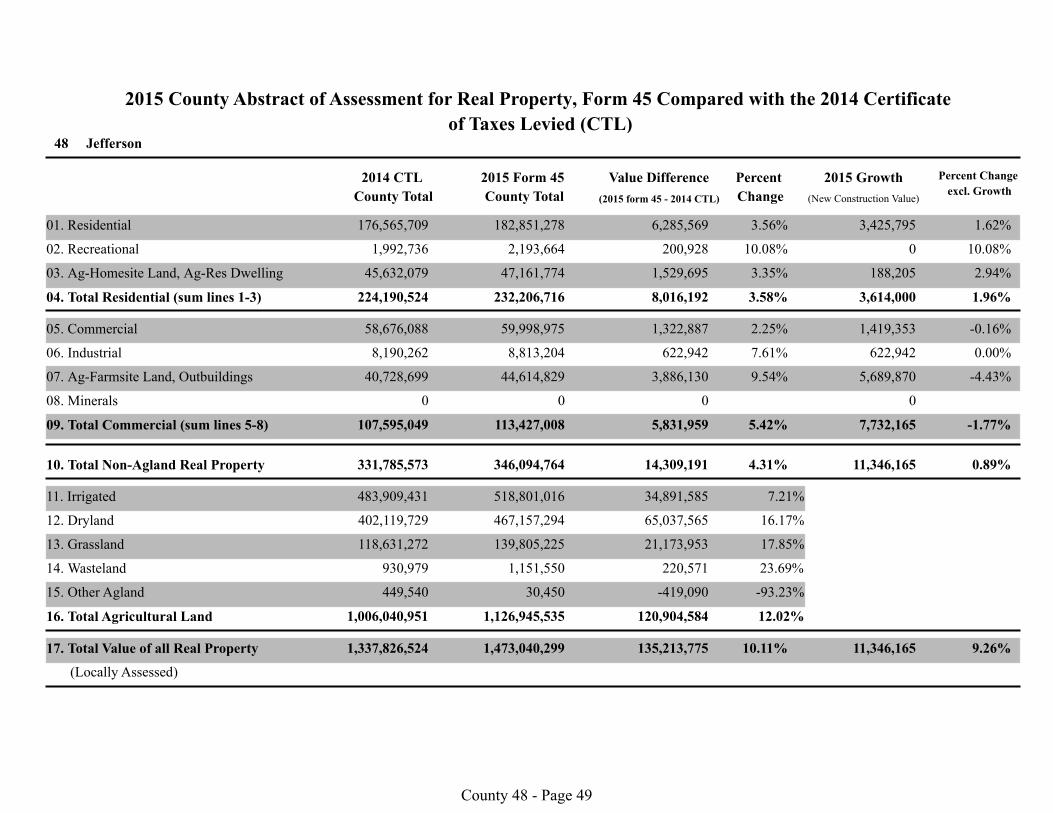
2015 County Abstract of Assessment for Real Property, Form 45 Compared with the 2014 Certificate
of Taxes Levied (CTL)48 Jefferson
2014 CTL
County Total
2015 Form 45
County Total
Value Difference Percent
Change
2015 Growth Percent Change
excl. Growth
176,565,709
1,992,736
01. Residential
02. Recreational
03. Ag-Homesite Land, Ag-Res Dwelling
04. Total Residential (sum lines 1-3)
05. Commercial
06. Industrial
07. Ag-Farmsite Land, Outbuildings
08. Minerals
09. Total Commercial (sum lines 5-8)
10. Total Non-Agland Real Property
11. Irrigated
12. Dryland
13. Grassland
14. Wasteland
15. Other Agland
16. Total Agricultural Land
17. Total Value of all Real Property
(Locally Assessed)
(2015 form 45 - 2014 CTL) (New Construction Value)
45,632,079
224,190,524
58,676,088
8,190,262
40,728,699
0
107,595,049
331,785,573
483,909,431
402,119,729
118,631,272
930,979
449,540
1,006,040,951
1,337,826,524
182,851,278
2,193,664
47,161,774
232,206,716
59,998,975
8,813,204
44,614,829
0
113,427,008
346,094,764
518,801,016
467,157,294
139,805,225
1,151,550
30,450
1,126,945,535
1,473,040,299
6,285,569
200,928
1,529,695
8,016,192
1,322,887
622,942
3,886,130
0
5,831,959
14,309,191
34,891,585
65,037,565
21,173,953
220,571
-419,090
120,904,584
135,213,775
3.56%
10.08%
3.35%
3.58%
2.25%
7.61%
9.54%
5.42%
4.31%
7.21%
16.17%
17.85%
23.69%
-93.23%
12.02%
10.11%
3,425,795
0
3,614,000
1,419,353
622,942
5,689,870
0
7,732,165
11,346,165
11,346,165
10.08%
1.62%
2.94%
1.96%
-0.16%
0.00%
-4.43%
-1.77%
0.89%
9.26%
188,205
County 48 - Page 49
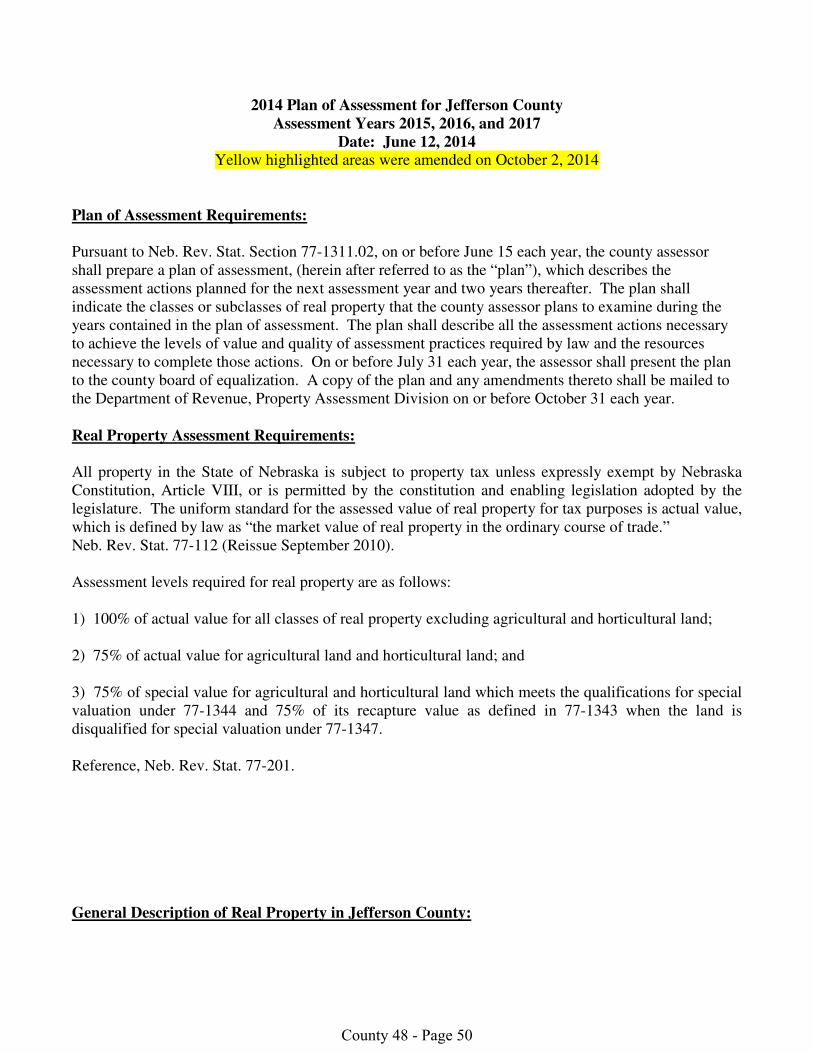
2014 Plan of Assessment for Jefferson County
Assessment Years 2015, 2016, and 2017
Date: June 12, 2014
Yellow highlighted areas were amended on October 2, 2014
Plan of Assessment Requirements:
Pursuant to Neb. Rev. Stat. Section 77-1311.02, on or before June 15 each year, the county assessor
shall prepare a plan of assessment, (herein after referred to as the “plan”), which describes the
assessment actions planned for the next assessment year and two years thereafter. The plan shall
indicate the classes or subclasses of real property that the county assessor plans to examine during the
years contained in the plan of assessment. The plan shall describe all the assessment actions necessary
to achieve the levels of value and quality of assessment practices required by law and the resources
necessary to complete those actions. On or before July 31 each year, the assessor shall present the plan
to the county board of equalization. A copy of the plan and any amendments thereto shall be mailed to
the Department of Revenue, Property Assessment Division on or before October 31 each year.
Real Property Assessment Requirements:
All property in the State of Nebraska is subject to property tax unless expressly exempt by Nebraska
Constitution, Article VIII, or is permitted by the constitution and enabling legislation adopted by the
legislature. The uniform standard for the assessed value of real property for tax purposes is actual value,
which is defined by law as “the market value of real property in the ordinary course of trade.”
Neb. Rev. Stat. 77-112 (Reissue September 2010).
Assessment levels required for real property are as follows:
1) 100% of actual value for all classes of real property excluding agricultural and horticultural land;
2) 75% of actual value for agricultural land and horticultural land; and
3) 75% of special value for agricultural and horticultural land which meets the qualifications for special
valuation under 77-1344 and 75% of its recapture value as defined in 77-1343 when the land is
disqualified for special valuation under 77-1347.
Reference, Neb. Rev. Stat. 77-201.
General Description of Real Property in Jefferson County:
County 48 - Page 50
Per 2013 County Abstract, Jefferson County consists of the following real property types:
Parcels % of Total Parcels
Residential 3642 51%
Commercial 506 8%
Industrial 25 <1%
Recreational 16 <1%
Agricultural 2891 41%
T.I.F. 8
Exempt 381
Game & Parks 26
Agricultural land – 339,106.31 acres
New Property: For assessment year 2014, an estimated 126 building permits and 36 improvement
information statements were filed for new property construction/additions, demolitions, land use
changes, etc., in the county. The office mailed out 407 Homestead Exemptions to applicants who filed
the previous year and 1,220 Personal Property post cards were mailed.
For more information see 2014 Reports & Opinions, Abstract and Assessor Survey.
Current Resources:
A. Staff/Budget/Training
The Jefferson County Assessor’s office staff currently consists of the assessor, 1 full time
lister/GIS specialist, 2 full time employees and 1 part time employee. Office budget for
2013 -2014 was $152,694. This was the third consecutive year that the budget was
decreased from the previous year. Employee benefits, such as health insurance,
retirement, etc., are funded by county general rather than through the assessor’s budget.
Official estimation for 2014-2015 fiscal year budget was $ 154,910. After submitting my
initial budget request, I found out that several offices had hired new personnel at a salary
greater than my employee of two and a half years. I requested the board increase my
employee’s salary to that of the newly hired personnel, which the board agreed to. Board
proposed and adopted a budget of $155,394.
The Assessor is required to obtain 60 hours of approved continuing education by
December 31, 2014 in order to be eligible to receive approval from the Property Tax
Administrator for re-certification. This certificate is required in order to file for or hold
the position of Assessor or Deputy Assessor. The cost of this education includes
registration fees, lodging, meals, transportation and any supplies needed.
(Section 77-702, R.S. Supp., 2002 and 77-414, R.S. Supp., 2003.)
County 48 - Page 51
Reg.-71-006.02A – Assessors assuming office on or after January 1, 2003, shall, within
four years from the date of assuming the office, complete IAAO course 101 -
Fundamentals of Real Property Appraisal, and IAAO course 300 – Fundamentals of Mass
Appraisal, or the equivalent thereof.
B. Cadastral Maps
Cadastral maps were revised in 1984 by a survey engineer and books printed. Ownership
changes are updated with each group of transfer statements. Parcel line changes are also
updated as needed when transfers are worked. We are in the process of producing new
cadastral books using GIS mapping. Each book will contain one precinct with one page
for each section showing ownership information. Following Reg-10-004.04 - .004.03G is
our goal. By completing the project within the office, we are saving the County money.
Due to budgeting restraints for staff and the time involved, this is an ongoing project.
Current year certified FSA maps have been requested from the land owner each time
there has been a land use change reported or discovered and also if a protest has been
made on a rural property.
Aerial photos were flown by Pictometry November – December 2012 and April 2014. A
six year contract was signed September 2010 with Pictometry International Corporation.
The contract will run through the fall of 2015 and include 2 flights. As the November-
December 2012 photos were not completely loaded into the system until after the first of
the 2013, the ability to do a split screen change print and the change finder not being
available until spring 2013, the 2012 aerial photos were not used for the 2013 assessment
year. The April 2014 photos became available to the assessor’s office June 12, 2014.
This was too late to use for the 2014 tax year. It was felt by the emergency manager that
April would work better for his office and others that use Pictometry and did not consult
with the assessor. The concern is that a lot of construction takes place in the spring,
summer and fall. By taking aerial photos in April we will be missing out on a lot of new
construction in 2014 for the 2015 tax year. The office has utilized Google, GIS and FSA
photos as tools in the assessment process as well as on site inspections. It is felt these are
more helpful to the office than Pictometry is, at this time.
County wide zoning regulations were adopted August 1, 2001 and amended March 12,
2013. The villages of Plymouth, Diller and Jansen also have zoning as does Fairbury.
Permits are to be dropped off, emailed or mailed to the Assessor’s office in a timely
manner. Even though Jansen has zoning, they do not issue permits.
C. Property Record Cards
Property record cards are kept for taxable residential, commercial, industrial,
improvements on leased land, TIF, partially exempt, permissive exempt, government
exempt and centrally assessed parcels. Each card has legal description, book and page of
last deed recorded in the last 5 years, current owner name and address, situs address of
parcel, cadastral map book and page, current property classification code, tax district
County 48 - Page 52
code and the current plus one or more years of assessed land value and improvements.
The exception for the assessed value would be for properties that receive an exemption.
Each record card with buildings contains a photo, sketch of the house, and aerial
photographs, if available.
A cost approach, income summary and comparable approach are included if applicable.
Also found within each card is land size (square footage or acres) and value.
All taxable property record cards are also entered into the computer CAMA system. The
Assessment Administration system is MIPS/County Solutions which is provided and
supported by NACO. This system links with the CAMA system and also the GIS system
that will eventually replace our old cadastral maps. Our property record card information
has been made accessible through www.nebraskataxesonline.us since 2006. Parcel
information became available through www.nebraskaassessoronline.us in January of
2014. Updates to this information will be made yearly after tax rolls have been certified
to the County Treasurer in the fall.
Current Assessment Procedures for Real Property
A. Discover, List & Inventory all property
Real estate transfer statements, plus a copy of the deed, are given to the Assessor’s
Office by the Register of Deeds. Appropriate real estate cards are pulled from the
files to be changed to the new owners’ name and address. Sales worksheets are filled
out with the information needed for the PAD’s sales file. Sales history is added to
the real estate card, and the administrative computer program and CAMA program is
changed for new owner, address and sales history. Alphabetical index file and
cadastral maps are updated for ownership. Sales questionnaires are sent to new
property owners of most transactions. CAMA system is updated and sales are
added to sales file. Sales sheets for the sales books are run and added to current book
of sales. Properties that require a split are done on the GIS system before any other
changes are made. Copy of real estate card and transfer are made to be used when
personnel physically go to the property and inventories the information that is on the
card as to what was actually there when the sale took place. Any differences are
noted and brought back to the Assessor’s office to correct the sales file. Real estate
cards are tabbed for the next year to correct information. This on sight verification
may also determine whether the sale was an arms-length transaction or not. New
pictures are taken of the improvements or lot for each residential and commercial
property. Income data is collected, if applicable. Rural land sales are categorized on
a computer program as to number of acres of each soil type, classification and
percent that each soil type attributes to the sale price.
Building permits are received from the Jefferson County zoning manager, the
Fairbury zoning administrator, and the village clerks of Plymouth and Diller. Letters
are sent every August to remind all village clerks to forward permits to the office and
County 48 - Page 53
what should be reported if a permit is not required. Unfortunately, we have had little
cooperation. The County Assessor and staff inspect small towns, by driving each
street and alley of the town to verify if any changes have been made. The
appropriate real estate cards are tabbed for review that we receive a permit,
improvement information statement or discover changes for.
B. Data Collection
All cards tabbed for new structures, additions, changes or demolition are physically
inspected by the County Assessor and staff between September and February of the
assessment year. The property record card is used for listing additions or changes to
buildings so data may be updated. New structures are measured and all the
components needed to produce a new cost approach on our CAMA program are
noted at the time of inspection. Commercial properties are listed and measured by
qualified personnel who also collect income data. New or corrected sketches are
made and digital pictures are taken. The County Assessor approves the final value
before it is placed on the property record card or computer administrative program.
C. Review assessment sales ratio studies before assessment actions.
Sales studies are done in the office and compared to the sales analysis provided by
the Property Assessment Division. Between these two sales studies and knowledge
of the current sales not within the sales study, the Assessor determines where and
what changes need to be made to valuation for the current assessment year. This is
to stay in compliance with the laws of Nebraska and to have a fair and equitable
assessment of real estate within Jefferson County.
D. Approaches to Value
The Assessor and County Board of Commissioners/Equalization hire qualified
personnel to do mass appraisal within the County. The personnel hired use the
counties sales studies and comparisons to do a market approach that is in
compliance with the IAAO standards. Cost approach is done on the CAMA system
using Marshall-Swift pricing and the current depreciation study at the time of the
appraisal. The hired personnel also do income approach. They collect the income
and expense data to be entered in the counties CAMA system and run an analysis
from the market.
Land valuation studies are done within the County using a spreadsheet program
developed in the Assessor’s office to analyze land valuations and check established
market areas within the County.
County 48 - Page 54
New statistics are ran using the same sales in our sales study to determine a cost
approach to value. These statistics verify the fact that county valuations are in
compliance with the laws of Nebraska.
On or before June 1 of each year, notices are mailed to all land owners that have
had either an increase or decrease in value from the previous assessment year. Any
changes made after March 19th
are made by the County Board of Equalization.
Approximately 3,455 Notice of Valuation Changes were mailed for the 2014
assessment year.
Level of Value, Quality, and Uniformity for Assessment Year 2014:
Property Class Median COD* PRD*
Residential 94% 29.95 112.42
Commercial 100% 22.40 110.51
Agricultural 71% 18.80 100.37
For assessment years 2011, 2012 and 2013, the PAD recommended to TERC that a level of value
for commercial property be rendered “not enough information” to establish statistics. 2014
Commercial Correlation Section Level of Value stated the statistical calculations alone are not
representative of the commercial class and are not considered adequate to indicate the actual
level of value. The information available allows that the county has probably achieved an
acceptable level of value. The level of value is called at the statutory level of 100%.
*COD means coefficient of dispersion and PRD means price related differential.
For more information regarding statistical measures see 2014 Reports & Opinions.
Assessment Actions Planned for Assessment Year 2015:
Residential:
Review the Village of Plymouth, all Northgate Additions to Fairbury, houses built since 2000 for
basement finish, and machine sheds with living area. House sheets for all improved properties
will be ran with the 2013 costing.
Areas that show a need for adjustment, based on their statistics, will be reviewed and valuations
changed according to sales study. All pick up work of reported or discovered changes to parcels
will be physically reviewed. Photos, sketches, etc., will be updated as needed.
Begin review of Daykin, Diller, Jansen, and Endicott.
County 48 - Page 55
Commercial:
Commercial property statistics will be reviewed and analyzed to determine any changes that
need to be made. New construction and changes reported on improvement statements, city
permits, rural permits or discovered will be physically reviewed. Photos will be taken and
sketches updated as needed. Review all storage facilities in the county.
Agricultural Land:
Verification of rural sales is done by phone, in person, letters and questionnaires with buyer,
seller, auctioneer or realtor and occasionally an attorney may be contacted. A yearly review of
all agricultural sales within the study period as set forth by TERC and PAD is done to determine
any changes in land value according to the market in Jefferson County. The study of agricultural
land sales is done by breaking each sale down by total number of acres, soil type and land use in
each parcel sold. Using this study the weighted average value per acre is determined. If there
were no sales of a certain type of soil, the value is determined by using values within the same
land classification. Our three neighborhoods are also reviewed to determine if changes in area
lines need to be made to keep equality in the valuations for Jefferson County. All land use
changes reported are verified and files are changed to reflect current land use. New FSA maps
are requested from property owners and the GIS system and County Solutions are changed
accordingly.
Update GIS maps to most current flight taken by FSA aerial if new ones are available.
The GIS program is also being utilized to produce current cadastral maps in a user friendly
format.
Pickup work is done annually with an on sight inspection of each reported improvement or
demolition. Unreported improvements that come to the attention of the County Assessor are
visually inspected, if possible, and also reported to the Zoning Manager. Requests by real estate
owners to review property are also done at this time. Digital pictures are taken as needed and
added to the CAMA system. All new or changed improvements are listed and entered into the
Assessor’s CAMA system and priced out using the Marshall Swift pricing.
No special value has been determined in Jefferson County at this time.
Staff will continue updating and correcting information on GIS layers and will probably add
more layers and information as it is collected.
All parcels with improvements, residential, commercial and rural, will be reviewed for errors
when we completed the V2 conversion in September 2013. Review aerial photos taken by
Pictometry in fall 2013. Print a new aerial photo for each rural card and note any discrepancies
from what we have on the real estate card.
County 48 - Page 56
Assessment Actions Planned for 2016
Residential:
Complete review of Daykin, Diller, Jansen and Endicott. Physically inspect and list all new or
changed construction and update all records accordingly.
Commercial:
Review Fairbury commercial properties and depreciation factors.
Run new cost sheets.
Study sales statistics.
Staff will help review sales and valuations and to do pickup work of all new or changed
construction by physically inspecting, listing and updating all records.
Agricultural Land:
Review sales study to determine changes of valuations per soil type and land use.
Review neighborhood boundaries.
Make all known changes to land use.
Physical inspections of all pickup work and change all records accordingly.
Run new irrigation listing for Jefferson County from Internet.
Continue updating the GIS system.
Print maps on GIS to replace old cadastral maps, land ownership and parcel lines.
Begin review of rural outbuildings and houses.
Assessment Actions Planned for Assessment Year 2017
Residential:
Review Fairbury Area 1 and 2. Physically inspect and list all new or changed construction and
update all records accordingly.
Review statistics to determine what if other areas, villages or subclasses may need to be
reviewed.
Commercial:
Review small town/village commercial properties and depreciation factors.
Review sales study statistics.
Staff to help with physical review and to do pickup work
Land Agricultural:
Study sales statistics.
Update valuations according to sales analysis.
Do pickup work by physically inspecting, listing and changing records.
County 48 - Page 57
Other functions performed by the Assessor’s office, but not limited to:
1. Record maintenance, mapping updates, and ownership changes are continuous projects that
usually take about 1 to 2 weeks. Records that need to be split take longer than just a change of
ownership. Changes to a record card have to be changed on the CAMA program, the PC Admin
V2 program (former County Solutions), the GIS program if there is a split or combination, the
cadastral books, the alphabetical index cards, and the Register of Deeds program (for all transfers
filed in the deed book or miscellaneous book) before the card may be refiled. Each transfer
statement has to have a sales worksheet filled out if there are doc stamps of a $2.25 or more or
total purchase price is $100 or more. This is all done electronically using our PC Admin V2
(former County Solutions) program which is linked with the Property Assessment Divisions
computer system.
2. Annually prepare and file Assessor Administrative Reports with the Property Tax
Administrator as required by statute/regulation:
Abstract of Assessment for Real Property
Assessor Survey
Sales information, rosters& annual Assessed Value Update w/Abstract to PAD
Certify taxable valuations and growth value (if applicable) to political subdivisions and a
copy of each to the County Clerk
School District Taxable Value Report
Homestead Exemption Certification of Average Assessed Value of a Single-Family
residential Property
Amended Homestead Exemption Summary Certificate (as needed)
Certificate of Taxes Levied Report (CTL) and a copy for the County Treasurer
Three Year Plan of Assessment
3. Administer annual personal property filings. For 2013 there were 1037 schedules on the tax
roll and 1,220 post cards were sent out for 2014. Update computer to anyone that the office feels
may need to file a return and contact MIPS, Inc. to print the post cards approximately 7 to 10
days before you want to mail them out. Prepare notices of change, unsigned schedule notices,
reminder of schedules due, and penalty notices. Assist people in the online filing of schedules as
needed. Contact personal property owner or tax preparer if more information is needed
regarding the filed personal property. Obtain the federal depreciation worksheet, whenever
possible, to verify all equipment reported for personal property.
4. Permissive Exemption Application (Form 451) or Statement of Reaffirmation of Tax
Exemption (Form 451A) are prepared and mailed to the previous years’ applicant. Reminder
notices are mailed on or about Dec 1 to any applicant that has not returned their form. Review
and make recommendations to county board.
County 48 - Page 58
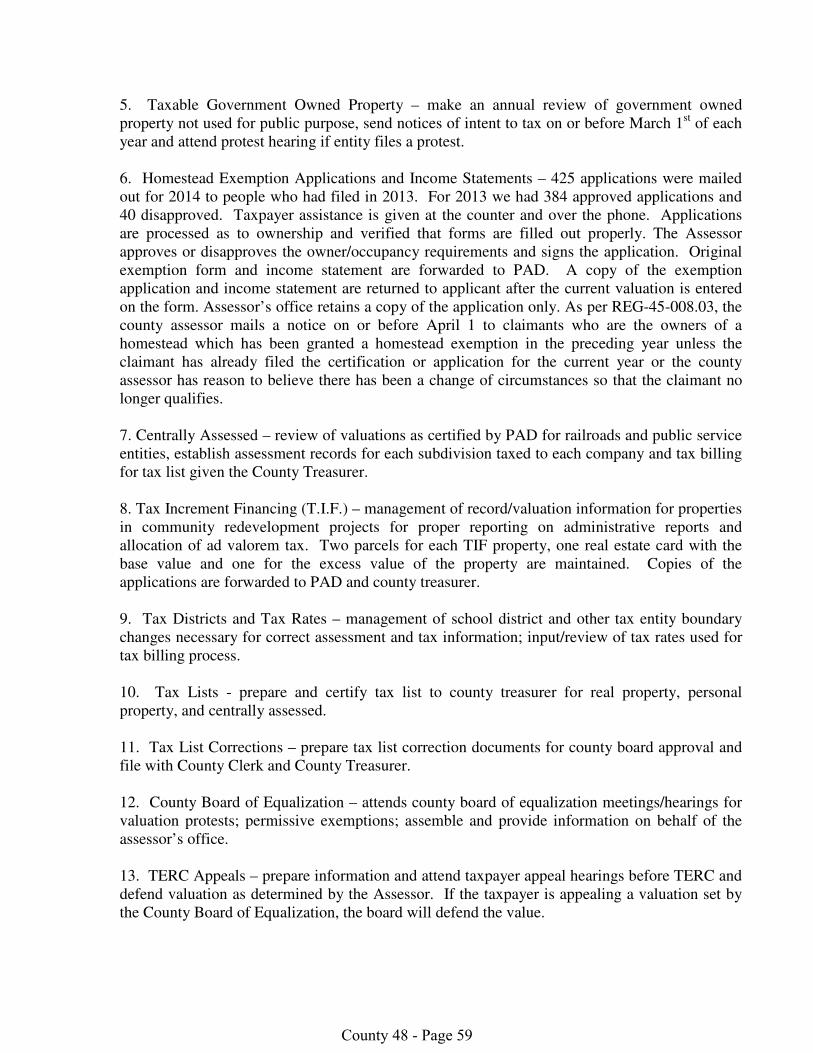
5. Taxable Government Owned Property – make an annual review of government owned
property not used for public purpose, send notices of intent to tax on or before March 1st of each
year and attend protest hearing if entity files a protest.
6. Homestead Exemption Applications and Income Statements – 425 applications were mailed
out for 2014 to people who had filed in 2013. For 2013 we had 384 approved applications and
40 disapproved. Taxpayer assistance is given at the counter and over the phone. Applications
are processed as to ownership and verified that forms are filled out properly. The Assessor
approves or disapproves the owner/occupancy requirements and signs the application. Original
exemption form and income statement are forwarded to PAD. A copy of the exemption
application and income statement are returned to applicant after the current valuation is entered
on the form. Assessor’s office retains a copy of the application only. As per REG-45-008.03, the
county assessor mails a notice on or before April 1 to claimants who are the owners of a
homestead which has been granted a homestead exemption in the preceding year unless the
claimant has already filed the certification or application for the current year or the county
assessor has reason to believe there has been a change of circumstances so that the claimant no
longer qualifies.
7. Centrally Assessed – review of valuations as certified by PAD for railroads and public service
entities, establish assessment records for each subdivision taxed to each company and tax billing
for tax list given the County Treasurer.
8. Tax Increment Financing (T.I.F.) – management of record/valuation information for properties
in community redevelopment projects for proper reporting on administrative reports and
allocation of ad valorem tax. Two parcels for each TIF property, one real estate card with the
base value and one for the excess value of the property are maintained. Copies of the
applications are forwarded to PAD and county treasurer.
9. Tax Districts and Tax Rates – management of school district and other tax entity boundary
changes necessary for correct assessment and tax information; input/review of tax rates used for
tax billing process.
10. Tax Lists - prepare and certify tax list to county treasurer for real property, personal
property, and centrally assessed.
11. Tax List Corrections – prepare tax list correction documents for county board approval and
file with County Clerk and County Treasurer.
12. County Board of Equalization – attends county board of equalization meetings/hearings for
valuation protests; permissive exemptions; assemble and provide information on behalf of the
assessor’s office.
13. TERC Appeals – prepare information and attend taxpayer appeal hearings before TERC and
defend valuation as determined by the Assessor. If the taxpayer is appealing a valuation set by
the County Board of Equalization, the board will defend the value.
County 48 - Page 59
14. TERC Statewide Equalization – attend hearings by phone, website or in person, to defend
values as determined by the Assessor, if applicable, and/or implement orders of the TERC,
which requires an amended abstract be filed with the PAD.
16. Pull real estate cards; make copies; answer inquiries via phone, in person, mail and email
from realtors, appraisers, lending institutions, property owners, lawyers, other county offices,
surveyors and the general public. As more people are searching for information online at
www.nebraskataxesonline.us, we field many questions on how to search for assessor data. We
must be able to communicate the steps in finding the data via phone or email. In 2014 we also
went online with www.nebraskaassessorsonline.us. This allowed more of our parcel data
information to be available to the public.
17. Attend Southeast District Assessor’s meetings, NACO meetings & conferences, Nebraska
Assessor’s Workshops and other meetings/classes that provide hours of continuing education
credit to keep my Assessor’s certificate current as required by the Nebraska Department of
Revenue, Property Assessment Division Regulations. (Reg-71-006 and Reg-71-007)
18. Miscellaneous tasks, duties, and obligations, not mentioned previously, are performed to
keep the office functioning.
Respectfully submitted:
Assessor signature _Vicki L. Haskell_____________ Date _June 12, 2014
Vicki L. Haskell
County 48 - Page 60
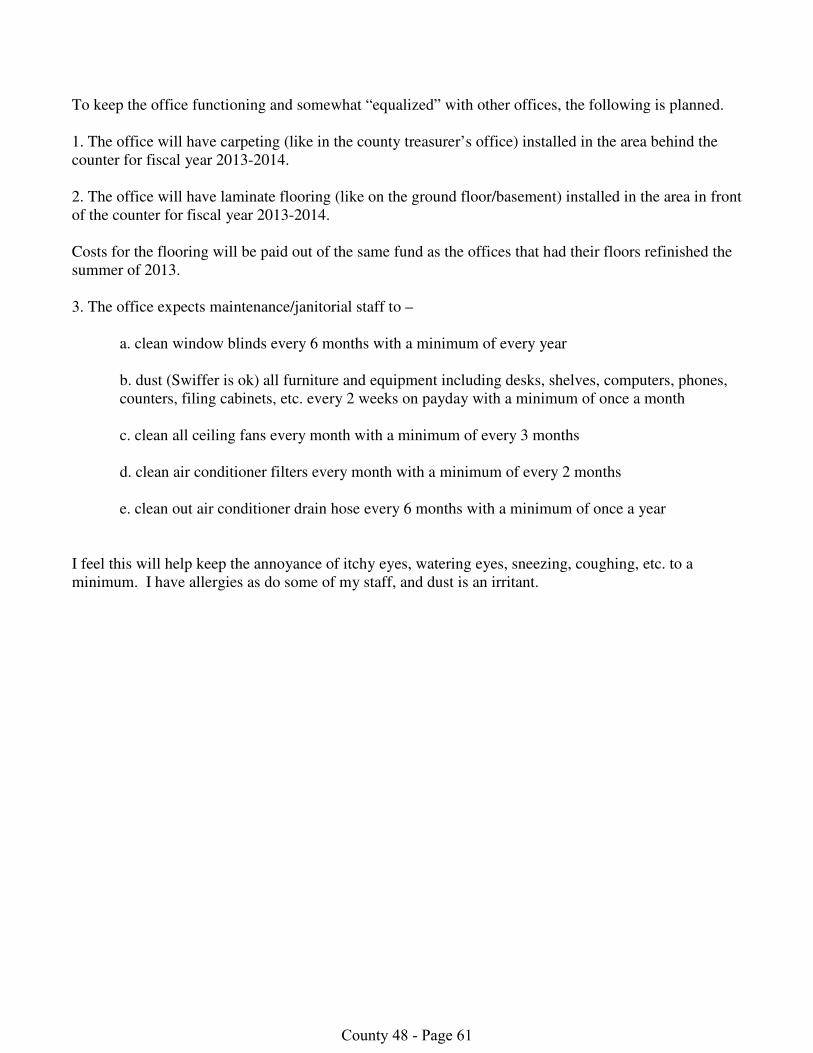
To keep the office functioning and somewhat “equalized” with other offices, the following is planned.
1. The office will have carpeting (like in the county treasurer’s office) installed in the area behind the
counter for fiscal year 2013-2014.
2. The office will have laminate flooring (like on the ground floor/basement) installed in the area in front
of the counter for fiscal year 2013-2014.
Costs for the flooring will be paid out of the same fund as the offices that had their floors refinished the
summer of 2013.
3. The office expects maintenance/janitorial staff to –
a. clean window blinds every 6 months with a minimum of every year
b. dust (Swiffer is ok) all furniture and equipment including desks, shelves, computers, phones,
counters, filing cabinets, etc. every 2 weeks on payday with a minimum of once a month
c. clean all ceiling fans every month with a minimum of every 3 months
d. clean air conditioner filters every month with a minimum of every 2 months
e. clean out air conditioner drain hose every 6 months with a minimum of once a year
I feel this will help keep the annoyance of itchy eyes, watering eyes, sneezing, coughing, etc. to a
minimum. I have allergies as do some of my staff, and dust is an irritant.
County 48 - Page 61
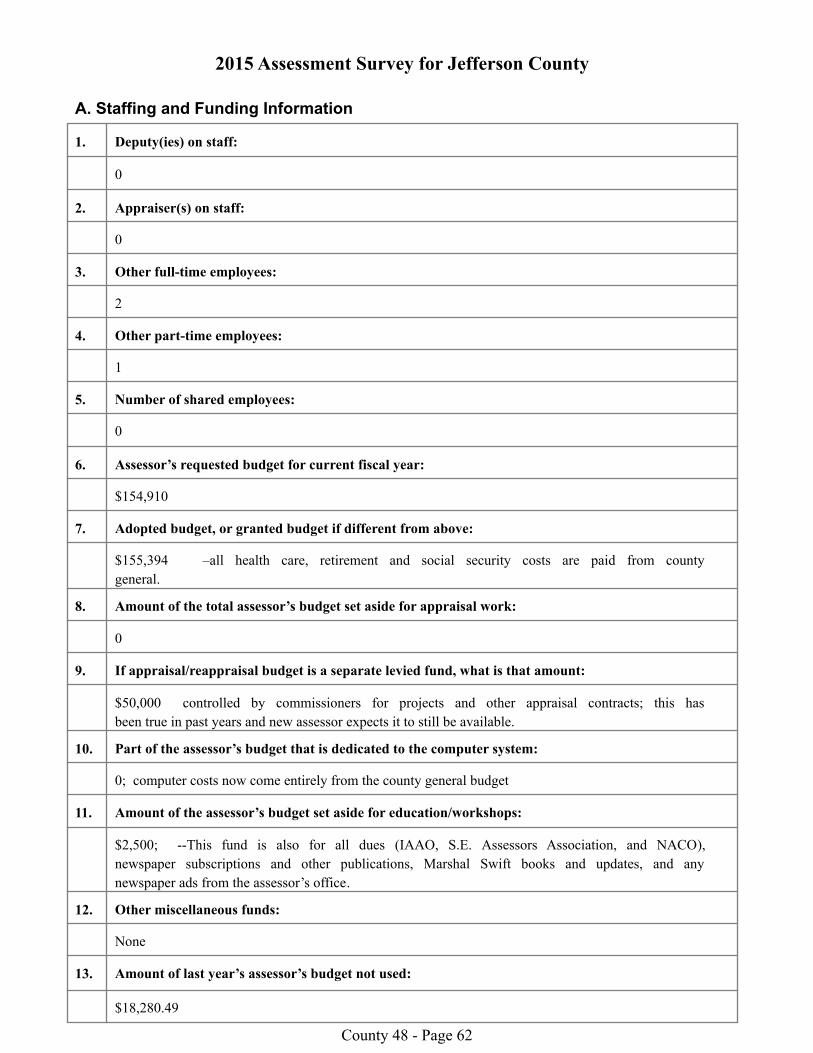
2015 Assessment Survey for Jefferson County
A. Staffing and Funding Information
Deputy(ies) on staff:1.
0
Appraiser(s) on staff:2.
0
Other full-time employees:3.
2
Other part-time employees:4.
1
Number of shared employees:5.
0
Assessor’s requested budget for current fiscal year:6.
$154,910
Adopted budget, or granted budget if different from above:7.
$155,394 –all health care, retirement and social security costs are paid from county
general.
Amount of the total assessor’s budget set aside for appraisal work:8.
0
If appraisal/reappraisal budget is a separate levied fund, what is that amount:9.
$50,000 controlled by commissioners for projects and other appraisal contracts; this has
been true in past years and new assessor expects it to still be available.
Part of the assessor’s budget that is dedicated to the computer system:10.
0; computer costs now come entirely from the county general budget
Amount of the assessor’s budget set aside for education/workshops:11.
$2,500; --This fund is also for all dues (IAAO, S.E. Assessors Association, and NACO),
newspaper subscriptions and other publications, Marshal Swift books and updates, and any
newspaper ads from the assessor’s office.
Other miscellaneous funds:12.
None
Amount of last year’s assessor’s budget not used:13.
$18,280.49 County 48 - Page 62
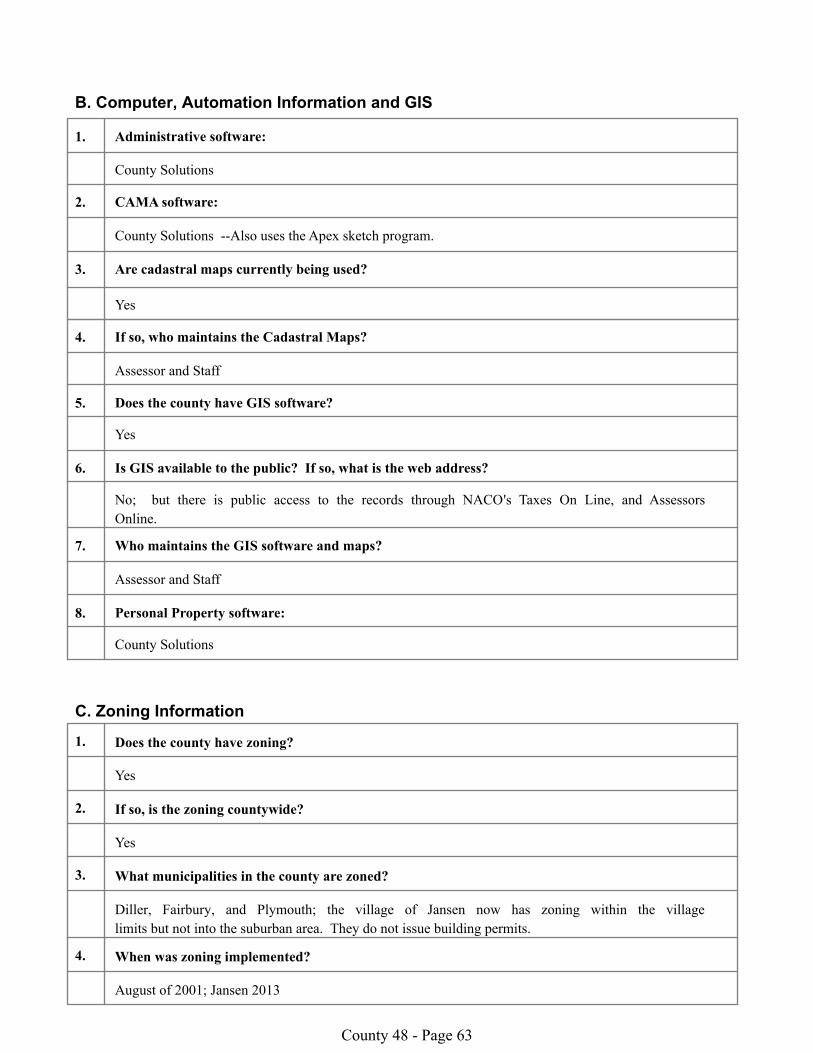
B. Computer, Automation Information and GIS
1. Administrative software:
County Solutions
2. CAMA software:
County Solutions --Also uses the Apex sketch program.
3. Are cadastral maps currently being used?
Yes
4. If so, who maintains the Cadastral Maps?
Assessor and Staff
5. Does the county have GIS software?
Yes
6. Is GIS available to the public? If so, what is the web address?
No; but there is public access to the records through NACO's Taxes On Line, and Assessors
Online.
7. Who maintains the GIS software and maps?
Assessor and Staff
8. Personal Property software:
County Solutions
C. Zoning Information
1. Does the county have zoning?
Yes
2. If so, is the zoning countywide?
Yes
3. What municipalities in the county are zoned?
Diller, Fairbury, and Plymouth; the village of Jansen now has zoning within the village
limits but not into the suburban area. They do not issue building permits.
4. When was zoning implemented?
August of 2001; Jansen 2013
County 48 - Page 63
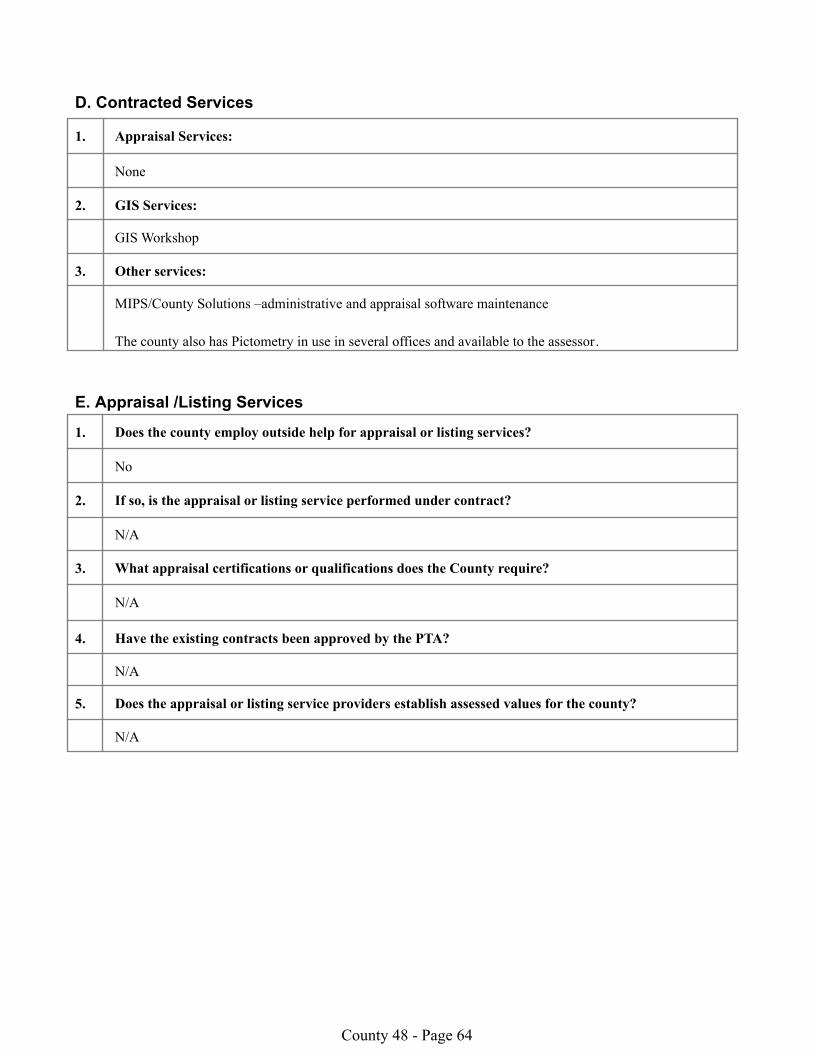
D. Contracted Services
1. Appraisal Services:
None
2. GIS Services:
GIS Workshop
3. Other services:
MIPS/County Solutions –administrative and appraisal software maintenance
The county also has Pictometry in use in several offices and available to the assessor.
E. Appraisal /Listing Services
1. Does the county employ outside help for appraisal or listing services?
No
2. If so, is the appraisal or listing service performed under contract?
N/A
3. What appraisal certifications or qualifications does the County require?
N/A
4. Have the existing contracts been approved by the PTA?
N/A
5. Does the appraisal or listing service providers establish assessed values for the county?
N/A
County 48 - Page 64
Certification
County 48 - Page 65
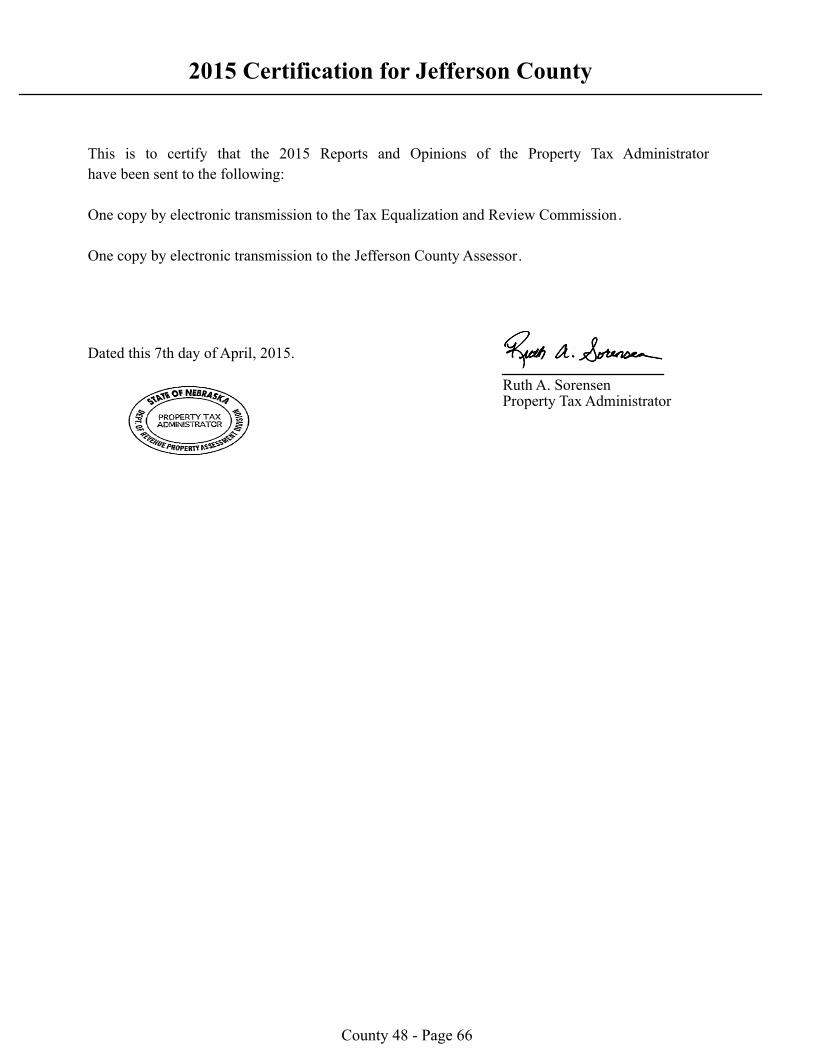
2015 Certification for Jefferson County
This is to certify that the 2015 Reports and Opinions of the Property Tax Administrator
have been sent to the following:
One copy by electronic transmission to the Tax Equalization and Review Commission.
One copy by electronic transmission to the Jefferson County Assessor.
Dated this 7th day of April, 2015.
Ruth A. SorensenProperty Tax Administrator
County 48 - Page 66

Certification
Map Section
County 48 - Page 67

Valuation H
istory
County 48 - Page 68


![27.06.2013. - Linde plin d.o.o., Karlovac [PDF 4.67 MB]](https://img.pdfslide.net/doc/110x75/5899a6d71a28abf0468b83ba/27062013-linde-plin-doo-karlovac-pdf-467-mb.jpg)