Embed Size (px)
Citation preview
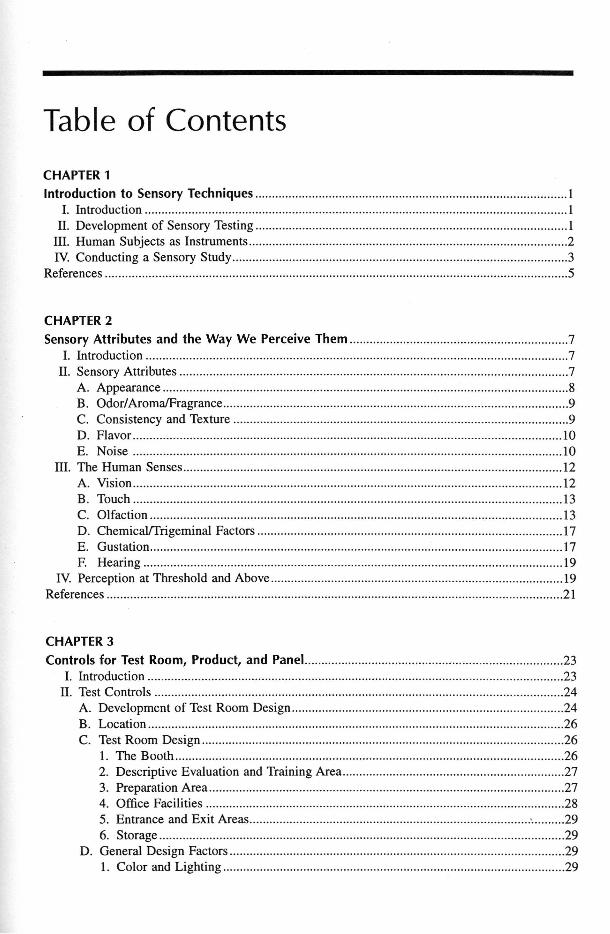
Table of Contents
CHAPTER 1Introduction to Sensory Techniques 1
1. Introduction 1n. Development of Sensory Testing 1
nI. Human Subjects as Instruments 2IV. Conducting a Sensory Study 3
References 5
CHAPTER 2Sensory Attributes and the Way We Perceive Them 7
1. Introduction 7n. Sensory Attributes 7
A. Appearance 8B. Odorl AromaIFragrance 9C. Consistency and Texture 9D. Flavor 10E. Noise 10
nI. The Human Senses 12A. Vision 12B. Touch 13C. Olfaction 13D. ChemicallTrigeminal Factors 17E. Gustation 17F. Hearing 19
IV. Perception at Threshold and Above 19References 21
CHAPTER 3Controls for Test Room, Product, and Panel... 23
1. Introduction 23n. Test Controls 24
A. Development of Test Room Design 24B. Location 26C. Test Room Design 26
1. The Booth 262. Descriptive Evaluation and Training Area 273. Preparation Area 274. Office Facilities 285. Entrance and Exit Areas ~ 296. Storage 29
D. General Design Factors 291. Color and Lighting 29

2. Air Circulation, Temperature, and Humidity .303. Construction Materials .30
nI. Product Controls 32A. General Equipment. .32B. Sample Preparation .33
1. Supplies and Equipment. .332. Materials .333. Preparation Procedures .33
C. Sample Presentation 331. Container, Sample Size, and Other Particulars .332. Order, Coding, and Number of Samples 34
D. Product Sampling 35IV. Panelist Controls '" .35
A. Panel Training or Orientation .35B. Productffime of Day .35C. PanelistslEnvironment , .36
References .36
CHAPTER4Factors Influencing Sensory Verdicts , .37
1. Introduction 37n. Physiological Factors .37
A. Adaptation 37B. Enhancement or Suppression .38
nI. Psychological Factors 39A. Expectation Error 39B. Error of Habituation .39C. Stimulus Error .39D. Logical Error 39E. Halo Effect .40F. Order of Presentation of Samples .40G. Mutual Suggestion : .40H. Lack of Motivation .411. Capriciousness vs. Timidity .41
IV. Poor Physical Condition .41References .41
CHAPTER 5Measuring Responses .43
1. Introduction .43n. Psychophysical Theory 45
A. Fechner's Law .46B. Stevens' Law .47C. The Beidler Model .48
nI. Classification 50IV. Grading 51
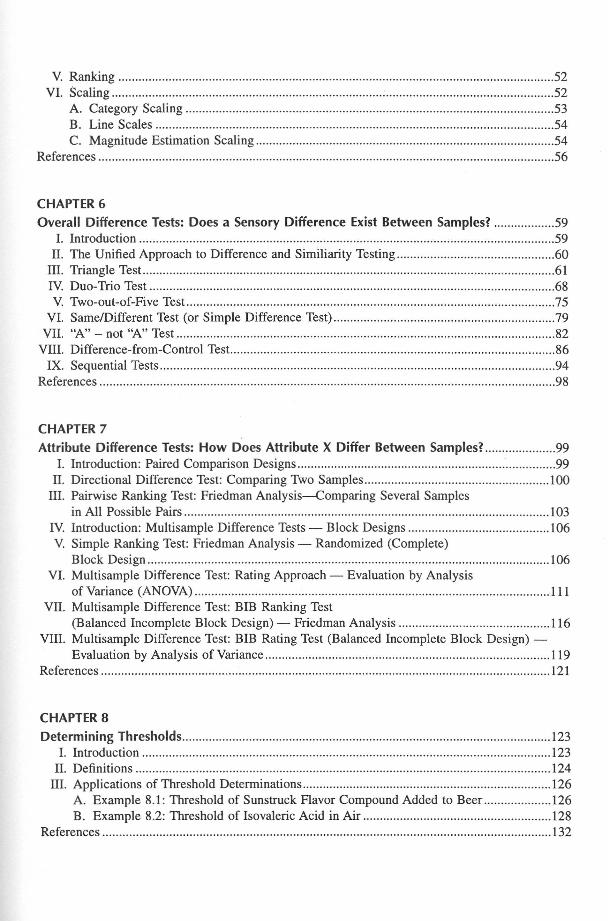
V. Ranking .52VI. Scaling : 52
A. Category Scaling 53B. Line Scales 54C. Magnitude Estimation Scaling 54
References 56
CHAPTER 6Overall Difference Tests: Does a Sensory Difference Exist Between Samples? 59
1. Introduction 5911. The Unified Approach to Difference and Similiarity Testing 60
111.Triangle Test 61IV. Duo- Trio Test 68V. Two-out-of-Five Test 75
VI. Same/Different Test (or Simple Difference Test) 79VII. "A" - not "A" Test 82VIII. Difference- from-Control Test. 86
IX. Sequential Tests 94References 98
CHAPTER 7Attribute Difference Tests: How Does Attribute X Differ Between Samples? 99
l. Introduction: Paired Comparison Designs 9911. Directional Difference Test: Comparing Two Samples 100III. Pairwise Ranking Test: Friedman Analysis-Comparing Several Samples
in All Possible Pairs 103IV. Introduction: Multisample Difference Tests - Block Designs 106V. Simple Ranking Test: Friedman Analysis - Randomized (Complete)
Block Design 106VI. Multisample Difference Test: Rating Approach - Evaluation by Analysis
of Variance (ANOVA) 111VII. Multisample Difference Test: BIB Ranking Test
(Balanced Incomplete Block Design) - Friedman Analysis 116VIII. Multisample Difference Test: BIB Rating Test (Balanced Incomplete Block Design) -
Evaluation by Analysis ofVariance 119References 121
CHAPTER 8Determ ining Thresholds 123
1. Introduction 12311. Definitions 124III. Applications of Threshold Determinations 126
A. Example 8.1: Threshold of Sunstruck Flavor Compound Added to Beer. 126B. Example 8.2: Threshold of Isovaleric Acid in Air 128
References 132

CHAPTER 9Selection and Training of Panel Members 133
1. Introduction 13311. Panel Development 134
III. Selection and Training for Difference Tests 135A. Selection 135
1. Matching Tests 1362. Detection/Discrimination Tests 1363. RankingIRating Tests for Intensity 1394. Interpretation of Results of Screening Tests 139
B. Training 139IV. Selection and Training of Panelists for Descriptive Testing 140
A. Selection for Descriptive Testing 1401. Prescreening Questionnaires 1412. Acuity Tests 1413. RankingIRating Screening Tests for Descriptive Analysis 1424. Personal Interview : 142
B. Training for Descriptive Testing 1431. Terminology Development 1432. Introduction to Descriptive Scaling 1433. Initial Practice 1444. Small Product Differences 1445. Final Practice 144
V. Panel Performance and Motivation 144A. Performance 144B. Panelist Maintenance, Feedback, Rewards, and Motivation 146
References 148Appendix 9.1 Prescreening Questionnaires 150
A. Prescreening Questionnaire for a Tactile Panel (Skinfeel or Fabric Feel) 150B. Prescreening Questionnaire for a Flavor Panel 152C. Prescreening Questionnaire for an Oral Texture Panel 154D. Prescreening Questionnaire for a Fragrance Panel... 156E. Scaling Exercises 158
CHAPTER 10Descriptive Analysis Techniques 161
1. Definition 16111. Field of Application 162
III. Components of Descriptive Analysis 162A. Characteristics: the Qualitative Aspect 162B. Intensity: the Quantitative Aspect 163C. Order of Appearance: the Time Aspect 164D. Overall Impression: the Integrated Aspect 165
IV. Commonly Used Descriptive Test Methods 166A. The Flavor Profi1e Method 166B. The Texture Profile Method 166C. The Quantitative Descriptive Analysis (QDA®) Method 167D. The Spectrum™ Descriptive Analysis Method 168E. Time-Intensity Descriptive Analysis 168F. Free-Choice Profiling 170
References 170

CHAPTER 11The Spectrum 1M Descriptive Analysis Method 173
1. Designing a Descriptive Procedure 174II. Terrninology 174III. Intensity 175IV. Other Options 175V. Modified Short-Version Spectrum Descriptive Procedures for Quality Assurance,
Shelf-Life Studies, etc 175References 176Appendix 11.1 Spectrum Terminology for Descriptive Analysis 177
A. Terms Used to Describe Appearance 177B. Terms Used to Describe Flavor (General and Baked Goods) 178
Example: Flavor Terminology of Baked Goods ~ 178C. Terms Used to Describe Semisolid Oral Texture 180
Example: Semisolid Texture Terminology - Oral Texture of Peanut Butter. .181D. Terms Used to Describe Solid Oral Texture 182
Example: Solid Texture Terminology of Oral Texture of Cookies 183E. Terms Used to Describe Skinfeel of Lotions and Creams 184F. Terms Used to Describe Handfeel of Fabric and Paper l85G. Terms Used to Describe the Feel ofHair (Wet and Dry) 187H. Terms Used to Describe the Lather and Skinfeel of Bar Soap 1901. Terms Used to Describe the Skinfeel of Antiperspirants 192
Appendix 11.2 Spectrum Intensity Scales for Descriptive Analysis 195A. Intensity Scale Values (O to 15) for Some Cornmon Aromatics 195B. Intensity Scale Values (O to 15) for the Four Basic Tastes 196C. Intensity Scale Values (O to 15) for Semisolid Oral Texture Attributes 198D. Intensity Scale Values (O to 15) for Solid Oral Texture Attributes 199E. Intensity Scale Values (O to 15) for Skinfeel Texture Attributes 204F. Intensity Scale Values (O to 15) for Fabricfeel Attributes 206
Appendix 11.3 Spectrum Descriptive Analysis Product Lexicons 209Appendix 11.4 Spectrum Descriptive Analysis FuB Product Descriptions 216
A. White Bread 216B. Toothpaste 217C. Peanut Butter 218D. Mayonnaise 219E. Marinara Sauce 220
Appendix 11.5 Spectrum Descriptive Analysis Training Exercises 222A. Basic Taste Combinations Exercise 222B. Cookie Variation Exercise 225
CHAPTER 12Affective Tests: Consumer Tests and In-House Panel Acceptance Tests 23l
1. Purpose and Applications 232A. Product Maintenance 233B. Product ImprovementlOptimization 233C. Development of New Products ~ 234D. Assessment of Market Potential 234E. Category Review 234F. Support for Advertising Claims 235

II. The Subjects/Consumers in Affective Tests 235A. Sampling and Demographics 235B. Source of Test Subjects: Employees, Local Residents, the General Population 236
III. Choice of Test Location 237A. Laboratory Test. 238B. Central Location Tests 238C. Home Use Tests 239
IV. Affective Methods: Qualitative 239A. Applications 239B. Types of Qualitative Affective Tests 240
1. Focus Groups 2402. Focus Panel s 2403. One-on-One Interviews '" 240
V. Affective Methods: Quantitative 241A. Applications 241B. Types of Quantitative Affective Tests 241
1. Preference Tests 2412. Acceptance Tests 242
C. Assessment of Individual Attributes (Attribute Diagnostics) 245VI. Design of Quantitative Affective Tests 247
A. Questionnaire Design 247B. Protocol Design 248
VII. Using Other Sensory Methods to Supplement Affective Testing 249A. Relating Affective and Descriptive Data 249B. Using Affective Data to Define Shelf-Life or Quality Limits 251
1. Example 12.3: Shelf Life of Sesap1e Cracker 25iReferences 254Appendix 12.1 Questionnaire for Consumer Studies 255
A. Candy Bar Questionnaire 2551. Candy Bar Liking Questions 2552. Candy Bar Specific Evaluation 256
B. Paper Table Napkins Questionnaire 2581. Paper.Table Napkins Liking Questions 2582. Paper Table Napkins Specific Evaluation 259
Appendix 12.2 Protocol Design for Consumer Studies 260A. Protocol Design Format Worksheets 260
1. Product Screening 2602. Sample Information 2603. Sample Preparation 2614. Sample Presentation 2615. Subjects 261
B. Protocol Design Example: Candy Bars 2621. Product Screening 2622. Sample Information 2623. Sample Preparation 2624. Sample Presentation 2635. Subjects 263

CHAPTER 13
Basic Statistical Methods 2651. Introduction 266
11. Summarizing Sensory Data 267A. Summary Analysis of Data in the Form of Ratings 268B. Estimating the Proportion of a Population that Possesses a Particular
Characteristic 269C. Confidence Intervals on )1 and p 270D. Other Interval Estimates 274E. Data Transformations 275
III. Statistical Hypothesis Testing 276A. Statistical Hypotheses 276B. One-Sided and Two-Sided Hypotheses 277C. Type 1 and Type 11Errors 278D. Examples: Tests on Means, Standard Deviations, and Proportions 280
1. Example 13.1: Testing that the Mean of a Distribution is Equal to aSpecified Value 280
2. Example 13.2: Comparing Two Means - Paired-Sample Case 2813. Example 13.3: Comparing Two Means - Independent (or Two-Sample) Case 2824. Example 13.4: Comparing Standard Deviations from Two Normal Populations 2835. Example 13.5: Testing that the Population Proportion is Equal to a
Specified Value 2836. Example 13.6: Comparing Two Population Proportions 284
E. Calculating Sample Sizes in Discrimination Tests 285IV. The Statistical Design of Sensory Panel Studies 287
A. Sampling: Replication vs. Multiple Observations 287B. Blocking an Experimental Design 288
1. Completely Randomized Designs 289C. Randomized (Complete) Block Designs 290
1. Randomized Block Analysis of Ratings 2912. Randomized Block Analysis of Rank Data 292
D. Balanced Incomplete Block Designs 2931. BIB Analysis of Ratings 2942. BIB Analysis of Rank Data 295
E. Latin Square Designs 295F. Split- Plot Designs 297
1. Split- Plot Analysis of Ratings 297G. A Simultaneous Multiple Comparison Procedure 298
V. Appendix on Probability 299A. The Normal Distribution 299
1. Example 13.7: Calculating Normal Probabilities on an Interval 3002. Example 13.8: Calculating Normal Tail Probabilities .301
B. The Binomial Distribution 3021. Example 13.9: Calculating Exact Binomial Probabilities .3022. Example 13.10: The Normal Approximation to the Binomial... 303
References 304

CHAPTER 14Advanced Statistical Methods .305
l. Introduction 305n. Data Relationships 306
A. All Independent Variables .3061. Correlation Analysis .3062. Principal Components Analysis 3083. Cluster Analysis 311
B. Dependent and Independent Variables 3131. Regression Analysis 314
a. Simple Linear Regression 314b. Multiple Linear Regression 317
2. Principal Component Regression .3203. Partial Least Squares Regression .3214. Discrirninant Analysis 322
III. The Treatrnent Structure of an Experimental Design , 324A. Factorial Treatrnent Structures .324B. Fractional Factorials and Screening Studies 326
1. Constructing Fractional Factorials 3282. Plackett-Burman Experiments .3293. Analysis of Screening Studies 329
C. Response Surface Methodology 330References 334
CHAPTER 15Guidelines for Choice of Technique .337
1. Introduction .337A. Define the Project Objective 337B. Define the Test Objective 337C. Reissue Project Objective and Test Objectives _ Revise Test Design .338
Table 15.1. Types of Problems Encountered in Sensory Analysis 339Table 15.2. Area of Application of Difference Tests:
Does a Sensory Difference Exist Between Samples? 340Table 15.3. Area of Application of Attribute Difference Tests:
How Does Attribute X Differ Between Samples? 341Table 15.4. Area of Application of Affective Tests Used in Consumer Tests and
Employee Acceptance Tests 342Table 15.5. Area of Application of Descriptive Tests 343Reference 343
CHAPTER 16Guidelines for Reporting Results 345
1. Introduction 345n. Summary .345IlI. Objective 346IV. Experimental .346V. Resu1ts and Discussion 347
References 350

Table TI.Table T2.Table T3.Table T4.
Table T5.Table T6.Table n.Table T8.Table T9.
Table T13.Table T14.
Random Orders of the Digits 1 to 9: Arranged in Groups of Three Columns 353The Standard Normal Distribution 354Upper-a Probability Points of Student's t-Distribution 355Percentage Points of the Studentized Range: Upper-a Probability Pointsfor Tukey's HSD Multiple Comparison Procedure 356Upper-a Probability Points of X2 Distribution 360Upper-a Probability Points of F-Distribution 362Minimum Number of Assessments in a Triangle Test 369Critical Number of Correct Responses in a Triangle Test 369Minimum Number of Assessments in a Duo- Trio or One-Sided DirectionalDifference Test 370Critical Number of Correct Responses in a Duo- Trio orOne-Sided Directional Difference Test... 37lMinimum Number of Assessments in a Two-Sided DirectionalDifference Test .372Critical Number of Correct Responses in a Two-Sided DirectionalDifference Test 373Minimum Number of Assessments in a Two-out-of-Five Test.. .374Critical Number of Correct Responses in a Two-out-of-Five Test 375


![Algebra lineal [ufro]](https://img.pdfslide.net/doc/110x75/55b5f76dbb61eb6c218b467c/algebra-lineal-ufro.jpg)