Embed Size (px)
Citation preview
The Project for Lahore Urban Transport Master Plan in the Islamic Republic of Pakistan
FINAL REPORT: VOLUME I of II
CHAPTER 2 – CURRENT TRANSPORT SITUATION, PROBLEMS AND ISSUES
2-68
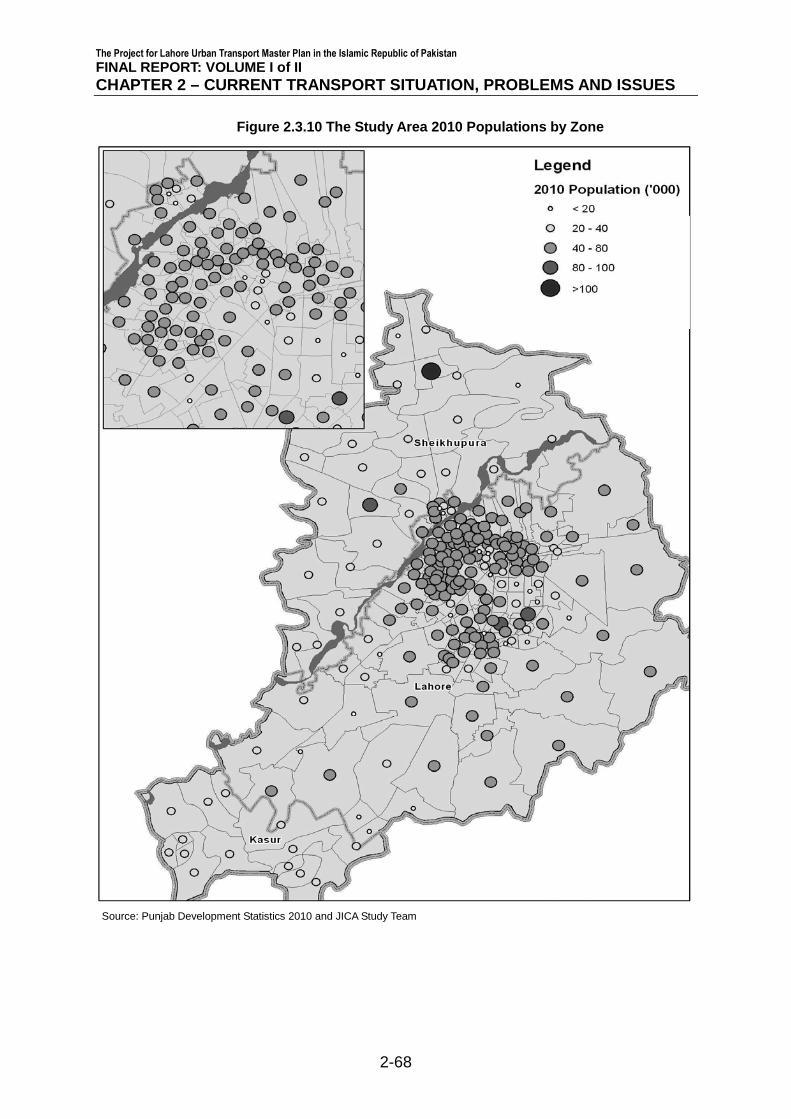
Figure 2.3.10 The Study Area 2010 Populations by Zone
Source: Punjab Development Statistics 2010 and JICA Study Team
The Project for Lahore Urban Transport Master Plan in the Islamic Republic of Pakistan
FINAL REPORT: VOLUME I of II
CHAPTER 2 – CURRENT TRANSPORT SITUATION, PROBLEMS AND ISSUES
2-69
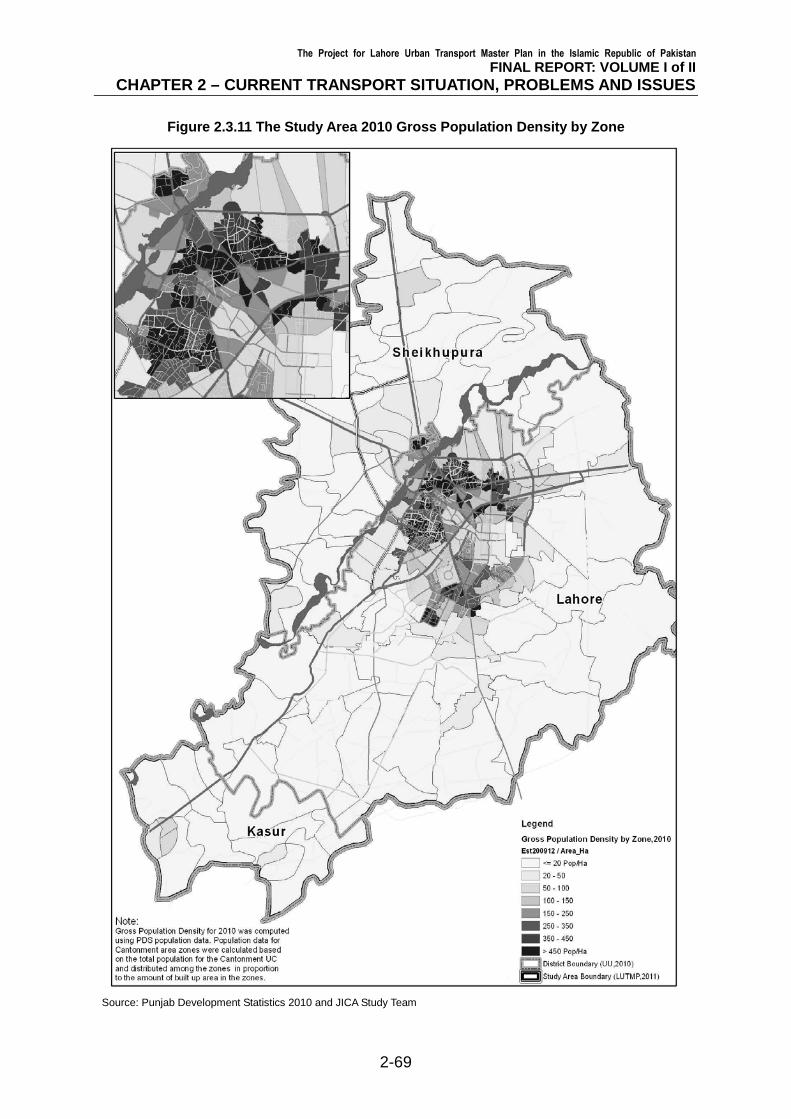
Figure 2.3.11 The Study Area 2010 Gross Population Density by Zone
Source: Punjab Development Statistics 2010 and JICA Study Team
The Project for Lahore Urban Transport Master Plan in the Islamic Republic of Pakistan
FINAL REPORT: VOLUME I of II
CHAPTER 2 – CURRENT TRANSPORT SITUATION, PROBLEMS AND ISSUES
2-70
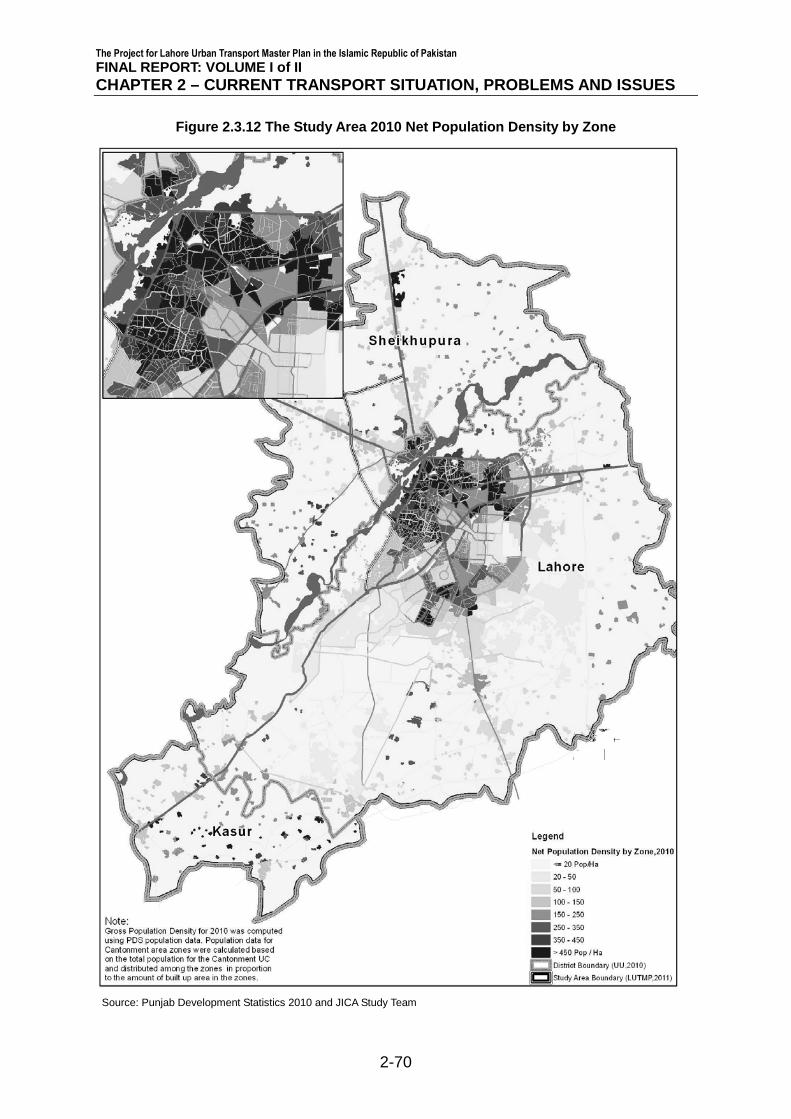
Figure 2.3.12 The Study Area 2010 Net Population Density by Zone
Source: Punjab Development Statistics 2010 and JICA Study Team
The Project for Lahore Urban Transport Master Plan in the Islamic Republic of Pakistan
FINAL REPORT: VOLUME I of II
CHAPTER 2 – CURRENT TRANSPORT SITUATION, PROBLEMS AND ISSUES
2-71
The net density plot clearly demonstrates that the population is mostly concentrated
around the old city area in a concentric fashion, with the exception of linear developments
along major arterial roads in the Study Area. The population in the mostly built up area
around the city centre accounts for over 66 % of the Study Area population in
approximately 10 % of the Study Area. This signifies that the population density in Lahore
is still considerably lower than similar conurbation/ metropolis around the Asia region.
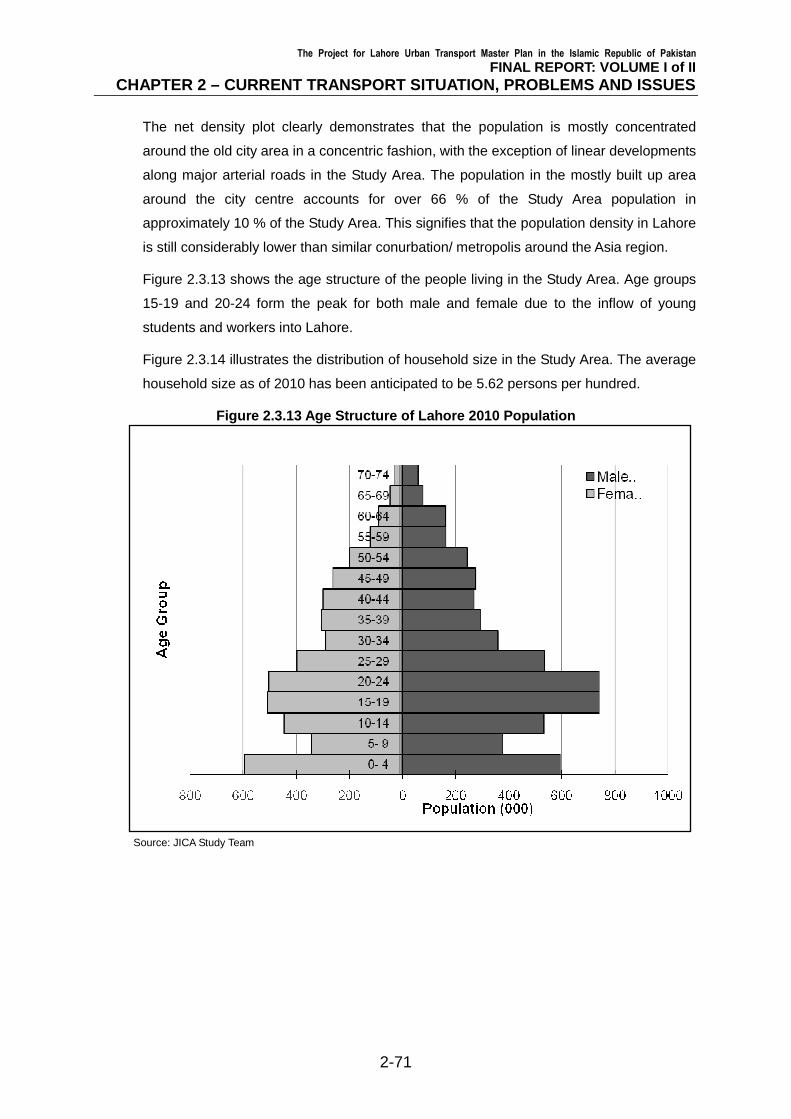
Figure 2.3.13 shows the age structure of the people living in the Study Area. Age groups
15-19 and 20-24 form the peak for both male and female due to the inflow of young
students and workers into Lahore.
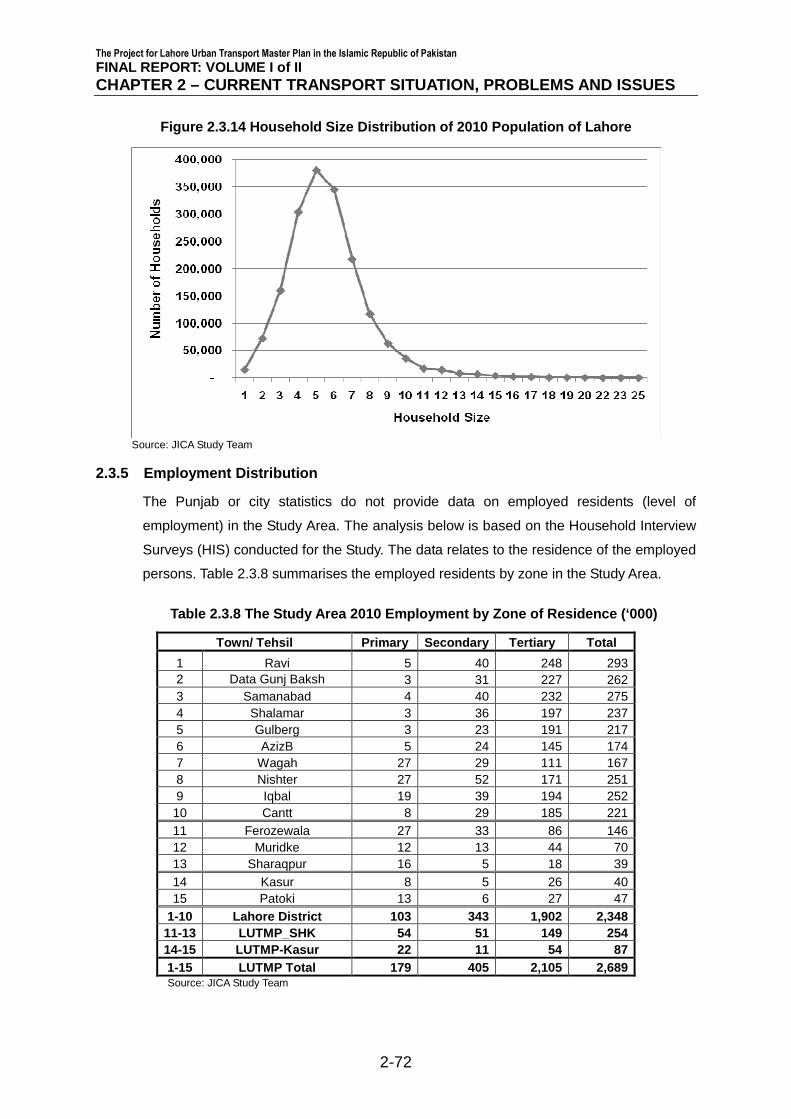
Figure 2.3.14 illustrates the distribution of household size in the Study Area. The average
household size as of 2010 has been anticipated to be 5.62 persons per hundred.
Figure 2.3.13 Age Structure of Lahore 2010 Population
Source: JICA Study Team
The Project for Lahore Urban Transport Master Plan in the Islamic Republic of Pakistan
FINAL REPORT: VOLUME I of II
CHAPTER 2 – CURRENT TRANSPORT SITUATION, PROBLEMS AND ISSUES
2-72
Figure 2.3.14 Household Size Distribution of 2010 Population of Lahore
Source: JICA Study Team
2.3.5 Employment Distribution
The Punjab or city statistics do not provide data on employed residents (level of
employment) in the Study Area. The analysis below is based on the Household Interview
Surveys (HIS) conducted for the Study. The data relates to the residence of the employed
persons. Table 2.3.8 summarises the employed residents by zone in the Study Area.
Table 2.3.8 The Study Area 2010 Employment by Zone of Residence (‘000)
Town/ Tehsil Primary Secondary Tertiary Total
1 Ravi 5 40 248 293 2 Data Gunj Baksh 3 31 227 262 3 Samanabad 4 40 232 275 4 Shalamar 3 36 197 237 5 Gulberg 3 23 191 217 6 AzizB 5 24 145 174 7 Wagah 27 29 111 167 8 Nishter 27 52 171 251 9 Iqbal 19 39 194 252
10 Cantt 8 29 185 221 11 Ferozewala 27 33 86 146 12 Muridke 12 13 44 70 13 Sharaqpur 16 5 18 39 14 Kasur 8 5 26 40 15 Patoki 13 6 27 47
1-10 Lahore District 103 343 1,902 2,348 11-13 LUTMP_SHK 54 51 149 254 14-15 LUTMP-Kasur 22 11 54 87 1-15 LUTMP Total 179 405 2,105 2,689 Source: JICA Study Team
The Project for Lahore Urban Transport Master Plan in the Islamic Republic of Pakistan
FINAL REPORT: VOLUME I of II
CHAPTER 2 – CURRENT TRANSPORT SITUATION, PROBLEMS AND ISSUES
2-73
The employment participation rate (Number of employed persons/ Total population) in
Lahore is estimated to be around 27 %. This figure is rather low, and the main reason
being that most of the population is young, and is below the employment age group of 0 ~
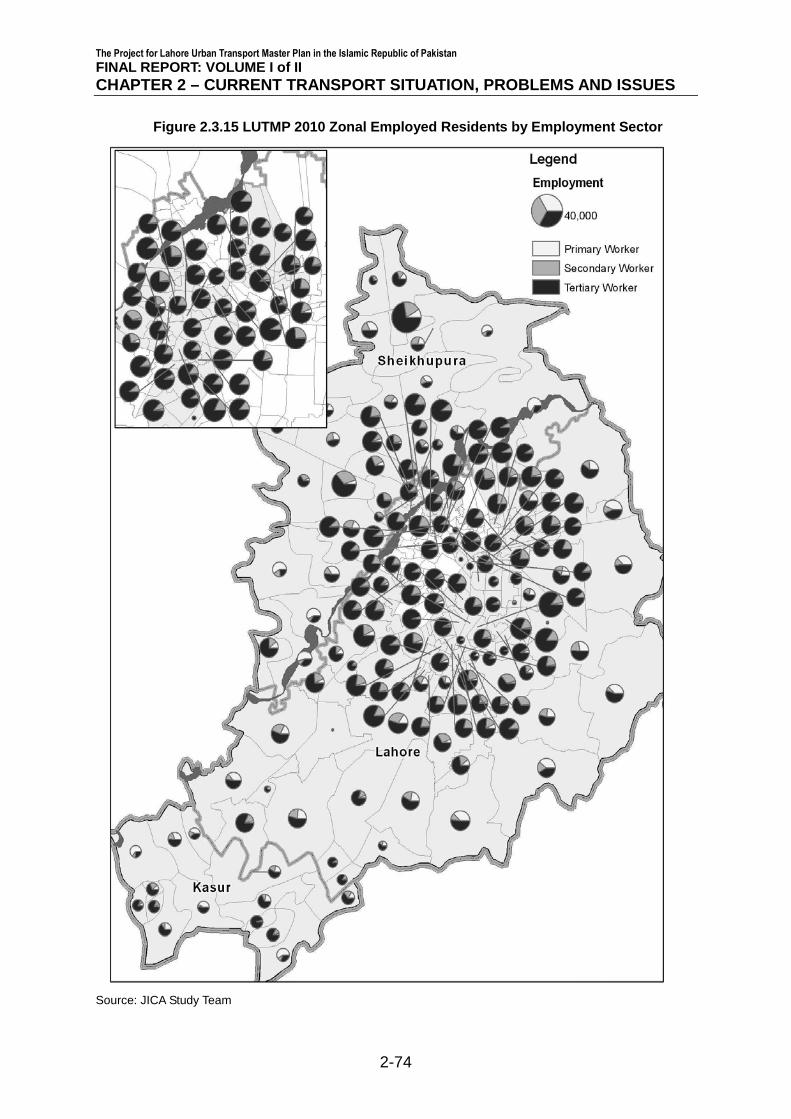
16 years. As anticipated, majority of the population is employed in tertiary sector, almost
five times more than those employed in the industrial or manufacturing sector. This is
significant to note that most of the Punjab provincial government offices are in Lahore,
along with the banking, and other service sector employment. Distribution of employed
residents by zone and employment sector is shown in Figure 2.3.15.
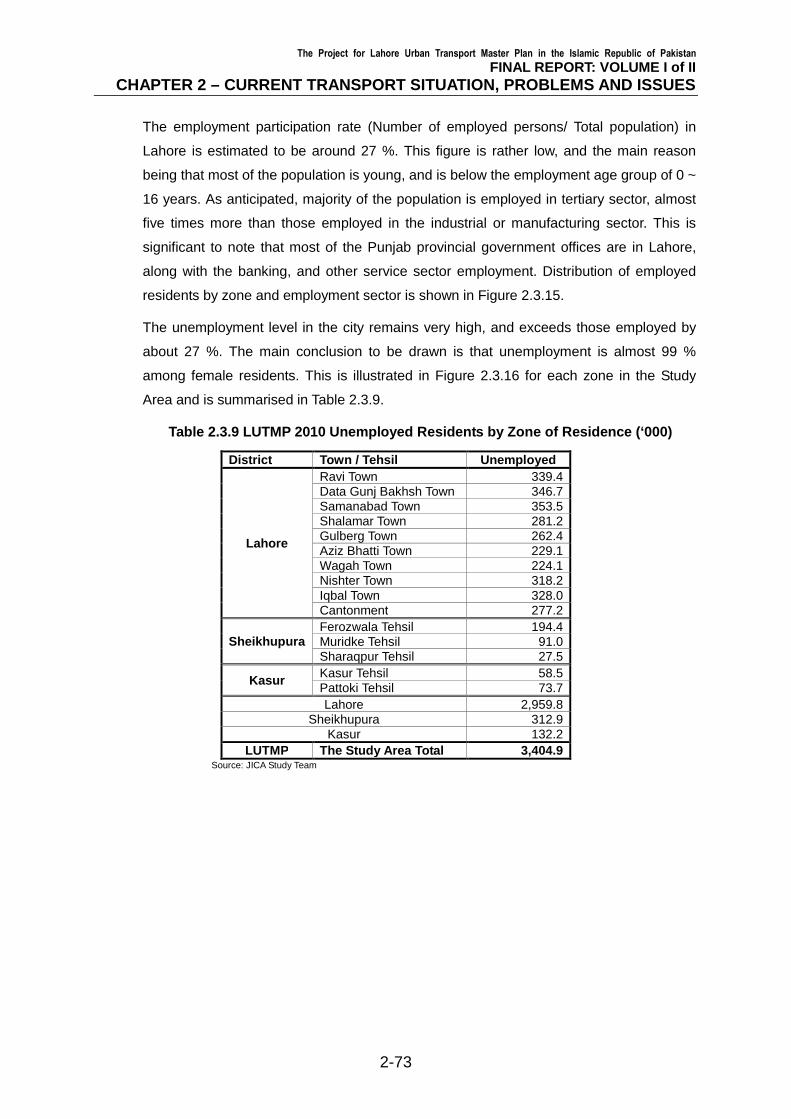
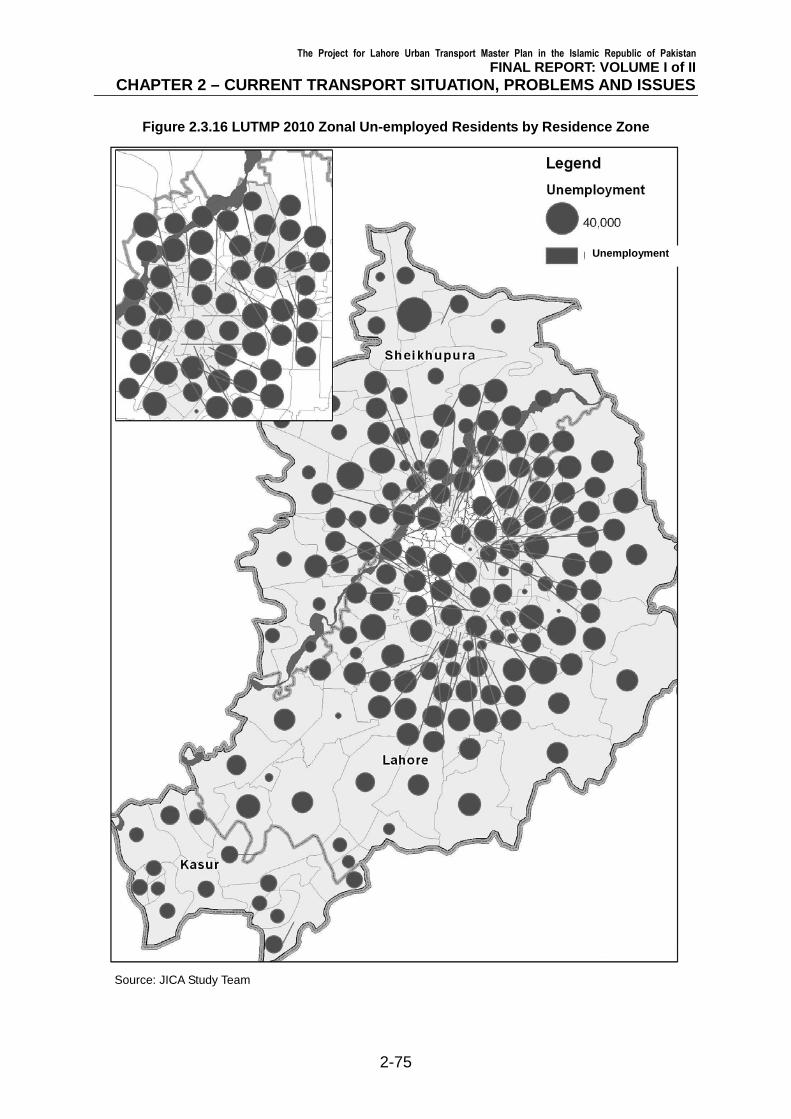
The unemployment level in the city remains very high, and exceeds those employed by
about 27 %. The main conclusion to be drawn is that unemployment is almost 99 %
among female residents. This is illustrated in Figure 2.3.16 for each zone in the Study
Area and is summarised in Table 2.3.9.
Table 2.3.9 LUTMP 2010 Unemployed Residents by Zone of Residence (‘000)
District Town / Tehsil Unemployed
Lahore
Ravi Town 339.4 Data Gunj Bakhsh Town 346.7 Samanabad Town 353.5 Shalamar Town 281.2 Gulberg Town 262.4 Aziz Bhatti Town 229.1 Wagah Town 224.1 Nishter Town 318.2 Iqbal Town 328.0 Cantonment 277.2
Sheikhupura Ferozwala Tehsil 194.4 Muridke Tehsil 91.0 Sharaqpur Tehsil 27.5
Kasur Kasur Tehsil 58.5 Pattoki Tehsil 73.7 Lahore 2,959.8
Sheikhupura 312.9 Kasur 132.2
LUTMP The Study Area Total 3,404.9 Source: JICA Study Team
The Project for Lahore Urban Transport Master Plan in the Islamic Republic of Pakistan
FINAL REPORT: VOLUME I of II
CHAPTER 2 – CURRENT TRANSPORT SITUATION, PROBLEMS AND ISSUES
2-74
Figure 2.3.15 LUTMP 2010 Zonal Employed Residents by Employment Sector
Source: JICA Study Team
The Project for Lahore Urban Transport Master Plan in the Islamic Republic of Pakistan
FINAL REPORT: VOLUME I of II
CHAPTER 2 – CURRENT TRANSPORT SITUATION, PROBLEMS AND ISSUES
2-75
Figure 2.3.16 LUTMP 2010 Zonal Un-employed Residents by Residence Zone
Source: JICA Study Team
Unemployment
The Project for Lahore Urban Transport Master Plan in the Islamic Republic of Pakistan
FINAL REPORT: VOLUME I of II
CHAPTER 2 – CURRENT TRANSPORT SITUATION, PROBLEMS AND ISSUES
2-76
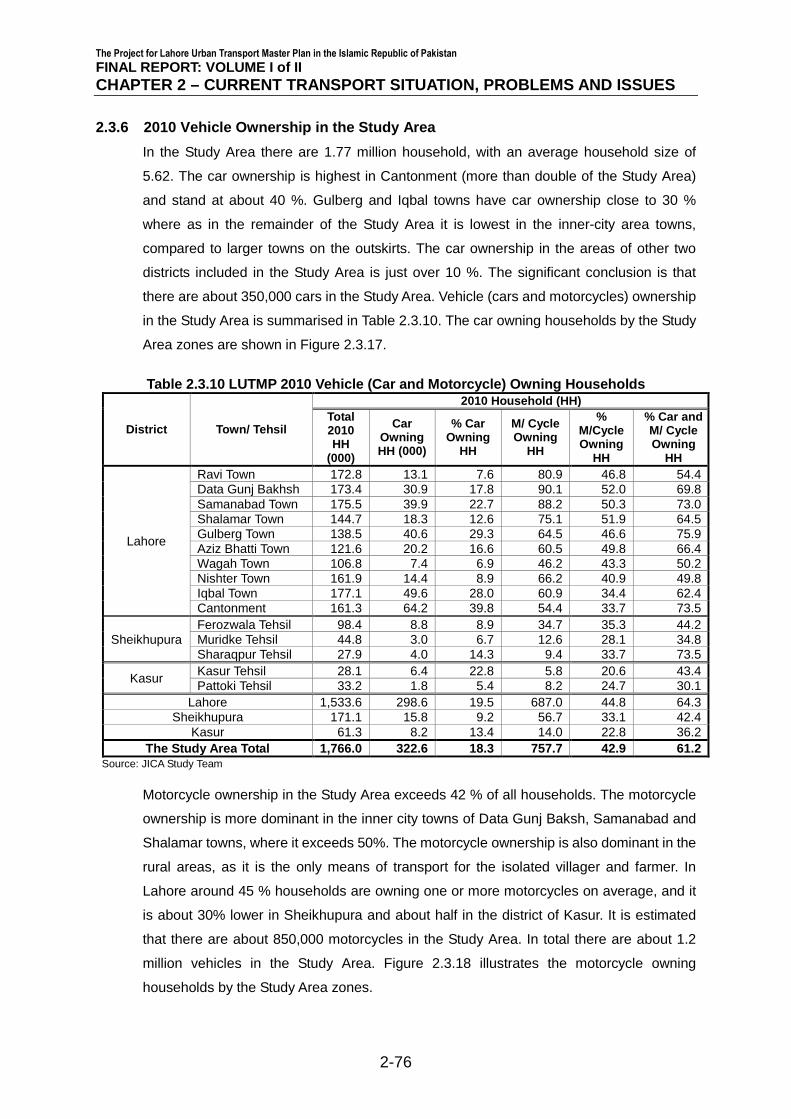
2.3.6 2010 Vehicle Ownership in the Study Area
In the Study Area there are 1.77 million household, with an average household size of
5.62. The car ownership is highest in Cantonment (more than double of the Study Area)
and stand at about 40 %. Gulberg and Iqbal towns have car ownership close to 30 %
where as in the remainder of the Study Area it is lowest in the inner-city area towns,
compared to larger towns on the outskirts. The car ownership in the areas of other two
districts included in the Study Area is just over 10 %. The significant conclusion is that
there are about 350,000 cars in the Study Area. Vehicle (cars and motorcycles) ownership
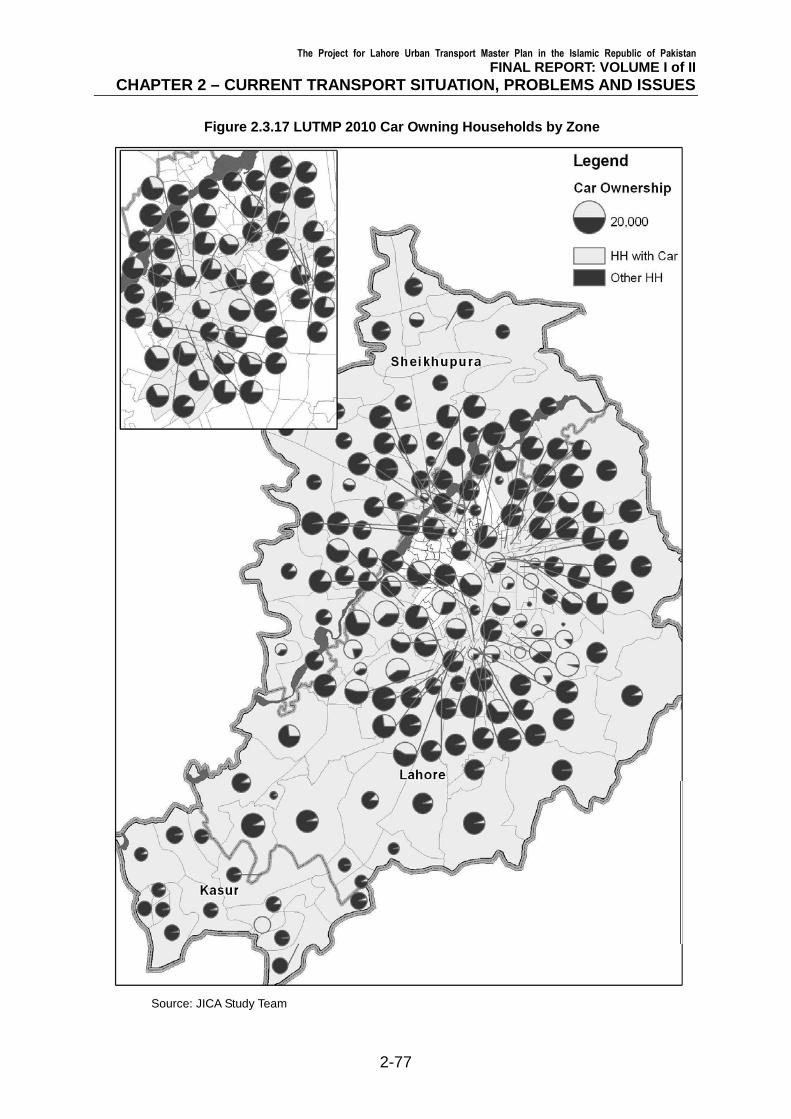
in the Study Area is summarised in Table 2.3.10. The car owning households by the Study
Area zones are shown in Figure 2.3.17.
Table 2.3.10 LUTMP 2010 Vehicle (Car and Motorcycle) Owning Households
District Town/ Tehsil
2010 Household (HH) Total 2010 HH
(000)
Car Owning HH (000)
% Car Owning
HH
M/ Cycle Owning
HH
% M/Cycle Owning
HH
% Car and M/ Cycle Owning
HH
Lahore
Ravi Town 172.8 13.1 7.6 80.9 46.8 54.4 Data Gunj Bakhsh 173.4 30.9 17.8 90.1 52.0 69.8 Samanabad Town 175.5 39.9 22.7 88.2 50.3 73.0 Shalamar Town 144.7 18.3 12.6 75.1 51.9 64.5 Gulberg Town 138.5 40.6 29.3 64.5 46.6 75.9 Aziz Bhatti Town 121.6 20.2 16.6 60.5 49.8 66.4 Wagah Town 106.8 7.4 6.9 46.2 43.3 50.2 Nishter Town 161.9 14.4 8.9 66.2 40.9 49.8 Iqbal Town 177.1 49.6 28.0 60.9 34.4 62.4 Cantonment 161.3 64.2 39.8 54.4 33.7 73.5
Sheikhupura Ferozwala Tehsil 98.4 8.8 8.9 34.7 35.3 44.2 Muridke Tehsil 44.8 3.0 6.7 12.6 28.1 34.8 Sharaqpur Tehsil 27.9 4.0 14.3 9.4 33.7 73.5
Kasur Kasur Tehsil 28.1 6.4 22.8 5.8 20.6 43.4 Pattoki Tehsil 33.2 1.8 5.4 8.2 24.7 30.1
Lahore 1,533.6 298.6 19.5 687.0 44.8 64.3 Sheikhupura 171.1 15.8 9.2 56.7 33.1 42.4
Kasur 61.3 8.2 13.4 14.0 22.8 36.2 The Study Area Total 1,766.0 322.6 18.3 757.7 42.9 61.2
Source: JICA Study Team
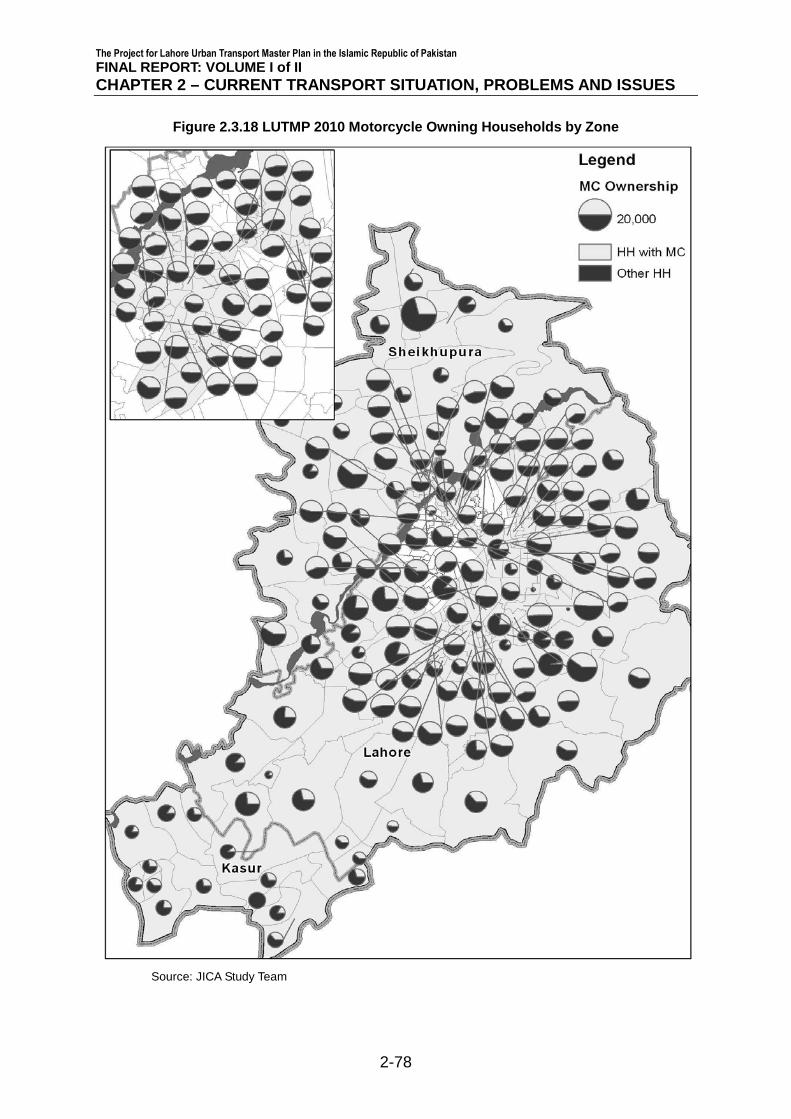
Motorcycle ownership in the Study Area exceeds 42 % of all households. The motorcycle
ownership is more dominant in the inner city towns of Data Gunj Baksh, Samanabad and
Shalamar towns, where it exceeds 50%. The motorcycle ownership is also dominant in the
rural areas, as it is the only means of transport for the isolated villager and farmer. In
Lahore around 45 % households are owning one or more motorcycles on average, and it
is about 30% lower in Sheikhupura and about half in the district of Kasur. It is estimated
that there are about 850,000 motorcycles in the Study Area. In total there are about 1.2
million vehicles in the Study Area. Figure 2.3.18 illustrates the motorcycle owning
households by the Study Area zones.
The Project for Lahore Urban Transport Master Plan in the Islamic Republic of Pakistan
FINAL REPORT: VOLUME I of II
CHAPTER 2 – CURRENT TRANSPORT SITUATION, PROBLEMS AND ISSUES
2-77
Figure 2.3.17 LUTMP 2010 Car Owning Households by Zone
Source: JICA Study Team
The Project for Lahore Urban Transport Master Plan in the Islamic Republic of Pakistan
FINAL REPORT: VOLUME I of II
CHAPTER 2 – CURRENT TRANSPORT SITUATION, PROBLEMS AND ISSUES
2-78
Figure 2.3.18 LUTMP 2010 Motorcycle Owning Households by Zone
Source: JICA Study Team
The Project for Lahore Urban Transport Master Plan in the Islamic Republic of Pakistan
FINAL REPORT: VOLUME I of II
CHAPTER 2 – CURRENT TRANSPORT SITUATION, PROBLEMS AND ISSUES
2-79
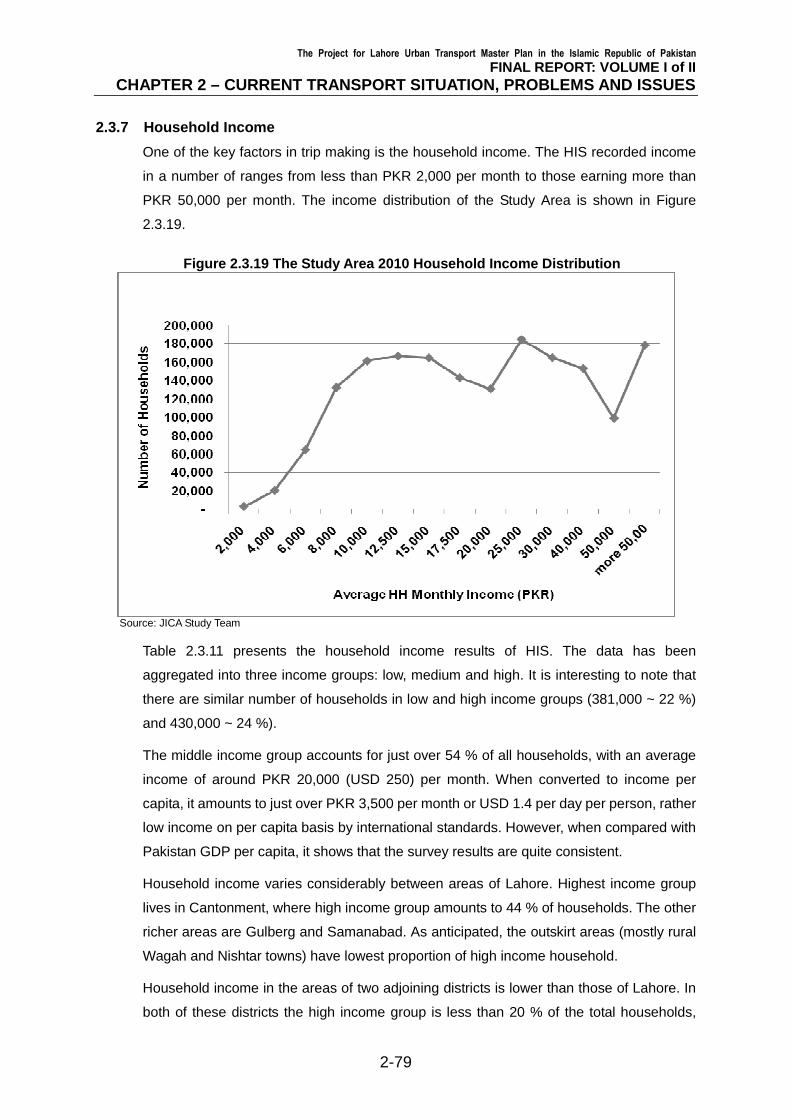
2.3.7 Household Income
One of the key factors in trip making is the household income. The HIS recorded income
in a number of ranges from less than PKR 2,000 per month to those earning more than
PKR 50,000 per month. The income distribution of the Study Area is shown in Figure
2.3.19.
Figure 2.3.19 The Study Area 2010 Household Income Distribution
Source: JICA Study Team
Table 2.3.11 presents the household income results of HIS. The data has been
aggregated into three income groups: low, medium and high. It is interesting to note that
there are similar number of households in low and high income groups (381,000 ~ 22 %)
and 430,000 ~ 24 %).
The middle income group accounts for just over 54 % of all households, with an average
income of around PKR 20,000 (USD 250) per month. When converted to income per
capita, it amounts to just over PKR 3,500 per month or USD 1.4 per day per person, rather
low income on per capita basis by international standards. However, when compared with
Pakistan GDP per capita, it shows that the survey results are quite consistent.
Household income varies considerably between areas of Lahore. Highest income group
lives in Cantonment, where high income group amounts to 44 % of households. The other
richer areas are Gulberg and Samanabad. As anticipated, the outskirt areas (mostly rural
Wagah and Nishtar towns) have lowest proportion of high income household.
Household income in the areas of two adjoining districts is lower than those of Lahore. In
both of these districts the high income group is less than 20 % of the total households,
The Project for Lahore Urban Transport Master Plan in the Islamic Republic of Pakistan
FINAL REPORT: VOLUME I of II
CHAPTER 2 – CURRENT TRANSPORT SITUATION, PROBLEMS AND ISSUES
2-80
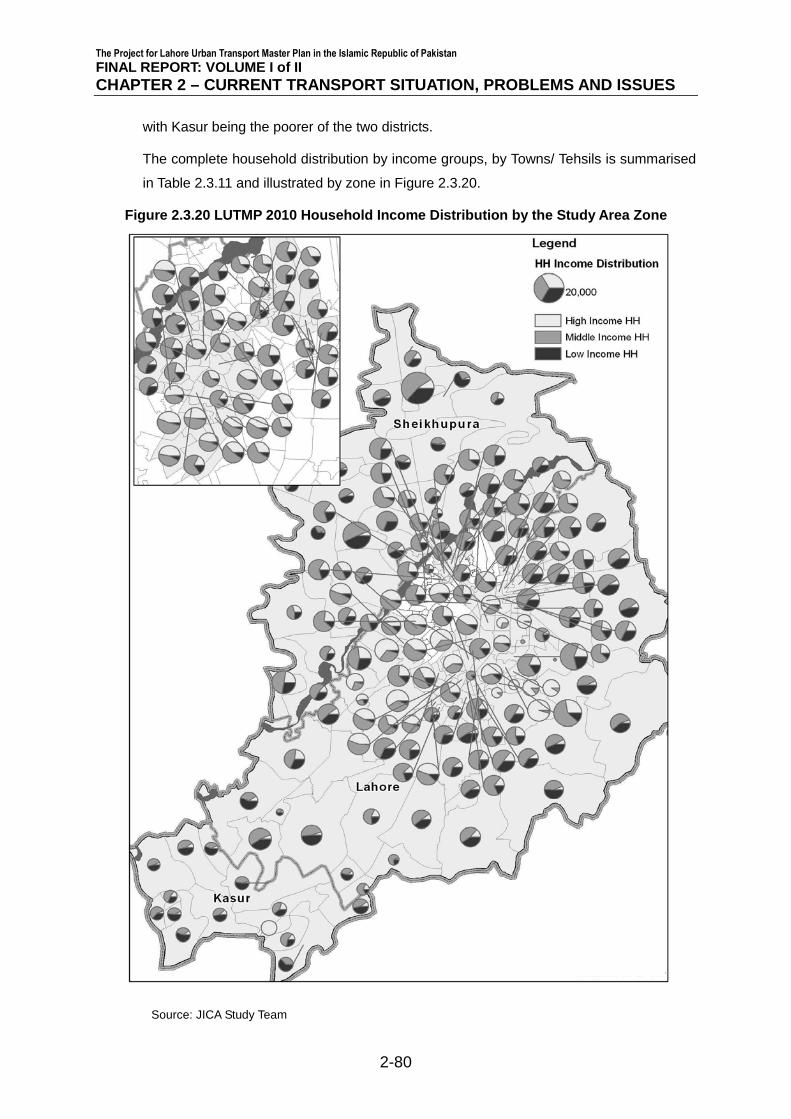
with Kasur being the poorer of the two districts.
The complete household distribution by income groups, by Towns/ Tehsils is summarised
in Table 2.3.11 and illustrated by zone in Figure 2.3.20.
Figure 2.3.20 LUTMP 2010 Household Income Distribution by the Study Area Zone
Source: JICA Study Team
The Project for Lahore Urban Transport Master Plan in the Islamic Republic of Pakistan
FINAL REPORT: VOLUME I of II
CHAPTER 2 – CURRENT TRANSPORT SITUATION, PROBLEMS AND ISSUES
2-81
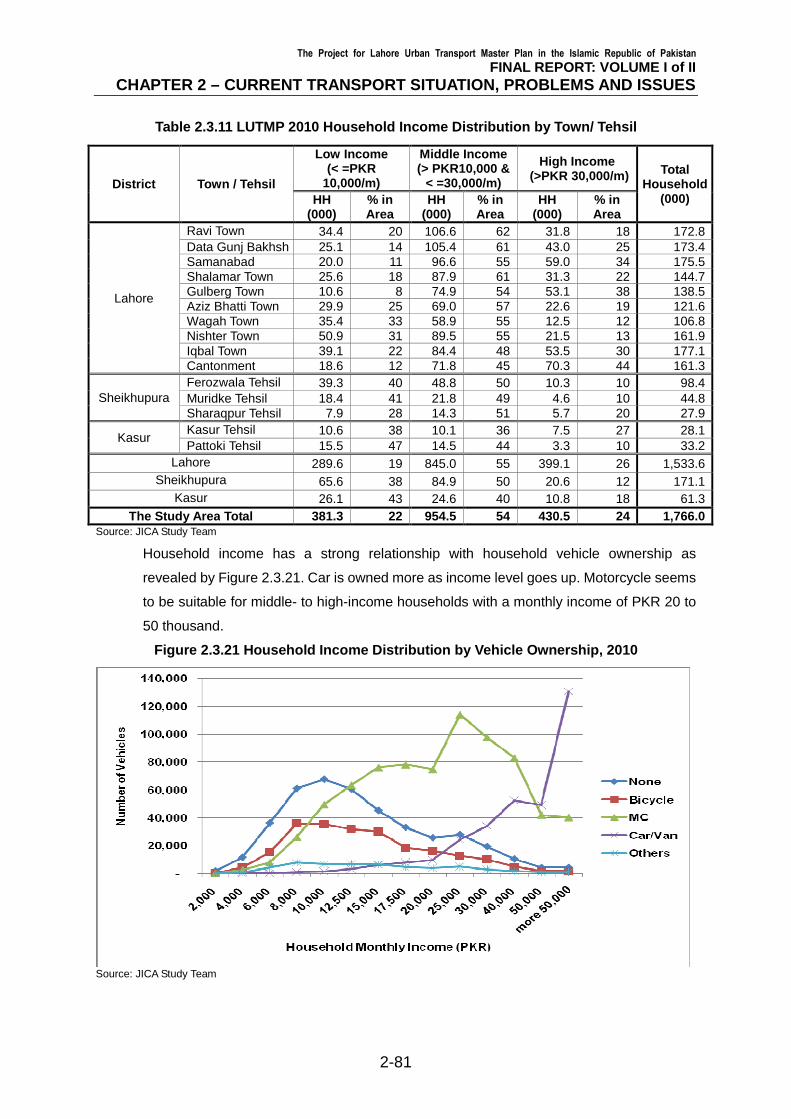
Table 2.3.11 LUTMP 2010 Household Income Distribution by Town/ Tehsil
District Town / Tehsil
Low Income (< =PKR
10,000/m)
Middle Income (> PKR10,000 &
< =30,000/m)
High Income (>PKR 30,000/m) Total
Household (000) HH
(000) % in Area
HH (000)
% in Area
HH (000)
% in Area
Lahore
Ravi Town 34.4 20 106.6 62 31.8 18 172.8 Data Gunj Bakhsh 25.1 14 105.4 61 43.0 25 173.4 Samanabad 20.0 11 96.6 55 59.0 34 175.5 Shalamar Town 25.6 18 87.9 61 31.3 22 144.7 Gulberg Town 10.6 8 74.9 54 53.1 38 138.5 Aziz Bhatti Town 29.9 25 69.0 57 22.6 19 121.6 Wagah Town 35.4 33 58.9 55 12.5 12 106.8 Nishter Town 50.9 31 89.5 55 21.5 13 161.9 Iqbal Town 39.1 22 84.4 48 53.5 30 177.1 Cantonment 18.6 12 71.8 45 70.3 44 161.3
Sheikhupura Ferozwala Tehsil 39.3 40 48.8 50 10.3 10 98.4 Muridke Tehsil 18.4 41 21.8 49 4.6 10 44.8 Sharaqpur Tehsil 7.9 28 14.3 51 5.7 20 27.9
Kasur Kasur Tehsil 10.6 38 10.1 36 7.5 27 28.1 Pattoki Tehsil 15.5 47 14.5 44 3.3 10 33.2
Lahore 289.6 19 845.0 55 399.1 26 1,533.6 Sheikhupura 65.6 38 84.9 50 20.6 12 171.1
Kasur 26.1 43 24.6 40 10.8 18 61.3 The Study Area Total 381.3 22 954.5 54 430.5 24 1,766.0
Source: JICA Study Team
Household income has a strong relationship with household vehicle ownership as
revealed by Figure 2.3.21. Car is owned more as income level goes up. Motorcycle seems
to be suitable for middle- to high-income households with a monthly income of PKR 20 to
50 thousand.
Figure 2.3.21 Household Income Distribution by Vehicle Ownership, 2010
Source: JICA Study Team