Embed Size (px)
Citation preview
0
33
Table of Contents Page
Mayoral Forward 4
Accounting Officer’s Overview on the State of the Municipality 5
Chapter 1: Introduction and Overview
Overview 7
Executive Summary 7
Financial Health 8
Chapter 2: Performance Highlights 9
KPA 1: Spatial Rationale 9
KPA 2: Municipal Transformation and Organizational Development 9
KPA 3: Basic Service Delivery 10
MARULENG LOCAL MUNICIPALITY
DRAFT ANNUAL REPORT
2010- 2011
”Once your direction becomes clear to you and fully visible
to others, all the elements of winning – attitude,
performance, teamwork and competition – begin to come
together.”
Denis Connor
1
Table of Contents Foreword by the Honourable Mayor 3 Accounting Officer’s overview on the state of the municipality 4 Chapter One: Introduction and Overview 6 Chapter Two: Performance Highlights 8 Chapter Three: Human Resource and other Organizational matters 17 Chapter Four: Audited Financial Statements and Related Financial matters 24 Chapter Five: Functional Area and Service Delivery Reporting 30 Chapter six: Conclusion 66
Annexure
2
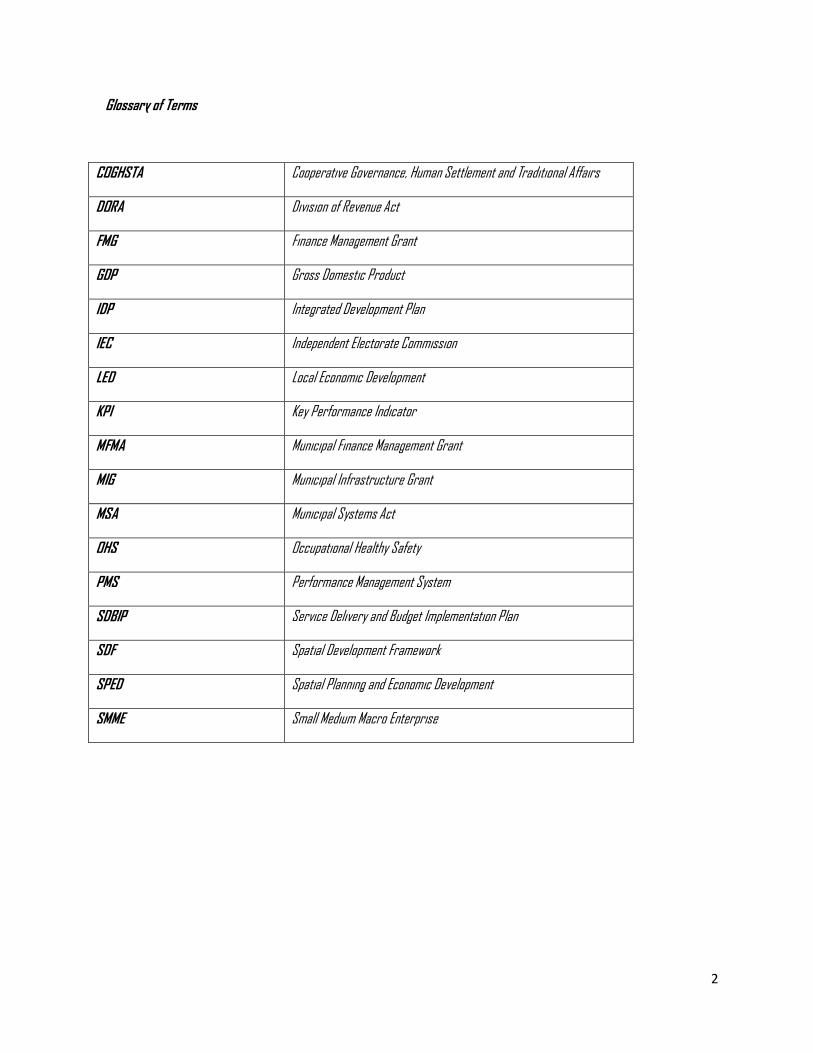
Glossary of Terms
COGHSTA Cooperative Governance, Human Settlement and Traditional Affairs
DORA Division of Revenue Act
FMG Finance Management Grant
GDP Gross Domestic Product
IDP Integrated Development Plan
IEC Independent Electorate Commission
LED Local Economic Development
KPI Key Performance Indicator
MFMA Municipal Finance Management Grant
MIG Municipal Infrastructure Grant
MSA Municipal Systems Act
OHS Occupational Healthy Safety
PMS Performance Management System
SDBIP Service Delivery and Budget Implementation Plan
SDF Spatial Development Framework
SPED Spatial Planning and Economic Development
SMME Small Medium Macro Enterprise
3
FOREWORD BY HIS WORSHIP THE MAYOR
The 2010/2011 Annual Report for Maruleng Local Municipality sets out the performance highlights and financial management for the
2010/2011 financial year. The report is an account of the municipal’s achievements in the year under review, and as with any rigorous
reporting instrument it does not hesitate in pointing out where the municipality has fallen short. The municipality has attained an
unqualified audit for the second consecutive year. Thanks to all stakeholders that have contributed for this achievement. It is our
conviction that this opinion from the Auditor General will contribute towards the realization of our shared commitment (goals) to:
Restore the confidence of the majority of the people in local government, as the primary delivery machine of the
developmental state at a local level; and
Re-build and improve the basic requirements for a functional, accountable, responsive, effective, efficient
developmental local government
The report is published in terms of the Municipal Finance Management Act, 2003 which requires municipalities to report regularly on
all aspects of performance and expenditure.
It also forms part of a cycle of ongoing planning, monitoring and evaluation that begins with the formulation and annual review of the
Integrated Development Plan – the five-year plan for the municipality, which ideally reflects the views of stakeholders in the
municipality.
Readers of this Annual Report will be able to reflect on progress in meeting the objectives of the IDP, and see where we have delivered
and where challenges still lie. I have no doubt that this will be a useful document for councillors, staff and stakeholders as we strive to
continuously improve our services to the people of Maruleng.
Under the auspices of Section 152 of the Constitution read with Section 32 (RSA, 1996), I hereby wish to thank our communities
and other actors, i.e Magoshi, business community, members of the civil society, etc for the contribution they have made in ensuring
that the municipality performed as it did.
Together we can do more.
Pule Abel Mafologele
Mayor
4
Accounting Office’s Overview of the State of the Municipality
This report is published in terms of the Municipal Finance Management Act, Act 56 of 2003 and
the local government legislation that has brought about considerable changes to local
government over the past years. One such change has been the implementation of performance management regulations
and guidelines, which require municipalities to report on progress in specific areas. The MFMA also sets very high
standards when it comes to accounting on the use of public funds.
As is the case with other municipalities, Maruleng municipality strives to achieve service excellence in all areas of its work.
This report will give readers a substantial insight into the workings of the municipality. Over the past four years we have
being seeing a steady improvement in the quality of our performance reporting as organizational performance
management becomes entrenched and as managers begin to see how the identification of key performance indicators and
the tracking thereof can aid service delivery and create or highlight opportunities for ongoing improvement. As this way of
working becomes entrenched in municipality, it also becomes possible for our stakeholders to measure our progress based
on clearly stated objectives. It came as no surprise when we attained an unqualified audit for the second consecutive year.
The highlights of the year under review are captured under 6 key performance areas below.
Spatial Planning
The municipality in conjunction with DLGH was able to demarcate 500 sites in Scotia a historic achievement in the sense that the
settlement came in to being as the results of land claim settlement. This achievement also increased the number of traditional
leaders from three to four. The challenge ahead of this development is provisioning of basic services and attracts business to
the area.
Municipal Transformation
The municipality had its IDP rated high in terms of the MEC assessment for the financial year 2010/2011 which is the third
consecutive year for such ratings. Therefore, this achievement meant all implementation of programmes and projects are based
on credible strategic document- IDP. The filling of positions in the organogram stood at 75.8 % (136 positions of 180 are filled).
This is an achievement as most of the critical positions are filled. The challenge however remains in the employment equity as
only one woman is a S57 Manager. The problem is that the municipality is unable to attract suitable people from the equity
target.
Basic Service Delivery
Maruleng municipality continued to collaborate with sector departments and state agencies to ensure that service delivery is
realized. This was done under the auspices of integrated development. Key agencies that duly appreciation is given to continue
assisting the municipality to deliver on key services include the Mopani District Mopani and ESKOM. Mopani District Municipality
continued with the roll out of sanitation projects in most villages in the municipal area as well as implementing Mametja-
5
Sekororo Regional Water Scheme and roads related projects. The municipality has witnessed the operationalization of the Law
Enforcement Unit, which will add value in the road safety.
Local Economic Development
LIBSA continued to support SMMEs through capacity building programmes. The process of building the shopping complex in Metz
is under way as the site was handed over to the developer. This is a breakthrough because most local communities will have
access to the shopping centre within a walking distance and jobs will also be created. About 2624 jobs were created and of which
33 are permanent. Most of the jobs created benefited
Financial Management
The municipality has shown great capability in the area of financial management. This is attested by the implementation GRAP
standard beginning with implementation of GRAP 17. There were also improvements regarding SCM processes. Implementation of
the Revenue Enhancement Strategy resulted in the municipality collecting more revenue than the previous years. The Treasury
wrote a letter to the municipality appreciating that the municipality spent grants as expected. However, the only challenge is the
accountability on financial management by staff members.
Good Governance
The functionality of council structures improved significantly in 2010/11 financial year. This translated in to each council structure
performing its role diligently. The municipal oversight committee was able to provide oversight on municipal performance on time
while the administration ensured that at all times performance information is subjected to both Internal Audit and Audit Committee
processes. The Ward Committees also added the needed value in the running of the municipality.
6
CHAPTER ONE
1.1. INTRODUCTION AND OVERVIEW
Maruleng Local Municipality is a Category B municipality that is located within Mopani District Municipality (MDM) in Limpopo Province.
The municipality covers the area 3247 square kilometers. The municipal area is largely rural, and is characterized by social service
backlogs, dispersed human settlements and high poverty levels. The population within the municipality is estimated at 95 769 that
resides in 36 settlements. The number of households increased from 19 668 in 2001 to 24 589 in 2007. This marked an increase of 4
921 or 20% increase.
The municipal area is divided into 12 wards. The municipal governance has been under the mayor as the political head, speaker as the
chairperson as chairperson of Council, 24 Councillors of which 12 are ward councilors and 12 are proportional representatives. The
Council has 4 Magoshi who serve as ex-officio members. The gender breakdown for the council stood at 12:12, which translates into 12
female and 12 male councillors. Therefore it means that there is 50% representation of both males and females in the council,
excluding ex-officio members.
1.2. EXECUTIVE SUMMARY
Vision and Mission statement
The Maruleng Municipality aspires “to be the powerhouse of socio-economic development through sustainable and integrated
agriculture and tourism”. The aforementioned vision will be attained through “the provision of basic services and the promotion of
socio-economic development in an integrated and sustainable manner”.
The Maruleng Municipality had a set of development priorities that guided service delivery for the year under review. The priorities
included water, electricity, roads, access to land and improved services. The service delivery priorities were further aligned to the
2006 to 2012 Integrated Development Plan strategies as per the list below.
Strategic Priorities for 2010/11 Financial Year
Provision of water and sanitation services
Job creation and livelihoods
Provision of roads and public service infrastructure
Waste management
Land use management and ownership
Maruleng Municipal Powers and Functions
In order to develop a functional capacity of the municipality it is imperative to be know the powers and functions as stipulated in the
Constitution and in terms of section 85 of the Municipal Structures Act no 117 of 1998 and further consider the assigned functions by
the MEC for the Department of Local Government and Housing given the capacity of respective municipality.
7
The municipality performances the following functions:
Building regulations
Billboards and advertisement
Local Tourism
Municipal planning
Street lighting
Cemeteries
Refuse removal
Licensing, registration of vehicles and traffic law enforcement
Municipal roads
Municipal parks and recreation
Local amenities ( community halls)
1.3. Municipal Financial Health
The municipality had a total revenue of R 92 960 749.04 in 2010/11 when compared to R 81 529 130.00 in 2009/10. This marked an
increase of R11 431 619.04 (12.3%) when compared to the 2009/10. The municipal revenue is categorized into internal and external
sources. The internal sources of revenue contributed R26 714 334.48 which is 28.74% of the total revenue while external sources
contributed 71.26% of the total revenue at R66 246 414.56i.e R 26 714 334.48 (operational revenue) and R 66 246 414 .56 (capital
revenue).
Total expenditure for the 2010/11 stood at R59 577 210 which illustrates an increase of R 9 245 929.00 i.e. 15.5 % increase from
the 2009/10 expenditure. The distribution of expenditures in R 28 337 122.37 (47.56%) for employees related costs, R 25 527
420.95 (42.85%) on general cost while councilors’ remuneration stood at R 5 712 666.68 (9.59 %). The overall expenditure
led to a surplus of R 33 383 539.04 in comparison to a surplus of R 21 932 003.00 in 2009/10 financial year.
The municipality’s financial position is further ascertained by assets and liabilities standing. The balance sheet of the municipality
reflected the total assets value at R 145 552 749.32 when compared to R 96 167 030.00 in 2009/10.
The above information depicts a healthy financial status for the municipality.
8
CHAPTER TWO
PERFORMANCE HIGHLIGHTS
This chapter of the Annual Report, 2010/11 performance year, reflects performance highlight of the MLM per Key Performance Areas
(KPA).
KPA 1: SPATIAL RATIONALE
Implementation of LUMS (Land Use Management Scheme) and SDF (Spatial Development Framework)
LUMS is the tool for land use and development scheme for areas that are not proclaimed or those without town planning schemes. The
implementation of the plan is intended to regulate land use and development in the municipal jurisdiction. SDF on the other hand is a
strategic document that takes stock or analysis on what land is available where and gives guidelines on land use potentials for each
land parcel. LUMS is actual intended to enforce or achieve the purpose of SDF.
During the year under review, LUMS was implemented and below are key achievements
45 land use application were processed during the f/y under review
Uploading of building plans and valuation roll on the GIS
1100 sites demarcated
KPA 2: MUNICIPAL TRANSFORMATION AND ORGANISATIONAL DEVELOPMENT
The following achievements under this KPA were made:
Six IDP/Budget public sessions held
Quarterly PMS reported generated and presented to Council and IDP Representative Forum
Individual assessment conducted
IDP/Budget adopted in time
Compliance to work place skills plan
A total of 12 policies were reviewed while policies were developed for the year under review. There were also by-laws which were
processed for promulgation during the course of the year. The complete list of policies and by-laws is as follows:
1. Use of community halls
2. Fleet Management
3. Employee Assistance
4. Risk Management
5. Building regulations by-law
6. Informal trading by-law
7. Ant-corruption and fraud policy
8. Asset Management policy
9. Indigent policy
10. Cell phone policy
11. Send-off policy
12. Overtime policy
9
The main challenge remains the compliance to Employment Equity Plan
KPA 3: BASIC SERVICEDELIVERY
Access to electricity
A total of 406 new connections for grid energy were made during the year under review. This translates to 23 857 households
(97.2%) households having access to electricity. The villages that benefited were:
Callais – 76
Hlolke – 95
Sofaya – 95
Makgaung - 140
Free Basic Electricity
Maruleng Local Municipality developed and implemented indigent policy through subsidization of Free Basic Electricity (FBE) as
the only programme wherein the legible residents could be assisted to access electricity service. 3700 indigent households
were identified but only 1700 households were configured by ESKOM. This translates to 45% of indigent households receiving
FBE.
Sanitation Facilities
The construction of sanitation facilities in Maruleng Municipal households is aided by Mopani District Municipality. This initiative
led to the construction of 3210 VIP toilet units. The following villages benefited:
Metz – 200
Bochabelo – 220
Mabins – 114
Sedawa – 173
Willows – 150
Oaks – 80
Turkey 1-4- 250
Molalane – 88
Enable -218
Worcester – 47
Butswana – 180
Finale – 57
Hlohlokwe – 337
Balloon – 217
Moshate – 158
Kanana – 154
10
Callais – 113
Metz – 50
Bismarck – 98
Finale – 93
Sofaya - 236
The initiatives brought the overall number of households that have access to sanitation of RDP standard to 24 589 (100%). The
municipality has met the millennium goal on sanitation three year earlier.
Housing
A total of 600 houses were constructed in different villages by DLGH during the financial year under review. The breakdown on
houses constructed is as follows:
Makgaung - 100
Worcester - 50
The Willows - 50
Madeira - 100
Turkey 1-4 -200
Sedawa - 100
Public Facilities
Three cemeteries were earmarked to be fenced during the year under review namely: The Oaks, Willows and Hlohlokwe
Health Facilities
One clinic in Calais was completed in the financial year. This clinic will benefit the residents of ward
Roads infrastructure
Six/6 roads were planned to be tarred in the year under review. The following roads were completed.
Ga-fanie road (1.7km completing kerbs and drainage)
Madeira road (1.8km)
Metz-Bismarck road – MDM road (phase 1 of 8.2km completed)
Mahlomelong road (1.8km) is still under construction due to underground water and Contractor is busy laying underground pipes.
Consultants were appointed for the following roads:
Turkey 03-04 road (4.5km)
Rakgolokoane road (4.5km)
11
Five/05 low-level bridges were constructed, namely:
Hlohlokwe – 3 x bridges
The Oaks bridge
The Willows bridge
These road infrastructures had greatly improved movement between the villages, as well as providing access to the main road
network.
Refuse removal (waste collection and landfill site)
The municipality provides waste collection services in three urbanized areas: Hoedspruit, Kampersrus and Drakensig for a total of
1229 households as well as businesses around these areas. A licensed landfill site is being constructed in Worcester. No refuse
removal is provided to the 33 villages. These villages rely mostly on backyard dumping and burning. The Municipality has bought
compact truck and appointed a driver. The municipality is planning to roll-out waste collections to all villages
KPA 4: LOCAL ECONOMIC DEVELOPMENT
Functionality of the LED Forum
Four (4) LED Forums were held and the following issues were identified:
SMME development and financing
Role of business forum in the Municipality
Review of LED Strategy
Community beneficiation in Agriculture and tourism
Forging strategic partnerships
Job Creation
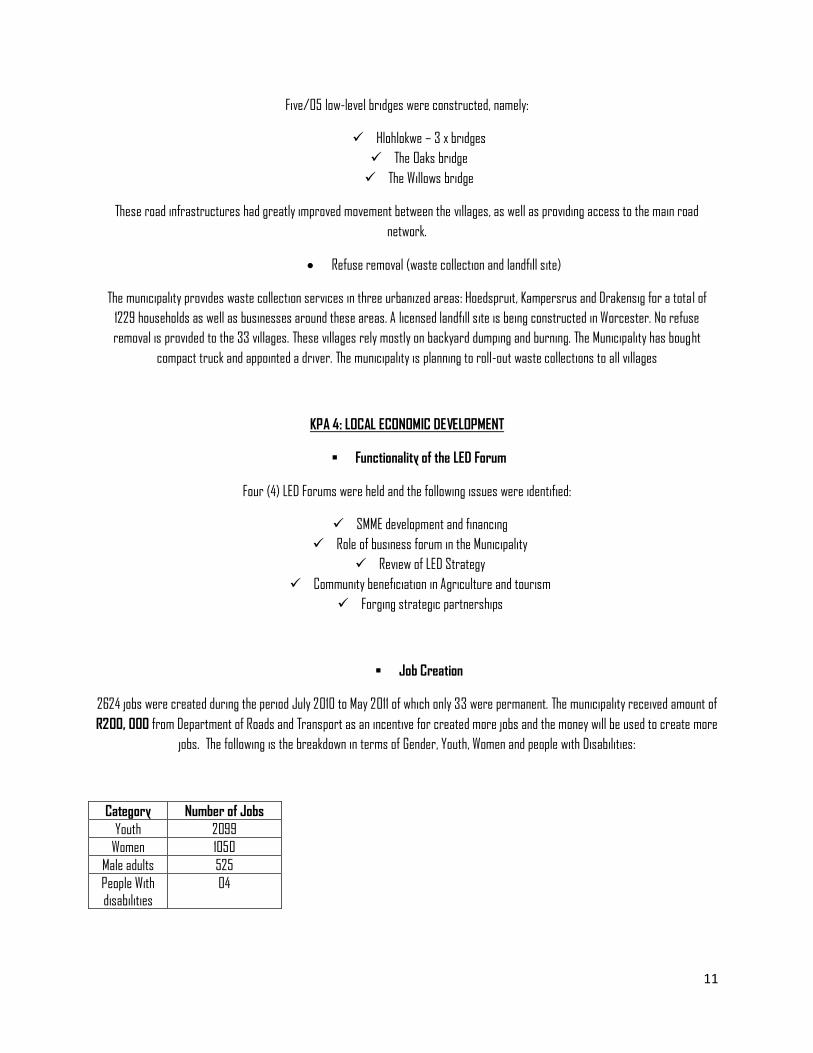
2624 jobs were created during the period July 2010 to May 2011 of which only 33 were permanent. The municipality received amount of
R200, 000 from Department of Roads and Transport as an incentive for created more jobs and the money will be used to create more
jobs. The following is the breakdown in terms of Gender, Youth, Women and people with Disabilities:
Category Number of Jobs
Youth 2099
Women 1050
Male adults 525
People With disabilities
04
12
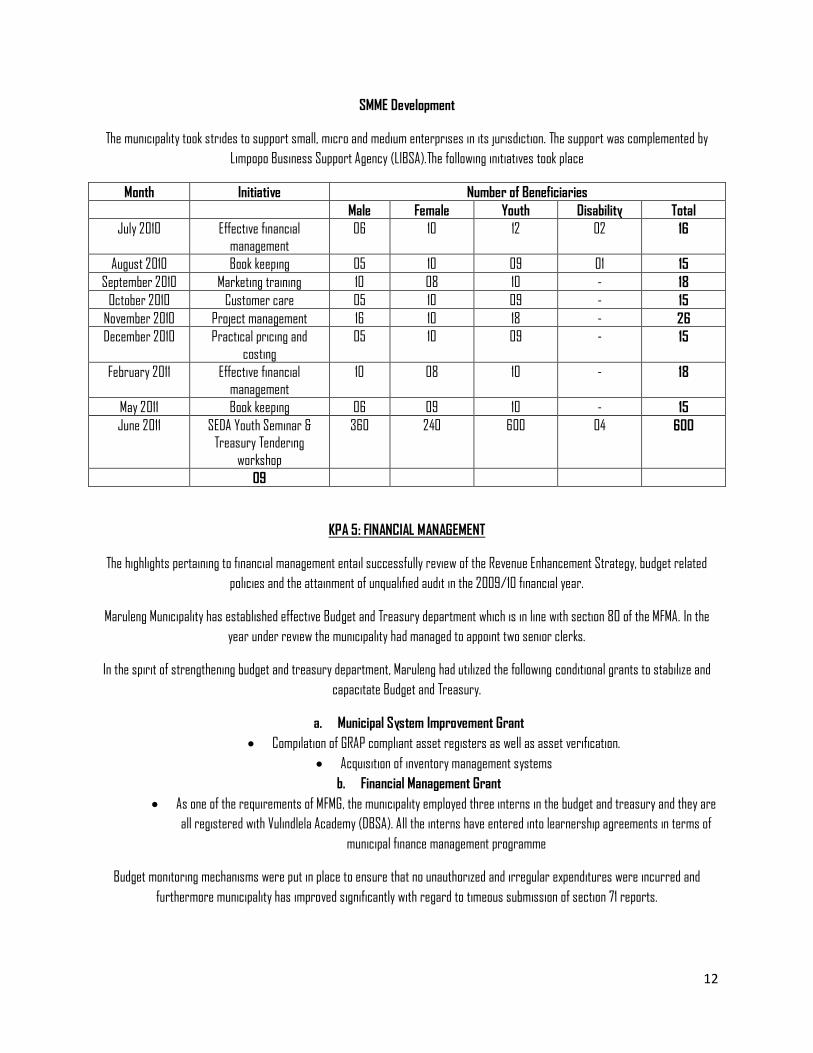
SMME Development
The municipality took strides to support small, micro and medium enterprises in its jurisdiction. The support was complemented by
Limpopo Business Support Agency (LIBSA).The following initiatives took place
Month Initiative Number of Beneficiaries
Male Female Youth Disability Total
July 2010 Effective financial management
06 10 12 02 16
August 2010 Book keeping 05 10 09 01 15
September 2010 Marketing training 10 08 10 - 18
October 2010 Customer care 05 10 09 - 15
November 2010 Project management 16 10 18 - 26
December 2010 Practical pricing and
costing
05 10 09 - 15
February 2011 Effective financial management
10 08 10 - 18
May 2011 Book keeping 06 09 10 - 15
June 2011 SEDA Youth Seminar & Treasury Tendering
workshop
360 240 600 04 600
09
KPA 5: FINANCIAL MANAGEMENT
The highlights pertaining to financial management entail successfully review of the Revenue Enhancement Strategy, budget related
policies and the attainment of unqualified audit in the 2009/10 financial year.
Maruleng Municipality has established effective Budget and Treasury department which is in line with section 80 of the MFMA. In the
year under review the municipality had managed to appoint two senior clerks.
In the spirit of strengthening budget and treasury department, Maruleng had utilized the following conditional grants to stabilize and
capacitate Budget and Treasury.
a. Municipal System Improvement Grant
Compilation of GRAP compliant asset registers as well as asset verification.
Acquisition of inventory management systems
b. Financial Management Grant
As one of the requirements of MFMG, the municipality employed three interns in the budget and treasury and they are
all registered with Vulindlela Academy (DBSA). All the interns have entered into learnership agreements in terms of
municipal finance management programme
Budget monitoring mechanisms were put in place to ensure that no unauthorized and irregular expenditures were incurred and
furthermore municipality has improved significantly with regard to timeous submission of section 71 reports.
13
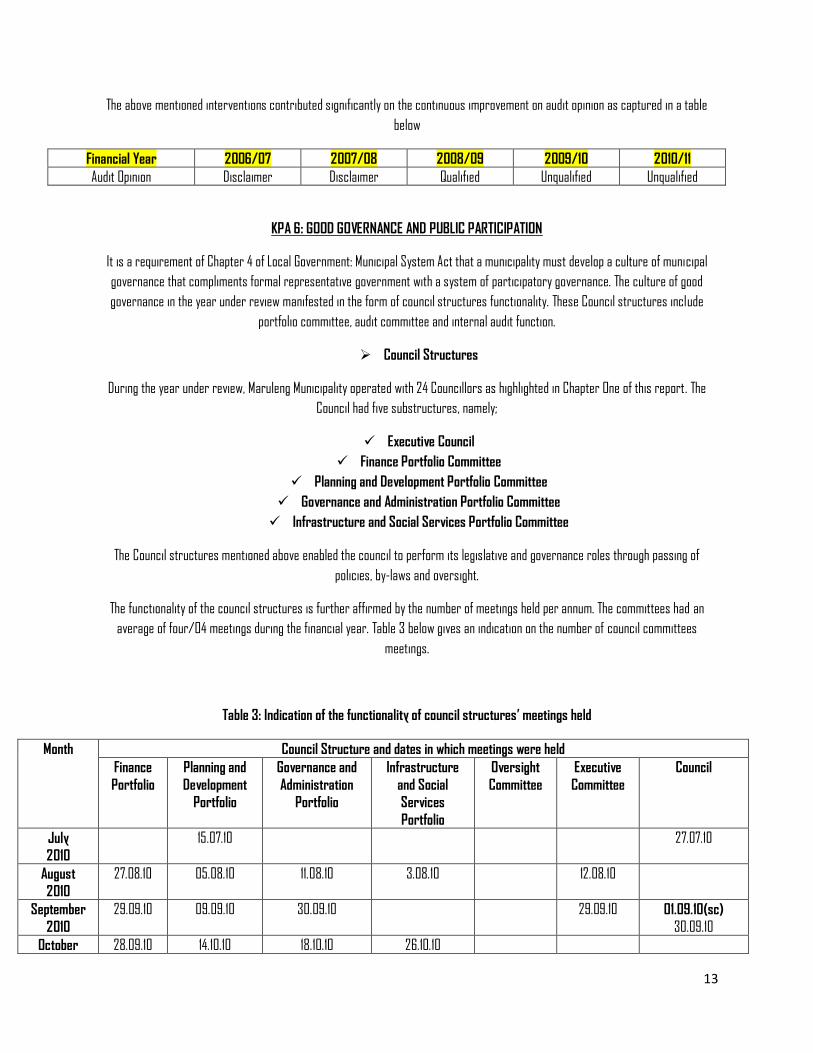
The above mentioned interventions contributed significantly on the continuous improvement on audit opinion as captured in a table
below
Financial Year 2006/07 2007/08 2008/09 2009/10 2010/11
Audit Opinion Disclaimer Disclaimer Qualified Unqualified Unqualified
KPA 6: GOOD GOVERNANCE AND PUBLIC PARTICIPATION
It is a requirement of Chapter 4 of Local Government: Municipal System Act that a municipality must develop a culture of municipal
governance that compliments formal representative government with a system of participatory governance. The culture of good
governance in the year under review manifested in the form of council structures functionality. These Council structures include
portfolio committee, audit committee and internal audit function.
Council Structures
During the year under review, Maruleng Municipality operated with 24 Councillors as highlighted in Chapter One of this report. The
Council had five substructures, namely;
Executive Council
Finance Portfolio Committee
Planning and Development Portfolio Committee
Governance and Administration Portfolio Committee
Infrastructure and Social Services Portfolio Committee
The Council structures mentioned above enabled the council to perform its legislative and governance roles through passing of
policies, by-laws and oversight.
The functionality of the council structures is further affirmed by the number of meetings held per annum. The committees had an
average of four/04 meetings during the financial year. Table 3 below gives an indication on the number of council committees
meetings.
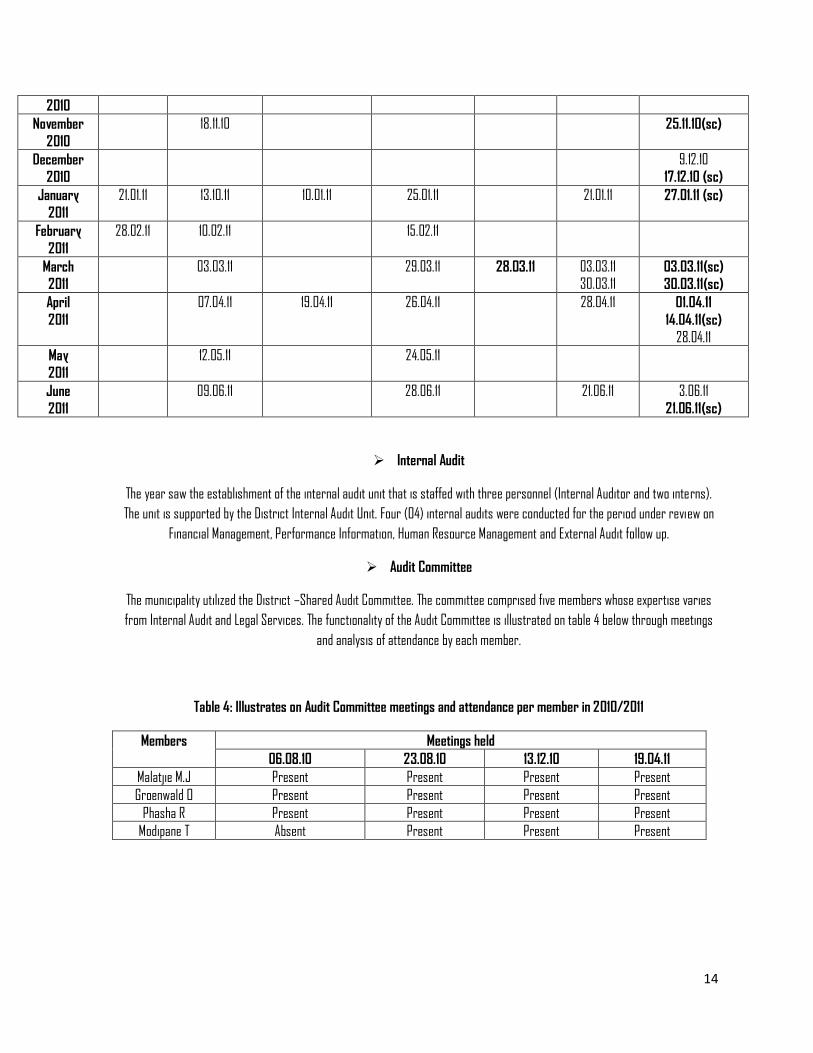
Table 3: Indication of the functionality of council structures’ meetings held
Month Council Structure and dates in which meetings were held
Finance
Portfolio
Planning and
Development
Portfolio
Governance and
Administration
Portfolio
Infrastructure
and Social
Services
Portfolio
Oversight
Committee
Executive
Committee
Council
July
2010
15.07.10 27.07.10
August
2010
27.08.10 05.08.10 11.08.10 3.08.10 12.08.10
September
2010
29.09.10 09.09.10 30.09.10 29.09.10 01.09.10(sc)
30.09.10
0ctober 28.09.10 14.10.10 18.10.10 26.10.10
14
2010
November
2010
18.11.10 25.11.10(sc)
December
2010
9.12.10
17.12.10 (sc)
January
2011
21.01.11 13.10.11 10.01.11 25.01.11 21.01.11 27.01.11 (sc)
February
2011
28.02.11 10.02.11 15.02.11
March
2011
03.03.11 29.03.11 28.03.11 03.03.11 30.03.11
03.03.11(sc)
30.03.11(sc)
April
2011
07.04.11 19.04.11 26.04.11 28.04.11 01.04.11
14.04.11(sc)
28.04.11
May
2011
12.05.11 24.05.11
June
2011
09.06.11 28.06.11 21.06.11 3.06.11
21.06.11(sc)
Internal Audit
The year saw the establishment of the internal audit unit that is staffed with three personnel (Internal Auditor and two interns).
The unit is supported by the District Internal Audit Unit. Four (04) internal audits were conducted for the period under review on
Financial Management, Performance Information, Human Resource Management and External Audit follow up.
Audit Committee
The municipality utilized the District –Shared Audit Committee. The committee comprised five members whose expertise varies
from Internal Audit and Legal Services. The functionality of the Audit Committee is illustrated on table 4 below through meetings
and analysis of attendance by each member.
Table 4: Illustrates on Audit Committee meetings and attendance per member in 2010/2011
Members Meetings held
06.08.10 23.08.10 13.12.10 19.04.11
Malatjie M.J Present Present Present Present
Groenwald O Present Present Present Present
Phasha R Present Present Present Present
Modipane T Absent Present Present Present
15
Public Participation Process
The municipality continued to deepen democracy amongst its residents by constantly consulting them on municipal programmes.
The consultation processes took the form of IDP/Budget sessions, Mayoral Public Participation Programme and IDP
Representative Forum sessions. The sessions were held as follows:
6 IDP/BUDGET sessions
IDP Representative Forum
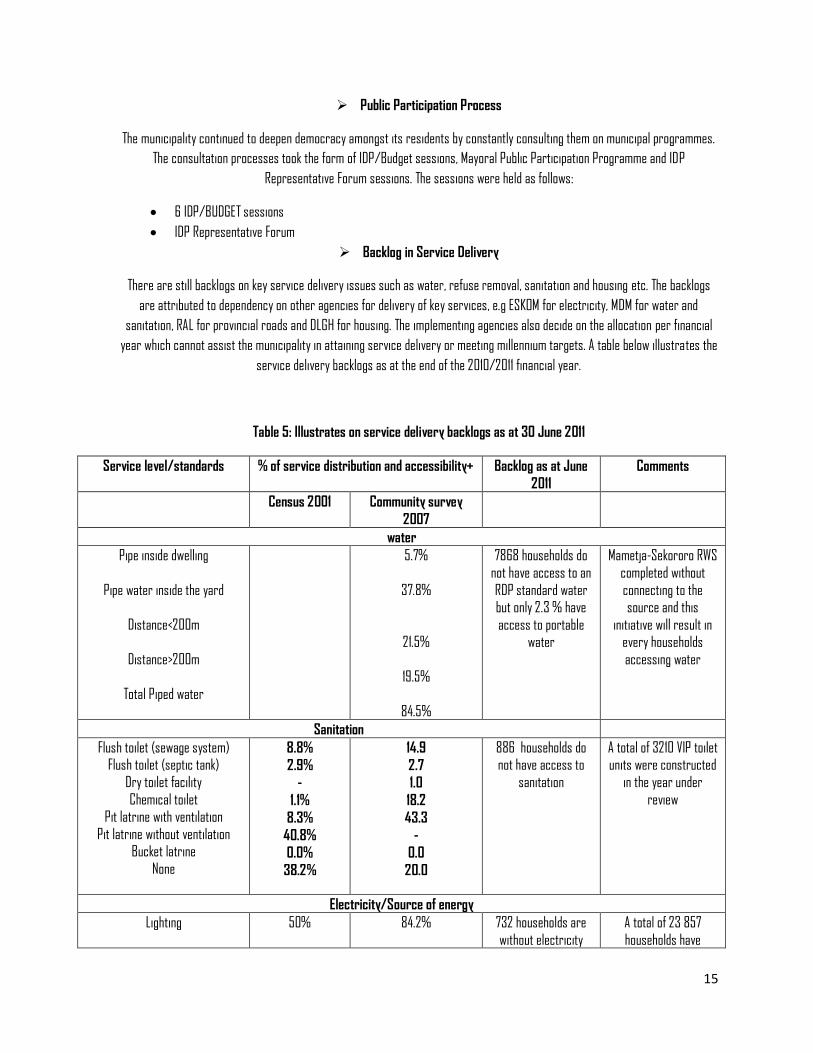
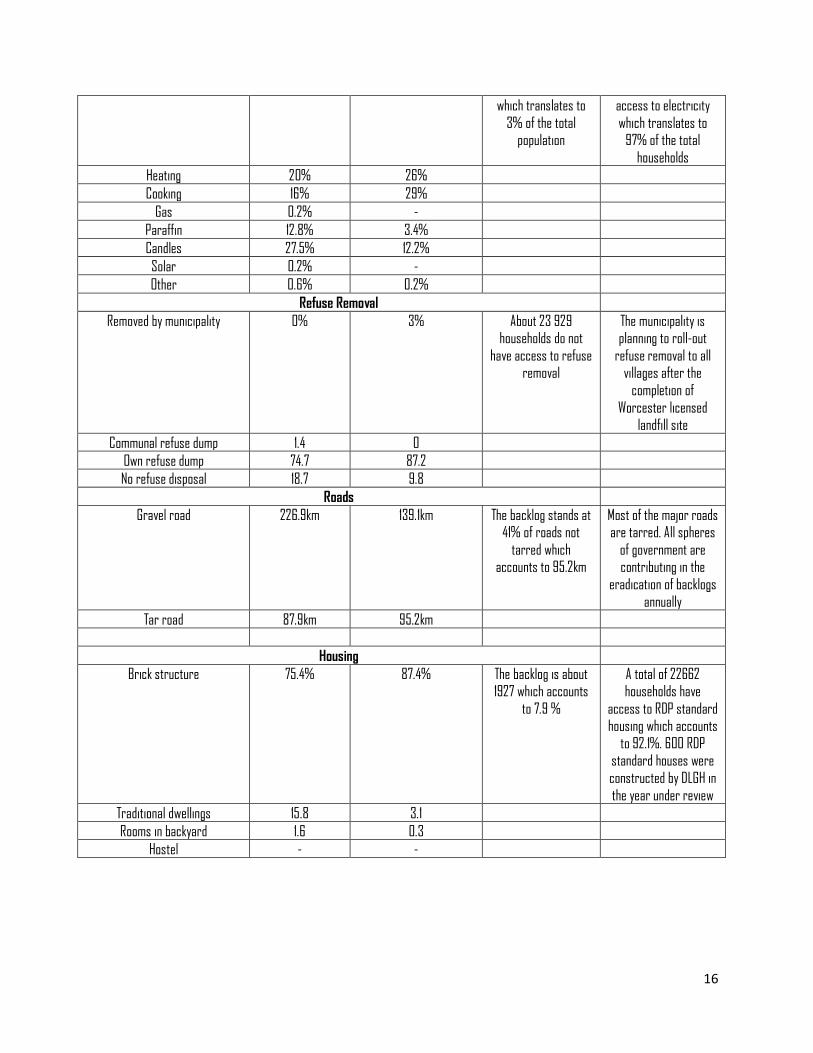
Backlog in Service Delivery
There are still backlogs on key service delivery issues such as water, refuse removal, sanitation and housing etc. The backlogs
are attributed to dependency on other agencies for delivery of key services, e.g ESKOM for electricity, MDM for water and
sanitation, RAL for provincial roads and DLGH for housing. The implementing agencies also decide on the allocation per financial
year which cannot assist the municipality in attaining service delivery or meeting millennium targets. A table below illustrates the
service delivery backlogs as at the end of the 2010/2011 financial year.
Table 5: Illustrates on service delivery backlogs as at 30 June 2011
Service level/standards % of service distribution and accessibility+ Backlog as at June
2011
Comments
Census 2001 Community survey
2007
water
Pipe inside dwelling
Pipe water inside the yard
Distance<200m
Distance>200m
Total Piped water
5.7%
37.8%
21.5%
19.5%
84.5%
7868 households do
not have access to an
RDP standard water but only 2.3 % have
access to portable water
Mametja-Sekororo RWS
completed without
connecting to the source and this
initiative will result in every households
accessing water
Sanitation
Flush toilet (sewage system) Flush toilet (septic tank)
Dry toilet facility
Chemical toilet Pit latrine with ventilation
Pit latrine without ventilation Bucket latrine
None
8.8%
2.9%
-
1.1%
8.3%
40.8%
0.0%
38.2%
14.9
2.7
1.0
18.2
43.3
-
0.0
20.0
886 households do not have access to
sanitation
A total of 3210 VIP toilet units were constructed
in the year under
review
Electricity/Source of energy
Lighting 50% 84.2% 732 households are
without electricity
A total of 23 857
households have
16
which translates to
3% of the total population
access to electricity
which translates to 97% of the total
households
Heating 20% 26%
Cooking 16% 29%
Gas 0.2% -
Paraffin 12.8% 3.4%
Candles 27.5% 12.2%
Solar 0.2% -
Other 0.6% 0.2%
Refuse Removal
Removed by municipality 0% 3% About 23 929 households do not
have access to refuse removal
The municipality is planning to roll-out
refuse removal to all villages after the
completion of
Worcester licensed landfill site
Communal refuse dump 1.4 0
Own refuse dump 74.7 87.2
No refuse disposal 18.7 9.8
Roads
Gravel road
226.9km 139.1km The backlog stands at 41% of roads not
tarred which accounts to 95.2km
Most of the major roads are tarred. All spheres
of government are contributing in the
eradication of backlogs
annually
Tar road 87.9km 95.2km
Housing
Brick structure 75.4% 87.4% The backlog is about 1927 which accounts
to 7.9 %
A total of 22662 households have
access to RDP standard housing which accounts
to 92.1%. 600 RDP standard houses were
constructed by DLGH in
the year under review
Traditional dwellings 15.8 3.1
Rooms in backyard 1.6 0.3
Hostel - -
17
CHAPTER THREE
HUMAN RESOURCE AND OTHER ORGANISATIONAL MANAGEMENT MATTERS
Human resources management refers to activities, policies, beliefs and the general functional that relates to employees. Therefore
human resource is an essential component for the functioning and performance of any institution.
In this chapter, details on human resource of Maruleng Local Municipality will be outlined, beginning with the implementation of
organogram to the development of the resources (human) as well as disclosures on the remuneration of the executive, i.e., Section 57
managers and Councillors.
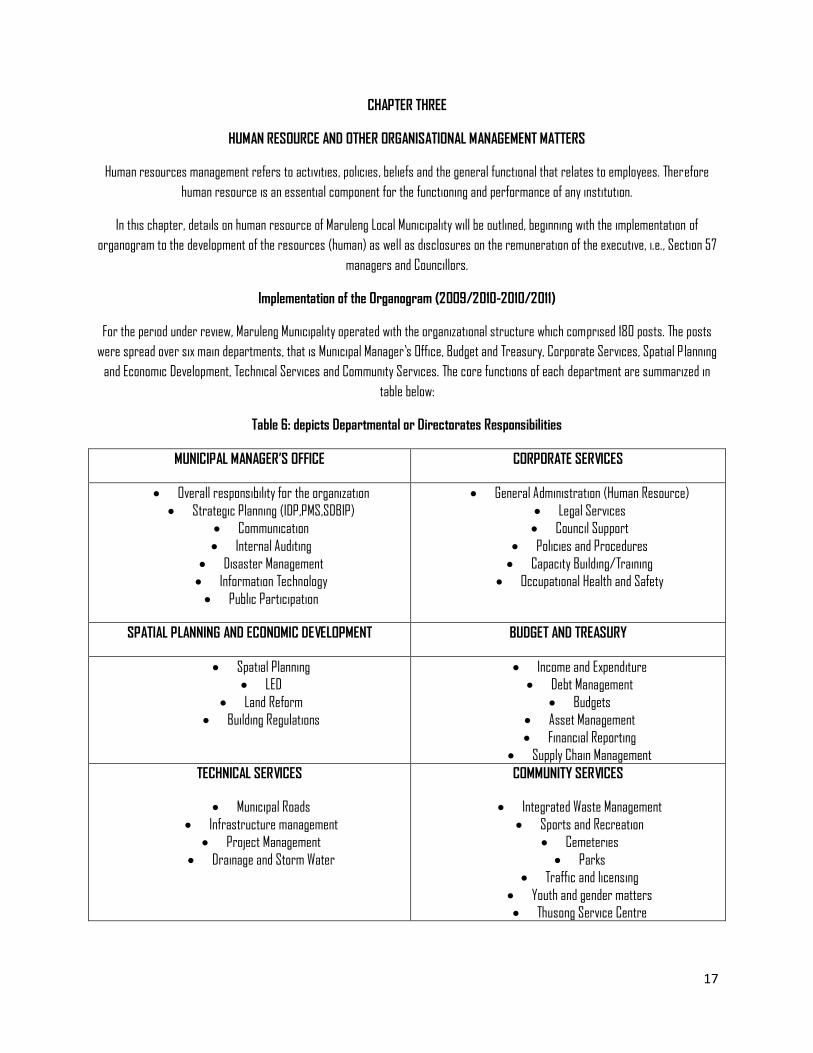
Implementation of the Organogram (2009/2010-2010/2011)
For the period under review, Maruleng Municipality operated with the organizational structure which comprised 180 posts. The posts
were spread over six main departments, that is Municipal Manager’s Office, Budget and Treasury, Corporate Services, Spatial P lanning
and Economic Development, Technical Services and Community Services. The core functions of each department are summarized in
table below:
Table 6: depicts Departmental or Directorates Responsibilities
MUNICIPAL MANAGER’S OFFICE CORPORATE SERVICES
Overall responsibility for the organization
Strategic Planning (IDP,PMS,SDBIP)
Communication
Internal Auditing
Disaster Management
Information Technology
Public Participation
General Administration (Human Resource)
Legal Services
Council Support
Policies and Procedures
Capacity Building/Training
Occupational Health and Safety
SPATIAL PLANNING AND ECONOMIC DEVELOPMENT BUDGET AND TREASURY
Spatial Planning
LED
Land Reform
Building Regulations
Income and Expenditure
Debt Management
Budgets
Asset Management
Financial Reporting
Supply Chain Management
TECHNICAL SERVICES
Municipal Roads
Infrastructure management
Project Management
Drainage and Storm Water
COMMUNITY SERVICES
Integrated Waste Management
Sports and Recreation
Cemeteries
Parks
Traffic and licensing
Youth and gender matters
Thusong Service Centre
18
136 positions are filled which amount to 75.8% will the vacant positions are 44 (24.2%). The filling of vacancies included direct
recruitment and placement. There was also intake of 6 interns. The municipality had one resignation during the period under review.
The post affected was the Secretary of SPED. However, this vacancy was filled sooner.
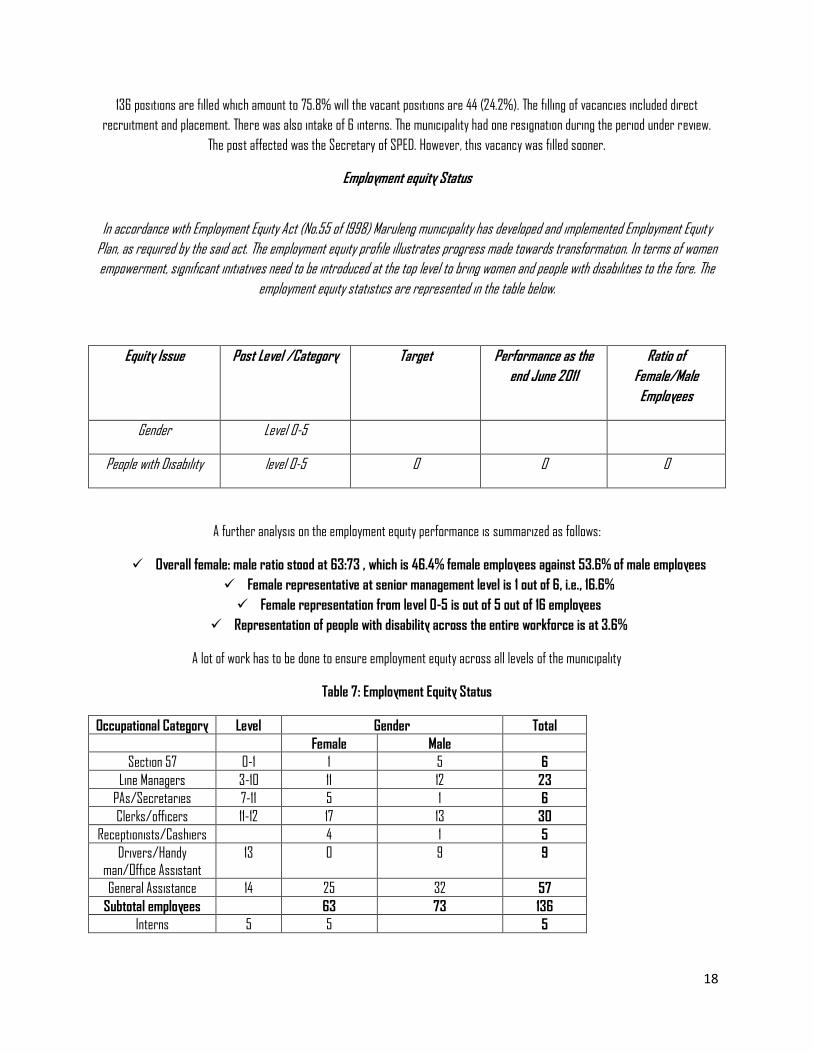
Employment equity Status
In accordance with Employment Equity Act (No.55 of 1998) Maruleng municipality has developed and implemented Employment Equity
Plan, as required by the said act. The employment equity profile illustrates progress made towards transformation. In terms of women
empowerment, significant initiatives need to be introduced at the top level to bring women and people with disabilities to the fore. The
employment equity statistics are represented in the table below.
Equity Issue Post Level /Category Target Performance as the
end June 2011
Ratio of
Female/Male
Employees
Gender Level 0-5
People with Disability level 0-5 0 0 0
A further analysis on the employment equity performance is summarized as follows:
Overall female: male ratio stood at 63:73 , which is 46.4% female employees against 53.6% of male employees
Female representative at senior management level is 1 out of 6, i.e., 16.6%
Female representation from level 0-5 is out of 5 out of 16 employees
Representation of people with disability across the entire workforce is at 3.6%
A lot of work has to be done to ensure employment equity across all levels of the municipality
Table 7: Employment Equity Status
Occupational Category Level Gender Total
Female Male
Section 57 0-1 1 5 6
Line Managers 3-10 11 12 23
PAs/Secretaries 7-11 5 1 6
Clerks/officers 11-12 17 13 30
Receptionists/Cashiers 4 1 5
Drivers/Handy
man/Office Assistant
13 0 9 9
General Assistance 14 25 32 57
Subtotal employees 63 73 136
Interns 5 5 5

19
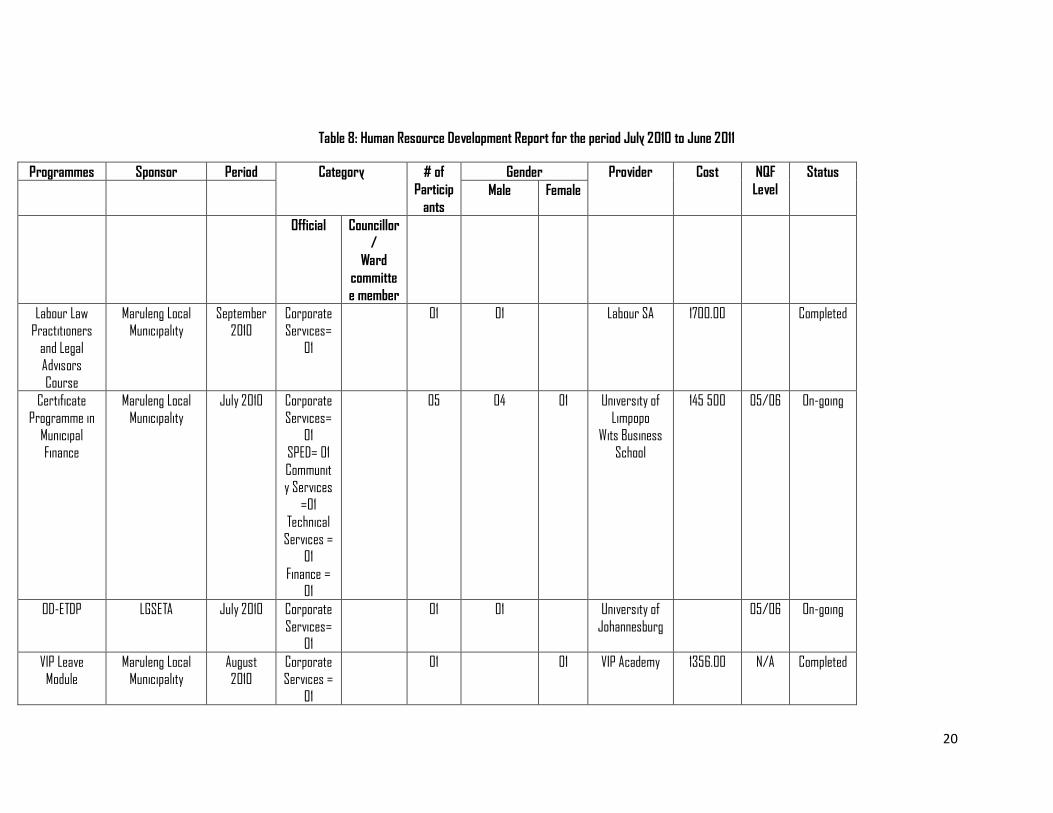
Human Resource Development
A great effort was made in developing human resources in the municipality. The human resource development programme was in line
with the Workplace Skills Plan that is developed and implemented annually. The plan is also developed and implemented in compliance
with the Skills Development Act.
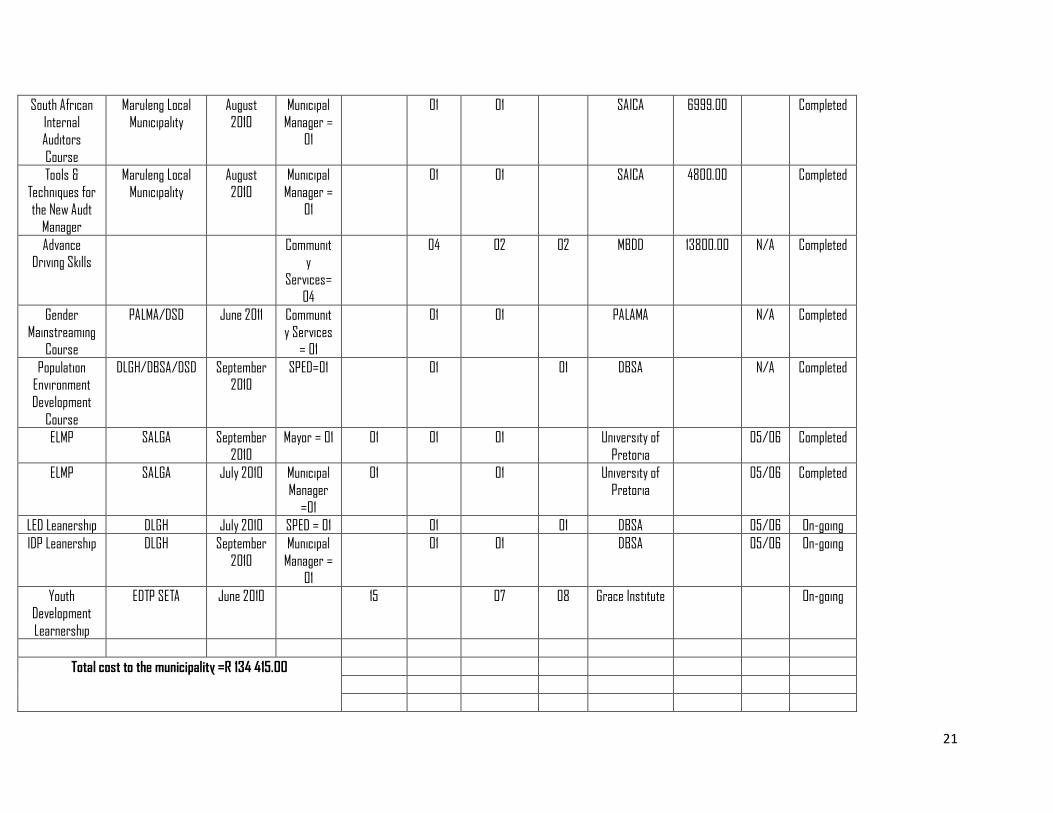
For the period under review, a total of R was paid to cover training costs. These trainings also catered for Councillors and ward
committees’ needs. Table 8 below gives a detailed account of trainings initiated.
20
Table 8: Human Resource Development Report for the period July 2010 to June 2011
Programmes Sponsor Period Category # of
Particip
ants
Gender Provider Cost NQF
Level
Status
Male Female
Official Councillor
/
Ward
committe
e member
Labour Law Practitioners
and Legal Advisors
Course
Maruleng Local Municipality
September 2010
Corporate Services=
01
01 01 Labour SA 1700.00 Completed
Certificate
Programme in
Municipal Finance
Maruleng Local
Municipality
July 2010 Corporate
Services=
01 SPED= 01
Community Services
=01 Technical
Services = 01
Finance = 01
05 04 01 University of
Limpopo
Wits Business School
145 500 05/06 On-going
OD-ETDP LGSETA July 2010 Corporate
Services=01
01 01 University of
Johannesburg
05/06 On-going
VIP Leave Module
Maruleng Local Municipality
August 2010
Corporate Services =
01
01 01 VIP Academy 1356.00 N/A Completed
21
South African
Internal Auditors
Course
Maruleng Local
Municipality
August
2010
Municipal
Manager = 01
01 01 SAICA 6999.00 Completed
Tools &
Techniques for
the New Audt Manager
Maruleng Local
Municipality
August
2010
Municipal
Manager =
01
01 01 SAICA 4800.00 Completed
Advance Driving Skills
Community
Services=04
04 02 02 MBDD 13800.00 N/A Completed
Gender
Mainstreaming Course
PALMA/DSD June 2011 Communit
y Services = 01
01 01 PALAMA N/A Completed
Population Environment
Development
Course
DLGH/DBSA/DSD September 2010
SPED=01 01 01 DBSA N/A Completed
ELMP SALGA September
2010
Mayor = 01 01 01 01 University of
Pretoria
05/06 Completed
ELMP SALGA July 2010 Municipal Manager
=01
01 01 University of Pretoria
05/06 Completed
LED Leanership DLGH July 2010 SPED = 01 01 01 DBSA 05/06 On-going
IDP Leanership DLGH September
2010
Municipal
Manager = 01
01 01 DBSA 05/06 On-going
Youth Development
Learnership
EDTP SETA June 2010 15 07 08 Grace Institute On-going
Total cost to the municipality =R 134 415.00
22
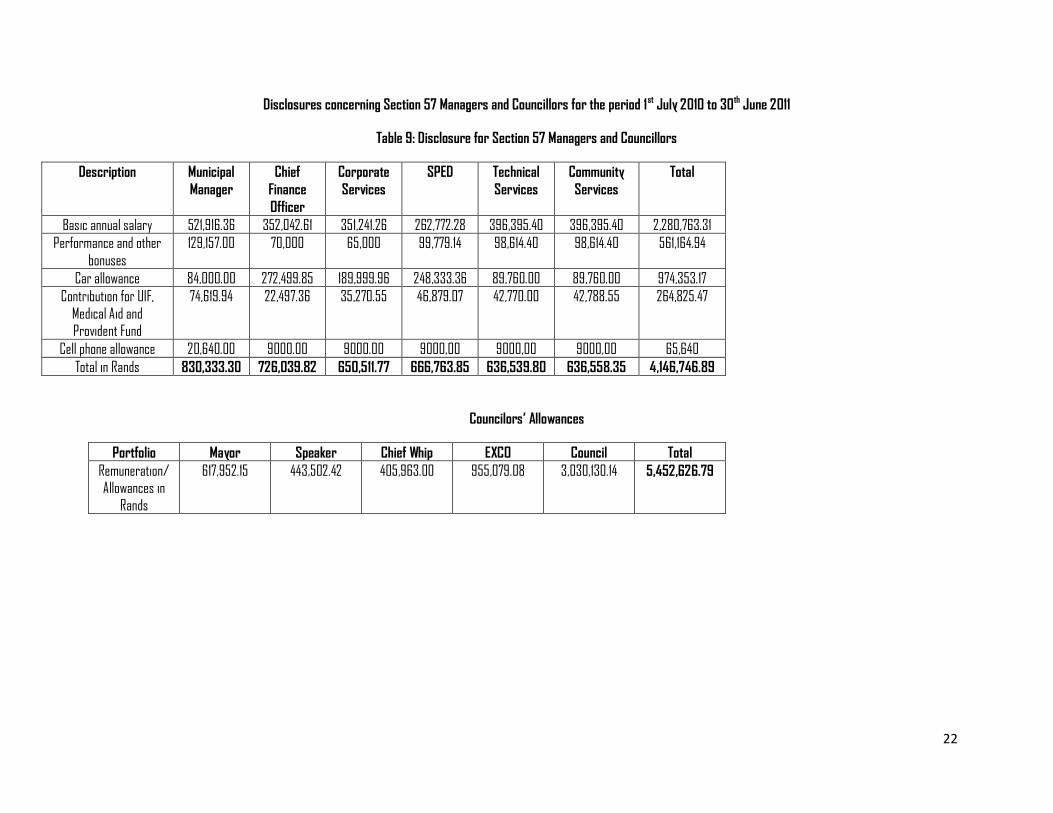
Disclosures concerning Section 57 Managers and Councillors for the period 1st July 2010 to 30th June 2011
Table 9: Disclosure for Section 57 Managers and Councillors
Description Municipal
Manager
Chief
Finance
Officer
Corporate
Services
SPED Technical
Services
Community
Services
Total
Basic annual salary 521,916.36 352,042.61 351,241.26 262,772.28 396,395.40 396,395.40 2,280,763.31
Performance and other
bonuses
129,157.00 70,000 65,000 99,779.14 98,614.40 98,614.40 561,164.94
Car allowance 84,000.00 272,499.85 189,999.96 248,333.36 89,760.00 89,760.00 974,353.17
Contribution for UIF,
Medical Aid and Provident Fund
74,619.94 22,497.36 35,270.55 46,879.07 42,770.00 42,788.55 264,825.47
Cell phone allowance 20,640.00 9000.00 9000.00 9000,00 9000,00 9000,00 65,640
Total in Rands 830,333.30 726,039.82 650,511.77 666,763.85 636,539.80 636,558.35 4,146,746.89
Councilors’ Allowances
Portfolio Mayor Speaker Chief Whip EXCO Council Total
Remuneration/ Allowances in
Rands
617,952.15 443,502.42 405,963.00 955,079.08 3,030,130.14 5,452,626.79
23
CHAPTER FOUR
AUDITED FINANCIAL STATEMENT AND RELATED FINANCIAL INFORMATION
This Chapter presents a financial status of the municipality as on the 30th June 2011. The financial status is depicted in the form of the revenue that was appropriated in terms of the
Division of Revenue Act, i.e. grants received and expenditure trends on grants. A summary on the financial statements also form part of the chapter.
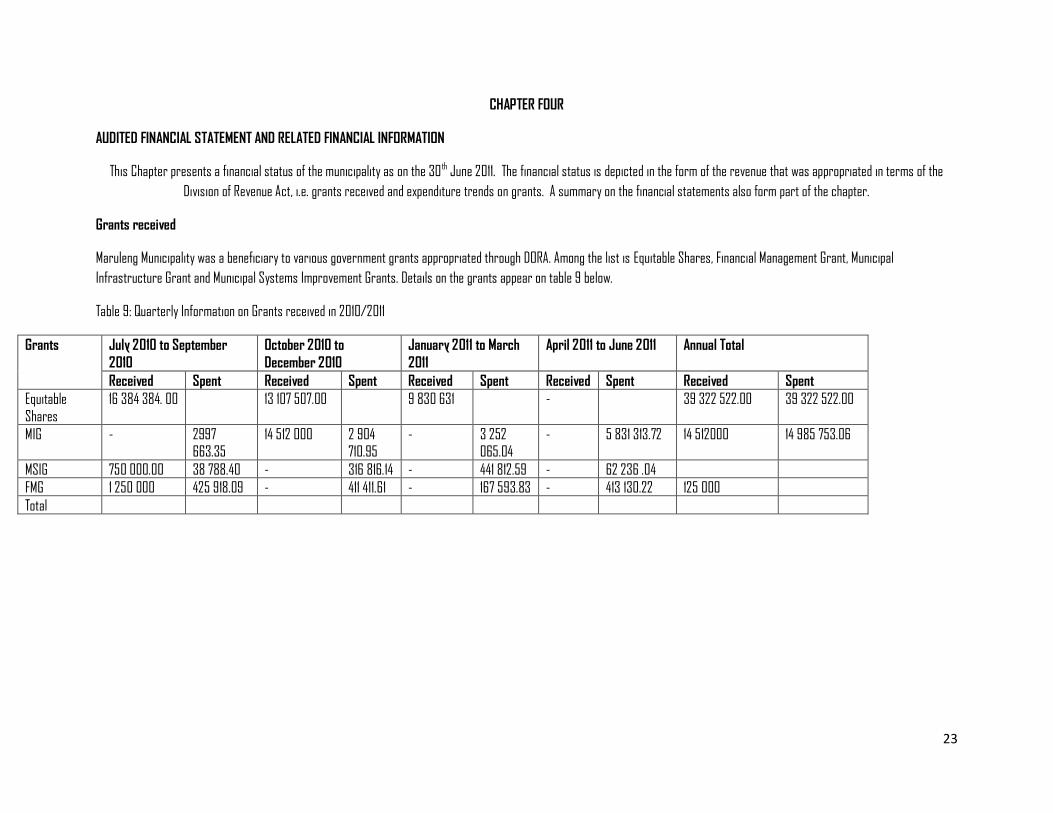
Grants received
Maruleng Municipality was a beneficiary to various government grants appropriated through DORA. Among the list is Equitable Shares, Financial Management Grant, Municipal
Infrastructure Grant and Municipal Systems Improvement Grants. Details on the grants appear on table 9 below.
Table 9: Quarterly Information on Grants received in 2010/2011
Grants July 2010 to September
2010
October 2010 to
December 2010
January 2011 to March
2011
April 2011 to June 2011 Annual Total
Received Spent Received Spent Received Spent Received Spent Received Spent
Equitable
Shares
16 384 384. 00 13 107 507.00 9 830 631 - 39 322 522.00 39 322 522.00
MIG - 2997 663.35
14 512 000 2 904 710.95
- 3 252 065.04
- 5 831 313.72 14 512000 14 985 753.06
MSIG 750 000.00 38 788.40 - 316 816.14 - 441 812.59 - 62 236 .04
FMG 1 250 000 425 918.09 - 411 411.61 - 167 593.83 - 413 130.22 125 000
Total
24
Summary of 2010/ 2011 Annual Financial Statements
The Statement of Financial Position of the municipality depicts the total revenue of the municipality for the financial year R 76 843 653.00 the expenditure was depicted as at R60 744
408.00, leaving the surplus of R16 099 245. The spending was spread across 6 departments of the municipality, Municipal Manager’s Office, Budget and Treasury, Corporate Services,
Technical Services, Community Services and Spatial Planning and Economic Development. Expenditure for the period under review is further classified into the employee related expenses,
general expenses and the capital expenditure. Employee related costs increased from R 21 044 581.00 in 2009/10 to R26 382 344. in 2010/11 and this covered salaries and
wages, Councillors’ remuneration of R5 683 264.00, General expenses of R 23 174 772, Depreciation of R4 609 005, Finance costs of R 34729 and maintenance and repairs
of R860 294
As reflected in section1.3, of this report the total assets for the municipality are valued at R129 998 983. This value is 17.8% 8 (R110 793 358) more than the 2009/10 assets value.
The liabilities value for the period 2009/10 had a monetary value of R12 636 765 while at the end of the 2010/11 financial year, the liabilities stood at R16 033 278. The liabilities value
decreased by R3, 396513.00 is 78 % decrease.
The cash book balance in the Account was R8 780 478 at the beginning of the financial year and R8 568 727 at end of the year, i.e., on the 30th June 2011. Cash on hand was R
710 Only. The municipality has a call deposit of R 14 166 776
Detailed Financial statement of the municipality is attached as Annexure B.
25
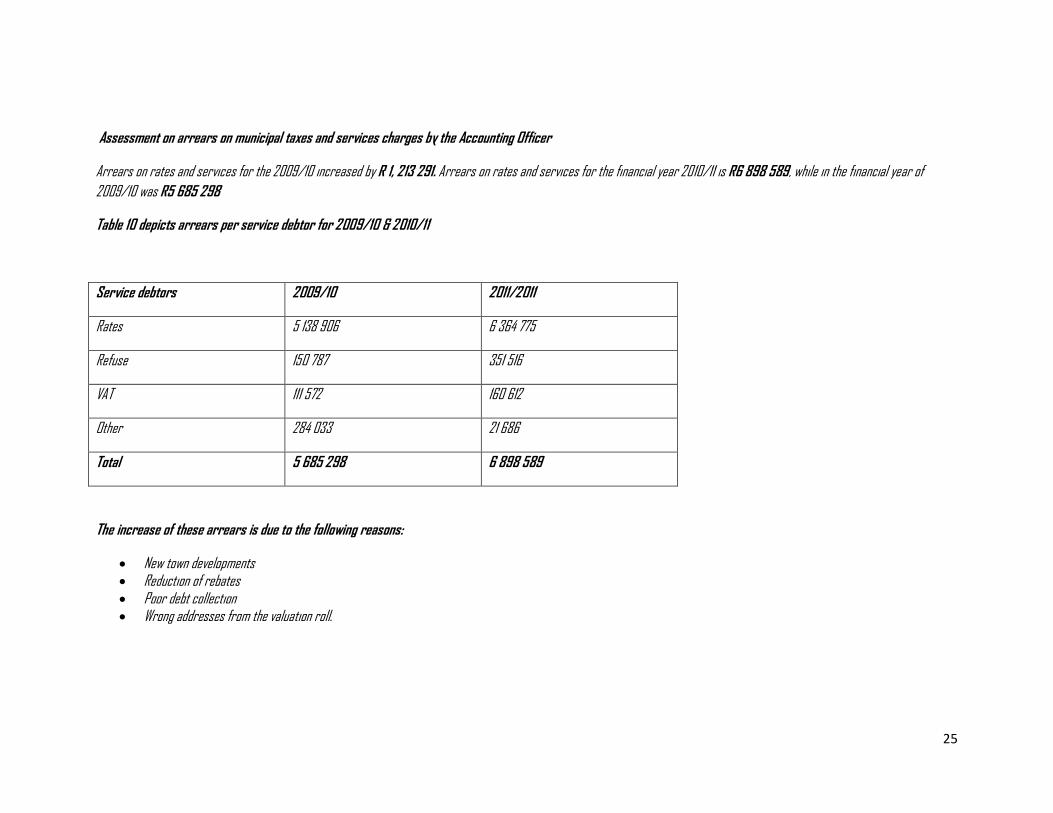
Assessment on arrears on municipal taxes and services charges by the Accounting Officer
Arrears on rates and services for the 2009/10 increased by R 1, 213 291. Arrears on rates and services for the financial year 2010/11 is R6 898 589, while in the financial year of
2009/10 was R5 685 298
Table 10 depicts arrears per service debtor for 2009/10 & 2010/11
Service debtors 2009/10 2011/2011
Rates 5 138 906 6 364 775
Refuse 150 787 351 516
VAT 111 572 160 612
Other 284 033 21 686
Total 5 685 298 6 898 589
The increase of these arrears is due to the following reasons:
New town developments Reduction of rebates Poor debt collection Wrong addresses from the valuation roll.
26
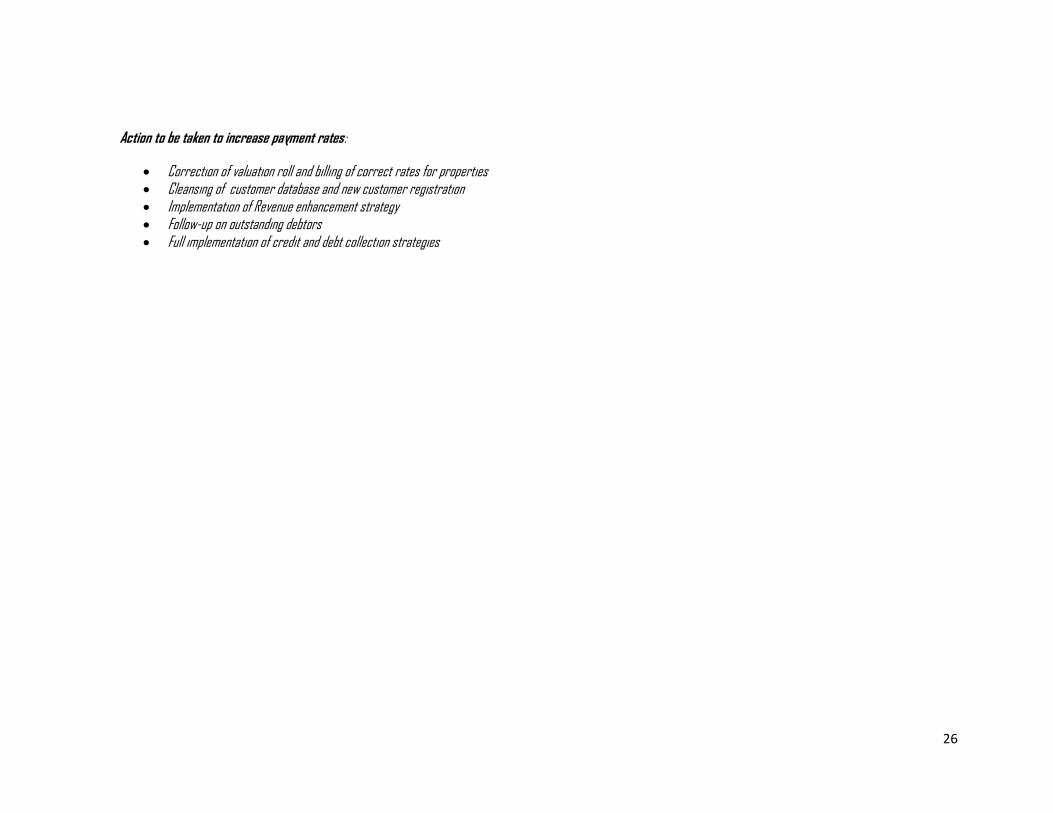
Action to be taken to increase payment rates:
Correction of valuation roll and billing of correct rates for properties Cleansing of customer database and new customer registration Implementation of Revenue enhancement strategy Follow-up on outstanding debtors Full implementation of credit and debt collection strategies
27
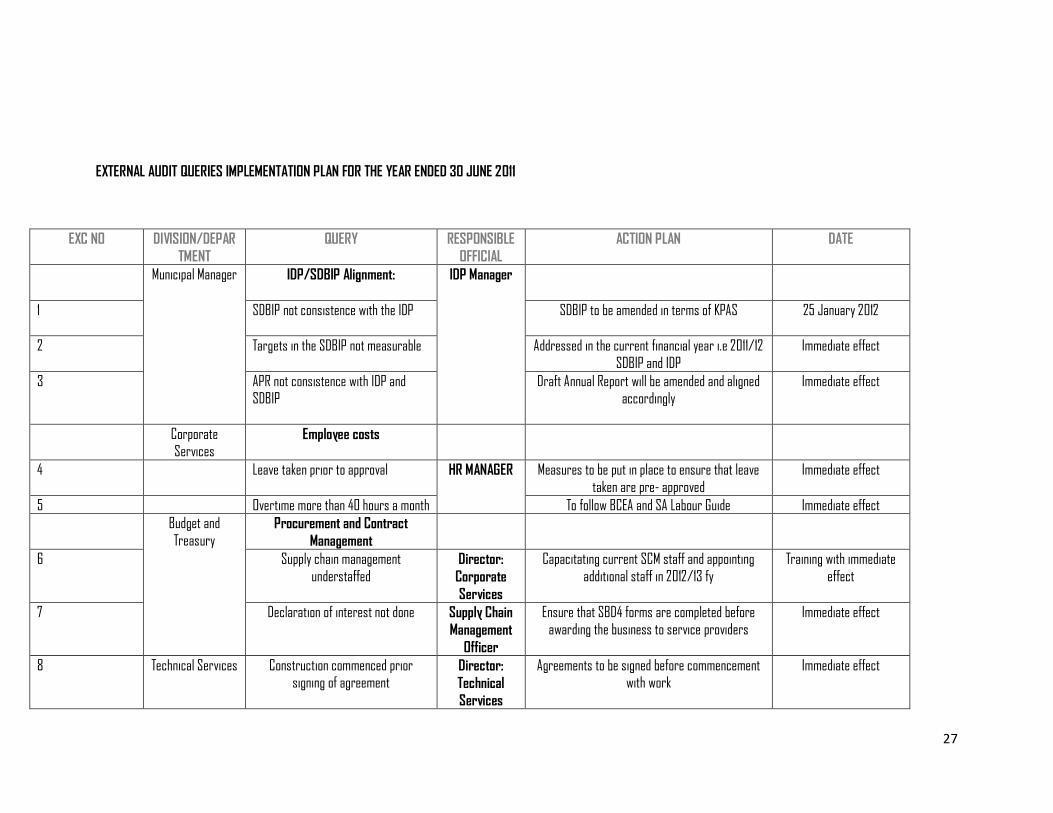
EXTERNAL AUDIT QUERIES IMPLEMENTATION PLAN FOR THE YEAR ENDED 30 JUNE 2011
EXC NO DIVISION/DEPAR
TMENT
QUERY RESPONSIBLE
OFFICIAL
ACTION PLAN DATE
Municipal Manager IDP/SDBIP Alignment:
IDP Manager
1 SDBIP not consistence with the IDP
SDBIP to be amended in terms of KPAS 25 January 2012
2 Targets in the SDBIP not measurable
Addressed in the current financial year i.e 2011/12
SDBIP and IDP
Immediate effect
3 APR not consistence with IDP and SDBIP
Draft Annual Report will be amended and aligned accordingly
Immediate effect
Corporate Services
Employee costs
4 Leave taken prior to approval
HR MANAGER Measures to be put in place to ensure that leave
taken are pre- approved
Immediate effect
5 Overtime more than 40 hours a month To follow BCEA and SA Labour Guide Immediate effect
Budget and
Treasury Procurement and Contract
Management
6 Supply chain management
understaffed Director:
Corporate
Services
Capacitating current SCM staff and appointing
additional staff in 2012/13 fy
Training with immediate
effect
7 Declaration of interest not done Supply Chain
Management
Officer
Ensure that SBD4 forms are completed before awarding the business to service providers
Immediate effect
8 Technical Services Construction commenced prior signing of agreement
Director:
Technical
Services
Agreements to be signed before commencement with work
Immediate effect
28
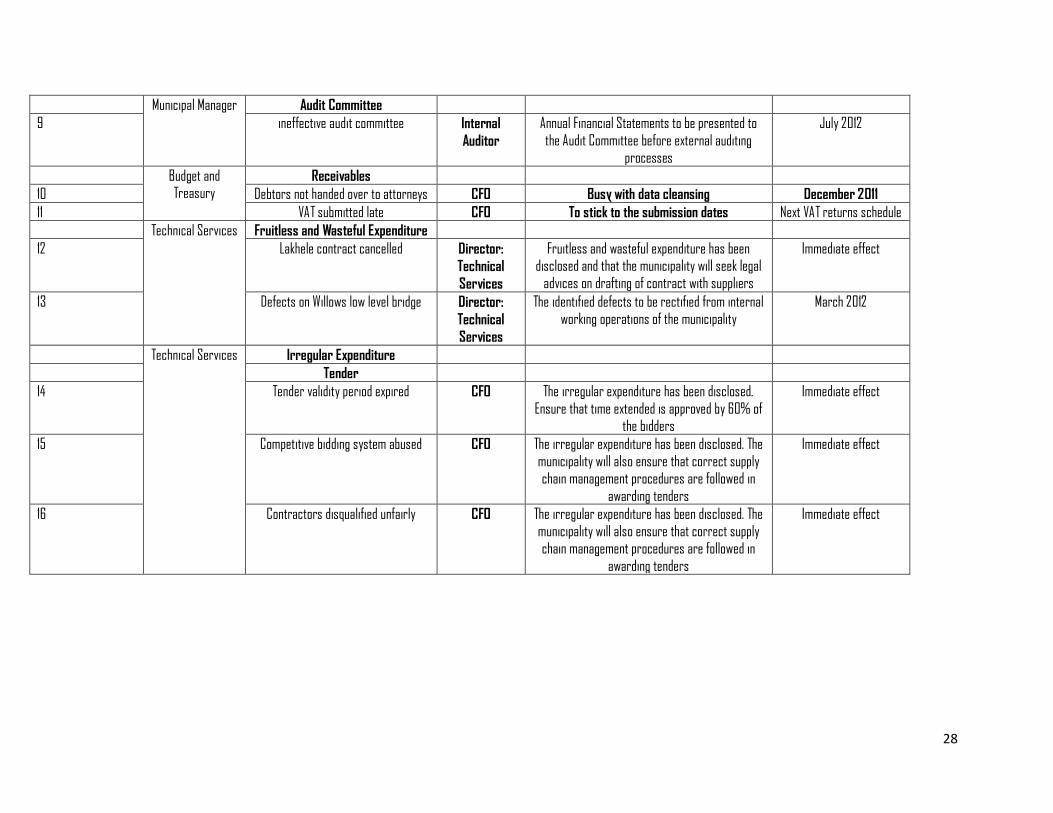
Municipal Manager Audit Committee
9 ineffective audit committee Internal
Auditor
Annual Financial Statements to be presented to
the Audit Committee before external auditing processes
July 2012
Budget and Treasury
Receivables
10 Debtors not handed over to attorneys CFO Busy with data cleansing December 2011
11 VAT submitted late CFO To stick to the submission dates Next VAT returns schedule
Technical Services Fruitless and Wasteful Expenditure
12 Lakhele contract cancelled Director:
Technical
Services
Fruitless and wasteful expenditure has been disclosed and that the municipality will seek legal
advices on drafting of contract with suppliers
Immediate effect
13 Defects on Willows low level bridge Director:
Technical
Services
The identified defects to be rectified from internal working operations of the municipality
March 2012
Technical Services Irregular Expenditure
Tender
14 Tender validity period expired CFO The irregular expenditure has been disclosed.
Ensure that time extended is approved by 60% of the bidders
Immediate effect
15 Competitive bidding system abused CFO The irregular expenditure has been disclosed. The
municipality will also ensure that correct supply chain management procedures are followed in
awarding tenders
Immediate effect
16 Contractors disqualified unfairly CFO The irregular expenditure has been disclosed. The
municipality will also ensure that correct supply chain management procedures are followed in
awarding tenders
Immediate effect
29
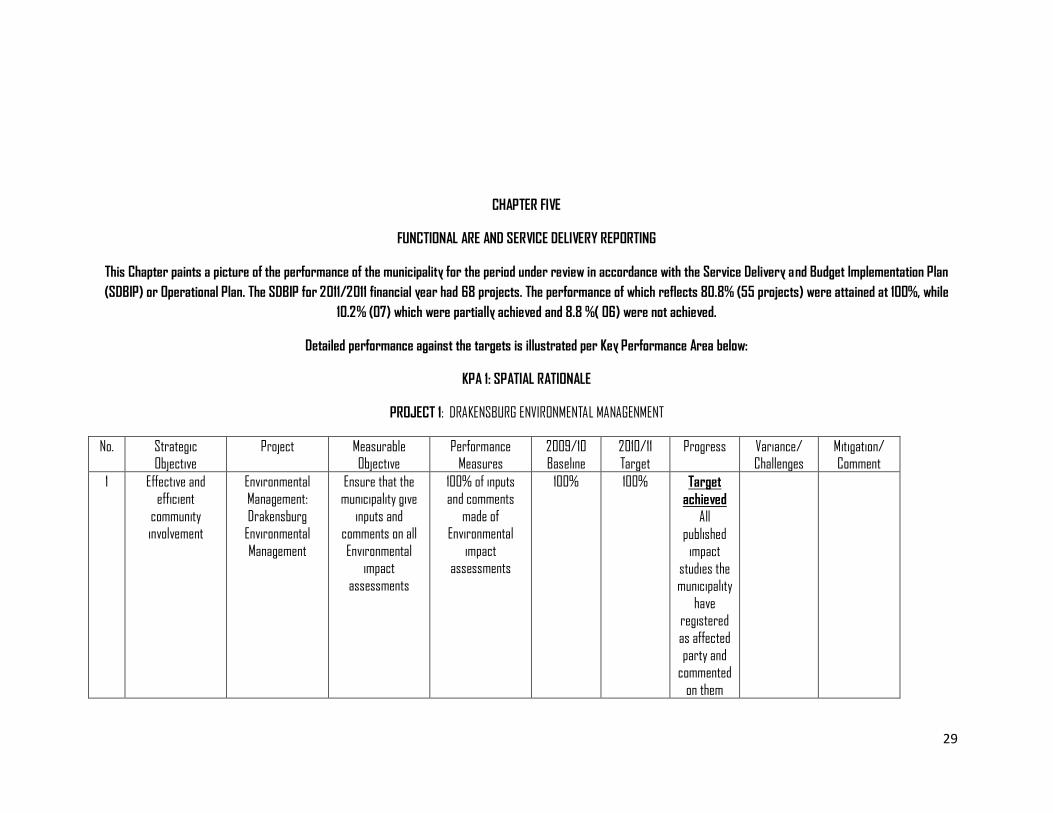
CHAPTER FIVE
FUNCTIONAL ARE AND SERVICE DELIVERY REPORTING
This Chapter paints a picture of the performance of the municipality for the period under review in accordance with the Service Delivery and Budget Implementation Plan
(SDBIP) or Operational Plan. The SDBIP for 2011/2011 financial year had 68 projects. The performance of which reflects 80.8% (55 projects) were attained at 100%, while
10.2% (07) which were partially achieved and 8.8 %( 06) were not achieved.
Detailed performance against the targets is illustrated per Key Performance Area below:
KPA 1: SPATIAL RATIONALE
PROJECT 1: DRAKENSBURG ENVIRONMENTAL MANAGENMENT
No. Strategic Objective
Project Measurable Objective
Performance Measures
2009/10 Baseline
2010/11 Target
Progress Variance/ Challenges
Mitigation/ Comment
1 Effective and efficient
community involvement
Environmental Management:
Drakensburg Environmental
Management
Ensure that the municipality give
inputs and comments on all
Environmental impact
assessments
100% of inputs and comments
made of Environmental
impact assessments
100% 100% Target
achieved All
published impact
studies the municipality
have registered
as affected
party and commented
on them
30
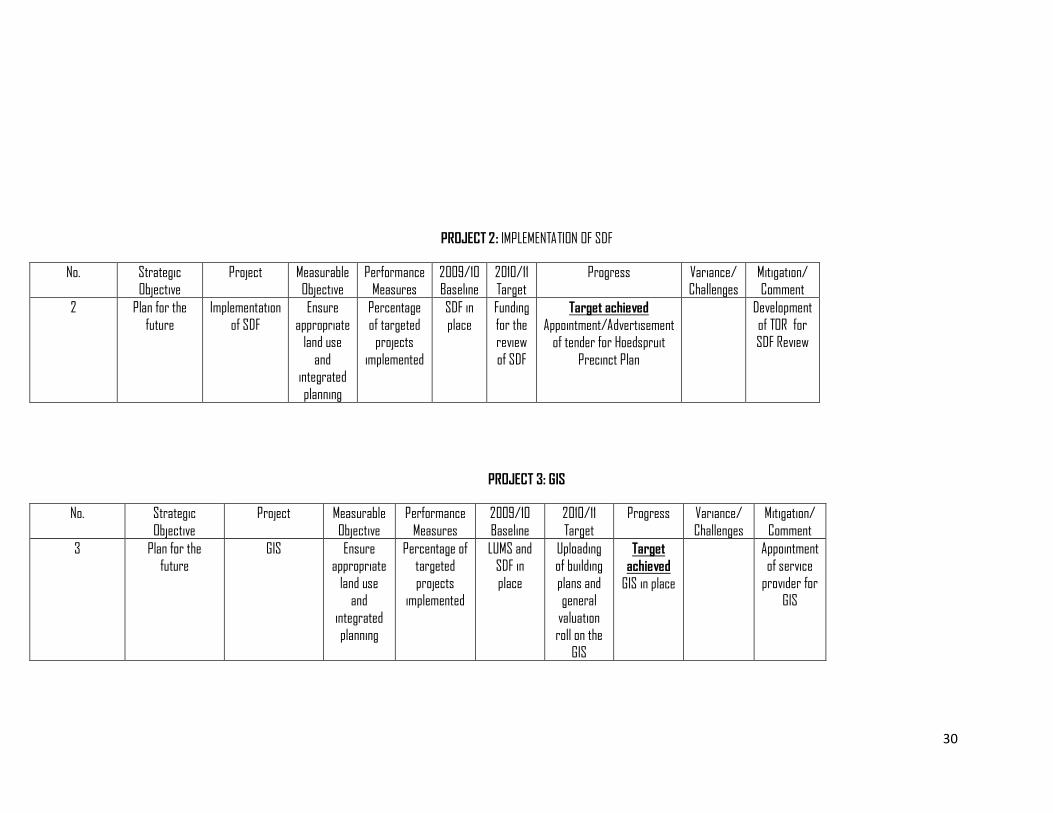
PROJECT 2: IMPLEMENTATION OF SDF
No. Strategic Objective
Project Measurable Objective
Performance Measures
2009/10 Baseline
2010/11 Target
Progress Variance/ Challenges
Mitigation/ Comment
2 Plan for the
future
Implementation
of SDF
Ensure
appropriate land use
and integrated
planning
Percentage
of targeted projects
implemented
SDF in
place
Funding
for the review
of SDF
Target achieved
Appointment/Advertisement of tender for Hoedspruit
Precinct Plan
Development
of TOR for SDF Review
PROJECT 3: GIS
No. Strategic
Objective
Project Measurable
Objective
Performance
Measures
2009/10
Baseline
2010/11
Target
Progress Variance/
Challenges
Mitigation/
Comment
3 Plan for the future
GIS Ensure appropriate
land use and
integrated planning
Percentage of targeted
projects implemented
LUMS and SDF in
place
Uploading of building
plans and general
valuation roll on the
GIS
Target
achieved
GIS in place
Appointment of service
provider for GIS
31
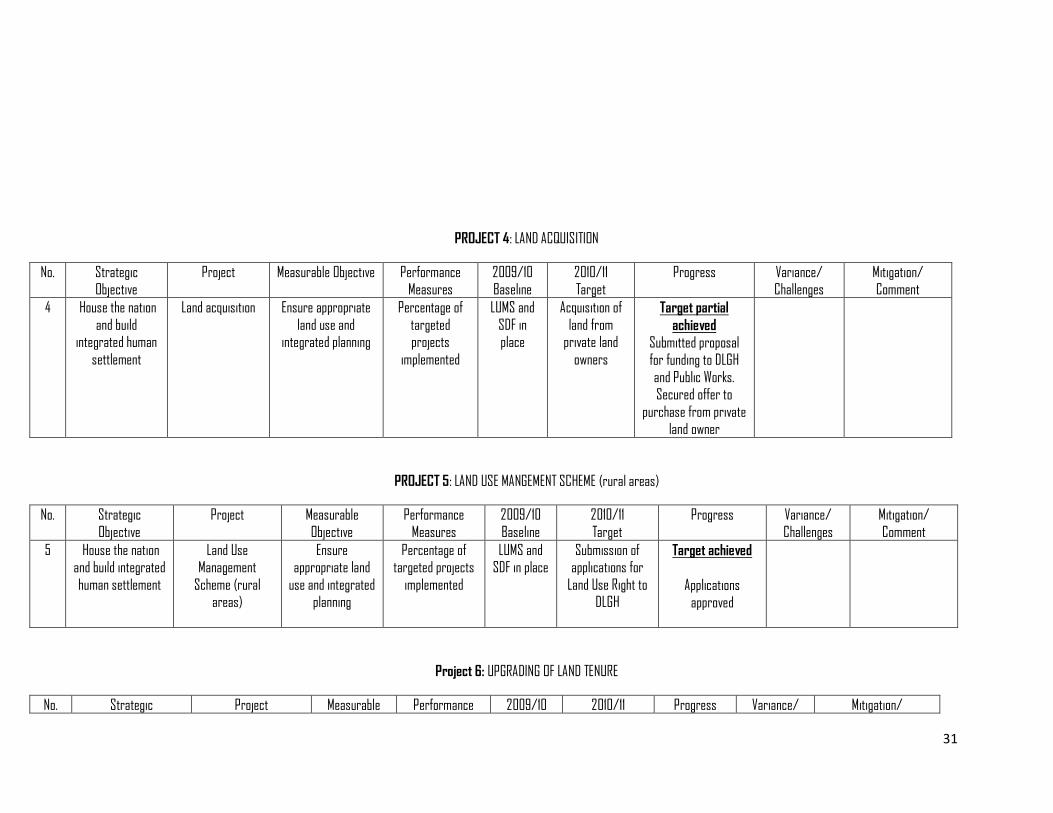
PROJECT 4: LAND ACQUISITION
No. Strategic Objective
Project Measurable Objective Performance Measures
2009/10 Baseline
2010/11 Target
Progress Variance/ Challenges
Mitigation/ Comment
4 House the nation
and build integrated human
settlement
Land acquisition Ensure appropriate
land use and integrated planning
Percentage of
targeted projects
implemented
LUMS and
SDF in place
Acquisition of
land from private land
owners
Target partial
achieved
Submitted proposal for funding to DLGH
and Public Works. Secured offer to
purchase from private land owner
PROJECT 5: LAND USE MANGEMENT SCHEME (rural areas)
No. Strategic
Objective
Project Measurable
Objective
Performance
Measures
2009/10
Baseline
2010/11
Target
Progress Variance/
Challenges
Mitigation/
Comment
5 House the nation and build integrated
human settlement
Land Use Management
Scheme (rural areas)
Ensure appropriate land
use and integrated planning
Percentage of targeted projects
implemented
LUMS and SDF in place
Submission of applications for
Land Use Right to DLGH
Target achieved
Applications
approved
Project 6: UPGRADING OF LAND TENURE
No. Strategic Project Measurable Performance 2009/10 2010/11 Progress Variance/ Mitigation/
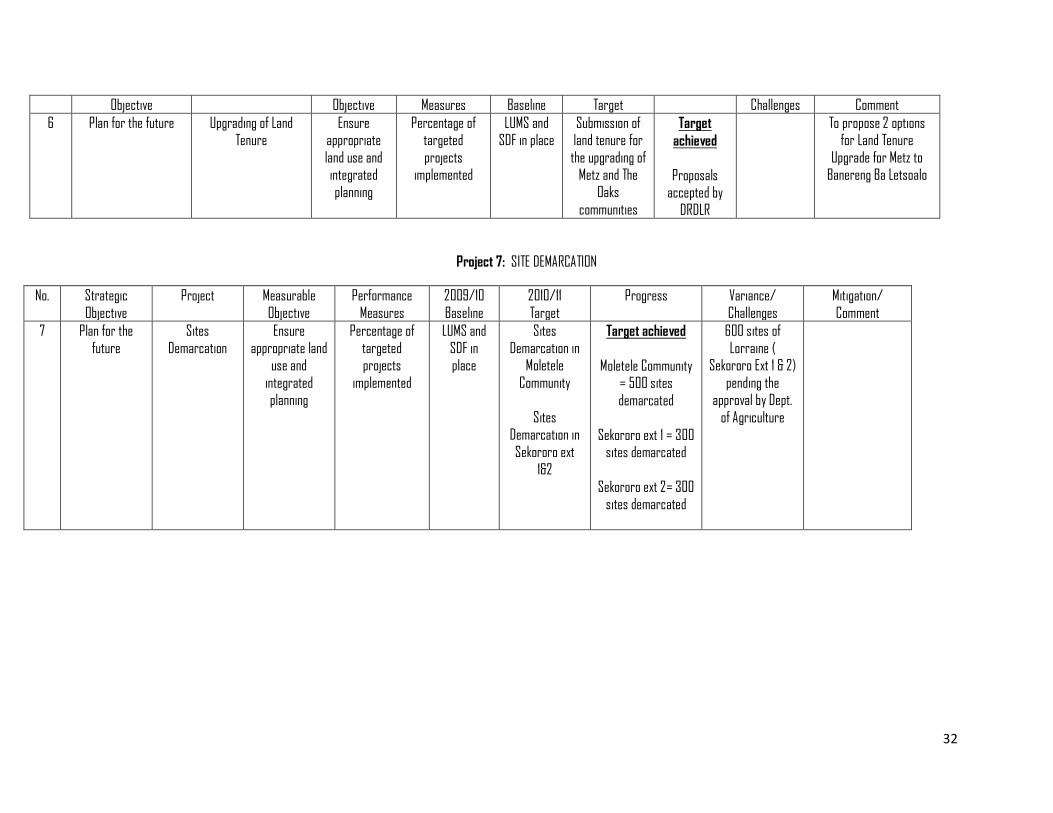
32
Objective Objective Measures Baseline Target Challenges Comment
6 Plan for the future Upgrading of Land Tenure
Ensure appropriate
land use and integrated
planning
Percentage of targeted
projects implemented
LUMS and SDF in place
Submission of land tenure for
the upgrading of Metz and The
Oaks
communities
Target
achieved
Proposals accepted by
DRDLR
To propose 2 options for Land Tenure
Upgrade for Metz to Banereng Ba Letsoalo
Project 7: SITE DEMARCATION
No. Strategic
Objective
Project Measurable
Objective
Performance
Measures
2009/10
Baseline
2010/11
Target
Progress Variance/
Challenges
Mitigation/
Comment
7 Plan for the
future
Sites
Demarcation
Ensure
appropriate land use and
integrated planning
Percentage of
targeted projects
implemented
LUMS and
SDF in place
Sites
Demarcation in Moletele
Community
Sites Demarcation in
Sekororo ext
1&2
Target achieved
Moletele Community = 500 sites
demarcated
Sekororo ext 1 = 300 sites demarcated
Sekororo ext 2= 300
sites demarcated
600 sites of
Lorraine ( Sekororo Ext 1 & 2)
pending the approval by Dept.
of Agriculture
33
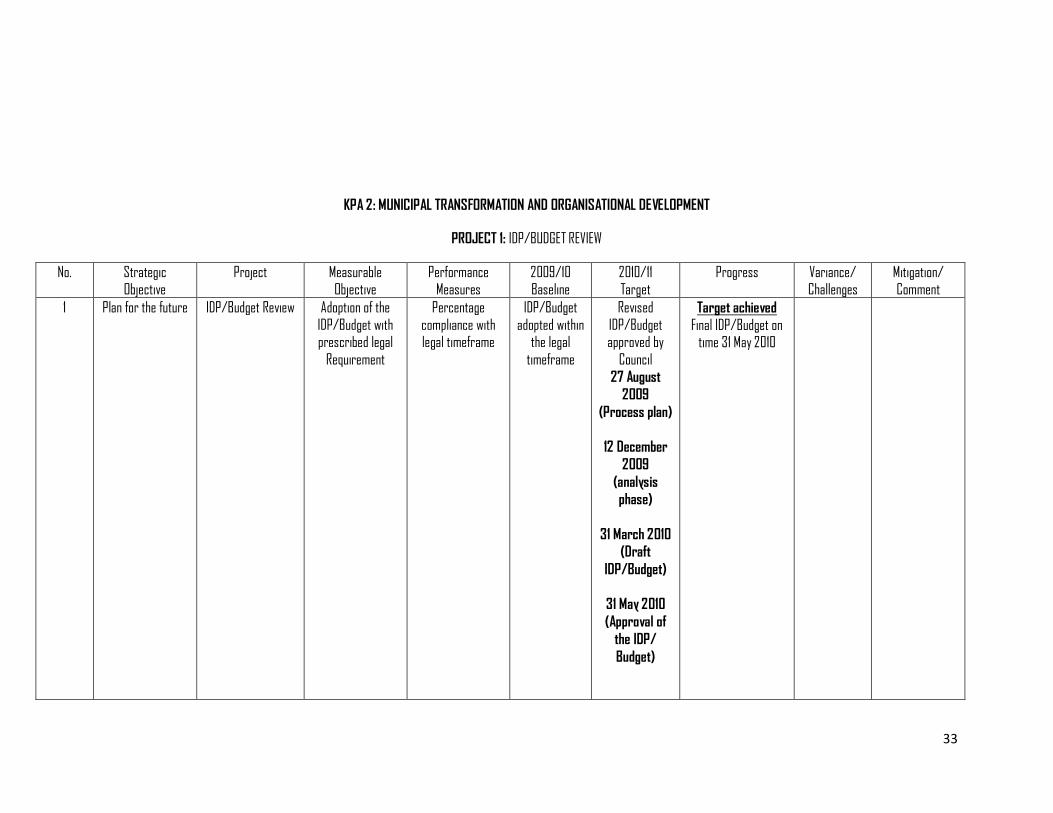
KPA 2: MUNICIPAL TRANSFORMATION AND ORGANISATIONAL DEVELOPMENT
PROJECT 1: IDP/BUDGET REVIEW
No. Strategic Objective
Project Measurable Objective
Performance Measures
2009/10 Baseline
2010/11 Target
Progress Variance/ Challenges
Mitigation/ Comment
1 Plan for the future IDP/Budget Review Adoption of the
IDP/Budget with prescribed legal
Requirement
Percentage
compliance with legal timeframe
IDP/Budget
adopted within the legal
timeframe
Revised
IDP/Budget approved by
Council
27 August
2009
(Process plan)
12 December
2009
(analysis
phase)
31 March 2010
(Draft
IDP/Budget)
31 May 2010
(Approval of
the IDP/
Budget)
Target achieved
Final IDP/Budget on time 31 May 2010
34
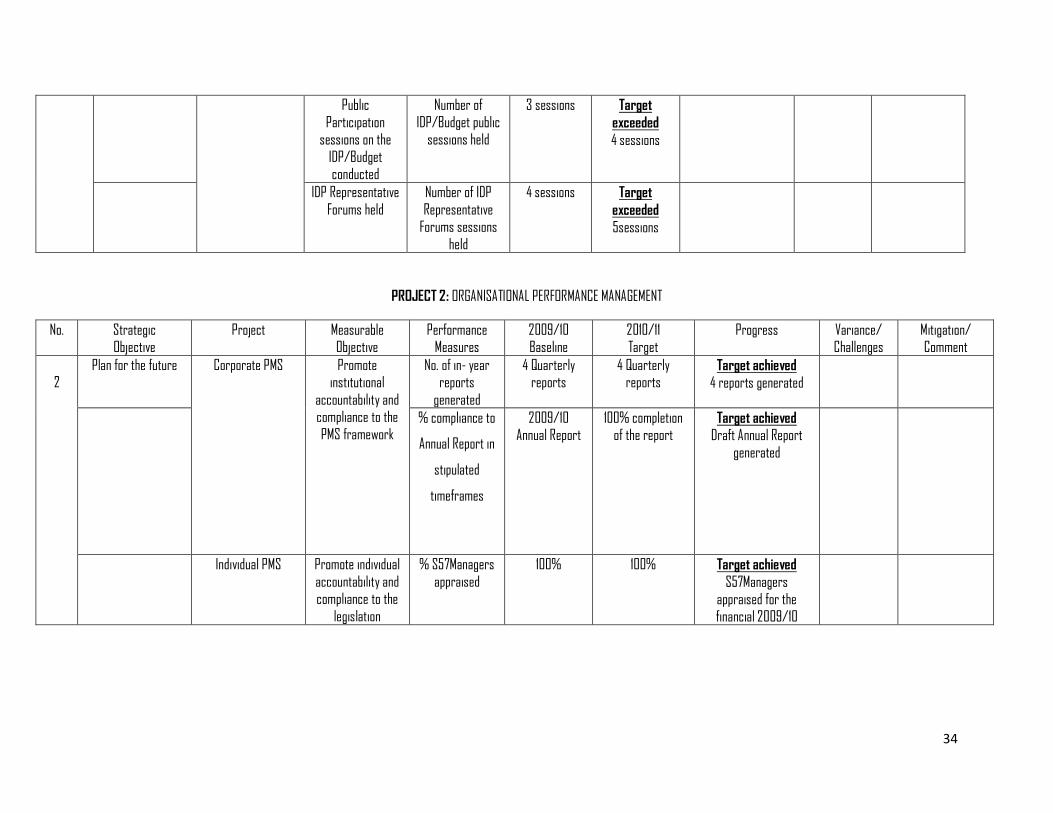
Public
Participation sessions on the
IDP/Budget conducted
Number of
IDP/Budget public sessions held
3 sessions Target
exceeded
4 sessions
IDP Representative
Forums held
Number of IDP
Representative Forums sessions
held
4 sessions Target
exceeded
5sessions
PROJECT 2: ORGANISATIONAL PERFORMANCE MANAGEMENT
No. Strategic Objective
Project Measurable Objective
Performance Measures
2009/10 Baseline
2010/11 Target
Progress Variance/ Challenges
Mitigation/ Comment
2
Plan for the future Corporate PMS Promote institutional
accountability and compliance to the
PMS framework
No. of in- year reports
generated
4 Quarterly reports
4 Quarterly reports
Target achieved
4 reports generated
% compliance to
Annual Report in
stipulated
timeframes
2009/10 Annual Report
100% completion of the report
Target achieved Draft Annual Report
generated
Individual PMS Promote individual
accountability and compliance to the
legislation
% S57Managers
appraised
100% 100% Target achieved
S57Managers
appraised for the financial 2009/10
35
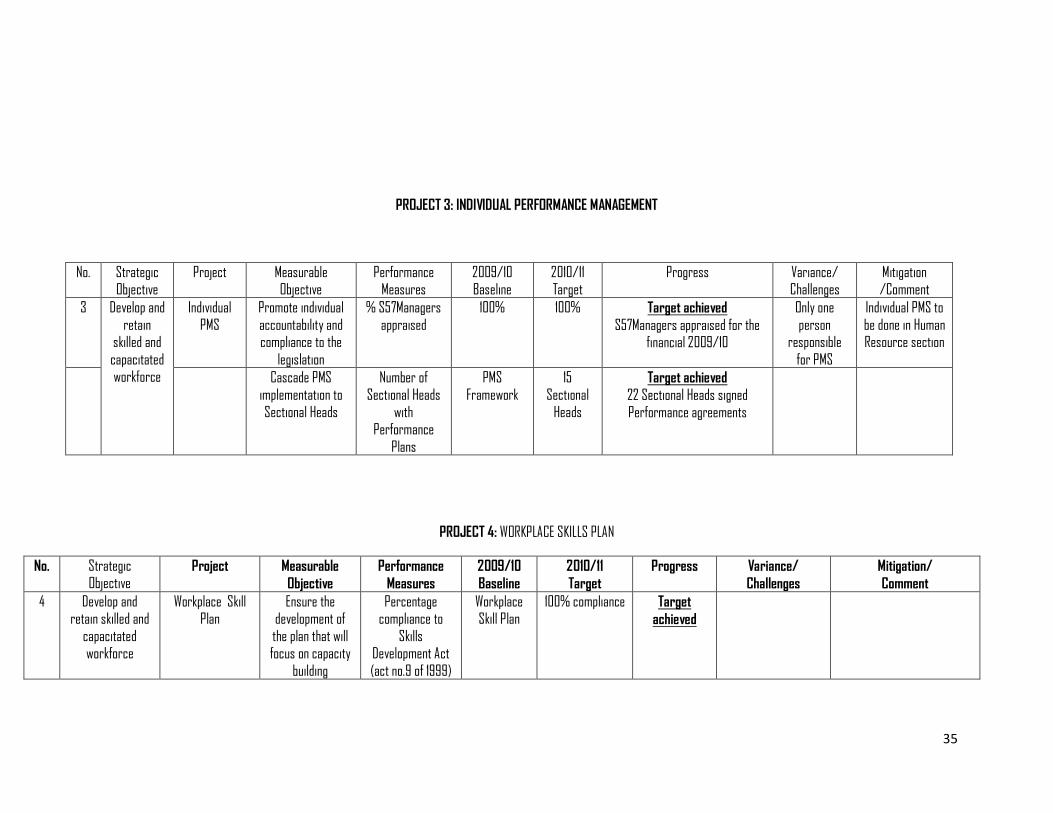
PROJECT 3: INDIVIDUAL PERFORMANCE MANAGEMENT
No. Strategic Objective
Project Measurable Objective
Performance Measures
2009/10 Baseline
2010/11 Target
Progress Variance/ Challenges
Mitigation /Comment
3 Develop and
retain skilled and
capacitated workforce
Individual
PMS
Promote individual
accountability and compliance to the
legislation
% S57Managers
appraised
100% 100% Target achieved
S57Managers appraised for the financial 2009/10
Only one
person responsible
for PMS
Individual PMS to
be done in Human Resource section
Cascade PMS
implementation to
Sectional Heads
Number of
Sectional Heads
with Performance
Plans
PMS
Framework
15
Sectional
Heads
Target achieved
22 Sectional Heads signed
Performance agreements
PROJECT 4: WORKPLACE SKILLS PLAN
No. Strategic
Objective Project Measurable
Objective
Performance
Measures
2009/10
Baseline
2010/11
Target
Progress Variance/
Challenges
Mitigation/
Comment
4 Develop and retain skilled and
capacitated workforce
Workplace Skill Plan
Ensure the development of
the plan that will focus on capacity
building
Percentage compliance to
Skills Development Act
(act no.9 of 1999)
Workplace Skill Plan
100% compliance Target
achieved
36
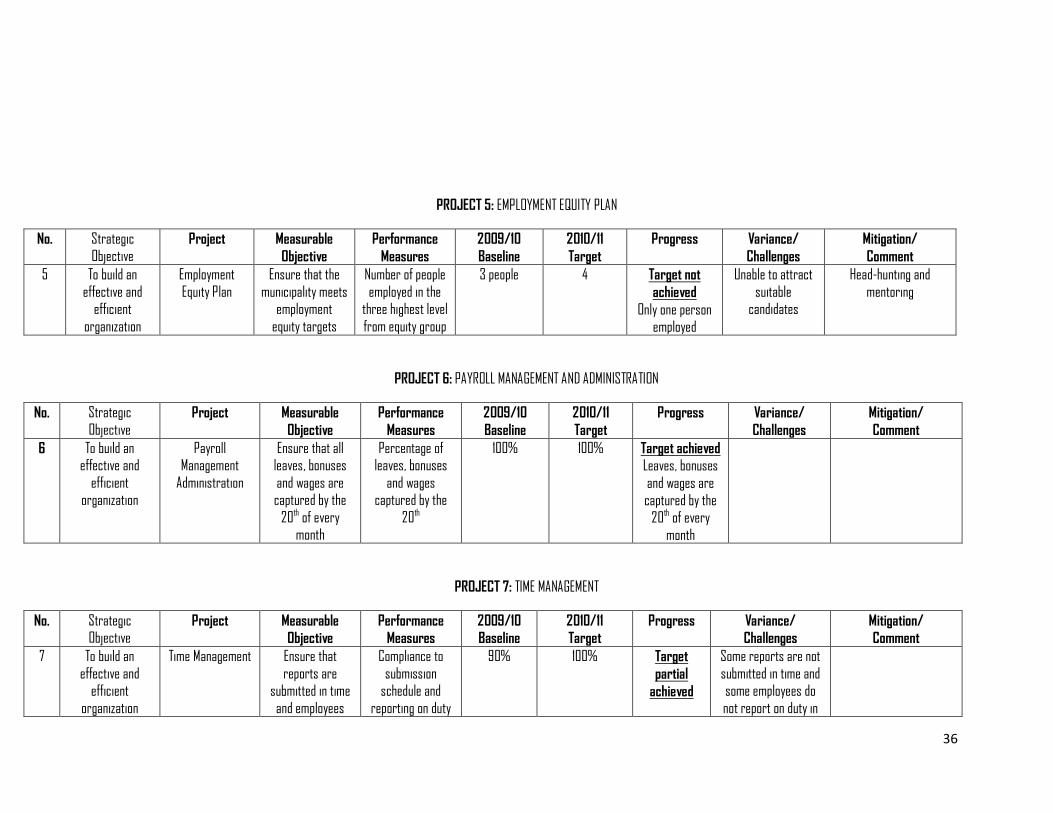
PROJECT 5: EMPLOYMENT EQUITY PLAN
No. Strategic
Objective Project Measurable
Objective
Performance
Measures
2009/10
Baseline
2010/11
Target
Progress Variance/
Challenges
Mitigation/
Comment
5 To build an
effective and efficient
organization
Employment
Equity Plan
Ensure that the
municipality meets employment
equity targets
Number of people
employed in the three highest level
from equity group
3 people 4 Target not
achieved
Only one person employed
Unable to attract
suitable candidates
Head-hunting and
mentoring
PROJECT 6: PAYROLL MANAGEMENT AND ADMINISTRATION
No. Strategic
Objective Project Measurable
Objective
Performance
Measures
2009/10
Baseline
2010/11
Target
Progress Variance/
Challenges
Mitigation/
Comment
6 To build an effective and
efficient organization
Payroll Management
Administration
Ensure that all leaves, bonuses
and wages are captured by the
20th of every month
Percentage of leaves, bonuses
and wages captured by the
20th
100% 100% Target achieved Leaves, bonuses
and wages are
captured by the 20th of every
month
PROJECT 7: TIME MANAGEMENT
No. Strategic Objective
Project Measurable
Objective
Performance
Measures
2009/10
Baseline
2010/11
Target
Progress Variance/
Challenges
Mitigation/
Comment
7 To build an
effective and efficient
organization
Time Management Ensure that
reports are submitted in time
and employees
Compliance to
submission schedule and
reporting on duty
90% 100% Target
partial
achieved
Some reports are not
submitted in time and some employees do
not report on duty in
37
report to duty in
time
in time time
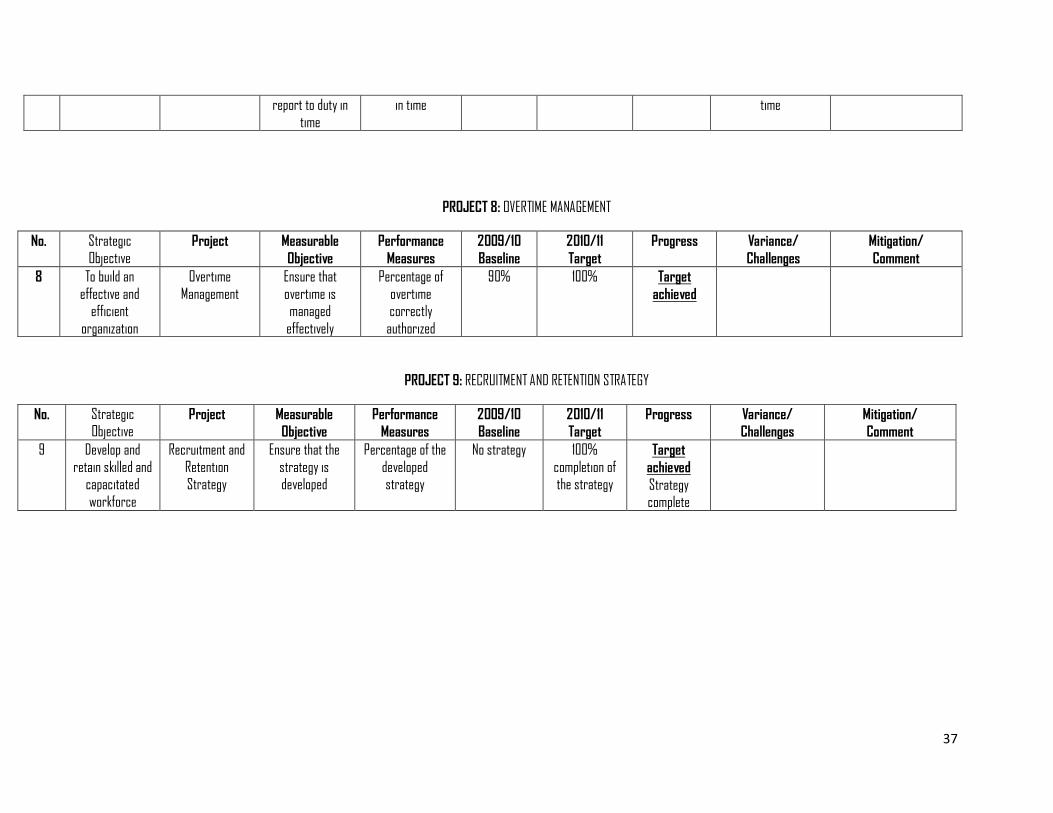
PROJECT 8: OVERTIME MANAGEMENT
No. Strategic
Objective Project Measurable
Objective
Performance
Measures
2009/10
Baseline
2010/11
Target
Progress Variance/
Challenges
Mitigation/
Comment
8 To build an
effective and efficient
organization
Overtime
Management
Ensure that
overtime is managed
effectively
Percentage of
overtime correctly
authorized
90% 100% Target
achieved
PROJECT 9: RECRUITMENT AND RETENTION STRATEGY
No. Strategic Objective
Project Measurable
Objective
Performance
Measures
2009/10
Baseline
2010/11
Target
Progress Variance/
Challenges
Mitigation/
Comment
9 Develop and
retain skilled and capacitated
workforce
Recruitment and
Retention Strategy
Ensure that the
strategy is developed
Percentage of the
developed strategy
No strategy 100%
completion of the strategy
Target
achieved
Strategy complete
38
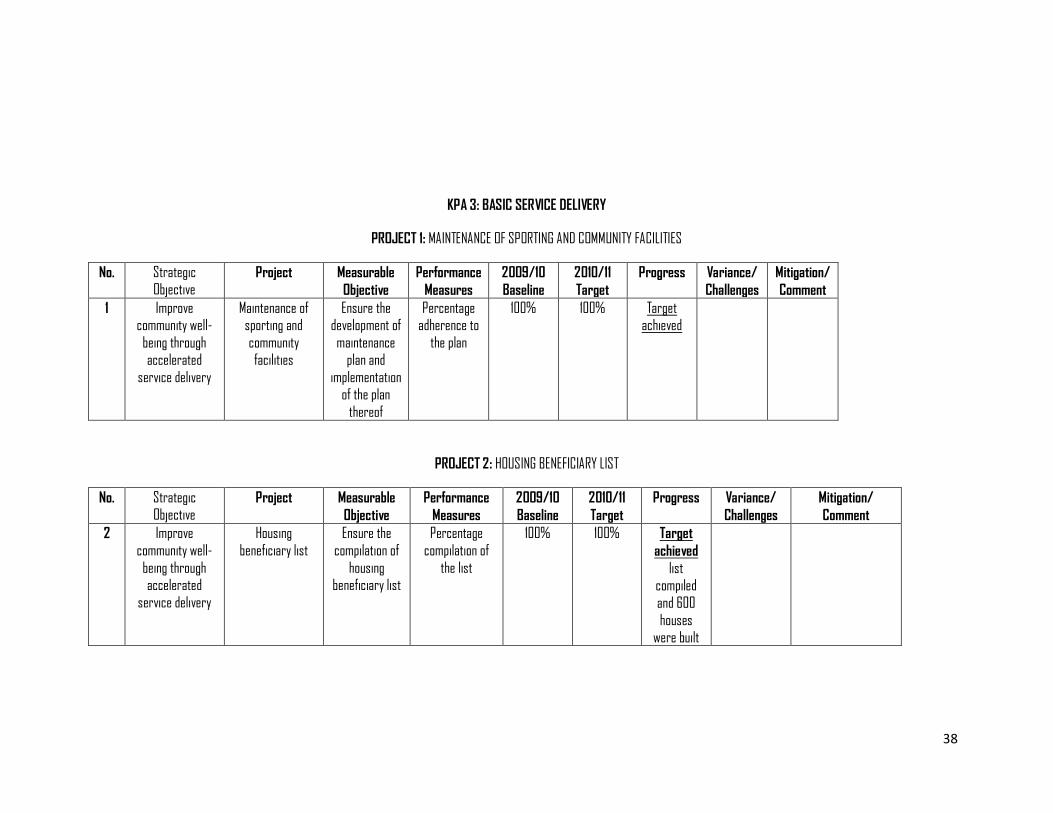
KPA 3: BASIC SERVICE DELIVERY
PROJECT 1: MAINTENANCE OF SPORTING AND COMMUNITY FACILITIES
No. Strategic Objective
Project Measurable
Objective
Performance
Measures
2009/10
Baseline
2010/11
Target
Progress Variance/
Challenges
Mitigation/
Comment
1 Improve community well-
being through accelerated
service delivery
Maintenance of sporting and
community facilities
Ensure the development of
maintenance plan and
implementation of the plan
thereof
Percentage adherence to
the plan
100% 100% Target achieved
PROJECT 2: HOUSING BENEFICIARY LIST
No. Strategic Objective
Project Measurable
Objective
Performance
Measures
2009/10
Baseline
2010/11
Target
Progress Variance/
Challenges
Mitigation/
Comment
2 Improve
community well-
being through accelerated
service delivery
Housing
beneficiary list
Ensure the
compilation of
housing beneficiary list
Percentage
compilation of
the list
100% 100% Target
achieved
list compiled
and 600
houses were built
39
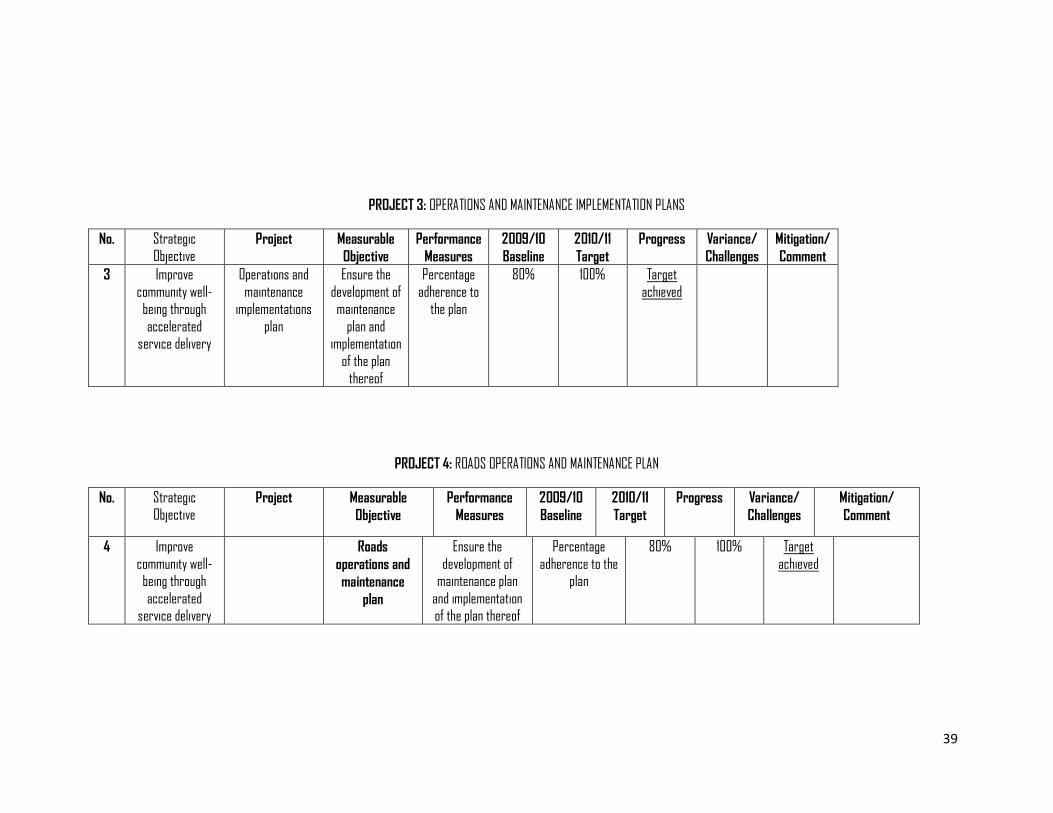
PROJECT 3: OPERATIONS AND MAINTENANCE IMPLEMENTATION PLANS
No. Strategic
Objective Project Measurable
Objective
Performance
Measures
2009/10
Baseline
2010/11
Target
Progress Variance/
Challenges
Mitigation/
Comment
3 Improve
community well-being through
accelerated service delivery
Operations and
maintenance implementations
plan
Ensure the
development of maintenance
plan and implementation
of the plan thereof
Percentage
adherence to the plan
80% 100% Target
achieved
PROJECT 4: ROADS OPERATIONS AND MAINTENANCE PLAN
No. Strategic Objective
Project Measurable
Objective
Performance
Measures
2009/10
Baseline
2010/11
Target
Progress Variance/
Challenges
Mitigation/
Comment
4 Improve
community well-being through
accelerated service delivery
Roads
operations and
maintenance
plan
Ensure the
development of maintenance plan
and implementation of the plan thereof
Percentage
adherence to the plan
80% 100% Target
achieved
40
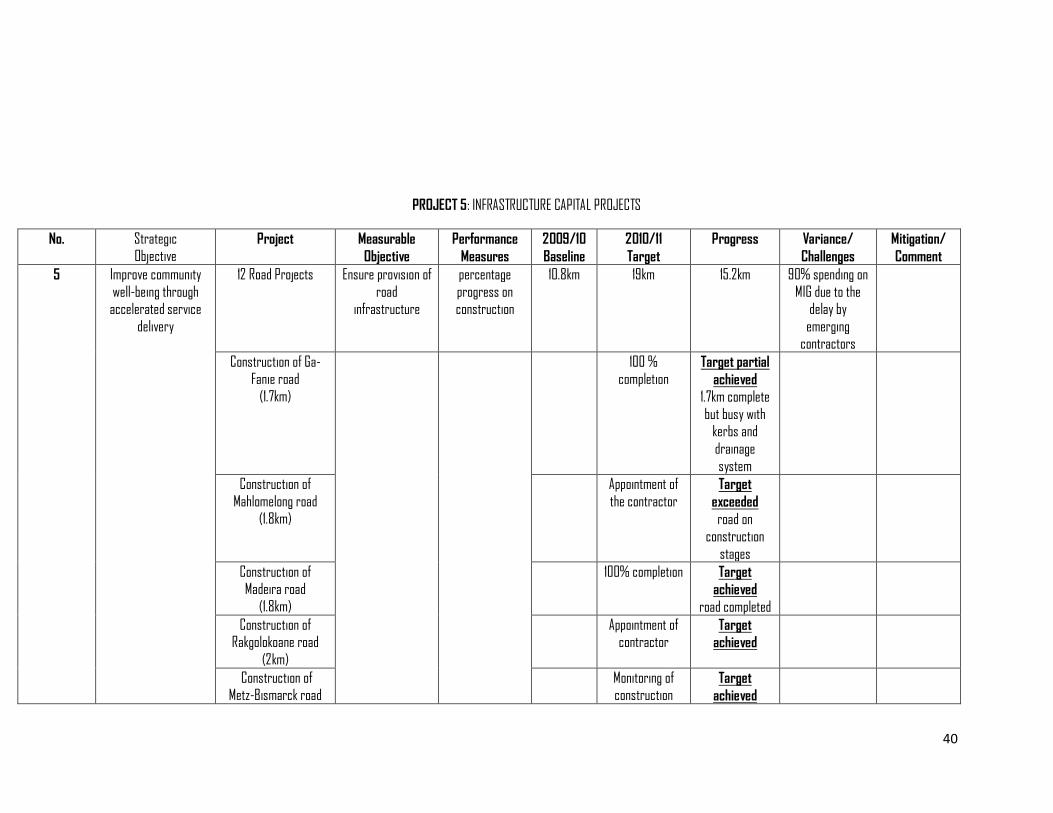
PROJECT 5: INFRASTRUCTURE CAPITAL PROJECTS
No. Strategic
Objective Project Measurable
Objective
Performance
Measures
2009/10
Baseline
2010/11
Target
Progress Variance/
Challenges
Mitigation/
Comment
5 Improve community
well-being through accelerated service
delivery
12 Road Projects Ensure provision of
road infrastructure
percentage
progress on construction
10.8km 19km 15.2km 90% spending on
MIG due to the delay by
emerging contractors
Construction of Ga-Fanie road
(1.7km)
100 % completion
Target partial
achieved 1.7km complete
but busy with kerbs and
drainage
system
Construction of
Mahlomelong road (1.8km)
Appointment of
the contractor Target
exceeded
road on construction
stages
Construction of Madeira road
(1.8km)
100% completion Target
achieved
road completed
Construction of Rakgolokoane road
(2km)
Appointment of contractor
Target
achieved
Construction of Metz-Bismarck road
Monitoring of construction
Target
achieved
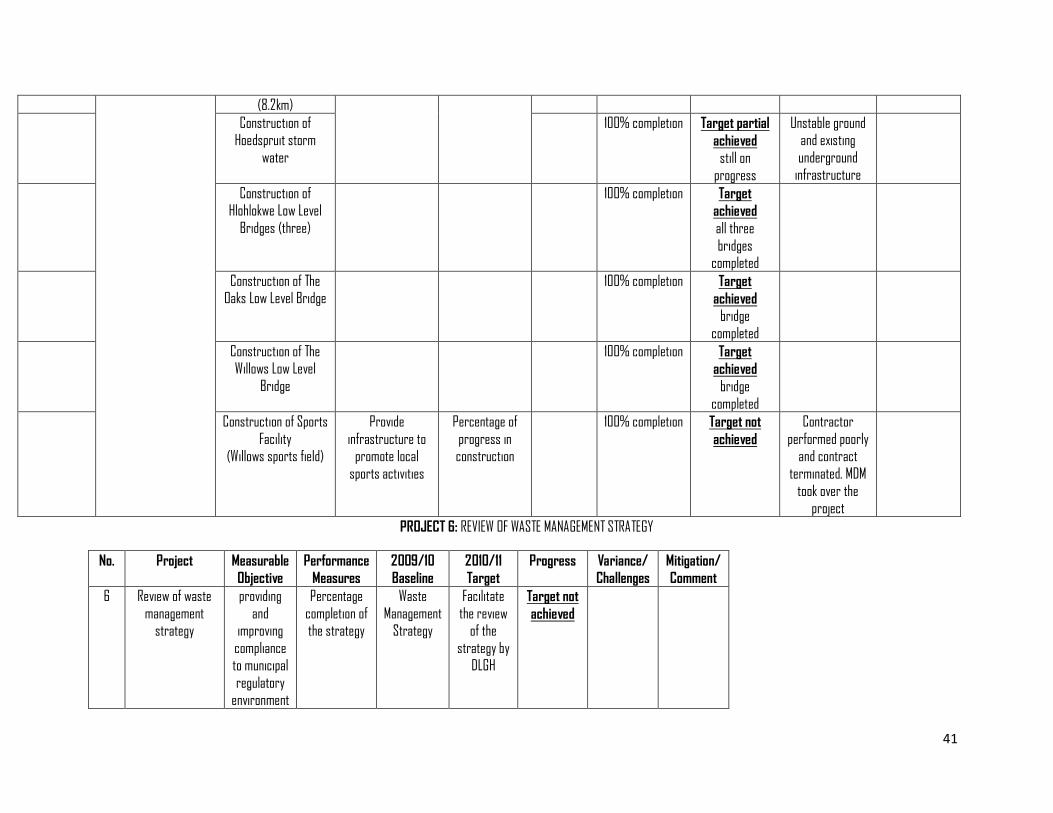
41
(8.2km)
Construction of Hoedspruit storm
water
100% completion Target partial
achieved still on
progress
Unstable ground and existing
underground infrastructure
Construction of Hlohlokwe Low Level
Bridges (three)
100% completion Target
achieved
all three
bridges completed
Construction of The Oaks Low Level Bridge
100% completion Target
achieved bridge
completed
Construction of The Willows Low Level
Bridge
100% completion Target
achieved
bridge
completed
Construction of Sports
Facility (Willows sports field)
Provide
infrastructure to promote local
sports activities
Percentage of
progress in construction
100% completion Target not
achieved
Contractor
performed poorly and contract
terminated. MDM
took over the project
PROJECT 6: REVIEW OF WASTE MANAGEMENT STRATEGY
No. Project Measurable
Objective
Performance
Measures
2009/10
Baseline
2010/11
Target
Progress Variance/
Challenges
Mitigation/
Comment
6 Review of waste
management strategy
providing
and improving
compliance to municipal
regulatory environment
Percentage
completion of the strategy
Waste
Management Strategy
Facilitate
the review of the
strategy by DLGH
Target not
achieved
42
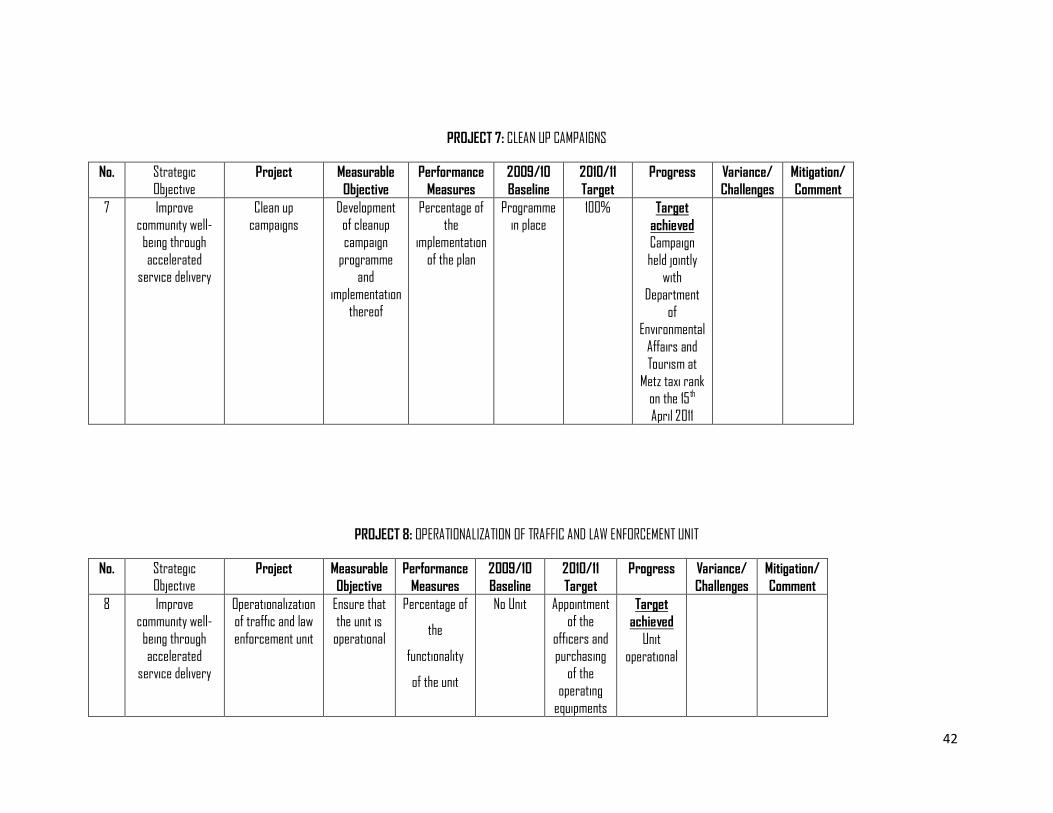
PROJECT 7: CLEAN UP CAMPAIGNS
No. Strategic
Objective Project Measurable
Objective
Performance
Measures
2009/10
Baseline
2010/11
Target
Progress Variance/
Challenges
Mitigation/
Comment
7 Improve community well-
being through
accelerated service delivery
Clean up campaigns
Development of cleanup
campaign
programme and
implementation thereof
Percentage of the
implementation
of the plan
Programme in place
100% Target
achieved Campaign
held jointly
with Department
of Environmental
Affairs and Tourism at
Metz taxi rank on the 15th
April 2011
PROJECT 8: OPERATIONALIZATION OF TRAFFIC AND LAW ENFORCEMENT UNIT
No. Strategic Objective
Project Measurable
Objective
Performance
Measures
2009/10
Baseline
2010/11
Target
Progress Variance/
Challenges
Mitigation/
Comment
8 Improve community well-
being through accelerated
service delivery
Operationalization of traffic and law
enforcement unit
Ensure that the unit is
operational
Percentage of
the
functionality
of the unit
No Unit Appointment of the
officers and purchasing
of the operating
equipments
Target
achieved
Unit
operational
43
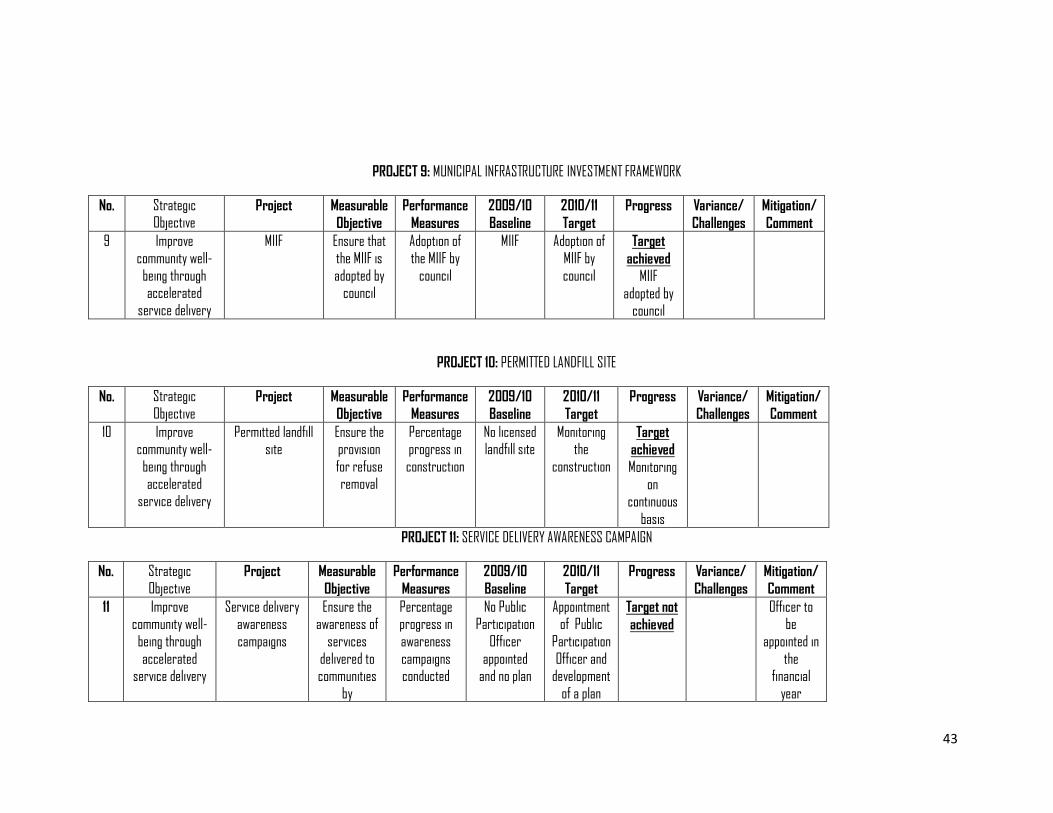
PROJECT 9: MUNICIPAL INFRASTRUCTURE INVESTMENT FRAMEWORK
No. Strategic Objective
Project Measurable
Objective
Performance
Measures
2009/10
Baseline
2010/11
Target
Progress Variance/
Challenges
Mitigation/
Comment
9 Improve
community well-
being through accelerated
service delivery
MIIF Ensure that
the MIIF is
adopted by council
Adoption of
the MIIF by
council
MIIF Adoption of
MIIF by
council
Target
achieved
MIIF
adopted by council
PROJECT 10: PERMITTED LANDFILL SITE
No. Strategic
Objective Project Measurable
Objective
Performance
Measures
2009/10
Baseline
2010/11
Target
Progress Variance/
Challenges
Mitigation/
Comment
10 Improve community well-
being through accelerated
service delivery
Permitted landfill site
Ensure the provision
for refuse removal
Percentage progress in
construction
No licensed landfill site
Monitoring the
construction
Target
achieved
Monitoring
on continuous
basis
PROJECT 11: SERVICE DELIVERY AWARENESS CAMPAIGN
No. Strategic
Objective Project Measurable
Objective
Performance
Measures
2009/10
Baseline
2010/11
Target
Progress Variance/
Challenges
Mitigation/
Comment
11 Improve community well-
being through
accelerated service delivery
Service delivery awareness
campaigns
Ensure the awareness of
services
delivered to communities
by
Percentage progress in
awareness
campaigns conducted
No Public Participation
Officer
appointed and no plan
Appointment of Public
Participation
Officer and development
of a plan
Target not
achieved
Officer to be
appointed in
the financial
year
44
government 2011/12
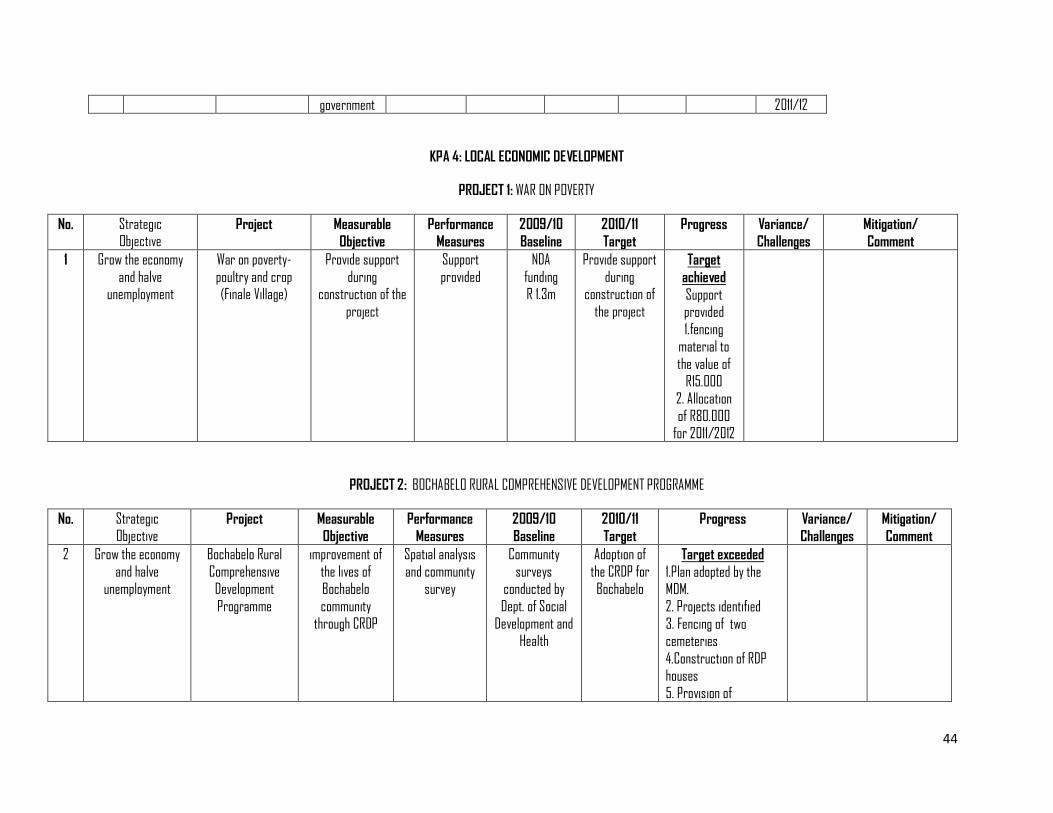
KPA 4: LOCAL ECONOMIC DEVELOPMENT
PROJECT 1: WAR ON POVERTY
No. Strategic Objective
Project Measurable
Objective
Performance
Measures
2009/10
Baseline
2010/11
Target
Progress Variance/
Challenges
Mitigation/
Comment
1 Grow the economy
and halve unemployment
War on poverty-
poultry and crop (Finale Village)
Provide support
during construction of the
project
Support
provided
NDA
funding R 1.3m
Provide support
during construction of
the project
Target
achieved
Support provided
1.fencing material to
the value of
R15.000 2. Allocation
of R80.000 for 2011/2012
PROJECT 2: BOCHABELO RURAL COMPREHENSIVE DEVELOPMENT PROGRAMME
No. Strategic Objective
Project Measurable
Objective
Performance
Measures
2009/10
Baseline
2010/11
Target
Progress Variance/
Challenges
Mitigation/
Comment
2 Grow the economy
and halve unemployment
Bochabelo Rural
Comprehensive Development
Programme
improvement of
the lives of Bochabelo
community
through CRDP
Spatial analysis
and community survey
Community
surveys conducted by
Dept. of Social
Development and Health
Adoption of
the CRDP for Bochabelo
Target exceeded
1.Plan adopted by the
MDM. 2. Projects identified
3. Fencing of two cemeteries
4.Construction of RDP houses
5. Provision of
45
Sanitation
6.Jobs created
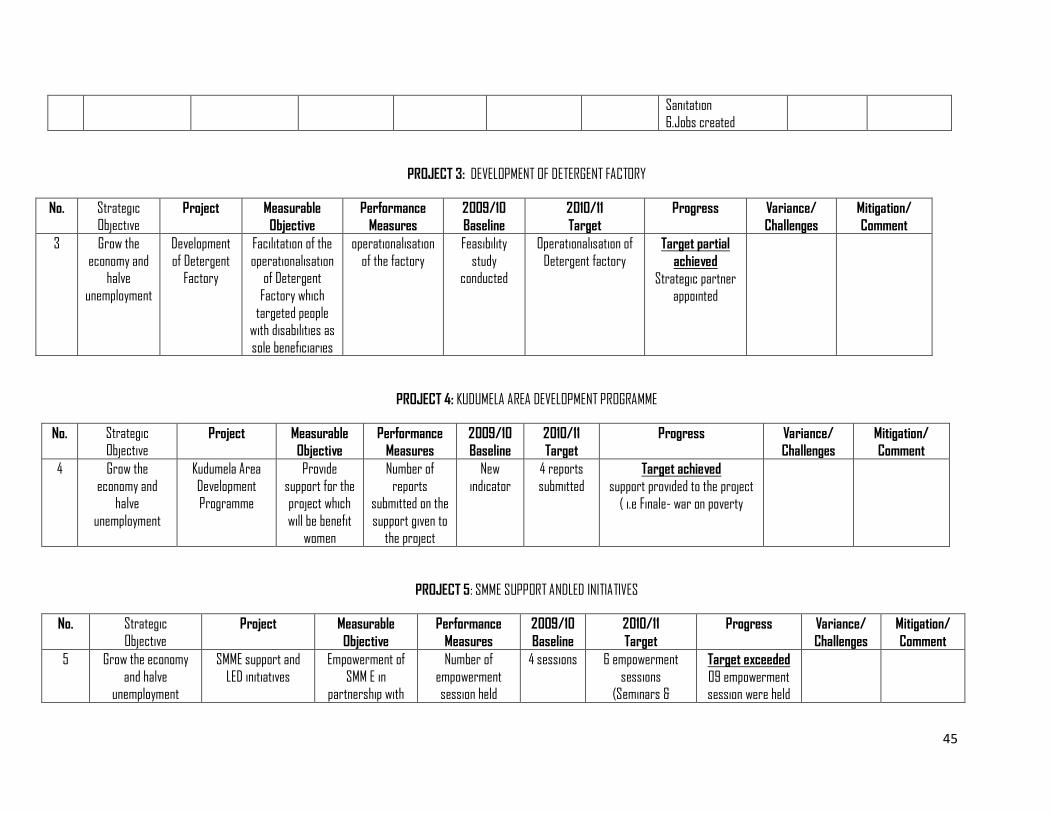
PROJECT 3: DEVELOPMENT OF DETERGENT FACTORY
No. Strategic Objective
Project Measurable
Objective
Performance
Measures
2009/10
Baseline
2010/11
Target
Progress Variance/
Challenges
Mitigation/
Comment
3 Grow the
economy and halve
unemployment
Development
of Detergent Factory
Facilitation of the
operationalisation of Detergent
Factory which
targeted people with disabilities as
sole beneficiaries
operationalisation
of the factory
Feasibility
study conducted
Operationalisation of
Detergent factory Target partial
achieved
Strategic partner appointed
PROJECT 4: KUDUMELA AREA DEVELOPMENT PROGRAMME
No. Strategic Objective
Project Measurable
Objective
Performance
Measures
2009/10
Baseline
2010/11
Target
Progress Variance/
Challenges
Mitigation/
Comment
4 Grow the
economy and halve
unemployment
Kudumela Area
Development Programme
Provide
support for the project which
will be benefit women
Number of
reports submitted on the
support given to the project
New
indicator
4 reports
submitted Target achieved
support provided to the project
( i.e Finale- war on poverty
PROJECT 5: SMME SUPPORT ANDLED INITIATIVES
No. Strategic
Objective Project Measurable
Objective
Performance
Measures
2009/10
Baseline
2010/11
Target
Progress Variance/
Challenges
Mitigation/
Comment
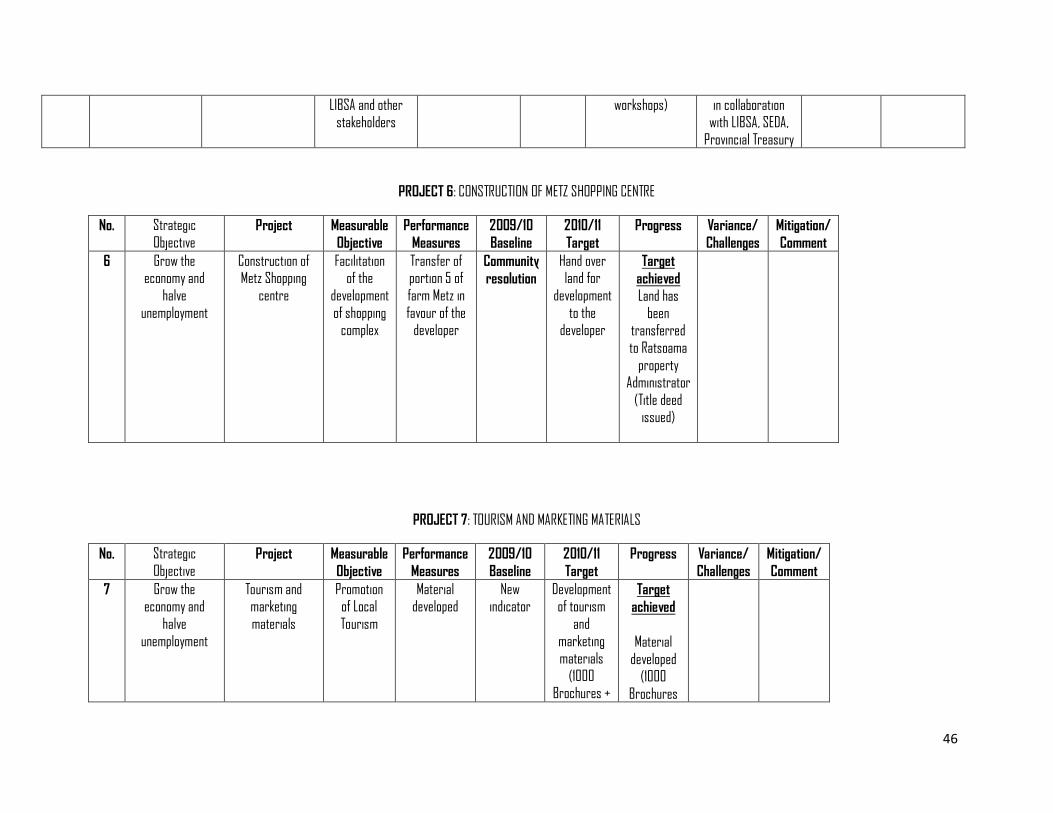
5 Grow the economy
and halve unemployment
SMME support and
LED initiatives
Empowerment of
SMM E in partnership with
Number of
empowerment session held
4 sessions 6 empowerment
sessions (Seminars &
Target exceeded
09 empowerment session were held
46
LIBSA and other
stakeholders
workshops) in collaboration
with LIBSA, SEDA, Provincial Treasury
PROJECT 6: CONSTRUCTION OF METZ SHOPPING CENTRE
No. Strategic
Objective Project Measurable
Objective
Performance
Measures
2009/10
Baseline
2010/11
Target
Progress Variance/
Challenges
Mitigation/
Comment
6 Grow the economy and
halve
unemployment
Construction of Metz Shopping
centre
Facilitation of the
development
of shopping complex
Transfer of portion 5 of
farm Metz in
favour of the developer
Community
resolution
Hand over land for
development
to the developer
Target
achieved Land has
been transferred
to Ratsoama
property Administrator
(Title deed issued)
PROJECT 7: TOURISM AND MARKETING MATERIALS
No. Strategic
Objective Project Measurable
Objective
Performance
Measures
2009/10
Baseline
2010/11
Target
Progress Variance/
Challenges
Mitigation/
Comment
7 Grow the economy and
halve
unemployment
Tourism and marketing
materials
Promotion of Local
Tourism
Material developed
New indicator
Development of tourism
and
marketing materials
(1000 Brochures +
Target
achieved
Material
developed (1000
Brochures
47
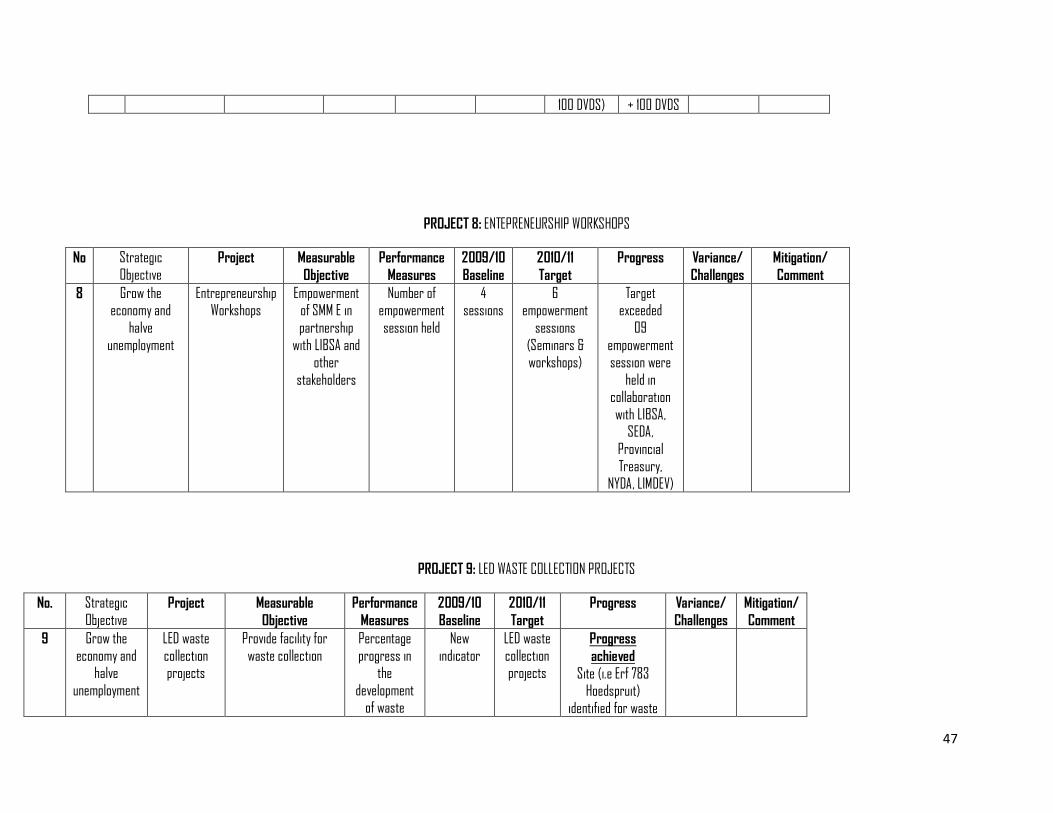
100 DVDS) + 100 DVDS
PROJECT 8: ENTEPRENEURSHIP WORKSHOPS
No Strategic
Objective Project Measurable
Objective
Performance
Measures
2009/10
Baseline
2010/11
Target
Progress Variance/
Challenges
Mitigation/
Comment
8 Grow the economy and
halve
unemployment
Entrepreneurship Workshops
Empowerment of SMM E in
partnership
with LIBSA and other
stakeholders
Number of empowerment
session held
4 sessions
6 empowerment
sessions
(Seminars & workshops)
Target exceeded
09
empowerment session were
held in collaboration
with LIBSA, SEDA,
Provincial Treasury,
NYDA, LIMDEV)
PROJECT 9: LED WASTE COLLECTION PROJECTS
No. Strategic
Objective Project Measurable
Objective
Performance
Measures
2009/10
Baseline
2010/11
Target
Progress Variance/
Challenges
Mitigation/
Comment
9 Grow the
economy and halve
unemployment
LED waste
collection projects
Provide facility for
waste collection
Percentage
progress in the
development of waste
New
indicator
LED waste
collection projects
Progress
achieved
Site (i.e Erf 783 Hoedspruit)
identified for waste
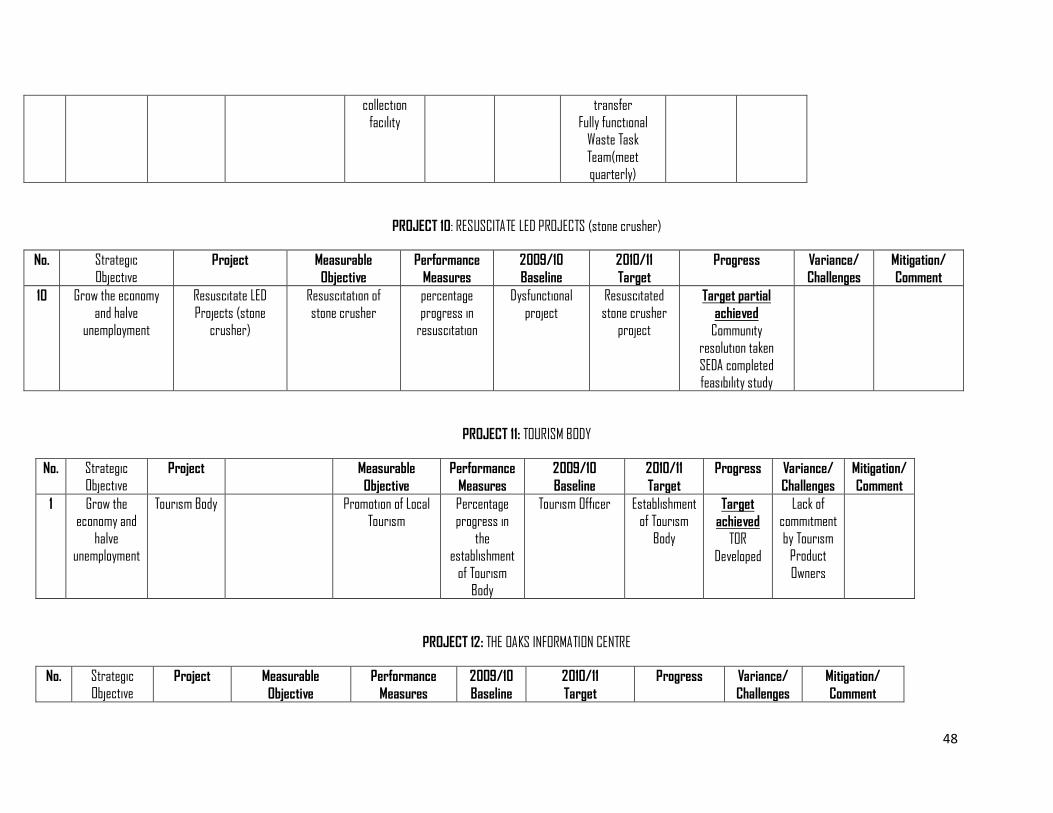
48
collection
facility
transfer
Fully functional Waste Task
Team(meet quarterly)
PROJECT 10: RESUSCITATE LED PROJECTS (stone crusher)
No. Strategic
Objective Project Measurable
Objective
Performance
Measures
2009/10
Baseline
2010/11
Target
Progress Variance/
Challenges
Mitigation/
Comment
10 Grow the economy
and halve unemployment
Resuscitate LED
Projects (stone crusher)
Resuscitation of
stone crusher
percentage
progress in resuscitation
Dysfunctional
project
Resuscitated
stone crusher project
Target partial
achieved Community
resolution taken
SEDA completed feasibility study
PROJECT 11: TOURISM BODY
No. Strategic
Objective Project Measurable
Objective
Performance
Measures
2009/10
Baseline
2010/11
Target
Progress Variance/
Challenges
Mitigation/
Comment
1 Grow the economy and
halve unemployment
Tourism Body
Promotion of Local Tourism
Percentage progress in
the establishment
of Tourism Body
Tourism Officer Establishment of Tourism
Body
Target
achieved
TOR
Developed
Lack of commitment
by Tourism Product
Owners
PROJECT 12: THE OAKS INFORMATION CENTRE
No. Strategic
Objective Project Measurable
Objective
Performance
Measures
2009/10
Baseline
2010/11
Target
Progress Variance/
Challenges
Mitigation/
Comment
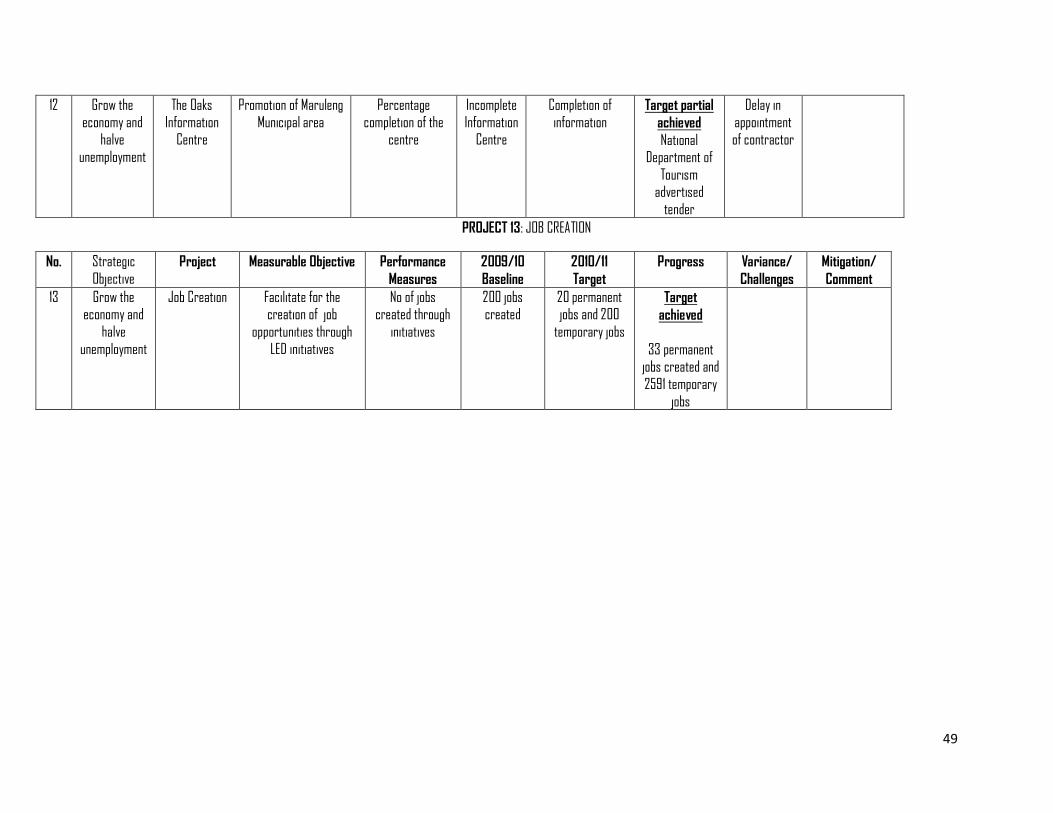
49
12 Grow the
economy and halve
unemployment
The Oaks
Information Centre
Promotion of Maruleng
Municipal area
Percentage
completion of the centre
Incomplete
Information Centre
Completion of
information Target partial
achieved
National Department of
Tourism advertised
tender
Delay in
appointment of contractor
PROJECT 13: JOB CREATION
No. Strategic
Objective Project Measurable Objective Performance
Measures
2009/10
Baseline
2010/11
Target
Progress Variance/
Challenges
Mitigation/
Comment
13 Grow the economy and
halve
unemployment
Job Creation Facilitate for the creation of job
opportunities through
LED initiatives
No of jobs created through
initiatives
200 jobs created
20 permanent jobs and 200
temporary jobs
Target
achieved
33 permanent jobs created and
2591 temporary
jobs
50
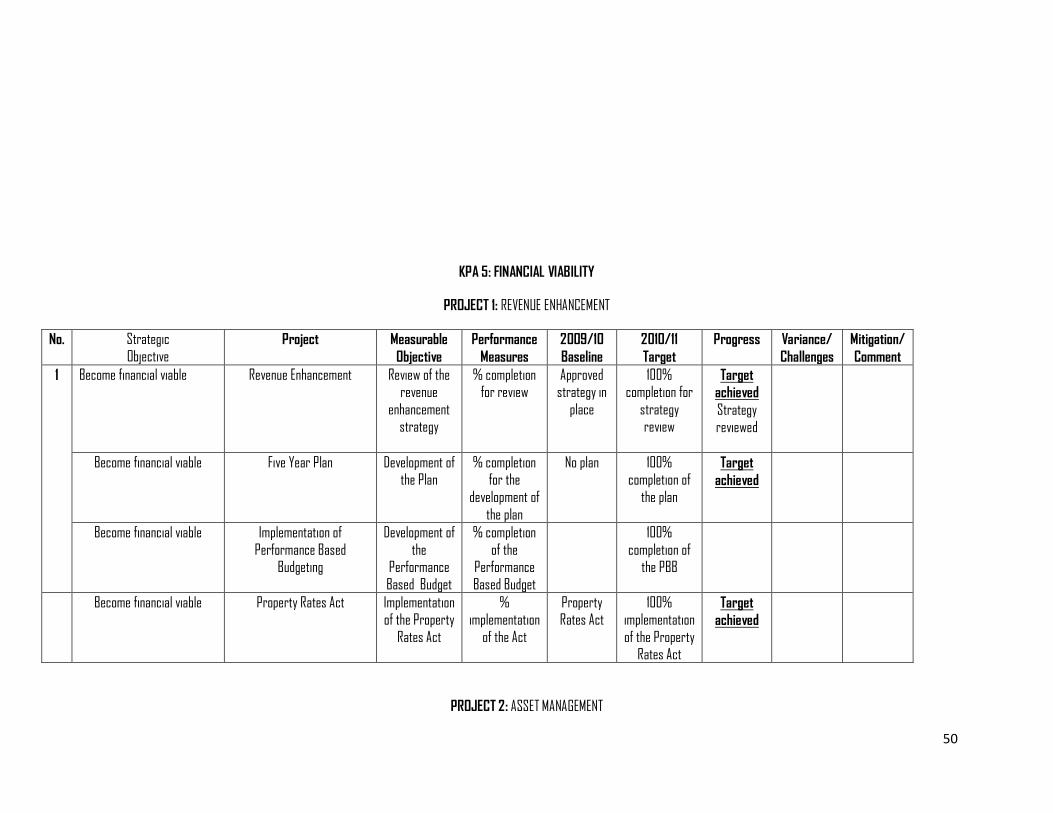
KPA 5: FINANCIAL VIABILITY
PROJECT 1: REVENUE ENHANCEMENT
No. Strategic
Objective Project Measurable
Objective
Performance
Measures
2009/10
Baseline
2010/11
Target
Progress Variance/
Challenges
Mitigation/
Comment
1
Become financial viable Revenue Enhancement Review of the revenue
enhancement strategy
% completion for review
Approved strategy in
place
100% completion for
strategy review
Target
achieved
Strategy
reviewed
Become financial viable Five Year Plan Development of the Plan
% completion for the
development of
the plan
No plan 100% completion of
the plan
Target
achieved
Become financial viable Implementation of
Performance Based Budgeting
Development of
the Performance
Based Budget
% completion
of the Performance
Based Budget
100%
completion of the PBB
Become financial viable Property Rates Act Implementation of the Property
Rates Act
% implementation
of the Act
Property Rates Act
100% implementation
of the Property Rates Act
Target
achieved
PROJECT 2: ASSET MANAGEMENT
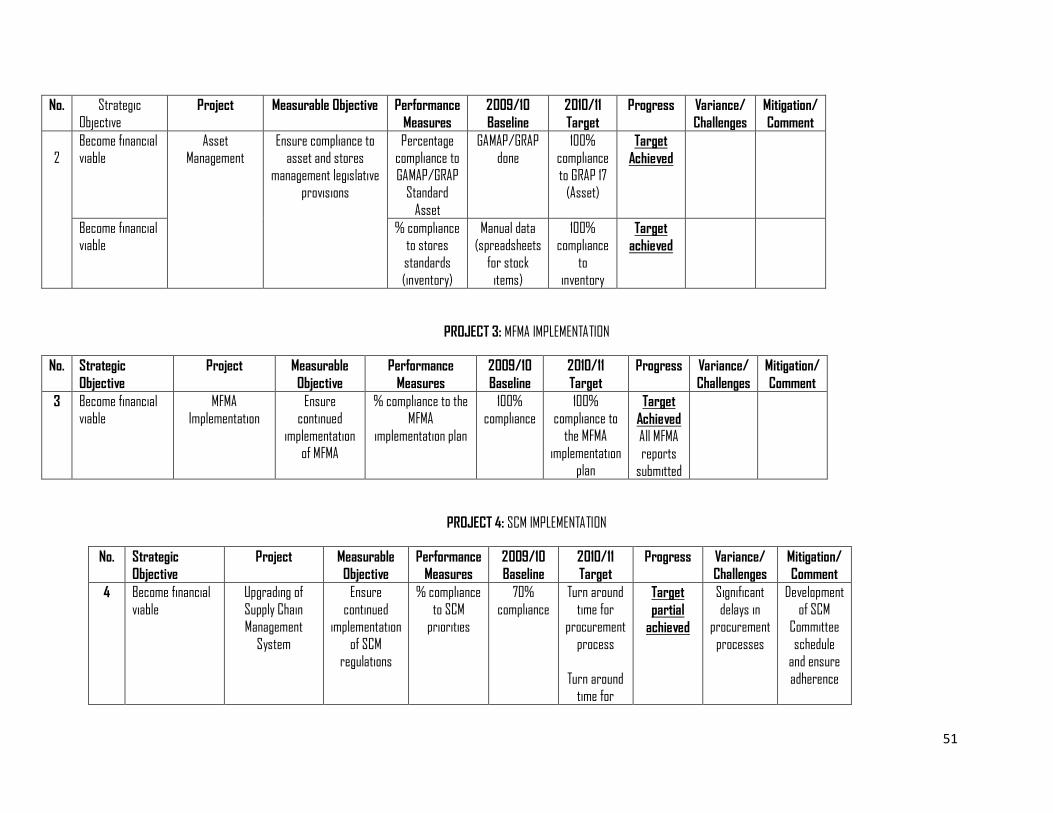
51
No. Strategic
Objective Project Measurable Objective Performance
Measures
2009/10
Baseline
2010/11
Target
Progress Variance/
Challenges
Mitigation/
Comment
2
Become financial viable
Asset Management
Ensure compliance to asset and stores
management legislative provisions
Percentage compliance to
GAMAP/GRAP Standard
Asset
GAMAP/GRAP done
100% compliance
to GRAP 17 (Asset)
Target
Achieved
Become financial viable
% compliance to stores
standards (inventory)
Manual data (spreadsheets
for stock items)
100% compliance
to inventory
Target
achieved
PROJECT 3: MFMA IMPLEMENTATION
No. Strategic
Objective Project Measurable
Objective
Performance
Measures
2009/10
Baseline
2010/11
Target
Progress Variance/
Challenges
Mitigation/
Comment
3 Become financial viable
MFMA Implementation
Ensure continued
implementation
of MFMA
% compliance to the MFMA
implementation plan
100% compliance
100% compliance to
the MFMA
implementation plan
Target
Achieved All MFMA
reports
submitted
PROJECT 4: SCM IMPLEMENTATION
No. Strategic
Objective Project Measurable
Objective
Performance
Measures
2009/10
Baseline
2010/11
Target
Progress Variance/
Challenges
Mitigation/
Comment
4 Become financial
viable Upgrading of
Supply Chain Management
System
Ensure
continued implementation
of SCM regulations
% compliance
to SCM priorities
70%
compliance
Turn around
time for procurement
process
Turn around time for
Target
partial
achieved
Significant
delays in procurement
processes
Development
of SCM Committee
schedule and ensure
adherence
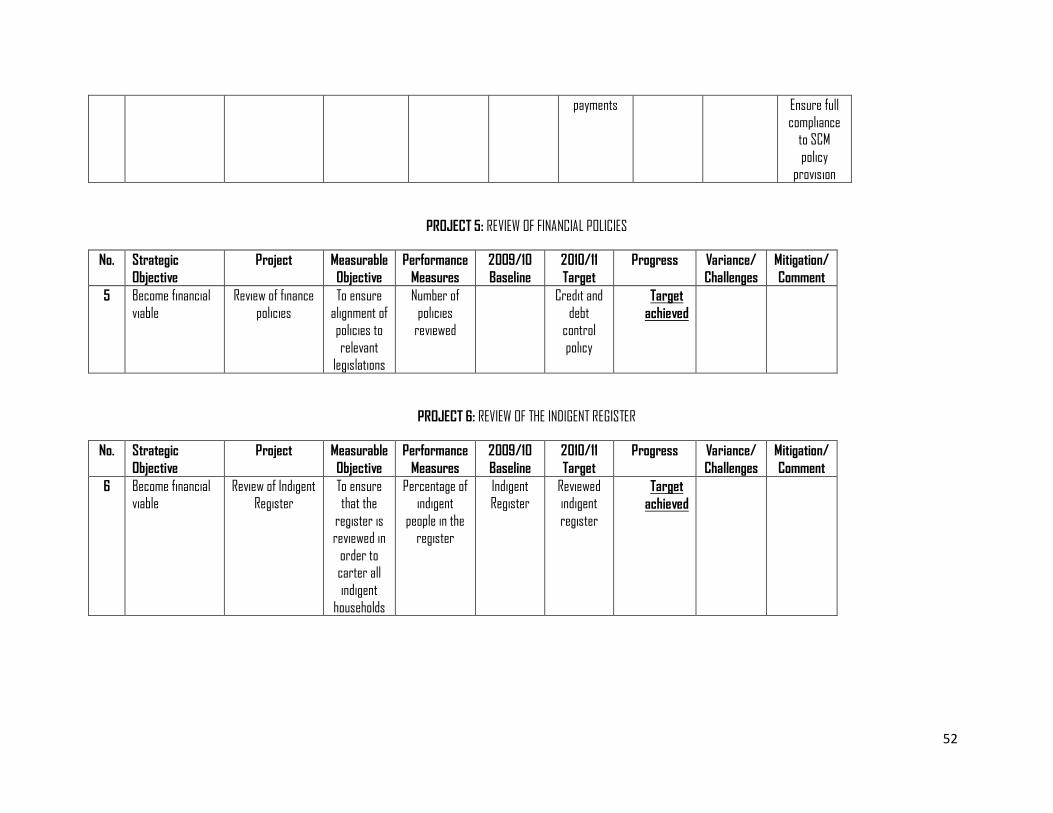
52
payments Ensure full
compliance to SCM
policy provision
PROJECT 5: REVIEW OF FINANCIAL POLICIES
No. Strategic
Objective Project Measurable
Objective
Performance
Measures
2009/10
Baseline
2010/11
Target
Progress Variance/
Challenges
Mitigation/
Comment
5 Become financial
viable Review of finance
policies
To ensure
alignment of policies to
relevant legislations
Number of
policies reviewed
Credit and
debt control
policy
Target
achieved
PROJECT 6: REVIEW OF THE INDIGENT REGISTER
No. Strategic
Objective Project Measurable
Objective
Performance
Measures
2009/10
Baseline
2010/11
Target
Progress Variance/
Challenges
Mitigation/
Comment
6 Become financial viable
Review of Indigent Register
To ensure that the
register is reviewed in
order to carter all
indigent
households
Percentage of indigent
people in the register
Indigent Register
Reviewed indigent
register
Target
achieved
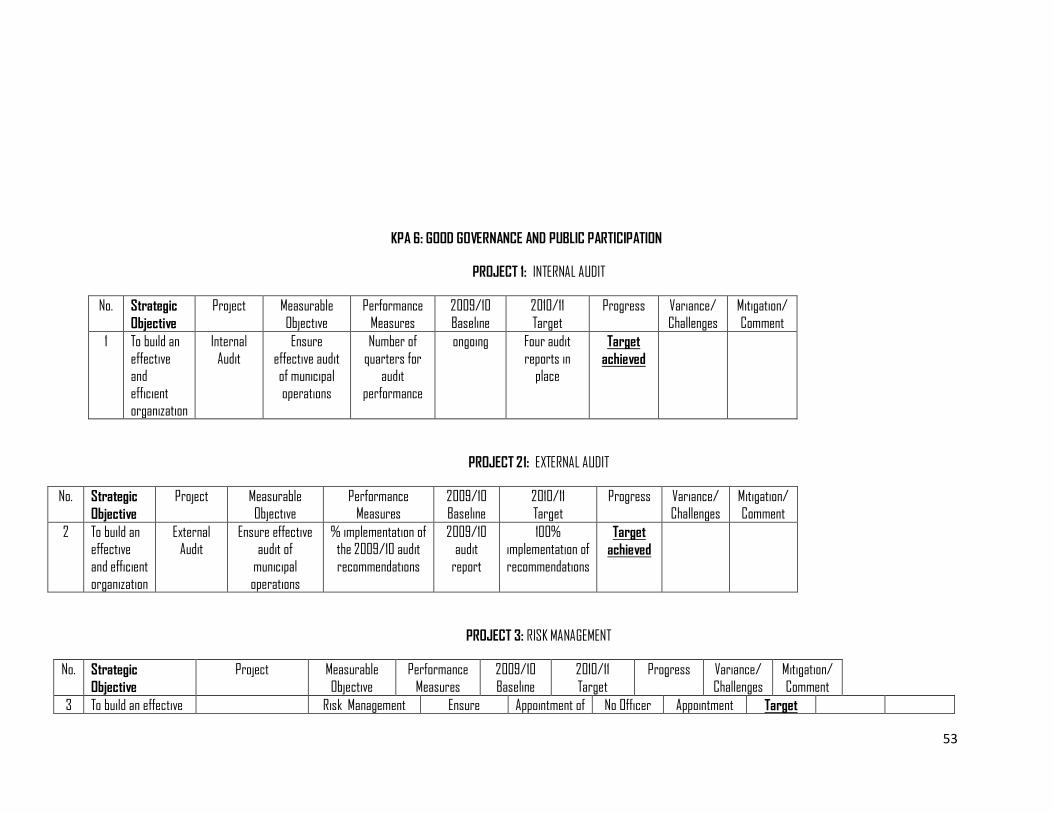
53
KPA 6: GOOD GOVERNANCE AND PUBLIC PARTICIPATION
PROJECT 1: INTERNAL AUDIT
No. Strategic
Objective Project Measurable
Objective
Performance
Measures
2009/10
Baseline
2010/11
Target
Progress Variance/
Challenges
Mitigation/
Comment
1 To build an
effective and
efficient organization
Internal
Audit
Ensure
effective audit of municipal
operations
Number of
quarters for audit
performance
ongoing Four audit
reports in place
Target
achieved
PROJECT 21: EXTERNAL AUDIT
No. Strategic
Objective Project Measurable
Objective
Performance
Measures
2009/10
Baseline
2010/11
Target
Progress Variance/
Challenges
Mitigation/
Comment
2 To build an effective
and efficient
organization
External Audit
Ensure effective audit of
municipal
operations
% implementation of the 2009/10 audit
recommendations
2009/10 audit
report
100% implementation of
recommendations
Target
achieved
PROJECT 3: RISK MANAGEMENT
No. Strategic
Objective Project Measurable
Objective
Performance
Measures
2009/10
Baseline
2010/11
Target
Progress Variance/
Challenges
Mitigation/
Comment
3 To build an effective Risk Management Ensure Appointment of No Officer Appointment Target
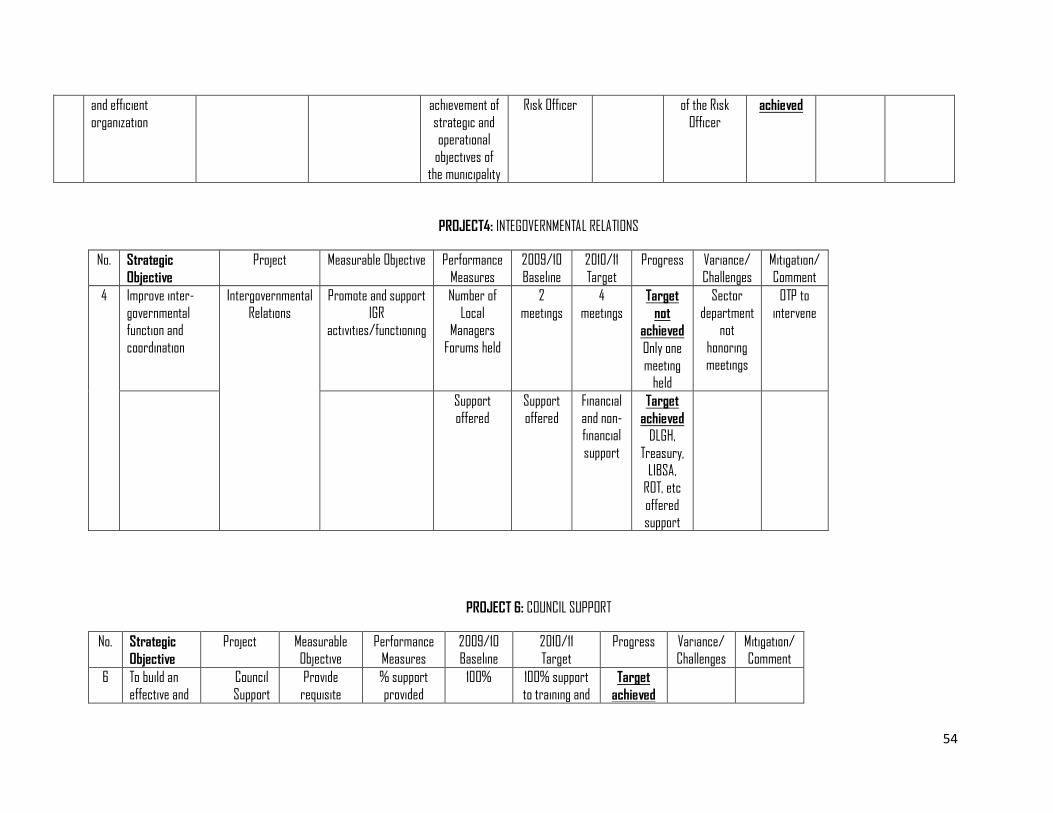
54
and efficient
organization
achievement of
strategic and operational
objectives of the municipality
Risk Officer of the Risk
Officer achieved
PROJECT4: INTEGOVERNMENTAL RELATIONS
No. Strategic
Objective Project Measurable Objective Performance
Measures
2009/10
Baseline
2010/11
Target
Progress Variance/
Challenges
Mitigation/
Comment
4 Improve inter-
governmental function and
coordination
Intergovernmental
Relations
Promote and support
IGR activities/functioning
Number of
Local Managers
Forums held
2
meetings
4
meetings Target
not
achieved
Only one
meeting held
Sector
department not
honoring meetings
OTP to
intervene
Support
offered
Support
offered
Financial
and non-financial
support
Target
achieved DLGH,
Treasury,
LIBSA, ROT, etc
offered support
PROJECT 6: COUNCIL SUPPORT
No. Strategic
Objective Project Measurable
Objective Performance
Measures 2009/10 Baseline
2010/11 Target
Progress Variance/ Challenges
Mitigation/ Comment
6 To build an
effective and
Council
Support
Provide
requisite
% support
provided
100% 100% support
to training and Target
achieved
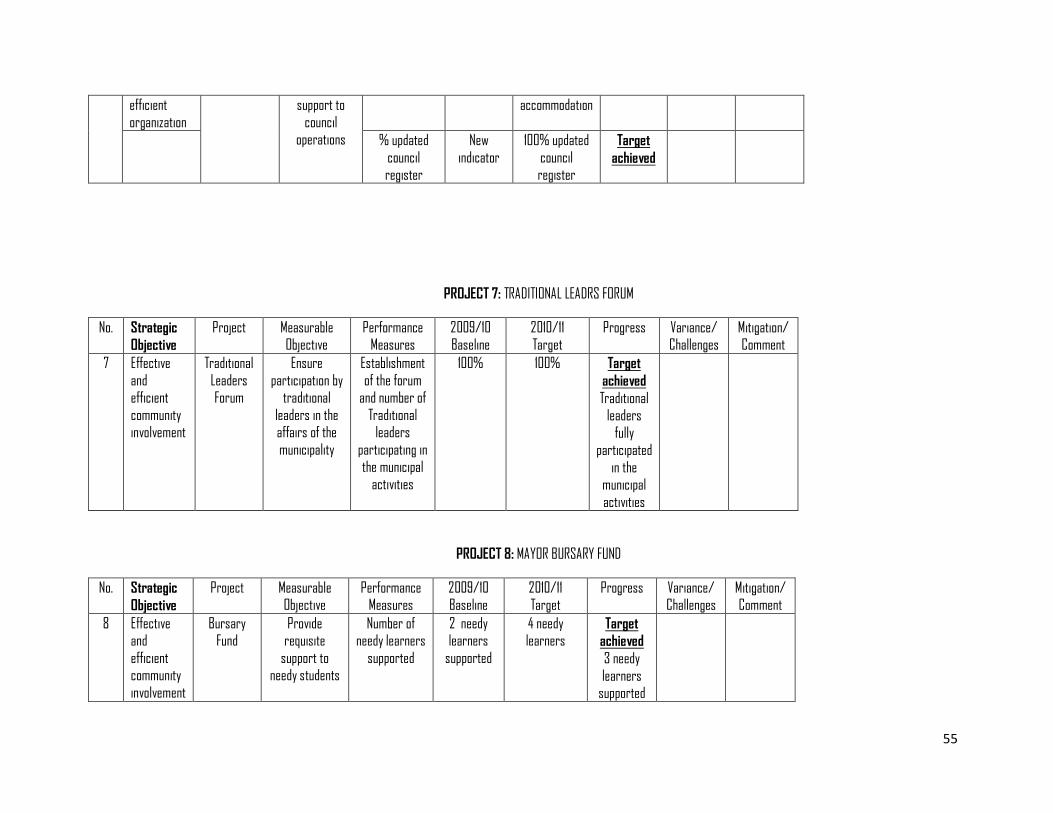
55
efficient
organization
support to
council operations
accommodation
% updated
council register
New
indicator
100% updated
council register
Target
achieved
PROJECT 7: TRADITIONAL LEADRS FORUM
No. Strategic
Objective Project Measurable
Objective Performance
Measures 2009/10 Baseline
2010/11 Target
Progress Variance/ Challenges
Mitigation/ Comment
7 Effective
and efficient
community involvement
Traditional
Leaders Forum
Ensure
participation by traditional
leaders in the affairs of the
municipality
Establishment
of the forum and number of
Traditional leaders
participating in the municipal
activities
100% 100% Target
achieved
Traditional leaders
fully participated
in the municipal
activities
PROJECT 8: MAYOR BURSARY FUND
No. Strategic
Objective Project Measurable
Objective Performance
Measures 2009/10 Baseline
2010/11 Target
Progress Variance/ Challenges
Mitigation/ Comment
8 Effective and
efficient community
involvement
Bursary Fund
Provide requisite
support to needy students
Number of needy learners
supported
2 needy learners
supported
4 needy learners
Target
achieved
3 needy
learners supported
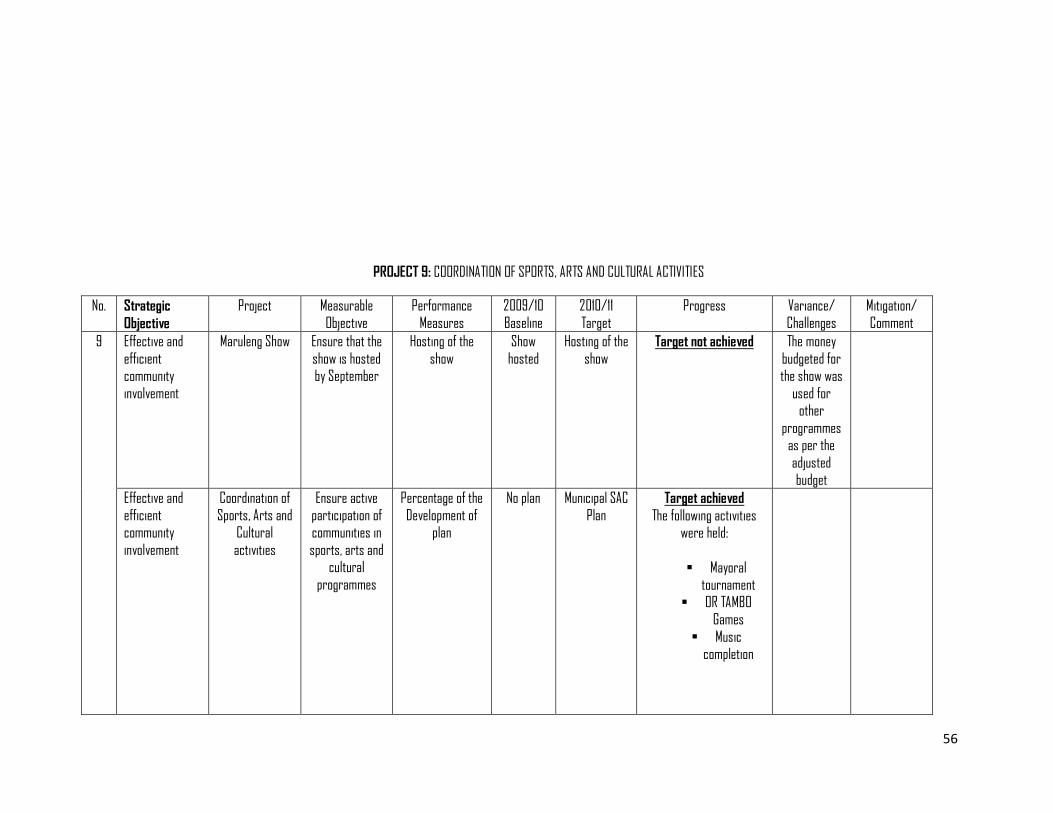
56
PROJECT 9: COORDINATION OF SPORTS, ARTS AND CULTURAL ACTIVITIES
No. Strategic
Objective Project Measurable
Objective
Performance
Measures
2009/10
Baseline
2010/11
Target
Progress Variance/
Challenges
Mitigation/
Comment
9 Effective and
efficient community
involvement
Maruleng Show Ensure that the
show is hosted by September
Hosting of the
show
Show
hosted
Hosting of the
show Target not achieved The money
budgeted for the show was
used for other
programmes as per the
adjusted budget
Effective and
efficient community
involvement
Coordination of
Sports, Arts and Cultural
activities
Ensure active
participation of communities in
sports, arts and cultural
programmes
Percentage of the
Development of plan
No plan Municipal SAC
Plan Target achieved
The following activities were held:
Mayoral tournament
OR TAMBO Games
Music completion
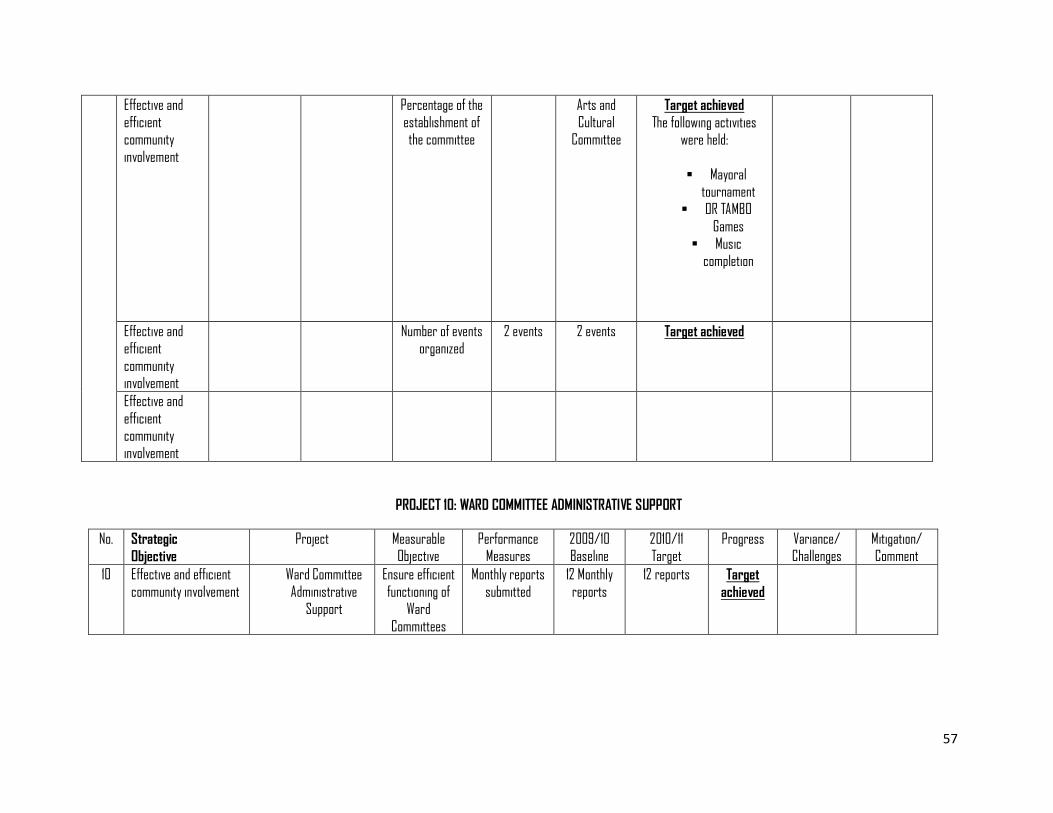
57
Effective and
efficient community
involvement
Percentage of the
establishment of the committee
Arts and
Cultural Committee
Target achieved
The following activities were held:
Mayoral tournament
OR TAMBO Games
Music completion
Effective and efficient
community involvement
Number of events organized
2 events 2 events Target achieved
Effective and
efficient community
involvement
PROJECT 10: WARD COMMITTEE ADMINISTRATIVE SUPPORT
No. Strategic
Objective Project Measurable
Objective Performance
Measures 2009/10 Baseline
2010/11 Target
Progress Variance/ Challenges
Mitigation/ Comment
10 Effective and efficient
community involvement Ward Committee
Administrative Support
Ensure efficient
functioning of Ward
Committees
Monthly reports
submitted
12 Monthly
reports
12 reports Target
achieved
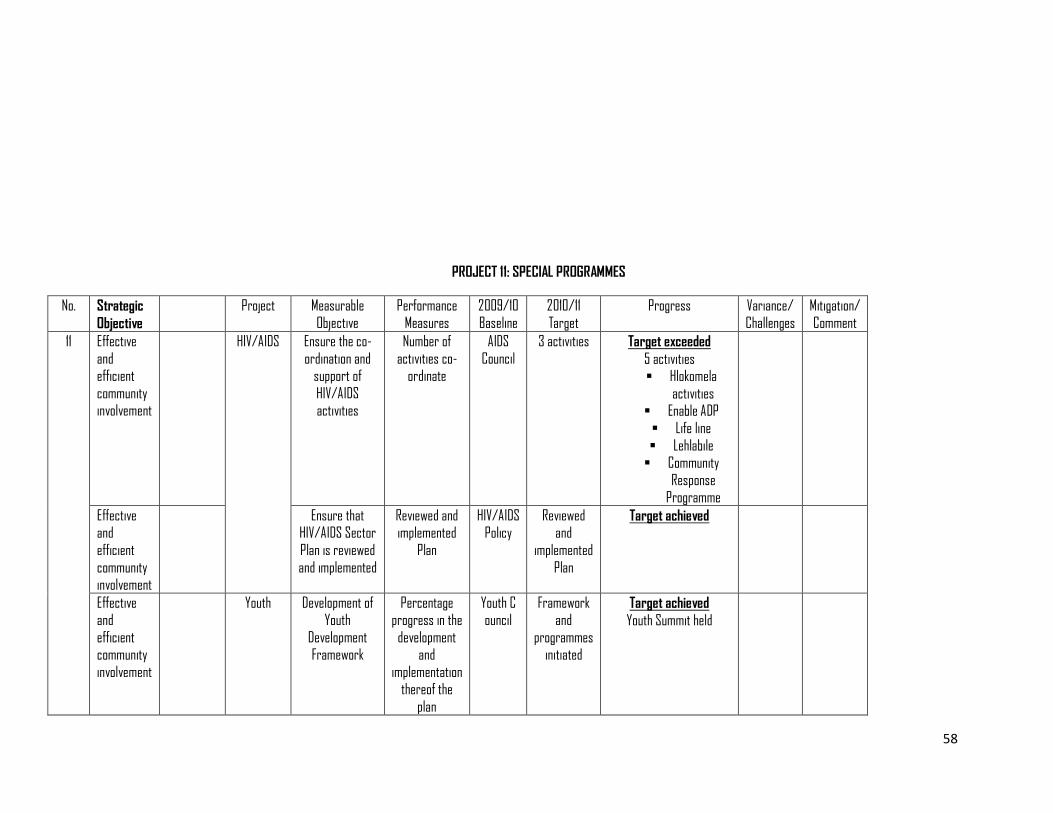
58
PROJECT 11: SPECIAL PROGRAMMES
No. Strategic
Objective Project Measurable
Objective
Performance
Measures
2009/10
Baseline
2010/11
Target
Progress Variance/
Challenges
Mitigation/
Comment
11 Effective
and efficient
community involvement
HIV/AIDS Ensure the co-
ordination and support of
HIV/AIDS activities
Number of
activities co-ordinate
AIDS
Council
3 activities Target exceeded
5 activities Hlokomela
activities Enable ADP
Life line
Lehlabile Community
Response Programme
Effective and
efficient
community involvement
Ensure that HIV/AIDS Sector
Plan is reviewed
and implemented
Reviewed and implemented
Plan
HIV/AIDS Policy
Reviewed and
implemented
Plan
Target achieved
Effective and
efficient community
involvement
Youth Development of Youth
Development Framework
Percentage progress in the
development and
implementation thereof the
plan
Youth C ouncil
Framework and
programmes initiated
Target achieved
Youth Summit held
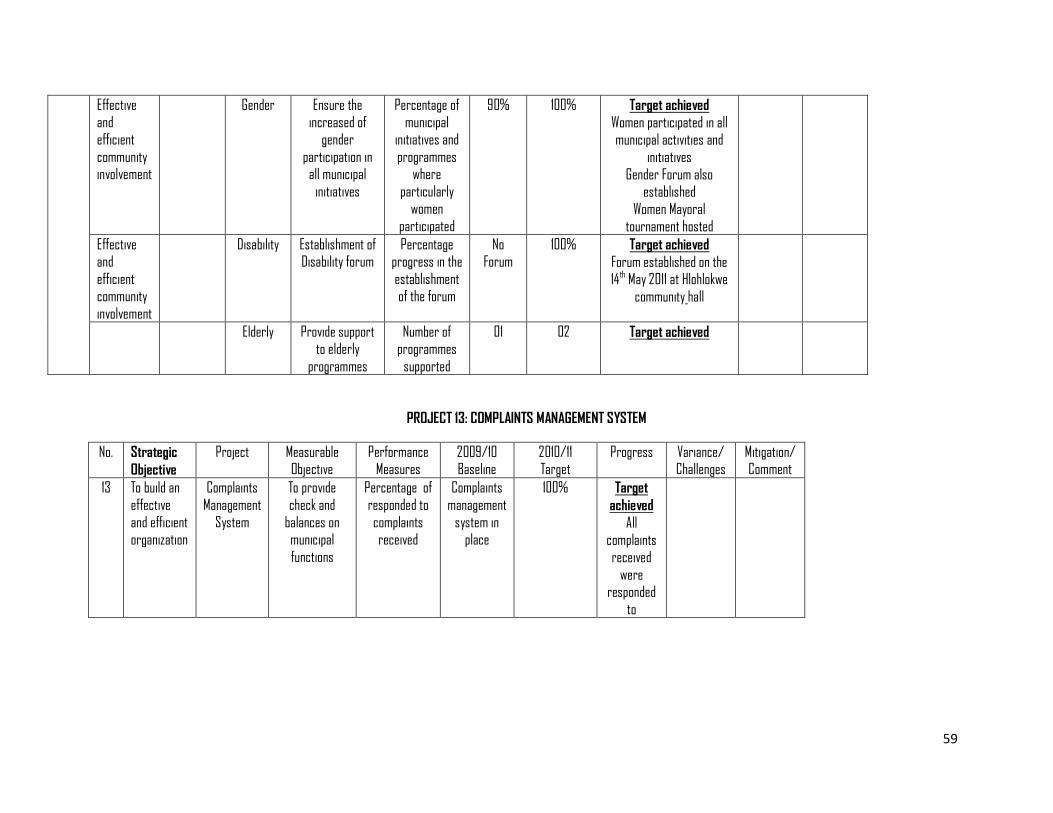
59
Effective
and efficient
community involvement
Gender Ensure the
increased of gender
participation in all municipal
initiatives
Percentage of
municipal initiatives and
programmes where
particularly women
participated
90% 100% Target achieved
Women participated in all municipal activities and
initiatives
Gender Forum also established
Women Mayoral tournament hosted
Effective and
efficient community
involvement
Disability Establishment of Disability forum
Percentage progress in the
establishment of the forum
No Forum
100% Target achieved
Forum established on the 14th May 2011 at Hlohlokwe
community hall
Elderly Provide support to elderly
programmes
Number of programmes
supported
01 02 Target achieved
PROJECT 13: COMPLAINTS MANAGEMENT SYSTEM
No. Strategic
Objective Project Measurable
Objective Performance
Measures 2009/10 Baseline
2010/11 Target
Progress Variance/ Challenges
Mitigation/ Comment
13 To build an
effective
and efficient organization
Complaints
Management
System
To provide
check and
balances on municipal
functions
Percentage of
responded to
complaints received
Complaints
management
system in place
100% Target
achieved
All complaints
received
were responded
to
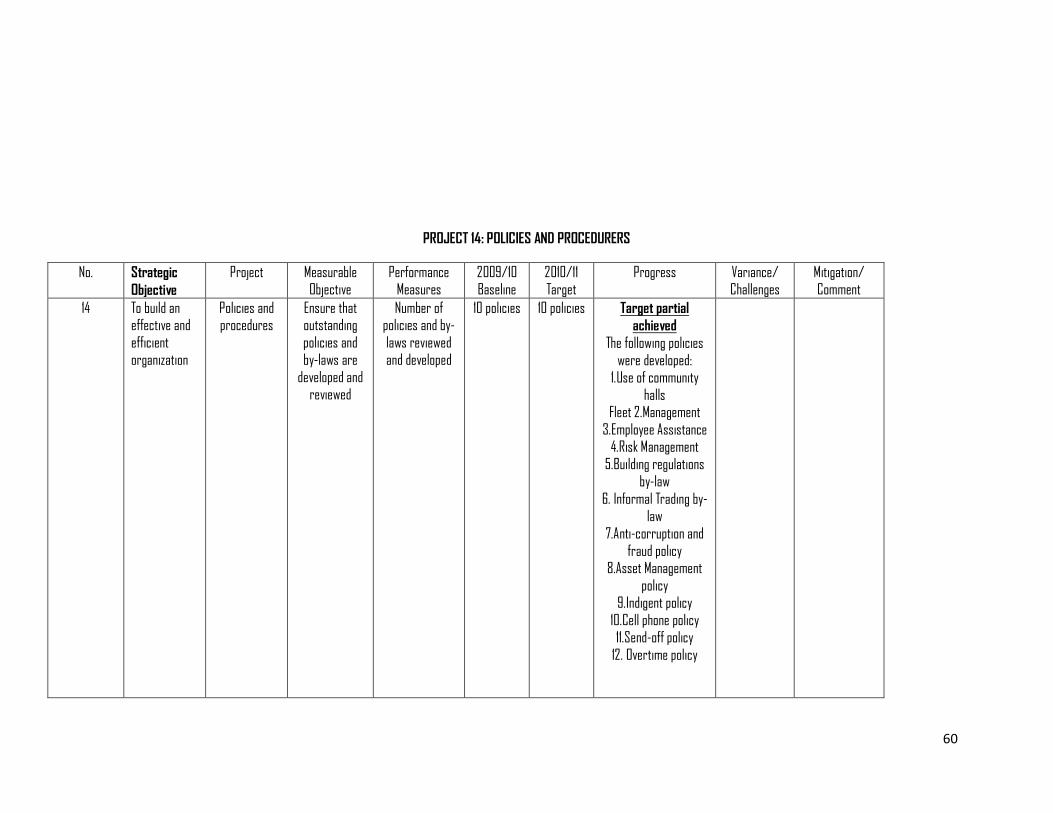
60
PROJECT 14: POLICIES AND PROCEDURERS
No. Strategic
Objective Project Measurable
Objective Performance
Measures 2009/10 Baseline
2010/11 Target
Progress Variance/ Challenges
Mitigation/ Comment
14 To build an effective and
efficient organization
Policies and procedures
Ensure that outstanding
policies and by-laws are
developed and reviewed
Number of policies and by-
laws reviewed and developed
10 policies 10 policies Target partial
achieved
The following policies
were developed: 1.Use of community
halls Fleet 2.Management
3.Employee Assistance 4.Risk Management
5.Building regulations by-law
6. Informal Trading by-law
7.Anti-corruption and
fraud policy 8.Asset Management
policy 9.Indigent policy
10.Cell phone policy 11.Send-off policy
12. Overtime policy
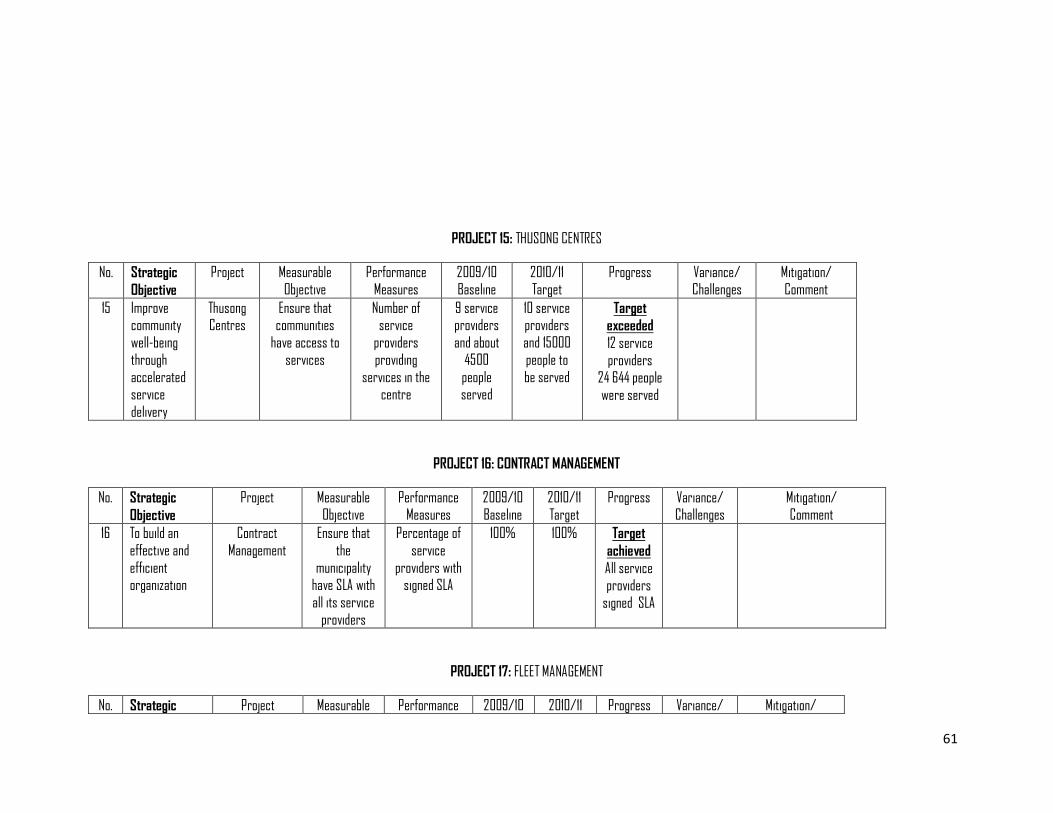
61
PROJECT 15: THUSONG CENTRES
No. Strategic
Objective Project Measurable
Objective Performance
Measures 2009/10 Baseline
2010/11 Target
Progress Variance/ Challenges
Mitigation/ Comment
15 Improve community
well-being through
accelerated service
delivery
Thusong Centres
Ensure that communities
have access to services
Number of service
providers providing
services in the centre
9 service providers
and about 4500
people served
10 service providers
and 15000 people to
be served
Target
exceeded
12 service
providers 24 644 people
were served
PROJECT 16: CONTRACT MANAGEMENT
No. Strategic
Objective Project Measurable
Objective Performance
Measures 2009/10 Baseline
2010/11 Target
Progress Variance/ Challenges
Mitigation/ Comment
16 To build an
effective and
efficient organization
Contract
Management
Ensure that
the
municipality have SLA with
all its service providers
Percentage of
service
providers with signed SLA
100% 100% Target
achieved
All service providers
signed SLA
PROJECT 17: FLEET MANAGEMENT
No. Strategic Project Measurable Performance 2009/10 2010/11 Progress Variance/ Mitigation/
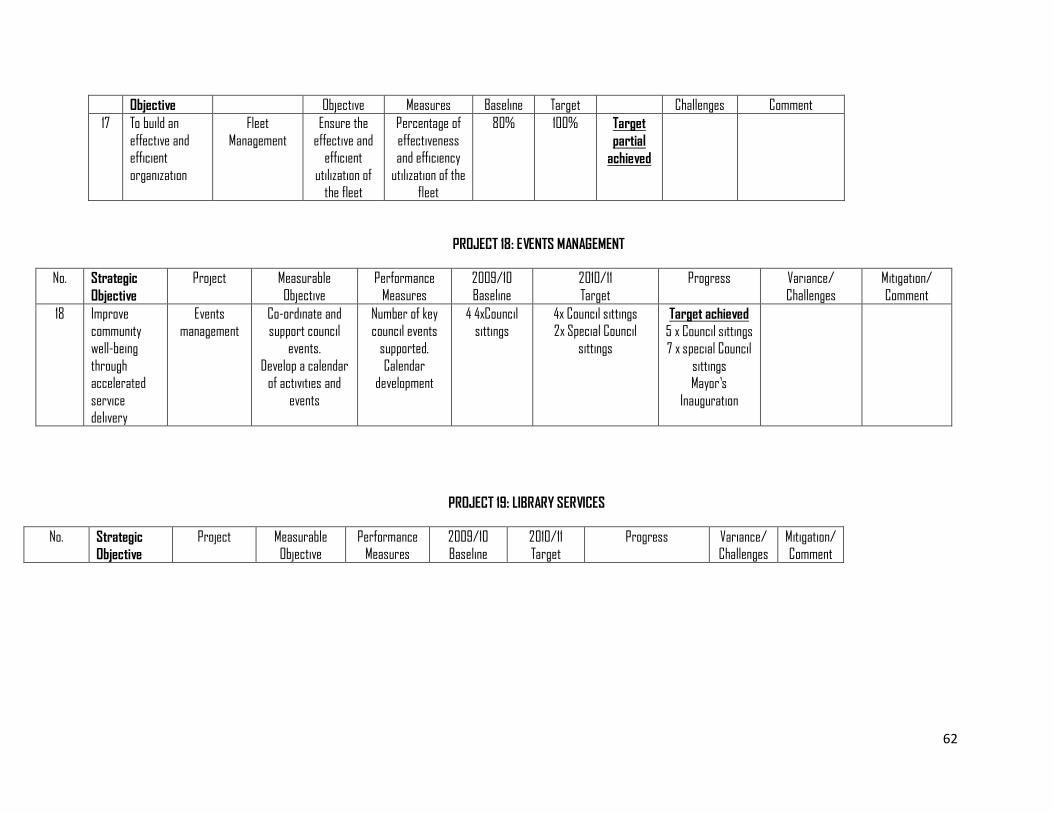
62
Objective Objective Measures Baseline Target Challenges Comment
17 To build an
effective and efficient
organization
Fleet
Management
Ensure the
effective and efficient
utilization of the fleet
Percentage of
effectiveness and efficiency
utilization of the fleet
80% 100% Target
partial
achieved
PROJECT 18: EVENTS MANAGEMENT
No. Strategic
Objective Project Measurable
Objective
Performance
Measures
2009/10
Baseline
2010/11
Target
Progress Variance/
Challenges
Mitigation/
Comment
18 Improve community
well-being
through accelerated
service delivery
Events management
Co-ordinate and support council
events.
Develop a calendar of activities and
events
Number of key council events
supported.
Calendar development
4 4xCouncil sittings
4x Council sittings 2x Special Council
sittings
Target achieved
5 x Council sittings 7 x special Council
sittings Mayor’s
Inauguration
PROJECT 19: LIBRARY SERVICES
No. Strategic
Objective Project Measurable
Objective Performance
Measures 2009/10 Baseline
2010/11 Target
Progress Variance/ Challenges
Mitigation/ Comment
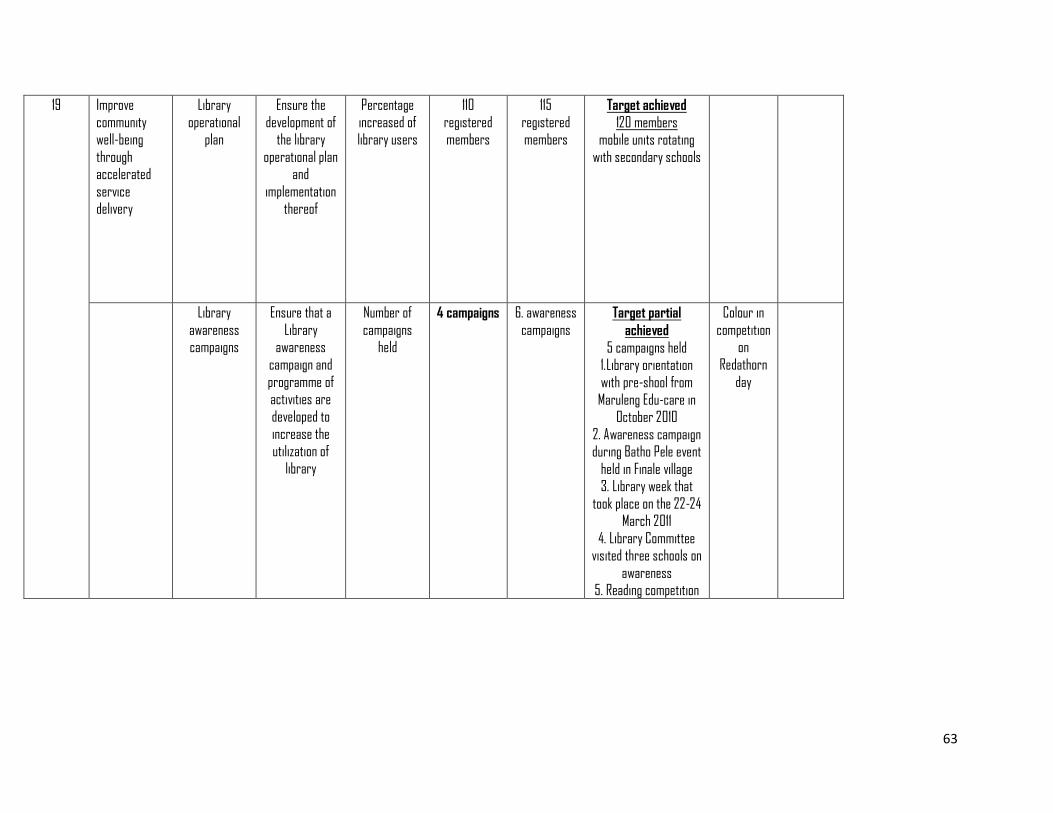
63
19 Improve
community well-being
through accelerated
service delivery
Library
operational plan
Ensure the
development of the library
operational plan and
implementation thereof
Percentage
increased of library users
110
registered members
115
registered members
Target achieved
120 members mobile units rotating
with secondary schools
Library
awareness campaigns
Ensure that a
Library awareness
campaign and
programme of activities are
developed to increase the
utilization of library
Number of
campaigns held
4 campaigns 6. awareness
campaigns Target partial
achieved
5 campaigns held 1.Library orientation
with pre-shool from
Maruleng Edu-care in October 2010
2. Awareness campaign during Batho Pele event
held in Finale village 3. Library week that
took place on the 22-24 March 2011
4. Library Committee visited three schools on
awareness 5. Reading competition
Colour in
competition on
Redathorn
day
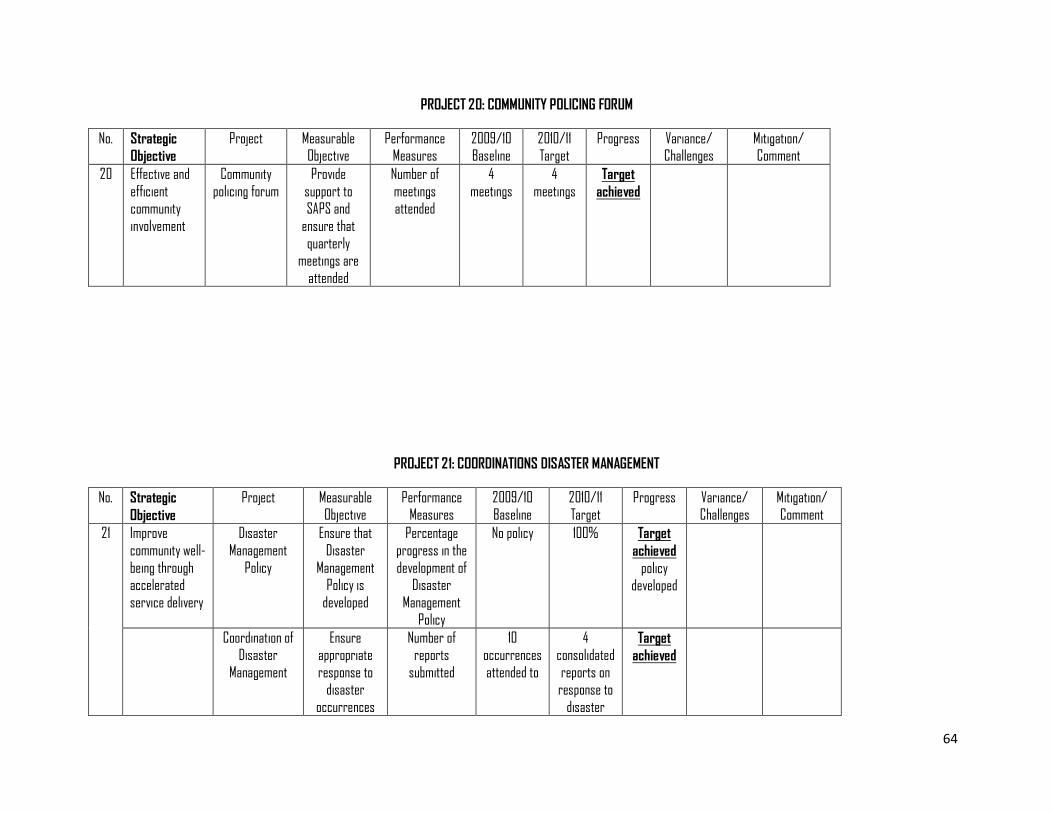
64
PROJECT 20: COMMUNITY POLICING FORUM
No. Strategic
Objective Project Measurable
Objective Performance
Measures 2009/10 Baseline
2010/11 Target
Progress Variance/ Challenges
Mitigation/ Comment
20 Effective and
efficient community
involvement
Community
policing forum
Provide
support to SAPS and
ensure that
quarterly meetings are
attended
Number of
meetings attended
4
meetings
4
meetings Target
achieved
PROJECT 21: COORDINATIONS DISASTER MANAGEMENT
No. Strategic
Objective Project Measurable
Objective Performance
Measures 2009/10 Baseline
2010/11 Target
Progress Variance/ Challenges
Mitigation/ Comment
21 Improve
community well-
being through accelerated
service delivery
Disaster
Management
Policy
Ensure that
Disaster
Management Policy is
developed
Percentage
progress in the
development of Disaster
Management Policy
No policy 100% Target
achieved
policy developed
Coordination of Disaster
Management
Ensure appropriate
response to disaster
occurrences
Number of reports
submitted
10 occurrences
attended to
4 consolidated
reports on response to
disaster
Target
achieved
65
occurrences
% responses to cases reported
for relief
100% 100% Target
achieved
CONCLUSION
This comprehensive report was able to paint a clear picture on areas of strengths as well as weaknesses. An action plan to address weaknesses pointed out in the report will be
developed once we get an opinion from the Auditor-General. When the content assessment of the IDPs in the Province was done, the comments of the MEC for Local Government and
Housing gave our IDP high crediting rating. The high IDP credibility rating the municipality is an indicator that demonstrates that the municipality is ready towards contributing in the
achievement of Outcome 9 which focuses on:
“A responsive, accountable, effective and efficient local government system”
……………………………………………… 7th April 2012

66
RAMOTHWALA R.J
MUNICIPAL MANAGER