Embed Size (px)
Citation preview


2 SAP Half-Year Report 2019
Table of Contents
Introductory Notes 3
Consolidated Half-Year Management Report 4
Consolidated Half-Year Financial Statements – IFRS 20
Notes to the Consolidated Half-Year Financial Statements 26
Supplementary Financial Information 43
General Information 48
Additional Information 49

SAP Half-Year Report 2019 3
Introductory Notes
This half-year group report meets the requirements of German Accounting Standard No. 16 “Half-yearly Financial Reporting” (GAS 16).
We prepared the financial data in the Half-Year Report section for SAP SE and its subsidiaries in accordance with International Financial
Reporting Standards (IFRS). In doing so, we observed the IFRS both as issued by the International Accounting Standards Board (IASB) and
as endorsed by the European Union (EU). This does not apply to numbers expressly identified as non-IFRS. For additional IFRS and non-IFRS
information, see the Supplementary Financial Information section.
This half-year group report complies with the legal requirements in accordance with the German Securities Trading Act
(Wertpapierhandelsgesetz, WpHG) for a half-year financial report, and comprises the consolidated half-year management report,
condensed consolidated half-year financial statements, and the responsibility statement in accordance with the German Securities Trading
Act, section 115 (2).
This half-year financial report updates our consolidated financial statements 2018, presents significant events and transactions of the
first half of 2019, and updates the forward-looking information contained in our Management Report 2018. This half-year financial report
only includes half-year numbers, our quarterly numbers are available in the Quarterly Statement. Both the 2018 consolidated financial
statements and the 2018 management report are part of our Integrated Report 2018, which is available at www.sapintegratedreport.com.
All of the information in this half-year group report is unaudited. This means the information has been subject neither to any audit nor to
any review by an independent auditor.

4 SAP Half-Year Report 2019
Consolidated Half-Year Management Report
Strategy and Business ModelSAP’s strategy is to be “The Experience Company powered by the
Intelligent Enterprise.” This strategy represents an expansion of the
Intelligent Enterprise to include a new category, called Experience
Management. Experience Management focuses on obtaining and
tapping into the value of outside-in customer, employee, product,
and brand feedback in real time to continuously improve the
experiences businesses deliver. For a detailed description, see our
Integrated Report 2018.
Intelligent Enterprise Framework
Products, Research & Development, and Services
Our integrated end-to-end portfolio enables an intelligent
enterprise by offering business value, data-driven innovation, rich
customer insights, and embedded intelligence. Our software,
technologies, and services address the three core elements of the
intelligent enterprise – digital platform, intelligent suite, and
intelligent technologies – for the 25 industries we serve.
In January 2019, SAP extended its portfolio with the acquisition
of Qualtrics International Inc. (Qualtrics). A market leader in the
experience management (XM) software category, Qualtrics provides
solutions that enable organizations to thrive in today’s experience
economy. The acquisition allows us to combine experience data (X-
data) from Qualtrics with operational data (O-data) from SAP to help
businesses deliver exceptional customer, employee, product and
brand experiences.
This chapter presents a snapshot of innovation in SAP product
development and services during the first half of 2019 and is
intended to supplement the SAP Integrated Report 2018.
Intelligent Suite
Network and Spend Management
In the first half of 2019, we focused on strengthening the already
tight integration between our network and spend management
solutions and the digital core, to deliver end-to-end value chain
processing and help customers better manage the three primary
categories of spending.
SAP Ariba
We announced partnerships with Barclaycard Commercial
Payments and American Express in 2019, establishing new payment
and financing options on the SAP Ariba network. Further innovation
in the first half of this year includes updates to the following solution
extension:
– SAP Process Mining by Celonis delivers enhanced procure-to-
pay automation features. A procurement operations desk
capability was launched to support shared service operators. In
addition, new supply chain functionality was introduced to help
advanced packaging and handling units better manage material
shipments.

SAP Half-Year Report 2019 5
SAP Concur
SAP Concur innovation in the first half of 2019 includes the
following:
– The Concur TripLink Web service is now connected with HRS, a
global hotel solutions provider, enabling users to view corporate
booking information through the Web and on mobile devices.
– The TripIt from Concur Web service delivered shortcuts for Siri,
the Apple iOS virtual assistant, so that detailed travel plans can
be generated for users who have visual impairments or for those
on the go.
– The Expense Pay Global Web service introduced Western Union
as a payment processing partner, opening up a pay solution for
public sector customers in the United States.
– The ExpenseIt mobile app employs machine learning and image
recognition to capture receipts and enable real-time processing
on the mobile device.
– The Concur Invoice solution has similarly adopted machine
learning capabilities, courtesy of SAP Leonardo technology, to
deliver improved accuracy.
SAP Fieldglass
SAP Fieldglass Candidate Link is a new mobile application that
enables recruiters to quickly learn about candidate availability,
allowing candidates to track opportunities and respond from their
mobile devices. The application features a virtual assistant, to give
users a more interactive and conversational experience.
People Engagement
SAP SuccessFactors
In the first half of 2019, we enriched the SAP SuccessFactors
HCM Suite with three new solutions to unlock a new chapter of
employee XM worldwide – SAP Qualtrics Employee Engagement,
SAP Qualtrics Employee Lifecycle, and SAP Qualtrics Employee
Benefits Optimizer.
SAP also combined the power of X-data and O-data by joining
forces with Thrive Global to launch the Thrive XM Index – a
pioneering diagnostic tool that recognizes and measures companies
that deliver a meaningful people experience, coupled with strong
business performance.
Digital Core
SAP S/4HANA
The SAP business suite supports the intelligent enterprise with
emerging technologies to drive next-generation business practices.
SAP S/4HANA innovation with machine learning in the first half
of 2019 includes the following capabilities:
– Intelligent Accruals Management provides automated
conversion of purchase-order data into posted accruals, allowing
customers to close their books faster.
– Defect Code Proposal uses machine learning to help quality
management technicians perform their daily checks faster, with
increased data quality and automated defect categorization
based on free-text entry.
– Financial Journal Entry with Intelligent Robotic Process
Automation is designed to collect, extract, and validate financial
journal data from e-mails and make mass uploads to
SAP S/4HANA.
Manufacturing and Supply Chain
In April 2019, we announced a partnership with Uber
Technologies, Inc., an American multinational transportation
network company, to help increase visibility and transparency for
providers and consumers in the freight industry. By integrating Uber
Freight app technology into the SAP Logistics Business Network –
an offering built on SAP Cloud Platform and SAP HANA Data
Management – SAP gives customers access to transportation rates
from Uber’s digitally activated carrier network. Users can get real-
time quotes and secure guaranteed freight capacity, greatly
simplifying load management and execution.
Customer Experience
SAP C/4HANA
A year since its launch, SAP C/4HANA, our customer experience
suite, has proven to be a key growth driver for SAP. Innovation in the
first half of 2019 includes the following:
– Qualtrics capabilities have been integrated into the
SAP C/4HANA suite – specifically within the commerce,
marketing, sales, and service offerings. These capabilities enable
an intelligent enterprise to gain live feedback, customer
sentiment, and actionable insights at every step of the customer
journey and deliver personalized customer experiences. For
example, by utilizing Qualtrics, the SAP Commerce Cloud
solution now helps intelligent enterprises to absorb customer
feedback and make their Web sites and mobile apps easier to
use. Online customers are then more likely to complete their
purchases and less inclined to abandon shopping carts.
– SAP C/4HANA Foundation is a technology layer designed to
infuse SAP C/4HANA with openness and extensibility, enabling
SAP customers to rapidly implement new business models,
provide an engaging customer experience, and keep operational
costs low.
– The SAP Litmos and SAP Litmos, CX edition solutions delivered
updates designed to develop sales and customer service mastery
to our mobile-friendly, agile learning platform.
Digital Platform
SAP HANA
SAP HANA remains an integral part of the digital platform at the
heart of every intelligent enterprise. Innovation in this space in the
first half of 2019 includes the delivery of the following:
– Hexagonal grid clustering for spatial analytics is a way to
process geospatial data, so that the user can visualize things
such as escape routes that avoid hazards in emergency
situations, or the optimal paths for utility pipelines that avoid
restricted areas. With SAP HANA, developers can use a single
SQL query to process millions of geo-coordinates in seconds and
cluster them effectively.
– Native storage extension is designed to support large
SAP HANA installations at a lower total cost of ownership (TCO),
by giving customers cost-effective storage for, and ready access
to, vast reservoirs of data that are still needed in the enterprise,
but seldom used, without fully loading that data into memory.
In addition, SAP opened a new chapter in our 30-year
collaboration with Intel, as SAP HANA was unveiled as the first
database platform optimized for the new Intel Optane DC persistent
memory technology.
SAP Cloud Platform
SAP Cloud Platform continues to evolve as a business technology
platform, enabling customers to easily extend and integrate SAP
software. Our multi-cloud strategy gives customers the freedom to

6 SAP Half-Year Report 2019
choose infrastructure from market-leading hyperscalers without
getting locked in to a specific vendor.
Innovation in the first half of 2019 includes the following:
– SAP Cloud Platform Extension Factory allows customers and
partners to create cloud-native software extensions for the
intelligent enterprise.
– SAP Cloud Platform enterprise trial offers customers a
consumption-based account to explore the entire SAP Cloud
Platform services portfolio.
– SAP Cloud Platform Estimator makes it faster and easier for
prospective customers to create customized cost estimates.
In addition, the SAP Application Programming Interface (API)
Business Hub now offers over 950 APIs, more than 1,800 Core Data
Services (CDS) views, and over 1,200 integration artifacts, helping
customers to significantly reduce their implementation and
integration efforts.
Intelligent Technologies
SAP Analytics Cloud
The SAP Analytics Cloud solution uses business intelligence (BI),
planning, and predictive analytics to deliver capabilities such as
simulation and automated discovery in BI, as well as storytelling and
predicted forecasts in planning. SAP Analytics Cloud, analytics
designer is a new capability that enables the development of
customized analytic applications based on existing content,
templates, or user stories. By making it easier for users to create
new analytic applications, we can extend the capabilities of existing
systems of record and further integrate analytics with transactional
data.
SAP Leonardo Artificial Intelligence
In 2018, SAP acquired Contextor SAS, a France-based pioneer in
the design of robotic process automation (RPA). This acquisition led
to the delivery of SAP Intelligent Robotic Process Automation in
the first half of 2019, enabling us to expand our SAP Leonardo
Artificial Intelligence (AI) portfolio. SAP Intelligent Robotic Process
Automation combines the potency of machine learning technology
with the chatbot-building capacity of SAP Conversational AI (CAI)
and our strengthened capabilities in RPA, tightly integrated into the
SAP digital core. This offering gives customers a complete
automation suite where software robots mimic humans by replacing
manual clicks, interpret text-heavy communications, and make
process suggestions to users.
SAP Leonardo Internet of Things
In March 2019, we released SAP Leonardo Internet of Things
(IoT), a solution that connects people with processes and things.
SAP gives customers the flexibility to choose the kind of
connectivity, infrastructure, and device management solutions they
want to use to bring their ‘thing’ data to SAP Leonardo IoT. SAP
Leonardo IoT then correlates the customer’s ‘thing’ data – from
sensors or telemetry, for example – with business data, to help the
customer better assess what is physically happening in their
business.
SAP Digital Business Services SAP Digital Business Services comprises a team of more than
22,500 employees serving customers in 180 countries. Our focus is
to enable an intelligent enterprise in the experience economy by
being the trusted partner for our customers and the SAP ecosystem.
To help SAP customers thrive, we provide tools and guidance across
three categories – continuous success, premium success, and
project success.
Continuous Success
We work to expedite the customer’s time to value on SAP
technology, delivering SAP Enterprise Support and SAP Preferred
Success services tailored for on-premise, hybrid, and cloud
implementations.
Premium Success
SAP MaxAttention was completely redesigned as New SAP
MaxAttention in 2018 and enhancements continued into 2019. This
revamped program helps customers turn ideas into value-based
predictable outcomes with precise business and technical guidance
– from innovation to operation. SAP ActiveAttention, on the other
hand, is a premium-level engagement program, similar to New SAP
MaxAttention, but designed for smaller businesses.
Project Success
During 2018 and 2019, we standardized our portfolio of services
to ensure project success. Many of these offerings are described in
the SAP Integrated Report 2018, and we strengthened this portfolio
in 2019 by incorporating the well-established SAP Innovative
Business Solutions, to help customers develop tailored, intelligent
applications.
Intelligent Tools
Our range of intelligent tools helps customers accelerate the
adoption of, and maximize investment from, their SAP solutions.
Most of these tools are described in the SAP Integrated Report
2018, with the following added to our portfolio in 2019:
– ABAP Test Cockpit enables customers to plan for efficient
custom code adaptation, while simplifying the process to remove
obsolete code.
– SAP S/4HANA Migration Cockpit helps users move data from
SAP or non-SAP systems and migrate from SAP ERP to
SAP S/4HANA.

SAP Half-Year Report 2019 7
Acquisitions In the first half of 2019, SAP acquired Qualtrics – a leading
provider of experience management (XM) solutions. By combining
Qualtrics products and SAP products, we aim to deliver an end-to-
end experience and operational management system to our
customers. For more information, see the Products, Research and
Development section and Note (D.1) of the Notes to the
Consolidated Half-Year Financial Statements.
Employees and Social Investments Our people are key in enabling our customers to successfully
become intelligent enterprises. For this reason, we strive to
understand the needs of today’s employees and how a 21st-century
organization must evolve to keep attracting, retaining, and growing
current and future talent. For a detailed description of our HR
strategy, see the Employees and Social Investments section in our
Integrated Report 2018.
We are passionate about developing deep and lasting
relationships. It is all about experiences for our key stakeholders
such as candidates, employees, managers, executives and alumni.
At the end of the first half of 2019, the employee retention rate was
still on a high level of 93.5% (compared to 94.3% at the end of the
first half of 2018 and 93.9% at the end of the year 2018). We define
retention as the ratio of the average number of employees minus the
employees who voluntarily departed, to the average number of
employees (in full-time equivalents or FTEs). Besides the aim to
keep our high Employee Engagement Index between 84% and 86%
also for 2019, one of SAP’s non-financial goals is to foster an
inclusive, bias-free workforce. Specifically, the SAP Executive Board
continues its commitment to increase the percentage of women in
management positions by 1% each year with a target of 30% by
year-end 2022. The ratio of women in management positions
continued its upward trajectory and reached 26.2% at the end of the
first half of 2019, compared to 25.8% at the end of June 2018 and
25.7% at the end of 2018.
On June 30, 2019, we had 98,332 full-time equivalent (FTE)
employees worldwide (June 30, 2018: 93,846; December 31, 2018:
96,498). For a breakdown of headcount by function and geography,
see Note (B1) of the Notes to the Consolidated Half-Year Financial
Statements.
Energy and Emissions In June 2019, we published the latest version of our Global
Environmental Policy, which illustrates SAP’s commitment towards
protecting the environment. The policy now includes our new goal to
phase out single-use plastic by 2020.
Over the past several years, we have worked to better
understand the connections between our energy consumption, its
related cost, and the resulting environmental impact. Today, we
measure and address our energy usage throughout SAP, as well as
our greenhouse gas (GHG) emissions across our entire value chain.
We have calculated that over the last three years, energy efficiency
initiatives have contributed to a cumulative cost avoidance of
€237.6 million compared to a business-as-usual extrapolation,
€38.4 million of which have been avoided in 2019.
Our goal is to become carbon neutral by 2025. SAP’s GHG
emissions for the first half of 2019 totaled 185 kilotons of CO2
compared to 175 kilotons in the first half of 2018. This increase is
primarily due to an increase in our business flights.
To gain insight into our efficiency as we grow, we also measure
our emissions per employee and per euro of revenue. During the
first half of 2019, our GHG emissions (in tons) per employee was 3.2
(compared to 3.7 during the first half of 2018), and our GHG
emissions (in grams) per euro revenue was 12.2 (compared to 14.7
during the first half of 2018) (rolling four quarters).
In recognition of the exemplary actions SAP has taken to embed
sustainability across its business worldwide, SAP was included in
various ratings and rankings. In the first half of 2019, SAP was once
again ranked in the Euronext Vigeo index: Europe 120, which lists
companies achieving the most advanced environmental, social and
governance (ESG) performances. SAP was also once again granted
the best ESG rating “AAA” by MSCI (Morgan Stanley Capital
International).
Organization and Changes in Management SAP Executive Board member Bernd Leukert, who co-led the
SAP Digital Business Services organization together with Michael
Kleinemeier, left SAP at the end of March 2019. The Supervisory
Board decided to extend the Executive Board contract of Michael
Kleinemeier through 2020.
In April 2019, Executive Board member Robert Enslin, who
served as president of the Cloud Business Group, left SAP. Executive
Board member Jennifer Morgan succeeded Robert Enslin as
president of the Cloud Business Group, and Executive Board
member Adaire Fox-Martin took over sole responsibility as president
of the Board area Global Customer Operations.
Financial Performance: Review and Analysis
Economy and the Market
Global Economic Trends
The global economic growth momentum softened in the first half
of 2019. According to the European Central Bank (ECB) in its most
recent Economic Bulletin1), this was due to continued weakness in
global manufacturing activity and in the service sector. The recent
escalation of the trade dispute between the United States and China
took its toll on the global economy as well.
In the Europe, Middle East, and Africa (EMEA) region, the euro
area economy performed better than expected in the first quarter of
2019, says the ECB. However, global headwinds led to weaker
growth afterwards. This slowdown in the euro area also weighed on
economic growth in central and eastern European countries. The
Russian economy still had to operate under international sanctions.
As for the Americas region, a partial federal government
shutdown in the United States subdued domestic demand in that
country at the beginning of the year, reports the ECB. The U.S.
economy as a whole nevertheless grew more than expected in the
first half of 2019. In Brazil, fiscal constraints and uncertainties about
the implementation of a reform agenda weighed on investments
since the beginning of the year.
The Asia Pacific Japan (APJ) region, the ECB reports, showed
that while the Japanese economy grew more than expected in the
first quarter, underlying growth momentum remained muted. In
China, meanwhile, economic growth decelerated gradually in spite
of expansionary policy measures and a positive net trade
contribution as imports decreased more than exports.

8 SAP Half-Year Report 2019
The IT Market
By the middle of 2019, digital transformation had turned from a
defensive concept for the sake of innovation into an offensive
strategy for the sake of business, says International Data
Corporation (IDC), a U.S.-based market research firm.2) This is in
line with what was anticipated by IDC in our 2018 annual report.
As of mid-2019, approximately one-quarter of the companies in
an IDC maturity benchmark had reached one of the top two levels of
digital maturity.2) Nearly 50% had an integrated, long-term strategy
for digital transformation. According to IDC, this means that
companies showed greater clarity about what the future enterprise
will look like and what it will take to compete in redefined industries.
Worldwide, adoption of the customized on-premise enterprise
applications of the past few decades slowed further in the first half
of 2019, while SaaS applications quickly became the new
deployment model.3) According to IDC, more and more companies
purposefully used technologies such as cloud, social, mobile,
Internet of Things (IoT), blockchain, Big Data, analytics, and
cognitive computing as innovation accelerators.2)
IDC identifies this as a shift from experimentation to multiplied
innovation, which we also described in earlier financial reports. In
2019, IDC explains, particular emphasis so far was on artificial
intelligence and machine learning, which progressively automated
tasks, activities, processes, and systems, and created human-
machine learning networks.2)
Sources:
1) European Central Bank, Economic Bulletin, Issue 4/2019, Publication Date: June 20, 2019 (https://www.ecb.europa.eu/pub/pdf/ecbu/eb201904.en.pdf)
2) IDC MaturityScape: The Future Enterprise 1.0, Doc #US43646819, April 2019
3) IDC Perspective: Digital Transformation Requires a New Way of Thinking: DX Use Cases, SaaS, Intelligent ERP and Associated Technologies, and Innovation at Scale, Doc #US45042219, May 2019
Impact on SAP
SAP continues to benefit from the consistent strategy aimed at
enabling customers to become intelligent enterprises. On top of a
very strong first quarter in 2019, SAP had a solid second-quarter
performance in the EMEA region, with cloud and software revenue
increasing 9% (IFRS) and 8% (non-IFRS at constant currencies).
Cloud revenue increased by 46% (IFRS) and 44% (non-IFRS at
constant currencies), with Germany and Spain being highlights. In
addition, SAP had strong software license revenue growth in
Germany, France, and Italy.
The Company had a strong performance in the Americas region
as well. Cloud and software revenue increased by 15% (IFRS) and
10% (non-IFRS at constant currencies). Cloud revenue grew by 36%
(IFRS) and 30% (non-IFRS at constant currencies), with the United
States, Canada, and Brazil being highlights. In addition, the United
States had a solid quarter and Canada had a strong quarter in
software license revenue.
In the APJ region, SAP had a solid performance despite trade-
related macro headwinds. Cloud and software revenue was up by
8% (IFRS) and 6% (non-IFRS at constant currencies). Cloud
revenue increased by 41% (IFRS) and 37% (non-IFRS at constant
currencies), with Japan being a highlight. As for software license
revenue, both Australia and India had a strong quarter.

SAP Half-Year Report 2019 9
Key Figures – SAP Group in the First Half of 2019 (IFRS)
€ millions, unless otherwise stated Q1–Q2 2019
Q1–Q2 2018
∆ ∆ in %
Cloud 3,247 2,283 964 42
Software licenses 1,599 1,621 –22 –1
Software support 5,692 5,391 301 6
Cloud and software 10,538 9,295 1,243 13
Total revenue 12,722 11,260 1,462 13
Operating expense –12,031 –9,192 –2,839 31
Operating profit 691 2,069 –1,378 –67
Operating margin (in %) 5.4 18.4 –13.0pp NA
Profit after tax 475 1,426 –951 –67
Effective tax rate (in %) 29.7 28.9 0.8pp NA
Earnings per share, basic (in €) 0.38 1.19 –0.81 –68
Operating Results (IFRS)
Revenue
Noteworthy is the successful cloud business in the first half of
2019. Our cloud revenue was €3,247 million (first half of 2018:
€2,283 million), an increase of 42% compared to the same period in
2018, with the cloud revenue growth rates remaining on a high level.
Software licenses revenue was €1,599 million (first half of 2018:
€1,621 million), a decrease of 1% compared to the same period in
2018.
Total revenue was €12,722 million (first half of 2018:
€11,260 million), an increase of 13% compared to the same period in
2018.
Operating Expense
Our operating expenses increased by 31% to €12,031 million
(first half of 2018: €9,192 million). The increase was mainly driven by
a significant rise in restructuring expenses, and share-based
compensation. SAP launched a company-wide restructuring
program in January 2019. In the first half of 2019, restructuring
expenses were €1,085 million, an increase of €1,063 million
compared to the first half of 2018 (€22 million). For more
information about restructuring, see the Notes to the Consolidated
Half-Year Financial Statements, Note (B.4). Share-based payment
expenses increased to €1,114 million (first half of 2018:
€491 million). The rise in share-based compensation expenses is
mainly due to a higher increase in SAP’s share price in the first half
of 2019 compared to the same period in 2018, and due to additional
share-based compensation expenses related to the acquisition of
Qualtrics. Personnel expenses rose by 22% while the number of full-
time employees increased by more than 6,600, an increase of 7%
compared to the prior-year period.
Operating Profit and Operating Margin
Operating profit decreased by 67% compared with the same
period in the previous year to €691 million (first half of 2018:
€2,069 million). This was mainly a result of the aforementioned
expense increases and the impact from business combinations (for
more information, see the Business Combinations section in this
consolidated half-year management report).
Our operating margin decreased by 13.0pp to 5.4% (first half of
2018: 18.4%).
Profit After Tax and Earnings per Share
Profit after tax was €475 million (first half of 2018:
€1,426 million), a decrease of 67%. Basic earnings per share was
€0.38 (first half of 2018: €1.19), a decrease of 68%.
The effective tax rate was 29.7% (first half of 2018: 28.9%). The
year-over-year increase in the effective tax rate mainly resulted from
tax effects relating to almost unchanged non-deductible expenses
on a lower profit before tax (IFRS) and changes in the regional
allocation of income which were partly compensated by tax effects
relating to changes in tax exempt income and taxes for prior years,
as well as from the application of hyperinflation accounting.
10 SAP Half-Year Report 2019
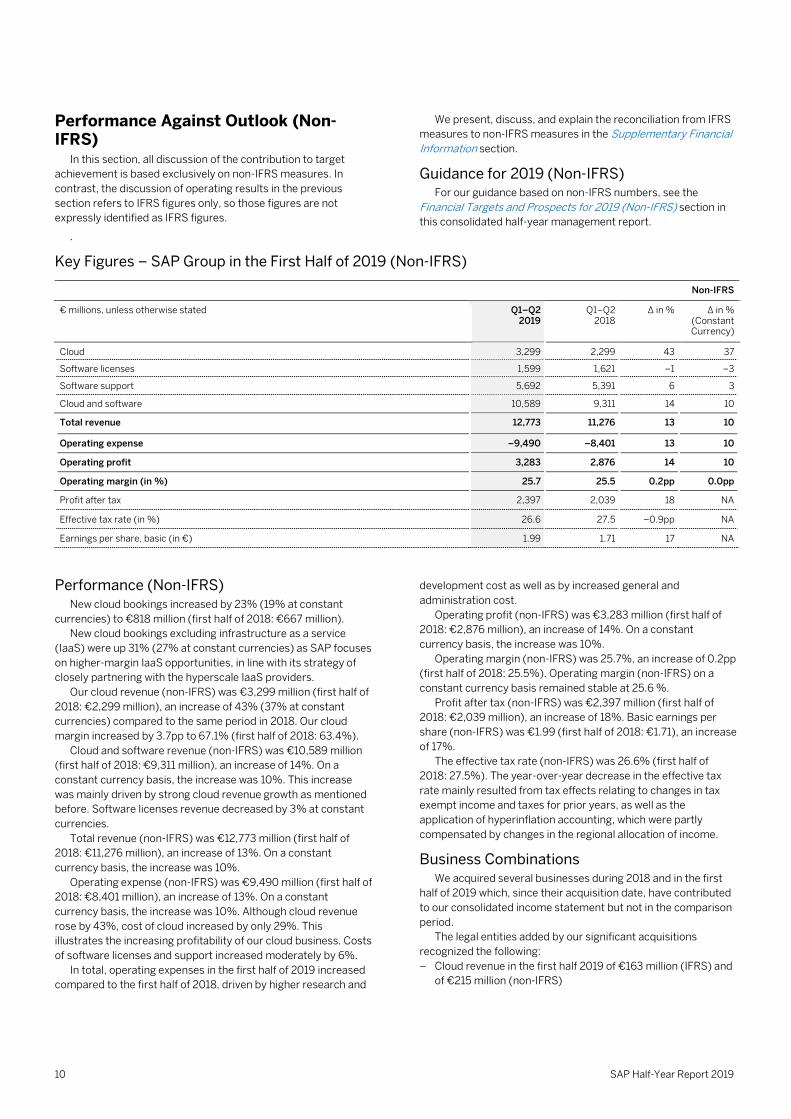
Performance Against Outlook (Non-IFRS)
In this section, all discussion of the contribution to target
achievement is based exclusively on non-IFRS measures. In
contrast, the discussion of operating results in the previous
section refers to IFRS figures only, so those figures are not
expressly identified as IFRS figures.
We present, discuss, and explain the reconciliation from IFRS
measures to non-IFRS measures in the Supplementary Financial
Information section.
Guidance for 2019 (Non-IFRS) For our guidance based on non-IFRS numbers, see the
Financial Targets and Prospects for 2019 (Non-IFRS) section in
this consolidated half-year management report.
.
Key Figures – SAP Group in the First Half of 2019 (Non-IFRS)
Non-IFRS
€ millions, unless otherwise stated Q1–Q2 2019
Q1–Q2 2018
∆ in % ∆ in % (Constant Currency)
Cloud 3,299 2,299 43 37
Software licenses 1,599 1,621 –1 –3
Software support 5,692 5,391 6 3
Cloud and software 10,589 9,311 14 10
Total revenue 12,773 11,276 13 10
Operating expense –9,490 –8,401 13 10
Operating profit 3,283 2,876 14 10
Operating margin (in %) 25.7 25.5 0.2pp 0.0pp
Profit after tax 2,397 2,039 18 NA
Effective tax rate (in %) 26.6 27.5 –0.9pp NA
Earnings per share, basic (in €) 1.99 1.71 17 NA
Performance (Non-IFRS) New cloud bookings increased by 23% (19% at constant
currencies) to €818 million (first half of 2018: €667 million).
New cloud bookings excluding infrastructure as a service
(IaaS) were up 31% (27% at constant currencies) as SAP focuses
on higher-margin IaaS opportunities, in line with its strategy of
closely partnering with the hyperscale IaaS providers.
Our cloud revenue (non-IFRS) was €3,299 million (first half of
2018: €2,299 million), an increase of 43% (37% at constant
currencies) compared to the same period in 2018. Our cloud
margin increased by 3.7pp to 67.1% (first half of 2018: 63.4%).
Cloud and software revenue (non-IFRS) was €10,589 million
(first half of 2018: €9,311 million), an increase of 14%. On a
constant currency basis, the increase was 10%. This increase
was mainly driven by strong cloud revenue growth as mentioned
before. Software licenses revenue decreased by 3% at constant
currencies.
Total revenue (non-IFRS) was €12,773 million (first half of
2018: €11,276 million), an increase of 13%. On a constant
currency basis, the increase was 10%.
Operating expense (non-IFRS) was €9,490 million (first half of
2018: €8,401 million), an increase of 13%. On a constant
currency basis, the increase was 10%. Although cloud revenue
rose by 43%, cost of cloud increased by only 29%. This
illustrates the increasing profitability of our cloud business. Costs
of software licenses and support increased moderately by 6%.
In total, operating expenses in the first half of 2019 increased
compared to the first half of 2018, driven by higher research and
development cost as well as by increased general and
administration cost.
Operating profit (non-IFRS) was €3,283 million (first half of
2018: €2,876 million), an increase of 14%. On a constant
currency basis, the increase was 10%.
Operating margin (non-IFRS) was 25.7%, an increase of 0.2pp
(first half of 2018: 25.5%). Operating margin (non-IFRS) on a
constant currency basis remained stable at 25.6 %.
Profit after tax (non-IFRS) was €2,397 million (first half of
2018: €2,039 million), an increase of 18%. Basic earnings per
share (non-IFRS) was €1.99 (first half of 2018: €1.71), an increase
of 17%.
The effective tax rate (non-IFRS) was 26.6% (first half of
2018: 27.5%). The year-over-year decrease in the effective tax
rate mainly resulted from tax effects relating to changes in tax
exempt income and taxes for prior years, as well as the
application of hyperinflation accounting, which were partly
compensated by changes in the regional allocation of income.
Business Combinations We acquired several businesses during 2018 and in the first
half of 2019 which, since their acquisition date, have contributed
to our consolidated income statement but not in the comparison
period.
The legal entities added by our significant acquisitions
recognized the following:
– Cloud revenue in the first half 2019 of €163 million (IFRS) and
of €215 million (non-IFRS)

SAP Half-Year Report 2019 11
– Operating profit in the first half 2019 of –€429 million (IFRS)
and €21 million (non-IFRS)
For more information about the business combinations
concluded in the first half of 2019, see the Notes to the
Consolidated Half-Year Financial Statements, Note (D.1).
Divestments At the beginning of 2019, we sold one content as a service
(CaaS) business to a third party. This sale generated the
following:
– A profit of €53 million in the first half of 2019, which is
classified in our half-year 2019 consolidated income
statement as other operating income
– Incremental employee-related expenses of €7 million in the
first half 2019, which are classified in our half-year 2019
consolidated income statement as cost of research and
development.
Additionally, SAP’s performance in the first half of 2019 but not in
the comparison period was also impacted by the adoption of
IFRS 16 (see the Notes to the Consolidated Half-Year Financial
Statements, Note (D.3)) and by a change in our estimate of the
expected useful lives of certain computer hardware (for more
information, see the Notes to the Consolidated Half-Year
Financial Statements, Note (D.2).)
Segment Performance At the end of the first half of 2019, SAP had three reportable
segments: the Applications, Technology & Services segment, the
Intelligent Spend Group segment, and the Customer and
Experience Management segment.
For more information about our segment reporting, see the
Notes to the Consolidated Half-Year Financial Statements, Notes
(C.1) and (C.2).
Applications, Technology & Services Segment
€ millions, unless otherwise stated (Non-IFRS)
Q1–Q2 2019 Q1–Q2 2018 ∆ in % ∆ in %
Actual Currency
Constant Currency
Actual Currency
Actual Currency
Constant Currency
Cloud revenue – SaaS/PaaS1) 1,163 1,125 849 37 33
Cloud gross margin – SaaS/PaaS1) (in %) 62.4 62.5 58.9 3.5pp 3.7pp
Cloud revenue – IaaS2) 327 315 217 51 45
Cloud gross margin – IaaS2) (in %) 26.9 26.1 10.3 16.6pp 15.8pp
Cloud revenue 1,490 1,440 1,066 40 35
Cloud gross margin (in %) 54.6 54.6 49.0 5.6pp 5.6pp
Segment revenue 10,375 10,104 9,529 9 6
Segment gross margin (in %) 71.3 71.3 72.0 –0.6pp –0.7pp
Segment profit 4,092 3,968 3,721 10 7
Segment margin (in %) 39.4 39.3 39.0 0.4pp 0.2pp
1) Software as a service/platform as a service
2) Infrastructure as a service
The Applications, Technology & Services segment recorded
strong growth in our cloud revenue and solid growth in support
revenue as well as in services revenue at constant currency
basis. The SaaS/PaaS business in this segment grew by 33% on
a constant currency basis year over year, driven by an ongoing
strong demand in our cloud solutions. The IaaS business even
grew by 45% on a constant currency basis year over year.
As a result of our ongoing efforts in leveraging our cloud
infrastructure, our SaaS/PaaS gross margin increased by 3.7pp
at constant currencies. Our IaaS gross margin even increased by
15.8pp at constant currencies compared to the first half of 2018.
As a result, the overall cloud gross margin improved by 5.6pp at
constant currencies to 54.6%.

12 SAP Half-Year Report 2019
Intelligent Spend Group Segment
€ millions, unless otherwise stated (Non-IFRS)
Q1–Q2 2019 Q1–Q2 2018 ∆ in % ∆ in %
Actual Currency
Constant Currency
Actual Currency
Actual Currency
Constant Currency
Cloud revenue – SaaS/PaaS1) 1,293 1,229 1,014 28 21
Cloud gross margin – SaaS/PaaS1) (in %) 78.1 78.0 77.4 0.8pp 0.6pp
Cloud revenue 1,293 1,229 1,014 28 21
Cloud gross margin (in %) 78.1 78.0 77.4 0.8pp 0.6pp
Segment revenue 1,526 1,451 1,233 24 18
Segment gross margin (in %) 69.5 69.3 69.0 0.5pp 0.3pp
Segment profit 314 293 229 37 28
Segment margin (in %) 20.6 20.2 18.5 2.0pp 1.6pp
1) Software as a service/platform as a service
In the first half of 2019, cloud revenue growth was 21% and
segment revenue growth was 18% at constant currencies. A
positive cloud gross margin development of 0.6pp at constant
currencies supported the segment margin increase of 1.6pp at
constant currencies compared to the first half of 2018. With
approximately US$3.3 trillion in global commerce transacted
annually in more than 180 countries, the Intelligent Spend
Group is the largest commerce platform in the world.
Customer and Experience Management Segment
€ millions, unless otherwise stated (Non-IFRS)
Q1–Q2 2019 Q1–Q2 2018 ∆ in % ∆ in %
Actual Currency
Constant Currency
Actual Currency
Actual Currency
Constant Currency
Cloud revenue – SaaS/PaaS1) 510 486 210 >100 >100
Cloud gross margin – SaaS/PaaS1) (in %) 75.8 75.3 67.4 8.4pp 7.8pp
Cloud revenue 510 486 210 >100 >100
Cloud gross margin (in %) 75.8 75.3 67.4 8.4pp 7.8pp
Segment revenue 667 636 338 97 88
Segment gross margin (in %) 75.5 75.1 76.9 –1.4pp –1.8pp
Segment profit –10 –13 –5 78 >100
Segment margin (in %) –1.5 –2.0 –1.6 0.2pp –0.4pp
1) Software as a service/platform as a service
The Customer and Experience Management segment
recorded strong growth in total revenue of 88% at constant
currencies in the first half of 2019. The positive development was
mainly influenced by the strong growth in cloud revenue of 131%
at constant currencies.
We acquired several businesses during 2018 and in the first
half of 2019 which, since their acquisition date, have contributed
to our consolidated income statement but not in the comparison
period. The legal entities added by our significant acquisitions
recognized €215 million in cloud revenue and €24 million in
operating profit within the segment in the first half of 2019. The
acquisition of Callidus and Qualtrics in combination with SAP’s
cloud strategy result in an increasing cloud revenue share
compared to software licenses and support revenue.

SAP Half-Year Report 2019 13
Reconciliation of Cloud Revenues and Margins
€ millions, unless otherwise stated Q1–Q2 2019 Q1–Q2 2018 ∆ in % ∆ in %
Actual Currency
Constant Currency
Actual Currency
Actual Currency
Constant Currency
Cloud revenue – SaaS/PaaS1)
Intelligent Spend Group segment 1,293 1,229 1,014 28 21
Other3) 1,678 1,616 1,068 57 51
Total 2,971 2,845 2,082 43 37
Cloud revenue – IaaS2) 327 315 217 51 45
Cloud revenue 3,299 3,161 2,299 43 37
Cloud gross margin – SaaS/PaaS1) (in %)
Intelligent Spend Group segment 78.1 78.0 77.4 0.8pp 0.6pp
Other3) 66.4 66.3 61.0 5.4pp 5.3pp
Total 71.5 71.4 69.0 2.5pp 2.4pp
Cloud gross margin – IaaS2) (in %) 26.9 26.1 10.3 16.6pp 15.8pp
Cloud gross margin (in %) 67.1 66.9 63.4 3.7pp 3.4pp
1) Software as a service/platform as a service
2) Infrastructure as a service
3) Other includes the Applications, Technology & Services segment, the Customer and Experience Management segment, and miscellaneous. The individual revenue and margin numbers for the Applications, Technology & Services segment and the Customer and Experience Management segment are disclosed on the previous pages.

14 SAP Half-Year Report 2019
Finances and Assets (IFRS)
Cash Flow
€ millions Q1–Q2 2019 Q1–Q2 2018 ∆
Net cash flows from operating activities
2,679 2,985 –10%
Capital expenditure –539 –818 –34%
Payments of lease liabilities –185 0
Free cash flow 1,956 2,167 –10%
Free cash flow (as a percentage of total revenue)
15 19 –4pp
Free cash flow (as a percentage of profit after tax)
412 152 +260pp
Days sales outstanding (DSO, in days)
70 68 2
The decrease in operating cash flow resulted mainly from higher
payments for income taxes (€412 million increase year-over-year),
higher payments related to restructuring (€183 million increase
year-over-year), and higher share-based payments (234 million
increase year over year).
Instead of investing in the expansion of our data centers, there
was a strong focus on improving capacity utilization in the first half
of 2019, resulting in a decrease in capital expenditure.
To avoid an impact on free cash flow from the new lease
accounting rules (IFRS 16), since January 1, 2019, we calculate free
cash flow as net cash flows from operating activities minus
purchases of intangible assets and property, plant, and equipment
without acquisitions (capital expenditure) and minus repayments of
lease liabilities.
DSO for receivables is defined as the average number of days
from the raised invoice to the cash receipt from the customer
(rolling 12 months).
Group Liquidity
5,280
–8,553
–539 –185
–6,147 –1,790 –100
8,838
+2,679 +2,523
–13,833
GroupLiquidity
12/31/2018
OperatingCashFlow
CapitalExpen-diture
LeasePayments
Proceedsof Borro-
wings
BusinessCombi-nations
Dividends Other GroupLiquidity
6/30/2019
FinancialDebt
NetLiquidity
6/30/2019
Group Liquidity Development
€ millions
Group Liquidity = cash and cash equivalent plus current time deposits and debt securitiesOther = mainly purchase and sales of equity or debt instruments of other entities, proceeds from sales of non-current assets, and effects of foreign currency rates on cash and cash equivalents Net Liquidity = group liquidity minus financial debt – for more information see our 2018 integrated report
1,956Free Cash Flow

SAP Half-Year Report 2019 15
Liquidity and Financial Position
€ millions 6/30/2019 12/31/2018 ∆
Cash and cash equivalents 5,168 8,627 –3,459
Current time deposits and debt securities
112 211 –99
Group liquidity 5,280 8,838 –3,558
Financial debt –13,833 –11,331 –2,502
Net liquidity –8,553 –2,493 –6,060
Goodwill 28,801 23,736 +5,065
Total assets 57,707 51,502 +6,206
Total equity 27,641 28,877 –1,236
Equity ratio (total equity as a percentage of total assets)
48 56 –8pp
In the first half of 2019, our liquidity decreased due to the
purchase price payment related to the acquisition of Qualtrics on
January 23, 2019.
Competitive Intangibles
The resources that are the basis for our current as well as future
success do not appear in the Consolidated Statements of Financial
Position. This is apparent from a comparison of the market
capitalization of SAP SE with the carrying amount of our equity. With
€148.4 billion at the end of the first half of 2019, the market
capitalization of our equity (based on all outstanding shares) is more
than five times higher than its carrying amount.
Some of the most important competitive intangibles that
influence our market value include: customer capital, our employees
and their knowledge and skills, our ecosystem of partners, software
we developed ourselves, our ability to innovate, the brands we have
built up – in particular, the SAP brand itself – and our organization.
SAP was recognized as the world’s 16th most valuable brand in
the 2019 BrandZ Global Top 100 Most Valuable Brands ranking. The
ranking estimates SAP’s brand value at US$58 billion, an increase of
4% in brand value for SAP year over year.
Risk Management and Risks
We have comprehensive risk-management structures in place
that are intended to enable us to recognize and analyze risks early
and to take the appropriate action as well as to mitigate any risks
that materialize as presented in the Risk Management and Risks
chapter in our Integrated Report 2018 and our Annual Report on
Form 20-F for 2018. For changes in our Litigation, Claims, and Legal
Contingencies since our last Integrated Report, see Note (G.1) in the
Notes to the Consolidated Half-Year Financial Statements. We do
not see any relevant changes to our assessment of the risk factors
since the release of the Integrated Report 2018 and Annual Report
on Form 20-F for 2018. We do not believe the risks we have
identified jeopardize our ability to continue as a going concern.
Expected Developments and Opportunities
Future Trends in the Global Economy According to the European Central Bank’s (ECB) most recent
Economic Bulletin1), global economic growth is projected to
decelerate in the second half of 2019. This weakening may be due to
political uncertainty, further trade tensions between the United
States and China, and a rising threat of protectionism and
vulnerabilities in emerging markets. However, recent policy
measures are expected to provide some support from 2020 onward
and stabilize the global economy at relatively low levels over the
medium term.
Regarding the Europe, Middle East, and Africa (EMEA) region, the
ECB expects employment gains and increasing wages to underpin
the resilience of the euro area economy after a weaker third quarter
of 2019. In central and eastern Europe, growth is projected to
moderate in the second half of the year and cool even further due to
the slowdown in the euro area. The outlook for the Russian economy
depends on developments in global oil markets and on fiscal and
structural policies, and is expected to decelerate in the medium
term.
As for the Americas region, the ECB projects a sizeable
procyclical fiscal stimulus in the United States which might provide
impetus in the second half of the year. In Brazil, growth is expected
to strengthen, supported by accommodative financial conditions.
For the Asia Pacific Japan (APJ) region, the ECB predicts that
economic activity in Japan will resume its path of moderate growth.
A consumption tax hike is scheduled for October 2019 in Japan,
which could provide a temporary boost over the summer months,
but provide a negative impact thereafter. China is expected to
continue its orderly transition to a more balanced, but weaker
growth path that is less dependent on investment and exports.

16 SAP Half-Year Report 2019
Economic Trends – Year-Over-Year GDP Growth
% 2018 2019p 2020p
World 3.6 3.3 3.6
Advanced economies 2.2 1.8 1.7
Emerging market and developing economies
4.5 4.4 4.8
Europe, the Middle East, and Africa (EMEA)
Euro area 1.8 1.3 1.5
Germany 1.5 0.8 1.4
Emerging and developing Europe 3.6 0.8 2.8
Middle East, North Africa, Afghanistan, and Pakistan
1.8 1.5 3.2
Sub-Saharan Africa 3.0 3.5 3.7
Americas
United States 2.9 2.3 1.9
Canada 1.8 1.5 1.9
Latin America and the Caribbean 1.0 1.4 2.4
Asia Pacific Japan (APJ)
Japan 0.8 1.0 0.5
Emerging and developing Asia 6.4 6.3 6.3
China 6.6 6.3 6.1
p = projection
Source: International Monetary Fund (IMF), World Economic Outlook April 2019, Growth Slowdown, Precarious Recovery (https://www.imf.org/~/media/Files/Publications/WEO/2019/April/English/text.ashx?la=en), p. 24.
The IT Market: Outlook for 2019 and Beyond
Technology and data are the “lifeblood” of the “digital enterprise
of the future”, which International Data Corporation (IDC), a US-
based market research firm, describes in one of its most recent
publications.2) Characteristically, such a “digital enterprise of the
future” according to IDC has built out and monetized its data,
implemented platform-based revenue models, participates in the
sharing economy, and optimizes contextualized offerings and
dynamic pricing.2) As a result, it can scale operations and innovate
much faster than traditional businesses. This is in line with our 2018
annual report outlook and with our continued strategy to help our
customers become “Intelligent Enterprises.”
According to IDC, global investment in digital transformation
initiatives could almost double in the next five years.3) IDC thus
expects US$6.1 trillion of direct investment in hardware, software,
and services from 2019 to 2022, with a compound annual growth
rate (CAGR) of 17.5% for the years 2017 through 2022 (compared to
a 1.5% CAGR for non-digital transformation investments).4) IDC also
forecasts that by 2020, 55% of organizations (46% in 2018) will
have an integrated digital strategy with a single road map and
enterprise-wide technology architecture, and that 30% of G2000
companies will spend at least 10% of their revenues to fuel their
digital strategies.3)
IDC further predicts that by 2022, 90% of all new applications will
feature microservices architectures, and 35% of all production apps
will be cloud-native.3) By 2023, 65% of G2000 organizations could
have refreshed their core business systems and created completely
new business processes. For this purpose, IDC reports, they are
likely to use cloud platforms and ubiquitous artificial intelligence
based upon curated data sets, advanced analytics, and machine
learning.3)
Sources:
1) European Central Bank, Economic Bulletin, Issue 4/2019, Publication Date: June 20, 2019 (https://www.ecb.europa.eu/pub/pdf/ecbu/eb201904.en.pdf)
2) IDC MaturityScape: The Future Enterprise 1.0, Doc #US43646819, April 2019
3) IDC Perspective: Digital Transformation Requires a New Way of Thinking: DX Use Cases, SaaS, Intelligent ERP and Associated Technologies, and Innovation at Scale, Doc #US45042219, May 2019
4) IDC Perspective: Organizing the Organization for the Future Enterprise: Digital at Scale, Part 3: Executing Digital Transformation – Achieving Goals and Creating Capabilities, Doc #US45073418, April 2019
Impact on SAP Despite growing geopolitical uncertainties and trade war
discussions, SAP expects to benefit further from the digitalization of
the global economy.
The strategy to enable customers to become intelligent
enterprises continues to resonate well in the market, and our
combination of technologies such as artificial intelligence,
blockchain, and Internet of Things (IoT) around the digital core is
unique. Very fast growth in the cloud and a strong adoption of our
core solution SAP S/4 HANA shows that we are consistently
expanding our reach and, with the acquisition of Qualtrics in January
2019, SAP has become the undisputed leader in the emerging,
rapidly-growing Experience Management software category.
In addition to the continued rapid revenue growth, our targeted
significant expansion of profitability shows our commitment to
operational excellence.
All of the above is reflected in the raise of our 2019 outlook and
2020 and 2023 ambitions.
On this basis, we consider ourselves well-prepared for the future
and expect profitable growth in 2019 and beyond. Balanced in terms
of regions as well as industries, we remain well-positioned with our
product offering to offset individual fluctuations in the global
economy and IT market. SAP expects to outperform the global
economy and the IT industry again in 2019 in terms of revenue
growth.
Financial Targets and Prospects for 2019 (Non-IFRS)
Revenue and Operating Profit Targets and Prospects for 2019
SAP has updated its 2019 outlook. This update reflects the
results of the first quarter 2019 and the Company’s new initiatives to
accelerate its operational excellence and value creation. SAP
continues to expect:
– Non-IFRS cloud revenue in a range of €6.7 billion to €7.0 billion at
constant currencies (2018: €5.03 billion), up 33% to 39% at
constant currencies.
– Non-IFRS cloud and software revenue in a range of €22.4 billion
to €22.7 billion at constant currencies (2018: €20.66 billion), up
8.5% to 10% at constant currencies.
SAP now expects:
– Non-IFRS operating profit in a range of €7.85 billion to
€8.05 billion at constant currencies (2018: €7.16 billion), up
9.5% to 12.5% at constant currencies (previously: €7.7 billion to
€8.0 billion, up 7.5% to 11.5% at constant currencies).

SAP Half-Year Report 2019 17
While SAP’s full year 2019 business outlook is at constant
currencies, actual currency reported figures are expected to be
impacted by currency exchange rate fluctuations as the Company
progresses through the year. For the Q3 and full year 2019 expected
currency impacts, see the table below.
Expected Currency Impact Based on June 2019 Level for the Rest of the Year
In percentage points Q3 Q1 – Q4
Cloud +2pp to +4pp +3pp to +5pp
Cloud and software +1pp to +3pp +1pp to +3pp
Operating profit +2pp to +4pp +1pp to +3pp
In addition, SAP expects total revenues to increase strongly, at a
rate lower than operating profit. The cloud and software revenue
guidance above assumes a mid-single-digit decline in software
license revenue.
Considering our restructuring program, we expect a deceleration
of our organic headcount growth for the full year 2019. Including our
acquisitions, we expect our headcount to grow but at a lower rate
than in 2018. We continuously strive for profit expansion in all of our
operating segments.
The following table shows the estimates of the items that
represent the differences between our IFRS financial measures and
our non-IFRS financial measures.
Non-IFRS Measures
€ millions Estimated Amounts for
Full Year 2019
Q1–Q2 2019
Q1–Q2 2018
Revenue adjustments
70–120 51 16
Acquisition- related charges
650–750 341 278
Share-based payment expenses
1,650–1,900 1,114 491
Restructuring 950–1,100 1,085 22
Due to an increase in share price, we have adjusted our guidance
for total Share-based payment expenses. Share-based payment
expenses are now projected to be between €1,650 million and
€1,900 million for the full year 2019.
Mainly due to an increase in the expected participation rate in the
voluntary and early retirement programs in Germany, we have
adjusted our guidance for total restructuring cost. Restructuring
expenses are now projected to be between €950 million and
€1,100 million for the full year. In the course of the whole
restructuring program, we now expect more than 4,000 employees
to leave SAP. Our prediction of €750 million to €850 million in
annual cost savings as of 2020 remains unchanged. For more
information about our restructuring program, see the Notes to the
Consolidated Half-Year Financial Statements, Note (B.4).
The Company continues to expect a full year 2019 effective tax
rate (IFRS) of 26.5% to 27.5% (2018: 27.0%) and an effective tax
rate (non-IFRS) of 26.0% to 27.0% (2018: 26.3%).
Impact of the New Accounting Standard IFRS 16 ‘Leases’
As of January 1, 2019, SAP changed its accounting policies to
adopt IFRS 16 ‘Leases’. Under the IFRS 16 adoption method chosen
by SAP, prior years are not restated to conform to the new policies.
Consequently, the year-over-year expenses and profit in 2019 will be
impacted by the new policies.
Unchanged from our Integrated Report 2018, the Company still
expects the full year 2019 impact of the policy change on operating
expenses and profit to be as follows:
– The adoption of IFRS 16 is expected to have a favorable impact
on operating profit in 2019, since a portion of the costs that were
previously classified as rental expenses are classified as interest
expense and thus recorded outside operating profit. Based on
the SAP Group’s leases as of January 1, 2019 and the insights
gained during the first half of the year, operating profit is
expected to increase by substantially less than €0.1 billion. The
actual impact on our profits depends not only on the lease
agreements in effect at the time of adoption but also on new
lease agreements entered into or terminated in 2019.
– IFRS 16 also has an impact on how lease payments are presented
in the cash flow statement. This will result in an increase in cash
flow from operating activities and a decline in cash flow from
financing activities. Cash flow from operating activities is
expected to increase by approximately €0.3 billion to
€0.4 billion. Cash flow from financing activities will decrease by
the same amount.
– As of January 1, 2019, we changed our free cash flow definition to
avoid effects resulting from the adoption of IFRS 16. This change
is described in the Cash Flow section in this Consolidated Half-
Year Management Report.
For more information about the adoption of IFRS 16, see the Notes
to the Consolidated Half-Year Financial Statements, Notes (D.2) and
(D.3).
Medium Term Prospects In this section, all numbers are based exclusively on non-IFRS
measures.
We continue to expect to grow our more predictable revenue
while steadily increasing operating profit. Our strategic objectives
are focused primarily on our main financial and non-financial
objectives: growth, profitability, customer loyalty, and employee
engagement. In April 2019, SAP updated its 2020 ambition
previously provided in January 2019. This update reflects SAP’s new
initiatives to accelerate its operational excellence and value creation:
In 2020, SAP continues to expect the following:
– €8.6 billion to €9.1 billion in non-IFRS cloud revenue (2018:
€5.03 billion)
– €28.6 billion to €29.2 billion in non-IFRS total revenue (2018:
€24.74 billion)
– The share of more predictable revenue (defined as the total of
cloud revenue and software support revenue) in a range of 70%
to 75% (2018: 65%)
In 2020, SAP now expects the following:
– €8.8 billion to €9.1 billion in non-IFRS operating profit
(previously: €8.5 billion to €9.0 billion; 2018: €7.16 billion).
The midpoints of the 2020 total revenue and operating profit
ranges now imply an operating margin of 31.0%.
We further continue to expect that, by 2020, our Intelligent
Spend Group offerings will contribute slightly less than 40% and our
other Software as a Service/Platform as a Service (SaaS/PaaS)

18 SAP Half-Year Report 2019
cloud offerings slightly more than 50% of cloud revenue. Both
offerings are expected to each generate, in 2020, cloud revenues
that are significantly higher than the cloud revenue generated from
our Infrastructure as a service (IaaS) cloud offerings. We continue to
expect our revenue growth trajectory through 2020 to be driven by
continued strong growth in the cloud and continued growth in our
software support revenue. We continue to expect mid-single digit
declines in software revenue. This is all expected to result in high
single-digit growth in cloud and software revenue through 2020.
We also continue to strive to significantly improve, over the next
few years, the profitability of our cloud business. In 2019, we
continue to expect to see the benefits from previous efficiency-
based investments, and thus an increasing cloud gross margin. We
continue to expect these profitability improvements to accelerate in
the following years.
We continue to expect that the individual gross margins of our
different cloud operating models will increase at different rates over
the next years to reach the following mid-term targets. We continue
to expect that, in 2020, the gross margin from our Intelligent Spend
Group offerings will be higher than 80% (2018: 78%). We continue
to expect that, in 2020, the gross margin from our other SaaS/PaaS
offerings will reach approximately 70% (2018: 60%), and expand to
about 80% over the course of the two years thereafter. We continue
to expect that, in 2020, the gross margin from our IaaS offerings will
reach between 30% and 35% (2018: 13%). We continue to expect
the cloud gross margin to be approximately 71% by 2020. We
continue to expect the 2020 gross margin for our software licenses
and support to remain at a similar level to 2018 (2018: 87%). In
addition, we continue to expect our 2020 services gross margin to
be slightly higher than in 2018 (2018: 23%).
As we look to increase our profitability through 2020, we
continue to expect our cost ratios (cost as a percentage of total
revenue) to develop as follows through 2020: Research and
development is expected to remain close to current levels. Sales and
marketing as well as general and administration are expected to
decline slightly.
In 2020 we do not expect significant restructuring expenses and
acquisition related charges that are lower than in 2019. Therefore,
we expect our IFRS operating profit to increase strongly in 2020 at a
rate higher than the growth of our non-IFRS operating profit.
In April 2019, we also updated the 2023 ambition, reflecting
SAP’s new initiatives to accelerate its operational excellence and
value creation.
The update did not affect our revenue ambitions. For these, over
the period from 2018 through 2023, SAP continues to expect to:
– More than triple its non-IFRS cloud revenue (2018: €5.03 billion)
– Grow to more than €35 billion in non-IFRS total revenue (2018:
€24.74 billion)
– Approach a share of more predictable revenue of 80% (2018:
65%)
Over the same period, pursuant to the April 2019 ambition
update, SAP now expects to:
– Reach a non-IFRS cloud gross margin of 75%
– Increase the non-IFRS operating margin by one percentage point
per year on average, representing a total expansion of
approximately 500 basis points
SAP’s 2023 non-IFRS operating margin ambition replaced its
former 2023 ambition of growing non-IFRS operating profit at a
compound annual growth rate of 7.5% to 10% (2018: €16 billion).
Goals for Liquidity, Finance, and Investments On June 30, 2019, we had negative net liquidity. We believe that
our liquid assets combined with our undrawn credit facilities are
sufficient to meet our operating financing needs in the second half of
2019 as well, and, together with expected cash flows from
operations, will support debt repayments and our currently planned
capital expenditure requirements over the near term and medium
term.
In 2019, compared to 2018 we expect higher cash outflows for
restructuring (approximately additional €550 million to
€750 million), share-based payments (approximately additional
€400 million more mainly due to Qualtrics and an increase in share
price), and tax-related cash outflows (approximately additional
€600 million). In contrast, we expect operating cash flow to benefit
from the cash flow reclassification due to IFRS 16 by an amount of
€300 million to €400 million.
Considering all these effects, we expect operating cash flow in
2019 to come in slightly lower than 2018. Free cash flow (as
redefined in response to IFRS 16) is expected to decrease
moderately following the decrease of operating cash flow partly
balanced by an expected decrease of capital expenditures. For
2020, we expect a significant year-over-year increase in both
operating cash flow and free cash flow, mainly due to decreased
cash outflows for restructuring and a profitable growth of our
operating business.
We intend to repay €750 million in Eurobonds in November 2019.
In addition, we might repay portions of the Qualtrics related
€2.5 billion acquisition term loan. In June 2019, we repaid a first
tranche of a €50 million promotional loan with KfW and we intend to
repay further tranches in the second half year.
Our capital expenditures, other than from business
combinations, consist primarily of the purchase of IT infrastructure
(data centers, etc.) and the construction of new buildings. We have
updated our expectations for capital expenditures for 2019 and
2020. For the full year 2019 we expect total capital expenditures of
less than €1.2 billion, thereof approximately €605 million for IT
Infrastructure and approximately €275 million from construction
activities. The capital expenditures for 2020 are expected to stay at
a similar level as in 2019, thereof €270 million from construction
activities.
Non-Financial Goals 2019 and Ambitions for 2020
In addition to our financial goals, we also focus on two non-
financial 2020 targets: customer loyalty and employee engagement.
These targets remain unchanged compared to what we disclosed in
our Integrated Report 2018. For a detailed description of our non-
financial goals 2019 and ambitions for 2020, see our Integrated
Report 2018.
Premises on Which Our Outlook and Prospects Are Based
In preparing our outlook, we have taken into account all events
known to us at the time we prepared this report that could influence
SAP’s business going forward.
Among the premises on which this outlook is based are those
presented concerning economic development and the assumption
that there will be no further major acquisitions in 2019 or 2020.
SAP Half-Year Report 2019 19
Opportunities We have comprehensive opportunity-management structures in
place that are intended to enable us to recognize and analyze
opportunities early and to take the appropriate action. The
opportunities remain largely unchanged compared to what we
disclosed in our Integrated Report 2018.

20 SAP Half-Year Report 2019
Consolidated Half-Year Financial Statements – IFRS
Primary Half-Year Financial Statements 20–24
Notes to the Half-Year Financial Statements 25
(IN.1) Basis for Preparation ........................................................................................................................................................................... 25
Section A – Customers 26
(A.1) Revenue .................................................................................................................................................................................................. 26 (A.2) Trade and Other Receivables ............................................................................................................................................................... 26
Section B – Employees 27 (B.1) Employee Headcount ............................................................................................................................................................................ 27 (B.2) Employee Benefits Expenses ............................................................................................................................................................... 27 (B.3) Share-Based Payments ........................................................................................................................................................................ 27 (B.4) Restructuring ......................................................................................................................................................................................... 28
Section C – Financial Results 29
(C.1) Results of Segments .............................................................................................................................................................................. 29 (C.2) Reconciliation of Segment Measures to Income Statement ............................................................................................................. 32 (C.3) Income Taxes ........................................................................................................................................................................................ 32
(C.4) Hyperinflation Accounting .................................................................................................................................................................... 32
Section D – Invested Capital 33
(D.1) Business Combinations......................................................................................................................................................................... 33 (D.2) Property, Plant, and Equipment ........................................................................................................................................................... 34 (D.3) Adoption of IFRS 16 ............................................................................................................................................................................... 34
Section E – Capital Structure, Financing, and Liquidity 36
(E.1) Total Equity ............................................................................................................................................................................................. 36 (E.2) Liquidity .................................................................................................................................................................................................. 37
Section F – Management of Financial Risk Factors 38
(F.1) Financial Risk Factors and Risk Management, and Fair Value Disclosures on Financial Instruments ............................................ 38
Section G – Other Disclosures 39 (G.1) Litigation, Claims, and Legal Contingencies ........................................................................................................................................ 39 (G.2) Related Party Transactions .................................................................................................................................................................. 39 (G.3) Events After the Reporting Period ....................................................................................................................................................... 39 (G.4) Scope of Consolidation ......................................................................................................................................................................... 40

SAP Half-Year Report 2019 21
Consolidated Income Statement of SAP Group (IFRS) – Half Year
€ millions, unless otherwise stated Notes
Q1–Q2 2019
Q1–Q2 2018
∆ in %
Cloud2) 3,247 2,283 42
Software licenses 1,599 1,621 –1
Software support 5,692 5,391 6
Software licenses and support 7,291 7,012 4
Cloud and software 10,538 9,295 13
Services 2,184 1,965 11
Total revenue (A.1), (C.2) 12,722 11,260 13
Cost of cloud2) –1,237 –941 31
Cost of software licenses and support –1,069 –1,001 7
Cost of cloud and software –2,306 –1,942 19
Cost of services –1,845 –1,600 15
Total cost of revenue –4,151 –3,542 17
Gross profit 8,571 7,718 11
Research and development –2,114 –1,761 20
Sales and marketing –3,833 –3,314 16
General and administration –895 –548 63
Restructuring (B.4) –1,085 –22 >100
Other operating income/expense, net 48 –5 <–100
Total operating expenses –12,031 –9,192 31
Operating profit (loss) 691 2,069 –67
Other non-operating income/expense, net –44 –91 –51
Finance income 286 185 55
Finance costs –258 –157 64
Financial income, net 29 28 3
Profit (loss) before tax (C.2) 675 2,006 –66
Income tax expense –201 –580 –65
Profit (loss) after tax 475 1,426 –67
Attributable to owners of parent 455 1,425 –68
Attributable to non-controlling interests 20 0 >100
Earnings per share, basic (in €)1) 0.38 1.19 –68
Earnings per share, diluted (in €)1) 0.38 1.19 –68
1) For the six months ended June 30, 2019 and 2018, the weighted average number of shares was 1,194 million (diluted 1,194 million) and 1,193 million (diluted: 1,194 million), respectively (treasury stock excluded).
2) In 2019, we renamed “cloud subscription and support” revenue and “cost of cloud subscription and support” to “cloud” revenue and “cost of cloud” without changing the content of these line items.
Due to rounding, numbers may not add up precisely.

22 SAP Half-Year Report 2019
Consolidated Statements of Comprehensive Income of SAP Group (IFRS) – Half Year
€ millions Q1–Q2 2019 Q1–Q2 2018
Profit after tax 475 1,426
Items that will not be reclassified to profit or loss
Remeasurements on defined benefit pension plans, before tax 6 2
Income taxes relating to remeasurements on defined benefit pension plans –5 –1
Remeasurements on defined benefit pension plans, net of tax 1 1
Other comprehensive income for items that will not be reclassified to profit or loss, net of tax 1 1
Items that will be reclassified subsequently to profit or loss
Gains (losses) on exchange differences on translation, before tax 180 557
Reclassification adjustments on exchange differences on translation, before tax 0 0
Exchange differences, before tax 180 557
Income taxes relating to exchange differences on translation 0 0
Exchange differences, net of tax 180 557
Gains (losses) on cash flow hedges/cost of hedging, before tax –8 –12
Reclassification adjustments on cash flow hedges/cost of hedging, before tax 9 –19
Cash flow hedges/cost of hedging, before tax 1 –31
Income taxes relating to cash flow hedges/cost of hedging 0 9
Cash flow hedges/cost of hedging, net of tax 1 –22
Other comprehensive income for items that will be reclassified to profit or loss, net of tax 181 536
Other comprehensive income, net of tax 181 537
Total comprehensive income 656 1,962
Attributable to owners of parent 636 1,962
Attributable to non-controlling interests 20 0
Due to rounding, numbers may not add up precisely.
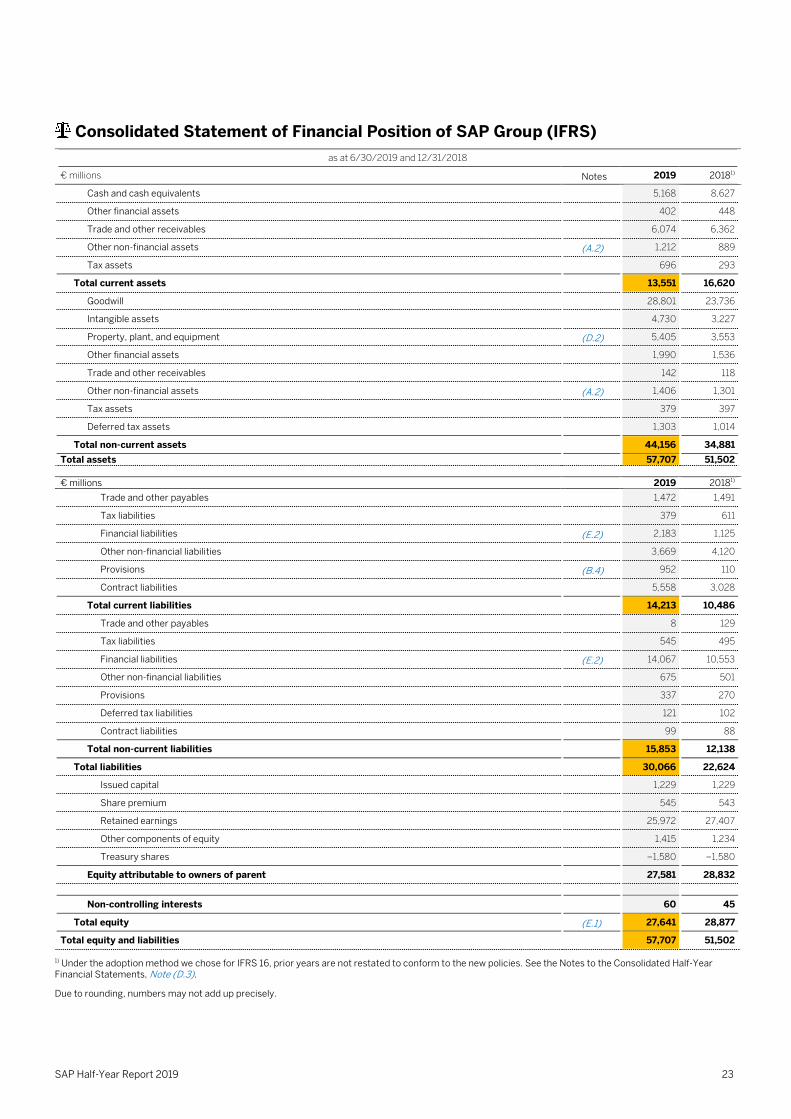
SAP Half-Year Report 2019 23
Consolidated Statement of Financial Position of SAP Group (IFRS)
as at 6/30/2019 and 12/31/2018
€ millions Notes 2019 20181)
Cash and cash equivalents 5,168 8,627
Other financial assets 402 448
Trade and other receivables 6,074 6,362
Other non-financial assets (A.2) 1,212 889
Tax assets 696 293
Total current assets 13,551 16,620
Goodwill 28,801 23,736
Intangible assets 4,730 3,227
Property, plant, and equipment (D.2) 5,405 3,553
Other financial assets 1,990 1,536
Trade and other receivables 142 118
Other non-financial assets (A.2) 1,406 1,301
Tax assets 379 397
Deferred tax assets 1,303 1,014
Total non-current assets 44,156 34,881
Total assets 57,707 51,502
€ millions 2019 20181)
Trade and other payables 1,472 1,491
Tax liabilities 379 611
Financial liabilities (E.2) 2,183 1,125
Other non-financial liabilities 3,669 4,120
Provisions (B.4) 952 110
Contract liabilities 5,558 3,028
Total current liabilities 14,213 10,486
Trade and other payables 8 129
Tax liabilities 545 495
Financial liabilities (E.2) 14,067 10,553
Other non-financial liabilities 675 501
Provisions 337 270
Deferred tax liabilities 121 102
Contract liabilities 99 88
Total non-current liabilities 15,853 12,138
Total liabilities 30,066 22,624
Issued capital 1,229 1,229
Share premium 545 543
Retained earnings 25,972 27,407
Other components of equity 1,415 1,234
Treasury shares –1,580 –1,580
Equity attributable to owners of parent 27,581 28,832
Non-controlling interests 60 45
Total equity (E.1) 27,641 28,877
Total equity and liabilities 57,707 51,502
1) Under the adoption method we chose for IFRS 16, prior years are not restated to conform to the new policies. See the Notes to the Consolidated Half-Year Financial Statements, Note (D.3).
Due to rounding, numbers may not add up precisely.

24 SAP Half-Year Report 2019
Consolidated Statements of Changes in Equity of SAP Group (IFRS)
€ millions Equity Attributable to Owners of Parent Non-Controlling
Interests
Total Equity
Issued Capital
Share Premium
Retained Earnings
Other Compo-nents of
Equity
Treasury Shares
Total
12/31/2017 1,229 570 24,769 508 –1,591 25,484 31 25,515
Adoption of IFRS 15 83 83 83
Adoption of IFRS 9 135 –160 –25 –25
1/1/2018 1,229 570 24,987 347 –1,591 25,542 31 25,572
Profit after tax 1,425 1,425 0 1,426
Other comprehensive income 1 536 537 537
Comprehensive income 1,426 536 1,962 0 1,962
Share-based payments –40 –40 –40
Dividends –1,671 –1,671 –4 –1,675
Reissuance of treasury shares under share-based payments
13 11 24 24
Shares to be issued 7 7 7
Hyperinflation –39 –39 –39
Changes in non-controlling interests
17 17
6/30/2018 1,229 543 24,711 883 –1,580 25,786 44 25,829
12/31/2018 1,229 543 27,407 1,234 –1,580 28,832 45 28,877
Adoption of IFRS 16 –70 –70 –70
1/1/2019 1,229 543 27,337 1,234 –1,580 28,762 45 28,807
Profit after tax 455 455 20 475
Other comprehensive income 1 181 181 181
Comprehensive income 456 181 636 20 656
Share-based payments 3 3 3
Dividends –1,790 –1,790 –5 –1,795
Hyperinflation –30 –30 –30
6/30/2019 1,229 545 25,972 1,415 –1,580 27,581 60 27,641
Due to rounding, numbers may not add up precisely.

SAP Half-Year Report 2019 25
Consolidated Statement of Cash Flows of SAP Group (IFRS)
€ millions Q1–Q2 2019 Q1–Q2 20181)
Profit (loss) after tax 475 1,426
Adjustments to reconcile profit (loss) after tax to net cash flows from operating activities:
Depreciation and amortization 897 635
Share-based payment expense 1,114 491
Income tax expense 201 580
Financial income, net –29 –28
Decrease/increase in allowances on trade receivables –9 –43
Other adjustments for non-cash items –55 4
Decrease/increase in trade and other receivables 354 1,409
Decrease/increase in other assets –390 –380
Increase/decrease in trade payables, provisions, and other liabilities –2 –842
Increase/decrease in contract liabilities 2,363 1,240
Share-based payments –832 –598
Interest paid –176 –101
Interest received 45 54
Income taxes paid, net of refunds –1,277 –865
Net cash flows from operating activities 2,679 2,985
Business combinations, net of cash and cash equivalents acquired –6,147 –1,995
Proceeds from sales of subsidiaries or other businesses 61 0
Purchase of intangible assets or property, plant, and equipment –539 –818
Proceeds from sales of intangible assets or property, plant, and equipment 35 32
Purchase of equity or debt instruments of other entities –579 –526
Proceeds from sales of equity or debt instruments of other entities 469 1,079
Net cash flows from investing activities –6,700 –2,228
Dividends paid –1,790 –1,671
Dividends paid on non-controlling interests –2 –4
Proceeds from borrowings 2,523 1,498
Repayments of borrowings –29 –146
Payments of lease liabilities –185 0
Net cash flows from financing activities 517 –323
Effect of foreign currency rates on cash and cash equivalents 45 70
Net decrease/increase in cash and cash equivalents –3,459 504
Cash and cash equivalents at the beginning of the period 8,627 4,011
Cash and cash equivalents at the end of the period 5,168 4,515
1) Under the adoption method we chose for IFRS 16, prior years are not restated to conform to the new policies. For more information, see the Notes to the Consolidated Half-Year Financial Statements, Note (D.3).
Due to rounding, numbers may not add up precisely.
26 SAP Half-Year Report 2019
Notes to the Consolidated Half-Year Financial Statements
(IN.1) Basis for Preparation
General Information About Consolidated Half-Year Financial Statements
The registered seat of SAP SE is in Walldorf, Germany
(Commercial Register of the Lower Court of Mannheim
HRB 719915). The accompanying condensed Consolidated Half-
Year Financial Statements of SAP SE and its subsidiaries
(collectively, “we,” “us,” “our,” “SAP,” “Group,” and “Company”)
have been prepared in accordance with the International Financial
Reporting Standards (IFRS) and in particular in compliance with
International Accounting Standard (IAS) 34. In this context, IFRS
includes all standards issued by the International Accounting
Standards Board (IASB) and related interpretations issued by the
IFRS Interpretations Committee (IFRS IC). The variances between
the applicable IFRS standards as issued by the IASB and the
standards as used by the European Union are not relevant to these
financial statements.
Certain information and disclosures normally included in the
notes to annual financial statements prepared in accordance with
IFRS have been condensed or omitted. We believe that the
disclosures made are adequate and that the information gives a true
and fair view.
Our business activities are influenced by certain seasonal effects.
Historically, our overall revenue tends to be highest in the fourth
quarter. Interim results are therefore not necessarily indicative of
results for a full year.
Amounts reported in previous years have been reclassified if
appropriate to conform to the presentation in this half-year report.
These unaudited condensed Consolidated Half-Year Financial
Statements should be read in conjunction with SAP’s audited
Consolidated IFRS Financial Statements for the Year Ended
December 31, 2018, included in our Integrated Report 2018 and our
Annual Report on Form 20-F for 2018.
Due to rounding, numbers presented throughout these
Consolidated Half-Year Financial Statements may not add up
precisely to the totals we provide and percentages may not
precisely reflect the absolute figures.
Amounts disclosed in our Consolidated Half-Year Financial
Statements that are taken directly from our Consolidated Income
Statements or our Consolidated Statements of Financial Position
are marked by the symbols and , respectively.
Accounting Policies, Management Judgments and Sources of Estimation Uncertainty
How We Present Our Accounting Policies, Judgments, and Estimates
To ease the understanding of our financial statements, we
changed the presentation of the accounting policies, management
judgments, and sources of estimation uncertainty (hereafter:
accounting policies, judgments, and estimates) in our 2018
Consolidated Financial Statements. We presented the accounting
policies, judgments, and estimates on a given subject together with
other disclosures related to the same subject in the Note that dealt
with this subject. For easier identification of our accounting policies,
judgments, and estimates, the respective disclosures were marked
with the symbol and framed by a light gray box.
We continue this approach in this half-year report. We describe
however, only material changes of our accounting policies,
judgments, and estimates in relation to our 2018 Consolidated
Financial Statements in this report.
Changes of our accounting policies, judgments, and estimates
that do not relate to a specific subject are presented in the following
section.
The following table provides an overview of where our accounting
policies, management judgments, and estimates are disclosed:
Note Accounting Policies, Judgments, and Estimates
(IN.1) Basis for Preparation
(A.1) Revenue
(D.2) Property, Plant, and Equipment
(D.3) Adoption of IFRS 16
New Accounting Standards
For information about the estimated financial impacts of the
adoption of IFRS 16, see Notes (D.2) and (D.3.).

SAP Half-Year Report 2019 27
Section A – Customers
This section discusses disclosures related to contracts with our
customers. These consist of revenue breakdowns and information
about our trade receivables. For more information, see the Notes to
the 2018 Consolidated Financial Statements, Section A –
Customers.
(A.1) Revenue In the first half of 2019, there were no significant changes in our
revenue accounting policies. For more information about our
revenue accounting policies, see Note (A.1) to our 2018
Consolidated Financial Statements.
Geographic Information
Accounting Policy
The amounts for revenue by region in the following tables are based
on the location of customers.
Cloud Revenue by Region
€ millions Q1–Q2 2019 Q1–Q2 2018
EMEA 967 671
Americas 1,868 1,333
APJ 412 280
SAP Group 3,247 2,283
Cloud and Software Revenue by Region
€ millions Q1–Q2 2019 Q1–Q2 2018
EMEA 4,629 4,207
Americas 4,230 3,586
APJ 1,680 1,503
SAP Group 10,538 9,295
Total Revenue by Region
€ millions Q1–Q2 2019 Q1–Q2 2018
Germany 1,783 1,617
Rest of EMEA 3,754 3,445
EMEA 5,537 5,062
United States 4,245 3,573
Rest of Americas 957 851
Americas 5,202 4,424
Japan 526 443
Rest of APJ 1,457 1,331
APJ 1,983 1,774
SAP Group 12,722 11,260
For information about the breakdown of revenue by segment and
segment revenue by region, see Note (C.1).
(A.2) Trade and Other Receivables
€ millions 6/30/2019
Current Non-Current
Total
Trade receivables, net 5,893 32 5,925
Other receivables 181 110 291
Total 6,074 142 6,216
€ millions 12/31/2018
Current Non-Current
Total
Trade receivables, net 6,182 6 6,188
Other receivables 181 112 293
Total 6,363 118 6,480
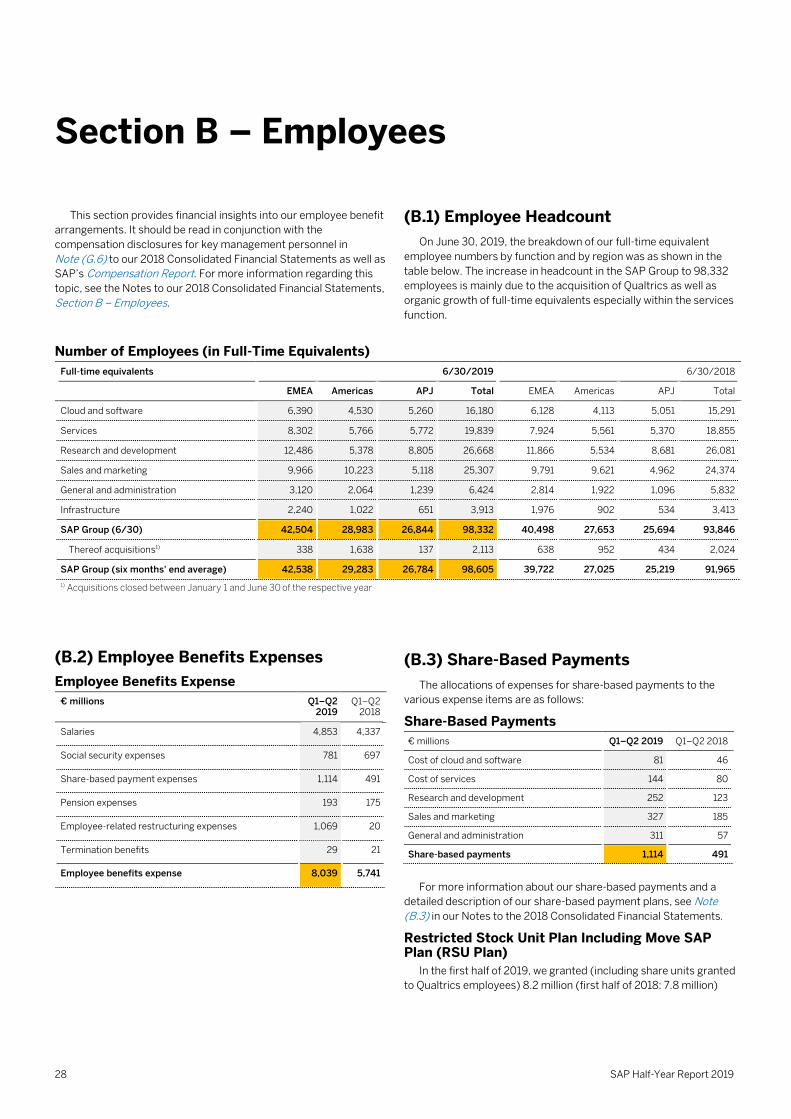
28 SAP Half-Year Report 2019
Section B – Employees
This section provides financial insights into our employee benefit
arrangements. It should be read in conjunction with the
compensation disclosures for key management personnel in
Note (G.6) to our 2018 Consolidated Financial Statements as well as
SAP’s Compensation Report. For more information regarding this
topic, see the Notes to our 2018 Consolidated Financial Statements,
Section B – Employees.
(B.1) Employee Headcount
On June 30, 2019, the breakdown of our full-time equivalent
employee numbers by function and by region was as shown in the
table below. The increase in headcount in the SAP Group to 98,332
employees is mainly due to the acquisition of Qualtrics as well as
organic growth of full-time equivalents especially within the services
function.
Number of Employees (in Full-Time Equivalents)
Full-time equivalents 6/30/2019 6/30/2018
EMEA Americas APJ Total EMEA Americas APJ Total
Cloud and software 6,390 4,530 5,260 16,180 6,128 4,113 5,051 15,291
Services 8,302 5,766 5,772 19,839 7,924 5,561 5,370 18,855
Research and development 12,486 5,378 8,805 26,668 11,866 5,534 8,681 26,081
Sales and marketing 9,966 10,223 5,118 25,307 9,791 9,621 4,962 24,374
General and administration 3,120 2,064 1,239 6,424 2,814 1,922 1,096 5,832
Infrastructure 2,240 1,022 651 3,913 1,976 902 534 3,413
SAP Group (6/30) 42,504 28,983 26,844 98,332 40,498 27,653 25,694 93,846
Thereof acquisitions1) 338 1,638 137 2,113 638 952 434 2,024
SAP Group (six months' end average) 42,538 29,283 26,784 98,605 39,722 27,025 25,219 91,965
1) Acquisitions closed between January 1 and June 30 of the respective year
(B.2) Employee Benefits Expenses
Employee Benefits Expense
€ millions Q1–Q2 2019
Q1–Q2 2018
Salaries 4,853 4,337
Social security expenses 781 697
Share-based payment expenses 1,114 491
Pension expenses 193 175
Employee-related restructuring expenses 1,069 20
Termination benefits 29 21
Employee benefits expense 8,039 5,741
(B.3) Share-Based Payments
The allocations of expenses for share-based payments to the
various expense items are as follows:
Share-Based Payments
€ millions Q1–Q2 2019 Q1–Q2 2018
Cost of cloud and software 81 46
Cost of services 144 80
Research and development 252 123
Sales and marketing 327 185
General and administration 311 57
Share-based payments 1,114 491
For more information about our share-based payments and a
detailed description of our share-based payment plans, see Note
(B.3) in our Notes to the 2018 Consolidated Financial Statements.
Restricted Stock Unit Plan Including Move SAP Plan (RSU Plan)
In the first half of 2019, we granted (including share units granted
to Qualtrics employees) 8.2 million (first half of 2018: 7.8 million)

SAP Half-Year Report 2019 29
share units to retain and motivate global executives and employees,
who make a significant sustained impact to our business success.
Own SAP Plan (Own)
The number of shares purchased by our employees under this
plan was 2.6 million in the first half of 2019 (first half of 2018:
2.6 million). The plan enables employees to purchase shares at
preferred conditions and build value by becoming an SAP
shareholder.
(B.4) Restructuring
€ millions Q1–Q2 2019
Q1–Q2 2018
Employee-related restructuring expenses
–1,069 –20
Onerous contract-related restructuring expenses and restructuring-related impairment losses
–16 –1
Restructuring expenses –1,085 –22
To further increase our focus on our key strategic growth areas,
SAP launched a company-wide restructuring program to further
simplify company structures and processes and to ensure that its
organizational setup, skillsets, and resource allocation all continue
to meet evolving customer demand. The main features of the
restructuring plan were announced on January 29, 2019.
Restructuring expenses are projected to be between €950 million
and €1,100 million, the vast majority of which was already
recognized in the first two quarters of 2019.
In the first half of 2019, approximately 1,400 employees left the
company under the plan. The cash outflow due to restructuring was
€233 million.
As at June 30, 2019, the restructuring provisions, which are
almost exclusively presented in current provisions, amount to
€868 million. Restructuring expenses primarily include employee
benefits that result from severance payments for employee
terminations.
If not presented separately, these restructuring expenses would
break down in our income statements as follows:
Restructuring Expenses by Functional Area
€ millions Q1–Q2 2019
Q1–Q2 2018
Cost of cloud and software –127 –3
Cost of services –169 –8
Research and development –443 –1
Sales and marketing –281 –9
General and administration –64 0
Restructuring expenses –1,085 –22

30 SAP Half-Year Report 2019
Section C – Financial Results
This section provides insight into the financial results of SAP's
reportable segments and of SAP overall, as far as not already
covered by previous sections. This includes segment results and
income taxes. For more information, see the Notes to the 2018
Consolidated Financial Statements, Section C – Financial Results.
(C.1) Results of Segments
General Information SAP has four operating segments that are regularly reviewed by
our Executive Board, which is responsible for assessing the
performance of our Company and for making resource allocation
decisions as our Chief Operating Decision Maker (CODM). The
operating segments are largely organized and managed separately
according to their product and service offerings, notably whether
the products and services relate to our business network activities,
customer and experience management solutions, or communication
offerings, or cover other areas of our business.
For more information about our segments, see Note (C.1) to our
2018 Consolidated Financial Statements.
In the first half of 2019, the following changes to the composition
of our operating segments occurred:
– The former SAP Business Network segment was renamed to
Intelligent Spend Group without any changes in the composition
of this segment.
– On January 23, 2019, we acquired Qualtrics and changed the
structure of our former Customer Experience segment. The
Qualtrics business was combined with our existing customer
experience solutions into a new business unit called Customer
and Experience Management. As a result, the former Customer
Experience segment was renamed to Customer and Experience
Management, and comprises on-premise and cloud-based
products that run front-office functions across the customer
experience and experience data.
– In 2018, revenues for one individual offering were reflected in the
former Customer Experience segment, and related research and
development costs were part of the Applications, Technology &
Services segment. Effective January 1, 2019, we changed this
allocation in our management reporting and consequently, in our
segment reporting: Revenues for this offering are now presented
in the Applications, Technology & Services segment.
– Further, we expanded the scope of our non-reportable Digital
Interconnect segment. It now comprises complete
communication channels, including our messaging services
combined with newly added telephony, video chat, and routing
(which were formerly part of the Applications, Technology &
Services segment and the former Customer Experience
segment).
The segment information for prior periods has been restated to
conform with these changes to our reportable segments.
In the first half of 2019, there were no significant changes in our
segment accounting policies. For a detailed overview of our segment
accounting policies, judgments, and sources for management
reporting, see Note (C.1) to our 2018 Consolidated Financial
Statements.

SAP Half-Year Report 2019 31
Applications, Technology & Services
€ millions Q1–Q2 2019 Q1–Q2 2018
Actual Currency
Constant Currency
Actual Currency
Cloud – SaaS/PaaS1) 1,163 1,125 849
Cloud – IaaS2) 327 315 217
Cloud 1,490 1,440 1,066
Software licenses 1,491 1,460 1,496
Software support 5,684 5,541 5,386
Software licenses and support 7,174 7,001 6,881
Cloud and software 8,665 8,441 7,947
Services 1,710 1,663 1,582
Total segment revenue 10,375 10,104 9,529
Cost of cloud – SaaS/PaaS1) –437 –421 –349
Cost of cloud – IaaS2) –239 –233 –195
Cost of cloud –677 –654 –544
Cost of software licenses and support –955 –933 –911
Cost of cloud and software –1,632 –1,587 –1,455
Cost of services –1,341 –1,312 –1,216
Total cost of revenue –2,973 –2,899 –2,671
Segment gross profit 7,402 7,205 6,858
Other segment expenses –3,311 –3,237 –3,138
Segment profit (loss) 4,092 3,968 3,721
1) Software as a service/platform as a service 2) Infrastructure as a service
Intelligent Spend Group
€ millions Q1–Q2 2019 Q1–Q2 2018
Actual Currency
Constant Currency
Actual Currency
Cloud – SaaS/PaaS1) 1,293 1,229 1,014
Cloud 1,293 1,229 1,014
Software licenses 0 0 0
Software support 8 8 8
Software licenses and support 8 7 8
Cloud and software 1,301 1,237 1,022
Services 225 214 210
Total segment revenue 1,526 1,451 1,233
Cost of cloud – SaaS/PaaS1) –283 –270 –229
Cost of cloud –283 –270 –229
Cost of software licenses and support –4 –4 –3
Cost of cloud and software –287 –274 –233
Cost of services –179 –172 –150
Total cost of revenue –466 –446 –382
Segment gross profit 1,060 1,005 850
Other segment expenses –746 –712 –622
Segment profit (loss) 314 293 229
1) Software as a service/platform as a service
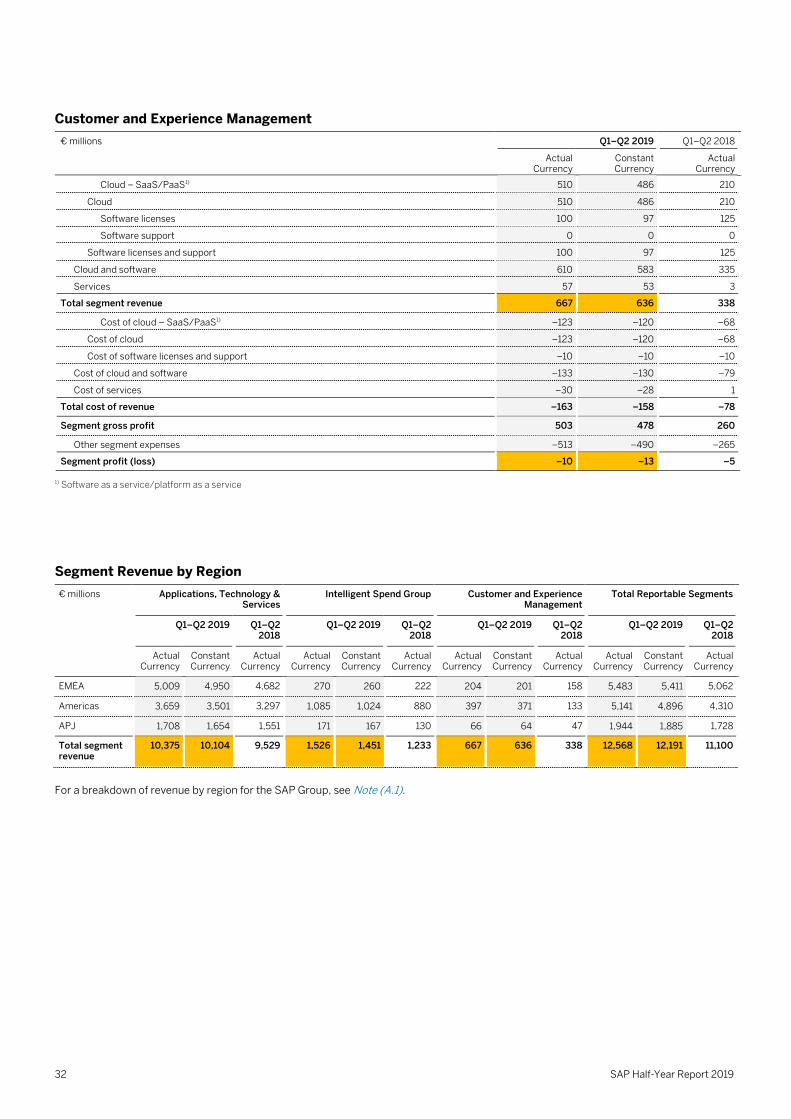
32 SAP Half-Year Report 2019
Customer and Experience Management
€ millions Q1–Q2 2019 Q1–Q2 2018
Actual Currency
Constant Currency
Actual Currency
Cloud – SaaS/PaaS1) 510 486 210
Cloud 510 486 210
Software licenses 100 97 125
Software support 0 0 0
Software licenses and support 100 97 125
Cloud and software 610 583 335
Services 57 53 3
Total segment revenue 667 636 338
Cost of cloud – SaaS/PaaS1) –123 –120 –68
Cost of cloud –123 –120 –68
Cost of software licenses and support –10 –10 –10
Cost of cloud and software –133 –130 –79
Cost of services –30 –28 1
Total cost of revenue –163 –158 –78
Segment gross profit 503 478 260
Other segment expenses –513 –490 –265
Segment profit (loss) –10 –13 –5
1) Software as a service/platform as a service
Segment Revenue by Region
€ millions Applications, Technology & Services
Intelligent Spend Group Customer and Experience Management
Total Reportable Segments
Q1–Q2 2019 Q1–Q2 2018
Q1–Q2 2019 Q1–Q2 2018
Q1–Q2 2019 Q1–Q2 2018
Q1–Q2 2019 Q1–Q2 2018
Actual Currency
Constant Currency
Actual Currency
Actual Currency
Constant Currency
Actual Currency
Actual Currency
Constant Currency
Actual Currency
Actual Currency
Constant Currency
Actual Currency
EMEA 5,009 4,950 4,682 270 260 222 204 201 158 5,483 5,411 5,062
Americas 3,659 3,501 3,297 1,085 1,024 880 397 371 133 5,141 4,896 4,310
APJ 1,708 1,654 1,551 171 167 130 66 64 47 1,944 1,885 1,728
Total segment revenue
10,375 10,104 9,529 1,526 1,451 1,233 667 636 338 12,568 12,191 11,100
For a breakdown of revenue by region for the SAP Group, see Note (A.1).

SAP Half-Year Report 2019 33
(C.2) Reconciliation of Segment Measures to Income Statement
€ millions Q1–Q2 2019 Q1–Q2 2018
Actual
Currency Constant Currency
Actual Currency
Applications, Technology & Services 10,375 10,104 9,529
Intelligent Spend Group 1,526 1,451 1,233
Customer and Experience Management 667 636 338
Total segment revenue for reportable segments 12,568 12,191 11,100
Other revenue 205 197 177
Adjustment for currency impact 0 385 0
Adjustment of revenue under fair value accounting –51 –51 –16
Total revenue 12,722 12,722 11,260
Applications, Technology & Services 4,092 3,968 3,721
Intelligent Spend Group 314 293 229
Customer and Experience Management –10 –13 –5
Total segment profit for reportable segments 4,396 4,248 3,944
Other revenue 205 197 177
Other expenses –1,319 –1,280 –1,245
Adjustment for currency impact 0 117 0
Adjustment for
Revenue under fair value accounting –51 –51 –16
Acquisition-related charges –341 –341 –278
Share-based payment expenses –1,114 –1,114 –491
Restructuring –1,085 –1,085 –22
Operating profit 691 691 2,069
Other non-operating income/expense, net –44 –44 –91
Financial income, net 29 29 28
Profit before tax 675 675 2,006
(C.3) Income Taxes
There have been no significant changes in contingent liabilities
from income tax-related litigation for which no provision has been
recognized compared to Note (C.5) in our Consolidated Financial
Statements for 2018, which is included in our Integrated Report
2018.
(C.4) Hyperinflation Accounting
We apply hyperinflation accounting for our subsidiaries in
Venezuela and Argentina, by restating the financial statements of
the respective subsidiaries for the current period to account for
changes in the general purchasing power of the local currency based
on relevant price indices at the reporting date. Most significantly
impacted by this accounting are equity (retained earnings and other
comprehensive income) (a decrease of €23 million versus a
decrease of €26 million in the first half of 2018) and contract
liabilities (an increase of €33 million versus an increase of
€70 million in the first half of 2018). The impact on our revenues and
operating profit is immaterial.

34 SAP Half-Year Report 2019
Section D – Invested Capital
This section highlights the non-current assets including
investments that form the basis of our operating activities. Additions
in invested capital include separate asset acquisitions or business
combinations. Further, we disclose information about the adoption
of IFRS 16. For more information, see our Notes to the 2018
Consolidated Financial Statements, Section D – Invested Capital.
(D.1) Business Combinations
We acquire businesses in specific areas of strategic interest to
us, particularly to broaden our product and service portfolio.
Prior-year acquisitions are described in our 2018 Consolidated
Financial Statements.
Acquisition of Qualtrics
On January 23, 2019, we concluded the acquisition of Qualtrics,
following satisfaction of applicable regulatory and other approvals
(also see Note (G.9) of our 2018 Consolidated Financial
Statements).
Qualtrics is a leading provider of experience management (XM)
solutions. By combining Qualtrics products and SAP products, we
aim to deliver an end-to-end experience and operational
management system to our customers.
We acquired 100% of the Qualtrics shares for approx. US$35 per
share, representing consideration transferred in cash of
approximately US$7.1 billion. In addition to the cash payments, SAP
will also incur liabilities and post-closing expenses relating to
assumed share-based payment awards amounting to approximately
US$0.9 billion.
The operating results and assets and liabilities of Qualtrics are
reflected in our consolidated financial statements from
January 23, 2019, onward.
Financial Impact as of the Acquisition Date
€ millions Qualtrics Consideration
Transferred
Cash paid 6,212
Liabilities incurred 237
Total consideration transferred 6,449
The liabilities incurred relate to the earned portion of unvested
share-based payment awards. These liabilities were incurred by
replacing, upon acquisition, equity-settled share-based payment
awards held by employees of Qualtrics with cash-settled share-
based payment awards, which are subject to forfeiture. The
respective liabilities represent the portion of the replacement
awards that relates to pre-acquisition services provided by the
acquiree’s employees and were measured at the fair value
determined under IFRS 2 as required by IFRS 3.
The following table summarizes the preliminary values of
identifiable assets acquired and liabilities assumed in connection
with the acquisition of Qualtrics, as of the acquisition date.
Recognized Amounts of Identifiable Assets Acquired and Liabilities Assumed
€ millions Qualtrics Contribution
Cash and cash equivalents 127
Other financial assets 1
Trade and other receivables 36
Other non-financial assets 20
Property, plant, and equipment 74
Intangible assets 1,803
Thereof acquired technology 575
Thereof customer relationship and other intangibles
1,226
Thereof software and database licenses 2
Total identifiable assets 2,061
Trade and other payables 85
Financial liabilities 54
Current and deferred tax liabilities 267
Provisions and other non-financial liabilities 39
Contract liabilities 127
Total identifiable liabilities 572
Total identifiable net assets 1,489
Goodwill 4,960
Total consideration transferred 6,449
The initial accounting for the Qualtrics business combination is
incomplete because we are still obtaining the information necessary
to identify and measure, for example, intangibles and tax-related
assets and liabilities (deferred taxes from investments in
subsidiaries, unused tax losses). It is also not yet possible to provide
final detailed information about each class of acquired receivables or
contingent liabilities. Accordingly, the amounts recognized in our
half-year financial statements for these items are provisional as of
June 30, 2019.
In general, the goodwill arising from our acquisitions consists
largely of the synergies and the know-how and technical skills of the
acquired businesses’ workforces.
Qualtrics goodwill is attributed to expected synergies from the
acquisition, particularly in the following areas:
– Cross-selling opportunities to existing SAP customers across all
regions, using SAP’s sales organization
– Creating new offerings by combining Qualtrics products and SAP
products to deliver an end-to-end experience and operational
management system to the customers
– Improved profitability in Qualtrics sales and operations

SAP Half-Year Report 2019 35
The allocation of the goodwill resulting from the Qualtrics
acquisition to our operating segments depends on how our
operating segments actually benefit from the synergies of the
Qualtrics business combination. We have not yet completed the
identification of those benefits.
For more information about our segments and about the changes
in our segment structure, see Note (C.1).
Impact of the Business Combination on Our Half-Year Financial
Statements
The amounts of revenue and profit or loss of the Qualtrics legal
entities acquired in 2019 since the acquisition date included in the
consolidated income statements for the reporting period are as
follows:
Impact on SAP’s Half-Year Financials
€ millions Q1–Q2 2019
as Reported
Contribution of Qualtrics
Revenue 12,722 165
Profit after tax 475 –301
Had Qualtrics been consolidated as of January 1, 2019, our
revenue and profit after tax for the reporting period would not have
been materially different.
(D.2) Property, Plant, and Equipment
Changed Estimates of Useful Lives
At the beginning of 2019, we changed our estimate of the expected
useful lives of certain computer hardware. This change from four to
five years is still within the range of two to six years that was
disclosed in the 2018 Integrated Report. This change reduces our
actual and expected depreciation expense by:
€49 million in the first half 2019 (thereof €35 million in cost of
cloud)
€93 million in the full year 2019 (thereof €71 million in cost of
cloud)
Property, Plant, and Equipment (Summary)
€ millions
6/30/2019 12/31/2018
Property, plant, and equipment excluding leases
3,575 3,553
Right-of-use assets 1,830 -
Total 5,405 3,553
(D.3) Adoption of IFRS 16
Accounting Policies, Judgments, and Estimates
On January 1, 2019, we adopted IFRS 16 ‘Leases.’ Using the modified
retrospective transition approach requires that the cumulative
effect of initially applying the standard be recognized as an
adjustment to the opening balance of retained earnings on the date
of initial application. The prior-year figures were not adjusted. The
new standard significantly impacts the lease accounting by lessees
as, in general, all leases need to be recognized on the lessee’s
balance sheet. A lessee recognizes a right-of-use asset representing
its right to use the underlying asset and a lease liability representing
its obligation to make lease payments. The nature of expenses
related to those leases has now changed because we recognize
depreciation expense for right-of-use assets and interest expense
on lease liabilities. These changes apply to leases that had
previously been classified as operating leases under IAS 17. We have
used practical expedients offered by the standard (such as non-
capitalization of short-term leases and low-value leases, and the use
of hindsight when determining the lease term if the contract
contains options to extend or terminate the lease). For measuring
our right-of-use assets for pre-existing leases, we have applied the
retrospective approach for our larger leases (primarily facility
leases), while smaller leases were measured at an amount equal to
the lease liability and adjusted by the amount of any prepaid or
accrued lease payments existing immediately prior to the date of
initial application.
Upon IFRS 16 adoption, lease liabilities from pre-existing leases
were discounted at the incremental borrowing rates as at
January 1, 2019. The weighted average discount rate applied to the
lease liabilities on January 1, 2019, was 2.5%.
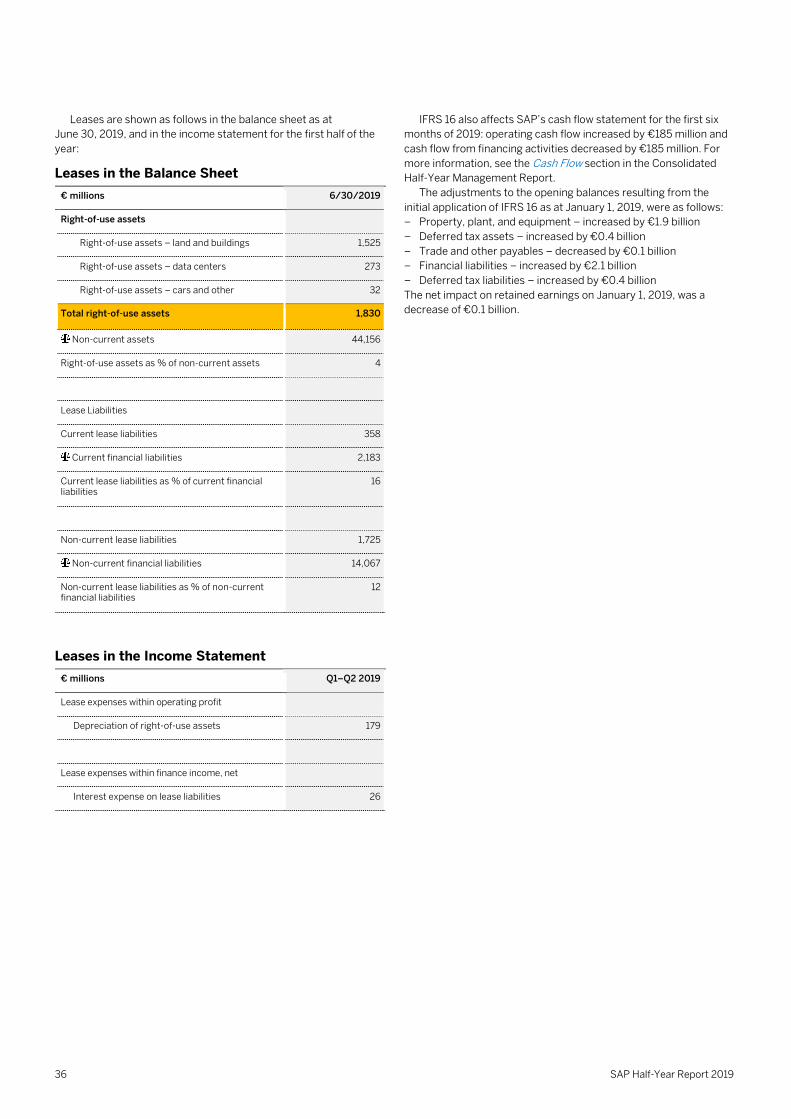
36 SAP Half-Year Report 2019
Leases are shown as follows in the balance sheet as at
June 30, 2019, and in the income statement for the first half of the
year:
Leases in the Balance Sheet
€ millions 6/30/2019
Right-of-use assets
Right-of-use assets – land and buildings 1,525
Right-of-use assets – data centers 273
Right-of-use assets – cars and other 32
Total right-of-use assets
1,830
Non-current assets 44,156
Right-of-use assets as % of non-current assets 4
Lease Liabilities
Current lease liabilities 358
Current financial liabilities 2,183
Current lease liabilities as % of current financial liabilities
16
Non-current lease liabilities 1,725
Non-current financial liabilities 14,067
Non-current lease liabilities as % of non-current financial liabilities
12
Leases in the Income Statement
€ millions Q1–Q2 2019
Lease expenses within operating profit
Depreciation of right-of-use assets 179
Lease expenses within finance income, net
Interest expense on lease liabilities 26
IFRS 16 also affects SAP’s cash flow statement for the first six
months of 2019: operating cash flow increased by €185 million and
cash flow from financing activities decreased by €185 million. For
more information, see the Cash Flow section in the Consolidated
Half-Year Management Report.
The adjustments to the opening balances resulting from the
initial application of IFRS 16 as at January 1, 2019, were as follows:
– Property, plant, and equipment – increased by €1.9 billion
– Deferred tax assets – increased by €0.4 billion
– Trade and other payables – decreased by €0.1 billion
– Financial liabilities – increased by €2.1 billion
– Deferred tax liabilities – increased by €0.4 billion
The net impact on retained earnings on January 1, 2019, was a
decrease of €0.1 billion.

SAP Half-Year Report 2019 37
Section E – Capital Structure, Financing and Liquidity
This section provides information related to how SAP manages
its capital structure. Our capital management is based on a high
equity ratio, modest financial leverage, a well-balanced maturity
profile, and deep debt capacity. For more information, see our Notes
to the 2018 Consolidated Financial Statements, Section E – Capital
Structure, Financing, and Liquidity.
(E.1) Total Equity
Number of Shares
millions Issued Capital Treasury Shares
12/31/2017 1,228.5 –35.1
Reissuance under share-based payments
0 0.2
6/30/2018 1,228.5 –34.9
12/31/2018 1,228.5 –34.9
6/30/2019 1,228.5 –34.9
Other Components of Equity
€ millions Exchange Differences Cash Flow Hedges Total
1/1/2018 330 18 347
Other comprehensive income1) 557 –22 536
6/30/2018 887 –4 883
12/31/2018 1,239 –5 1,234
Other comprehensive income1) 180 1 181
6/30/2019 1,419 –4 1,415
1) The exchange differences in other comprehensive income include the effect from hyperinflation accounting for our subsidiaries in Venezuela and Argentina.
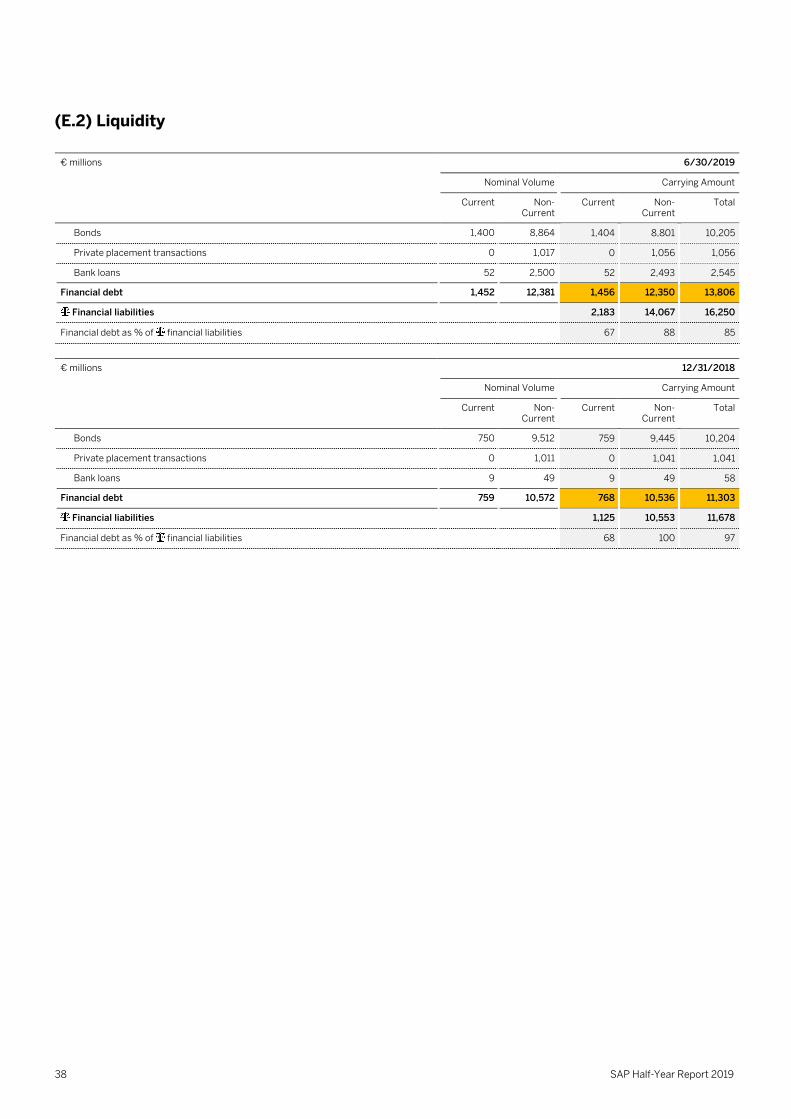
38 SAP Half-Year Report 2019
(E.2) Liquidity
€ millions 6/30/2019
Nominal Volume Carrying Amount
Current Non-Current
Current Non-Current
Total
Bonds 1,400 8,864 1,404 8,801 10,205
Private placement transactions 0 1,017 0 1,056 1,056
Bank loans 52 2,500 52 2,493 2,545
Financial debt 1,452 12,381 1,456 12,350 13,806
Financial liabilities 2,183 14,067 16,250
Financial debt as % of financial liabilities 67 88 85
€ millions 12/31/2018
Nominal Volume Carrying Amount
Current Non-Current
Current Non-Current
Total
Bonds 750 9,512 759 9,445 10,204
Private placement transactions 0 1,011 0 1,041 1,041
Bank loans 9 49 9 49 58
Financial debt 759 10,572 768 10,536 11,303
Financial liabilities 1,125 10,553 11,678
Financial debt as % of financial liabilities 68 100 97

SAP Half-Year Report 2019 39
Section F – Risk Management and Fair Value Disclosures
This section discusses financial risk factors and risk
management. In our half-year report, this includes the transfers
between levels of the fair value hierarchy. For more information,
particularly about our risk management related to foreign currency
exchange rate risk, interest rate risk, equity price risk, credit risk,
liquidity risk, and so on, see the Notes to the 2018 Consolidated
Financial Statements, Section F – Risk Management and Fair Value
Disclosures.
(F.1) Financial Risk Factors, Financial Risk Management, and Fair Value Disclosures on Financial Instruments
In the second quarter of 2019, the fair value estimate for SAP’s
investment in Looker Data Sciences Inc. (Looker) was adjusted to
reflect the estimated exit value based on Google LLC’s (Google)
announcement on June 6, 2019, that Google had entered into a
definitive agreement to acquire Looker. The closing of this
transaction is subject to regulatory approvals. The adjustment
resulted in gains recognized in finance income from financial assets
at fair value through profit and loss of €45 million. The investment in
Looker is held through our interest in Sapphire Ventures Fund II,
L.P., a consolidated venture investment fund.
A detailed overview of our other financial instruments, financial
risk factors, the management of financial risks, and the
determination of fair value as well as the classification of our other
financial instruments into the fair value hierarchy of IFRS 13 are
presented in Notes (F.1) and (F.2) in our 2018 Consolidated Financial
Statements.
We do not disclose the fair value of our financial instruments as of
June 30, 2019, for the following reasons:
– For a large number of our financial instruments, their carrying
amounts are a reasonable approximation of their fair values, and
– For those financial instruments where the carrying amount
differs from fair value, there was no material change in the
relation between carrying amount and fair value since
December 31, 2018.

40 SAP Half-Year Report 2019
Section G – Other Disclosures
This section provides additional disclosures on miscellaneous
topics, including information pertaining to other litigation, claims
and legal contingencies, and related party transactions. For more
information, see the Notes to the 2018 Consolidated Financial
Statements, Section G – Other Disclosures.
(G.1) Litigation, Claims, and Legal Contingencies
We are subject to a variety of claims and lawsuits that arise from
time to time in the ordinary course of our business, including
proceedings and claims that relate to companies we have acquired.
We will continue to vigorously defend against all claims and lawsuits
against us. We currently believe that resolving the claims and
lawsuits pending as of June 30, 2019, will neither individually nor in
the aggregate have a material adverse effect on our business,
financial position, profit, or cash flows. Consequently, the provisions
recorded for these claims and lawsuits as of June 30, 2019, are
neither individually nor in the aggregate material to SAP.
Among the claims and lawsuits are the following classes (for
more information about these classes, see our Integrated Report
2018, Notes to the Consolidated Financial Statements, Note (G.4)).
Intellectual Property-Related Litigation and Claims
There have been no significant changes to the amount of
provisions recorded for intellectual property-related litigation and
claims compared to the amounts disclosed in our Integrated Report
2018, Notes to the Consolidated Financial Statements, Note (G.4).
There have also been no significant changes in contingent liabilities
from intellectual property-related litigation and claims for which no
provision has been recognized.
For the individual cases of intellectual property-related litigation
and claims disclosed in our Integrated Report 2018, there were no
significant developments in the first half of 2019.
Tax-Related Litigation
There have been no significant changes in contingent liabilities
from non-income tax-related litigation for which no provision has
been recognized compared to Note (G.4) in our Consolidated
Financial Statements for 2018, which is included in our Integrated
Report 2018.
For more information about income tax-related litigation, see
Note (C.3).
Anti-Bribery and Export Control Matters
SAP received communications alleging conduct that may violate
anti-bribery laws (including the U.S. Foreign Corrupt Practices Act
(FCPA)) in Brazil, Indonesia, South Africa, and other countries.
Further, we voluntarily self-disclosed potential export controls and
economic sanctions violations. The investigations are ongoing and
neither the outcome of the investigations nor the date when
substantiated findings will be available is predictable at this point in
time. SAP enhanced its anti-corruption compliance program as well
as its export control compliance program throughout the last
months. We continue to be fully committed to anti-bribery laws and
export restriction controls and will continue full cooperation with all
parties involved.
It is impossible at this point in time to determine whether the
potential anti-bribery law violations and the potential export
restriction violations represent present obligations of SAP and, if so,
to reliably estimate the amount of these obligations. As a
consequence, as at June 30, 2019, no provisions have been
recognized for these potential violations in our consolidated financial
statements. It is currently also not practicable to estimate the
financial effect of any contingent liabilities that may result from
these potential violations.
For more information, see our Integrated Report 2018, Notes to
the Consolidated Financial Statements, Note (G.4).
(G.2) Related Party Transactions
Certain Executive Board and Supervisory Board members of
SAP SE currently hold (or have held within the last year) positions of
significant responsibility with other entities (for more information,
see our Integrated Report 2018, Notes to the Consolidated Financial
Statements, Note (G.5)). We have relationships with certain of these
entities in the ordinary course of business.
During the reporting period, we had no related party transactions
that had a material effect on our business, financial position, or
results in the reporting period.
For more information about related party transactions, see our
Integrated Report 2018, Notes to the Consolidated Financial
Statements, Note (G.7).
(G.3) Events After the Reporting Period
No events that have occurred since June 30, 2019, have a
material impact on the Company’s Consolidated Half-Year Financial
Statements.
Release of the Consolidated Half-Year Financial Statements
The Executive Board of SAP SE approved these consolidated
half-year financial statements on July 17, 2019, for submission to the
Audit Committee of the Supervisory Board and for subsequent
issuance.

SAP Half-Year Report 2019 41
(G.4) Scope of Consolidation
Total
12/31/2018 265
Additions 19
Disposals –11
06/30/2019 273
The additions in the first half of 2019 relate to legal entities added
in connection with acquisitions and foundations. The disposals are
mainly due to liquidations and mergers of legal entities.
For more information about our business combinations and the
effect on our Consolidated Financial Statements, see Note (D.1) and
our Integrated Report 2018.

42 SAP Half-Year Report 2019
Responsibility Statement To the best of our knowledge, and in accordance with the applicable reporting principles for half-year financial reporting, the Consolidated
Half-Year Financial Statements give a true and fair view of the assets, liabilities, financial position, and profit or loss of the SAP Group, and
the Consolidated Half-Year Management Report of the SAP Group includes a fair review of the development and performance of the
business and the position of the SAP Group, together with a description of the material opportunities and risks associated with the expected
development of the SAP Group for the remaining months of the financial year.
Walldorf, July 17, 2019
SAP SE
Walldorf, Baden
The Executive Board
Bill McDermott Adaire Fox-Martin
Christian Klein Michael Kleinemeier
Jennifer Morgan Luka Mucic
Jürgen Müller Stefan Ries

SAP Half-Year Report 2019 43
Supplementary Financial Information Financial and Non-Financial Key Facts (IFRS and Non-IFRS)
€ millions, unless otherwise stated Q1 2018
Q2 2018
Q3 2018
Q4 2018
TY 2018
Q1 2019
Q2 2019
Revenues
Cloud (IFRS) 1,070 1,213 1,304 1,406 4,993 1,555 1,692
Cloud (non-IFRS) 1,072 1,227 1,315 1,413 5,027 1,581 1,717
% change – yoy 18 32 40 42 33 48 40
% change constant currency – yoy 31 40 41 40 38 41 35
Software licenses (IFRS) 625 996 937 2,089 4,647 650 948
Software licenses (non-IFRS) 625 996 937 2,089 4,647 650 948
% change – yoy –10 –9 –9 1 –5 4 –5
% change constant currency – yoy –2 –5 –8 8 0 1 –6
Software support (IFRS) 2,656 2,735 2,765 2,825 10,981 2,838 2,854
Software support (non-IFRS) 2,656 2,735 2,765 2,826 10,982 2,838 2,854
% change – yoy –3 0 3 3 1 7 4
% change constant currency – yoy 5 7 6 3 5 4 2
Software licenses and support (IFRS) 3,281 3,731 3,702 4,914 15,628 3,489 3,802
Software licenses and support (non-IFRS) 3,281 3,731 3,702 4,914 15,629 3,489 3,802
% change – yoy –4 –2 0 2 –1 6 2
% change constant currency – yoy 4 3 2 5 4 3 0
Cloud and software (IFRS) 4,351 4,944 5,007 6,320 20,622 5,044 5,495
Cloud and software (non-IFRS) 4,353 4,958 5,017 6,327 20,655 5,070 5,520
% change – yoy 1 4 8 9 6 16 11
% change constant currency – yoy 9 10 10 11 10 12 8
Total revenue (IFRS) 5,261 5,999 6,020 7,428 24,708 6,091 6,631
Total revenue (non-IFRS) 5,262 6,014 6,031 7,434 24,741 6,118 6,656
% change – yoy 0 4 8 9 5 16 11
% change constant currency – yoy 9 10 10 13 11 12 8
Share of more predictable revenue (IFRS, in %) 71 66 68 57 65 72 69
Share of more predictable revenue (non-IFRS, in %) 71 66 68 57 65 72 69
Profits
Operating profit (loss) (IFRS) 1,025 1,044 1,236 2,399 5,703 –136 827
Operating profit (loss) (non-IFRS) 1,235 1,640 1,742 2,545 7,163 1,467 1,816
% change – yoy 3 4 6 8 6 19 11
% change constant currency – yoy 14 12 11 8 10 13 8
Profit (loss) after tax (IFRS) 708 718 972 1,691 4,088 –108 582
Profit (loss) after tax (non-IFRS) 868 1,171 1,358 1,802 5,199 1,080 1,317
% change – yoy –2 5 12 –16 –3 25 12
Margins
Cloud gross margin (IFRS, in %) 59.3 58.3 58.6 58.2 58.6 61.2 62.6
Cloud gross margin (non-IFRS, in %) 63.2 63.6 63.5 62.1 63.1 66.2 67.9
Software license and support gross margin (IFRS, in %) 85.7 85.8 86.0 88.3 86.6 84.6 86.0
Software license and support gross margin (non-IFRS, in %) 86.4 87.0 87.1 88.7 87.4 85.7 87.1
Cloud and software gross margin (IFRS, in %) 79.2 79.0 78.9 81.6 79.8 77.4 78.8
Cloud and software gross margin (non-IFRS, in %) 80.7 81.2 80.9 82.8 81.5 79.6 81.1
Gross margin (IFRS, in %) 68.5 68.6 68.3 72.9 69.8 66.5 68.2
Gross margin (non-IFRS, in %) 70.2 71.5 71.0 74.0 71.8 69.5 71.4
Operating margin (IFRS, in %) 19.5 17.4 20.5 32.3 23.1 –2.2 12.5
Operating margin (non-IFRS, in %) 23.5 27.3 28.9 34.2 29.0 24.0 27.3
AT&S segment – Cloud gross margin (in %) 49.1 48.8 48.1 46.9 48.2 53.2 55.9
AT&S segment – Segment gross margin (in %) 71.2 72.6 72.4 75.2 73.1 70.1 72.5
AT&S segment – Segment margin (in %) 36.5 41.3 41.8 46.8 42.1 36.3 42.3

44 SAP Half-Year Report 2019
€ millions, unless otherwise stated Q1 2018
Q2 2018
Q3 2018
Q4 2018
TY 2018
Q1 2019
Q2 2019
ISG segment – Cloud gross margin (in %) 77.4 77.4 78.4 78.0 77.8 78.0 78.2
ISG segment – Segment gross margin (in %) 68.7 69.3 69.1 69.2 69.1 69.2 69.7
ISG segment – Segment margin (in %) 16.7 20.3 23.0 20.4 20.2 21.6 19.6
CXM segment – Cloud gross margin (in %) 65.4 68.7 67.6 63.1 66.2 74.9 76.6
CXM segment – Segment gross margin (in %) 75.9 77.5 75.1 79.9 77.6 75.5 75.5
CXM segment – Segment margin (in %) –6.5 1.7 5.6 24.6 9.7 –2.3 –0.8
Key Profit Ratios
Effective tax rate (IFRS, in %) 28.3 29.5 24.1 26.9 27.0 23.2 28.6
Effective tax rate (non-IFRS, in %) 27.6 27.5 24.0 26.7 26.3 26.1 27.0
Earnings per share, basic (IFRS, in €) 0.59 0.60 0.81 1.41 3.42 –0.10 0.48
Earnings per share, basic (non-IFRS, in €) 0.73 0.98 1.14 1.51 4.35 0.90 1.09
Order Entry
New cloud and software order entry 1,346 2,332 2,221 4,533 10,432 1,579 2,404
% change – yoy 1 8 11 15 11 17 3
% change constant currency – yoy 10 12 12 18 14 13 1
New cloud bookings 245 421 411 736 1,814 324 494
% change – yoy 14 24 36 25 25 32 17
% change constant currency – yoy 25 29 37 23 28 26 15
Orders – number of cloud deals (in transactions) 2,376 3,032 3,375 6,055 14,839 2,956 3,609
Share of cloud orders greater than €5 million based on total cloud order entry volume (in %)
20 32 28 33 30 26 26
Share of cloud orders smaller than €1 million based on total cloud order entry volume (in %)
39 31 35 28 32 39 33
Orders – number of on-premise software deals (in transactions) 13,549 14,538 13,794 16,649 58,530 12,229 12,522
Share of orders greater than €5 million based on total software order entry volume (in %)
18 29 22 35 29 28 28
Share of orders smaller than €1 million based on total software order entry volume (in %)
50 41 42 33 39 42 36
Liquidity and Cash Flow
Net cash flows from operating activities 2,578 407 499 819 4,303 2,802 –122
Capital expenditure –427 –391 –328 –312 –1,458 –359 –180
Payments of lease liabilities NA NA NA NA NA –78 –106
Free cash flow 2,151 16 171 506 2,844 2,365 –409
% of total revenue (IFRS) 41 0 3 7 12 39 –6
% of profit after tax (IFRS) 304 2 18 30 70 –2,198 –70
Group liquidity, gross 8,270 4,688 4,738 8,838 8,838 7,673 5,280
Group debt –7,723 –7,660 –7,521 –11,331 –11,331 –13,866 –13,833
Group liquidity, net 546 –2,972 –2,784 –2,493 –2,493 –6,193 –8,553
Days sales outstanding (DSO, in days)1) 68 68 68 70 70 69 70
Financial Position
Cash and cash equivalents 7,598 4,516 4,507 8,627 8,627 7,332 5,168
Goodwill 20,856 23,406 23,523 23,736 23,736 29,108 28,801
Total assets 45,463 45,491 45,631 51,502 51,502 60,693 57,707
Contract liabilities (current) 5,046 4,867 3,600 3,028 3,028 6,068 5,558
Equity ratio (total equity in % of total assets) 56 57 59 56 56 48 48
Non-Financials
Number of employees (quarter end)2) 91,120 93,846 94,989 96,498 96,498 98,659 98,332
Employee retention (in %, rolling 12 months) 94.4 94.3 94.1 93.9 93.9 93.8 93.5
Women in management (in %, quarter end) 25.6 25.8 25.9 25.7 25.7 26.0 26.2
Greenhouse gas emissions (in kilotons) 100 75 65 70 310 110 75
1) Days sales outstanding measures the average number of days from the raised invoice to cash receipt from the customer. We calculate DSO by dividing the average invoiced trade receivables balance of the last 12 months by the average monthly cash receipt of the last 12 months. 2) In full-time equivalents.
Due to rounding, numbers may not add up precisely.

SAP Half-Year Report 2019 45
Reconciliation from Non-IFRS Numbers to IFRS Numbers – Half Year
€ millions, unless otherwise stated Q1–Q2 2019 Q1–Q2 2018 ∆ in %
IFRS Adj. Non-IFRS
Currency Impact
Non-IFRS Constant Currency
IFRS Adj. Non-IFRS
IFRS Non-IFRS
Non-IFRS Constant
Currency1)
Revenue Numbers
Cloud 3,247 51 3,299 –138 3,161 2,283 16 2,299 42 43 37
Software licenses 1,599 0 1,599 –33 1,565 1,621 0 1,621 –1 –1 –3
Software support 5,692 0 5,692 –143 5,549 5,391 0 5,391 6 6 3
Software licenses and support 7,291 0 7,291 –177 7,114 7,012 0 7,012 4 4 1
Cloud and software 10,538 51 10,589 –315 10,274 9,295 16 9,311 13 14 10
Services 2,184 0 2,184 –70 2,114 1,965 0 1,965 11 11 8
Total revenue 12,722 51 12,773 –385 12,389 11,260 16 11,276 13 13 10
Operating Expense Numbers
Cost of cloud –1,237 151 –1,086 –941 100 –841 31 29
Cost of software licenses and support
–1,069 79 –990 –1,001 71 –930 7 6
Cost of cloud and software –2,306 231 –2,075 –1,942 171 –1,771 19 17
Cost of services –1,845 146 –1,699 –1,600 86 –1,514 15 12
Total cost of revenue –4,151 377 –3,774 –3,542 257 –3,285 17 15
Gross profit 8,571 428 8,999 7,718 273 7,992 11 13
Research and development –2,114 257 –1,857 –1,761 127 –1,635 20 14
Sales and marketing –3,833 496 –3,337 –3,314 319 –2,995 16 11
General and administration –895 325 –570 –548 67 –481 63 19
Restructuring –1,085 1,085 0 –22 22 0 >100 NA
Other operating income/expense, net
48 0 48 –5 0 –5 <–100 <–100
Total operating expenses –12,031 2,540 –9,490 267 –9,223 –9,192 791 –8,401 31 13 10
Profit Numbers
Operating profit (loss) 691 2,592 3,283 –117 3,166 2,069 807 2,876 –67 14 10
Other non-operating income/expense, net
–44 0 –44 –91 0 –91 –51 –51
Finance income 286 0 286 185 0 185 55 55
Finance costs –258 0 –258 –157 0 –157 64 64
Financial income, net 29 0 29 28 0 28 3 3
Profit (loss) before tax 675 2,592 3,267 2,006 807 2,813 –66 16
Income tax expense –201 –669 –870 –580 –194 –774 –65 12
Profit (loss) after tax 475 1,923 2,397 1,426 613 2,039 –67 18
Attributable to owners of parent
455 1,923 2,378 1,425 613 2,038 –68 17
Attributable to non-controlling interests
20 0 20 0 0 0 >100 >100
Key Ratios
Operating margin (in %) 5.4 25.7 25.6 18.4 25.5 –12.9pp 0.2pp 0.0pp
Effective tax rate (in %)2) 29.7 26.6 28.9 27.5 0.8pp –0.9pp
Earnings per share, basic (in €) 0.38 1.99 1.19 1.71 –68 17
1) Constant-currency period-over-period changes are calculated by comparing the current year's non-IFRS constant-currency numbers with the non-IFRS number of the previous year's respective period. 2) The difference between our effective tax rate (IFRS) and effective tax rate (non-IFRS) in the first half of 2019 mainly results from tax effects of share-based payment expenses, restructuring expenses and acquisition-related charges.
Due to rounding, numbers may not add up precisely.

46 SAP Half-Year Report 2019
Non-IFRS Adjustments Actuals and Estimates – Half Year
€ millions Estimated Amounts for
Full Year 2019
Q1–Q2 2019 Q1–Q2 2018
Operating profit (loss) (IFRS) 691 2,069
Revenue adjustments 70–120 51 16
Adjustment for acquisition-related charges 650–750 341 278
Adjustment for share-based payment expenses 1,650–1,900 1,114 491
Adjustment for restructuring 950–1,100 1,085 22
Operating expense adjustments 2,540 791
Operating profit (loss) adjustments 2,592 807
Operating profit (loss) (non-IFRS) 3,283 2,876
Non-IFRS-Adjustments by Functional Areas – Half Year
€ millions Q1–Q2 2019 Q1–Q2 2018
IFRS Acqui- sition-
Related
SBP1) Restruc-turing
Non-IFRS IFRS Acqui- sition-
Related
SBP1) Restruc-turing
Non-IFRS
Cost of cloud and software –2,306 150 81 0 –2,075 –1,942 126 46 0 –1,771
Cost of services –1,845 3 144 0 –1,699 –1,600 5 80 0 –1,514
Research and development –2,114 5 252 0 –1,857 –1,761 3 123 0 –1,635
Sales and marketing –3,833 169 327 0 –3,337 –3,314 134 185 0 –2,995
General and administration –895 14 311 0 –570 –548 10 57 0 –481
Restructuring –1,085 0 0 1,085 0 –22 0 0 22 0
Other operating income/expense, net
48 0 0 0 48 –5 0 0 0 –5
Total operating expenses –12,031 341 1,114 1,085 –9,490 –9,192 278 491 22 –8,401
1) Share-based payments
Due to rounding, numbers may not add up precisely.
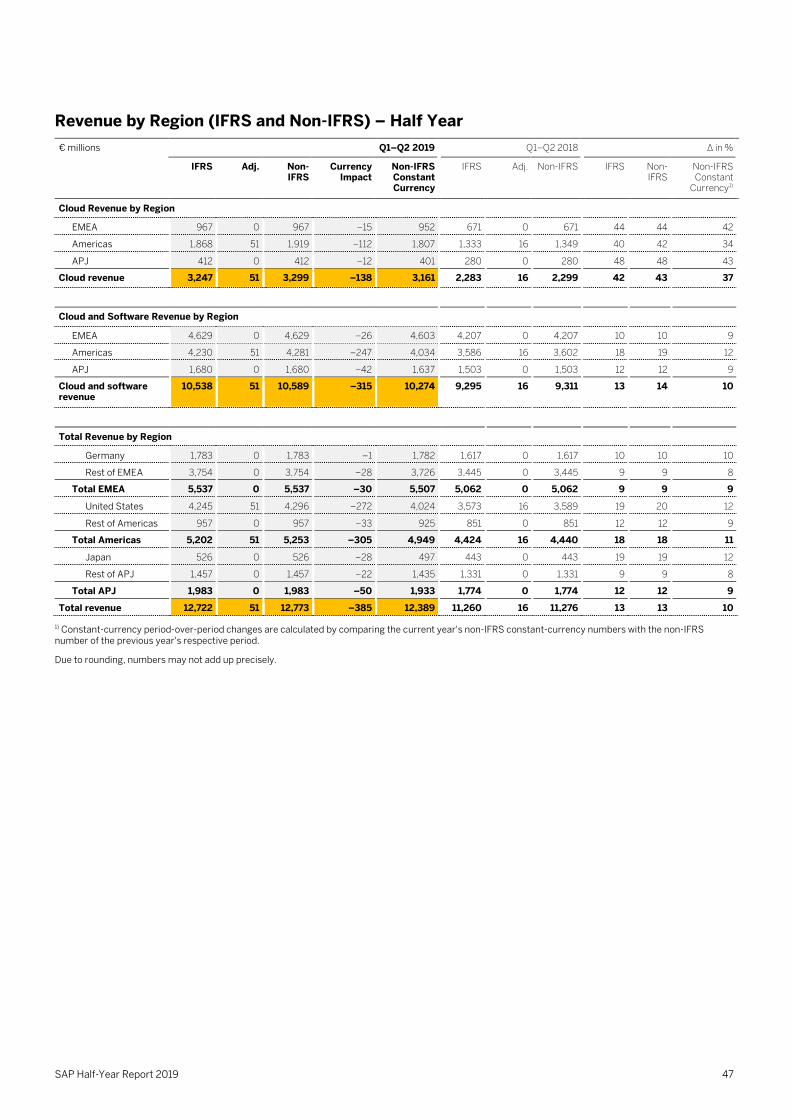
SAP Half-Year Report 2019 47
Revenue by Region (IFRS and Non-IFRS) – Half Year
€ millions Q1–Q2 2019 Q1–Q2 2018 ∆ in %
IFRS Adj. Non-IFRS
Currency Impact
Non-IFRS Constant Currency
IFRS Adj. Non-IFRS IFRS Non-IFRS
Non-IFRS Constant
Currency1)
Cloud Revenue by Region
EMEA 967 0 967 –15 952 671 0 671 44 44 42
Americas 1,868 51 1,919 –112 1,807 1,333 16 1,349 40 42 34
APJ 412 0 412 –12 401 280 0 280 48 48 43
Cloud revenue 3,247 51 3,299 –138 3,161 2,283 16 2,299 42 43 37
Cloud and Software Revenue by Region
EMEA 4,629 0 4,629 –26 4,603 4,207 0 4,207 10 10 9
Americas 4,230 51 4,281 –247 4,034 3,586 16 3,602 18 19 12
APJ 1,680 0 1,680 –42 1,637 1,503 0 1,503 12 12 9
Cloud and software revenue
10,538 51 10,589 –315 10,274 9,295 16 9,311 13 14 10
Total Revenue by Region
Germany 1,783 0 1,783 –1 1,782 1,617 0 1,617 10 10 10
Rest of EMEA 3,754 0 3,754 –28 3,726 3,445 0 3,445 9 9 8
Total EMEA 5,537 0 5,537 –30 5,507 5,062 0 5,062 9 9 9
United States 4,245 51 4,296 –272 4,024 3,573 16 3,589 19 20 12
Rest of Americas 957 0 957 –33 925 851 0 851 12 12 9
Total Americas 5,202 51 5,253 –305 4,949 4,424 16 4,440 18 18 11
Japan 526 0 526 –28 497 443 0 443 19 19 12
Rest of APJ 1,457 0 1,457 –22 1,435 1,331 0 1,331 9 9 8
Total APJ 1,983 0 1,983 –50 1,933 1,774 0 1,774 12 12 9
Total revenue 12,722 51 12,773 –385 12,389 11,260 16 11,276 13 13 10
1) Constant-currency period-over-period changes are calculated by comparing the current year's non-IFRS constant-currency numbers with the non-IFRS number of the previous year's respective period.
Due to rounding, numbers may not add up precisely.

48 SAP Half-Year Report 2019
General Information
Forward-Looking Statements
This half-year report contains forward-looking statements and
information based on the beliefs of, and assumptions made by, our
management using information currently available to them. Any
statements contained in this report that are not historical facts are
forward-looking statements as defined in the U.S. Private Securities
Litigation Reform Act of 1995. We have based these forward-looking
statements on our current expectations, assumptions, and
projections about future conditions and events. As a result, our
forward-looking statements and information are subject to
uncertainties and risks, many of which are beyond our control. If one
or more of these uncertainties or risks materializes, or if
management’s underlying assumptions prove incorrect, our actual
results could differ materially from those described in or inferred
from our forward-looking statements and information. We describe
these risks and uncertainties in the Risk Management and Risks
section, respectively in the there-mentioned sources.
The words “aim,” “anticipate,” “assume,” “believe,” “continue,”
“could,” “counting on,” “is confident,” “development,” “estimate,”
“expect,” “forecast,” ”future trends,” “guidance,” “intend,” “may,”
”might,” “outlook,” “plan,” “project,” “predict,” “seek,” “should,”
“strategy,” “want,” “will,” “would,” and similar expressions as they
relate to us are intended to identify such forward-looking
statements. Such statements include, for example, those made in
the Operating Results section, the Risk Management and Risks
section, the Expected Developments and Opportunities section, and
other forward-looking information appearing in other parts of this
half-year financial report. To fully consider the factors that could
affect our future financial results, both our Integrated Report 2018
and our Annual Report on Form 20-F for December 31, 2018, should
be considered, as well as all of our other filings with the Securities
and Exchange Commission (SEC). Readers are cautioned not to
place undue reliance on these forward-looking statements, which
speak only as of the date specified or the date of this report. We
undertake no obligation to publicly update or revise any forward-
looking statements as a result of new information that we receive
about conditions that existed upon issuance of this report, future
events, or otherwise unless we are required to do so by law.
This report includes statistical data about the IT industry and
global economic trends that comes from information published by
sources including International Data Corporation (IDC), the
European Central Bank (ECB), and the International Monetary Fund
(IMF). This type of data represents only the estimates of IDC, ECB,
IMF, and other sources of industry data. SAP does not adopt or
endorse any of the statistical information provided by sources such
as IDC, ECB, IMF, or other similar sources that is contained in this
report. The data from these sources is subject to risks and
uncertainties, and subject to change based on various factors,
including those described above, in the Risk Management and Risks
section, and elsewhere in this report. These and other factors could
cause our results to differ materially from those expressed in the
estimates made by third parties and SAP. We caution readers not to
place undue reliance on this data.
All of the information in this report relates to the situation as at
June 30, 2019, or the half year ended on that date unless otherwise
stated.
Non-IFRS Financial Information
This half-year report contains non-IFRS measures as well as
financial data prepared in accordance with IFRS. We present and
discuss the reconciliation of these non-IFRS measures to the
respective IFRS measures in the Supplementary Financial
Information section. For more information about non-IFRS
measures, see our Web site www.sap.com/investors/sap-non-ifrs-
measures.

SAP Half-Year Report 2019 49
Additional Information
Financial Calendar
October 21, 2019
Third-quarter 2019 earnings release, telephone conference
November 12, 2019
Special Capital Markets Day, New York
January 28, 2020
Fourth-quarter and full-year 2019 preliminary earnings release,
telephone conference
May 20, 2020
Annual General Meeting of Shareholders, Mannheim, Germany
Investor Services
Additional information about this half-year report is available
online at www.sap.com/investors, including the official quarterly
statement, a presentation about the quarterly results, and a
recording of the conference call for financial analysts.
The “Financial Reports” tab contains the following publications:
– SAP Integrated Report (IFRS, PDF,
www.sapintegratedreport.com)
– SAP Annual Report on Form 20-F (IFRS, PDF)
– SAP SE Statutory Financial Statements and Review of Operations
(HGB, German only, PDF)
– Half-Year Report (IFRS, PDF)
– Quarterly Statements (IFRS, PDF)
www.sap.com/investors is also the place to look for in-depth
information about stock, debt, and corporate governance; financial
and event news; and various services designed to help investors find
the information they need fast (see "Investor Services”). These
include an e-mail and text message news service, and a Twitter feed.
For sustainability reasons and faster distribution, SAP decided to
refrain from printing reports.
Only a limited number of the Excerpt from the Integrated Report
was printed for the Annual General Meeting of Shareholders.
You can reach us by phone at +49 6227 7-67336, send a fax to
+49 6227 7-40805, or e-mail us at [email protected].
Addresses
SAP SE
Dietmar-Hopp-Allee 16
69190 Walldorf
Germany
Tel. +49 6227 7-47474
Fax +49 6227 7-57575
Internet www.sap.com
E-mail [email protected]
The addresses of all our international subsidiaries and sales partners
are available on our public Web site at
www.sap.com/directory/main.html.
Information About Content Investor Relations
Tel. +49 6227 7-67336
Fax +49 6227 7-40805
E-mail [email protected]
Twitter @SAPinvestor
Internet www.sap.com/investor
Imprint
Overall responsibility:
SAP SE
Corporate Financial Reporting
Published on July 18, 2019
The German version of this Half-Year Report can be found under
https://www.sap.com/corporate/de/investors.html.
Copyright Usage in Collateral © 2019 SAP SE or an SAP affiliate company. All rights reserved.
No part of this publication may be reproduced or transmitted in
any form or for any purpose without the express permission of SAP
SE or an SAP affiliate company.
SAP and other SAP products and services mentioned herein as
well as their respective logos are trademarks or registered
trademarks of SAP SE (or an SAP affiliate company) in Germany and
other countries. Please see www.sap.com/corporate-
en/legal/copyright for additional trademark information and
notices.


![SAP S/4HANA on-premise · 2020. 10. 7. · SAP S/4HANA Enterprise Management for Productivity use [7018653] SAP S/4HANA Enterprise Management for Functional use [7018654] S/4HANA](https://img.pdfslide.net/doc/110x75/61037dbaded08646435a08b8/sap-s4hana-on-premise-2020-10-7-sap-s4hana-enterprise-management-for-productivity.jpg)