Embed Size (px)
Citation preview


Table of Contents
Insert the appropriate page numbers once the agency has completed the report.
I. Executive Summary ____________________________________________________ Page 1
Historical Perspective ______________________________________________ Page 1
Purpose, Mission & Vision __________________________________________ Page 1
Key Performance Measurement Results _______________________________ Page 1
II. Organizational Profile _________________________________________________ Page 2
III. Laws (Statutes, Regulations, Provisos) ____________________________________ Page 4
IV. Reports & Reviews ___________________________________________________ Page 4
V. Key Performance Measurement Processes _________________________________ Page 5
VI. Seven‐Year Plan
General ________________________________________________________ Page 32
Recommended Changes ___________________________________________ Page 32
Additional Information ____________________________________________ Page 36
VII. Charts Appendix ____________________________________________________ Page 37

1 | P a g e
Does the agency already provide the information requested on this page, or similar information, in a report required by another entity? If yes, add the appropriate information to the Similar Information Requested Chart. If the agency looks in the Excel document attached, there is a template for the agency to complete for any questions which ask for the same information under the tab labeled, “Similar Info Requested.”
EXECUTIVE SUMMARY
I. Executive Summary
A. Historical Perspective
1. Please reference the Historical Perspective Chart in the Excel document. This chart provides a list of major changes in the agency’s purpose or mission and any restructuring that occurred (i.e., combining with or taking on other agency responsibilities, etc.) during the last ten years.
B. Purpose, Mission and Vision
1. Please reference the Purpose/Mission/Vision Chart in the Excel document. This chart details the “Purpose, Mission, and Vision” of the Agency.
C. Key Performance Measure Results
1. After completing the Key Performance Measurement Processes Section of this Report, please come back to this question and provide a summary of the results (bullet style results only, explanations should be included in the Key Performance Measurement Processes Section).
Reduce the Fatality Rate on SC highways.
Reduce structurally deficient bridge statistics.
Manage pavement assets.
Manage transit cost per passenger trip.
Deliver construction projects on or under budget.
Transit provider satisfaction.
Deliver construction projects on time.
Workforce retention.
Employee Recognition programs.
Workforce Development.
Workplace Accidents/Injuries.
Disadvantaged Business Enterprise Program.
2 | P a g e
Does the agency already provide the information requested on this page, or similar information, in a report required by another entity? If yes, add the appropriate information to the Similar Information Requested Chart. If the agency looks in the Excel document attached, there is a template for the agency to complete for any questions which ask for the same information under the tab labeled, “Similar Info Requested.”
ORGANIZATIONAL PROFILE
II. Organizational Profile This section asks for a fact based description of the agency. Please provide information in the stated Excel template. If an Excel template is not referenced, provide the information in bullet style.
The agency’s main deliverables (i.e., products or services) and the primary methods by which these are provided;
a. Please reference the Key Deliverables Chart in the Excel document.
The agency’s key customers and their requirements and expectations; a. Please reference the Key Customers Chart in the Excel document.
The agency’s key stakeholders (other than customers); a. Please reference the Key Stakeholders Chart in the Excel document.
Other state agencies which have the biggest impact on the agency’s mission success; a. Please reference the Key Partner Agency Chart in the Excel document.
The agency’s performance improvement system(s); a. Strategic Direction b. 2040 Multimodal Plan c. Program and Resource Analysis Meeting (PRAM)
The agency’s organizational structure in flow chart format;
SC Governor
Secretary of Transportation
Deputy for Engineering
Deputy for Finance &
Procurement
Deputy for Intermodal Planning
Director of Support Services
Director of LegalDirector of Small
Business & Minority Affairs
Director of Human Resources
Chief of Staff
Commission
Internal Audits
General
Assembly

3 | P a g e
Does the agency already provide the information requested on this page, or similar information, in a report required by another entity? If yes, add the appropriate information to the Similar Information Requested Chart. If the agency looks in the Excel document attached, there is a template for the agency to complete for any questions which ask for the same information under the tab labeled, “Similar Info Requested.”
Details about the body to whom the Agency Head reports; a. Please reference the Overseeing Body Chart in the Excel document.
Please reference Major Program Areas Chart in the Excel document.
Please identify any emerging issues the agency anticipates may have an impact on its operations in the upcoming five years.
a. Solvency of the federal Highway Trust Fund since SCDOT receives over 60% of its funding from federal government (i.e., the Highway Trust Fund).
b. Need for a federal long‐term/multi‐year Surface Transportation Authorization Bill that would provide authority for SCDOT to plan and let projects.
c. Lack of ability to maintain Infrastructure with current funding. d. Inability to provide multimodal needs for highways, bridges,
bicycle/pedestrian, and transit with expected increase in residents, tourist, and businesses.

4 | P a g e
Does the agency already provide the information requested on this page, or similar information, in a report required by another entity? If yes, add the appropriate information to the Similar Information Requested Chart. If the agency looks in the Excel document attached, there is a template for the agency to complete for any questions which ask for the same information under the tab labeled, “Similar Info Requested.”
ORGANIZATIONAL PROFILE
III. Laws (Statutes, Regulations, Provisos) This section asks for state and federal statutes, regulations and provisos (“Laws”) which apply to the agency.
1. Please reference the Legal Standards Chart in the Excel document containing both state
and federal statutes, regulations and provisos that apply to the agency (“Laws”).
IV. Reports and Reviews This section asks for information about reports the agency is required to submit to a legislative entity and the agency’s internal review process.
1. Please reference the Agency Reporting Requirements Chart in the Excel document of all
reports, the agency is required to make to a legislative entity.
2. Please reference the Internal Audit Chart in the Excel document.

5 | P a g e
Does the agency already provide the information requested on this page, or similar information, in a report required by another entity? If yes, add the appropriate information to the Similar Information Requested Chart. If the agency looks in the Excel document attached, there is a template for the agency to complete for any questions which ask for the same information under the tab labeled, “Similar Info Requested.”
RESTRUCTURING REPORT
V. Key Performance Measurement Processes This category examines the agency’s performance and improvement in key areas. Performance levels are examined relative to those of competitors and other organizations providing similar programs and services. Information is typically displayed by the use of performance measures. Quantitative measures may be supplemented by a discussion of qualitative measures where appropriate; however, every effort should be made to use appropriate quantitative measures that can be charted to show trends and comparisons to benchmarks. Address only top‐level results showing aggregate measures of agency‐wide performance that are reflective of the value added to customers. Please include comparative data as applicable. These results are typically captured in performance goals and planning documents. When determining which processes are “key processes” consider the business impacts, and select those processes that are most important to the customer (both internal and external) to satisfy their requirements and/or those processes with problem areas identified by management. Note: Results information (i.e., each chart, graph, table) reported for this category should be referenced to the specific question number (Ex. Chart 5.1‐1, Graph 5.1‐2, Table 5.1‐3). The third digit identifies the sequential position of the specific chart, graph or table included in the agency’s responses to each questions.
For each performance measurement included in response to the questions on the next page under Subsection A, please provide the following information:
a. The performance goal(s)/benchmark(s) for the overall process output, and/or critical activities that produce the output. i. Three agency/government entities in other states or non‐government entities the
agency considers the best in the country in this process or similar process and why. ii. If the agency did not use results from an entity the agency listed in response to “i”
as a performance goal/benchmark, why not and why did the agency choose the goal/benchmark it did?
iii. Individual(s) who are not employed by the agency (government or non‐government, located anywhere in the country) whom the agency considers an expert in the process or similar process and their contact information, or if deceased, name of books authored.
b. List the senior leaders who review the performance measure, their title and frequency with which they monitor it.
c. Trends the agency has seen and the method by which it analyzes trends in these results. d. Whether the agency has reasonable control over this result (i.e., more than 50% or
enough to be able to influence and accurately measure the result). i. If the agency does not have reasonable control over this result, the other one or
more agencies, who when combined with the agency, together have reasonable control over the result and names of those other agencies.

6 | P a g e
Does the agency already provide the information requested on this page, or similar information, in a report required by another entity? If yes, add the appropriate information to the Similar Information Requested Chart. If the agency looks in the Excel document attached, there is a template for the agency to complete for any questions which ask for the same information under the tab labeled, “Similar Info Requested.”
RESTRUCTURING REPORT
V. Key Performance Measurement Processes (cont.)
A. Results of Agency’s Key Performance Measurements
SCDOT routinely compares performance metrics to neighboring and regional states including North Carolina, Georgia, and Florida. SCDOT is a member of SASHTO, the Southeastern Association of State Highway & Transportation Officials. The departments of transportation from Alabama, Arkansas, Florida, Georgia, Kentucky, Louisiana, Mississippi, North Carolina, Puerto Rico, South Carolina, Tennessee, Virginia and West Virginia are the member states of SASHTO. SCDOT is also looking to other states known for best practices in performance management including, but not limited to, Utah, Oregon, Missouri, and Virginia. Industry experts include Pete Rahn and John Njord. SCDOT also relies on guidance and expertise offered by AASHTO (American Association of State Highway & Transportation Officials), FHWA and FTA. SCDOT staff participates in many peer exchanges and serves on numerous AASHTO committees on policy matters. Effective with the last federal surface transportation authorization, the federal program is migrating towards a performance management approach to the National Highway System. Once the rulemaking and national benchmarking is established and vetted, SCDOT will be able to compare our management and performance levels of the National Highway System in SC with other segments of the federal system in other states. Based on the national movement towards a risk‐based performance management approach to assets, SCDOT is in the process of preparing a Transportation Asset Management Plan (TAMP) that incorporates all components of the system (federal‐aid and non federal‐aid eligible) under SCDOT’s responsibility as the lead transportation agency for the state of SC.

7 | P a g e
Does the agency already provide the information requested on this page, or similar information, in a report required by another entity? If yes, add the appropriate information to the Similar Information Requested Chart. If the agency looks in the Excel document attached, there is a template for the agency to complete for any questions which ask for the same information under the tab labeled, “Similar Info Requested.”
Mission Effectiveness 1. What are the agency’s actual performance levels for two to four of the agency’s key
performance measurements for mission effectiveness (i.e., a process characteristic indicating the degree to which the process output (work product) conforms to statutory requirements (i.e., is the agency doing the right things?))?
Secretary Oakley and the Senior leadership team of SCDOT recently updated and launched a Strategic Management Plan, called Strategic Direction. This living document is structured to identify the most important goals of the agency, emphasis areas and priority actions to be accomplished as we perform our mission. Below are three items selected from the many measures that SCDOT tracks regarding our effectiveness of our annual program: Fatalities (Safety), Structurally Deficient Bridges and Pavement Condition.
1a. Performance Benchmark: Providing a safe transportation system is a top priority of SCDOT. SECTION 57‐1‐30 of the SC Code of Laws identifies that the goal of the department is to provide adequate, safe, and efficient transportation services for the movement of people and goods. As such, SCDOT produces, in coordination with the SC Department of Public Safety and FHWA, the State of South Carolina’s Strategic Highway Safety Plan (SHSP) in accordance with the requirements of 23 USC § 148(d), Highway Safety Improvement Program. The current DRAFT Plan, entitled Target Zero, is indicative of the state’s commitment to eliminating traffic fatalities and severe injuries over time. SC routinely benchmarks itself against the national fatality rates
Chart 5.1-1

8 | P a g e
Does the agency already provide the information requested on this page, or similar information, in a report required by another entity? If yes, add the appropriate information to the Similar Information Requested Chart. If the agency looks in the Excel document attached, there is a template for the agency to complete for any questions which ask for the same information under the tab labeled, “Similar Info Requested.”
as well as compares itself to the Southern Region of the United States. In 2013, traffic fatalities were lowest since 1982 and fatalities per vehicle miles traveled is lowest ever recorded in the state. However, SC is still approximately 50% above the national fatality rate.
i. Leaders: SC is considered a national leader in using a data‐driven approach to safety. Other states such as Tennessee DOT and Georgia DOT have emulated some of our innovative practices on using a data‐driven approach to project selection.
ii. Benchmark Selection: All states utilize similar crash, fatality and serious injury metrics.
iii. National Experts: a. Mr. Jeff Shaw, FHWA’s Intersection Safety Program
Manager. (708) 283‐3524. [email protected] b. Ms. Jennifer Warren, FHWA’s Safety Program Coordinator
(202) 366‐2157 [email protected]
1b. Responsibility Assignment: The Deputy Secretary for Engineering, Christy Hall, is assigned the Highway Safety component of SCDOT’s program. However, this effort is a multi‐agency coordination operation. The Target Zero DRAFT plan was prepared through consultation with our Governor’s Highway Safety Representative, regional and metropolitan planning organizations, representatives of the major modes of transportation, the South Carolina Highway Patrol and local law enforcement agencies, the highway‐rail grade crossing safety representative, representatives conducting motor carrier safety programs under Section 31102, 31106, or 31309 of Title 49, motor vehicle administration agencies, state representative of non‐motorized users, county transportation officials, and other Federal, State, tribal, and local safety stakeholders. The DRAFT SHSP continues to address key emphasis areas and contains additional recommendations for appropriate strategies and countermeasures based on data‐driven and evidence‐based practices toward the goal of eliminating fatalities and severe injuries on South Carolina roads. A Steering Committee was formed for the purpose of updating the state’s Strategic Highway Safety Plan. Members of the committee include representatives from the SC Department of Transportation, the SC Department of Public Safety, the Federal Highway Administration, and the National Highway Traffic Safety Administration. The Committee used a data‐driven approach to identify emphasis areas for the updated SHSP and held monthly meetings to discuss each emphasis area, reviewing the data analysis results and proposing strategies to eliminate the number of fatalities and severe injuries for that particular emphasis area. Strategies were explored from the point of view of the 4Es: Engineering, Enforcement, Education, and Emergency Medical Services. Performance measures and goals were established as well as the process for evaluating progress toward meeting those goals. Additionally, the SCDOT Traffic Engineering Office provides a monthly fatality report to the SCDOT Commission and is scheduled to produce a quarterly report in accordance with the Engineering Division Goals as part of the Secretary of Transportation’s Strategic Direction.

9 | P a g e
Does the agency already provide the information requested on this page, or similar information, in a report required by another entity? If yes, add the appropriate information to the Similar Information Requested Chart. If the agency looks in the Excel document attached, there is a template for the agency to complete for any questions which ask for the same information under the tab labeled, “Similar Info Requested.”
1c. Trends: As demonstrated in Chart 5.1‐1, the overall trend in SC is a steady decline in the fatality rate on SC highways. In 2013, traffic fatalities per vehicle miles traveled is the lowest ever recorded in the state yet it was still approximately 50% above the national rate. The raw crash data is reviewed in detail by technical staff with SCDOT and SCDPS. Once the technical review is completed, possible emphasis areas are identified based on trends within the data and those items are presented to the Steering Committee for consideration in the SHSP. 1d. Control over outcomes: The crash data indicates that Driver Behavior is a major factor. 41% of all vehicle occupant fatalities and serious injuries were not wearing seatbelts 26% of all fatal and serious injury crashes were alcohol related 35% of fatal and serious injury crashes were speed related
The data also indicates that Roadway Departure is the leading factor of fatal and serious injury crashes. Over 40% of all traffic fatality and serious injury crashes involve vehicles leaving roadway About 1/3 of all rural interstate crash fatalities and serious injuries involve a vehicle
striking a tree
i. Strategies for countermeasures are explored from the point of view of the 4Es: Engineering, Enforcement, Education, and Emergency Medical Services. For the ones involving Engineering, such as rumble strips, roundabout construction, signage, etc, SCDOT clearly has the lead. As noted above, roadway departure is the leading factor in nearly half of the fatality and serious injury crashes. Accordingly, SCDOT has launched a robust countermeasure program designed to target this contributing factor to fatalities, such as rumble strips, rumble stripes, select tree clearing projects along the interstate, safety edge, paved shoulders and shoulder widenings. Our partners in the SHSP each also play a role for their respective area of control: SCDPS, SCDMV, local law enforcement, local emergency medical services and FHWA.

10 | P a g e
Does the agency already provide the information requested on this page, or similar information, in a report required by another entity? If yes, add the appropriate information to the Similar Information Requested Chart. If the agency looks in the Excel document attached, there is a template for the agency to complete for any questions which ask for the same information under the tab labeled, “Similar Info Requested.”
1a. Performance Benchmark: Providing a safe transportation system is a top priority of SCDOT. SECTION 57‐1‐30 of the SC Code of Laws identifies that the goal of the department is to provide adequate, safe, and efficient transportation services for the movement of people and goods. The condition and structural health of our state’s bridges play a critical role in the economy and everyday lives of citizens and visitors to the Palmetto state. Effective with the last federal surface transportation authorization, the federal program is migrating towards a performance management approach to the National Highway System. Once the rulemaking and national benchmarking is established and vetted, SCDOT will be able to compare our management and performance levels of the National Highway System in SC with other segments of the federal system in other states. Within the SASHTO region of the Nation and based on 2013 data, SC ranked:
4th in number of State Owned Bridges 4th in number of Structurally Deficient Bridges 8th in number of Functionally Obsolete Bridges 6th in number of Substandard Bridges
Based on 2013 data, SC compared nationally:
Structurally Deficient Bridges: Nationwide @ 6.2% ‐vs‐ SC @ 9.9% Functionally Obsolete Bridges: Nationwide @ 13.1% ‐vs‐ SC @ 9.2% Substandard Bridges: Nationwide @ 19.4% ‐vs‐ SC @ 19.1%
Mill
ions
of S
quar
e F
eet
2.7%
8.1%
8.4%
Chart 5.1-2a
January 2015 data

11 | P a g e
Does the agency already provide the information requested on this page, or similar information, in a report required by another entity? If yes, add the appropriate information to the Similar Information Requested Chart. If the agency looks in the Excel document attached, there is a template for the agency to complete for any questions which ask for the same information under the tab labeled, “Similar Info Requested.”
i. Leaders: CalTrans, Florida DOT, NCDOT, Oregon DOT and Ohio DOT are viewed by SCDOT as national leaders in effectively managing their bridge assets.
ii. Benchmark Selection: All states will be utilizing a =< 10% target for structurally deficient bridge deck area on the NHS. Based on our preliminary assessment of SC’s data, SCDOT is expecting to have a favorable report that approximately 4.9% of the NHS bridge deck area is structurally deficient. SCDOT will be determining over the next year or so, what reasonable targets need to be established for the state’s use for both the NHS and non‐NHS portions of the state system.
iii. National Experts: a. Michael B. Johnson, CalTrans, Chief Specialty Inventory & Bridge
Management (916) 227‐8768 b. Richard I. Kerr, Florida DOT, Bridge Inspection Project Manager
(850) 410‐5808 [email protected]
1b. Responsibility Assignment: The Deputy Secretary for Engineering, Christy Hall, is assigned the responsibility for managing the state’s bridge assets. Over time, this will be a shared function from a resourcing recommendation standpoint with the Deputy Secretary for Intermodal Planning as the TAMP matures. 1c. Trends: Over the past several years, SCDOT has seen a downward trend in the number of structurally deficient bridges in SC. However, in the 1960’s SC built a significant number of precast concrete bridges on timber piles with lower design loadings that today’s standards. Without additional funding, other applied countermeasures and innovations, the number of structurally deficient bridges is expected to again begin to increase over time.
SCDOT Owned Bridges by System, Classification and Restriction Data as of January 23, 2015
Table 5.1-2b

12 | P a g e
Does the agency already provide the information requested on this page, or similar information, in a report required by another entity? If yes, add the appropriate information to the Similar Information Requested Chart. If the agency looks in the Excel document attached, there is a template for the agency to complete for any questions which ask for the same information under the tab labeled, “Similar Info Requested.”
1d. Control over outcomes: The large “bubble” of older bridges that were built in the 1960’s are approaching the end of their expected service life. The challenge is to balance currently available financial resources across all assets (bridges, pavements, widenings, operations, etc) while trying to achieve reasonable performance targets over time.
i. Strategies for countermeasures are (based on current funding levels):
Move away from primarily a replacement oriented program to one that is more balanced to include more rehabilitation and preservation to extend bridge service life
Put increased emphasis on reducing public user costs associated with load restricted and closed bridges
Use of modern standard non‐site specific bridge designs with an alternative project development process to quickly program and deliver bridge replacement projects.
Continue to use Asset Management/Maintenance contracts to protect and preserve critical assets. Consider additional selected privatization projects for preservation assistance where most effective and beneficial.
Work with the legislature, truckers, Oversize/Overweight permit load haulers and the railroads to control the loadings on bridges while promoting continued needs and services for commerce.
Use of Structural Health Monitoring (SHM) Technology has provided benefits and savings in bridge repairs, upgrades and restrictions by testing for actual
1,041 1,010 1,023 1,008938 907 852 839 822
0
200
400
600
800
1000
1200
2007 2008 2009 2010 2011 2012 2013 2014 2015
Fiscal Year
SCDOT Owned Structurally Deficient Bridges Chart 5.1-2c

13 | P a g e
Does the agency already provide the information requested on this page, or similar information, in a report required by another entity? If yes, add the appropriate information to the Similar Information Requested Chart. If the agency looks in the Excel document attached, there is a template for the agency to complete for any questions which ask for the same information under the tab labeled, “Similar Info Requested.”
load carrying performance. SCDOT was recently awarded a federal Accelerated Innovation Deployment (AID) demonstration program grant to acquire some Structural Health Monitors. This technology will enable SCDOT to determine more effectively actual loadings on bridge structures where load restrictions are being evaluated.
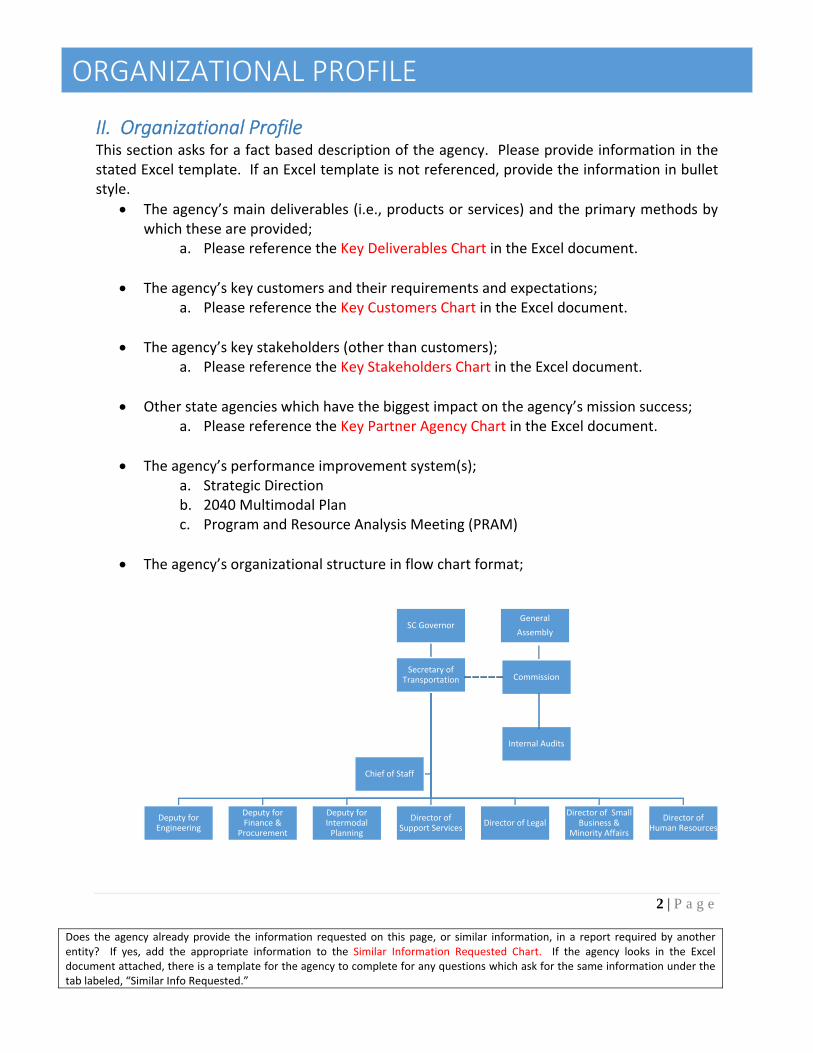
1a. Performance Benchmark: Providing a safe transportation system is a top priority of SCDOT. SECTION 57‐1‐30 of the SC Code of Laws identifies that the goal of the department is to provide adequate, safe, and efficient transportation services for the movement of people and goods. Pavement condition is a key component to the assessing the overall health of the state’s transportation network. South Carolina has the fourth largest highway system in the nation, consisting of approximately 41,414 centerline miles of roadway and a little over 90,530 lane miles. The aging transportation system coupled with an insufficient funding source intensifies the challenge faced by SCDOT and our partners to maintain and preserve the transportation infrastructure in a safe and acceptable condition. As depicted in the chart above and subsequent charts below, much of the pavement condition has eroded to either fair or poor condition. SCDOT will be determining over the next year or so, what reasonable targets need to be established for the state’s use for both the NHS and non‐NHS portions of the state system.
Chart 5.1-3a
Overall Assessment of SC’s Pavements
System Components: Based on Lane Miles
%Traffic Riding on Pavement
Condition Type
December 30, 2013 data

14 | P a g e
Does the agency already provide the information requested on this page, or similar information, in a report required by another entity? If yes, add the appropriate information to the Similar Information Requested Chart. If the agency looks in the Excel document attached, there is a template for the agency to complete for any questions which ask for the same information under the tab labeled, “Similar Info Requested.”
Table 5.1-3b
i. Leaders: SCDOT Staff is of the opinion that the states of Utah and Minnesota have good pavement preservation and management programs.
ii. Benchmark Selection: Effective with the last federal surface transportation authorization, the federal program is migrating towards a performance management approach to the National Highway System. Once the rulemaking and national benchmarking is established and vetted, SCDOT will be able to compare our management and performance levels of the National Highway System in SC with other segments of the federal system in other states.
iii. National Expert: Larry Galehouse is the director of the National Center for Pavement Preservation. (517) 432‐8220 [email protected]
1b. Responsibility Assignment: The Deputy Secretary for Engineering, Christy Hall, is assigned the responsibility for managing the state’s pavement assets. Over time, this will be a shared function from a resourcing recommendation standpoint with the Deputy Secretary for Intermodal Planning as the TAMP matures. 1c. Trends: As demonstrated in the charts included in this report, the overall trend for pavement condition in the state has been in a steady decline, with the exception of the interstate system which has seen some gradual improvement. With the passage of ACT 98, SCDOT is forecasting that the downward trend on the Non‐Federal Aid Secondary system pavements will begin to reverse and improve over time. It is anticipated that the Non‐Federal Aid system pavements will eventually begin to gain at a rate of about 1% per year, given the investment of ACT 98.
The State System

15 | P a g e
Does the agency already provide the information requested on this page, or similar information, in a report required by another entity? If yes, add the appropriate information to the Similar Information Requested Chart. If the agency looks in the Excel document attached, there is a template for the agency to complete for any questions which ask for the same information under the tab labeled, “Similar Info Requested.”
Chart 5.1‐3c
Interstate System Pavement Condition Trends
Primary System Pavement Condition Trends Chart 5.1‐3d
16 | P a g e
Does the agency already provide the information requested on this page, or similar information, in a report required by another entity? If yes, add the appropriate information to the Similar Information Requested Chart. If the agency looks in the Excel document attached, there is a template for the agency to complete for any questions which ask for the same information under the tab labeled, “Similar Info Requested.”
Federal Aid Eligible Secondary System Pavement Condition Trends Chart 5.1‐3e
Non-Federal Aid Eligible Secondary System Pavement Condition Trends Chart 5.1‐3f
17 | P a g e
Does the agency already provide the information requested on this page, or similar information, in a report required by another entity? If yes, add the appropriate information to the Similar Information Requested Chart. If the agency looks in the Excel document attached, there is a template for the agency to complete for any questions which ask for the same information under the tab labeled, “Similar Info Requested.”
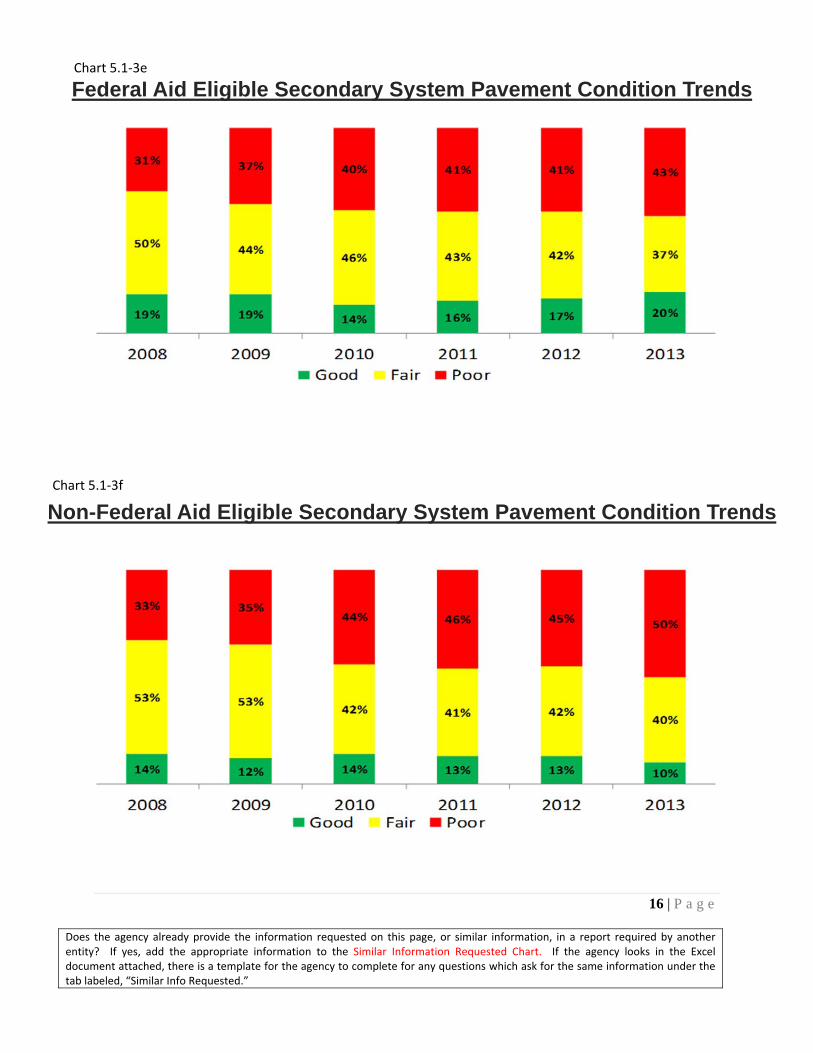
1d. Control over outcomes: The challenge is to balance currently available financial resources across all assets (bridges, pavements, widenings, operations, etc) while trying to achieve reasonable performance targets over time. The current restrictions on resources allocated to the Non‐Federal Aid, preclude SCDOT from effectively managing all resources across all components of the state system. In particular, the federal aid eligible portion of the Secondary system and the Primary System compete for the few federal dollars that are allocated in accordance with ACT 114 and Commission approval for pavement preservation and rehabilitation.
i. Strategies for countermeasures are: Keep the Good Pavements Good Intercept Fair roads Follow the traffic Target Roads on the Freight Network Deploy innovative preservation & rehab practices Quickly deploy actual ACT 98 revenues annually
Mission Efficiency 1. What are the agency’s actual performance levels for two to four of the agency’s key
performance measurements for mission efficiency (i.e., a process characteristic indicating the degree to which the process produces the required output at minimum resource cost (i.e., is the agency doing things right?)) including measures f cost containment, as appropriate?
Secretary Oakley and the Senior leadership team of SCDOT recently updated and launched a Strategic Management Plan, called Strategic Direction. This living document is structured to identify the most important goals of the agency, emphasis areas and priority actions to be accomplished as we perform our mission. Below are two items selected from the many measures that SCDOT tracks regarding our efficiency of the delivery of our annual program: Statewide Transit Cost Per Passenger Trip and Paid versus Bid for construction projects.

18 | P a g e
Does the agency already provide the information requested on this page, or similar information, in a report required by another entity? If yes, add the appropriate information to the Similar Information Requested Chart. If the agency looks in the Excel document attached, there is a template for the agency to complete for any questions which ask for the same information under the tab labeled, “Similar Info Requested.”
2a. Performance Benchmark: Cost per passenger trip is calculated by dividing the reported
operating expenditures by the total number of reported passenger trips. A lower cost is indicative of enhanced efficiency. Operating expenditures are defined as costs necessary to operate a transit system, and include labor, fuel, employee benefits, taxes, etc, and do not include capitalized maintenance expenses. Public Transit Ridership and Efficiency Countermeasures: Over the past few years SCDOT has introduced innovative initiatives and modified existing programs that were aimed at lessening the impact of fiscal difficulties many transit providers were facing. SCDOT also worked with a number of public transit agencies in developing Financial Recovery and Sustainability Plans. In doing so, we were able to assist our state’s public transit providers in becoming more fiscally sustainable, addressing budget shortfalls while new fiscal management processes were implemented, and maximizing the drawdown of available federal transit funding. SCDOT also deployed a technical assistance and oversight program with all public transit agencies in the state to ensure that the scope and associated costs of transit services are commensurate with available and projected revenues. This has resulted in an ongoing “right‐sizing” of transit services statewide to better ensure long‐term fiscal sustainability, which benefits ridership through increased efficiencies.
Statewide Transit Cost per Passenger Trip
Chart 5.2‐1

19 | P a g e
Does the agency already provide the information requested on this page, or similar information, in a report required by another entity? If yes, add the appropriate information to the Similar Information Requested Chart. If the agency looks in the Excel document attached, there is a template for the agency to complete for any questions which ask for the same information under the tab labeled, “Similar Info Requested.”
SCDOT is also leading an effort in partnership with DHHS, and through the SC Interagency Transportation Coordination Council, to develop an interagency Human Services Transportation Infrastructure Review. The purpose of the review is to identify and develop the most effective and cost‐efficient transportation coordination model for South Carolina. The ultimate goal of this effort currently underway is to reduce overall public and human services transportation costs in a manner that maintains or enhances the delivery of transit services across agencies, while reducing the fiscal impact to the state as a whole.
i. SCDOT routinely compares performance metrics to neighboring and regional
states including North Carolina, Georgia, and Florida. SCDOT is also looking to other states known for best practices in performance management including, but not limited to, Utah, Oregon, Missouri, and Virginia.
ii. Industry experts include Pete Rahn and John Njord. SCDOT also relies on guidance and expertise offered by AASHTO and the FHWA.
2b. Senior leaders include Deputy Secretary Mark Lester and Director Doug Frate. Efficiency numbers are reported annually. SCDOT is finalizing a Transit Information Management System that will allow us to monitor performance more frequently.
2c. The five‐year trend analysis shows a 4% decrease in average operating cost per passenger trip since 2010.
2d. SCDOT is largely dependent on the success of our local transit providers. iv. A list of South Carolina transit providers can be found at
http://www.scdot.org/getting/publicTransit_Providers.aspx

20 | P a g e
Does the agency already provide the information requested on this page, or similar information, in a report required by another entity? If yes, add the appropriate information to the Similar Information Requested Chart. If the agency looks in the Excel document attached, there is a template for the agency to complete for any questions which ask for the same information under the tab labeled, “Similar Info Requested.”
2a. Performance Benchmark: SECTION 57‐1‐30 of the SC Code of Laws identifies that the goal of the department is to provide adequate, safe, and efficient transportation services for the movement of people and goods. Efficient management of construction contracts, including change orders, are critical to SCDOT’s success in delivery of its annual program. As indicated in the chart above, SCDOT has efficiently managed construction contracts such that actual paid is slightly under bid amount.
i. SCDOT routinely compares performance metrics to neighboring and regional
states including North Carolina, Georgia, and Florida. SCDOT is also looking to other states known for best practices in performance management.
ii. SCDOT also relies on guidance and expertise offered by AASHTO, SASHTO states and the FHWA.
2b. SCDOT’s Senior leadership team (Secretary and Deputies) reviews this data monthly in
the PRAM meetings as well as the SCDOT Commission in its monthly meeting. 2c. The data is reviewed on a rolling 12 month basis. Based on the data reported within the
PRAM, SCDOT has consistently delivered the construction projects less than original bid amount.
2d. SCDOT has a great deal of control over this particular measure as it has the ability to
modify scope of work and effectively negotiate with road and bridge contractors.
Management of Construction Costs (Actual vs Bid) Chart 5.2‐2

21 | P a g e
Does the agency already provide the information requested on this page, or similar information, in a report required by another entity? If yes, add the appropriate information to the Similar Information Requested Chart. If the agency looks in the Excel document attached, there is a template for the agency to complete for any questions which ask for the same information under the tab labeled, “Similar Info Requested.”
Quality (Customer Satisfaction) 3. What are the agency’s actual performance levels for two to four of the agency’s key
performance measurements for quality (i.e., degree to which a deliverable (product or service) meets customer requirements and expectations (a customer is defined as an actual or potential user of the agency’s products or services)) for the agency as a whole and for each program listed in the agency’s Major Program Areas Chart?
Secretary Oakley and the Senior leadership team of SCDOT recently updated and launched a Strategic Management Plan, called Strategic Direction. This living document is structured to identify the most important goals of the agency, emphasis areas and priority actions to be accomplished as we perform our mission. Below are two items selected from the many measures that SCDOT tracks regarding our customer satisfaction regarding the delivery of our annual program: Transit Services and On‐time delivery of our construction projects.
3a. 88% of transit providers are either satisfied or very satisfied with the services provided by the Office of Transit as found by a recent customer survey conducted by the Office of Transit.
i. SCDOT routinely compares performance metrics to neighboring and regional states including North Carolina, Georgia, and Florida. SCDOT is also looking to other states known for best practices in performance management including, but not limited to, Utah, Oregon, Missouri, and Virginia.
ii. Industry experts include Pete Rahn and John Njord. SCDOT also relies on guidance and expertise offered by AASHTO and the FHWA.
3b. Senior leaders include Deputy Secretary Mark Lester and Director Doug Frate. This is the
first survey of this type the Office of Transit has conducted. This survey will be conducted on an annual basis going forward to monitor progress.
3c. Trend data is not yet available. 3d. SCDOT does have reasonable control of this measure.

22 | P a g e
Does the agency already provide the information requested on this page, or similar information, in a report required by another entity? If yes, add the appropriate information to the Similar Information Requested Chart. If the agency looks in the Excel document attached, there is a template for the agency to complete for any questions which ask for the same information under the tab labeled, “Similar Info Requested.”
3a. As indicated in the above chart, 74% of the construction projects are delivered on schedule (original and adjusted). The public expects timely delivery of construction projects in order to minimize disruption of the motoring public. When delivery of the road or bridge to the public is delayed, the public expects that responsible parties are held accountable. Accordingly, 20% of our contracts were charged penalties due to missing anticipated completion dates.
i. SCDOT currently does not have a formal process for benchmarking this
information to other states. This information was recently added to the monthly PRAM reportings, in order to enable Senior Leadership to have visibility to this important performance measure.
ii. SCDOT also relies on guidance and expertise offered by AASHTO, SASHTO states and the FHWA.
3b. SCDOT’s Senior leadership team (Secretary and Deputies) now reviews this data monthly
in the PRAM meetings as well as the SCDOT Commission in its monthly meeting. 3c. Trend data is not yet available. 3d. SCDOT exercises what control it has over this item through contract penalties.
On time Delivery of Construction Projects Chart 5.3‐1
SWCK = Substantial Work Complete

23 | P a g e
Does the agency already provide the information requested on this page, or similar information, in a report required by another entity? If yes, add the appropriate information to the Similar Information Requested Chart. If the agency looks in the Excel document attached, there is a template for the agency to complete for any questions which ask for the same information under the tab labeled, “Similar Info Requested.”
Workforce Engagement 4. What are the agency’s actual performance levels for two to four of the agency’s key
performance measurements for workforce engagement, satisfaction, retention and development of the agency’s workforce, including leaders, for the agency as a whole and for each program listed in the agency’s Major Program Areas Chart?
1. Retention (Trades Workers) 2. Development of Agency’s Workforce
{V.A.4.1. Retention (Trades Specialists)} 4a. Performance Benchmark: SCDOT’s overall turnover rate increased from 10% in 2008‐
2009 to 13% in 2013‐2014. The turnover rate for our entry level trades position was 26% in 2013‐2014. State Government turnover rate for 2013‐2014 was 14%. Employees in trades job classifications represent approximately 45% of our full‐time equivalent positions (fte’s).
i. In response to the increasing turnover numbers, the Department completed a salary survey in the Summer of 2014 collecting relevant salary averages for trades positions from South Carolina State Government, the City of Columbia, counties, SC Metropolitan Statistical Areas, the private sector, and the American Association of State Highway and Transportation Officials (AASHTO).
ii. Not Applicable. iii. SCDOT utilizes the annual AASHTO salary survey, which provides
visibility into all 50 states salary ranges by job classification.
4b. SCDOT’s Senior leadership team (Secretary and Deputies) now reviews this data monthly in the PRAM meetings as well as the SCDOT Commission in its monthly meeting.
4c. Retention of these employees was increasingly becoming more difficult. The Department hired trades’ employees and trained them to obtain their Commercial Drivers’ License (CDL). Once the CDL was received, the employee became more marketable for other entities and many left the Department for a higher salary.
Our salary minimums were lower than our counterparts.
Our average salaries were low in comparison to related positions.
In order to try to mitigate turnover issues, we worked with the State Division of Human Resources and received approval to increase the salary minimums for our trades positions and to award salary adjustments for employees classified in the trades series

24 | P a g e
Does the agency already provide the information requested on this page, or similar information, in a report required by another entity? If yes, add the appropriate information to the Similar Information Requested Chart. If the agency looks in the Excel document attached, there is a template for the agency to complete for any questions which ask for the same information under the tab labeled, “Similar Info Requested.”
effective November 17, 2014. Total number of employees that were affected by the study: 2,047
Between 2008 and 2014, SCDOT lost nearly 16% of its workforce. In 2014, through a comprehensive set of initiatives including streamlined hiring practices, increased recruiting, enhanced employee recognition programs, and targeted salary adjustments, we believe we have witnessed a turnaround in that six‐year trend. Employee Recognition Programs The Department implemented award programs (July 1, 2014) within our existing budget.
Extra Mile ‐ recognizes employees by awarding employees with SCDOT branded merchandise for improvements in work processes, exemplary work or outstanding customer service.
Achievement Award ‐ cash award to employees in pay band seven and below ($100, $250 or $500 depending on the accomplishment).
State Service Pins (10, 20, 30, 40 and 50 years service)
Pay for Performance Increases (policy effective 11/03/2014)
Workforce Retention Chart 5.4‐1

25 | P a g e
Does the agency already provide the information requested on this page, or similar information, in a report required by another entity? If yes, add the appropriate information to the Similar Information Requested Chart. If the agency looks in the Excel document attached, there is a template for the agency to complete for any questions which ask for the same information under the tab labeled, “Similar Info Requested.”
{V.A.4.2. } Employee Development 4a. Performance Benchmark: A well trained workforce is critical to ensuring effective use of
internal staff. The Department offers classroom training, e‐learning courses, training with federal highways, and miscellaneous other venues.
39,505 training completions in 2014
493 training courses offered
The Department realizes the need to have a well trained workforce. We have a total of 398 participants in the Teacher Employee Retirement Incentive (TERI) program with the largest number of employees scheduled to depart in 2017. As the chart indicates, we have been on an upward retention trend which we believe is a result of our trades salary initiative, our employee recognition programs and development opportunities.
i. SCDOT currently does not have a formal process for benchmarking this
information to other states. ii. SCDOT also relies on guidance and expertise offered by AASHTO, SASHTO
states and the FHWA. 4b. The bulk of the workforce within SCDOT is in the Engineering Division, which has
established a Division Goal of training for its employees. 4c. Trend data is not yet available, as the Strategic Direction reporting has not begun. 4d. SCDOT does have control over this particular item.
Operational/Work System Performance 5. What are the agency’s actual performance levels for two to four of the agency’s key
performance measurements for operational efficiency and work system performance (includes measures related to the following: innovation and improvement results; improvements to cycle or wait times; supplier and partner performance; and results related to emergency drills or exercises) for the agency as a whole and for each program listed in the agency’s Major Program Areas Chart?
1) Workplace Accidents/Injuries 2) Disadvantaged Business Enterprise (DBE) Goal versus Commitment
Workplace Accidents/Injuries 5a. Performance Benchmark: Reduce the number of incidents; therefore, resulting in lower
premiums being paid.

26 | P a g e
Does the agency already provide the information requested on this page, or similar information, in a report required by another entity? If yes, add the appropriate information to the Similar Information Requested Chart. If the agency looks in the Excel document attached, there is a template for the agency to complete for any questions which ask for the same information under the tab labeled, “Similar Info Requested.”
Fiscal Year
Premium Amount
Total # of Injuries*
2011 $10,586,649 367
2012 $8,969,782 355
2013 $8,877,280 358
2014 $7,820,811 279
2015 (1st quarter)
66
*based on calendar year
Five Year Accident / Injury Trends 700
600
500
Total No Injuries
400 Reported
Total No of OSHA Recordable Cases
300
Total Motor Vehicle Accidents 200
100
0
2007 2008 2009 2010 2011 2012
Total Hours
Worked
Total No
Injuries
Reported
Total No of
OSHA
Recordable
Cases
OSHA Incident
Rate *
Total Motor
Vehicle
Accidents
Motor Vehicle
Miles Driven
Accident
Frequency Rate *
2007 10,187,173 462 340 6.68 332 31,862,769 10.42
2008 10,543,246 461 276 5.24 288 39,507,872 7.29
2009 10,469,120 516 314 6.00 277 39,072,229 7.09
2010 10,283,110 627 344 6.69 311 39,602,077 7.85
2011 9,597,192 510 284 5.92 286 36,476,490 7.84
2012 9,381,048 515 306 6.52 182 27,579,019 6.60
i. SCDOT currently does not have a formal process for benchmarking this information to other states.
ii. SCDOT also relies on guidance and expertise offered by AASHTO, SASHTO states and the FHWA.
Table 5.5‐1
Chart 5.5‐1 and Table 5.5‐2

27 | P a g e
Does the agency already provide the information requested on this page, or similar information, in a report required by another entity? If yes, add the appropriate information to the Similar Information Requested Chart. If the agency looks in the Excel document attached, there is a template for the agency to complete for any questions which ask for the same information under the tab labeled, “Similar Info Requested.”
5b. The bulk of the workforce within SCDOT is in the Engineering Division, which has
established a Division Goal to reduce the accident/injury rate for its employees. 5c. Trend data is not yet available, as the Strategic Direction reporting has not begun. 5d. SCDOT does have some control over this particular item.
5a. Performance Benchmark: Achieve the annual DBE Goal as established by SCDOT. i. SCDOT routinely compares performance metrics to neighboring and regional
states including North Carolina, Georgia, and Florida. ii. SCDOT also relies on guidance and expertise offered by AASHTO, SASHTO
states and the FHWA.
5b. SCDOT’s Senior leadership team (Secretary and Deputies) reviews this data periodically in the PRAM meetings.
5c. SCDOT has consistently achieved its Annual DBE Program target levels and has increased
the goal over the past few years. 5d. SCDOT does have some control over this particular item.
FFY 12-14 DBE Goal = 11.5%
FHWA DBE Goal vs. Commitment Chart 5.5‐2

28 | P a g e
Does the agency already provide the information requested on this page, or similar information, in a report required by another entity? If yes, add the appropriate information to the Similar Information Requested Chart. If the agency looks in the Excel document attached, there is a template for the agency to complete for any questions which ask for the same information under the tab labeled, “Similar Info Requested.”
RESTRUCTURING REPORT
V. Key Performance Measurement Processes (cont.)
B. Most Critical Performance Measures
1. Of the key performance measurement processes listed in Subsection A., which are the three most critical to achieving the overall mission of the agency?
Safety
Pavement & Bridges
Workforce
C. Databases/Document Management
1. List all electronic databases/document management/business intelligence systems or programs utilized by the agency, including, but not limited to all relational database management systems. SCDOT maintains over 110 electronic databases/programs and over 35 additional vendor systems. These are listed separately below in no particular order.
DATABASES/PROGRAMS "Contact Us" Internet Portal (CSCTS ‐ CU) Account Request Internet Portal (CSCTS ‐ AR) Accounting Accounts Receivable Agency Budget Submission System (ABS²) Allotment Ledger Posting Applications Development Task Management System (ADTMS) Asset Management and Tracking System Bridge Replacements Budget Building Maintenance System (BMS) Business Development & Special Projects Task Mgmt. System (DBETMS) Business Plan Management System Capture All Promises (CAPS) Cash Disbursements Completed Projects Compliance Connector Addresses Construction/Maintenance Projects Browse Contract Bid Estimator System V2 Reports (CBES V2 Reports) Contract Bid Estimator System V3 (CBES V3)

29 | P a g e
Does the agency already provide the information requested on this page, or similar information, in a report required by another entity? If yes, add the appropriate information to the Similar Information Requested Chart. If the agency looks in the Excel document attached, there is a template for the agency to complete for any questions which ask for the same information under the tab labeled, “Similar Info Requested.”
Contractor Performance Evaluation System (CPES) Current Billing Customer Service Center Tracking System (CSCTS) DBA Knowledge Base DBA Request System Debt Setoff Collection Driver's License Record Request Earthwork Balancing System (EWBS) EDMS ‐ Bridge Maintenance EDMS ‐ Contract Resource Management EDMS ‐ Document Web Services (EDMS Generic) EDMS ‐ Human Resources EDMS ‐ ITMS Document Retrieval Web Service EDMS ‐ Office of Planning EDMS ‐ Outdoor Advertising EDMS ‐ Property Management Office EDMS ‐ Right of Way EDMS ‐ Right of Way ‐ Metadata Update Utilities EDMS ‐ Right of Way ‐ Railroad Office EDMS ‐ Road Design EDMS ‐ SCDOT Commission Documents EDMS ‐ Workflow Engine (EDMS Generic) Electronic Forms 2010 (EF 2010) Emergency Operational Readiness Systems (EORS) Employee Reports ‐ HR and Payroll Automated Reporting Encroachment Permit Processing System (EPPS) Ending Projects Browse Engineering Publication Receipts 2.0 Entire Connection Account Management Assistant (EC_AMA) Fiscal Year Audit Workpapers Fiscal Year CPA Audit Workpapers Fuel Card Payments Fuel Transaction Browse Funds Reservation System Grant Management System Highway Maintenance Management System (HMMS) HMMS Equipment Management Module (HMMS‐EMM/ESM/FCM) HMMS Work Request Module ‐ Mobile Device Version (HMMS‐M) HRSuite Human Resources\Payroll Immunization System Insurance Billing System Maintenance Assessment Program 2.0 (MAP) Maintenance Customer Survey Maintenance Performance Guidelines Maintenance Work Request Public Portal Materials Lab Sample Label Generator MOSS ‐ IT Services Help Desk System MOSS (Internet) ‐ Property Management (Surplus Property Sales) Net Expenditures Obligation Management PR2 form Online Reservation Services (ORS) Org Plus Organization Charting Interface Outdoor Advertising Exchange (ODAx) Outdoor Advertising Internet Forms (ODA Forms) Parking Inventory System 2.0
30 | P a g e
Does the agency already provide the information requested on this page, or similar information, in a report required by another entity? If yes, add the appropriate information to the Similar Information Requested Chart. If the agency looks in the Excel document attached, there is a template for the agency to complete for any questions which ask for the same information under the tab labeled, “Similar Info Requested.”
Pavement Design Calculator Pre‐HMMS Encroachment Permit Viewer Procurement Card Payments Procurement Cards Project File Project Labor Distribution Browse R/W Grantor Index Radio Shop Parts Inventory Management Risk Management Information System (RMIS) S.C. Transportation Infrastructure Bank (SCTIB) Accounting System Safety System SCDOT Commissioners Extranet Shop Foreman Discussion Board Site Manager Maintenance and Support Site Manager Reports 2.0 Site Manager Template Migration Application South Carolina Automated Routing and Permit System (SCARPS) STARS STARS ‐ Mobile Equipment STARS ‐ Vehicle and Commuter Mileage Student Tracking System Survey Automated/Station Offset Alignment (SASOA) Survey Editor 2.0 Toll Collections System (TCS) Total Equipment Replacement Methodology System (TERMS) User Feedback Management System 2.0 (UFMS) Utility Payments Vehicle Reservation System (VRS) Virtual Transit Enterprise (VTE Forms) Virtual Warehouse VT e‐forms WSS Extranet ‐ Construction WSS Extranet ‐ Risk Management ‐ CompEndium WSS Extranet ‐ Traffic Engineering XREF SCDOT Projects to SCEIS WBS
VENDOR SYSTEMS Falcon CTS ATMS IIMS SCDOTSigns Orion HAR RIMS HMMS Pontis Virtis Traffic Polling System Pavement Management System Geomedia WebTransport Online Reservation System Call Tracking System Site Manager Password Reset Pro

31 | P a g e
Does the agency already provide the information requested on this page, or similar information, in a report required by another entity? If yes, add the appropriate information to the Similar Information Requested Chart. If the agency looks in the Excel document attached, there is a template for the agency to complete for any questions which ask for the same information under the tab labeled, “Similar Info Requested.”
PSTWeb Nintex Forms and Workflow Outdoor Advertising System Muhimbi Document Convertor Cosign RoadSignApp ProjectWise ActiveProjectsHelper BridgeViewer Poll5WebAppPublic IHaul StreetFinder SCDOTP2SWebSrvr P2S P2S/ROW ITMS DARTS eTeams
D. Recommended Restructuring Consider the process taken to review the agency’s divisions, programs and personnel to obtain the information contained in response to all the previous questions in the Restructuring Report (“Process”).
1. Yes or No, based on the information obtained and analysis performed during the
Process, does the agency have any recommendations for restructuring (either that it could do internally or that would need the assistance of revised or new legislation) that would merge or eliminate duplicative or unnecessary divisions, programs, or personnel within each department of the agency to provide a more efficient administration of government services? At this time, we are not prepared to recommend restructuring. SCDOT is acquiring an external expert to conduct a top to bottom review of the agency’s management and administration.
a. If yes, please provide the agency’s suggestions.

32 | P a g e
Does the agency already provide the information requested on this page, or similar information, in a report required by another entity? If yes, add the appropriate information to the Similar Information Requested Chart. If the agency looks in the Excel document attached, there is a template for the agency to complete for any questions which ask for the same information under the tab labeled, “Similar Info Requested.”
SEVEN‐YEAR PLAN
VI. Seven‐Year Plan
A. General
1. Yes or No, does the agency have a plan that provides initiatives and/or planned actions the agency will take during the next seven fiscal years that implement cost savings and increased efficiencies of services and responsibilities in order to continually improve its ability to respond to the needs of the state’s citizens? SCDOT is currently reviewing opportunities, including utilizing outside experts, to assess and recommend opportunities for increased privatization, outsourcing, integrated information systems, best procurement practices and organizational restructuring all of which may lead to cost savings and efficiencies. Below are a few of the items that are currently underway. We welcome the opportunity to discuss this further with the Committee and its staff.
B. Current/Recommended Actions
1. Describe all of the actions the agency is currently taking and plans it has for initiatives and actions during the next seven fiscal years to work to achieve greater efficiency in its operations in order to continually improve its ability to respond to the needs of the state’s citizens? In this description, provide the names of all personnel who are responsible for overseeing the actions and plans.
a. {Transportation Asset Management Plan (TAMP) SCDOT is developing a performance and risk‐based Transportation Asset Management Plan which supports the goals of the agency’s Strategic Direction. (Deputy Mark Lester, PE and Kevin Gantt, PE)
b. {HVAC} Pursue Guaranteed Energy Savings contract (GESC) to upgrade HVAC System for Headquarters Building. (Director Andy Leaphart, PE and Suzette Johnson)
c. {Outdoor Advertising} SCDOT is responsible for the regulation of advertising along interstate and primary systems which includes billboard and vegetation management. Staff currently manages the system through the utilization of an automated permitting system. SCDOT IT staff is internally upgrading the permitting system to automate processes for permit management, customer information management, customer billing, and customer information submission. (Director Andy Leaphart, PE and Keith Melvin)
d. {Oversize/Overweight (OSOW) Permits} SCDOT is responsible for issuing permits to operate or move vehicles/loads exceeding legal size, weight, and/or load restrictions. The Department is updating its sole‐proprietary automated

33 | P a g e
Does the agency already provide the information requested on this page, or similar information, in a report required by another entity? If yes, add the appropriate information to the Similar Information Requested Chart. If the agency looks in the Excel document attached, there is a template for the agency to complete for any questions which ask for the same information under the tab labeled, “Similar Info Requested.”
oversize/overweight routing and permitting system to assist in efficiencies. (Director Andy Leaphart, PE, Michele Paoleschi, and Mechelle Mabry)
e. {Transit Asset Management System (TAMS)} SCDOT will utilize the Transit Asset Management System recently developed by the Office of Public Transit (OPT) to optimize replacement of public transit vehicles. OPT currently has a Statewide Vehicle Utilization Review and Capital Needs Assessment underway to determine transit agencies’ actual asset needs based on optimized service levels. Vehicles that have satisfied useful life requirements will be identified by transit agency, with additional validation that such replacement vehicles are still needed to support ongoing services. OPT will identify areas where transit vehicles are being underutilized for no‐cost transfer to other areas in the state with documented need. Once all available vehicles have been transferred, OPT will then initiate a capital asset replacement plan that utilizes available toll revenue credits as soft match to available federal funding specifically dedicated for the acquisition of new public transit vehicles. (Deputy Mark Lester, PE and Doug Frate)
2. What are the anticipated cost savings and/or efficiencies that would be achieved by
each action? a. {TAMP} The effort will increase efficiency by implementing a performance and
risk‐based asset management plan that promotes the efficient use of resources and strategic management of the Department’s assets. Performance targets will be set and closely monitored to provide management with current and future system conditions. The results of this analysis will be used to quantify system needs. Risk‐based asset management maximizes the useful life of physical assets by optimizing the Department’s investment across all assets. It involves preservation and preventive maintenance, well planned rehabilitation, and cost effective replacement at the appropriate stages of an asset’s life. No cost savings are anticipated as a result of implementing a Transportation Asset Management Plan.
b. {HVAC} Costs for new system are paid from savings realized in reduced energy bills. This contracting method requires no initial capital investment.
c. {Outdoor Advertising} The system update will reduce the cost and manpower associated with mailing both applications and permits, as well as, manual billings completed annually. It will also increase the efficiency of outdoor advertising staff by providing real‐time data to the approving authority, which will reduce turnaround time for permit approval.
d. {OSOW Permits} The new system will automate many routine functions that currently must be performed manually by staff. It will allow external users to set up accounts, request permits, request routes, and submit payment.
e. {TAMS} As of July 1, 2014, the cost to replace SCDOT‐titled public transit vehicles past their useful life was estimated at $15 million. The estimated cost to replace all SCDOT‐titled public transit vehicles as of July 1, 2014 was $47 million. South Carolina currently receives approximately $3.7 million in annual Federal funding

34 | P a g e
Does the agency already provide the information requested on this page, or similar information, in a report required by another entity? If yes, add the appropriate information to the Similar Information Requested Chart. If the agency looks in the Excel document attached, there is a template for the agency to complete for any questions which ask for the same information under the tab labeled, “Similar Info Requested.”
specifically designated for vehicle acquisition, with no state funding dedicated for the same purpose or required match. SCDOT estimates that over 90% of the current SCDOT‐titled public transit vehicles can be replaced at no cost to the state.
3. Is legislative action required to allow the department/agency to implement the current
or recommended actions? a. {TAMP} No action is required. b. {HVAC} ‐ Yes, approval of the GESC by the Joint Bond Review Committee and the
Budget and Control Board will be required to enter into a Guaranteed Energy Savings Contract.
c. {Outdoor Advertising} No action is required. d. {OSOW Permits} No action is required. e. {TAMS} No action is required.
4. If legislative action is required, please explain the constitutional, statutory or regulatory
changes needed. a. {TAMP} No changes required. b. {HVAC} No changes required. c. {Outdoor Advertising} No changes required. d. {OSOW Permits} No changes required. e. {TAMS} No changes required.
5. Describe the agency actions that will be implemented to generate the desired outcomes
for each recommendation. a. {TAMP} SCDOT established an Asset Management Division within the Office of
Planning and hired an Asset Management Engineer. A Steering Committee has been established to oversee the development of the Transportation Asset Management Plan and the Department has executed a contract with a consultant to assist in this effort.
b. {HVAC} SCDOT to enter into a Guaranteed Energy Savings Contract with an Energy Service Company to implement energy conservation measures.
c. {Outdoor Advertising} SCDOT IT Services, working in conjunction with outdoor advertising staff, will develop an automated solution to combine all current permitting processes into a single, modern system. The redevelopment will address automated processes for permit management, customer information management, customer billing, and customer information submission.
d. {OSOW Permits} No action, other than to test and deploy the system. e. {TAMS} Agency leadership and the SCDOT Commission recently approved the
vehicle replacement plan. Further action will consist of ongoing reporting and monitoring to ensure successful implementation.

35 | P a g e
Does the agency already provide the information requested on this page, or similar information, in a report required by another entity? If yes, add the appropriate information to the Similar Information Requested Chart. If the agency looks in the Excel document attached, there is a template for the agency to complete for any questions which ask for the same information under the tab labeled, “Similar Info Requested.”
6. What is the timeline for implementation of the change and realization of the anticipated benefits for each recommended action/change?
a. {TAMP} The Transportation Asset Management Plan is scheduled to be complete in January of 2016. As the Agency moves forward, additional physical assets will be added to the plan to manage the lifecycle of the agency’s assets proactively. The benefits of the recommendation will be realized incrementally over the first few years of the plan’s implementation. Subsequently, increased benefits will be realized as the Department is able to shift more resources to programming methods to promote preservation, preventive maintenance and rehabilitation in lieu of reconstruction and replacement of assets before reaching their maximum life cycle.
b. {HVAC} Begin the process in early 2017 with construction completed during calendar year 2017.
c. {Outdoor Advertising} SCDOT anticipates the system to be ready in July 2015. Activities for the next billing cycle will begin in October 2015, so benefits will be seen immediately.
d. {OSOW Permits} SCDOT anticipates “going live” in early 2015; benefits would be realized within one year.
e. {TAMS} Over 7 years, it is estimated that we can replace over 90% of the current SCDOT‐titled public transit vehicles at no cost to the state. Anticipated benefits will be realized and accumulate throughout this timeframe.

36 | P a g e
Does the agency already provide the information requested on this page, or similar information, in a report required by another entity? If yes, add the appropriate information to the Similar Information Requested Chart. If the agency looks in the Excel document attached, there is a template for the agency to complete for any questions which ask for the same information under the tab labeled, “Similar Info Requested.”
SEVEN‐YEAR PLAN
VI. Seven‐Year Plan (cont.)
C. Additional Questions
1. What top three strategic objectives of the agency will have the biggest impact on the agency’s effectiveness in accomplishing its mission? a. {SAFETY} Reduce the number of fatalities and serious injuries on the state highway
system. b. {SYSTEM} Decrease the number of roads and bridges moving from “good to fair”
and “fair to poor.” c. {CONGESTION} Reduce congestion on our highway system.
2. What are the fundamentals required to accomplish the objectives? a. {SAFETY} Measure the number of fatalities, serious injuries, pedestrian accidents,
and bicycle accidents (to date and annual). b. {SYSTEM} Measure the percentage of road miles in good condition, percentage of
bridges in satisfactory condition, the deck area of structurally deficient bridges, and percentage of vehicle miles travelled on good pavement.
c. {CONGESTION} Measure the annual hours of delay on interstates and Strategic Network, and calculate the interstate reliability index.
3. What links on the agency website, if any, would the agency like listed in the report so
the public can find more information about the agency? Website: www.scdot.org
4. Is there any additional information the agency would like to provide the Committee or public? None at this time.
5. Consider the process taken to review the agency’s divisions, programs and personnel to obtain the information contained in response to all the previous questions in the Restructuring Report and Seven‐Year Plan (“Process”). State the total amount of time taken to do the following:
a. Complete the Process: 50 hours for 2 people (100 hours) b. Complete this Report: 35 hours for 2 people (70 hours)
6. Please reference the Personnel Involved Chart in the Excel document of all personnel at
SCDOT who were consulted or performed work to obtain the information utilized when answering the questions for this report.

37 | P a g e
Does the agency already provide the information requested on this page, or similar information, in a report required by another entity? If yes, add the appropriate information to the Similar Information Requested Chart. If the agency looks in the Excel document attached, there is a template for the agency to complete for any questions which ask for the same information under the tab labeled, “Similar Info Requested.”
CHARTS APPENDIX
VII. Excel Charts Please send an electronic copy of the entire Excel Workbook and print hard copies of each of the Charts to attach here. Please print the charts in a format so that all the columns fit on one page. Please insert the page number each chart begins on below.
Similar Information Requested Chart __________________________________ Page 1 Historical Perspective Chart _________________________________________ Page 2 Purpose, Mission Chart _____________________________________________ Page 3 Key Deliverables Chart _____________________________________________ Page 4 Key Customers Chart _______________________________________________ Page 5 Key Stakeholders Chart _____________________________________________ Page 6 Key Partner Agency Chart ___________________________________________ Page 7 Overseeing Body Chart (General) _____________________________________ Page 8
Overseeing Body Chart (Individual Member) ____________________________ Page 9 Major Program Areas Chart ________________________________________ Page 10 Legal Standards Chart _____________________________________________ Page 11 Agency Reporting Requirements Chart _______________________________ Page 12 Internal Audits Chart ______________________________________________ Page 13 Personnel Involved Chart __________________________________________ Page 14

Agency Name: South Carolina Department of TransportationAgency Code: U12Agency Section: 084
Similar Information Requested Chart
1
Agency Submitting Report
Restructuring Report Question #
Name of Other Report
Section of Other Report
Entity Requesting Report
Freq. Other Report is Required
Department of Transportation II. (Major Program Areas Chart)
Annual Accountability Report "Program Template"
Budget & Control Board (Executive Budget Office) Annually
Department of Transportation
VI (B)(1) (Current/ Recommended Actions)
Senate Restructuring and Cost Savings Report
Cost Savings and Increased Efficiencies
Governor, General Assembly and Senate Legislative Oversight Committee Annually (or as needed)
INSTRUCTIONS: Please provide details about other reports which investigate the information requested in the Restructuring Report. This information is sought in an effort to avoid duplication in the future. In the columns below, please list the question number in this report, name of the other report in which the same or similar information is requested, section of the other report in which the information is requested, name of the entity that requests the other report and frequency the other report is required. NOTE: Responses are not limited to the number of rows below that have borders around them, please list all that are applicable.

Agency Name: South Carolina Department of TransportationAgency Code: U12Agency Section: 084
Historical Perspective Chart
2
Agency Submitting Report
Year Description of Restructuring that Occurred Description of Major Change in Agency's Purpose or Mission
Department of Transportation
2007 Establishment of the Regional Program Groups (RPGs) in order to improve delivery of programs and projects.
Department of Transportation
2009 Realignment of four engineering districts by shifting two counties (Aiken from District 1 to District 7 and Anderson from District 3 to District 2). Completed to distribute district workloads more evenly and enhance the service these two counties receive.
Department of Transportation
2010 Office of Public Transit and the Office of Railroads were established within the Division of Intermodal and Freight Programs.
Department of Transportation
2011 Moved functions of Office of Administration to the newly created Department of Support Services. Support Services gained: Customer relations, Communications, Information Technology, Facilities Management, Business Development and Special Programs.
Department of Transportation
2011
Department of Transportation
2011
Department of Transportation
2012 Restructured HR to add the Director of Human Capital Investment reporting to the Director of HR.
Department of Transportation
2013 Planning Office realigned under the Division of Intermodal and Freight Programs; Environmental Management Office realigned from Planning to report to Chief Engineer for Planning, Location and Design (PLD); The Right of Way Office realigned from Preconstruction to report to Chief Engineer for PLD; Preconstruction Resource Management Office dissolved; Local Program Administration reports to the Chief Engineer PLD, Obligation Management, Program Controls and Program Applications consolidated under Program Controls Division and reports to Chief Engineer PLD; Chief Engineer for Field Operations position created and reports to Deputy Secretary for Engineering; all District Engineers realigned to report to Chief Engineer for Field Operations as well as Director, emergency Operations; Office of Occupational Health and Safety realigned to report to Director Support Services. Establishment of Director Strategic Management Planning (SMPC) position created and reports to Chief of Staff and realigned of the Director, Communications reporting to Dir., SMPC; Office of Occupational Health and Safety realigned to report to Director, Support Services.
Department of Transportation
2013 Asset Management Division established to meet the requirements of Moving Ahead for Progress 21 (MAP 21).
Department of Transportation
2013 Intermodal Planning is established by consolidating highway planning with freight and transit.
Department of Transportation
2014
Department of Transportation
2014 Realigned Business Development and Special Programs from Support Services to report to the Secretary.
Department of Transportation
2014 Design Build Unit established in Preconstruction.
INSTRUCTIONS: Please provide information about any restructuring or major changes in the agency's purpose or mission during the last ten years. NOTE: Responses are not limited to the number of rows below that have borders around them, please list all that are applicable.
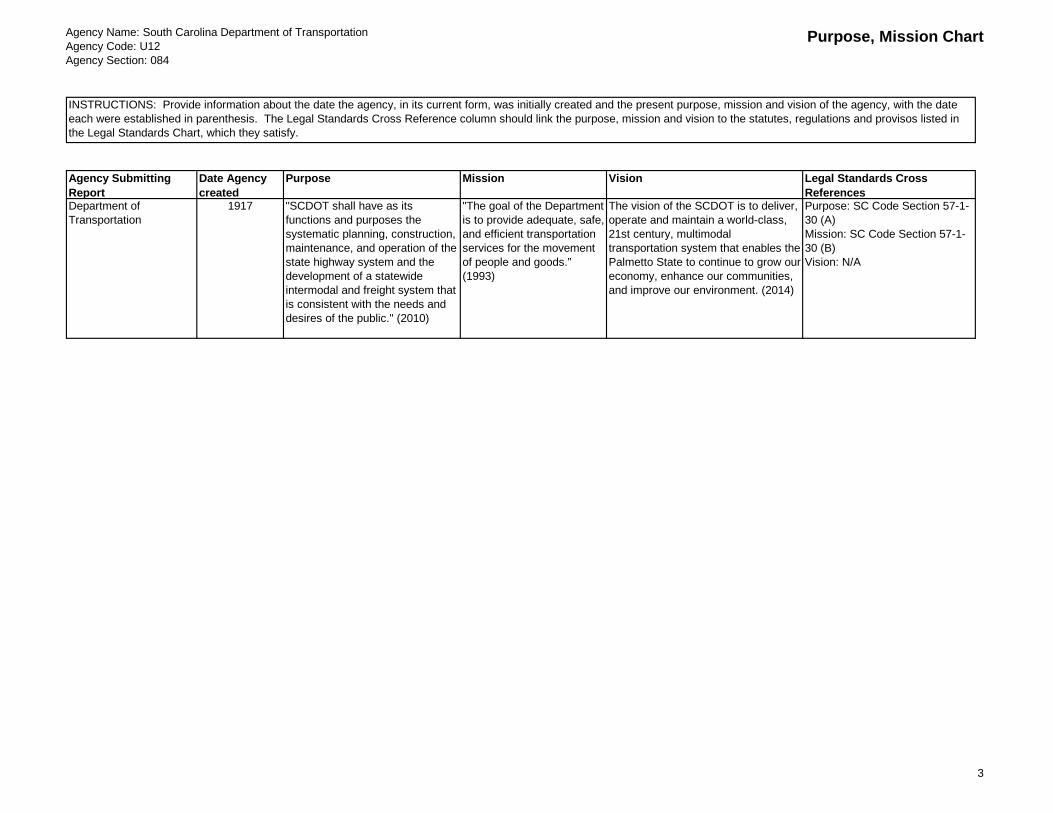
Agency Name: South Carolina Department of TransportationAgency Code: U12Agency Section: 084
Purpose, Mission Chart
3
Agency Submitting Report
Date Agency created
Purpose Mission Vision Legal Standards Cross References
Department of Transportation
1917 "SCDOT shall have as its functions and purposes the systematic planning, construction, maintenance, and operation of the state highway system and the development of a statewide intermodal and freight system that is consistent with the needs and desires of the public." (2010)
"The goal of the Department is to provide adequate, safe, and efficient transportation services for the movement of people and goods.” (1993)
The vision of the SCDOT is to deliver, operate and maintain a world-class, 21st century, multimodal transportation system that enables the Palmetto State to continue to grow our economy, enhance our communities, and improve our environment. (2014)
Purpose: SC Code Section 57-1-30 (A)Mission: SC Code Section 57-1-30 (B)Vision: N/A
INSTRUCTIONS: Provide information about the date the agency, in its current form, was initially created and the present purpose, mission and vision of the agency, with the date each were established in parenthesis. The Legal Standards Cross Reference column should link the purpose, mission and vision to the statutes, regulations and provisos listed in the Legal Standards Chart, which they satisfy.
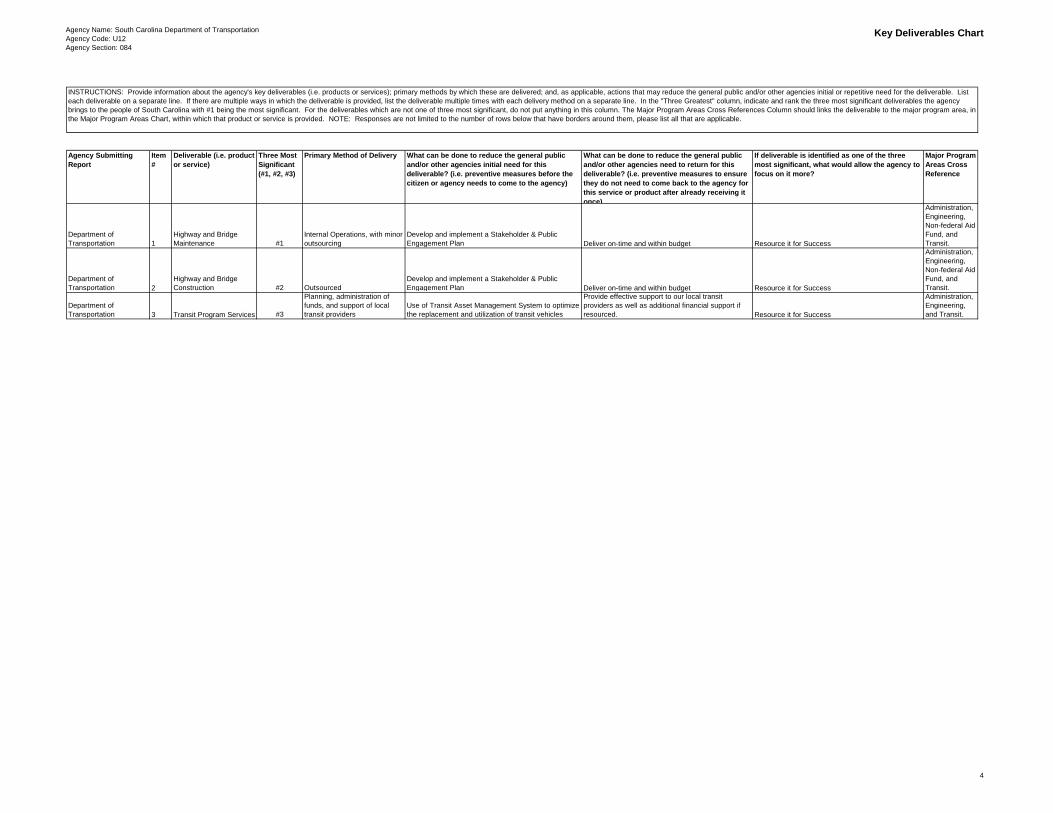
Agency Name: South Carolina Department of TransportationAgency Code: U12Agency Section: 084
Key Deliverables Chart
4
Agency Submitting Report
Item #
Deliverable (i.e. product or service)
Three Most Significant (#1, #2, #3)
Primary Method of Delivery What can be done to reduce the general public and/or other agencies initial need for this deliverable? (i.e. preventive measures before the citizen or agency needs to come to the agency)
What can be done to reduce the general public and/or other agencies need to return for this deliverable? (i.e. preventive measures to ensure they do not need to come back to the agency for this service or product after already receiving it once)
If deliverable is identified as one of the three most significant, what would allow the agency to focus on it more?
Major Program Areas Cross Reference
Department of Transportation 1
Highway and Bridge Maintenance #1
Internal Operations, with minor outsourcing
Develop and implement a Stakeholder & Public Engagement Plan Deliver on-time and within budget Resource it for Success
Administration, Engineering, Non-federal Aid Fund, and Transit.
Department of Transportation 2
Highway and Bridge Construction #2 Outsourced
Develop and implement a Stakeholder & Public Engagement Plan Deliver on-time and within budget Resource it for Success
Administration, Engineering, Non-federal Aid Fund, and Transit.
Department of Transportation 3 Transit Program Services #3
Planning, administration of funds, and support of local transit providers
Use of Transit Asset Management System to optimize the replacement and utilization of transit vehicles
Provide effective support to our local transit providers as well as additional financial support if resourced. Resource it for Success
Administration, Engineering, and Transit.
INSTRUCTIONS: Provide information about the agency's key deliverables (i.e. products or services); primary methods by which these are delivered; and, as applicable, actions that may reduce the general public and/or other agencies initial or repetitive need for the deliverable. List each deliverable on a separate line. If there are multiple ways in which the deliverable is provided, list the deliverable multiple times with each delivery method on a separate line. In the "Three Greatest" column, indicate and rank the three most significant deliverables the agency brings to the people of South Carolina with #1 being the most significant. For the deliverables which are not one of three most significant, do not put anything in this column. The Major Program Areas Cross References Column should links the deliverable to the major program area, in the Major Program Areas Chart, within which that product or service is provided. NOTE: Responses are not limited to the number of rows below that have borders around them, please list all that are applicable.
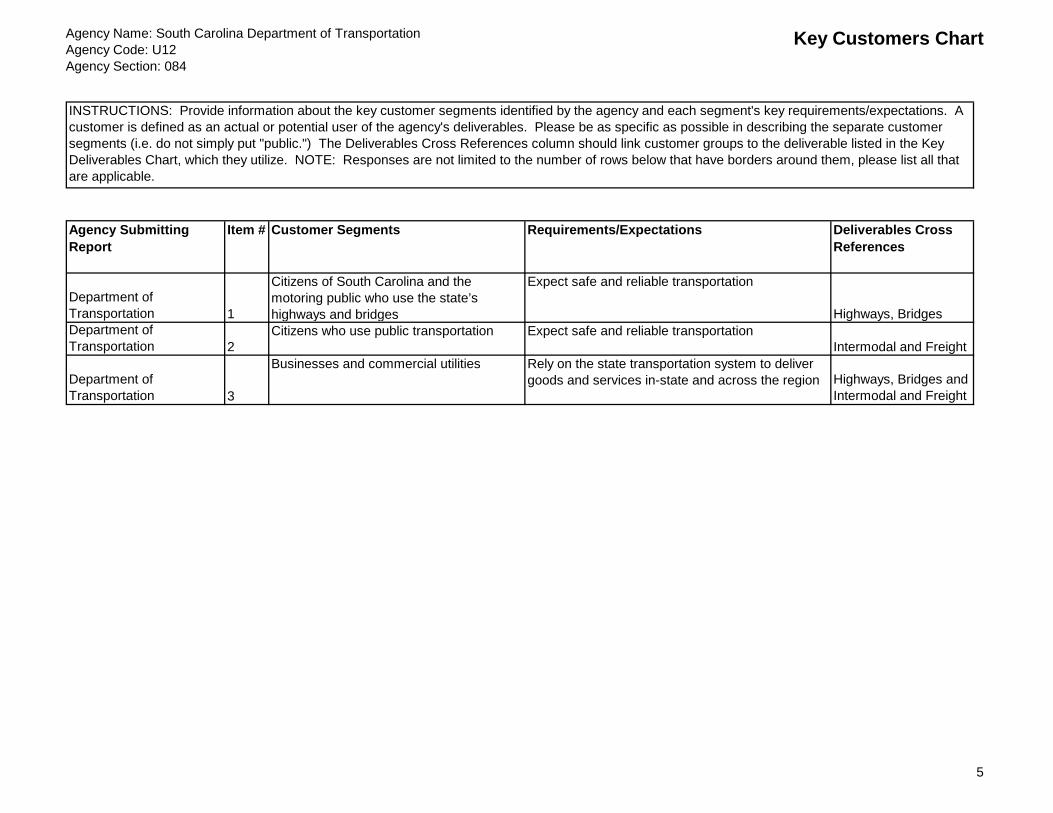
Agency Name: South Carolina Department of TransportationAgency Code: U12Agency Section: 084
Key Customers Chart
5
Agency Submitting Report
Item # Customer Segments Requirements/Expectations Deliverables Cross References
Department of Transportation 1
Citizens of South Carolina and the motoring public who use the state’s highways and bridges
Expect safe and reliable transportation
Highways, Bridges Department of Transportation 2
Citizens who use public transportation Expect safe and reliable transportationIntermodal and Freight
Department of Transportation 3
Businesses and commercial utilities Rely on the state transportation system to deliver goods and services in-state and across the region Highways, Bridges and
Intermodal and Freight
INSTRUCTIONS: Provide information about the key customer segments identified by the agency and each segment's key requirements/expectations. A customer is defined as an actual or potential user of the agency's deliverables. Please be as specific as possible in describing the separate customer segments (i.e. do not simply put "public.") The Deliverables Cross References column should link customer groups to the deliverable listed in the Key Deliverables Chart, which they utilize. NOTE: Responses are not limited to the number of rows below that have borders around them, please list all that are applicable.

Agency Name: South Carolina Department of TransportationAgency Code: U12Agency Section: 084
Key Stakeholders Chart
6
Agency Submitting Report Item # Stakeholder Group Requirements/Expectations Deliverables Cross References
Department of Transportation 1 SC CitizensExpect prompt and courteous attention to needs and concerns
Highways, Bridges and Intermodal & Freight
Department of Transportation 2 General Motoring Public Expect safe and reliable transportation Highways and Bridges
Department of Transportation 3 Governor
Deliver, operate and maintain a world-class 21st century multimodal transportation system that enables the State to continue to grow and support its citizens.
Highways, Bridges and Intermodal & Freight
Department of Transportation 4 General AssemblyProvide the best multimodal transportation system for the citizens of South Carolina.
Highways, Bridges and Intermodal & Freight
Department of Transportation 5 Business Community
Be responsible stewards in meeting the requirements of delivering transportation needs to the motoring public of South Carolina.
Highways, Bridges and Intermodal & Freight
Department of Transportation 6 Local GovernmentsBe inclusive partners as SCDOT builds for the future.
Highways and Bridges
INSTRUCTIONS: Provide information about the agency's key stakeholder groups and their key requirements and expectations. A stakeholder is defined as a person, group or organization that has interest or concern in an agency. Stakeholders can affect or be affected by the agency's actions, objectives and policies. Please be as specific as possible in describing the separate stakeholder groups (i.e. please do not simply put "the public.") The Deliverables Cross References column should link stakeholder groups to the deliverable, listed in the Key Deliverables Chart, for which they group has the most interest or concern. NOTE: Responses are not limited to the number of rows below that have borders around them, please list all that are applicable.

Agency Name: South Carolina Department of TransportationAgency Code: U12Agency Section: 084
Key Partner Agency Chart
7
Agency Submitting Report Agency w/ Impact on Mission Success
Partnership Arrangement Established
Performance Measures Routinely Reviewed Together
Major Program Areas Cross Reference
Department of Transportation Department of Motor Vehicles 1993 Safety Engineering Department of Transportation Department of Health &
Environmental ControlEnvironmental impact of any new construction, maintenance projects
Engineering
Department of Transportation Department of Commerce 2012 Economic impact of highways and bridges to key outlets of commerce
Engineering and Mass Transit
Department of Transportation South Carolina Ports Authority 2012 Economic impact of infrastructure to key outlets of commerce
Engineering
Department of Transportation Department of Corrections Feasibility of using inmates for litter control Administration and Engineering
Department of Transportation Department of Public Safety 1993 Safety: vehicle crashes, fatalities: pedestrian, bicycles, motor
Engineering and Mass Transit
Department of Transportation Emergency Management Division 1977 Effectiveness in responding to and recovery for hurricanes, earthquakes, tornadoes, chemical spills, wild fires, dam failures, and winter weather advisories.
Engineering and Mass Transit
Department of Transportation Transportation Organizations: AASHTO, ACEC, ASSE, ACOE, Carolina's AGC, FHWA, FMCSA, FRA, FTA, I-73 Coalition, I-95 Coalition, ITE, National Safety Council, NAATSHO, NCHRP, NESA, NHTSA, NSB, Outdoor Advertising Association, OSHA, 12 Public Transit Providers, 7 RTAs, SASHTO, SCAPA, SSBP, SC-FOR, SCCPA, SCMCD, SCTA, SCTIB, SPRC, TRB, USDOT, regional Economic Development Elected
AASHTO 1918, Varies
Smart solutions, training, direct technical assistance, unchallenged expertise, research, safety, mobility, livability, innovation, legislation, marketing, and media assets.
Administration, Engineering and Mass Transit
INSTRUCTIONS: List the names of the other state agencies which have the biggest impact on the agency's mission success (list a minimum of three); partnership arrangements established and performance measures routinely reviewed with the other entity. The Major Program Areas Cross References Column should link the Partner Agency to the major program area, in the Major Program Areas Chart, on which it has the biggest impact. NOTE: Responses are not limited to the number of rows below that have borders around them, please list all that are applicable and a minimum of three.

Agency Name: South Carolina Department of TransportationAgency Code: U12Agency Section: 084
Key Partner Agency Chart
7
Department of Transportation Conservation and Environmental Organizations: Andrew Jackson Chapter of CFNSB, CCL, CFNSB, Drayton Hall Plantation, Edisto Island Land Trust, Greenville County Recreation District, Nature Conservatory, National Heritage Corridor, South Carolina Scenic Highway Committee, Town of Bluffton
Varies Environmental impact of any new construction or maintenance project
Administration, Engineering and Mass Transit
Department of Transportation General Partners: Motoring Public, Transit Riders
Since the formation of the agency in
1917
Tolls, vehicle usage fees, safety, and stewardship of funds.
Engineering and Mass Transit
Department of Transportation Professional Associations and Universities: Clemson, USC, SCSU, CPM, GFOA
Since the formation of the agency in
1917
Research and focus group studies Administration, Engineering and Mass Transit
Department of Transportation Other State, County and Municipal Groups: State and local Chambers of Commerce, Congressional Delegation, 10 COGs, 11 MPOs, 46 Counties, CTCs, General Assembly, Governor, Municipalities, Various law enforcement entities
Since the formation of the agency in
1917
Administration, Engineering and Mass Transit
Department of Transportation Corporate Partners Varies Safety Engineering and Mass Transit

Agency Name: South Carolina Department of TransportationAgency Code: U12Agency Section: 084
Overseeing Body Chart (General)
8
Agency Submitting Report Type of Body (i.e. Board, Commission, etc.)
# of Times per Year Body Meets
Total # of Individuals on the Body
Are Individuals Elected or Appointed?
Who Elects or Appoints?
Length of Term
Limitations on Total Number of Terms
Limitations on Consecutive Number of Terms
Challenges imposed or that Agency staff and the Body have faced based on the structure of the overseeing body
Other Pertinent Information
Department of Transportation Governor 0 1 Elected SC Voters 4 years 2 None Title 57, Article 5
Department of Transportation SCDOT Commission 11 8 AppointedGeneral Assembly 4 1 0
Commission reports to General Assembly Title 57, Article 3
INSTRUCTIONS: Provide information about the body that oversees the agency and to whom the agency head reports including what the overseeing body is (i.e. board, commission, etc.); total number of individuals on the body; whether the individuals are elected or appointed; who elects or appoints the individuals; the length of term for each individual; whether there are any limitations on the total number of terms an individual can serve; whether there are any limitations on the number of consecutive terms an individual can serve; and any other requirements or nuances about the body which the agency believes is relevant to understanding how the agency performs and its results.

Agency Name: South Carolina Department of TransportationAgency Code: U12Agency Section: 084
Overseeing Body Chart (Individual Member)
9
Agency Submitting Report Name of Individual on Body
Contact Information Profession Date First Started Serving on the Body
Last Date Served on the Body
Length of Time on the Body (in years)
Senator or House Member? (put Senate or House)
Major Program Areas Cross Reference
Department of Transportation Nikki R. Haley Columbia, SC Governor 1/12/2011 - - - 5 years NDepartment of Transportation Jim Rozier 1610 Dennis Blvd./
Monck Corner, SC 29461
President and CEO of The Rozier Group, LLC
2/26/2012 2/26/2016 3 years N
Administration, Engineering, Non-federal Aid Fund,
and Transit.Department of Transportation Mike Wooten 4807 Lily Pond Road,
Murrell's Inlet, SC 29576
President of DDC Engineers
1/15/2013 2/15/2017 2 years N
Administration, Engineering, Non-federal Aid Fund,
and Transit.Department of Transportation John Hardee 296 Tombee Lane,
Columbia, SC 29209Director of Public Affairs for Lamar Outdoor Advertising
1/22/2014 2/15/2018 1 year N
Administration, Engineering, Non-federal Aid Fund,
and Transit.Department of Transportation Woody Willard, Jr. 1027 Four Mile
Branch Road, Spartanburg, SC 29302
Owner and Operator of Willard Incorporated
1/21/2014 2/15/2018 1 year N
Administration, Engineering, Non-federal Aid Fund,
and Transit.Department of Transportation W. B. Cook POB 65, Gaffney, SC
29342Retired utility contractor
7/7/2012 2/15/2016 3 years N
Administration, Engineering, Non-federal Aid Fund,
and Transit.Department of Transportation Sam Glover 149 Belton Drive,
Orangeburg, SC 29118
Retired Director of SC Department of Probation, Parole & Pardon
1/23/2014 2/15/2018 1 year N
Administration, Engineering, Non-federal Aid Fund,
and Transit.
Department of Transportation Clifton Parker 126 Access Road, Gaston, SC 29053
President and General Manager of G & P Trucking Company, Inc.
4/27/2011Appointed by
Governor4 years N
Administration, Engineering, Non-federal Aid Fund,
and Transit.
Department of Transportation Ben Davis, Jr. 706 Spray Shed RoadGreenwood, SC 29649
Retired President and CEO of Connie Maxwell Children’s Home
2/12/2015 2/15/2016 0 years N
Administration, Engineering, Non-federal Aid Fund,
and Transit.
INSTRUCTIONS: Provide information about the individual members on the body that oversees the agency including their name, contact information, length of time on the body, profession and whether they are a Senator or House Member. The Major Program Areas Cross References Column should link the individual to the major program area, in the Major Program Areas Chart, in which the individual has a particular influence, if any, by way of serving on a subcommittee within the body, task force, etc. NOTE: Responses are not limited to the number of rows below that have borders around them, please list all that are applicable.

Agency Name: South Carolina Department of TransportationAgency Code: U12Agency Section: 084
Major Program Areas Chart
10
Agency Submitting Report
Program/Title Purpose General Other Federal TOTAL General Other Federal TOTAL Key Performance Measures Cross Reference
Legal Standards Cross References
Department of Transportation
I.A. General Administration Agency-wide executive management and support service function. $0
$32,143,916 % of Total Budget: 3%
$0
$32,143,916 % of Total Budget: 3%
$0
$36,395,252% of Total Budget: 3%
$0
$36,395,252 % of Total Budget: 3%
Climate Survey; Leadership Courses; PRAM; ITS; Transit
1, 3-10, 12-26, and 28
Department of Transportation
II.A. Engineering Administration & Project Management
Program funds the core management to support the statewide delivery of the highway program. $0
$80,753,450 % of Total Budget: 7% $0
$80,753,450 % of Total Budget: 7% $0
$79,927,890 % of Total Budget: 6% $0
$79,927,890 % of Total Budget: 6%
Multimodal Transportation Plan; Asset Management; PRAM; RPGs; ITS; Design-Build; EMD
1, 2, 29-30, and 32
Department of Transportation
II.B. Engineering & Construction Program funds the construction of roads and bridges statewide. $ 596,322
% of Total Budget: less than 0.05%
$672,223,225% of Total Budget: 62% $0
$672,819,547% of Total Budget: 62%
$50,000,000% of Total Budget:4%
$708,723,936% of Total Budget: 51% $0
$758,723,936% of Total Budget:55%
Multimodal Transportation Plan; Asset Management; PRAM; RPGs; ITS; Design-Build
1, 2, 11, 27, 29-30, and 32
Department of Transportation
II.C. Highway Maintenance Program funds the maintenance of statewide roads, bridges, buildings, and rest areas.
$0 $185,249,048% of Total Budget:17%
$0 $185,249,048% of Total Budget:17%
$0 $244,472,377% of Total Budget:19%
$0 $244,472,377% of Total Budget:19%
Asset Management; PRAM; ITS, DB
1, 2, 29-30, and 32
Department of Transportation
IV. Non Federal Aid Fund Operating expenses for maintenance on non federal aid secondary roads.
$0 $18,373,497 % of Total Budget: 2%
$0 $18,373,497 % of Total Budget: 2%
$0 $104,233,649 % of Total Budget:8%
$0 $104,233,649 % of Total Budget: 8%
Asset Management; PRAM; Design-Build
1, 2, and 16
Department of Transportation
V. Mass Transit
Allocations and aid for transit services, equipment, and operating expenses.
$ 57,270% of Total Budget: less than 0.01%
$20,845,960% of Total Budget: 2%
$0
$20,903,230% of Total Budget: 2%
$ 57,270% of Total Budget: less than 0.01%
$24,462,932% of Total Budget: 2%
$0
$24,520,202% of Total Budget: 2%
Multimodal Transportation Plan; Asset Management; PRAM; Transit
1, 31, and 32
Department of Transportation
VI. Employee Benefits State employer contributions and total fringe benefits.
$0 $69,700,786% of Total Budget: 6%
$0 $69,700,786% of Total Budget: 6%
$0 $71,162,556% of Total Budget: 6%
$0 $71,162,556% of Total Budget: 6%
None 1 and 4
2012-2013 % of Total Budget
2013-2014 % of Total Budget
Remainder of Programs: List any programs not included above and show the remainder of expenditures by source of funds.
INSTRUCTIONS: Provide information about the agency's Major Program Areas as those are defined in the Appropriations Act. When completing columns B - K, the agency can copy and paste the information the agency submitted in the Program Template of the FY 2013-14 Accountability Report, just make sure of the following: a) List only the programs that comprise at least 80% of the total budget and include the % of total budget. The remainder of the programs should be “listed ONLY” in the box labeled “Remainder of Programs”, with those program expenditures detailed in the box labeled “Remainder of Expenditures.” If the agency has trouble understanding what is requested, refer to the 2012-13 Accountability Report, Section II, number 11. b) The “Associated Objective(s)” column in the Program Template of the FY 2-13-14 Accountability report has been changed to “Key Performance Measures Cross References.” The Key Performance Measures Cross References column should link major programs to charts/graphs in the Key Performance Measurement Processes Section (ex. Chart 5.2-1 or Graph 5.2-2). If the agency has trouble understanding what is requested, refer to the 2012-13 Accountability Report, Section II, number 11; and c) An additional column, titled “Legal Standards Cross References,” has been added at the end. The Legal Standards Cross Reference column should link major programs to the statutes, regulations and provisos listed in the Laws Section of this report, which they satisfy. Included below is an example, with a partial list of past Major Program Areas from the Department of Transportation. The example does not include information in the columns under expenditures, key performance measures cross reference, legal standards cross references or remainder of expenditures, however the agency must complete these columns when submitting this chart in final form. Please delete the example information before submitting this chart in final form. NOTE: Responses are not limited to the number of rows below that have borders around them, please list all that are applicable.
Note: -Key Performance Measures Cross References Column links major programs to the charts/graphs in the Key Performance Measurement Processes Section of the Restructuring Report. -Legal Standards Cross References Column links major programs to the statutes, regulations and provisos they satisfy which are listed in the Laws Section of the Restructuring Report.
FY 2013-14 ExpendituresFY 2012-13 Expenditures

Agency Name: South Carolina Department of TransportationAgency Code: U12Agency Section: 084
Major Program Areas Chart
10
$2,277,655 less than 0.02% $4,942,132 less than 0.04%
$3,344,039 less than 0.03% $6,873,840 less than 0.06%
$0 0% $10,247,451 less than 0.08%
Remainder of Expenditures:
% of Total Budget % of Total Budget % of Total Budget % of Total Budget % of Total Budget % of Total Budget % of Total Budget % of Total Budget
Land and Buildings
Toll Operations
Non-Recurring Appropriations

Agency Name: South Carolina Department of TransportationAgency Code: U12Agency Section: 084
Legal Standards Chart
11
Agency Submitting Report
Item # Statute/Regulation/Provisos
State or Federal
Summary of Statutory Requirement and/or Authority Granted
Department of Transportation
1SC Code of Laws:
Title 57State
The entire Title 57 applies to the Department of Transportation. Title 57 contains the following Chapters: 1. General provisions, 3. Department of Transportation, 5. State Highway System, 7. Obstruction or Damage to Roads or Drainage, 9. Abandonment or Closing of Streets, Roads or Highways, 11. Financial Matters, 13. Provisions Affecting Bridges Only, 15. Provisions Affecting Ferries Only, 17. County Roads, Bridges, and Ferries Generally, 19. County Road Taxes and Assessments, 21. Paving Districts in Counties with City of Over 70,000, 23. Highway Beautification and Scenic Routes, 25. Outdoor Advertising and 27. Junkyard Control
Department of Transportation
2SC Code of Regulations, Chapter 63
State
Chapter 63 of the SC Code Regulations applies to the Department of Transportation. The regulations include: 63-10 - Transportation Project Prioritization; 63-30 - Commission approval of actions; 63-100 - Secretary of Transportation Approval of Actions; 63-300 to 309 - Prequalification and Disqualification of Bidders; 63- 322 - Relocation of Displaced Persons; 63-338 - Highway Advertising Control Act; 63-361- Movement of Machinery over Highways; 63-370 - Driveways; 63-380 - Erosion Control ; 63-390 - Tandem Trailer Combinations and Other Larger Vehicle Access Control Act ; 63-700, et seq. Disadvantaged Business Enterprises Program; 63-800 - Bus Shelters; 63-900 - Scenic Byways
Department of Transportation
3SC Code Section 1-1-
1040State
Links to websites posting department’s monthly state procurement card statements or information
Department of Transportation
4SC Code Section
1-30- 10(A)State
Department of Transportation is a department within the executive branch of state government
Department of Transportation 5
SC Code Sections 1-30-10(G)(1) and 1-
30-10(G) (2)State
Restructuring Report and Seven Year Cost Savings Plan that provides initiatives and/or planned actions that implement cost savings and increased efficiencies of services and responsibilities within the projected seven year period
Department of Transportation 6
S. C. Code Sections 1-30-10(G)(1)
StateRestructuring Report Department reports giving detailed and comprehensive recommendations for the purposes of merging or eliminating duplicative or unnecessary divisions, programs, or personnel within each department to provide a more efficient administration of government services
Department of Transportation 7
SC Code Sections 1-1-810, 1-1-820 and
Proviso 117.31State
Annual Accountability Report establishment and content requirements
Department of Transportation 8
SC Code Sections 2-47-50 and 2-47-55
StateComprehensive Permanent Improvement Plan
Department of Transportation 9
SC Code Sections 8-13-1110 and 8-13-
1140State
Persons required to file statement of economic interests and updates annually
Department of Transportation
10SC Code Section 8-13-1110 (12)
StateAmended in 2007 to include District Engineering Administrators
Department of Transportation
11SC Code Section 11-
35-3310State
Indefinite delivery contracts for construction items, architectural engineering, and land surveying services
Department of Transportation
12SC Code Section 11-
35-3830State
Approval and Record of Trade-in Sales
Department of Transportation
13SC Code Section 11-
35-2440State
Records of procurement actions
INSTRUCTIONS: List all state and federal statutes, regulations and provisos that apply to the agency (“Laws”) and a summary of the statutory requirement and/or authority granted in the particular Law listed. Included below is an example, with a partial list of Laws which apply to the Department of Juvenile Justice and Department of Transportation. The agency will see that a statute should be listed again on a separate line for each year there was an amendment to it. Please delete the example information before submitting this chart in final form. NOTE: Responses are not limited to the number of rows below that have borders around them, please list all that are applicable.

Agency Name: South Carolina Department of TransportationAgency Code: U12Agency Section: 084
Legal Standards Chart
11
Department of Transportation
14SC Code Section 11-
35-5240State
Minority business enterprise (MBE) Utilization Plan
Department of Transportation
SC Code Regs.19-445.2000(h)
StateIllegal Procurements Citation of the South Carolina Consolidated Procurement Code
Department of Transportation
16SC Code Section
12-28-2740State
Distribution of gasoline user fee among counties also referred to as C-Fund. Includes apportionments, formula distribution, and requirements for expenditure of funds; county transportation committees
Department of Transportation
17SC Code Section
12-28-2930State
State set-asides for small businesses owned and controlled by socially and economically ethnic minorities (MBE's) and disadvantaged females (WBE's)
Department of Transportation
18SC Code Section 44-
96-140State
Recycling programs of state government; state procurement policy; report of the Department of Transportation
Department of Transportation
19 SC Code Section
48-52-620State
State agency requirement to submit energy conservation plans and reports to include state buildings
Department of Transportation
20 SC Proviso 117.79 StateFines and Fees
Department of Transportation
21 SC Proviso 117.52 StatePersonnel Organization Chart
Department of Transportation
22 SC Proviso 84.11 StateHanahan Permit Application
Department of Transportation
23 SC Proviso 117.132 StateIT & Information Security Plans
Department of Transportation
24 SC Proviso 117.28 StateTravel Expenses of $2000
Department of Transportation
25 SC Proviso 117.88 StateBank Transparency & Accountability
Department of Transportation
26 SC Proviso 117.14 StateDiscrimination Policy
Department of Transportation
27 SC Proviso 84.16 StatePedestrian Overpass
Department of Transportation
28 SC Proviso 117.37 StateDebt Collections Report
Department of Transportation
29US Code of Laws:
Title 23Federal
Federal Statutes applicable to federally funded highway programs
Department of Transportation
30 23 Code of Federal Regulations
Federal Federal Regulations applicable to federally funded highway programs
Department of Transportation
3149 US Code Title 49, Subtitle III
Federal Section 5301, et seq. - Public Transportation
Department of Transportation
3249 Code of Federal Regulations
Federal Federal regulations applicable to federally funded transportation programs

Agency Name: South Carolina Department of TransportationAgency Code: U12Agency Section: 084
Agency Reporting Requirements Chart
12
Agency Submitting Report Item # Report Name Legislative Entity Requesting Report
Law Requiring Report
Stated Intent of Report Year First Required to Complete Report
Reporting Freq. # of Days in which to Complete Report
Month Report Template is Received by Agency
Month Agency is Required to Submit the Report
# of Staff Members Needed to Complete Report
Approx. Total Amount of time to Complete Report
Approx. total Cost to Agency to Complete (considering staff time, etc.)
Positive Results of Reporting
Method in which Report Template is Sent to Agency (i.e. via email; receive
Format in which Report Template is Sent to Agency
Method in which Agency Submits Completed Report (i.e. email; mail; click submit on web based form; etc.)
Format in which Agency Submits Completed Report (word, excel; web
Department of Transportation 1 Restructuring Report and Seven Year Cost Savings Plan
Governor, General Assembly and Senate Legislative Oversight Committee
1-30-10(G)(1) and 1-30-10(G) (2)
Increased Efficiency and Cost Savings 2015 Annually (or as needed)
60 November January 1 120 hours $8,624.95 TBD Email Word and Excel Email and Hand-delivered Mail
Word, Excel and PDF
Department of Transportation 2 Restructuring Report Governor, General Assembly and House Legislative Oversight Committee
1-30-10(G)(1) Increased Efficiency 1 Annually (or as needed)
30 February March 2 170 hours $12,218.68 TBD Email and Hardcopy
Word and Excel Email and Hand-delivered Mail
Word, Excel and PDF
Department of Transportation 3 Annual Accountability Report
Budget & Control Board (Executive Budget Office)
1-1-810, 1-1-820 and Proviso 117.31
Financial, Organizational, and Accountability Improvements
1929 (original annual report)
and 1995 (accountability report)
Annually 60 July September 2 80 hours $5,989.55 Depicts trends
Email and Hardcopy
Word and Excel Email and Hand-delivered Mail
Word, Excel and PDF
Department of Transportation 4 Annual Report General Assembly 57-3-760 Annual Accomplishments, Ten Year Needs Plan, and All Firms and Contract Amounts (DMV reports on traffic regulation- Section (3))
1951 (original report- gas
tax) and 1993 (includes accomplishments and future plans)
Annually 15 N/A January 1 30 hours $2,053.56 TBD Email and Hardcopy
Word and Excel Email and Hand-delivered Mail
Word, Excel and PDF
Department of Transportation 5 Transit Report Senate Transportation Committee and House Education & Public Works Committee
57-3-40 Annual accomplishments, five year needs, and funding plan.
1993 Annually 30 N/A February 2 25 hours $3,422.60 TBD Email and Hardcopy
Word and Excel Email and Hand-delivered Mail
Word, Excel and PDF
Department of Transportation 6 State Set-aside and Other State DBE Funds Report
General Assembly 12-28-2930(I) Allocation of all Contracts Awarded pursuant to DBE law.
1995 Annually 30 N/A July 2 72 hours $3,160.77 Awareness N/A N/A Not submitted - on file in office
Excel
Department of Transportation 7 Minority Business Enterprise Utilization Plan
Governor's SMBAO 11-35-5240(2) Procurement Contracts 1981 Annually N/A N/A July 1 7.5 hours $975.44 Transparency N/A N/A Mailed Word
Department of Transportation 8 Minority Business Enterprise Utilization Progress Report
Governor's SMBAO 11-35-5240(2) Procurement Contracts Progress Reports
1981 Quarterly 90 N/A January, April, July, & October
1 7.5 hours $359.37 Transparency N/A N/A Electronic Word
Department of Transportation 9 Annual Energy Conservation
State Energy Office 48-52-620 Report energy used by SCDOT for buildings
1992 (general plan) & 2008 (building plan)
Annually 30 N/A August 59 652 hours $20,936.04 Awareness of Energy Consumption
Email Word and Excel Email and Hardcopy
Word, Excel, and PDF
Department of Transportation 10 Fines and Fees Chairmen of Senate Finance and House Ways & Means
Proviso 117.75 Promote Accountability & Transparency
2010 Annually 60 N/A September 1 2 hours $167.71 Transparency Email Word and Excel Posted on web, Email and Hand-delivered Mail
Word and Excel
Department of Transportation 11 Personnel Organization Chart
Budget & Control Board (Office of HR)
Proviso 117.52 Agency organization chart of personnel
2005 Annually N/A N/A September 1 15 hours $886.45 Information N/A N/A Web-based (SCEIS)
Web-based (SCEIS)
Department of Transportation 12 Recycling Report DHEC 44-96-140 Transportation Solid Waste Reduction and general recycling.
1991 (DOT waste) and 2000 (general agency)
Annually August September 1 52 hours $1,540.17 Recycling Email Web-based Email Web-based
Department of Transportation 13 Railroad Avenue Extension/Hanahan Permit Application
US Corps of Engineers Proviso 84.11 Application for Required Permit 2014 One time N/A N/A TBD 2 TBD TBD Project to proceed
N/A N/A Mail Word and Plan Sheets
Department of Transportation 14 IT & Information Security Plans
Budget & Control Board (Division of Technology)
Proviso 117.132 Agency plan for Information Technology and Security Plans
2015 Annually 120 N/A October 5 187.5 hours $14,888.31 Security plan in place
Email Excel Secured Email Excel
Department of Transportation 15 Travel Expenses of $2000
Comptroller General Proviso 117.28 Travel Report for agency for prior fiscal year
1996 Annually 120 September October 1 2 hours $154.02 Transparency Email with attachment
Excel Email Excel
Department of Transportation 16 Bank Transparency & Accountability
Budget & Control Board (State Budget Office)
Proviso 117.88 Disclosure of transactions on the agency account for the prior fiscal year.
2011 Annually 120 September October 1 6 hours $284.08 Transparency Email with attachment
PDF and Excel Mail and email Word and Excel
Department of Transportation 17 Annual Audit General Assembly 57-1-490 Audits of agency performed by certified public accountant.
1993 Annually N/A N/A October Consultant Varies $138,444.17 Clear Audit N/A N/A Hardcopy Hardcopy Report
Department of Transportation 18 Discrimination Policy State Human Affairs Commission Proviso 117.14 SC policy on employment and filled vacancy rate data by race and sex.
1990 Annually N/A N/A October 1 15 hours $918.97 Transparency N/A N/A web based form NeoGov
Department of Transportation 19 Affirmative Action Plans and Programs
State Human Affairs Commission Proviso 117.14 Personnel Report by race and sex 1976 Annually N/A N/A February 1 15 hours $918.97 Transparency N/A N/A web based form SCEIS
Department of Transportation 20 Feasibility Studies for Sidewalk, Bike, and HOV Lanes
State Energy Office 57-3-780 Feasibility of HOV Lanes, Sidewalks, and Bicycle Lanes
1993 As needed 30 N/A Per Project Basis
N/A N/A N/A Awareness N/A N/A Email Word
Department of Transportation 21 Pedestrian Overpass Governor and General Assembly Proviso 84.16 Feasibility study for pedestrian overpass in Charleston
2015 Annually 180 N/A January Consultant Varies $25,000.00 Study Complete
N/A N/A Hardcopy Hardcopy Report
Department of Transportation 22 C-Fund Expenditures General Assembly 12-28-2740 Distribution of user fee among counties.
2002 Annually N/A N/A January 2 90 hours $5,862.91 Transparency N/A N/A Hardcopy and DVD
Hardcopy Report and disc
Cost to Complete Report
INSTRUCTIONS: List all reports, if any, the agency is required to submit to a legislative entity. Beside each include the following under the appropriate column: a) Name of the report; b) Legislative entity that requires the report; c) Law(s) that require the agency to provide the report; d) Stated legislative intent (from legislative entity, statute, regulation or other source) in providing the report; e) Frequency with which the report is required (i.e. annually, monthly, etc.); f) Approximate year the agency first started providing the report; g) Approximate cost to complete the report and any positive results from completing and submitting the report; and h) Method by which the agency receives, completes and submits the report (i.e. receive via emailed word document; log into or open program, enter data and click submit; etc.). Included below are examples of reports the agency may have to submit. The example does not include information in the columns under # of staff needed to complete the report; approx. total amount of time to complete the report and approx. total cost to complete the report, however the agency must complete these columns when submitting this chart in final form. Please delete the example figures before submitting this chart in final form, unless it applies to the agency, in which case ensure the information about those reports is complete. NOTE: Responses are not limited to the number of rows below that have borders around them, please list all that are applicable.

Agency Name: South Carolina Department of TransportationAgency Code: U12Agency Section: 084
Agency Reporting Requirements Chart
12
Department of Transportation 23 Debt Collections Report Chairmen of Senate Finance, House Ways & Means, and the Inspector General
Proviso 117.37 Report of outstanding debt and methods used to collect.
2002 Annually 60 January February 3 17 hours $864.21 Financial Email Excel template Email with attachment
Excel template
Department of Transportation 24 Federal Enhancement Grants
Chairmen of Senate Finance, House Ways & Means, and Education & Public Works
57-1-370 (D) Show Awards of Federal Enhancement Grants
2007 Annually N/A N/A February 2 90 hours $4,122.52 Informative N/A N/A Mail Word
Department of Transportation 25 Statements of Economic Interest
State Ethics Commission 8-13-1110 and 8-13-1140
Requirements for filing a statement of interest, amended in 2007 to include SCDOT Transportation District Engineering Administrators.
1991 Annually 120 December April 31 31 hours $1,351.93 Disclosure Mail Word Submit on web-based form
Web-based form
Department of Transportation 26 SCDOT Commission Requests for Routine Maintenance, Emergency Repairs, & Project Status
General Assembly (ACT 114) 57-1-460 Evaluation and Approval of Routine Operation & Maintenance and Emergency Repairs
2007 Monthly 30 Monthly Monthly 3 15 hours $925.81 Transparency N/A N/A Web PDF
Department of Transportation 27 Projects Approved by Commission
General Assembly (ACT 114) 57-1-370 Develop Long-Range Statewide Transportation Plan and plan for Preservation & Improvements
2007 Monthly 30 Monthly Monthly 6 114 hours $8,491.47 Transparency N/A N/A Web PDF
Department of Transportation 28 Procurement Card Report
General Assembly (ACT 114) 1-1-1040 Post Department's Monthly State Procurement Card Statements
2011 Monthly 30 Monthly Monthly N/A N/A N/A Transparency and automation
N/A N/A Web Web based
Department of Transportation 29 Indefinite Delivery of Contracts
Budget & Control Board (Office of State Engineer)
11-35-3310 Notify State Engineer of all indefinite delivery contract work orders/delivery orders
1993 Quarterly 90 N/A January, April, July, & October
2 10 hours $487.72 Informative N/A N/A Email PDF
Department of Transportation 30 Sole Source & Emergency Procurements
Budget & Control Board (Materials Management Office)
11-35-2440 Record of procurement actions to include sole source and emergency procurements.
1981 Quarterly 90 N/A January, April, July, & October
1 4 hour $191.67 Transparency N/A N/A Web Web based
Department of Transportation 31 Trade in Sales Budget & Control Board (Materials Management Office)
11-35-3830 Record listing of all trade-in sales. 1981 Quarterly 90 N/A January, April, July, & October
1 1 hour $47.92 Transparency N/A N/A Web Web based
Department of Transportation 32 Illegal Procurements Budget & Control Board (Division of Budget Analysis)
11-35-1230(2) and Regulation 19-445.2000(D)
Submitted only if illegal procurement occurs
1981 As Needed N/A N/A January, April, July, & October
1 1 hour $47.92 Transparency N/A N/A Web Web based
Department of Transportation 33 Comprehensive Permanent Improvement Plan
Budget & Control Board (Executive Budgeting Office)
2-47-50 and 2-47-55
Five-Year Plan 1980 Annually 45 January March 70 151.5 hours $9,959.77 Awareness Email Excel Email and Hardcopy
Excel and PDF

Agency Name: South Carolina Department of TransportationAgency Code: U12Agency Section: 084
Internal Audits Chart
13
Agency Submitting Report
Does agency have internal auditors? Y/N
Date Internal Audits Began
Individuals responsible for hiring internal auditors
Individuals to whom internal auditors report
Name and contact information for head Internal Auditor
General subject matters audited
Who makes decision of when an internal audit is conducted
Information considered when determining whether to conduct an internal audit
Do internal auditors conduct an agency wide risk assessment routinely? Y/N
Do internal auditors routinely evaluate the agency's performance measurement and improvement systems? Y/N
Total Number of Audits performed in last five fiscal years
# of months for shortest audit
# of months for longest audit
Avg. # of months needed to conduct audit
Date of most recent Peer Review of Self-Assessment by SCSIAA or other entity (if other entity, name of that entity)
Department of Transportation
Yes 2008 Paul Townes, Chief Internal Auditor
Paul Townes, Chief Internal Auditor
Paul Townes, Chief Internal Auditor: [email protected]; telephone - 803-737-1151; cell - 803-319-7271
Legislative Audit Council recommendations; Right-of-Way; C-funds; Enhancements (Transportation Alternatives Program); Road Data Services; Oversize/Overweight Permits; Purchasing cards; Audit of laptop Computers; Safety Department Audit; DBE Program; and Previously investigated fraud accusations.
Once an audit plan is approved by the Commission, the Chief Internal Auditor determines when an audit is conducted.
The Commission directors the Chief Internal Auditor on what audits to conduct, based on input from its members, agency management, and audit staff.
No No 20 4-6 months 2 years (this audit has started and stopped a couple of times due to issues with getting access to supporting information for certain calculations). At the conclusion of this audit, it will be close to two and a half years.
9-12 months; usually one employee works on an audit. Also, the more technical as audit or scope is, additional time is incurred since many audits are first time reviews.
A peer review is scheduled for 2015, which will be performed by SCSIAA.
Note: All audits are not the result of suspicious activity or alleged improper actions. Often times regular audits are required by statute regulation or an agency's standard operating procedure simply as a method of ensuring operations are staying on track.
INSTRUCTIONS: Identify the agency's internal audit system and policies during the past five fiscal years including the date the agency first started performing audits; individuals responsible for hiring the internal auditors; individuals to whom internal auditors report; the head internal auditor; general subject matters audited; the individual or body that makes decision of when internal audits are conducted; information considered when determining whether to conduct an internal audit; total number of audits performed in the last five fiscal years; # of months it took for shortest audit; # of months for longest audit; average number of months to complete an internal audit; and date of the most recent Peer Review of Self-Assessment by SC State Internal Auditors Association or other entity (if other entity, name of that entity).
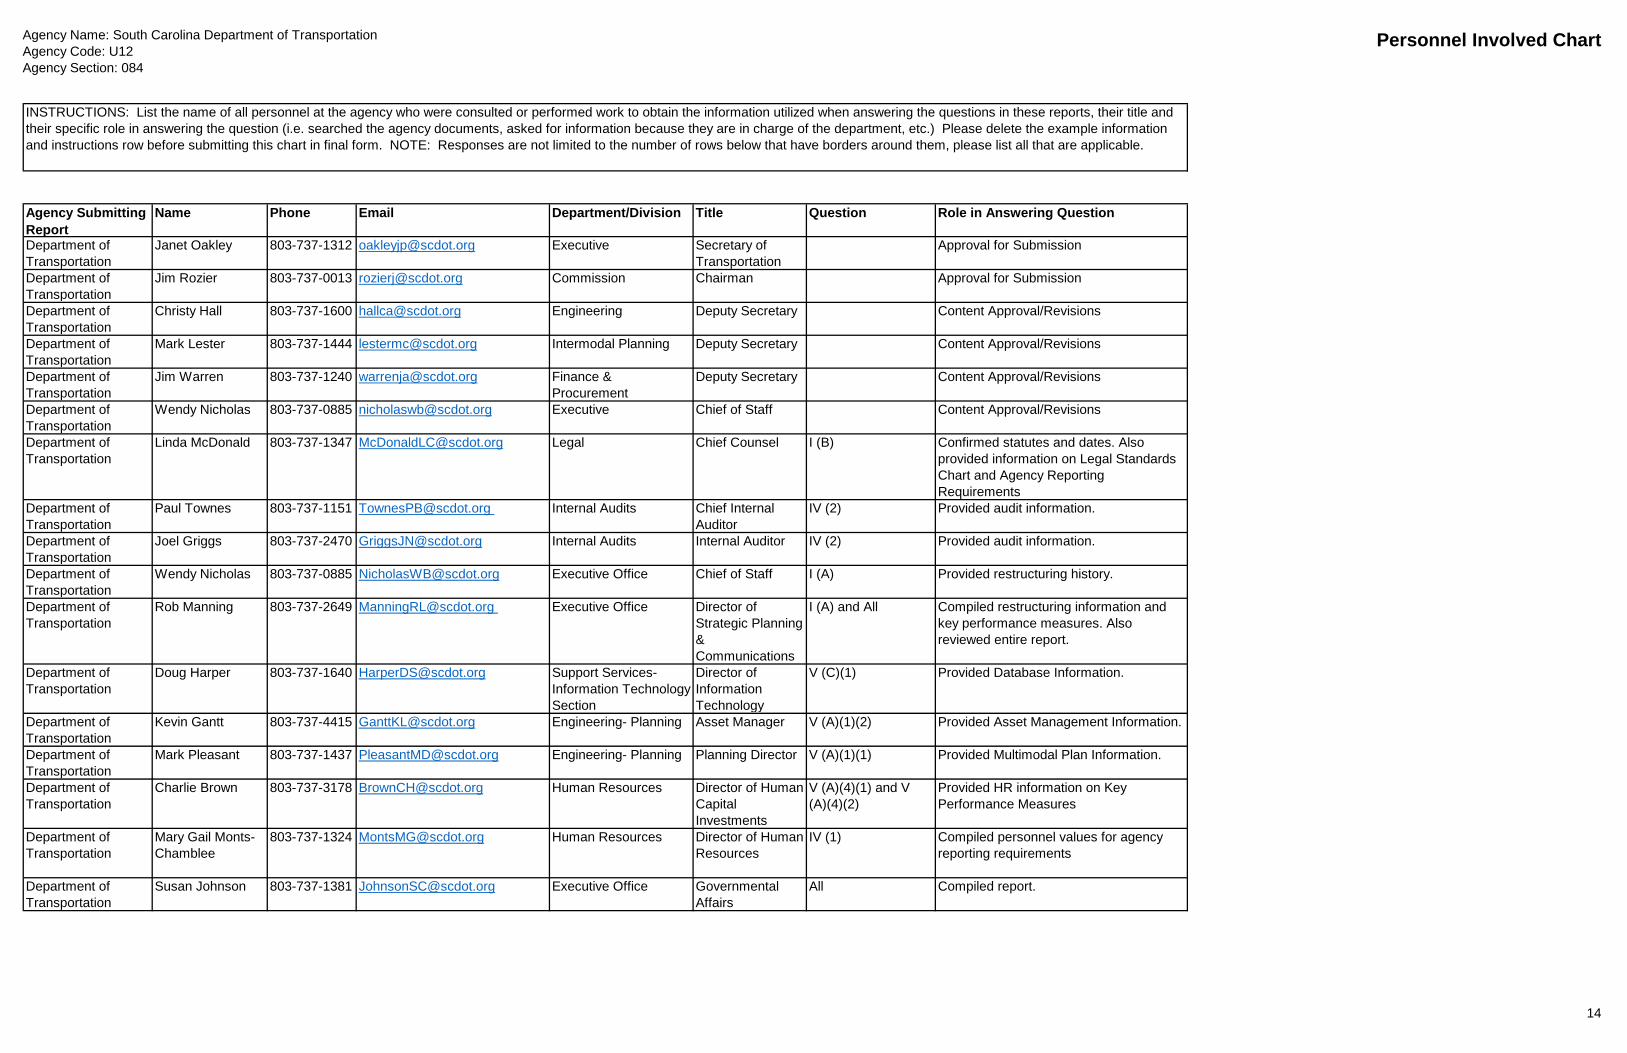
Agency Name: South Carolina Department of TransportationAgency Code: U12Agency Section: 084
Personnel Involved Chart
14
Agency Submitting Report
Name Phone Email Department/Division Title Question Role in Answering Question
Department of Transportation
Janet Oakley 803-737-1312 [email protected] Executive Secretary of Transportation
Approval for Submission
Department of Transportation
Jim Rozier 803-737-0013 [email protected] Commission Chairman Approval for Submission
Department of Transportation
Christy Hall 803-737-1600 [email protected] Engineering Deputy Secretary Content Approval/Revisions
Department of Transportation
Mark Lester 803-737-1444 [email protected] Intermodal Planning Deputy Secretary Content Approval/Revisions
Department of Transportation
Jim Warren 803-737-1240 [email protected] Finance & Procurement
Deputy Secretary Content Approval/Revisions
Department of Transportation
Wendy Nicholas 803-737-0885 [email protected] Executive Chief of Staff Content Approval/Revisions
Department of Transportation
Linda McDonald 803-737-1347 [email protected] Legal Chief Counsel I (B) Confirmed statutes and dates. Also provided information on Legal Standards Chart and Agency Reporting Requirements
Department of Transportation
Paul Townes 803-737-1151 [email protected] Internal Audits Chief Internal Auditor
IV (2) Provided audit information.
Department of Transportation
Joel Griggs 803-737-2470 [email protected] Internal Audits Internal Auditor IV (2) Provided audit information.
Department of Transportation
Wendy Nicholas 803-737-0885 [email protected] Executive Office Chief of Staff I (A) Provided restructuring history.
Department of Transportation
Rob Manning 803-737-2649 [email protected] Executive Office Director of Strategic Planning & Communications
I (A) and All Compiled restructuring information and key performance measures. Also reviewed entire report.
Department of Transportation
Doug Harper 803-737-1640 [email protected] Support Services- Information Technology Section
Director of Information Technology
V (C)(1) Provided Database Information.
Department of Transportation
Kevin Gantt 803-737-4415 [email protected] Engineering- Planning Asset Manager V (A)(1)(2) Provided Asset Management Information.
Department of Transportation
Mark Pleasant 803-737-1437 [email protected] Engineering- Planning Planning Director V (A)(1)(1) Provided Multimodal Plan Information.
Department of Transportation
Charlie Brown 803-737-3178 [email protected] Human Resources Director of Human Capital Investments
V (A)(4)(1) and V (A)(4)(2)
Provided HR information on Key Performance Measures
Department of Transportation
Mary Gail Monts-Chamblee
803-737-1324 [email protected] Human Resources Director of Human Resources
IV (1) Compiled personnel values for agency reporting requirements
Department of Transportation
Susan Johnson 803-737-1381 [email protected] Executive Office Governmental Affairs
All Compiled report.
INSTRUCTIONS: List the name of all personnel at the agency who were consulted or performed work to obtain the information utilized when answering the questions in these reports, their title and their specific role in answering the question (i.e. searched the agency documents, asked for information because they are in charge of the department, etc.) Please delete the example information and instructions row before submitting this chart in final form. NOTE: Responses are not limited to the number of rows below that have borders around them, please list all that are applicable.