Embed Size (px)
Citation preview
2
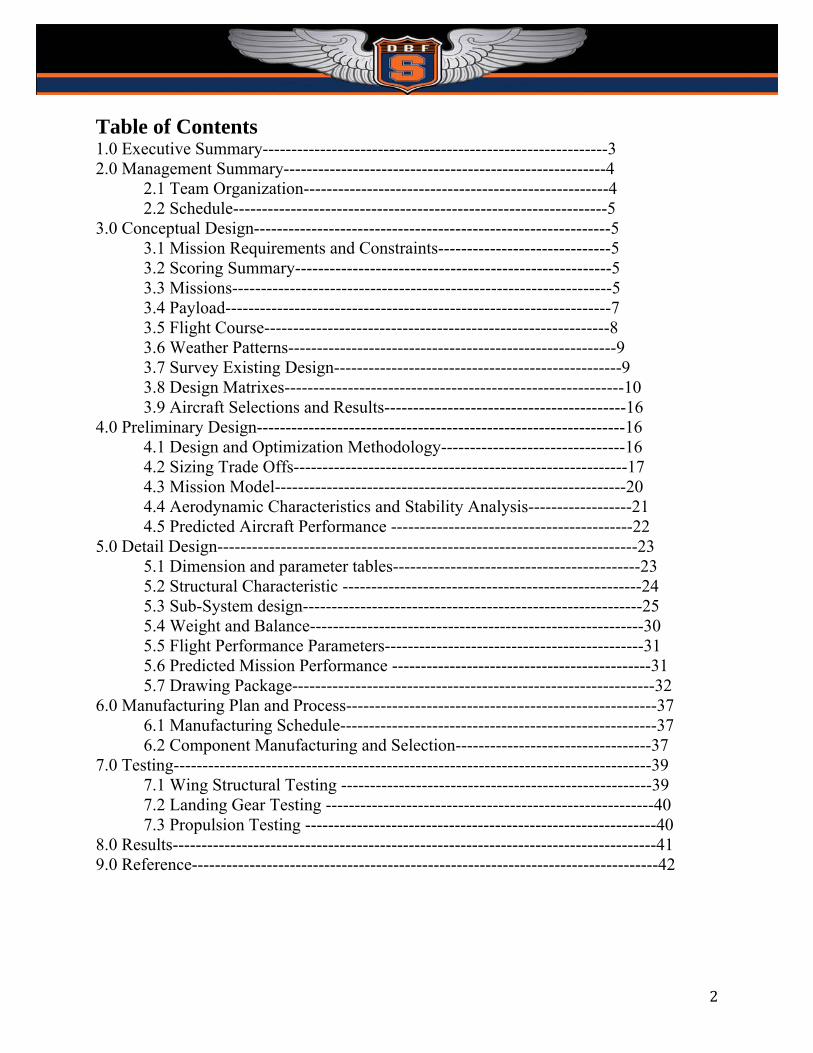
Table of Contents 1.0 Executive Summary------------------------------------------------------------3 2.0 Management Summary--------------------------------------------------------4 2.1 Team Organization-----------------------------------------------------4 2.2 Schedule-----------------------------------------------------------------5 3.0 Conceptual Design--------------------------------------------------------------5 3.1 Mission Requirements and Constraints------------------------------5 3.2 Scoring Summary-------------------------------------------------------5
3.3 Missions------------------------------------------------------------------5 3.4 Payload-------------------------------------------------------------------7 3.5 Flight Course------------------------------------------------------------8 3.6 Weather Patterns---------------------------------------------------------9
3.7 Survey Existing Design--------------------------------------------------9 3.8 Design Matrixes-----------------------------------------------------------10 3.9 Aircraft Selections and Results------------------------------------------16 4.0 Preliminary Design----------------------------------------------------------------16
4.1 Design and Optimization Methodology--------------------------------16 4.2 Sizing Trade Offs----------------------------------------------------------17
4.3 Mission Model-------------------------------------------------------------20 4.4 Aerodynamic Characteristics and Stability Analysis------------------21
4.5 Predicted Aircraft Performance ------------------------------------------22 5.0 Detail Design-------------------------------------------------------------------------23 5.1 Dimension and parameter tables-------------------------------------------23
5.2 Structural Characteristic ----------------------------------------------------24 5.3 Sub-System design-----------------------------------------------------------25 5.4 Weight and Balance----------------------------------------------------------30 5.5 Flight Performance Parameters---------------------------------------------31 5.6 Predicted Mission Performance ---------------------------------------------31 5.7 Drawing Package---------------------------------------------------------------32
6.0 Manufacturing Plan and Process------------------------------------------------------37 6.1 Manufacturing Schedule-------------------------------------------------------37
6.2 Component Manufacturing and Selection----------------------------------37 7.0 Testing-----------------------------------------------------------------------------------39 7.1 Wing Structural Testing ------------------------------------------------------39
7.2 Landing Gear Testing ---------------------------------------------------------40 7.3 Propulsion Testing -------------------------------------------------------------40
8.0 Results------------------------------------------------------------------------------------41 9.0 Reference---------------------------------------------------------------------------------42
3
1.0 Executive Summary This report outlines how the Syracuse University Design Build Fly Team
designed, manufactured and tested a radio controlled aircraft to meet the design specifications of the AIAA, Cessna Aircraft Company & Raytheon Missile Systems Design Build Fly competition for 2014-2015. This year’s competition consisted of one ground mission and three aerial missions. The ground mission was a timed event involving how fast the aircraft could be loaded with a 10”x4.5”x5.5” wooden block weighing approximately 5lbs that simulated a sensor package for Mission 2 and then how fast that package could be unloaded and the aircraft reloaded with the wiffle ball payload for Mission 3. A full score is achieved by completing the mission in less than five minutes with no damage to the aircraft. The first flight mission involves having the aircraft takeoff in the prescribed area without payload and having it fly as many laps as possible in four minutes. The second aerial mission comprises of taking off in a prescribed area while carrying the Mission 2 payload described above and flying three laps as fast as possible for a times score. The third and final flight mission, is a sensor drop mission where the aircraft is loaded with wiffle balls that were stored open to the air and could be dropped in a predetermined location along the flight path. The score for this mission is based on the number of laps and accurate sensor drops the aircraft can perform before landing.
Syracuse University Design Build Fly team created a fuselage that could store the sensor pack for Mission 2 while also being easy to load and reload. A payload delivery system was designed that could store and deliver the wiffle ball payloads in Mission 3 while also interacting with the airframe efficiently. A conventional high wing single motor aircraft configuration was select as the best option because it gave the aircraft stable and familiar flight characteristics.
The aircraft that was created had the capability being loaded and unloaded in less than 5 minutes. It could fly 5 laps in Mission 1 with a calculated velocity of 120 ft/s. The aircraft then could be loaded with Mission 2’s payload for an aircraft weight of 9.56 lb and fly the 3 required laps with an average time of 109.4 seconds. The aircraft is predicted to be able to fly Mission 3 and carry/drop 6 wiffle balls in the designated drop zone for a total of 6 laps. Further improvements to the design will be made in order to minimize its empty weight and maximize the speed and maneuverability of the aircraft, while maintaining mission completion and system reliability. Figure 1.1 shows the final design of the competition aircraft.
4
2.0 Management Summary 2.1 Team Organization
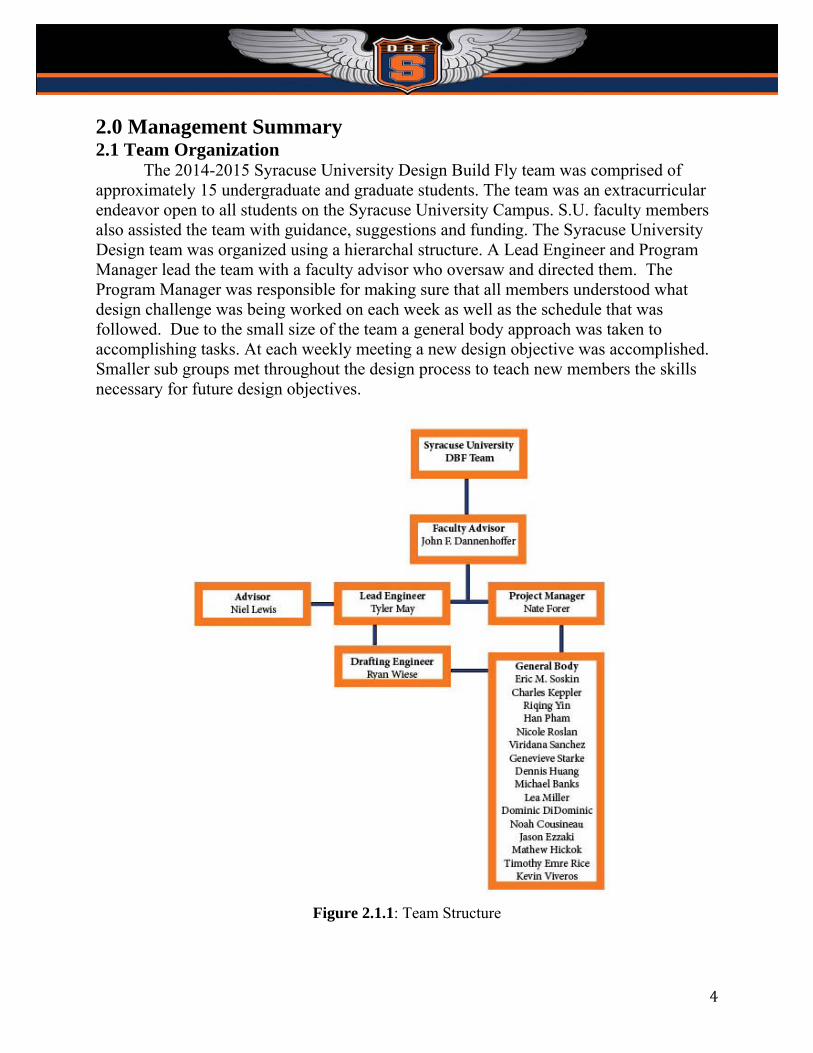
The 2014-2015 Syracuse University Design Build Fly team was comprised of approximately 15 undergraduate and graduate students. The team was an extracurricular endeavor open to all students on the Syracuse University Campus. S.U. faculty members also assisted the team with guidance, suggestions and funding. The Syracuse University Design team was organized using a hierarchal structure. A Lead Engineer and Program Manager lead the team with a faculty advisor who oversaw and directed them. The Program Manager was responsible for making sure that all members understood what design challenge was being worked on each week as well as the schedule that was followed. Due to the small size of the team a general body approach was taken to accomplishing tasks. At each weekly meeting a new design objective was accomplished. Smaller sub groups met throughout the design process to teach new members the skills necessary for future design objectives.
Figure 2.1.1: Team Structure
5
2.2 Project Schedule
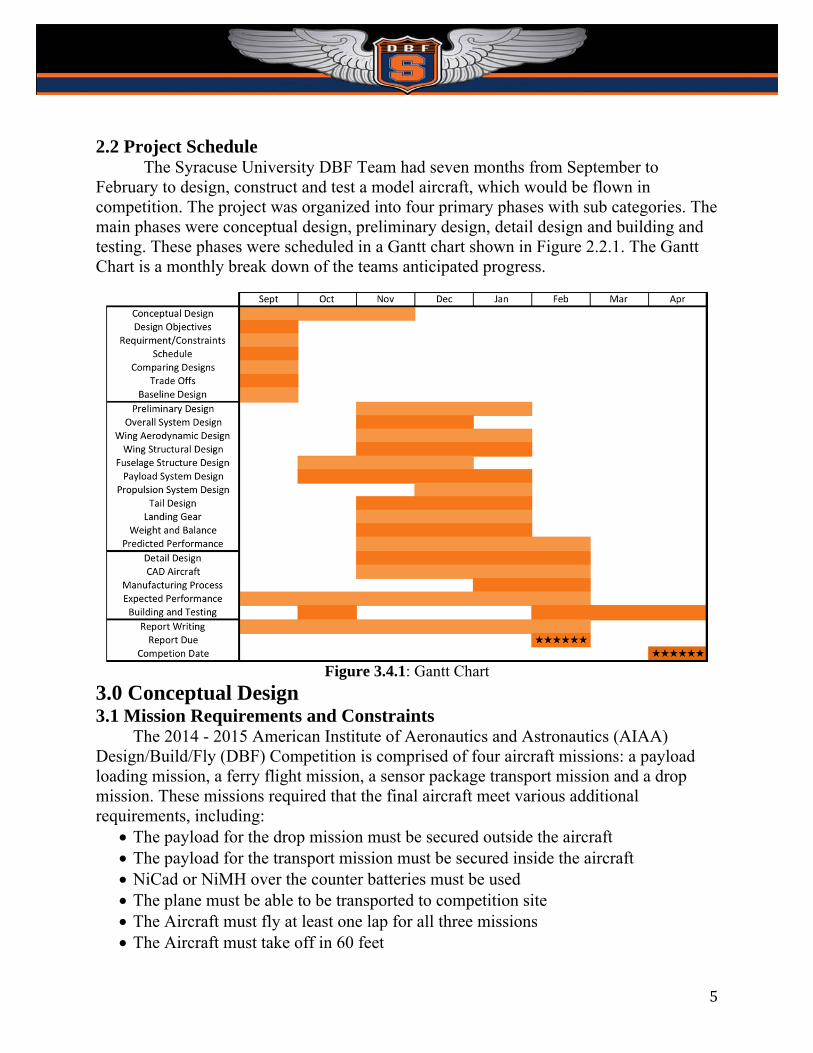
The Syracuse University DBF Team had seven months from September to February to design, construct and test a model aircraft, which would be flown in competition. The project was organized into four primary phases with sub categories. The main phases were conceptual design, preliminary design, detail design and building and testing. These phases were scheduled in a Gantt chart shown in Figure 2.2.1. The Gantt Chart is a monthly break down of the teams anticipated progress.
Figure 3.4.1: Gantt Chart
3.0 Conceptual Design 3.1 Mission Requirements and Constraints The 2014 - 2015 American Institute of Aeronautics and Astronautics (AIAA) Design/Build/Fly (DBF) Competition is comprised of four aircraft missions: a payload loading mission, a ferry flight mission, a sensor package transport mission and a drop mission. These missions required that the final aircraft meet various additional requirements, including:
The payload for the drop mission must be secured outside the aircraft The payload for the transport mission must be secured inside the aircraft NiCad or NiMH over the counter batteries must be used The plane must be able to be transported to competition site The Aircraft must fly at least one lap for all three missions The Aircraft must take off in 60 feet
6
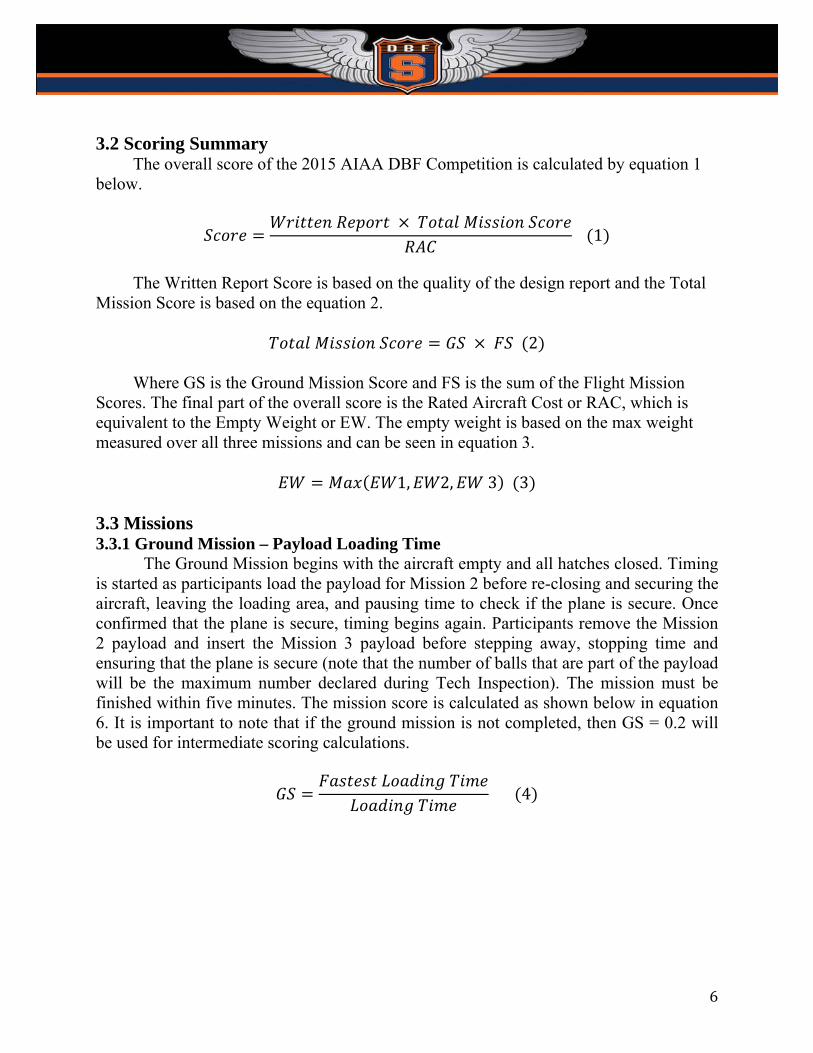
3.2 Scoring Summary The overall score of the 2015 AIAA DBF Competition is calculated by equation 1 below.
1
The Written Report Score is based on the quality of the design report and the Total Mission Score is based on the equation 2.
2 Where GS is the Ground Mission Score and FS is the sum of the Flight Mission Scores. The final part of the overall score is the Rated Aircraft Cost or RAC, which is equivalent to the Empty Weight or EW. The empty weight is based on the max weight measured over all three missions and can be seen in equation 3.
1, 2, 3 3 3.3 Missions 3.3.1 Ground Mission – Payload Loading Time
The Ground Mission begins with the aircraft empty and all hatches closed. Timing is started as participants load the payload for Mission 2 before re-closing and securing the aircraft, leaving the loading area, and pausing time to check if the plane is secure. Once confirmed that the plane is secure, timing begins again. Participants remove the Mission 2 payload and insert the Mission 3 payload before stepping away, stopping time and ensuring that the plane is secure (note that the number of balls that are part of the payload will be the maximum number declared during Tech Inspection). The mission must be finished within five minutes. The mission score is calculated as shown below in equation 6. It is important to note that if the ground mission is not completed, then GS = 0.2 will be used for intermediate scoring calculations.
4
7
3.3.2 Flight Mission 1 – Ferry Flight
Flight Mission 1 involves no payload. Aircraft takeoff within the prescribed field length and complete as many laps as possible within a four minute flight time. Time starts counting down when the throttle is used to initiate the first takeoff attempt. A lap is complete when the aircraft passes over the start/finish line while flying. Mission score can be calculated as shown in equation 5. For the to team to receive a score the flight must have a successful landing.
1 2
5
3.3.3 Flight Mission 2 – Sensor Package Transport Mission
Flight Mission 2 involves a payload of three standard 2x6 wooden pine boards that are fastened together to form a single block. The aircraft must have the payload and supporting equipment properly secured internally to the airplane. Internally is defined as completely closed by the airplane and not having any part exposed to freestream air before taking off within the prescribed field length. The aircraft will fly 3 timed laps carrying the senor package with the score calculated as shown below. The time of this mission is measured in seconds and begins counting down when the throttle is moved.
2 4
6
3.3.4 Flight Mission 3 – Sensor Drop Mission
Flight Mission 3 involves a payload consisting of plastic whiffle balls mounted externally to the fuselage of the aircraft. The aircraft takes off within the prescribed field length and, while airborne, remotely drops a single ball on each lap. The drop occurs in a specified “drop zone”, and a lap will only count if a single ball is dropped within the prescribed drop zone. If multiple balls drop in the same lap, the lap will not be accepted. No other part of the airplane or mounting system for the payload may drop with the ball and a successful landing must be completed to receive a score. The mission score is calculated using the following equation 7.
1 6
7
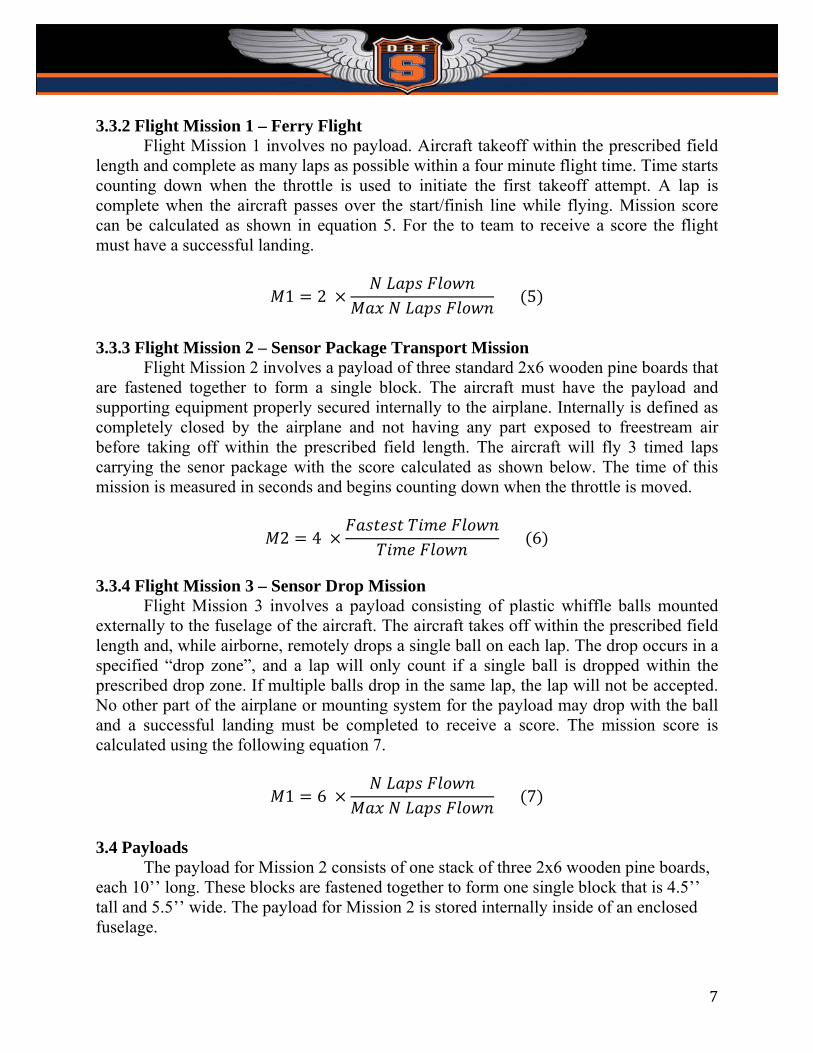
3.4 Payloads The payload for Mission 2 consists of one stack of three 2x6 wooden pine boards, each 10’’ long. These blocks are fastened together to form one single block that is 4.5’’ tall and 5.5’’ wide. The payload for Mission 2 is stored internally inside of an enclosed fuselage.
8
Figure 3.4.1: Mission 2 Payload
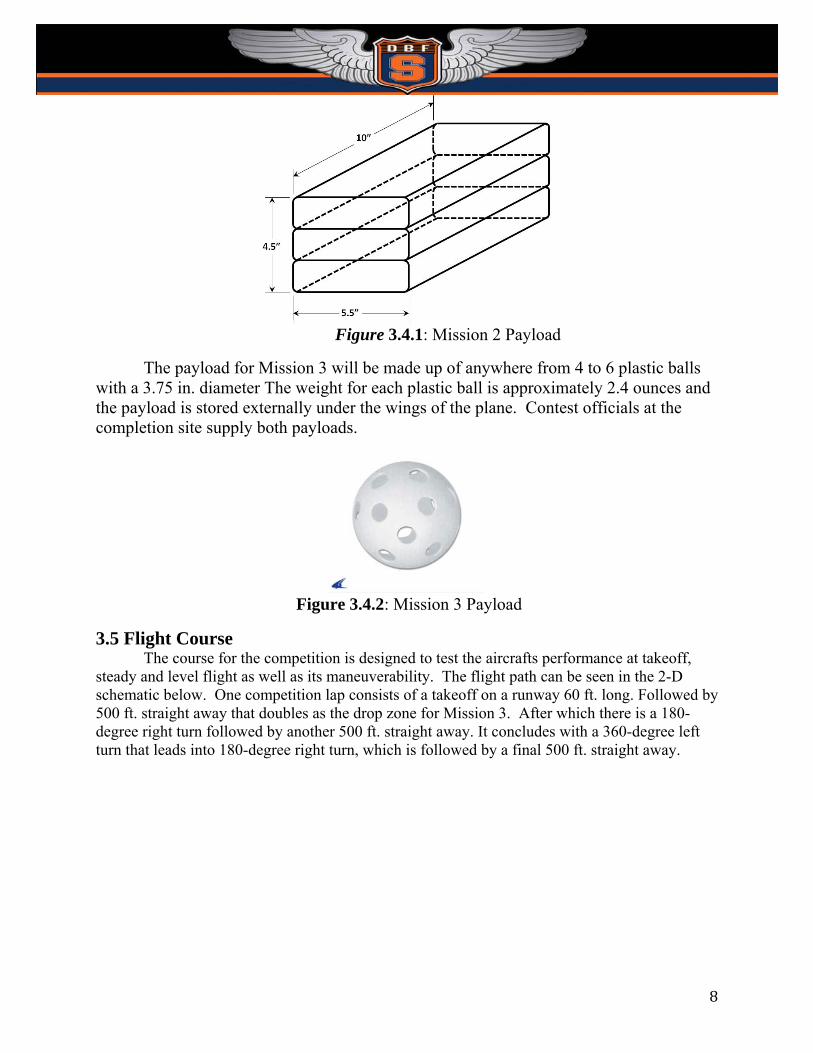
The payload for Mission 3 will be made up of anywhere from 4 to 6 plastic balls with a 3.75 in. diameter The weight for each plastic ball is approximately 2.4 ounces and the payload is stored externally under the wings of the plane. Contest officials at the completion site supply both payloads.
Figure 3.4.2: Mission 3 Payload
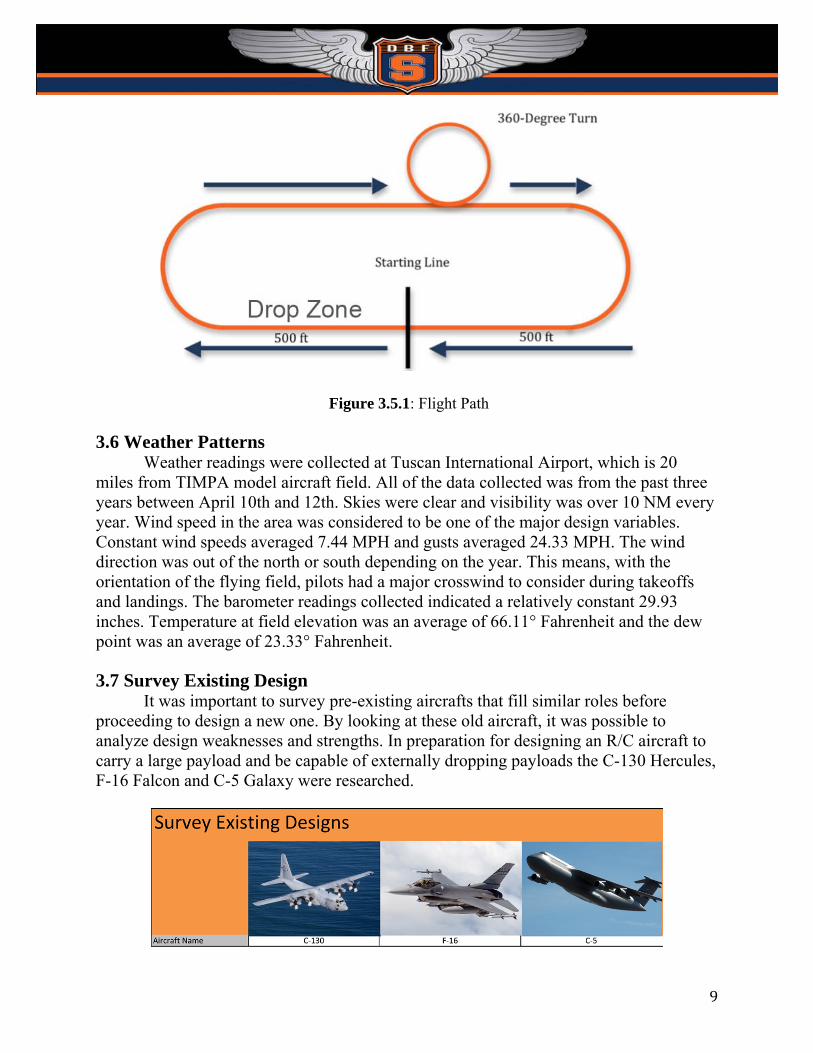
3.5 Flight Course The course for the competition is designed to test the aircrafts performance at takeoff,
steady and level flight as well as its maneuverability. The flight path can be seen in the 2-D schematic below. One competition lap consists of a takeoff on a runway 60 ft. long. Followed by 500 ft. straight away that doubles as the drop zone for Mission 3. After which there is a 180-degree right turn followed by another 500 ft. straight away. It concludes with a 360-degree left turn that leads into 180-degree right turn, which is followed by a final 500 ft. straight away.
9
Figure 3.5.1: Flight Path
3.6 Weather Patterns
Weather readings were collected at Tuscan International Airport, which is 20 miles from TIMPA model aircraft field. All of the data collected was from the past three years between April 10th and 12th. Skies were clear and visibility was over 10 NM every year. Wind speed in the area was considered to be one of the major design variables. Constant wind speeds averaged 7.44 MPH and gusts averaged 24.33 MPH. The wind direction was out of the north or south depending on the year. This means, with the orientation of the flying field, pilots had a major crosswind to consider during takeoffs and landings. The barometer readings collected indicated a relatively constant 29.93 inches. Temperature at field elevation was an average of 66.11° Fahrenheit and the dew point was an average of 23.33° Fahrenheit. 3.7 Survey Existing Design
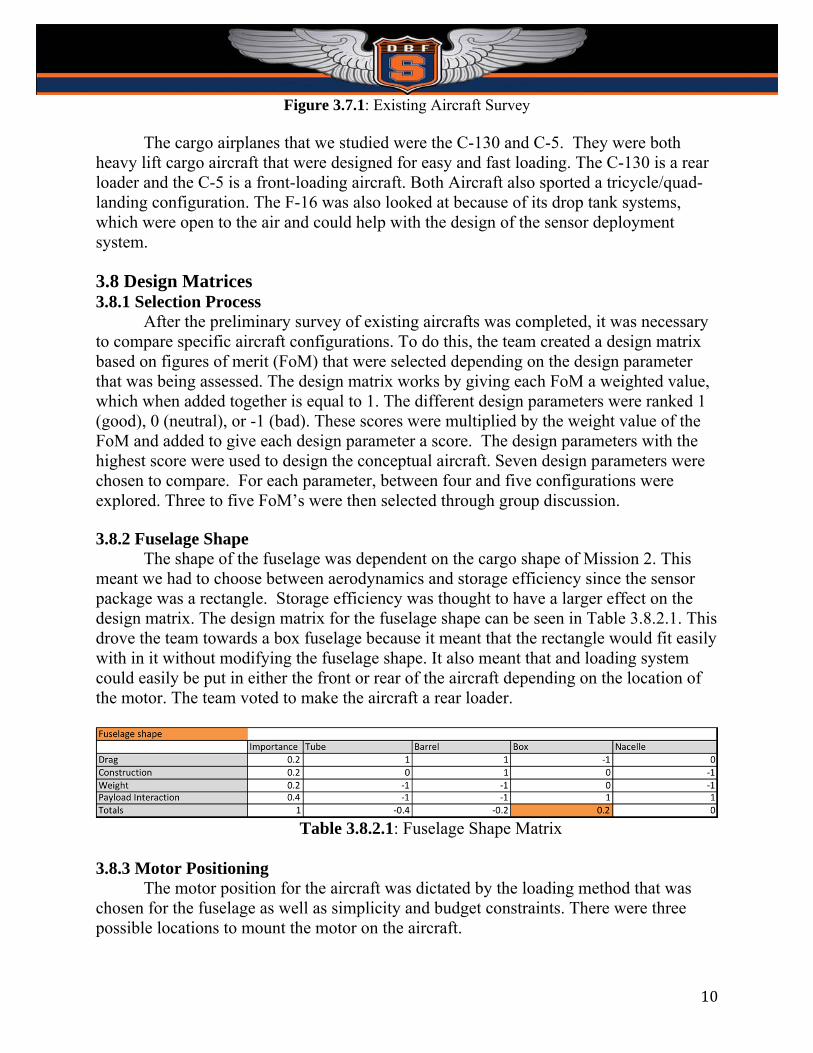
It was important to survey pre-existing aircrafts that fill similar roles before proceeding to design a new one. By looking at these old aircraft, it was possible to analyze design weaknesses and strengths. In preparation for designing an R/C aircraft to carry a large payload and be capable of externally dropping payloads the C-130 Hercules, F-16 Falcon and C-5 Galaxy were researched.
10
Figure 3.7.1: Existing Aircraft Survey
The cargo airplanes that we studied were the C-130 and C-5. They were both heavy lift cargo aircraft that were designed for easy and fast loading. The C-130 is a rear loader and the C-5 is a front-loading aircraft. Both Aircraft also sported a tricycle/quad-landing configuration. The F-16 was also looked at because of its drop tank systems, which were open to the air and could help with the design of the sensor deployment system. 3.8 Design Matrices 3.8.1 Selection Process
After the preliminary survey of existing aircrafts was completed, it was necessary to compare specific aircraft configurations. To do this, the team created a design matrix based on figures of merit (FoM) that were selected depending on the design parameter that was being assessed. The design matrix works by giving each FoM a weighted value, which when added together is equal to 1. The different design parameters were ranked 1 (good), 0 (neutral), or -1 (bad). These scores were multiplied by the weight value of the FoM and added to give each design parameter a score. The design parameters with the highest score were used to design the conceptual aircraft. Seven design parameters were chosen to compare. For each parameter, between four and five configurations were explored. Three to five FoM’s were then selected through group discussion.
3.8.2 Fuselage Shape
The shape of the fuselage was dependent on the cargo shape of Mission 2. This meant we had to choose between aerodynamics and storage efficiency since the sensor package was a rectangle. Storage efficiency was thought to have a larger effect on the design matrix. The design matrix for the fuselage shape can be seen in Table 3.8.2.1. This drove the team towards a box fuselage because it meant that the rectangle would fit easily with in it without modifying the fuselage shape. It also meant that and loading system could easily be put in either the front or rear of the aircraft depending on the location of the motor. The team voted to make the aircraft a rear loader.
Table 3.8.2.1: Fuselage Shape Matrix
3.8.3 Motor Positioning
The motor position for the aircraft was dictated by the loading method that was chosen for the fuselage as well as simplicity and budget constraints. There were three possible locations to mount the motor on the aircraft.
11
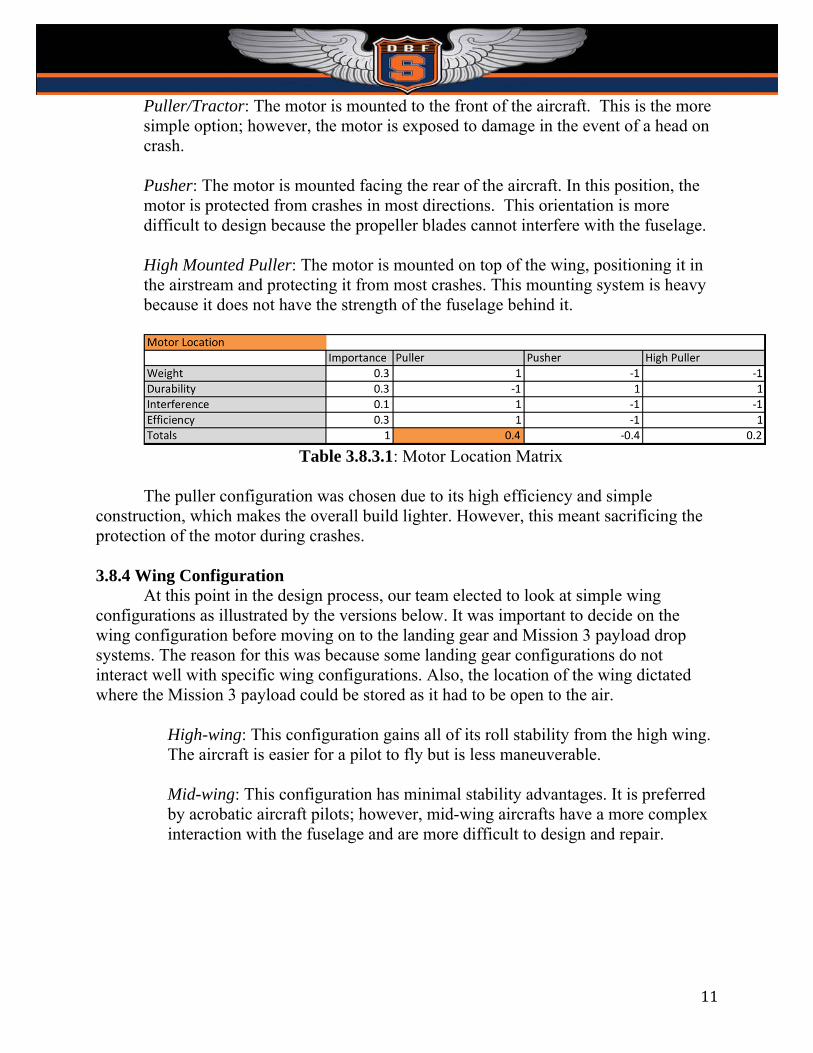
Puller/Tractor: The motor is mounted to the front of the aircraft. This is the more simple option; however, the motor is exposed to damage in the event of a head on crash.
Pusher: The motor is mounted facing the rear of the aircraft. In this position, the motor is protected from crashes in most directions. This orientation is more difficult to design because the propeller blades cannot interfere with the fuselage.
High Mounted Puller: The motor is mounted on top of the wing, positioning it in the airstream and protecting it from most crashes. This mounting system is heavy because it does not have the strength of the fuselage behind it.
Table 3.8.3.1: Motor Location Matrix
The puller configuration was chosen due to its high efficiency and simple
construction, which makes the overall build lighter. However, this meant sacrificing the protection of the motor during crashes.
3.8.4 Wing Configuration
At this point in the design process, our team elected to look at simple wing configurations as illustrated by the versions below. It was important to decide on the wing configuration before moving on to the landing gear and Mission 3 payload drop systems. The reason for this was because some landing gear configurations do not interact well with specific wing configurations. Also, the location of the wing dictated where the Mission 3 payload could be stored as it had to be open to the air.
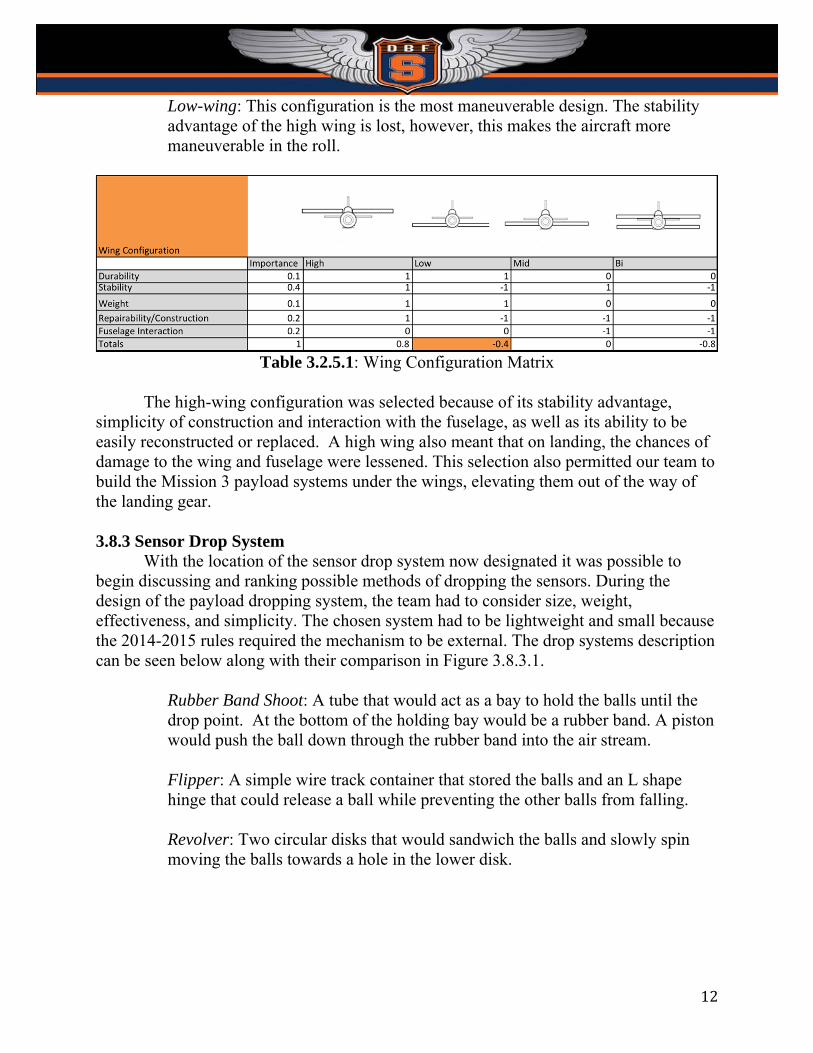
High-wing: This configuration gains all of its roll stability from the high wing. The aircraft is easier for a pilot to fly but is less maneuverable.
Mid-wing: This configuration has minimal stability advantages. It is preferred by acrobatic aircraft pilots; however, mid-wing aircrafts have a more complex interaction with the fuselage and are more difficult to design and repair.
12
Low-wing: This configuration is the most maneuverable design. The stability advantage of the high wing is lost, however, this makes the aircraft more maneuverable in the roll.
Table 3.2.5.1: Wing Configuration Matrix
The high-wing configuration was selected because of its stability advantage,
simplicity of construction and interaction with the fuselage, as well as its ability to be easily reconstructed or replaced. A high wing also meant that on landing, the chances of damage to the wing and fuselage were lessened. This selection also permitted our team to build the Mission 3 payload systems under the wings, elevating them out of the way of the landing gear. 3.8.3 Sensor Drop System
With the location of the sensor drop system now designated it was possible to begin discussing and ranking possible methods of dropping the sensors. During the design of the payload dropping system, the team had to consider size, weight, effectiveness, and simplicity. The chosen system had to be lightweight and small because the 2014-2015 rules required the mechanism to be external. The drop systems description can be seen below along with their comparison in Figure 3.8.3.1.
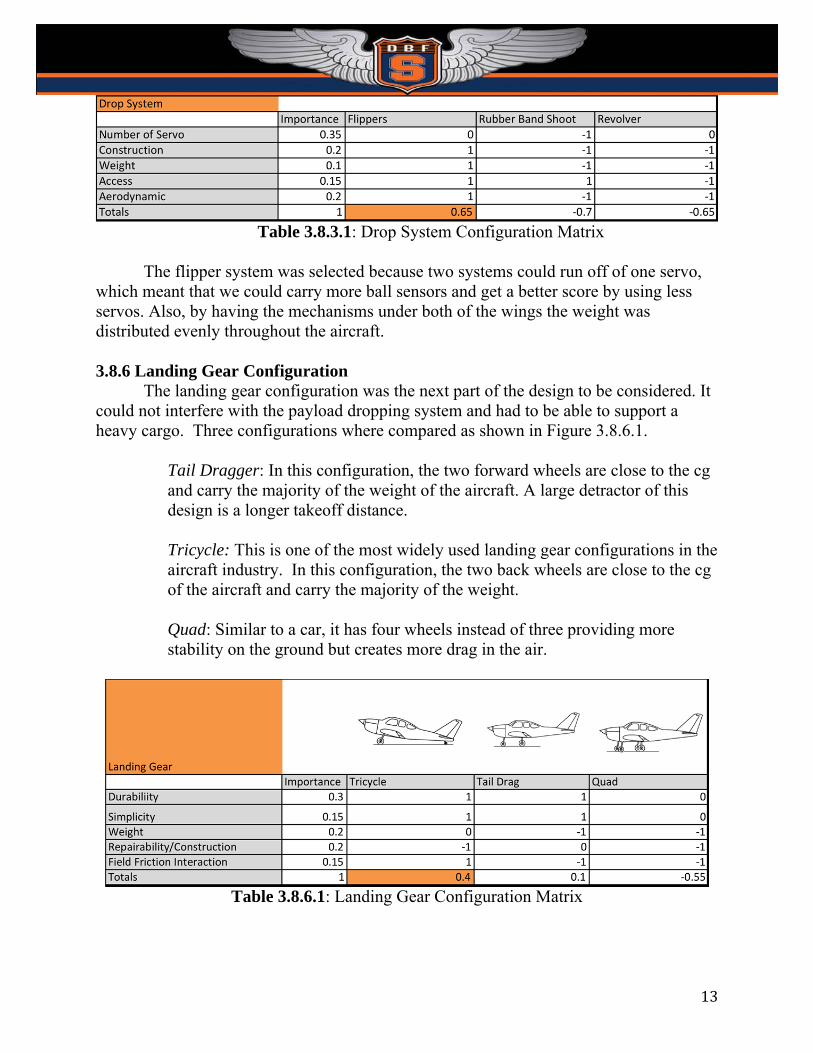
Rubber Band Shoot: A tube that would act as a bay to hold the balls until the drop point. At the bottom of the holding bay would be a rubber band. A piston would push the ball down through the rubber band into the air stream. Flipper: A simple wire track container that stored the balls and an L shape hinge that could release a ball while preventing the other balls from falling.
Revolver: Two circular disks that would sandwich the balls and slowly spin moving the balls towards a hole in the lower disk.
13
Table 3.8.3.1: Drop System Configuration Matrix
The flipper system was selected because two systems could run off of one servo,
which meant that we could carry more ball sensors and get a better score by using less servos. Also, by having the mechanisms under both of the wings the weight was distributed evenly throughout the aircraft. 3.8.6 Landing Gear Configuration
The landing gear configuration was the next part of the design to be considered. It could not interfere with the payload dropping system and had to be able to support a heavy cargo. Three configurations where compared as shown in Figure 3.8.6.1.
Tail Dragger: In this configuration, the two forward wheels are close to the cg and carry the majority of the weight of the aircraft. A large detractor of this design is a longer takeoff distance.
Tricycle: This is one of the most widely used landing gear configurations in the aircraft industry. In this configuration, the two back wheels are close to the cg of the aircraft and carry the majority of the weight.
Quad: Similar to a car, it has four wheels instead of three providing more stability on the ground but creates more drag in the air.
Table 3.8.6.1: Landing Gear Configuration Matrix
14
It was decided that because there were no taxi missions and that the rear of the fuselage needed to be accessed easily, a tricycle landing gear would be used. 3.8.7 Tail Configuration With most of our aircraft design configurations selected, it was possible to select a tail configuration. There were numerous aircraft tail configurations as shown by the list below.
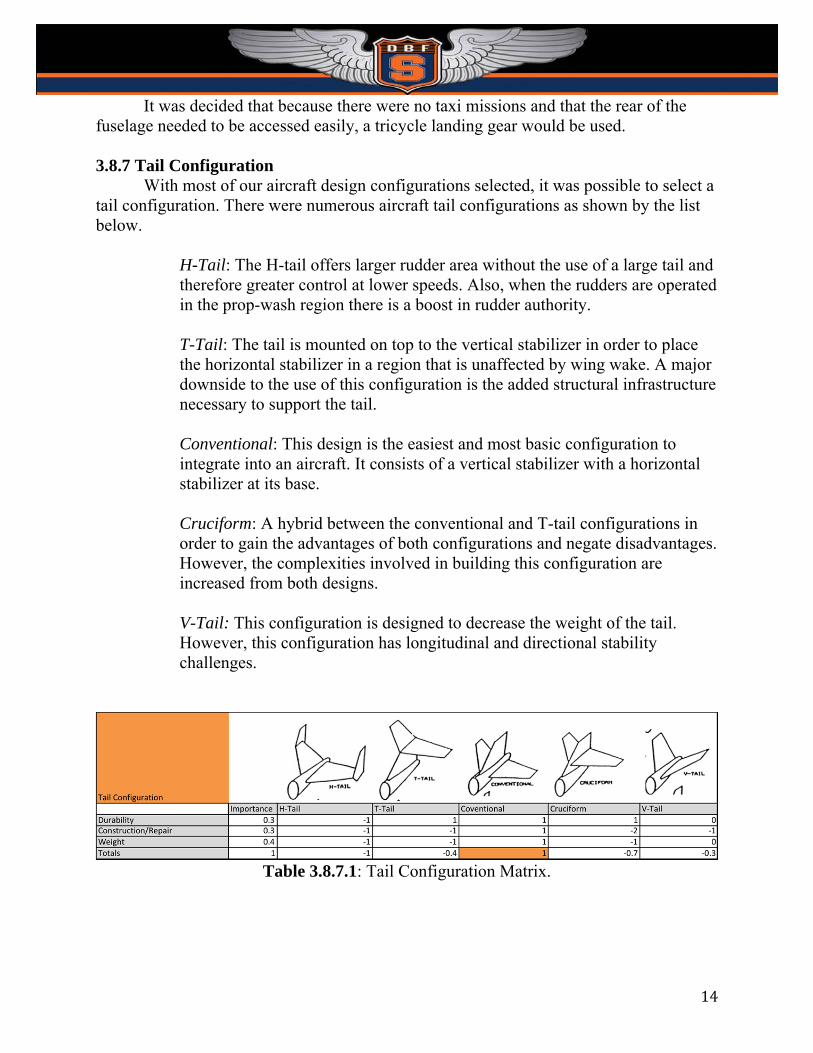
H-Tail: The H-tail offers larger rudder area without the use of a large tail and therefore greater control at lower speeds. Also, when the rudders are operated in the prop-wash region there is a boost in rudder authority.
T-Tail: The tail is mounted on top to the vertical stabilizer in order to place the horizontal stabilizer in a region that is unaffected by wing wake. A major downside to the use of this configuration is the added structural infrastructure necessary to support the tail.
Conventional: This design is the easiest and most basic configuration to integrate into an aircraft. It consists of a vertical stabilizer with a horizontal stabilizer at its base.
Cruciform: A hybrid between the conventional and T-tail configurations in order to gain the advantages of both configurations and negate disadvantages. However, the complexities involved in building this configuration are increased from both designs.
V-Tail: This configuration is designed to decrease the weight of the tail. However, this configuration has longitudinal and directional stability challenges.
Table 3.8.7.1: Tail Configuration Matrix.
15
The conventional tail configuration was chosen for its simplicity and lesser
weight. It was also selected because it is incredibly easy to repair.
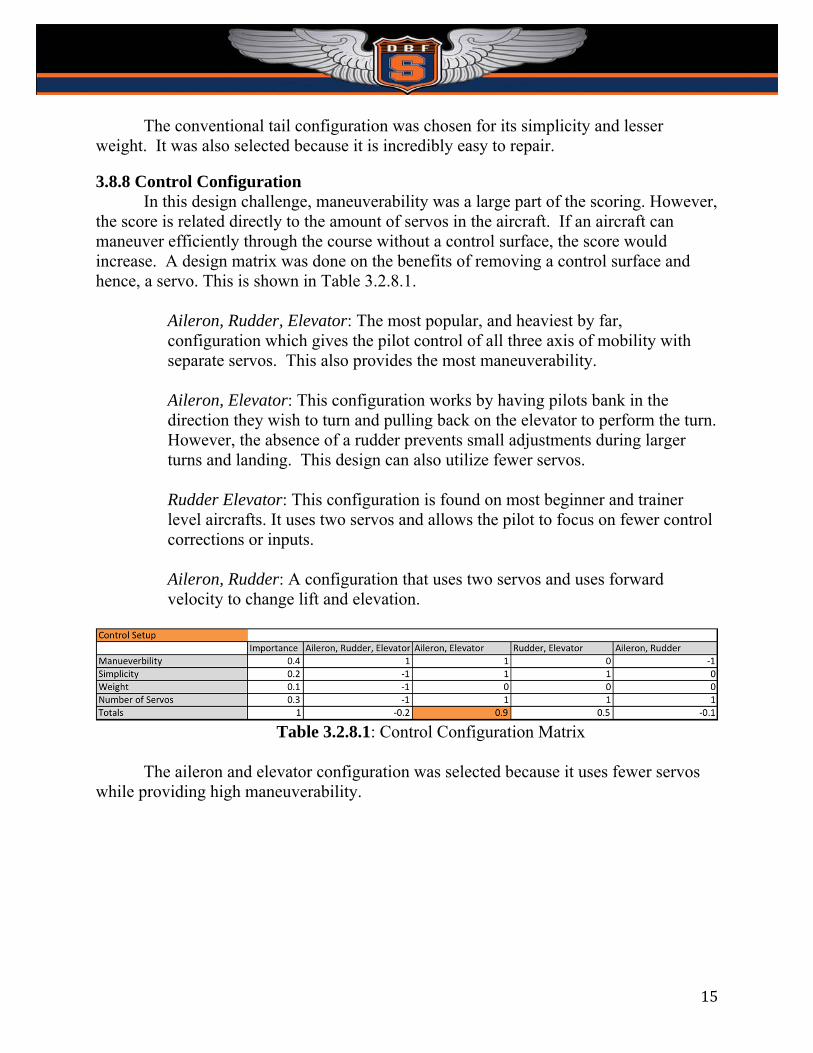
3.8.8 Control Configuration In this design challenge, maneuverability was a large part of the scoring. However,
the score is related directly to the amount of servos in the aircraft. If an aircraft can maneuver efficiently through the course without a control surface, the score would increase. A design matrix was done on the benefits of removing a control surface and hence, a servo. This is shown in Table 3.2.8.1.
Aileron, Rudder, Elevator: The most popular, and heaviest by far, configuration which gives the pilot control of all three axis of mobility with separate servos. This also provides the most maneuverability.
Aileron, Elevator: This configuration works by having pilots bank in the direction they wish to turn and pulling back on the elevator to perform the turn. However, the absence of a rudder prevents small adjustments during larger turns and landing. This design can also utilize fewer servos.
Rudder Elevator: This configuration is found on most beginner and trainer level aircrafts. It uses two servos and allows the pilot to focus on fewer control corrections or inputs.
Aileron, Rudder: A configuration that uses two servos and uses forward velocity to change lift and elevation.
Table 3.2.8.1: Control Configuration Matrix
The aileron and elevator configuration was selected because it uses fewer servos
while providing high maneuverability.
16
3.9 Aircraft Selections and Results
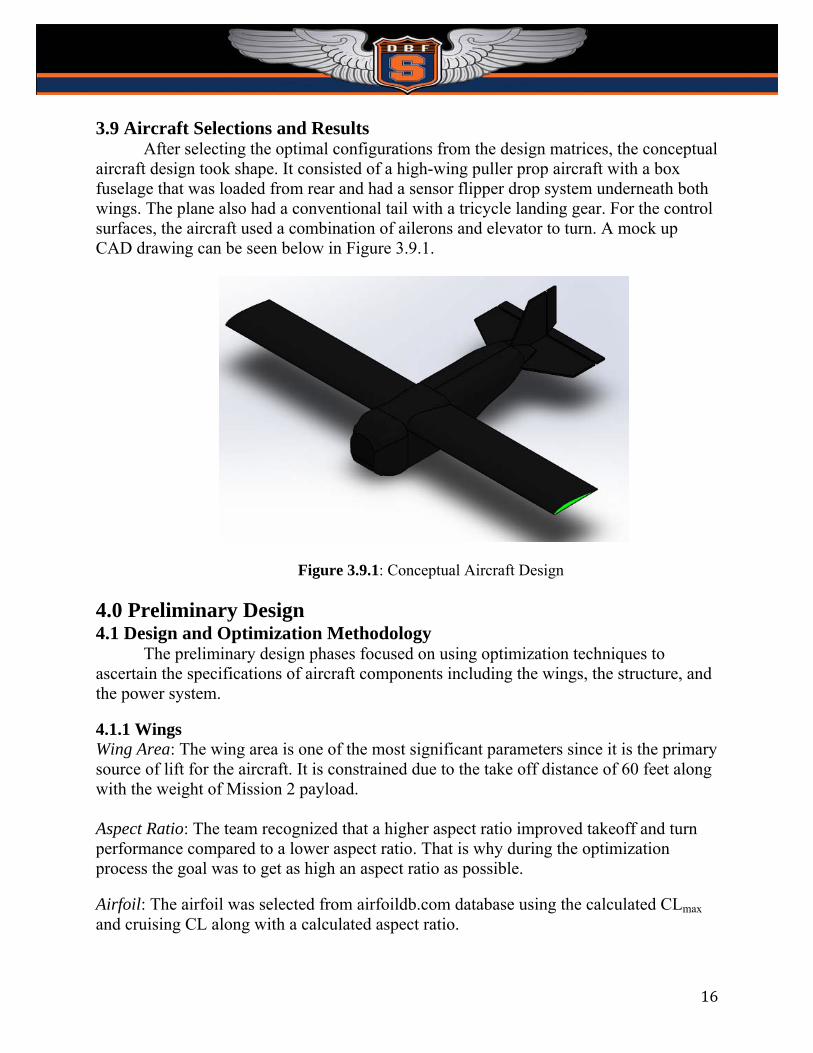
After selecting the optimal configurations from the design matrices, the conceptual aircraft design took shape. It consisted of a high-wing puller prop aircraft with a box fuselage that was loaded from rear and had a sensor flipper drop system underneath both wings. The plane also had a conventional tail with a tricycle landing gear. For the control surfaces, the aircraft used a combination of ailerons and elevator to turn. A mock up CAD drawing can be seen below in Figure 3.9.1.
Figure 3.9.1: Conceptual Aircraft Design
4.0 Preliminary Design 4.1 Design and Optimization Methodology
The preliminary design phases focused on using optimization techniques to ascertain the specifications of aircraft components including the wings, the structure, and the power system.
4.1.1 Wings Wing Area: The wing area is one of the most significant parameters since it is the primary source of lift for the aircraft. It is constrained due to the take off distance of 60 feet along with the weight of Mission 2 payload. Aspect Ratio: The team recognized that a higher aspect ratio improved takeoff and turn performance compared to a lower aspect ratio. That is why during the optimization process the goal was to get as high an aspect ratio as possible.
Airfoil: The airfoil was selected from airfoildb.com database using the calculated CLmax and cruising CL along with a calculated aspect ratio.

17
4.1.2 Structure Wing Spars: The wing spars were designed specifically so that they could take the maximum cargo load while also being light and durable.
Fuselage: The fuselage is what holds the entire aircraft together; because of this it was designed to transfer the load of the cargo directly to the ground on landings. It was also designed to be as aerodynamic and light as possible to assist in increasing the total score.
4.1.3 Propulsion Motor, Propeller, and Battery Pack: These components were selected and organized as to amplify the performance of the aircraft while attempting to decrease the weight of the aircrafts payload. The propeller shape and size was also altered to increase mission performance.
4.2 Sizing Trade Offs 4.2.1 Payload The weight of the cargo in Mission 2 was the first payload parameter that was identified because it was the heaviest payload. This meant that the aircraft had to be designed to carry at most 5 lbs. There was no way to make changes to the payload, so alterations to lighten the plane had to be considered. This meant using new building styles and structural supports. Even though Mission 2 provided the overall shape and design of the aircraft, the mission’s payload delivery system needed to be included as to add the extra weight during to Missions 2’s flight. From the information given, Mission 3 could carry a total of 12 balls if it was deemed necessary. However, our scoring optimization showed that it was optimal to carry between 2-6 balls because of the expected life of the battery. 4.2.2 Airfoil Selection To select an airfoil we created a rough weight estimate by generating a conceptual fuselage design in SolidWorks. The volume of each piece was summed and multiplied by the density of balsa wood, which was acquired from the Syracuse University Design Build Fly archives. A surface area estimate was gathered for an estimate of the microlite weight. This fuselage weight was multiplied by a factor of three and added to the sum of the weights of the electronics in order to gain a rough estimate for the entire aircraft structure. At SLUF conditions, the lift and weight can be set equivalent. A MATLAB code which calculated lift as a function of a range of CL and V∞ was then created. This plot allowed a CL of .406 to be assumed, as well as a cruising velocity of 39.8 ft/s. Using the same MATLAB code, a plot of CL and CD against velocity was generated. CD was calculated assuming the maximum L/D condition, where CD is double the induced drag. This data showed that a CLMax of about 1.55 would be most effective for our conditions. From here (L/D)Max was calculated. The data acquired was then plugged into
18
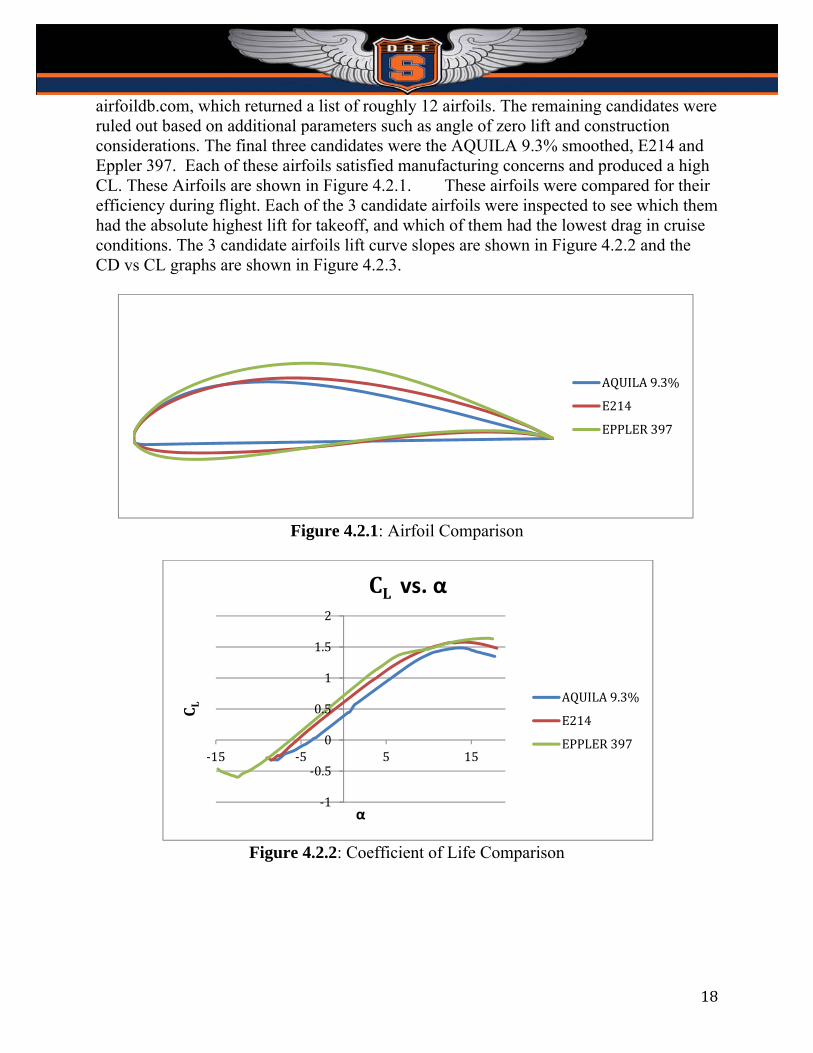
airfoildb.com, which returned a list of roughly 12 airfoils. The remaining candidates were ruled out based on additional parameters such as angle of zero lift and construction considerations. The final three candidates were the AQUILA 9.3% smoothed, E214 and Eppler 397. Each of these airfoils satisfied manufacturing concerns and produced a high CL. These Airfoils are shown in Figure 4.2.1. � �These airfoils were compared for their efficiency during flight. Each of the 3 candidate airfoils were inspected to see which them had the absolute highest lift for takeoff, and which of them had the lowest drag in cruise conditions. The 3 candidate airfoils lift curve slopes are shown in Figure 4.2.2 and the CD vs CL graphs are shown in Figure 4.2.3.
Figure 4.2.1: Airfoil Comparison
Figure 4.2.2: Coefficient of Life Comparison
AQUILA9.3%
E214
EPPLER397
‐1
‐0.5
0
0.5
1
1.5
2
‐15 ‐5 5 15
C L
α
CL vs. α
AQUILA9.3%
E214
EPPLER397
19
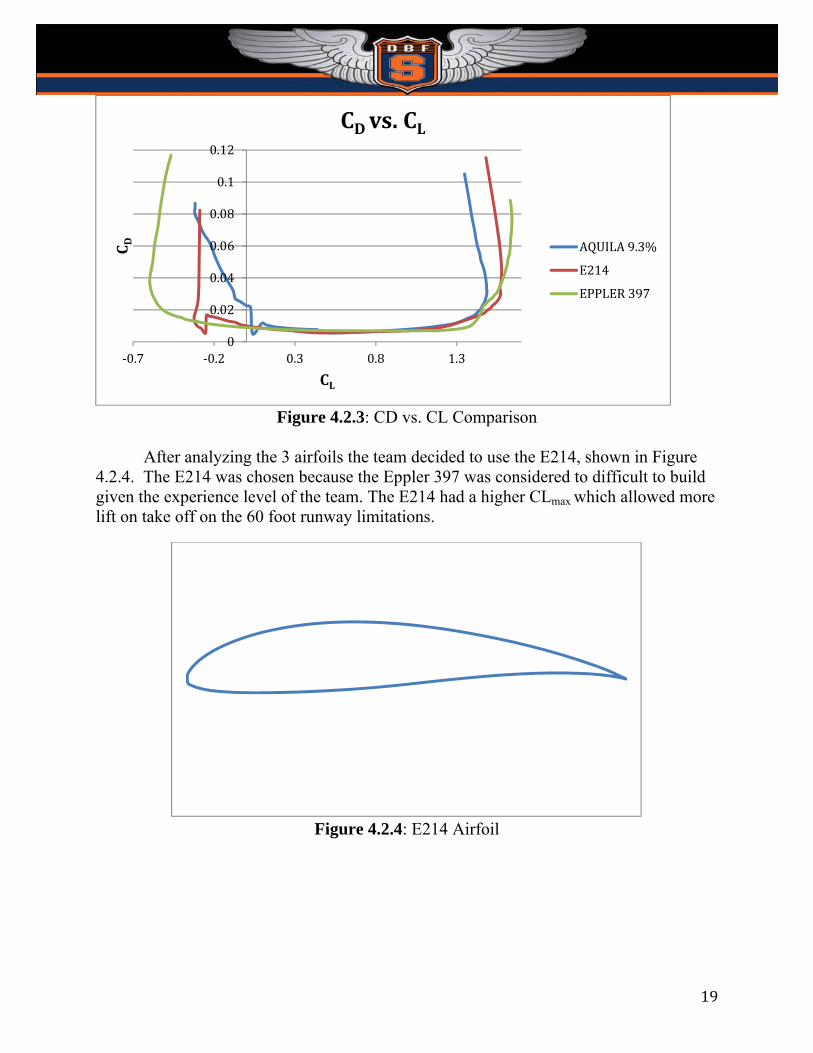
Figure 4.2.3: CD vs. CL Comparison
After analyzing the 3 airfoils the team decided to use the E214, shown in Figure
4.2.4. The E214 was chosen because the Eppler 397 was considered to difficult to build given the experience level of the team. The E214 had a higher CLmax which allowed more lift on take off on the 60 foot runway limitations.
Figure 4.2.4: E214 Airfoil
0
0.02
0.04
0.06
0.08
0.1
0.12
‐0.7 ‐0.2 0.3 0.8 1.3
C D
CL
CDvs.CL
AQUILA9.3%
E214
EPPLER397
20
4.3.4 Propulsion The initial propulsion system was designed using the competition parameters of 60
foot takeoff distance and a 2 lb battery. A spare electronics package was used for placeholder values while the aircraft was conceptualized. Once the drag was computed, the thrust required to sustain S.L.U.F. was used to compute the power required. This power was used to size the motor. Due to the weight requirements of Mission 2, it was found that 1.89 lb of thrust was needed at a minimum in order to lift off. This, however, violated the wing sizing constraint, so the actual minimum was 3.1 lb. Based off the statistics and thrust rating provided by hobbyking.com the motor and propeller combination chosen provided almost double the amount of thrust required. This ensured a much higher top speed in order to maximize the score. The ESC and batteries were chosen based off the 36A draw to achieve maximal safe output from the motor. Additionally, the battery chosen provided sufficient current and storage such that it would sustain the motor at maximum velocity for the entire 4min duration of the first mission.
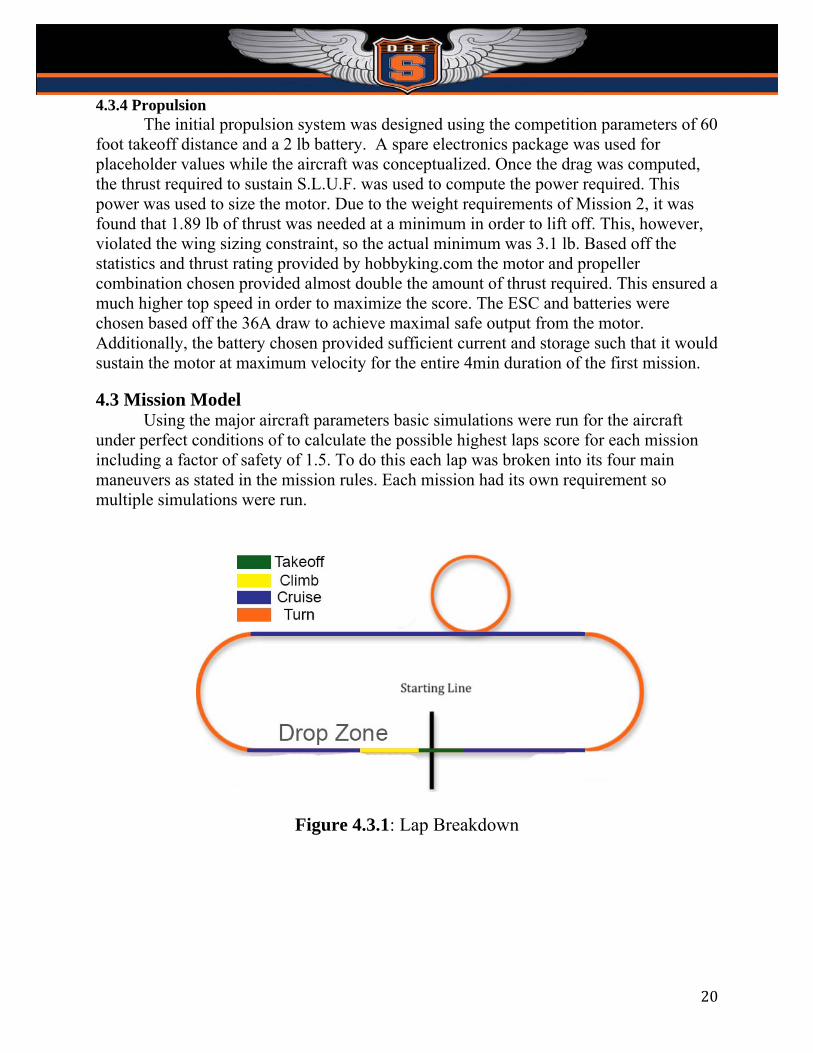
4.3 Mission Model Using the major aircraft parameters basic simulations were run for the aircraft
under perfect conditions of to calculate the possible highest laps score for each mission including a factor of safety of 1.5. To do this each lap was broken into its four main maneuvers as stated in the mission rules. Each mission had its own requirement so multiple simulations were run.
Figure 4.3.1: Lap Breakdown
21
Takeoff: This operation is done at the max throttle with flapperons deployed to increase CLmax.
Climb: The aircraft had a different climb rate for each mission ranging from 17.6 ft/s in mission 2 to 30 ft/s in mission 1. The rate of climb was calculated by taking the power available and subtracting it from the power required at takeoff divided by the wait of the aircraft.
Cruise: For this portion of the flight the plane was assumed to be flying at steady level unaccelrated flight where thrust is equal to drag so that the aircraft does not surpass it battery capacity.
Turn: The turn was assumed to be at constant velocity for both the two 180 degree turns and the 360 degree turning maneuver. Load factor was calculated during optimization and applied to the wing structure.
The simulation, however, was done under perfect conditions meaning that no cross winds were taken into account.
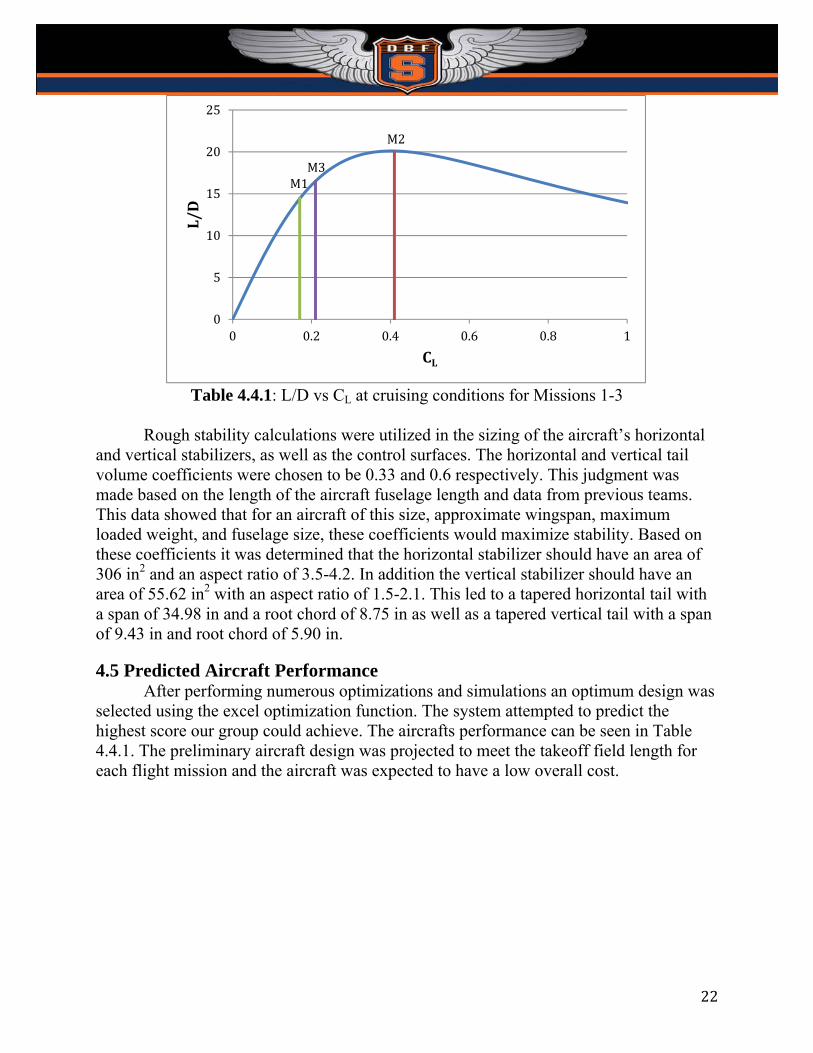
4.4 Aerodynamic Characteristics and Stability Analysis The potential drag on the aircraft was calculated using a range of CL. The
coefficient of drag at zero lift was estimated based off of previous competition planes designed to a similar size and mission. Table 4.4.1 below shows L/D as it relates to changing CL as well as the cruising L/D for all three missions. The CL for turning for a given mission was found to be about 0.15 higher than the corresponding cruising for CL. While Missions 1 and 3 cruise below L/D max, Mission 2 operates almost exactly at that condition. This was done intentionally to maximize the performance of the aircraft while carrying the 5lb payload. In addition, the turning L/D values for Missions 1 and 3 were close to L/D max, approximately 18 and 19 respectively. During Missions 1 and 3 more than half the distance flown is turning flight. Therefore, the majority of the time the aircraft is flying, it will operate near L/D max. The drag was estimated using a CD0 of 0.022 based on component selection, sizing, and a monokote surface.
22
Table 4.4.1: L/D vs CL at cruising conditions for Missions 1-3
Rough stability calculations were utilized in the sizing of the aircraft’s horizontal
and vertical stabilizers, as well as the control surfaces. The horizontal and vertical tail volume coefficients were chosen to be 0.33 and 0.6 respectively. This judgment was made based on the length of the aircraft fuselage length and data from previous teams. This data showed that for an aircraft of this size, approximate wingspan, maximum loaded weight, and fuselage size, these coefficients would maximize stability. Based on these coefficients it was determined that the horizontal stabilizer should have an area of 306 in2 and an aspect ratio of 3.5-4.2. In addition the vertical stabilizer should have an area of 55.62 in2 with an aspect ratio of 1.5-2.1. This led to a tapered horizontal tail with a span of 34.98 in and a root chord of 8.75 in as well as a tapered vertical tail with a span of 9.43 in and root chord of 5.90 in.
4.5 Predicted Aircraft Performance After performing numerous optimizations and simulations an optimum design was
selected using the excel optimization function. The system attempted to predict the highest score our group could achieve. The aircrafts performance can be seen in Table 4.4.1. The preliminary aircraft design was projected to meet the takeoff field length for each flight mission and the aircraft was expected to have a low overall cost.
M1M3
M2
0
5
10
15
20
25
0 0.2 0.4 0.6 0.8 1
L/D
CL

23
Table 4.4.1: Aircraft Predicted Performance
5.0 Detail Design Detail design uses the optimized sizing while taking in real world design
constraints. Each section of the aircraft was meticulously reviewed to make certain that each characteristic of the final aircraft was as optimal as possible.
5.1 Dimension and Parameter Tables � Table 5.1.1 catalogs the characteristic parameters for Syracuse Universities DBF aircraft for this year competition.
Table 5.5.1: Aircraft Predicted Performance
24
5.2 Structural Characteristic Since the scoring was sensitive to the weight of the aircraft the design team
focused on minimizing the weight of the aircraft while maintaining the structural rigidity needed to withstand the forces experienced during flight, most notably the high load factor experienced during turning and the impact from landing. 5.2.1 Wing
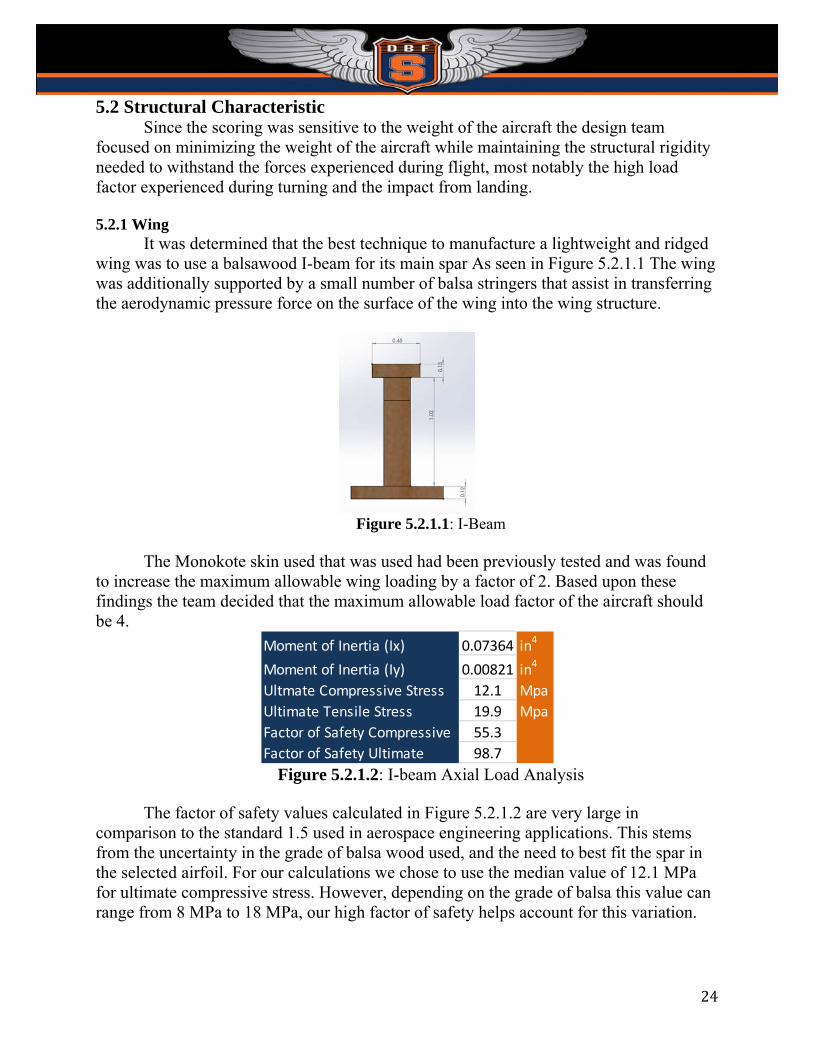
It was determined that the best technique to manufacture a lightweight and ridged wing was to use a balsawood I-beam for its main spar As seen in Figure 5.2.1.1 The wing was additionally supported by a small number of balsa stringers that assist in transferring the aerodynamic pressure force on the surface of the wing into the wing structure.
Figure 5.2.1.1: I-Beam
The Monokote skin used that was used had been previously tested and was found
to increase the maximum allowable wing loading by a factor of 2. Based upon these findings the team decided that the maximum allowable load factor of the aircraft should be 4.
Figure 5.2.1.2: I-beam Axial Load Analysis
The factor of safety values calculated in Figure 5.2.1.2 are very large in
comparison to the standard 1.5 used in aerospace engineering applications. This stems from the uncertainty in the grade of balsa wood used, and the need to best fit the spar in the selected airfoil. For our calculations we chose to use the median value of 12.1 MPa for ultimate compressive stress. However, depending on the grade of balsa this value can range from 8 MPa to 18 MPa, our high factor of safety helps account for this variation.
Moment of Inertia (Ix) 0.07364 in4
Moment of Inertia (Iy) 0.00821 in4
Ultmate Compressive Stress 12.1 Mpa
Ultimate Tensile Stress 19.9 Mpa
Factor of Safety Compressive 55.3
Factor of Safety Ultimate 98.7
25
5.2.2 Fuselage Reducing the aircraft’s weight was the most important factor in building the fuselage. We recognized that there were two different building methods that we could use for constructing this aircraft. The first method the team thought to use was using a stick styled fuselage because it would allow for the simplest construction method. The fuselage would be constructing around a keel, which would run the length of the fuselage and empennage. For this design the ribs of the aircraft would slide onto the keel to make the external surface of the fuselage while also providing the interior payload bay. This design, however, was scrapped when the CAD model showed that it would in fact be one of the heaviest and least rigid techniques because all of its torque would be around the keel permitting it to bend and flex. The other method, which was used was the layering of bulk heads that were connected by different sized stringers to give it structural support and to help stiffen the aircraft while providing a more aerodynamic shape. Weight was also reduced from the fuselage by creating a wing saddle. This saddle was a hole cut into the top of the fuselage allowing the wing to rest with in it. The wing saddle also allowed the wing to the mate flush with the fuselage structure and permitting the wing to transfer the load directly into the fuselage by passing through bolts and other mounting hardware. 5.3 Sub-System Design This section of the report will focus on the design of the aircraft’s subsystems and how each subsystem is integrated with each other. The components that will be discussed are the wing, fuselage, empennage, payload bay, drop system, landing gear and electronics. 5.3.1 Wing
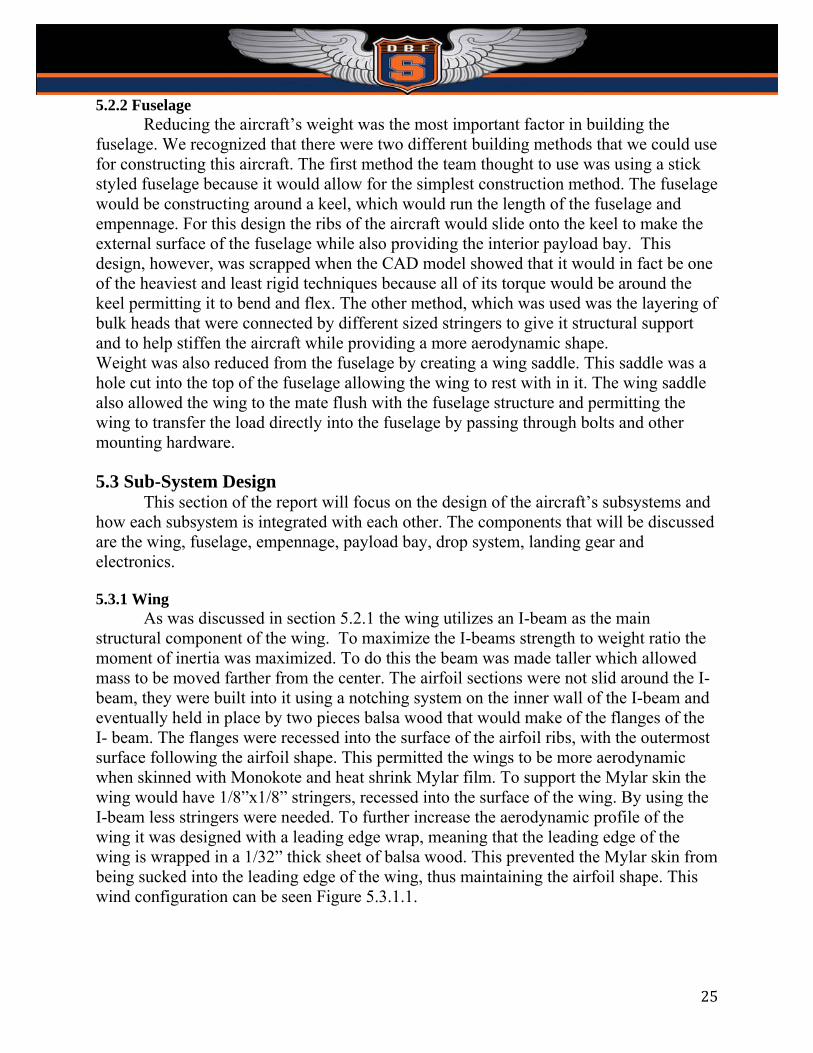
As was discussed in section 5.2.1 the wing utilizes an I-beam as the main structural component of the wing. To maximize the I-beams strength to weight ratio the moment of inertia was maximized. To do this the beam was made taller which allowed mass to be moved farther from the center. The airfoil sections were not slid around the I-beam, they were built into it using a notching system on the inner wall of the I-beam and eventually held in place by two pieces balsa wood that would make of the flanges of the I- beam. The flanges were recessed into the surface of the airfoil ribs, with the outermost surface following the airfoil shape. This permitted the wings to be more aerodynamic when skinned with Monokote and heat shrink Mylar film. To support the Mylar skin the wing would have 1/8”x1/8” stringers, recessed into the surface of the wing. By using the I-beam less stringers were needed. To further increase the aerodynamic profile of the wing it was designed with a leading edge wrap, meaning that the leading edge of the wing is wrapped in a 1/32” thick sheet of balsa wood. This prevented the Mylar skin from being sucked into the leading edge of the wing, thus maintaining the airfoil shape. This wind configuration can be seen Figure 5.3.1.1.
26
Figure 5.3.1.1: Wing structure
The team elected to use a rectangular no taper wing because it would simplify the
construction and design time. Even though the wing would be rectangular, rounded wing tips were added to protect the wing in-case of accidently ground strike. The wing tips were not added for aerodynamic considerations. Using past structural testing it was known that the 1/16” balsawood was the lightest airfoil rib that would support the required loading. Although 1/16” balsa was strong enough for flight considerations, that balsa had a tendency to snap during assembly of the aircraft, and transportation. Because of this all airfoil ribs that interacted with external forces other than aerodynamic loading would be made out of 1/8” balsawood. 5.3.2 Fuselage
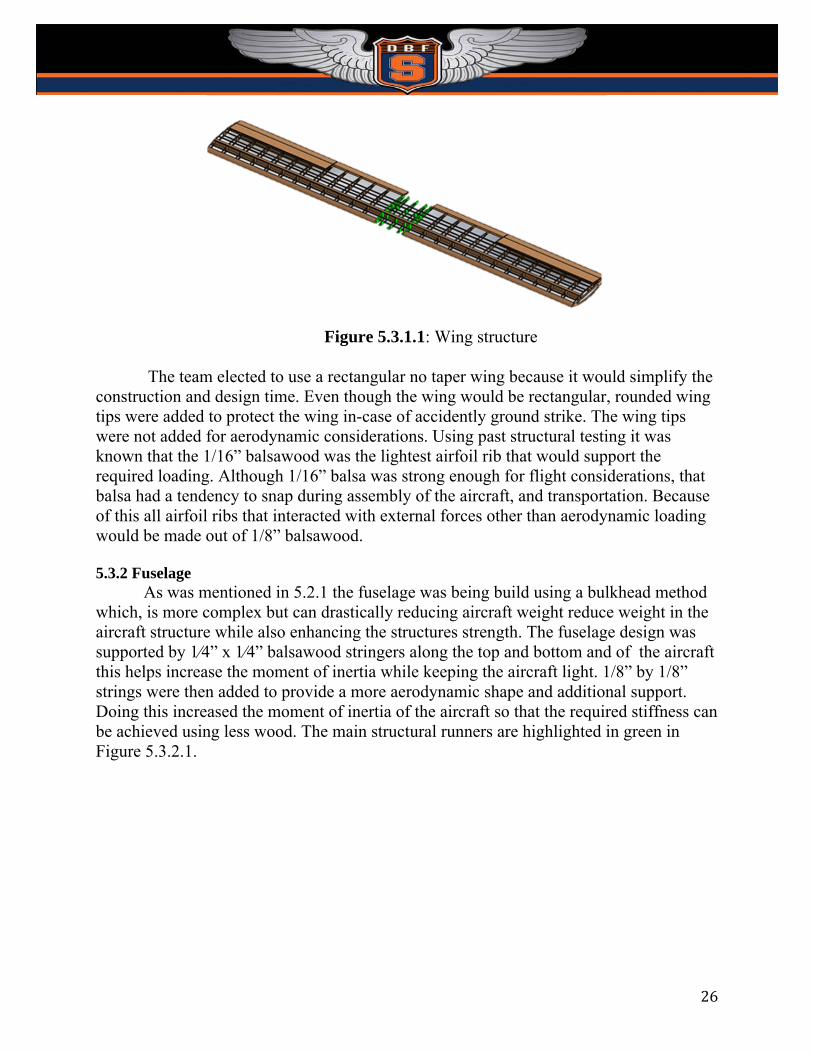
As was mentioned in 5.2.1 the fuselage was being build using a bulkhead method which, is more complex but can drastically reducing aircraft weight reduce weight in the aircraft structure while also enhancing the structures strength. The fuselage design was supported by 1⁄4” x 1⁄4” balsawood stringers along the top and bottom and of the aircraft this helps increase the moment of inertia while keeping the aircraft light. 1/8” by 1/8” strings were then added to provide a more aerodynamic shape and additional support. Doing this increased the moment of inertia of the aircraft so that the required stiffness can be achieved using less wood. The main structural runners are highlighted in green in Figure 5.3.2.1.
27
Figure 5.3.2.1: Main Structural Runners
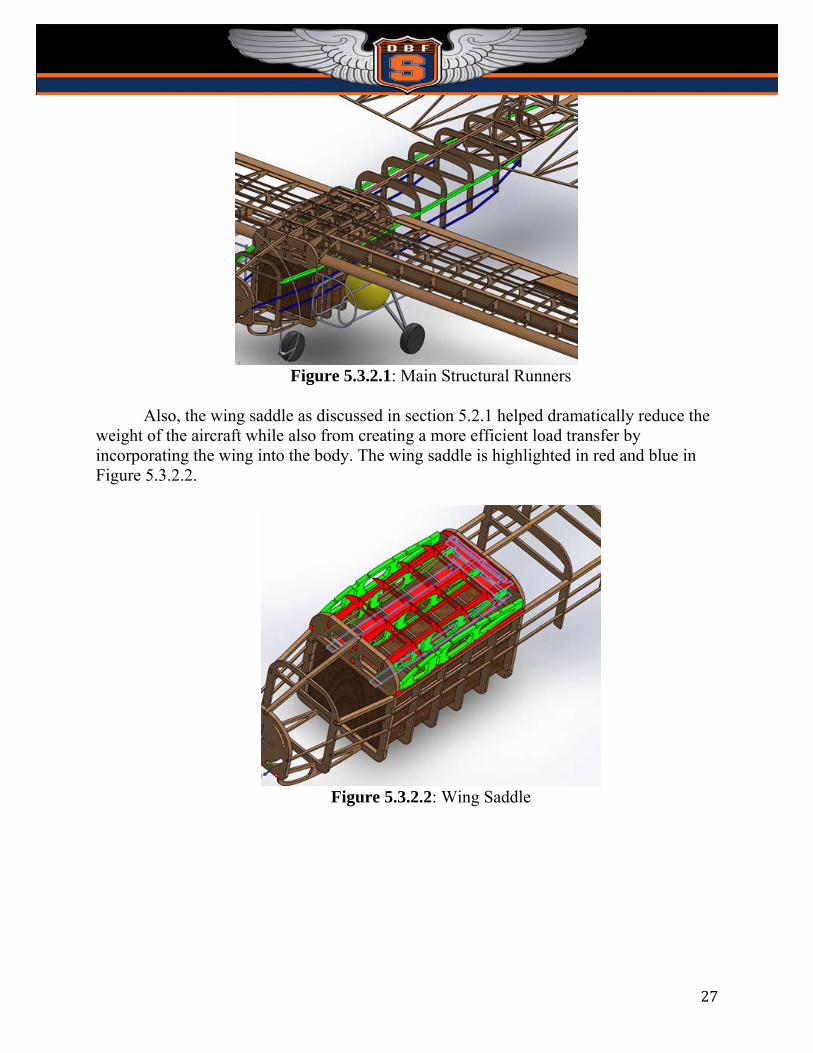
Also, the wing saddle as discussed in section 5.2.1 helped dramatically reduce the
weight of the aircraft while also from creating a more efficient load transfer by incorporating the wing into the body. The wing saddle is highlighted in red and blue in Figure 5.3.2.2.
Figure 5.3.2.2: Wing Saddle
28
5.3.3 Empennage
The empennage was designed to be light and rigid. This was done by using flat plate theory. The horizontal stabilizer sandwiches in-between two balsawood formers at the end of the fuselage. The vertical stabilizer was attached by sliding it into two 1/4”x1/4” slots that run through the horizontal stabilizer’s mounting. Because of the size of the wing that was necessary to generate enough lift at take off, the tail sizing was large. The tail can be seen in Figure 5.3.3.1
Figure 5.3.3.1: Empennage Structure
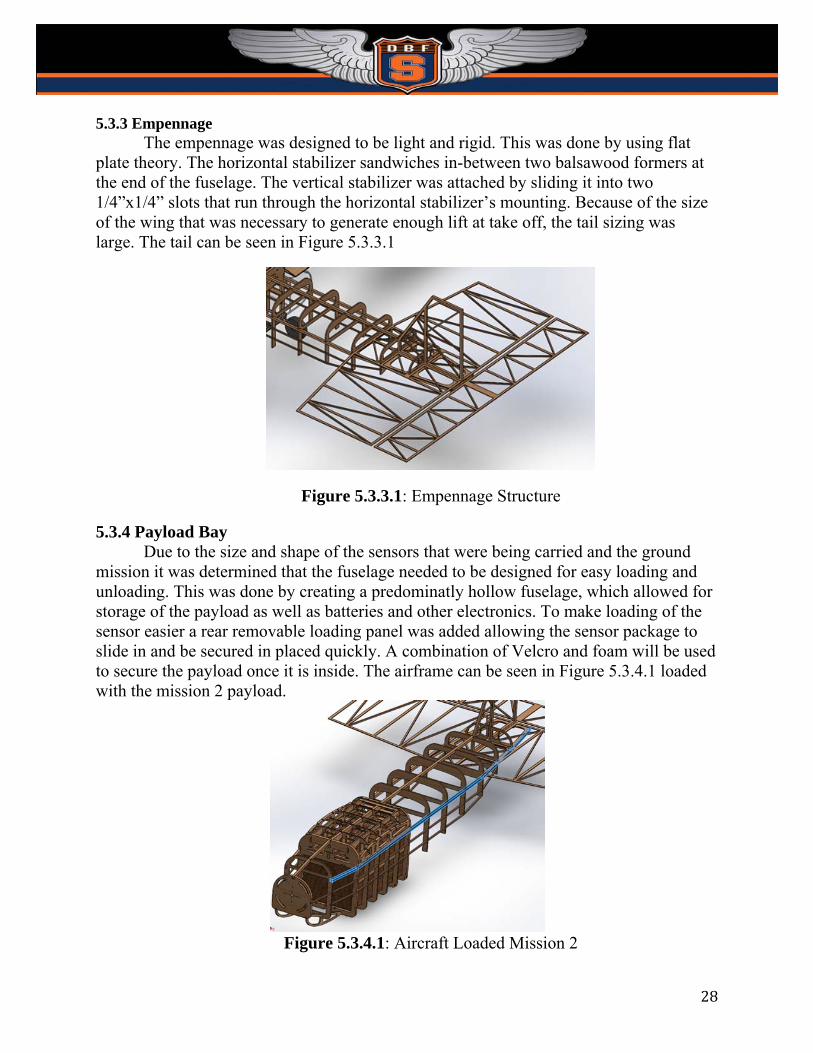
5.3.4 Payload Bay Due to the size and shape of the sensors that were being carried and the ground
mission it was determined that the fuselage needed to be designed for easy loading and unloading. This was done by creating a predominatly hollow fuselage, which allowed for storage of the payload as well as batteries and other electronics. To make loading of the sensor easier a rear removable loading panel was added allowing the sensor package to slide in and be secured in placed quickly. A combination of Velcro and foam will be used to secure the payload once it is inside. The airframe can be seen in Figure 5.3.4.1 loaded with the mission 2 payload.
Figure 5.3.4.1: Aircraft Loaded Mission 2
29
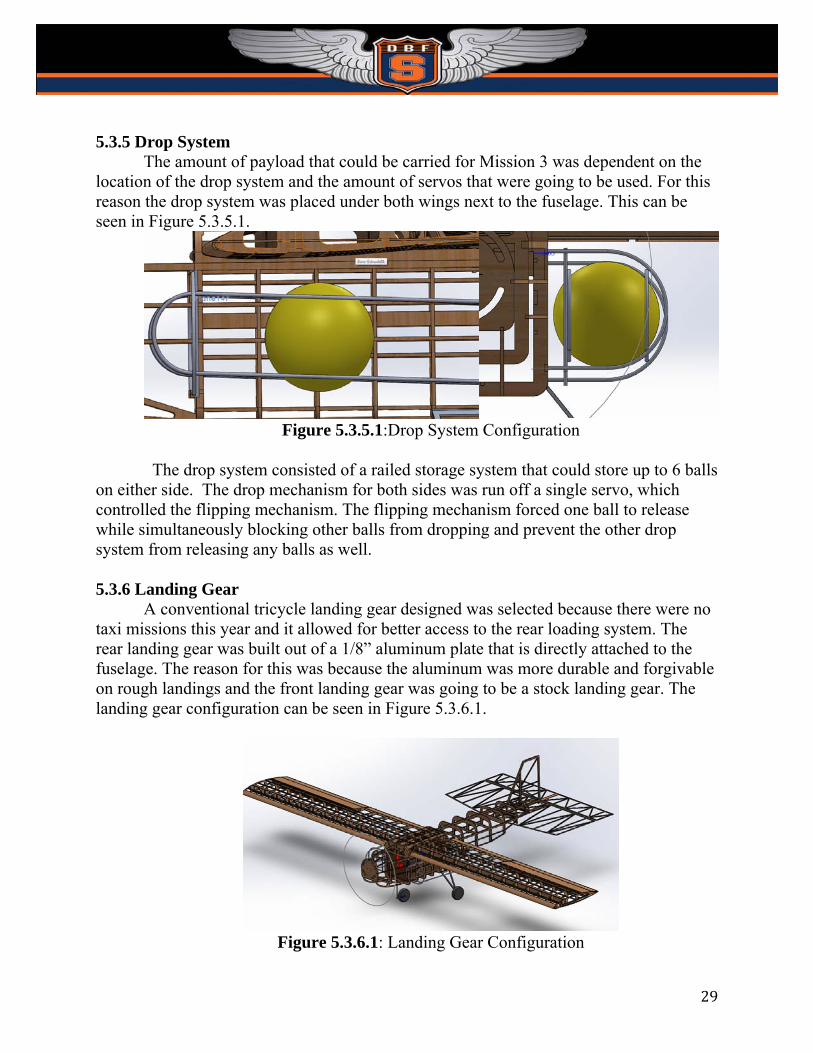
5.3.5 Drop System The amount of payload that could be carried for Mission 3 was dependent on the
location of the drop system and the amount of servos that were going to be used. For this reason the drop system was placed under both wings next to the fuselage. This can be seen in Figure 5.3.5.1.
Figure 5.3.5.1:Drop System Configuration
The drop system consisted of a railed storage system that could store up to 6 balls
on either side. The drop mechanism for both sides was run off a single servo, which controlled the flipping mechanism. The flipping mechanism forced one ball to release while simultaneously blocking other balls from dropping and prevent the other drop system from releasing any balls as well. 5.3.6 Landing Gear
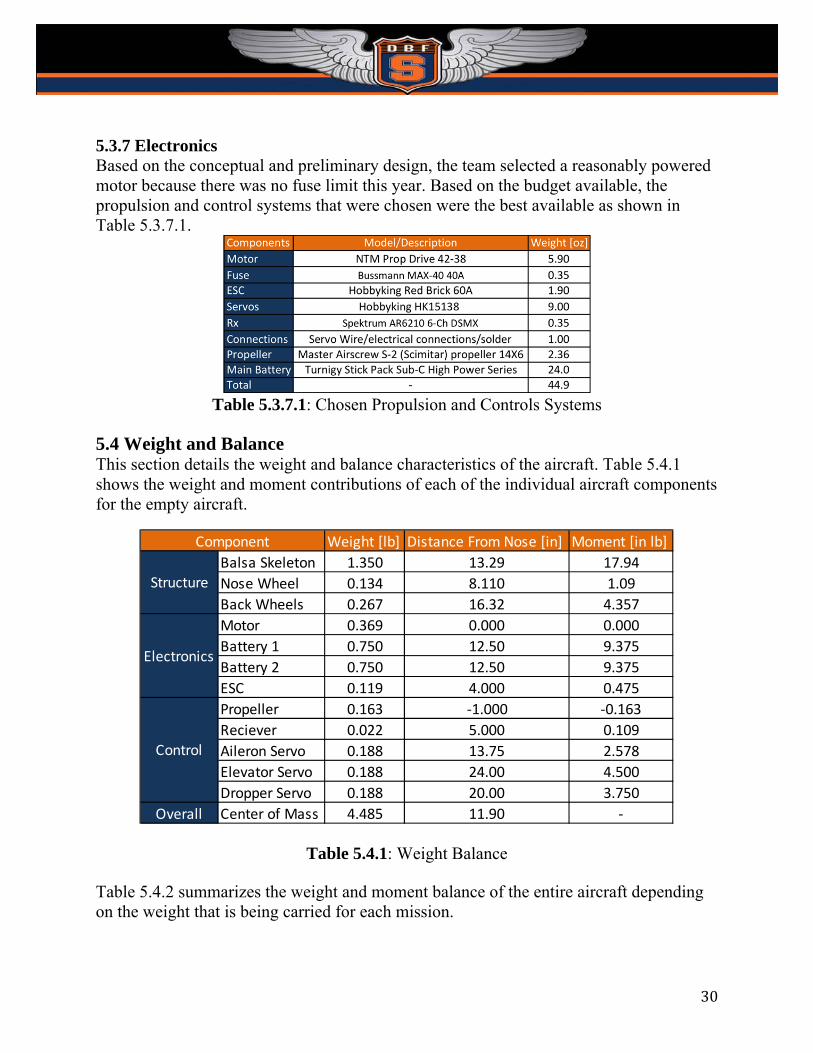
A conventional tricycle landing gear designed was selected because there were no taxi missions this year and it allowed for better access to the rear loading system. The rear landing gear was built out of a 1/8” aluminum plate that is directly attached to the fuselage. The reason for this was because the aluminum was more durable and forgivable on rough landings and the front landing gear was going to be a stock landing gear. The landing gear configuration can be seen in Figure 5.3.6.1.
Figure 5.3.6.1: Landing Gear Configuration
30
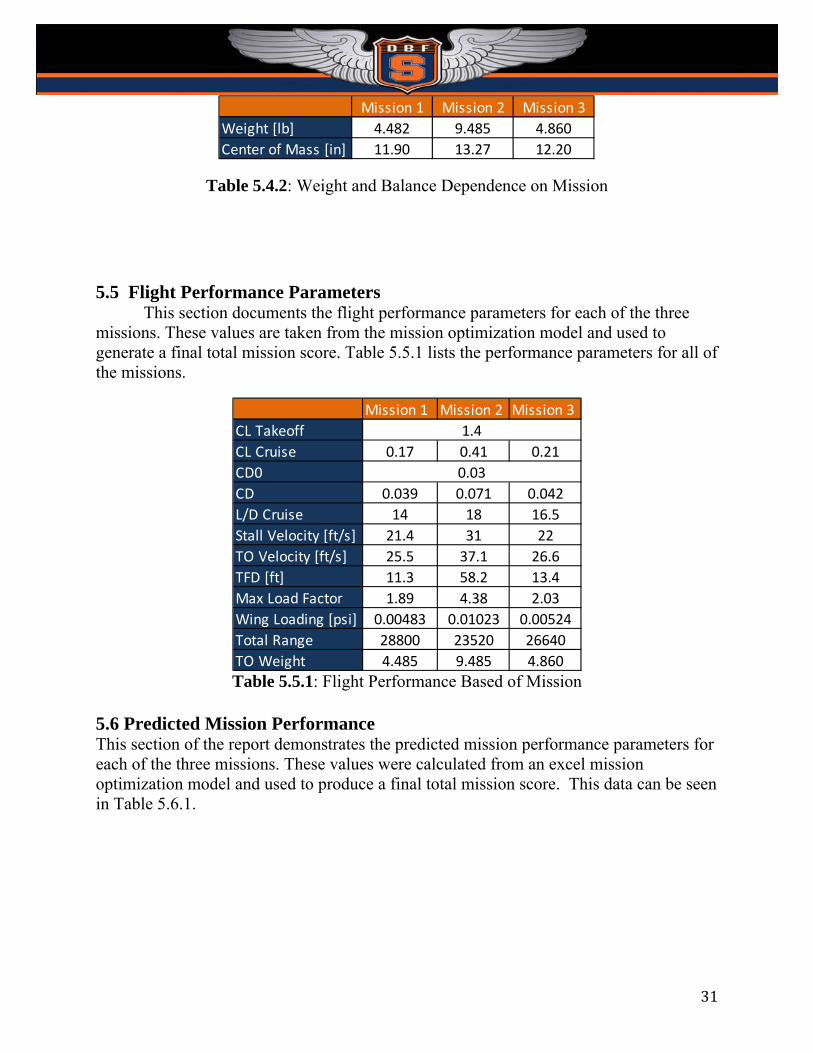
5.3.7 Electronics Based on the conceptual and preliminary design, the team selected a reasonably powered motor because there was no fuse limit this year. Based on the budget available, the propulsion and control systems that were chosen were the best available as shown in Table 5.3.7.1.
Table 5.3.7.1: Chosen Propulsion and Controls Systems
5.4 Weight and Balance This section details the weight and balance characteristics of the aircraft. Table 5.4.1 shows the weight and moment contributions of each of the individual aircraft components for the empty aircraft.
Table 5.4.1: Weight Balance Table 5.4.2 summarizes the weight and moment balance of the entire aircraft depending on the weight that is being carried for each mission.
Weight [lb] Distance From Nose [in] Moment [in lb]
Balsa Skeleton 1.350 13.29 17.94
Nose Wheel 0.134 8.110 1.09
Back Wheels 0.267 16.32 4.357
Motor 0.369 0.000 0.000
Battery 1 0.750 12.50 9.375
Battery 2 0.750 12.50 9.375
ESC 0.119 4.000 0.475
Propeller 0.163 ‐1.000 ‐0.163
Reciever 0.022 5.000 0.109
Aileron Servo 0.188 13.75 2.578
Elevator Servo 0.188 24.00 4.500
Dropper Servo 0.188 20.00 3.750
Overall Center of Mass 4.485 11.90 ‐
Structure
Component
Electronics
Control
31
Table 5.4.2: Weight and Balance Dependence on Mission 5.5 Flight Performance Parameters
This section documents the flight performance parameters for each of the three missions. These values are taken from the mission optimization model and used to generate a final total mission score. Table 5.5.1 lists the performance parameters for all of the missions.
Table 5.5.1: Flight Performance Based of Mission
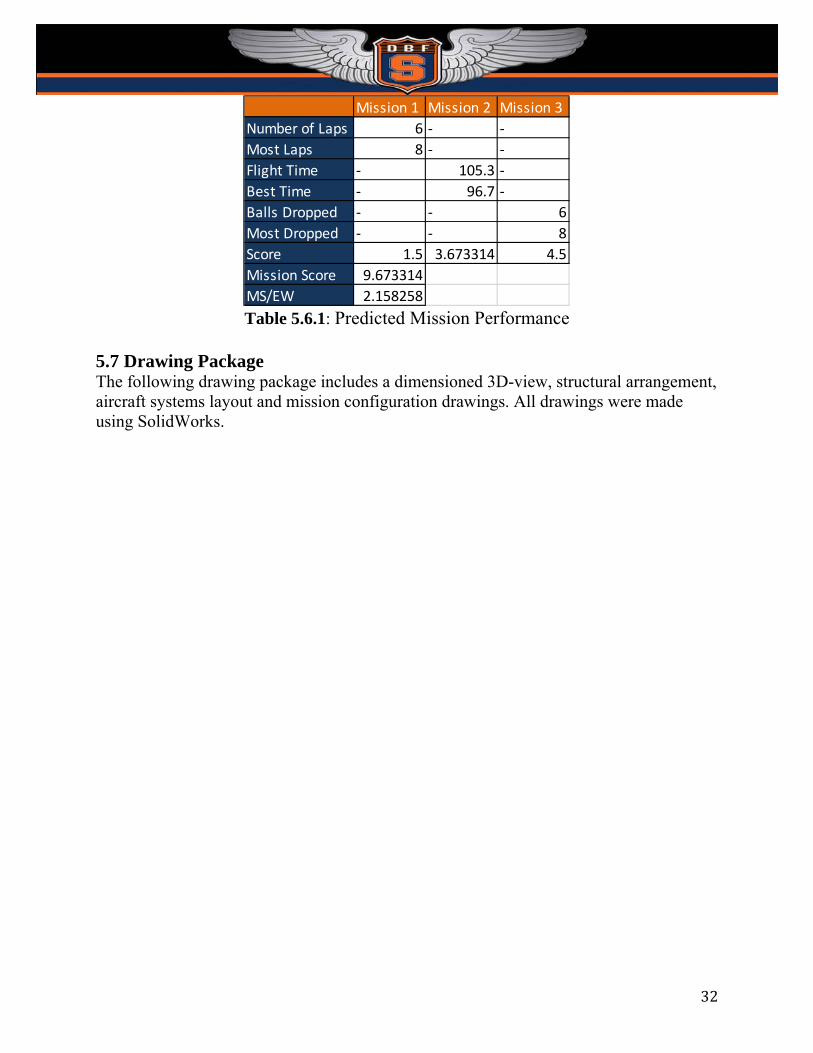
5.6 Predicted Mission Performance This section of the report demonstrates the predicted mission performance parameters for each of the three missions. These values were calculated from an excel mission optimization model and used to produce a final total mission score. This data can be seen in Table 5.6.1.
Mission 1 Mission 2 Mission 3
Weight [lb] 4.482 9.485 4.860
Center of Mass [in] 11.90 13.27 12.20
Mission 1 Mission 2 Mission 3
CL Takeoff
CL Cruise 0.17 0.41 0.21
CD0
CD 0.039 0.071 0.042
L/D Cruise 14 18 16.5
Stall Velocity [ft/s] 21.4 31 22
TO Velocity [ft/s] 25.5 37.1 26.6
TFD [ft] 11.3 58.2 13.4
Max Load Factor 1.89 4.38 2.03
Wing Loading [psi] 0.00483 0.01023 0.00524
Total Range 28800 23520 26640
TO Weight 4.485 9.485 4.860
1.4
0.03
32
Table 5.6.1: Predicted Mission Performance
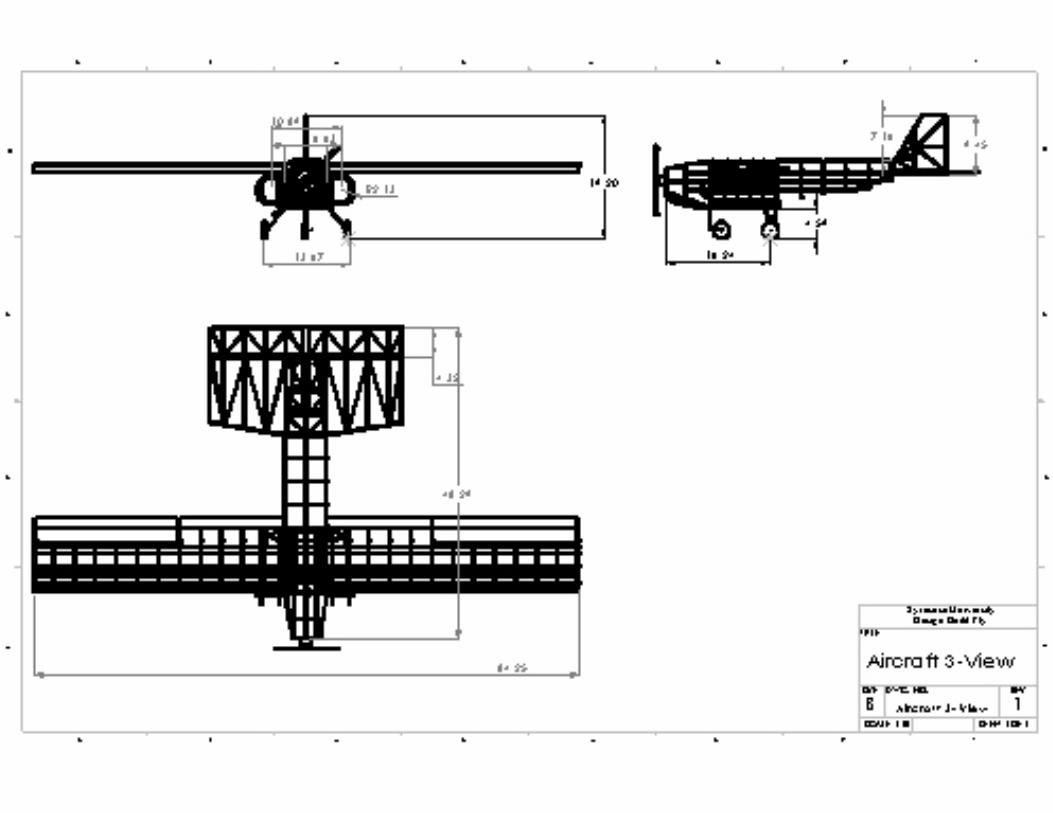
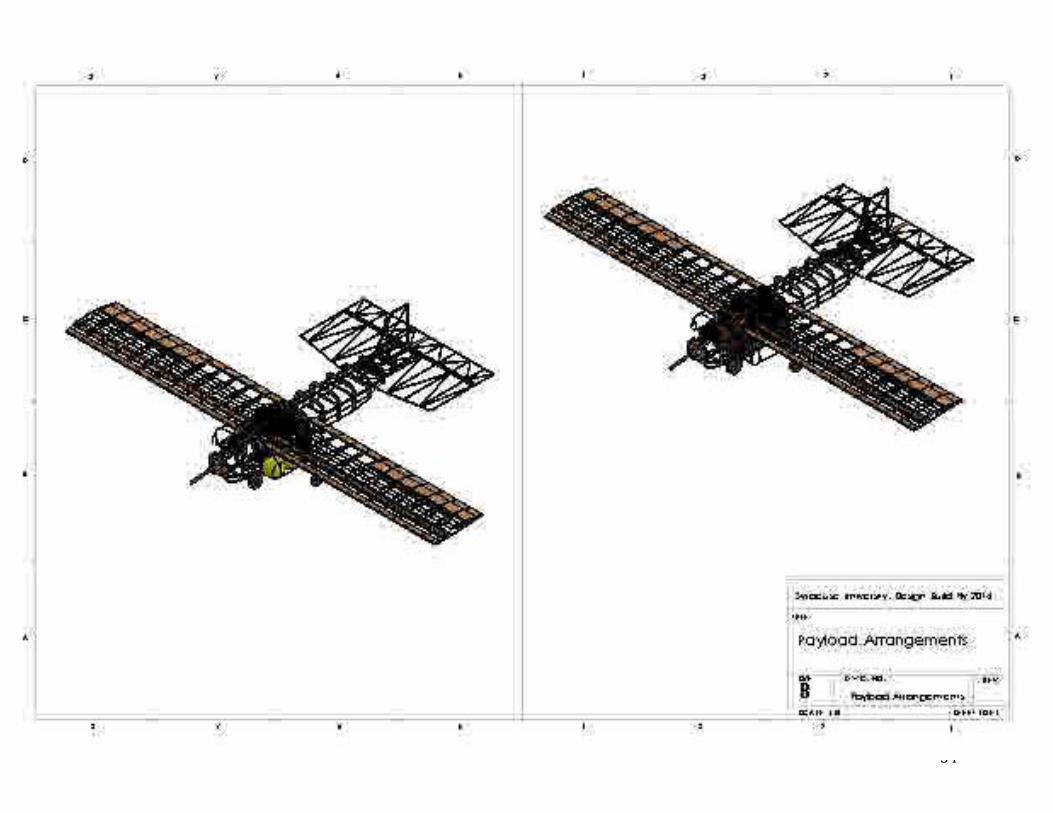
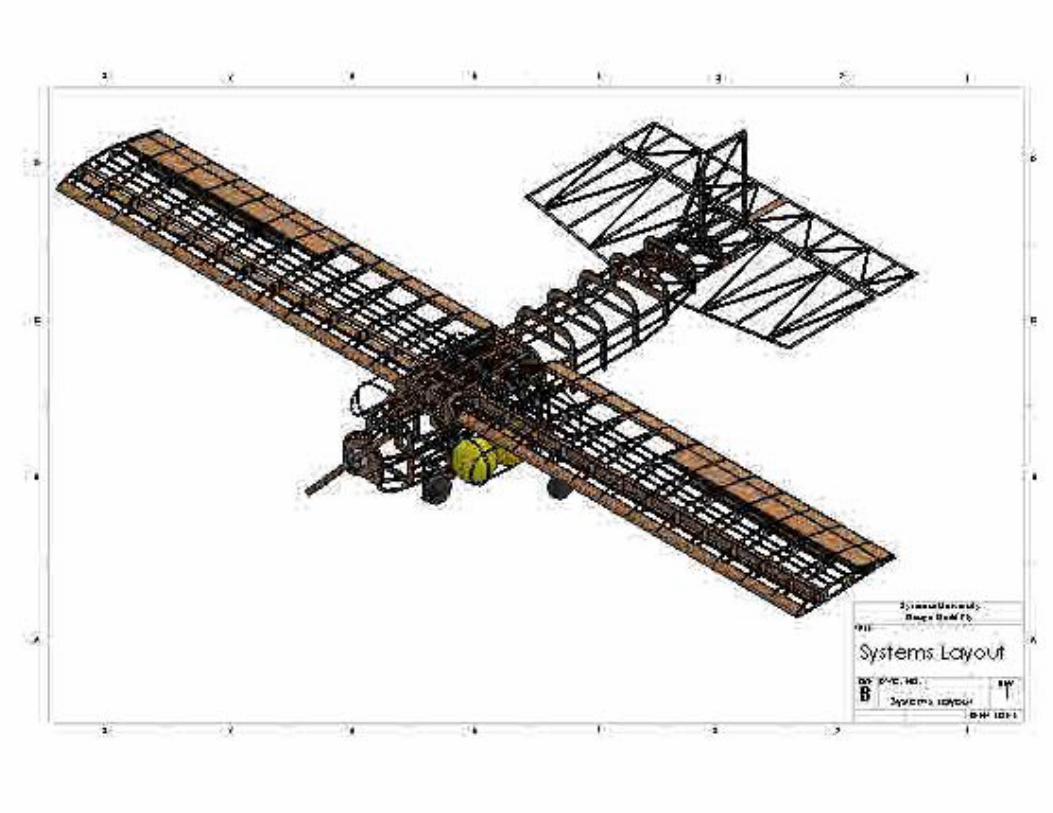
5.7 Drawing Package The following drawing package includes a dimensioned 3D-view, structural arrangement, aircraft systems layout and mission configuration drawings. All drawings were made using SolidWorks.
Mission 1 Mission 2 Mission 3
Number of Laps 6 ‐ ‐
Most Laps 8 ‐ ‐
Flight Time ‐ 105.3 ‐
Best Time ‐ 96.7 ‐
Balls Dropped ‐ ‐ 6
Most Dropped ‐ ‐ 8
Score 1.5 3.673314 4.5
Mission Score 9.673314
MS/EW 2.158258
33
34
35
36
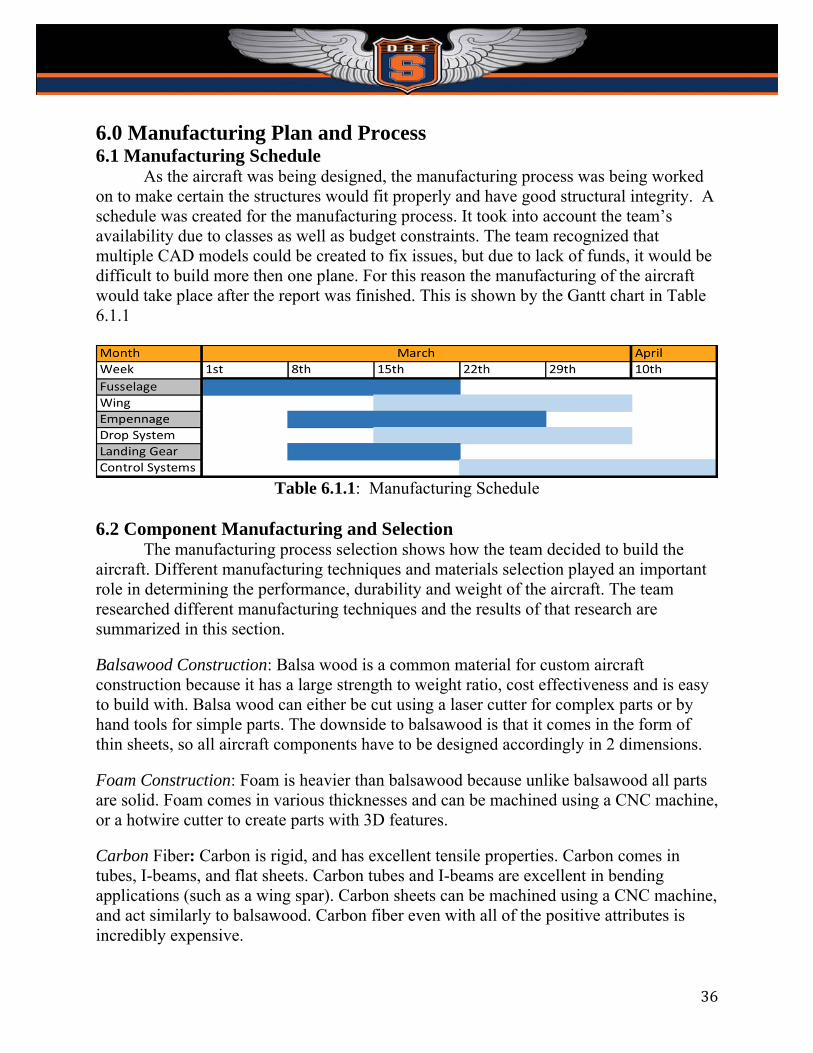
6.0 Manufacturing Plan and Process 6.1 Manufacturing Schedule
As the aircraft was being designed, the manufacturing process was being worked on to make certain the structures would fit properly and have good structural integrity. A schedule was created for the manufacturing process. It took into account the team’s availability due to classes as well as budget constraints. The team recognized that multiple CAD models could be created to fix issues, but due to lack of funds, it would be difficult to build more then one plane. For this reason the manufacturing of the aircraft would take place after the report was finished. This is shown by the Gantt chart in Table 6.1.1
Table 6.1.1: Manufacturing Schedule
6.2 Component Manufacturing and Selection
The manufacturing process selection shows how the team decided to build the aircraft. Different manufacturing techniques and materials selection played an important role in determining the performance, durability and weight of the aircraft. The team researched different manufacturing techniques and the results of that research are summarized in this section.
Balsawood Construction: Balsa wood is a common material for custom aircraft construction because it has a large strength to weight ratio, cost effectiveness and is easy to build with. Balsa wood can either be cut using a laser cutter for complex parts or by hand tools for simple parts. The downside to balsawood is that it comes in the form of thin sheets, so all aircraft components have to be designed accordingly in 2 dimensions.
Foam Construction: Foam is heavier than balsawood because unlike balsawood all parts are solid. Foam comes in various thicknesses and can be machined using a CNC machine, or a hotwire cutter to create parts with 3D features.
Carbon Fiber: Carbon is rigid, and has excellent tensile properties. Carbon comes in tubes, I-beams, and flat sheets. Carbon tubes and I-beams are excellent in bending applications (such as a wing spar). Carbon sheets can be machined using a CNC machine, and act similarly to balsawood. Carbon fiber even with all of the positive attributes is incredibly expensive.
37
3D Printed Plastic: 3D printed components are far heavier than the previously mentioned materials, but allow for extremely easy manufacturing of complex components with 3D features. The team had access to multiple Makerbot replicator 2 3D printers. Each printer prints different materials; the first prints ABS plastic and the second prints PLA plastic. ABS plastic parts print slower than a PLA parts and the printing process is less robust.
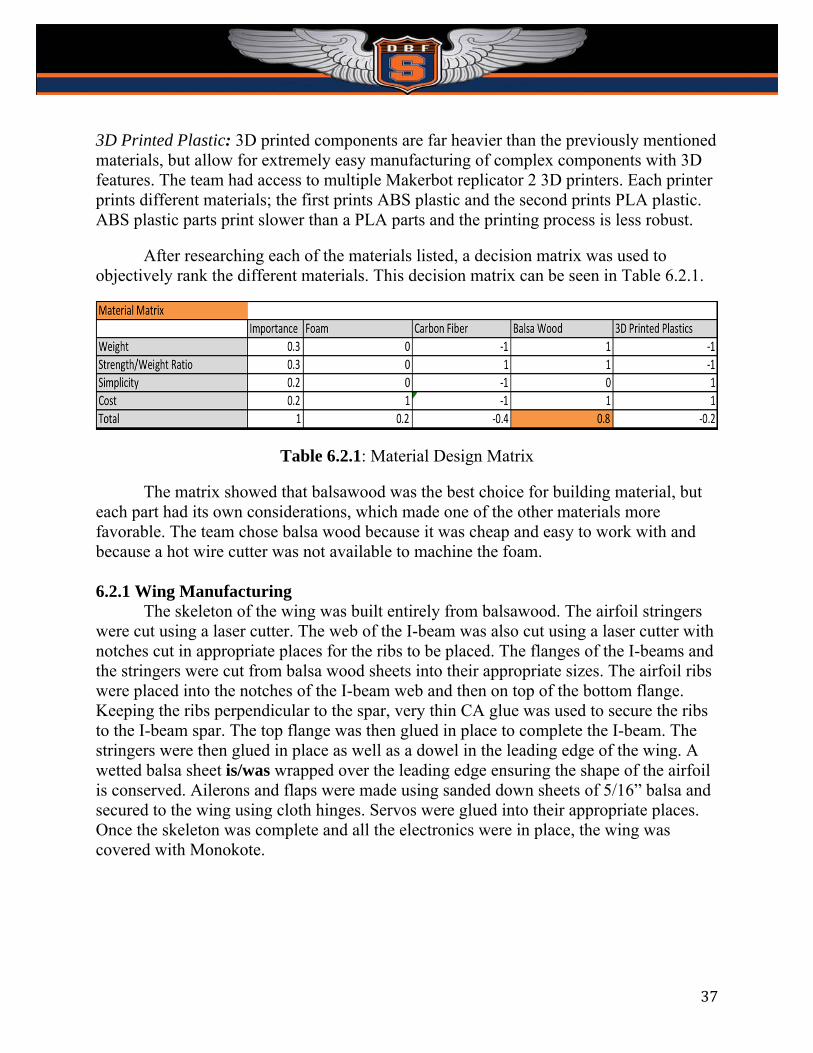
After researching each of the materials listed, a decision matrix was used to objectively rank the different materials. This decision matrix can be seen in Table 6.2.1.
Table 6.2.1: Material Design Matrix
The matrix showed that balsawood was the best choice for building material, but each part had its own considerations, which made one of the other materials more favorable. The team chose balsa wood because it was cheap and easy to work with and because a hot wire cutter was not available to machine the foam.
6.2.1 Wing Manufacturing
The skeleton of the wing was built entirely from balsawood. The airfoil stringers were cut using a laser cutter. The web of the I-beam was also cut using a laser cutter with notches cut in appropriate places for the ribs to be placed. The flanges of the I-beams and the stringers were cut from balsa wood sheets into their appropriate sizes. The airfoil ribs were placed into the notches of the I-beam web and then on top of the bottom flange. Keeping the ribs perpendicular to the spar, very thin CA glue was used to secure the ribs to the I-beam spar. The top flange was then glued in place to complete the I-beam. The stringers were then glued in place as well as a dowel in the leading edge of the wing. A wetted balsa sheet is/was wrapped over the leading edge ensuring the shape of the airfoil is conserved. Ailerons and flaps were made using sanded down sheets of 5/16” balsa and secured to the wing using cloth hinges. Servos were glued into their appropriate places. Once the skeleton was complete and all the electronics were in place, the wing was covered with Monokote.

38
6.2.2 Fuselage Manufacturing The fuselage was mostly comprised of balsa wood. Bulkheads were cut using a
laser cutter. Stringers were run in between the bulkheads to create the shape of the fuselage. The stringers then continued out the back of the fuselage and converged onto a point where the vertical and horizontal tail surfaces attached. Gusset plates were added in key structural areas. Two small running boards were glued in place to provide a bed for the stores to sit on and allowed sliding in and out with ease. A plywood piece was secured to the bottom of the fuselage where the landing gear was battached. Servos for tail control surfaces were glued into the tapered section of the fuselage. The fuselage skeleton piece was then coated in Monokote. 6.2.3 Empennage Manufacturing
The vertical and horizontal stabilizers as well as the rudder and elevator were made from balsa wood sheets laser cut into their appropriate shapes. This was done to ensure the structural integrity of each of the parts. This also cuts down on weight because no glue was used to construct the parts. Each part was covered in Monokote. Using CA glue the horizontal stabilizer was secured onto a flat piece of the end of the fuselage. The vertical stabilizer was slotted through the horizontal stabilizer and fuselage to help keep it perpendicular to the ground. The vertical stabilizer was also glued in place. The rudder and elevator are/were secured using cloth hinges.
7.0 Testing Tests are currently planned for when materials arrive. Due to budget constraints
they can only be performed for the final aircraft. Currently, the aircraft design relies on past experimental data and computer models. These past tests will be performed to confirm computer models and theoretical calculations. In addition to these test flights, tests will also be performed to demonstrate the aircraft’s performance and stability as well as provide the pilot with experience in the handling characteristics of the aircraft.
7.1 Wing Structural Testing
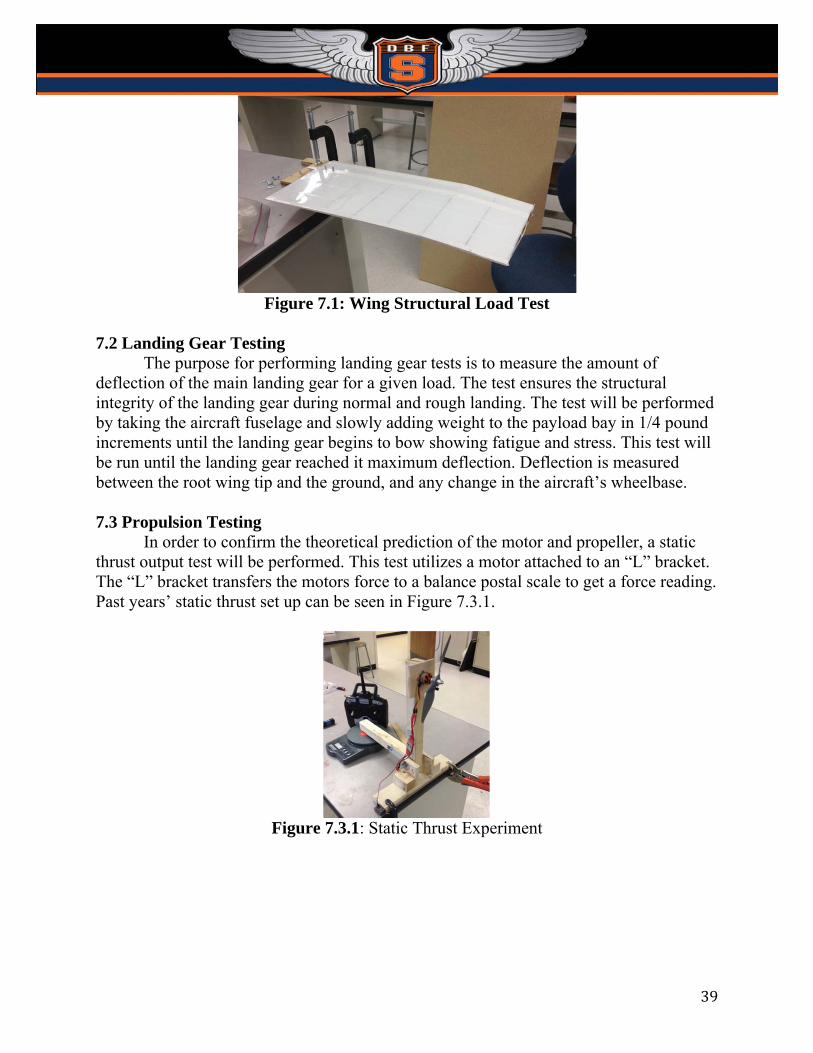
Wing structural testing consists of wing tip loading. The objective of this test is to find out how much loading the wing can take before failure. To perform this this experiment the aircraft is modeled as a cantilever beam extending from the fuselage. In the test the root of the wing is secured to a table and the wing tip extended off of the table. 1/4 pound weights are added incrementally at the wing tip and the deflection of the wing is measured. Weights are added until the wing shows the first sign of structural failure. Previous wing structure test can be seen in Figure 7.1.1
39
Figure 7.1: Wing Structural Load Test
7.2 Landing Gear Testing
The purpose for performing landing gear tests is to measure the amount of deflection of the main landing gear for a given load. The test ensures the structural integrity of the landing gear during normal and rough landing. The test will be performed by taking the aircraft fuselage and slowly adding weight to the payload bay in 1/4 pound increments until the landing gear begins to bow showing fatigue and stress. This test will be run until the landing gear reached it maximum deflection. Deflection is measured between the root wing tip and the ground, and any change in the aircraft’s wheelbase. 7.3 Propulsion Testing
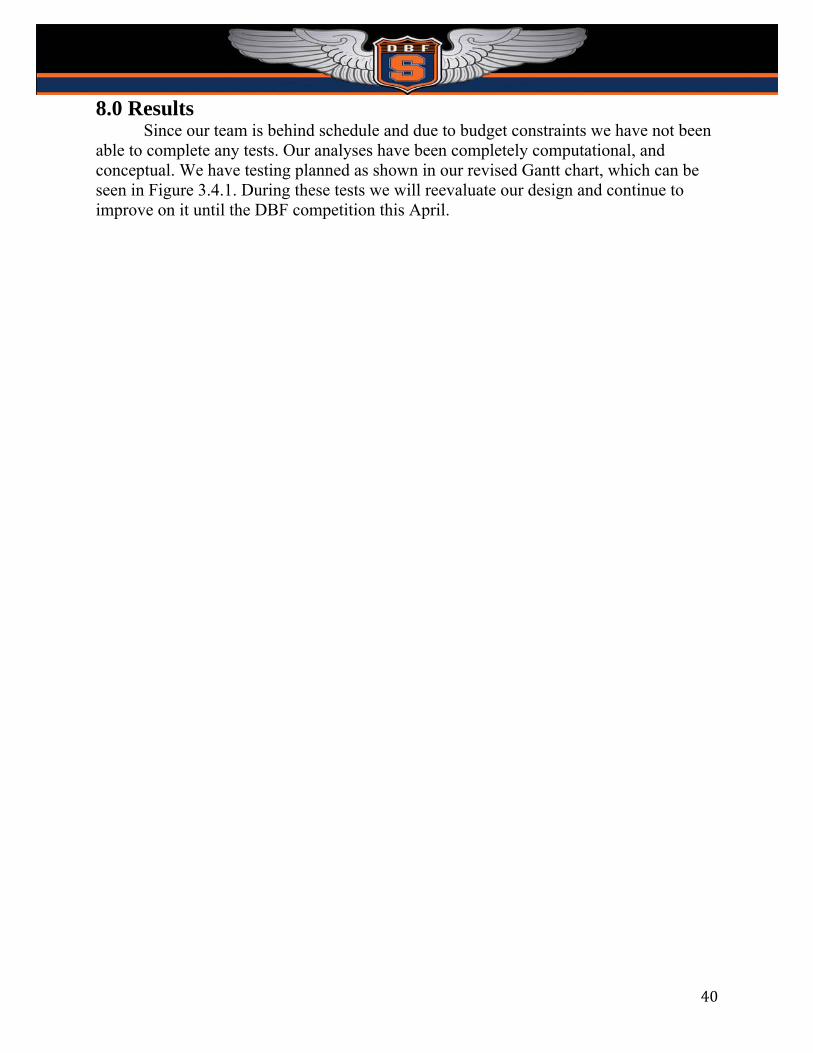
In order to confirm the theoretical prediction of the motor and propeller, a static thrust output test will be performed. This test utilizes a motor attached to an “L” bracket. The “L” bracket transfers the motors force to a balance postal scale to get a force reading. Past years’ static thrust set up can be seen in Figure 7.3.1.
Figure 7.3.1: Static Thrust Experiment
40
8.0 Results Since our team is behind schedule and due to budget constraints we have not been
able to complete any tests. Our analyses have been completely computational, and conceptual. We have testing planned as shown in our revised Gantt chart, which can be seen in Figure 3.4.1. During these tests we will reevaluate our design and continue to improve on it until the DBF competition this April.
41
9.0 Reference 1) Anderson, John David. Fundamentals of Aerodynamics. 5th ed. New York: McGraw-Hill, 2011. Print.
2) Anderson, John David. Introduction to Flight. Boston: McGraw-Hill, 2008. Print.
3) Aircraft Design Report 2013 AIAA Cessna/Raytheon Design/Build/Fly Competition”, Syracuse University, 2013.
4) “Aircraft Design Report 2014 AIAA Cessna/Raytheon Design/Build/Fly Competition”, Syracuse University, 2014.
5)"Airfoil Investigation Database - Welcome." Airfoil Investigation Database - Welcome. Airfoil Data Base, n.d. Web. 23 Feb. 2015.
6) "DBF Rules." DBF Rules. AIAA, Aug. 2013. Web. 23 Feb. 2014.<http://www.aiaadbf.org/2014_files/2014_rules_31Oct.html>.
7) Munson, Bruce Roy, T. H. Okiishi, and Wade W. Huebsch. Fundamentals of
8) Fluid Mechanics. Hoboken, NJ: J. Wiley & Sons, 2009. Print. Nelson, Robert C. Flight Stability and Automatic Control. Boston, MA:
9) WCB/McGraw Hill, 1998. Print.
10) "Weather History for KRYN." Weather History for Tucson, AZ. Weather Underground, n.d. Web. 23 Feb. 2015. 11) "UIUC Airfoil Data Site." UIUC Airfoil Data Site. N.p., n.d. Web. 24 Feb. 2014. <http://aerospace.illinois.edu/m-selig/ads.html>.