Embed Size (px)
Citation preview
3© Shell Education #50024—Graphing Calculator Strategies, Algebra
Table of Contents
Introduction . . . . . . . . . . . . . . . . . . . . . . . . . . . . . . . . . . . . . . . . . . . . . . . . . . . . . . . . . . . . 5 Research Base . . . . . . . . . . . . . . . . . . . . . . . . . . . . . . . . . . . . . . . . . . . . . . . . . . . . . . . . 7
Correlation to Standards . . . . . . . . . . . . . . . . . . . . . . . . . . . . . . . . . . . . . . . . . . . . . . . . . . 9
How to Use This Book . . . . . . . . . . . . . . . . . . . . . . . . . . . . . . . . . . . . . . . . . . . . . . . . . . 12
Utilizing and Managing Graphing Calculators . . . . . . . . . . . . . . . . . . . . . . . . . . . . . . . . . . . 19
Assessment . . . . . . . . . . . . . . . . . . . . . . . . . . . . . . . . . . . . . . . . . . . . . . . . . . . . . . . . . 24
Unit 1 . . . . . . . . . . . . . . . . . . . . . . . . . . . . . . . . . . . . . . . . . . . . . . . . . . . . . . . . . . . . . . . . 29 Lesson 1: Understanding Like Terms . . . . . . . . . . . . . . . . . . . . . . . . . . . . . . . . . . . . . . . . . 31
Lesson 2: Combining Like Terms . . . . . . . . . . . . . . . . . . . . . . . . . . . . . . . . . . . . . . . . . . . 40
Lesson 3: Investigating Direct Variation . . . . . . . . . . . . . . . . . . . . . . . . . . . . . . . . . . . . . . 49
Lesson 4: Using Graphs & Tables to Solve Linear Equations . . . . . . . . . . . . . . . . . . . . . . . . . 57
Lesson 5: Using CALC to Solve Linear Equations . . . . . . . . . . . . . . . . . . . . . . . . . . . . . . . . . 66
Unit 2 . . . . . . . . . . . . . . . . . . . . . . . . . . . . . . . . . . . . . . . . . . . . . . . . . . . . . . . . . . . . . . . . 73 Lesson 6: Analyzing Constant Change & Straightness . . . . . . . . . . . . . . . . . . . . . . . . . . . . . 75
Lesson 7: Exploring Slope as a Constant Rate of Change . . . . . . . . . . . . . . . . . . . . . . . . . . . 82
Lesson 8: Constructing Slope-Intercept Form . . . . . . . . . . . . . . . . . . . . . . . . . . . . . . . . . . . 89
Lesson 9: Solving One-Variable Inequalities . . . . . . . . . . . . . . . . . . . . . . . . . . . . . . . . . . . . 98
Lesson 10: Conceptualizing Absolute Value . . . . . . . . . . . . . . . . . . . . . . . . . . . . . . . . . . . 107
Lesson 11: Solving Absolute Value Equations and Inequalities . . . . . . . . . . . . . . . . . . . . . . 115
Unit 3 . . . . . . . . . . . . . . . . . . . . . . . . . . . . . . . . . . . . . . . . . . . . . . . . . . . . . . . . . . . . . . . 123 Lesson 12: Adding & Subtracting to Solve Systems of Equations . . . . . . . . . . . . . . . . . . . . . 125
Lesson 13: Substituting to Solve Systems of Equations . . . . . . . . . . . . . . . . . . . . . . . . . . . 132
Lesson 14: Using Inverse Matrices to Solve Systems of Equations . . . . . . . . . . . . . . . . . . . . 139
4 #50024—Graphing Calculator Strategies, Algebra © Shell Education
Table of Contents (cont.)
Unit 4 . . . . . . . . . . . . . . . . . . . . . . . . . . . . . . . . . . . . . . . . . . . . . . . . . . . . . . . . . . . . . . . 149 Lesson 15: Investigating Roots & Fractional Exponents . . . . . . . . . . . . . . . . . . . . . . . . . . . 151
Lesson 16: Completing the Square . . . . . . . . . . . . . . . . . . . . . . . . . . . . . . . . . . . . . . . . . 160
Lesson 17: Exploring Factors, Zeros, & Roots . . . . . . . . . . . . . . . . . . . . . . . . . . . . . . . . . . 170
Lesson 18: Determining Number of Quadratic Solutions . . . . . . . . . . . . . . . . . . . . . . . . . . . 184
Lesson 19: Examining Exponential Growth . . . . . . . . . . . . . . . . . . . . . . . . . . . . . . . . . . . . 194
Lesson 20: Linear Transformations . . . . . . . . . . . . . . . . . . . . . . . . . . . . . . . . . . . . . . . . . 200
Appendices . . . . . . . . . . . . . . . . . . . . . . . . . . . . . . . . . . . . . . . . . . . . . . . . . . . . . . . . . . . 210 Appendix A: Works Cited . . . . . . . . . . . . . . . . . . . . . . . . . . . . . . . . . . . . . . . . . . . . . . . 211
Appendix B: Teacher Resource CD Index . . . . . . . . . . . . . . . . . . . . . . . . . . . . . . . . . . . . . 212
Appendix C: Templates & Manipulatives . . . . . . . . . . . . . . . . . . . . . . . . . . . . . . . . . . . . . 213
Appendix D: Glossary . . . . . . . . . . . . . . . . . . . . . . . . . . . . . . . . . . . . . . . . . . . . . . . . . . 220
Appendix E: Answer Key . . . . . . . . . . . . . . . . . . . . . . . . . . . . . . . . . . . . . . . . . . . . . . . . 229
10 #50024—Graphing Calculator Strategies, Algebra © Shell Education
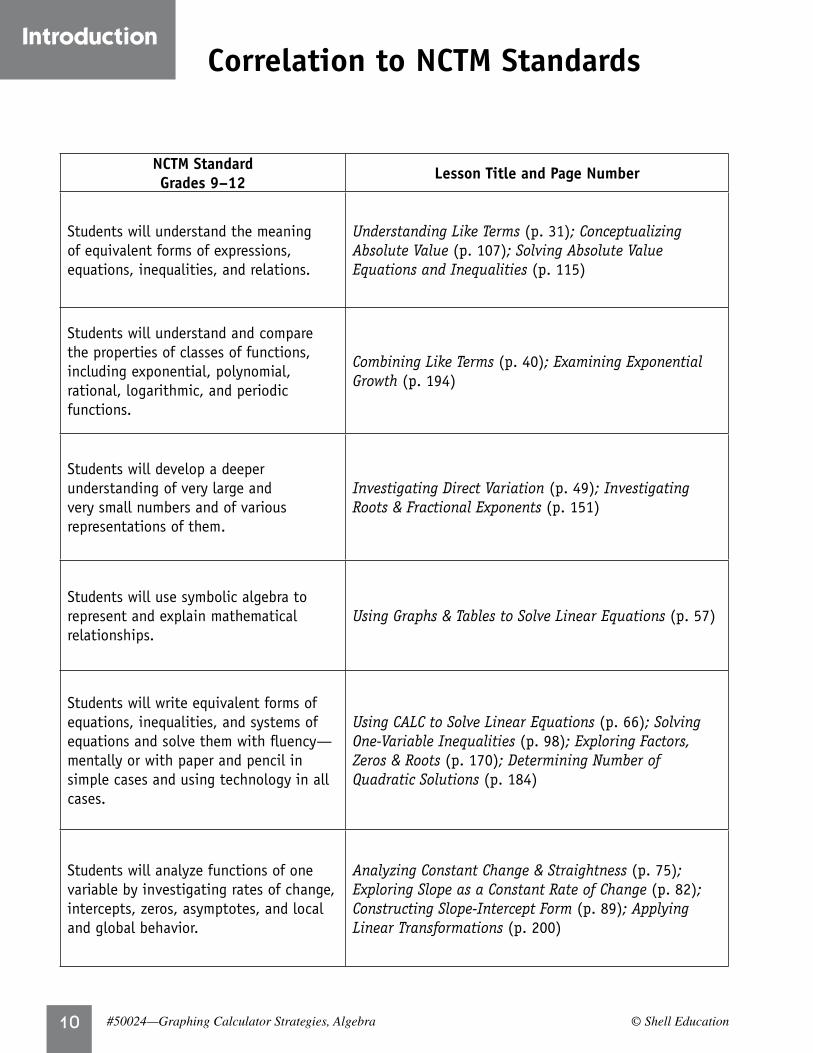
Correlation.to.NCTM.StandardsIntroduction
NCTM.Standard..Grades.9–12.. Lesson.Title.and.Page.Number
Students will understand the meaning of equivalent forms of expressions, equations, inequalities, and relations.
Understanding Like Terms (p. 31); Conceptualizing Absolute Value (p. 107); Solving Absolute Value Equations and Inequalities (p. 115)
Students will understand and compare the properties of classes of functions, including exponential, polynomial, rational, logarithmic, and periodic functions.
Combining Like Terms (p. 40); Examining Exponential Growth (p. 194)
Students will develop a deeper understanding of very large and very small numbers and of various representations of them.
Investigating Direct Variation (p. 49); Investigating Roots & Fractional Exponents (p. 151)
Students will use symbolic algebra to represent and explain mathematical relationships.
Using Graphs & Tables to Solve Linear Equations (p. 57)
Students will write equivalent forms of equations, inequalities, and systems of equations and solve them with fluency—mentally or with paper and pencil in simple cases and using technology in all cases.
Using CALC to Solve Linear Equations (p. 66); Solving One-Variable Inequalities (p. 98); Exploring Factors, Zeros & Roots (p. 170); Determining Number of Quadratic Solutions (p. 184)
Students will analyze functions of one variable by investigating rates of change, intercepts, zeros, asymptotes, and local and global behavior.
Analyzing Constant Change & Straightness (p. 75); Exploring Slope as a Constant Rate of Change (p. 82); Constructing Slope-Intercept Form (p. 89); Applying Linear Transformations (p. 200)
11© Shell Education #50024—Graphing Calculator Strategies, Algebra
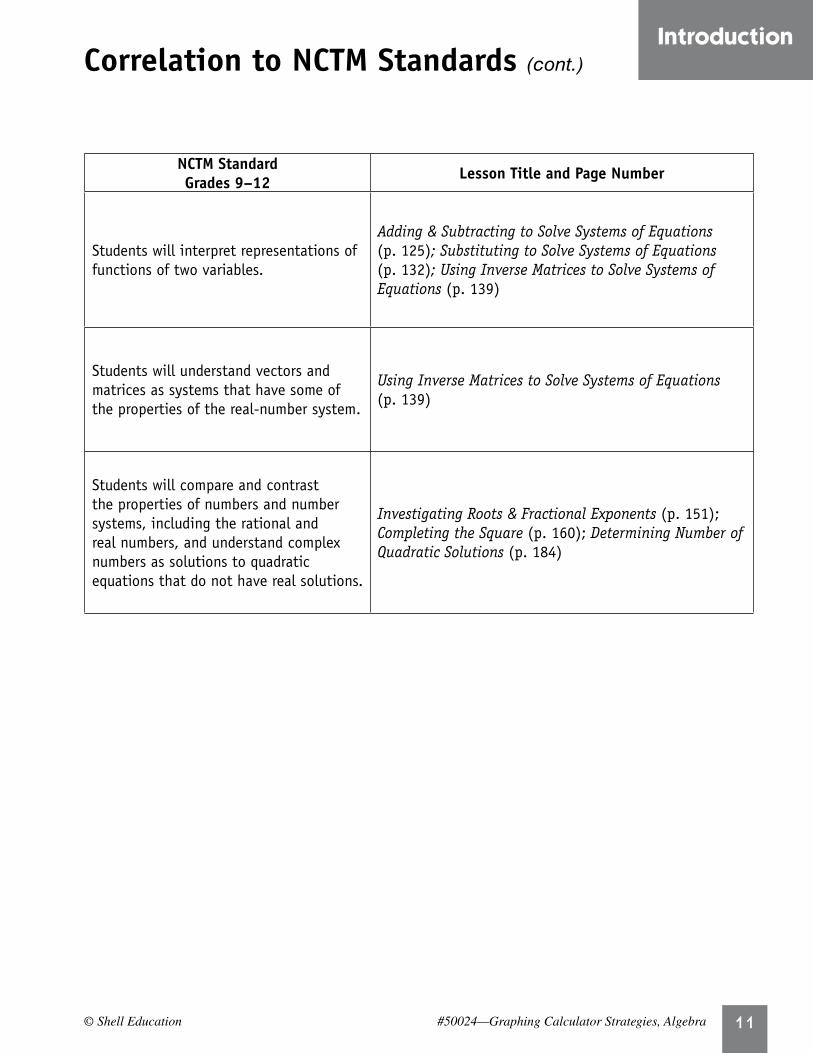
Correlation.to.NCTM.Standards.(cont.)Introduction
NCTM.Standard..Grades.9–12.. Lesson.Title.and.Page.Number
Students will interpret representations of functions of two variables.
Adding & Subtracting to Solve Systems of Equations (p. 125); Substituting to Solve Systems of Equations (p. 132); Using Inverse Matrices to Solve Systems of Equations (p. 139)
Students will understand vectors and matrices as systems that have some of the properties of the real-number system.
Using Inverse Matrices to Solve Systems of Equations (p. 139)
Students will compare and contrast the properties of numbers and number systems, including the rational and real numbers, and understand complex numbers as solutions to quadratic equations that do not have real solutions.
Investigating Roots & Fractional Exponents (p. 151); Completing the Square (p. 160); Determining Number of Quadratic Solutions (p. 184)
1� #50024—Graphing Calculator Strategies, Algebra © Shell Education
How.to.Use.This.BookIntroduction
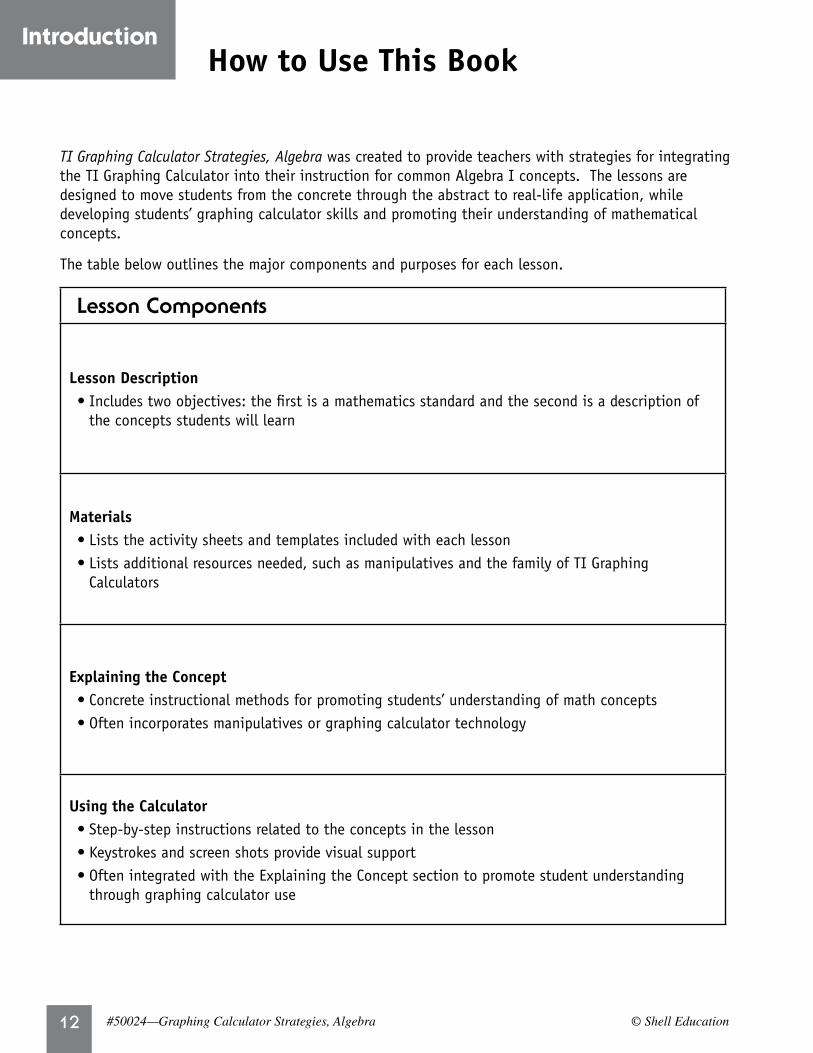
TI Graphing Calculator Strategies, Algebra was created to provide teachers with strategies for integrating the TI Graphing Calculator into their instruction for common Algebra I concepts. The lessons are designed to move students from the concrete through the abstract to real-life application, while developing students’ graphing calculator skills and promoting their understanding of mathematical concepts.
The table below outlines the major components and purposes for each lesson.
Lesson Components
Lesson.Description • Includes two objectives: the first is a mathematics standard and the second is a description of
the concepts students will learn
Materials • Lists the activity sheets and templates included with each lesson • Lists additional resources needed, such as manipulatives and the family of TI Graphing
Calculators
Explaining.the.Concept. • Concrete instructional methods for promoting students’ understanding of math concepts • Often incorporates manipulatives or graphing calculator technology
Using.the.Calculator • Step-by-step instructions related to the concepts in the lesson • Keystrokes and screen shots provide visual support • Often integrated with the Explaining the Concept section to promote student understanding
through graphing calculator use
1�© Shell Education #50024—Graphing Calculator Strategies, Algebra
How.to.Use.This.Book.(cont.)Introduction
Lesson Components (cont.)
Applying.the.Concept • Instructional strategies to promote real-life problem solving and higher-level thinking • Engaging activities designed around secondary students’ interests
Extension.Ideas • Additional lesson ideas for practicing concepts and skills • Can be used to review, extend, and challenge students’ thinking
Activity.Sheets • Teacher- and student-friendly, with easy-to-follow directions • Often requires students to explain their problem solving strategies and mathematical thinking
Icon Guide
To help identify the major instructional parts of each lesson, a corresponding icon has been placed in the margin. In some lessons, these four major instructional phases are independent; in others they are combined.
Explaining the Concept Using the Calculator
Applying the Concept Extension Ideas
1�© Shell Education #50024—Graphing Calculator Strategies, Algebra
Utilizing.and.Managing.Graphing.Calculators
Every minute of class time is valuable. To ensure that adequate time is spent on the lesson and on the usage of the graphing calculator, implement the steps below in your planning.
Methods for Teaching Graphing Calculator Skills Unlike the four-function calculator, the TI Graphing Calculator has many keyboard zones that will be used to complete the activities in this resource. To help students feel comfortable using the TI Graphing Calculator, follow the steps below before starting a lesson.
1 . Demonstrate the most basic graphing calculator skills that students must know to be successful during the Using.the.Calculator section.
2 . To teach a skill, have students locate the keys and functions on the calculator and familiarize students with the menus and screens these keys and functions access.
3 . If multiple steps are needed to complete the activity, list the steps, on the board, or on the overhead for the students to use as a reference while working. Or use a projector to display the PDF versions of the Using the Calculator sections, which can be printed from the Teacher.Resource.CD.
4 . Ask students who are familiar and comfortable using the graphing calculator to assist others. Let the other students know who those graphing calculator mentors are.
5 . Allow time to address any questions the students may have after each step or before continuing on to the next part of the lesson.
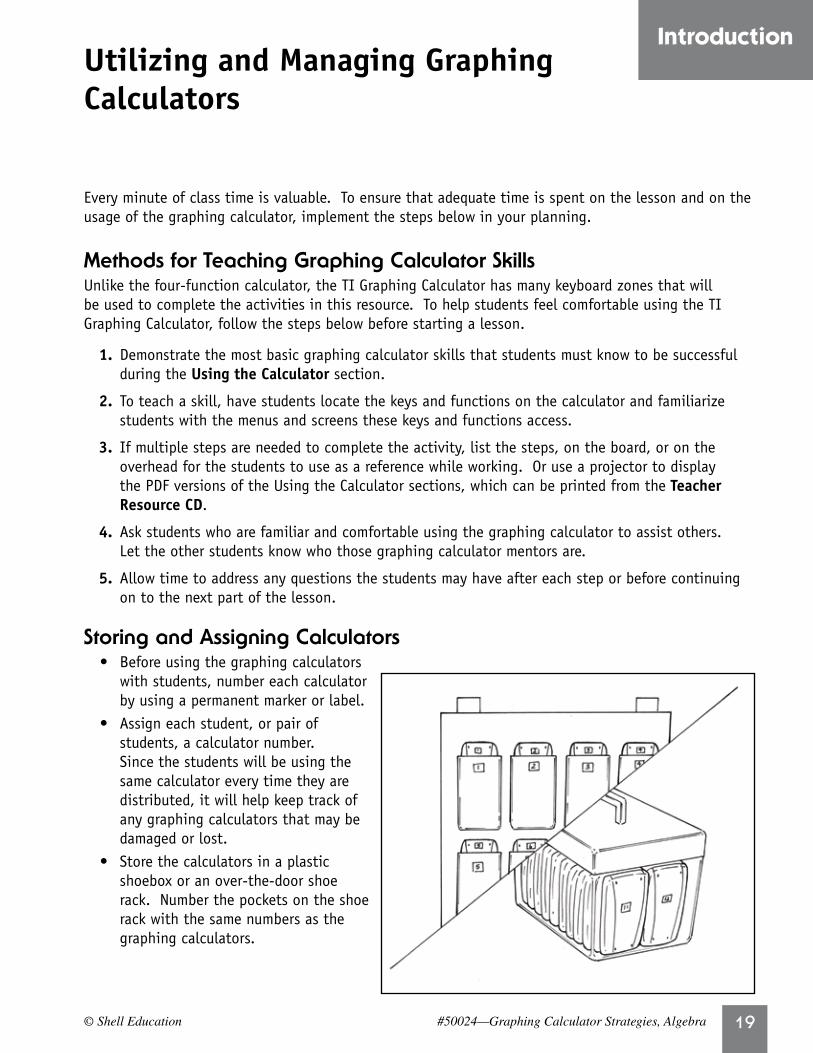
Storing and Assigning Calculators • Before using the graphing calculators
with students, number each calculator by using a permanent marker or label.
• Assign each student, or pair of students, a calculator number. Since the students will be using the same calculator every time they are distributed, it will help keep track of any graphing calculators that may be damaged or lost.
• Store the calculators in a plastic shoebox or an over-the-door shoe rack. Number the pockets on the shoe rack with the same numbers as the graphing calculators.
Introduction
��© Shell Education #50024—Graphing Calculator Strategies, Algebra
Lesson 3Investigating Direct VariationUnit 1
Lesson Description • Students will solve problems involving direct variation and identify
relationships among variables through the use of a spreadsheet.
• Students will apply direct variation, proportion, and percent to real-life scenarios.
Materials • It’s Direct! (pages 55–56; unt1.55.pdf)
• TI-83/84 Plus Family Graphing Calculator or TI-73 Explorer™
Using the Calculator
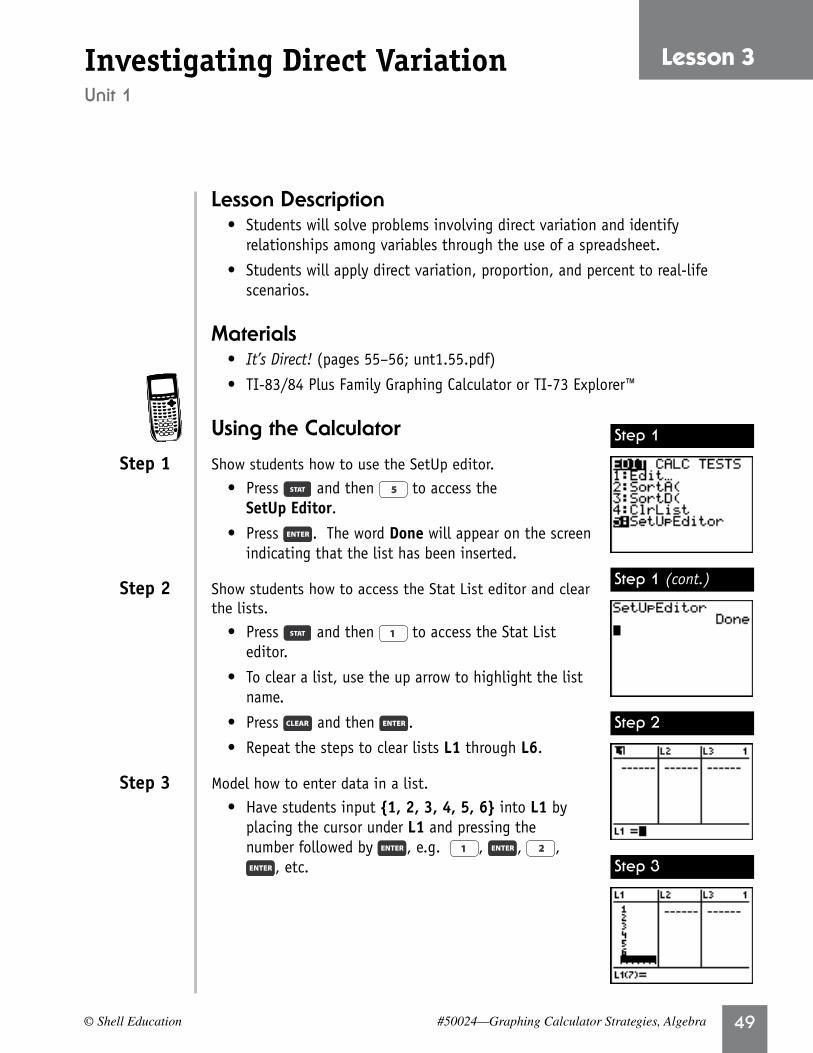
Step.1. Show students how to use the SetUp editor.
• Press and then to access the SetUp.Editor.
• Press . The word Done will appear on the screen indicating that the list has been inserted.
Step.2. Show students how to access the Stat List editor and clear the lists.
• Press and then to access the Stat List editor.
• To clear a list, use the up arrow to highlight the list name.
• Press and then .
• Repeat the steps to clear lists L1 through L6.
Step.3. Model how to enter data in a list.
• Have students input {1,.2,.3,.4,.5,.6} into L1 by placing the cursor under L1 and pressing the number followed by , e.g. , , ,
, etc.
Step 1
Step 1 (cont.)
Step �
Step �
�0 #50024—Graphing Calculator Strategies, Algebra © Shell Education
Lesson 3 Investigating Direct Variation (cont.)
Unit 1
Using the Calculator (cont.)
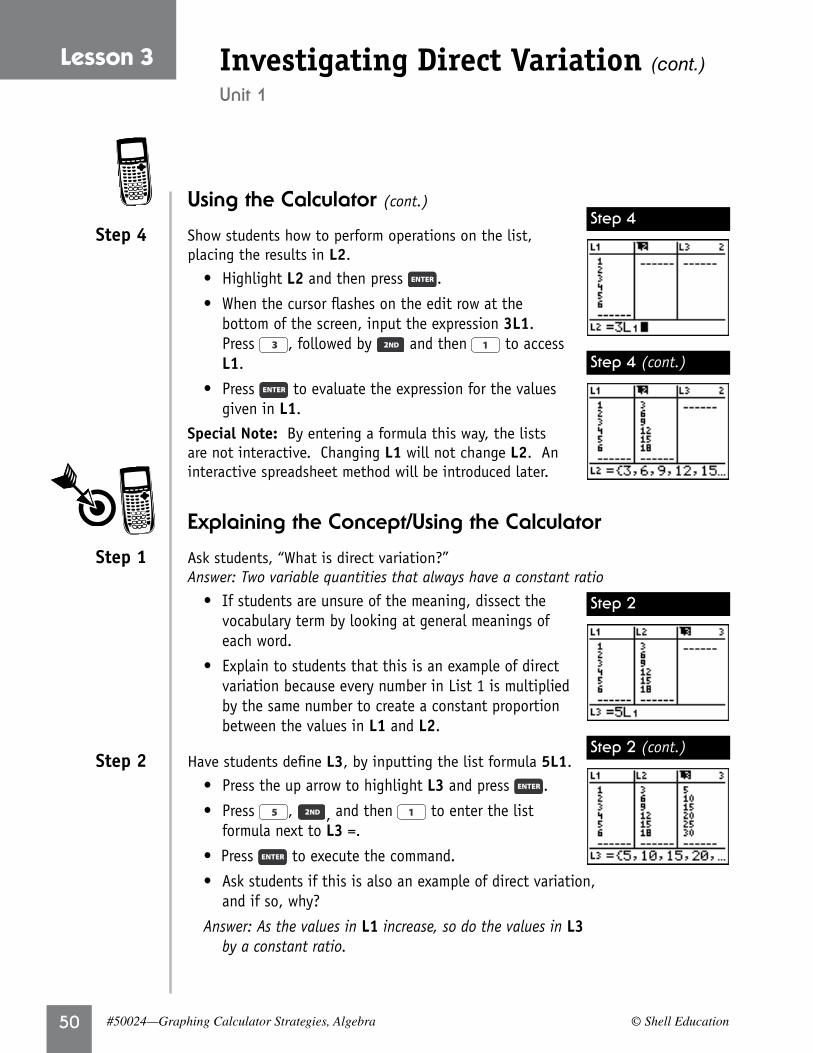
Step.4. Show students how to perform operations on the list, placing the results in L2.
• Highlight L2 and then press .
• When the cursor flashes on the edit row at the bottom of the screen, input the expression 3L1. Press , followed by and then to access L1.
• Press to evaluate the expression for the values given in L1.
Special.Note: By entering a formula this way, the lists are not interactive. Changing.L1 will not change L2. An interactive spreadsheet method will be introduced later.
Explaining the Concept/Using the Calculator
Step.1. Ask students, “What is direct variation?” Answer: Two variable quantities that always have a constant ratio
• If students are unsure of the meaning, dissect the vocabulary term by looking at general meanings of each word.
• Explain to students that this is an example of direct variation because every number in List 1 is multiplied by the same number to create a constant proportion between the values in L1 and L2.
Step.2. Have students define L3, by inputting the list formula 5L1.
• Press the up arrow to highlight L3 and press .
• Press , , and then to enter the list formula next to L3 =.
• Press to execute the command.
• Ask students if this is also an example of direct variation, and if so, why?
Answer: As the values in L1 increase, so do the values in L3 by a constant ratio.
Step �
Step � (cont.)
Step �
Step � (cont.)
�1© Shell Education #50024—Graphing Calculator Strategies, Algebra
Lesson 3Investigating Direct Variation (cont.)
Unit 1
Explaining the Concept/Using the Calculator (cont.)
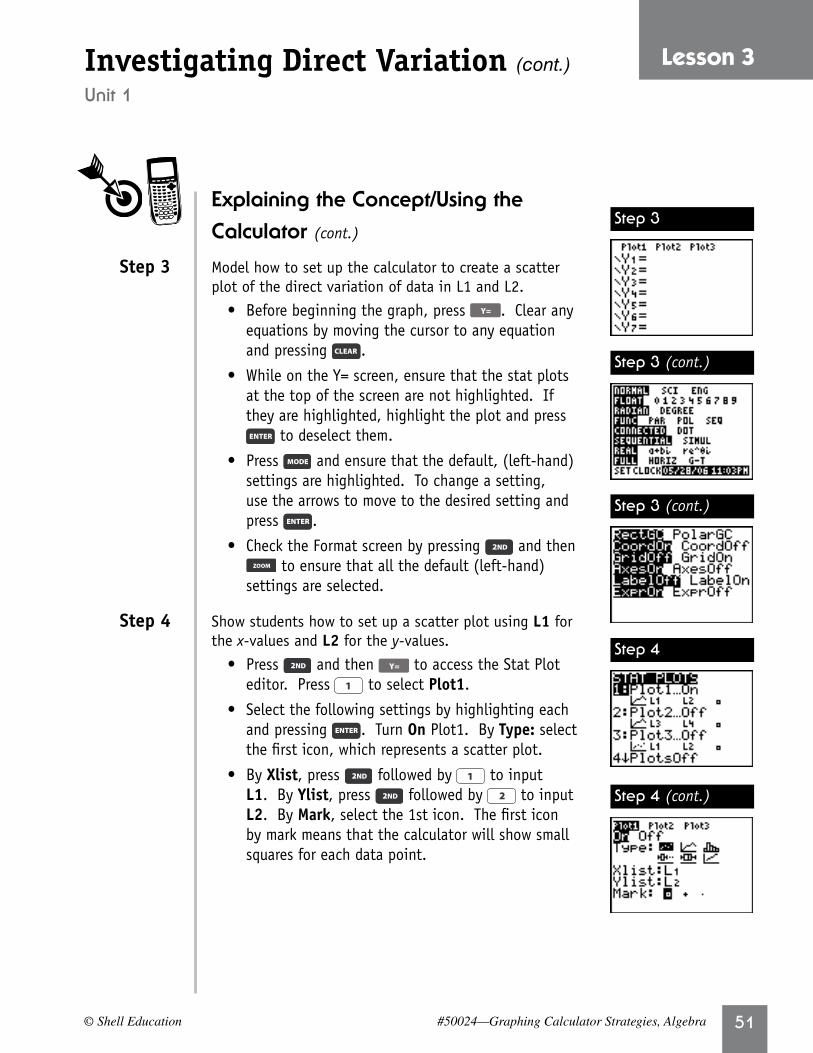
Step.3. Model how to set up the calculator to create a scatter plot of the direct variation of data in L1 and L2.
• Before beginning the graph, press . Clear any equations by moving the cursor to any equation and pressing .
• While on the Y= screen, ensure that the stat plots at the top of the screen are not highlighted. If they are highlighted, highlight the plot and press
to deselect them.
• Press and ensure that the default, (left-hand) settings are highlighted. To change a setting, use the arrows to move to the desired setting and press .
• Check the Format screen by pressing and then to ensure that all the default (left-hand)
settings are selected.
Step.4. Show students how to set up a scatter plot using L1 for the x-values and L2 for the y-values.
• Press and then to access the Stat Plot editor. Press to select Plot1.
• Select the following settings by highlighting each and pressing . Turn On Plot1. By Type: select the first icon, which represents a scatter plot.
• By Xlist, press followed by to input L1. By Ylist, press followed by to input L2. By Mark, select the 1st icon. The first icon by mark means that the calculator will show small squares for each data point.
Step �
Step � (cont.)
Step � (cont.)
Step �
Step � (cont.)
�� #50024—Graphing Calculator Strategies, Algebra © Shell Education
Lesson 3 Investigating Direct Variation (cont.)
Unit 1
Explaining the Concept/Using the Calculator (cont.)
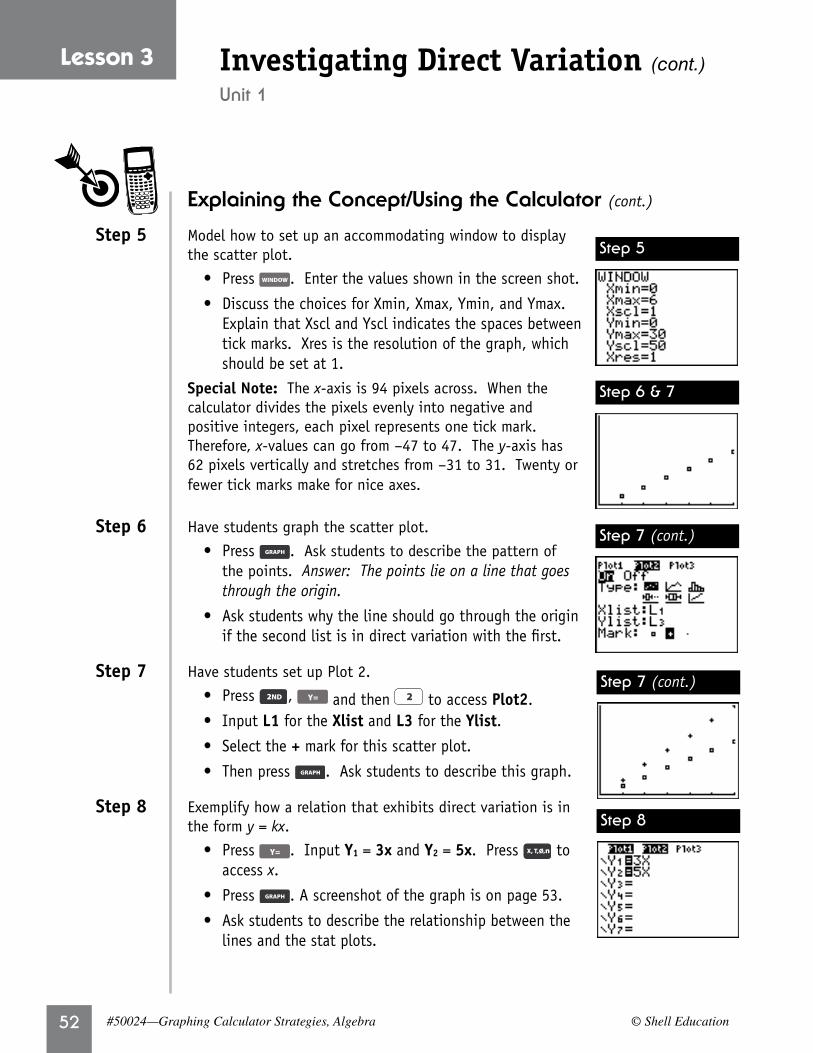
Step.5. Model how to set up an accommodating window to display the scatter plot.
• Press . Enter the values shown in the screen shot.
• Discuss the choices for Xmin, Xmax, Ymin, and Ymax. Explain that Xscl and Yscl indicates the spaces between tick marks. Xres is the resolution of the graph, which should be set at 1.
Special.Note: The x-axis is 94 pixels across. When the calculator divides the pixels evenly into negative and positive integers, each pixel represents one tick mark. Therefore, x-values can go from –47 to 47. The y-axis has 62 pixels vertically and stretches from –31 to 31. Twenty or fewer tick marks make for nice axes.
Step.6.. Have students graph the scatter plot.
• Press . Ask students to describe the pattern of the points. Answer: The points lie on a line that goes through the origin.
• Ask students why the line should go through the origin if the second list is in direct variation with the first.
Step.7. Have students set up Plot 2.
• Press , and then to access Plot2.
• Input L1 for the Xlist and L3 for the Ylist. • Select the + mark for this scatter plot.
• Then press . Ask students to describe this graph.
Step.8. Exemplify how a relation that exhibits direct variation is in the form y = kx.
• Press . Input Y1 = 3x and Y2 = 5x. Press to access x.
• Press . A screenshot of the graph is on page 53.
• Ask students to describe the relationship between the lines and the stat plots.
Step �
Step � & �
Step � (cont.)
Step � (cont.)
Step �
��© Shell Education #50024—Graphing Calculator Strategies, Algebra
Lesson 3Investigating Direct Variation (cont.)
Unit 1
Explaining the Concept/Using the Calculator (cont.)
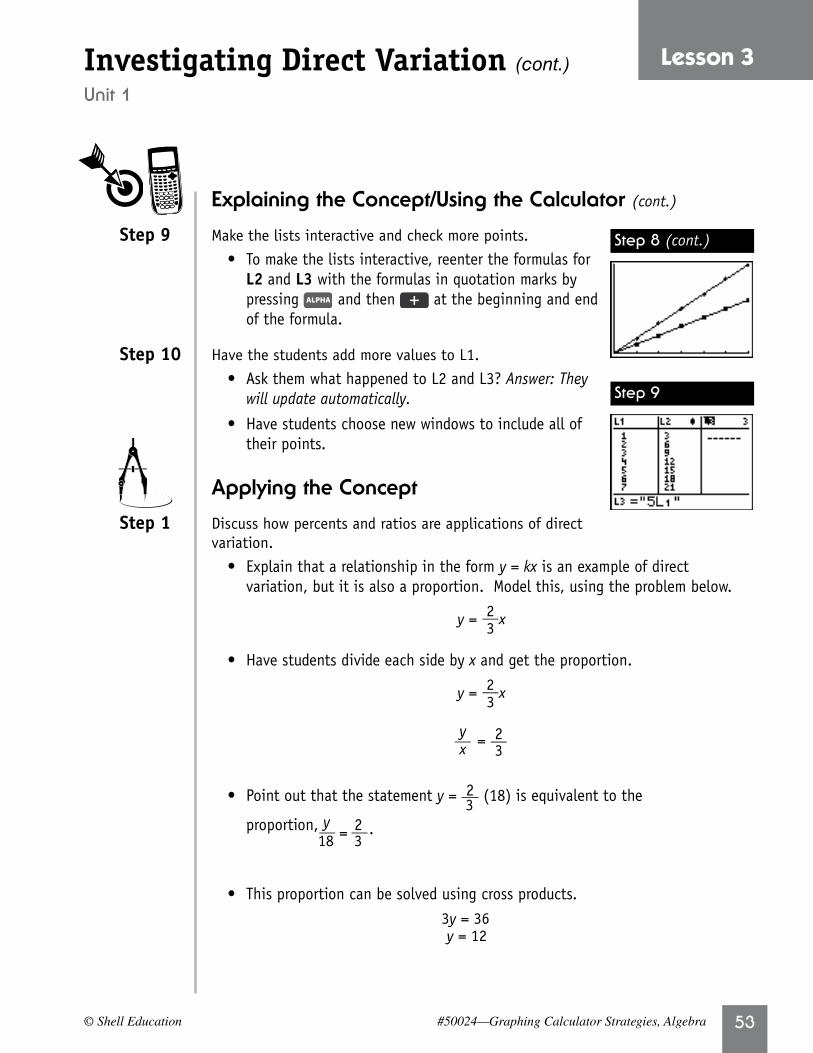
Step.9. Make the lists interactive and check more points.
• To make the lists interactive, reenter the formulas for L2 and L3 with the formulas in quotation marks by pressing and then at the beginning and end of the formula.
Step.10. Have the students add more values to L1.
• Ask them what happened to L2 and L3? Answer: They will update automatically.
• Have students choose new windows to include all of their points.
Applying the Concept
Step.1. Discuss how percents and ratios are applications of direct variation.
• Explain that a relationship in the form y = kx is an example of direct variation, but it is also a proportion. Model this, using the problem below.
y = 2 x __ 3
• Have students divide each side by x and get the proportion. y = 2 x __ 3
y 2 __ = __
x 3
• Point out that the statement y = 2 (18) is equivalent to the 3 proportion, y = 2 . __ __
18 3
• This proportion can be solved using cross products. 3y = 36 y = 12
Step � (cont.)
Step �
�� #50024—Graphing Calculator Strategies, Algebra © Shell Education
Lesson 3 Investigating Direct Variation (cont.)
Unit 1
Applying the Concept (cont.)
Step.2. Have students write equivalent statements of the proportion y/x = 4/5 in both forms.
• Ask students what they should do before they can rewrite the statement. Answer: Begin by solving for y.
5y = 4x
y = 4x ___ 5
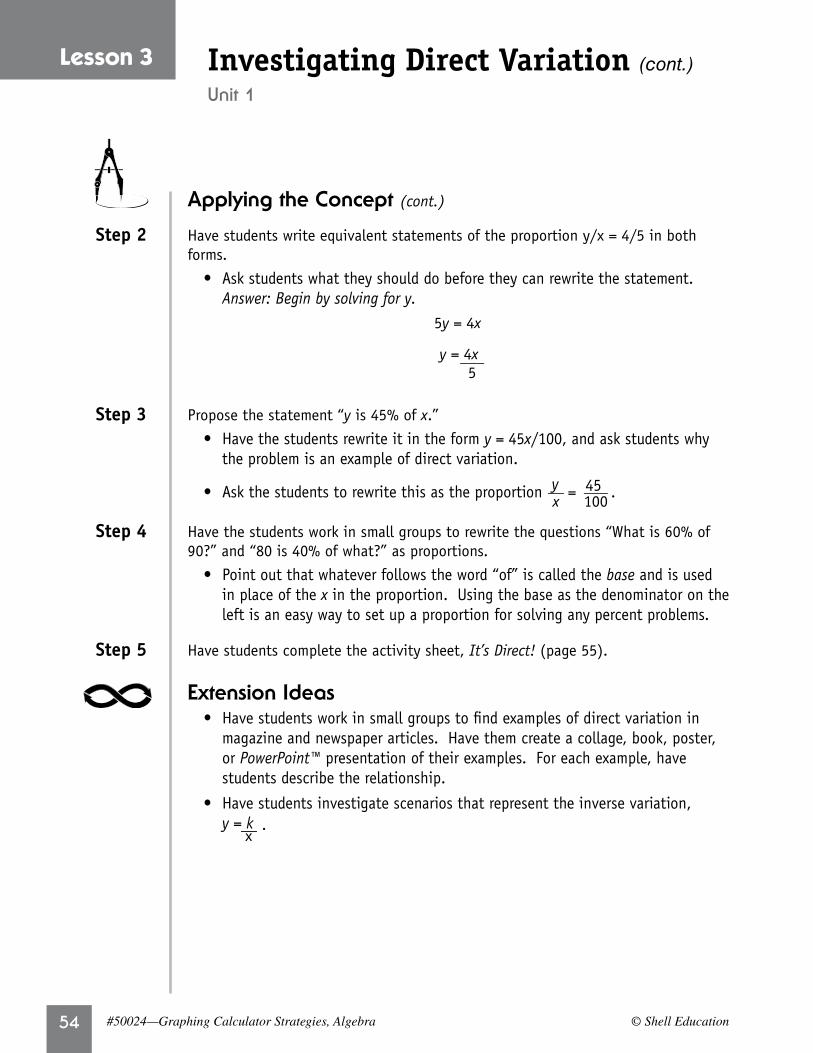
Step.3. Propose the statement “y is 45% of x.”
• Have the students rewrite it in the form y = 45x/100, and ask students why the problem is an example of direct variation.
• Ask the students to rewrite this as the proportion y = 45 . __ ___ x 100
Step.4. Have the students work in small groups to rewrite the questions “What is 60% of 90?” and “80 is 40% of what?” as proportions.
• Point out that whatever follows the word “of” is called the base and is used in place of the x in the proportion. Using the base as the denominator on the left is an easy way to set up a proportion for solving any percent problems.
Step.5. Have students complete the activity sheet, It’s Direct! (page 55).
Extension Ideas • Have students work in small groups to find examples of direct variation in
magazine and newspaper articles. Have them create a collage, book, poster, or PowerPoint™ presentation of their examples. For each example, have students describe the relationship.
• Have students investigate scenarios that represent the inverse variation, y = k __ .
x
Name
Date
��© Shell Education #50024—Graphing Calculator Strategies, Algebra
Lesson 3
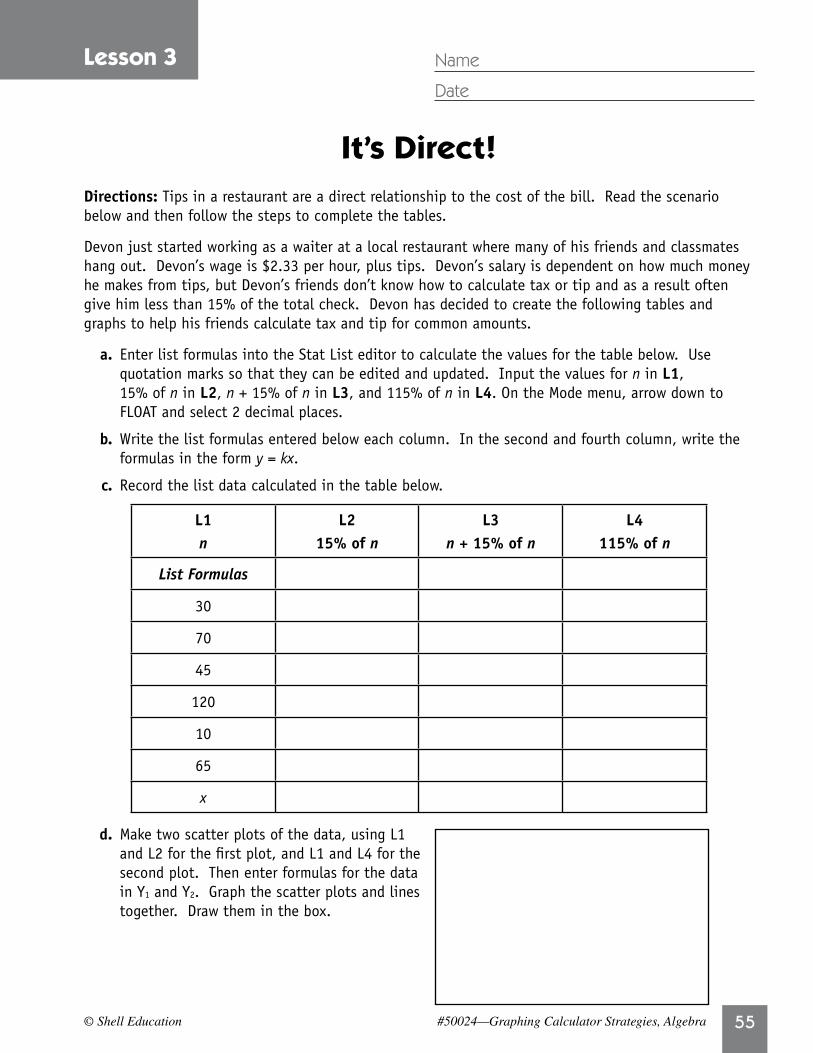
Directions:.Tips in a restaurant are a direct relationship to the cost of the bill. Read the scenario below and then follow the steps to complete the tables.
Devon just started working as a waiter at a local restaurant where many of his friends and classmates hang out. Devon’s wage is $2.33 per hour, plus tips. Devon’s salary is dependent on how much money he makes from tips, but Devon’s friends don’t know how to calculate tax or tip and as a result often give him less than 15% of the total check. Devon has decided to create the following tables and graphs to help his friends calculate tax and tip for common amounts.
. a .. Enter list formulas into the Stat List editor to calculate the values for the table below. Use quotation marks so that they can be edited and updated. Input the values for n in L1, 15% of n in L2, n + 15% of n in L3, and 115% of n in L4. On the Mode menu, arrow down to FLOAT and select 2 decimal places.
. b .. Write the list formulas entered below each column. In the second and fourth column, write the formulas in the form y = kx.
. c .. Record the list data calculated in the table below.
L1n
L215%.of.n
L3n.+.15%.of.n
L4115%.of.n
List Formulas
30
70
45
120
10
65
x
d .. Make two scatter plots of the data, using L1 and L2 for the first plot, and L1 and L4 for the second plot. Then enter formulas for the data in Y1 and Y2. Graph the scatter plots and lines together. Draw them in the box.
It’s Direct!
Name
Date
�� #50024—Graphing Calculator Strategies, Algebra © Shell Education
Lesson 3
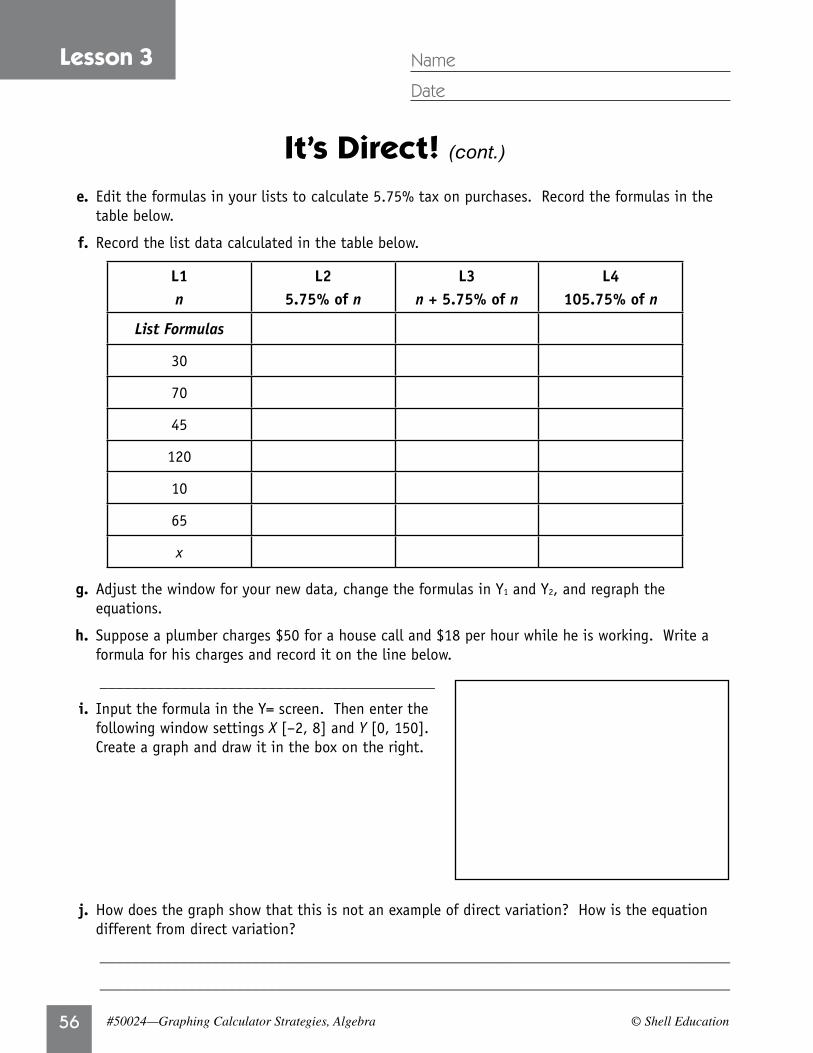
It’s Direct! (cont.)
. e .. Edit the formulas in your lists to calculate 5.75% tax on purchases. Record the formulas in the table below.
. f .. Record the list data calculated in the table below.
L1n
L25 .75%.of.n
L3n.+.5 .75%.of.n
L4105 .75%.of.n
List Formulas
30
70
45
120
10
65
x
. g .. Adjust the window for your new data, change the formulas in Y1.and Y2, and regraph the equations.
. h .. Suppose a plumber charges $50 for a house call and $18 per hour while he is working. Write a formula for his charges and record it on the line below.
__________________________________________
. i .. Input the formula in the Y= screen. Then enter the following window settings X [–2, 8] and Y [0, 150]. Create a graph and draw it in the box on the right.
.
. j .. How does the graph show that this is not an example of direct variation? How is the equation different from direct variation?
_______________________________________________________________________________
_______________________________________________________________________________