Embed Size (px)
Citation preview
VDOT: Asphalt Concrete Mix Design Jan. 2005
TABLE OF CONTENTS CHAPTER 1 Selection of Aggregates ........................................................... 1-1 - 1-24 CHAPTER 2 Blending Aggregates ................................................................. 2-1 - 2-6 CHAPTER 3 Batching Specimens .................................................................. 3-1 - 3-6 CHAPTER 4 Selecting Target Gradation ...................................................... 4-1 - 4-2 CHAPTER 5 Selecting the Design Asphalt Content ................................... 5-1 - 5-28 CHAPTER 6 Calculating Field Correction Factor ....................................... 6-1 - 6-3 CHAPTER 7 Muffle Furnace Correction Factor .......................................... 7-1 - 7-7 CHAPTER 8 Testing % Gmm at Nmax ............................................................. 8-1 - 8-6 CHAPTER 9 Resistance of Compacted Bituminous Mixture to Moisture-Induced Damage (TSR) .......................................................................... 9-1 - 9- 6
VDOT: Asphalt Concrete Mix Design Jan. 2005
1-1
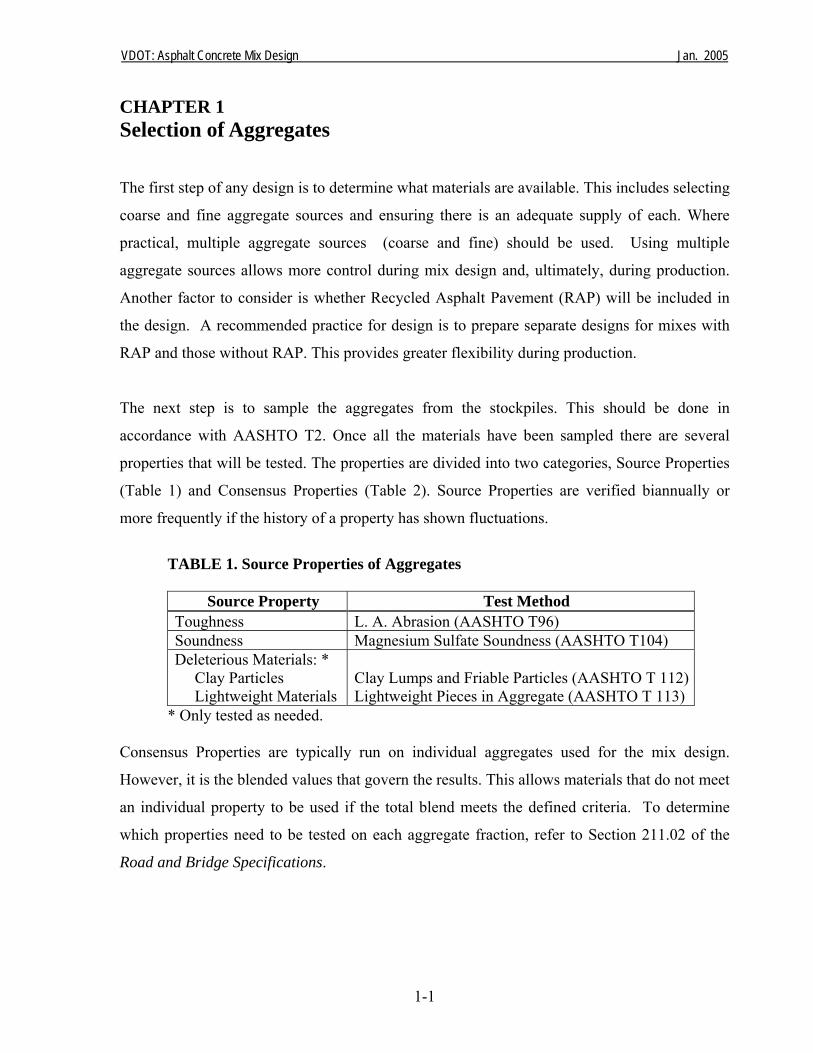
CHAPTER 1 Selection of Aggregates The first step of any design is to determine what materials are available. This includes selecting
coarse and fine aggregate sources and ensuring there is an adequate supply of each. Where
practical, multiple aggregate sources (coarse and fine) should be used. Using multiple
aggregate sources allows more control during mix design and, ultimately, during production.
Another factor to consider is whether Recycled Asphalt Pavement (RAP) will be included in
the design. A recommended practice for design is to prepare separate designs for mixes with
RAP and those without RAP. This provides greater flexibility during production.
The next step is to sample the aggregates from the stockpiles. This should be done in
accordance with AASHTO T2. Once all the materials have been sampled there are several
properties that will be tested. The properties are divided into two categories, Source Properties
(Table 1) and Consensus Properties (Table 2). Source Properties are verified biannually or
more frequently if the history of a property has shown fluctuations.
TABLE 1. Source Properties of Aggregates
Source Property Test Method Toughness L. A. Abrasion (AASHTO T96) Soundness Magnesium Sulfate Soundness (AASHTO T104) Deleterious Materials: * Clay Particles Lightweight Materials
Clay Lumps and Friable Particles (AASHTO T 112)Lightweight Pieces in Aggregate (AASHTO T 113)
* Only tested as needed. Consensus Properties are typically run on individual aggregates used for the mix design.
However, it is the blended values that govern the results. This allows materials that do not meet
an individual property to be used if the total blend meets the defined criteria. To determine
which properties need to be tested on each aggregate fraction, refer to Section 211.02 of the
Road and Bridge Specifications.
VDOT: Asphalt Concrete Mix Design Jan. 2005
1-2
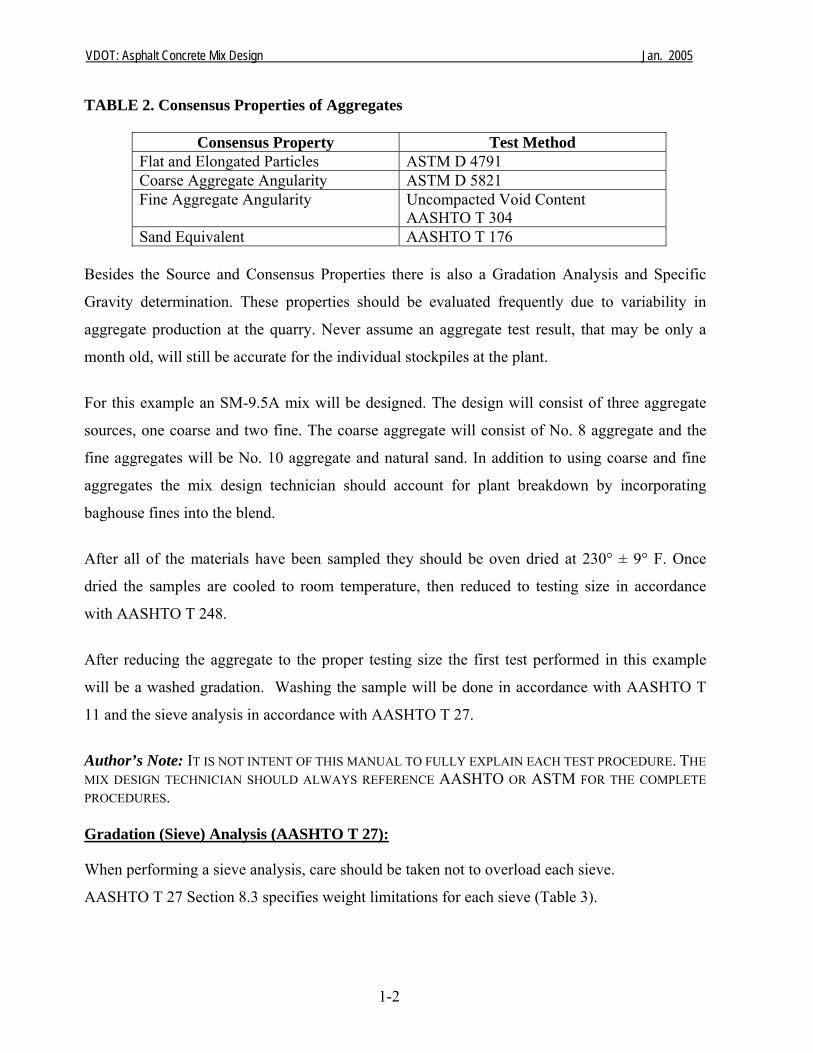
TABLE 2. Consensus Properties of Aggregates
Consensus Property Test Method Flat and Elongated Particles ASTM D 4791 Coarse Aggregate Angularity ASTM D 5821 Fine Aggregate Angularity Uncompacted Void Content
AASHTO T 304 Sand Equivalent AASHTO T 176
Besides the Source and Consensus Properties there is also a Gradation Analysis and Specific
Gravity determination. These properties should be evaluated frequently due to variability in
aggregate production at the quarry. Never assume an aggregate test result, that may be only a
month old, will still be accurate for the individual stockpiles at the plant.
For this example an SM-9.5A mix will be designed. The design will consist of three aggregate
sources, one coarse and two fine. The coarse aggregate will consist of No. 8 aggregate and the
fine aggregates will be No. 10 aggregate and natural sand. In addition to using coarse and fine
aggregates the mix design technician should account for plant breakdown by incorporating
baghouse fines into the blend.
After all of the materials have been sampled they should be oven dried at 230° ± 9° F. Once
dried the samples are cooled to room temperature, then reduced to testing size in accordance
with AASHTO T 248.
After reducing the aggregate to the proper testing size the first test performed in this example
will be a washed gradation. Washing the sample will be done in accordance with AASHTO T
11 and the sieve analysis in accordance with AASHTO T 27.
Author’s Note: IT IS NOT INTENT OF THIS MANUAL TO FULLY EXPLAIN EACH TEST PROCEDURE. THE MIX DESIGN TECHNICIAN SHOULD ALWAYS REFERENCE AASHTO OR ASTM FOR THE COMPLETE PROCEDURES. Gradation (Sieve) Analysis (AASHTO T 27):
When performing a sieve analysis, care should be taken not to overload each sieve.
AASHTO T 27 Section 8.3 specifies weight limitations for each sieve (Table 3).
VDOT: Asphalt Concrete Mix Design Jan. 2005
1-3
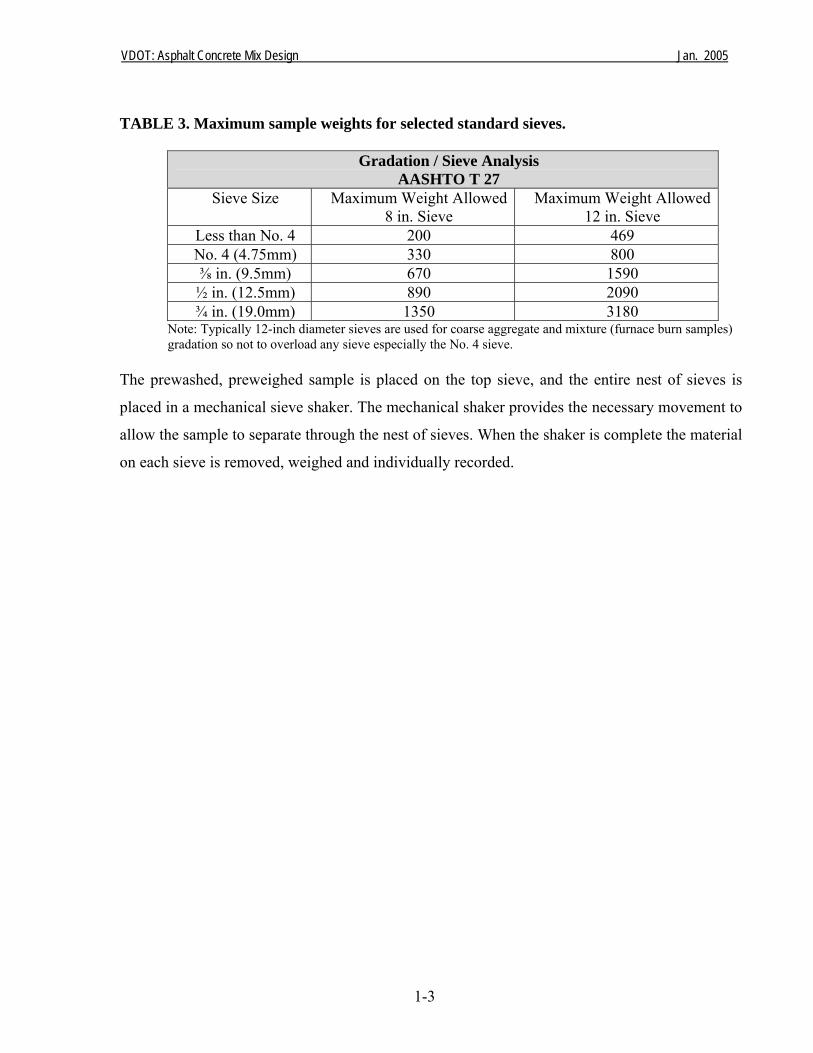
TABLE 3. Maximum sample weights for selected standard sieves.
Gradation / Sieve Analysis AASHTO T 27
Sieve Size Maximum Weight Allowed 8 in. Sieve
Maximum Weight Allowed 12 in. Sieve
Less than No. 4 200 469 No. 4 (4.75mm) 330 800 ⅜ in. (9.5mm) 670 1590 ½ in. (12.5mm) 890 2090 ¾ in. (19.0mm) 1350 3180
Note: Typically 12-inch diameter sieves are used for coarse aggregate and mixture (furnace burn samples) gradation so not to overload any sieve especially the No. 4 sieve.
The prewashed, preweighed sample is placed on the top sieve, and the entire nest of sieves is
placed in a mechanical sieve shaker. The mechanical shaker provides the necessary movement to
allow the sample to separate through the nest of sieves. When the shaker is complete the material
on each sieve is removed, weighed and individually recorded.
VDOT: Asphalt Concrete Mix Design Jan. 2005
1-4
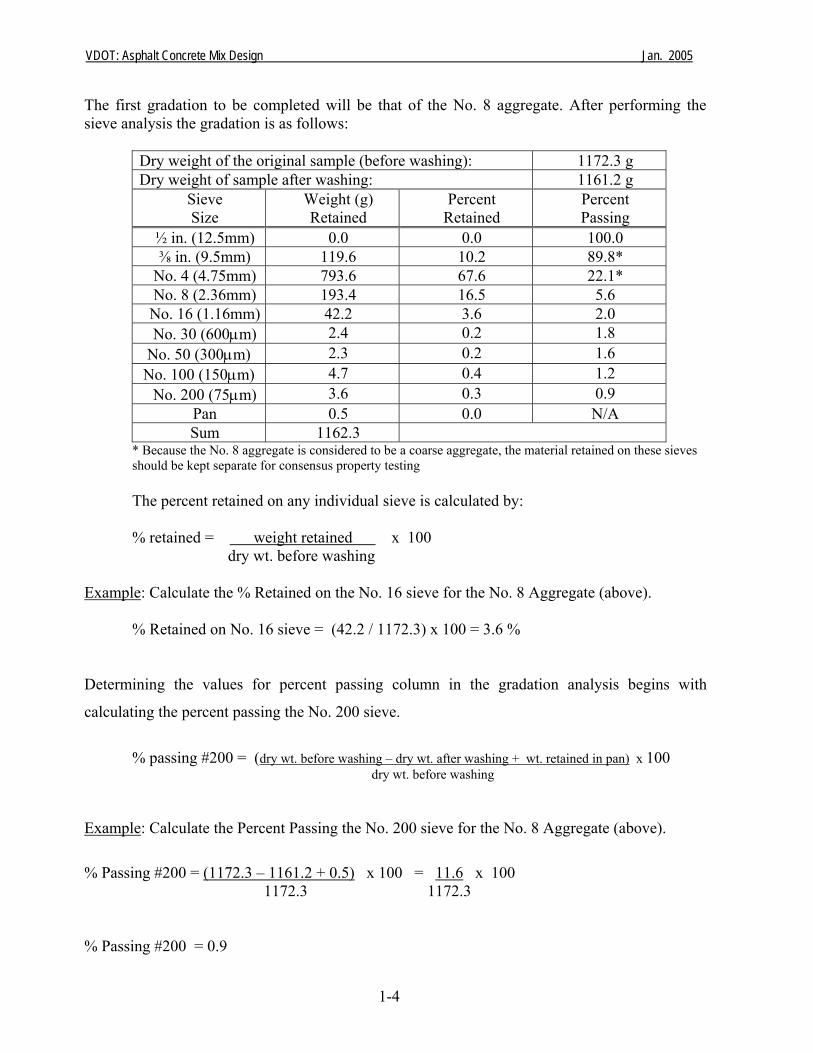
The first gradation to be completed will be that of the No. 8 aggregate. After performing the sieve analysis the gradation is as follows:
Dry weight of the original sample (before washing): 1172.3 g Dry weight of sample after washing: 1161.2 g
Sieve Size
Weight (g) Retained
Percent Retained
Percent Passing
½ in. (12.5mm) 0.0 0.0 100.0 ⅜ in. (9.5mm) 119.6 10.2 89.8*
No. 4 (4.75mm) 793.6 67.6 22.1* No. 8 (2.36mm) 193.4 16.5 5.6 No. 16 (1.16mm) 42.2 3.6 2.0 No. 30 (600μm) 2.4 0.2 1.8
No. 50 (300μm) 2.3 0.2 1.6 No. 100 (150μm) 4.7 0.4 1.2
No. 200 (75μm) 3.6 0.3 0.9 Pan 0.5 0.0 N/A Sum 1162.3
* Because the No. 8 aggregate is considered to be a coarse aggregate, the material retained on these sieves should be kept separate for consensus property testing
The percent retained on any individual sieve is calculated by:
% retained = weight retained x 100 dry wt. before washing Example: Calculate the % Retained on the No. 16 sieve for the No. 8 Aggregate (above). % Retained on No. 16 sieve = (42.2 / 1172.3) x 100 = 3.6 % Determining the values for percent passing column in the gradation analysis begins with
calculating the percent passing the No. 200 sieve.
% passing #200 = (dry wt. before washing – dry wt. after washing + wt. retained in pan) x 100 dry wt. before washing Example: Calculate the Percent Passing the No. 200 sieve for the No. 8 Aggregate (above).
% Passing #200 = (1172.3 – 1161.2 + 0.5) x 100 = 11.6 x 100 1172.3 1172.3 % Passing #200 = 0.9
VDOT: Asphalt Concrete Mix Design Jan. 2005
1-5
Calculating the Percent Passing for other sieves is done by adding the Percent Retained and
Percent Passing values for the sieve below it in the analysis table.
Example: Find the % Passing for the No. 100 sieve for the No. 8 aggregate (above). % passing #100 = % retained on #200 + % passing #200 = 0.3 + 0.9 = 1.2 Example: Find the % Passing for the No. 4 sieve for the No. 8 aggregate (above). % Passing #4 = % retained on #8 + % passing #8 = 16.5 + 5.6
= 22.1 Next, complete a gradation on the two fine aggregate sources and the bag house fines.
Calculating the percent retained and percent passing on these materials follows the procedure
just shown for the No. 8 aggregate.
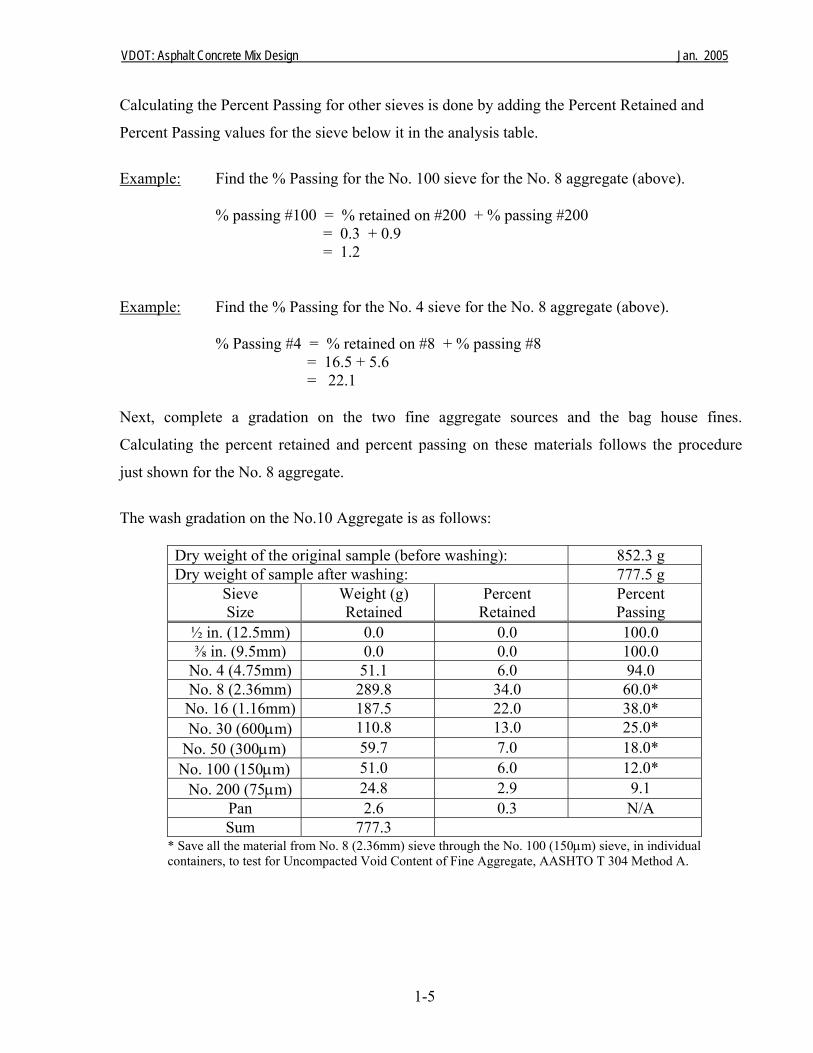
The wash gradation on the No.10 Aggregate is as follows:
Dry weight of the original sample (before washing): 852.3 g Dry weight of sample after washing: 777.5 g
Sieve Size
Weight (g) Retained
Percent Retained
Percent Passing
½ in. (12.5mm) 0.0 0.0 100.0 ⅜ in. (9.5mm) 0.0 0.0 100.0
No. 4 (4.75mm) 51.1 6.0 94.0 No. 8 (2.36mm) 289.8 34.0 60.0* No. 16 (1.16mm) 187.5 22.0 38.0* No. 30 (600μm) 110.8 13.0 25.0*
No. 50 (300μm) 59.7 7.0 18.0* No. 100 (150μm) 51.0 6.0 12.0*
No. 200 (75μm) 24.8 2.9 9.1 Pan 2.6 0.3 N/A Sum 777.3
* Save all the material from No. 8 (2.36mm) sieve through the No. 100 (150μm) sieve, in individual containers, to test for Uncompacted Void Content of Fine Aggregate, AASHTO T 304 Method A.
VDOT: Asphalt Concrete Mix Design Jan. 2005
1-6
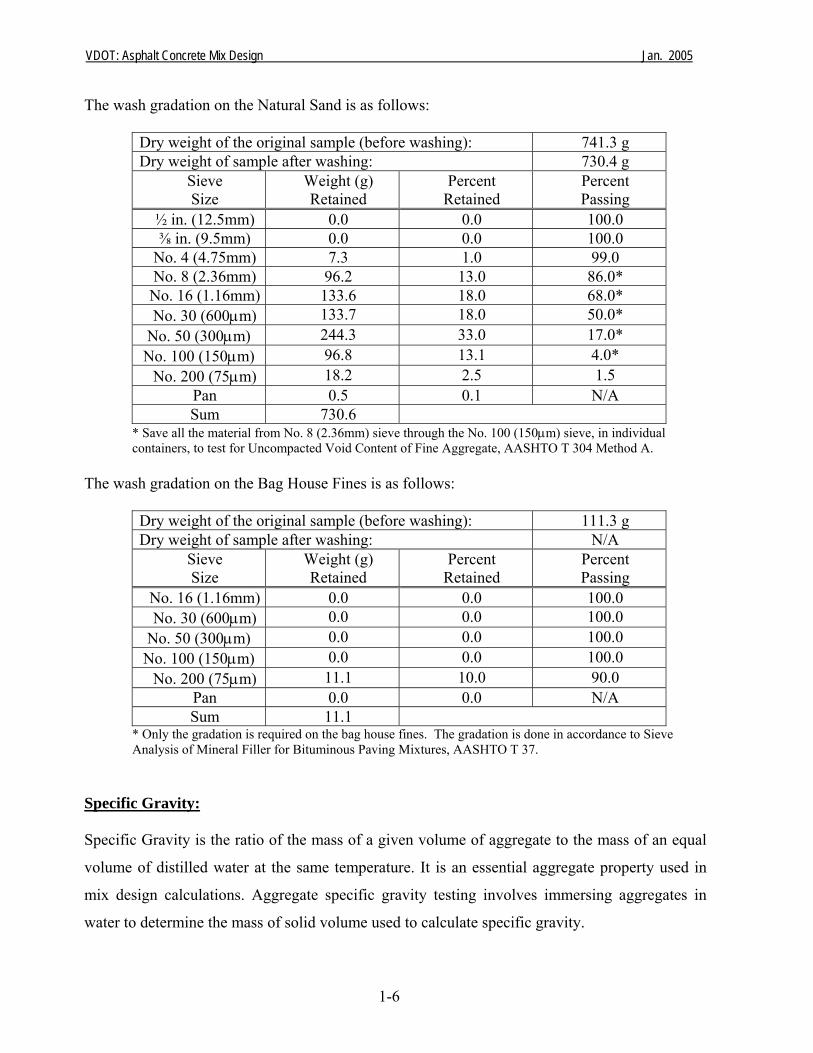
The wash gradation on the Natural Sand is as follows:
Dry weight of the original sample (before washing): 741.3 g Dry weight of sample after washing: 730.4 g
Sieve Size
Weight (g) Retained
Percent Retained
Percent Passing
½ in. (12.5mm) 0.0 0.0 100.0 ⅜ in. (9.5mm) 0.0 0.0 100.0
No. 4 (4.75mm) 7.3 1.0 99.0 No. 8 (2.36mm) 96.2 13.0 86.0* No. 16 (1.16mm) 133.6 18.0 68.0* No. 30 (600μm) 133.7 18.0 50.0*
No. 50 (300μm) 244.3 33.0 17.0* No. 100 (150μm) 96.8 13.1 4.0*
No. 200 (75μm) 18.2 2.5 1.5 Pan 0.5 0.1 N/A Sum 730.6
* Save all the material from No. 8 (2.36mm) sieve through the No. 100 (150μm) sieve, in individual containers, to test for Uncompacted Void Content of Fine Aggregate, AASHTO T 304 Method A.
The wash gradation on the Bag House Fines is as follows:
Dry weight of the original sample (before washing): 111.3 g Dry weight of sample after washing: N/A
Sieve Size
Weight (g) Retained
Percent Retained
Percent Passing
No. 16 (1.16mm) 0.0 0.0 100.0 No. 30 (600μm) 0.0 0.0 100.0
No. 50 (300μm) 0.0 0.0 100.0 No. 100 (150μm) 0.0 0.0 100.0
No. 200 (75μm) 11.1 10.0 90.0 Pan 0.0 0.0 N/A Sum 11.1
* Only the gradation is required on the bag house fines. The gradation is done in accordance to Sieve Analysis of Mineral Filler for Bituminous Paving Mixtures, AASHTO T 37.
Specific Gravity: Specific Gravity is the ratio of the mass of a given volume of aggregate to the mass of an equal
volume of distilled water at the same temperature. It is an essential aggregate property used in
mix design calculations. Aggregate specific gravity testing involves immersing aggregates in
water to determine the mass of solid volume used to calculate specific gravity.
VDOT: Asphalt Concrete Mix Design Jan. 2005
1-7
The various tests for aggregate specific gravity are:
Material Test Procedure Coarse Aggregate AASHTO T 85 Fine Aggregate AASHTO T 84 Mineral Filler (Bag House Fines) AASHTO T 100
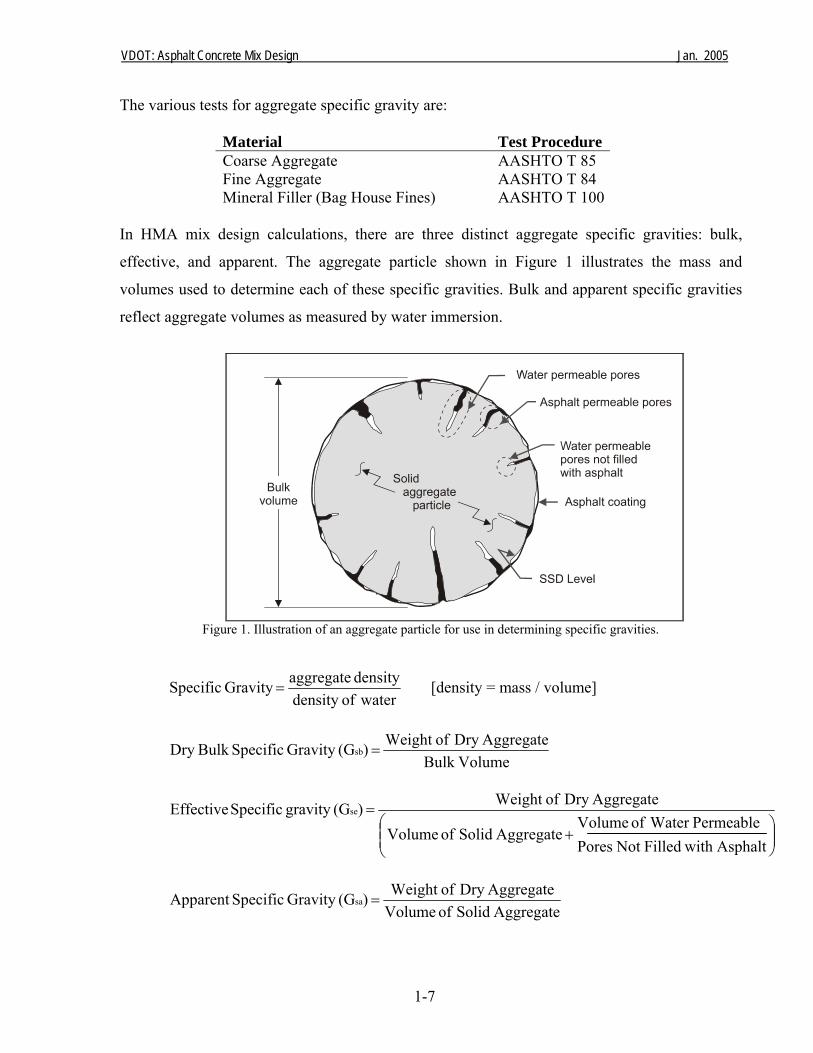
In HMA mix design calculations, there are three distinct aggregate specific gravities: bulk,
effective, and apparent. The aggregate particle shown in Figure 1 illustrates the mass and
volumes used to determine each of these specific gravities. Bulk and apparent specific gravities
reflect aggregate volumes as measured by water immersion.
Figure 1. Illustration of an aggregate particle for use in determining specific gravities.
waterofdensity density aggregate Gravity Specific = [density = mass / volume]
VolumeBulk
AggregateDry ofWeight )(GGravity SpecificBulk Dry sb =
⎜⎜⎝
⎛⎟⎟⎠
⎞+
=
Asphalt with FilledNot Pores Permeable Water of Volume
Aggregate Solid of Volume
AggregateDry ofWeight )(Ggravity Specific Effective se
Aggregate Solid of VolumeAggregateDry ofWeight )(GGravity SpecificApparent sa =
VDOT: Asphalt Concrete Mix Design Jan. 2005
1-8
Bulk specific gravity includes the entire aggregate volume including solid volume and the
volume of pores that are permeable (filled with water). The bulk volume is the largest aggregate
volume measured. Thus, the bulk specific gravity is, numerically, the lowest among the three.
Apparent specific gravity only includes the solid aggregate volume. It does not include the
volume of water permeable pores. Since its volume is the smallest, apparent specific gravity is,
numerically, the largest specific gravity.
Effective specific gravity is not measured by immersing aggregate in water. Instead, it is
determined during the mix design phase based on properties of a voidless asphalt and aggregate
mixture (maximum theoretical specific gravity). The effective volume is the solid aggregate
volume and the volume of pores that are not permeable to liquid asphalt. Thus, effective specific
gravity recognizes the difference between water and asphalt permeable pores and is a very
important property. Because the volume is between the bulk and apparent volumes, the effective
specific gravity is, numerically, between these two values.
Specific Gravity and Absorption of Coarse Aggregate (AASHTO T 85) The coarse aggregate material should be sampled, oven-dried, and reduced to testing size in
accordance with AASHTO procedures (AASHTO T 2 and T 248). Once you have your
representative sample of material the first step is to wash the sample over the No. 4 sieve. This
can be done in one step or by dry sieving and then washing all the +4 material.
NOTE: IF AN AGGREGATE SOURCE HAS A LARGE QUANTITY OF MATERIAL RETAINED ON THE NO. 8 SIEVE,
THAT MATERIAL MAY BE INCLUDED IN THE COARSE AGGREGATE SPECIFIC GRAVITY.
Next, immerse the washed sample in water for 15 to 19 hours. Remove the sample from the
water and roll in a towel until all visible films of water are removed. Take care not to remove
water from the pores in the aggregate. Weigh the sample in this Saturated Surface Dry (SSD)
condition. Immediately place the SSD sample in a basket and immerse in a water bath for 10
minutes and then record the weight. Remove the sample from the basket (return basket to the
water bath and record its weight in water) and place the sample in an oven to dry. Allow the
sample to cool, and then record dry sample weight.
VDOT: Asphalt Concrete Mix Design Jan. 2005
1-9
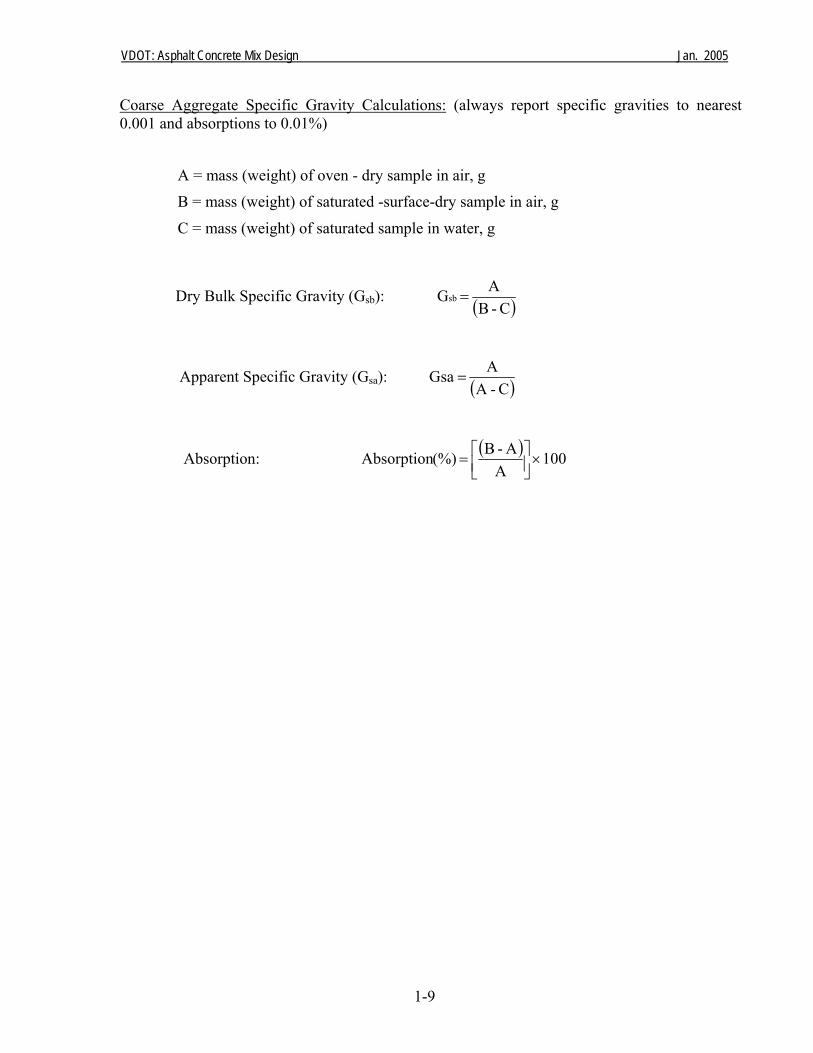
Coarse Aggregate Specific Gravity Calculations: (always report specific gravities to nearest 0.001 and absorptions to 0.01%)
Dry Bulk Specific Gravity (Gsb): ( )C - BA Gsb =
Apparent Specific Gravity (Gsa): ( )C-AA Gsa =
Absorption: ( ) 100 A
A-B (%)Absorption ×⎥⎦⎤
⎢⎣⎡=
A = mass (weight) of oven - dry sample in air, g
B = mass (weight) of saturated -surface-dry sample in air, g
C = mass (weight) of saturated sample in water, g
VDOT: Asphalt Concrete Mix Design Jan. 2005
1-10
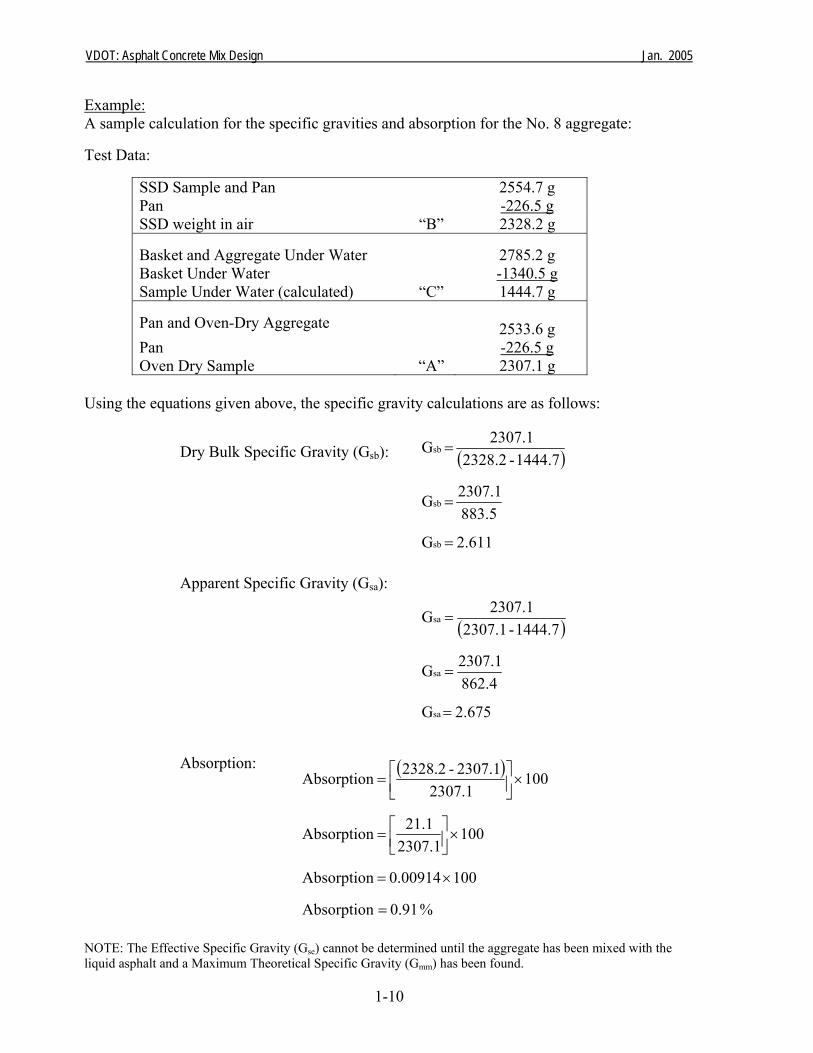
Example: A sample calculation for the specific gravities and absorption for the No. 8 aggregate: Test Data:
SSD Sample and Pan 2554.7 g Pan -226.5 g SSD weight in air “B” 2328.2 g Basket and Aggregate Under Water
2785.2 g
Basket Under Water -1340.5 g Sample Under Water (calculated) “C” 1444.7 g Pan and Oven-Dry Aggregate
2533.6 g
Pan -226.5 g Oven Dry Sample “A” 2307.1 g
Using the equations given above, the specific gravity calculations are as follows: Dry Bulk Specific Gravity (Gsb):
Apparent Specific Gravity (Gsa):
Absorption:
NOTE: The Effective Specific Gravity (Gse) cannot be determined until the aggregate has been mixed with the liquid asphalt and a Maximum Theoretical Specific Gravity (Gmm) has been found.
( )
2.611 G
883.52307.1 G
1444.7 - 2328.22307.1 G
sb
sb
sb
=
=
=
( )
2.675G
862.42307.1 G
1444.7-2307.12307.1 G
sa
sa
sa
=
=
=
( )
% 0.91 Absorption
100 0.00914 Absorption
100 2307.1
21.1 Absorption
100 2307.1
2307.1 - 2328.2 Absorption
=
×=
×⎥⎦⎤
⎢⎣⎡=
×⎥⎦⎤
⎢⎣⎡=
VDOT: Asphalt Concrete Mix Design Jan. 2005
1-11
Specific Gravity and Absorption of Fine Aggregate (AASHTO T84) The fine aggregate material should be sampled, oven-dried, and reduced to testing size in
accordance with AASHTO procedures (T 2 and T 248). For a fine aggregate specific gravity test
we will need approximately 1000g of -4 material. The sample should always be sieved through
the No. 4 sieve to ensure all the coarse material has been removed. The sample is first immersed
in water for 15 to 19 hours.
After the sample has been soaked for 15 to 19 hours pour off the excess water with care not to
loose any fines. In order to continue to remove the water to test for the Saturated-Surface-Dry
(SSD) condition, the sample should be exposed to a gentle flow of warm air, stirring frequently
to ensure even drying throughout the sample.
The SSD condition of the sample is measured by means of a cone and tamp test. The cone is
placed on a smooth, flat, firm, and nonabsorbent surface. The cone is loaded to overflowing with
the sample. Then apply 25 drops with a tamper at a height of 0.2 in. (5mm) from the surface of
the sample. Adjust the starting height for the tamper to the new surface elevation after each drop
and distribute the drops over the available sample surface.
Remove the cone and visually inspect the sample to determine if a slight slump has occurred. If
there is a slight slump then the sample is determined to be at the SSD condition.
Defining “slight slump”: VDOT has adopted a procedure for judging when the SSD condition
has been reached in this test. This is not given in the test specification (AASHTO T 84). The
SSD condition is reached when the cone of aggregate slumps leaving a central column of
aggregate still standing that is between 5/8” and 1” in diameter. The tamper used in this test is
about 1” in diameter on the bottom and 5/8” diameter at the top making it a good reference.
If the cone test slumps too little – that is, the column of aggregate still standing is larger than 1”
in diameter - the aggregate is still too moist. Allow the material to continue drying and repeat the
cone test until the SSD condition is reached. (The full specification (AASHTO T 84) gives
alternative ways to determine the SSD condition for materials that do not readily slump.)
VDOT: Asphalt Concrete Mix Design Jan. 2005
1-12
If the cone test slumps too much – the column of aggregate still standing is less than 5/8” in
diameter - the sample is too dry. It should be moistened, covered and then set aside for 30
minutes to allow for re-absorption. After 30 minutes, resume the cone and tamp test to
determine the SSD condition.
Once SSD condition has been reached immediately weigh 500 ± 10 grams into a separate
container. Then partially fill a pycnometer with water and carefully add the SSD sample. Fill the
pycnometer slightly below the calibration mark with water. Remove all entrapped air (i.e. air
bubbles) and continue to fill with water to the calibration mark. Adjust sample temperature to
73.4°F ±3° before weighing. This can be achieved by using a water bath. Weigh the
pycnometer, with SSD sample, and water. Record the total weight of the pycnometer, SSD
sample and water.
Remove sample from pycnometer and place in pan. Place the pan with sample in an oven and
dry to a constant weight. Once dry, remove from the oven and allow it to cool to room
temperature for 1.0± 0.5 hours, then record the mass of the sample. Fine Aggregate Specific Gravity Calculations: (always report specific gravity to nearest 0.001 and absorption to 0.01%)
g sample,dry -surface-saturated of (weight) mass Sg mark,n calibratio water toand sample with pycnometer of (weight) mass C
g mark,n calibratio water todistilled with filled pycnometer of (weight) mass Bg air,in specimen dry -oven of (weight) mass A
====
Dry Bulk Specific Gravity (Gsb): ( )C- S BA Gsb+
=
Apparent Specific Gravity (Gsa): ( )C-A BA Gsa+
=
Absorption:
( ) 100 A
A - S (%) Absorption ×⎥⎦⎤
⎢⎣⎡=
VDOT: Asphalt Concrete Mix Design Jan. 2005
1-13
Example: A sample calculation for the specific gravities and absorption for the No. 10 aggregate: Test Data:
SSD Sample and Pan 652.6 g Pan -152.6 g SSD weight in air “S” 500.0 g Pycnometer with Sample and Water “C” 1571.5 g Pycnometer with Water to calibration mark “B” 1260.2 g Pan and Oven-Dry Aggregate 981.5 g Pan -486.4 g Oven Dry Sample “A” 495.1 g
Dry Bulk Specific Gravity (Gsb): Apparent Specific Gravity (Gsa):
Absorption: Now that all our gradations and specific gravities are complete we can proceed with the other
Consensus Property tests on our aggregates. From each gradation we have fractionated materials
that need testing: The No. 8 material requires a Flat and Elongated analysis on the 3/8 in. and
No. 4 sized particles, and both the natural sand and No. 10 (quarry dust) require a Fine
Aggregate Angularity measurement.
( )
2.624G188.7495.1 G
1571.5 - 500.0 1260.2495.1 G
sb
sb
sb
=
=
+=
( )
2.694G183.8495.1 G
1571.5 - 495.1 1260.2495.1 G
sa
sa
sa
=
=
+=
( )
% .99 Absorption100 0.00989 Absorption
100 495.14.9 Absorption
100 495.1
495.1 - 500.0 Absorption
=×=
×⎥⎦⎤
⎢⎣⎡=
×⎥⎦⎤
⎢⎣⎡=
VDOT: Asphalt Concrete Mix Design Jan. 2005
1-14
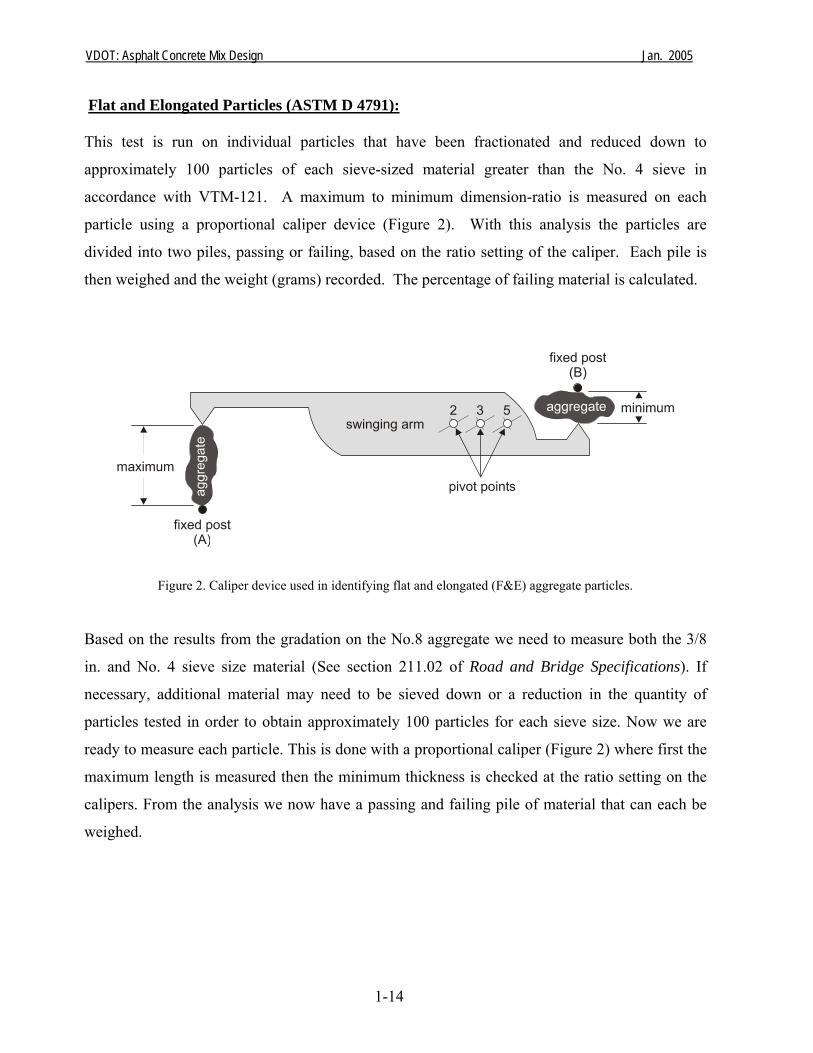
Flat and Elongated Particles (ASTM D 4791): This test is run on individual particles that have been fractionated and reduced down to
approximately 100 particles of each sieve-sized material greater than the No. 4 sieve in
accordance with VTM-121. A maximum to minimum dimension-ratio is measured on each
particle using a proportional caliper device (Figure 2). With this analysis the particles are
divided into two piles, passing or failing, based on the ratio setting of the caliper. Each pile is
then weighed and the weight (grams) recorded. The percentage of failing material is calculated.
Figure 2. Caliper device used in identifying flat and elongated (F&E) aggregate particles. Based on the results from the gradation on the No.8 aggregate we need to measure both the 3/8
in. and No. 4 sieve size material (See section 211.02 of Road and Bridge Specifications). If
necessary, additional material may need to be sieved down or a reduction in the quantity of
particles tested in order to obtain approximately 100 particles for each sieve size. Now we are
ready to measure each particle. This is done with a proportional caliper (Figure 2) where first the
maximum length is measured then the minimum thickness is checked at the ratio setting on the
calipers. From the analysis we now have a passing and failing pile of material that can each be
weighed.
VDOT: Asphalt Concrete Mix Design Jan. 2005
1-15
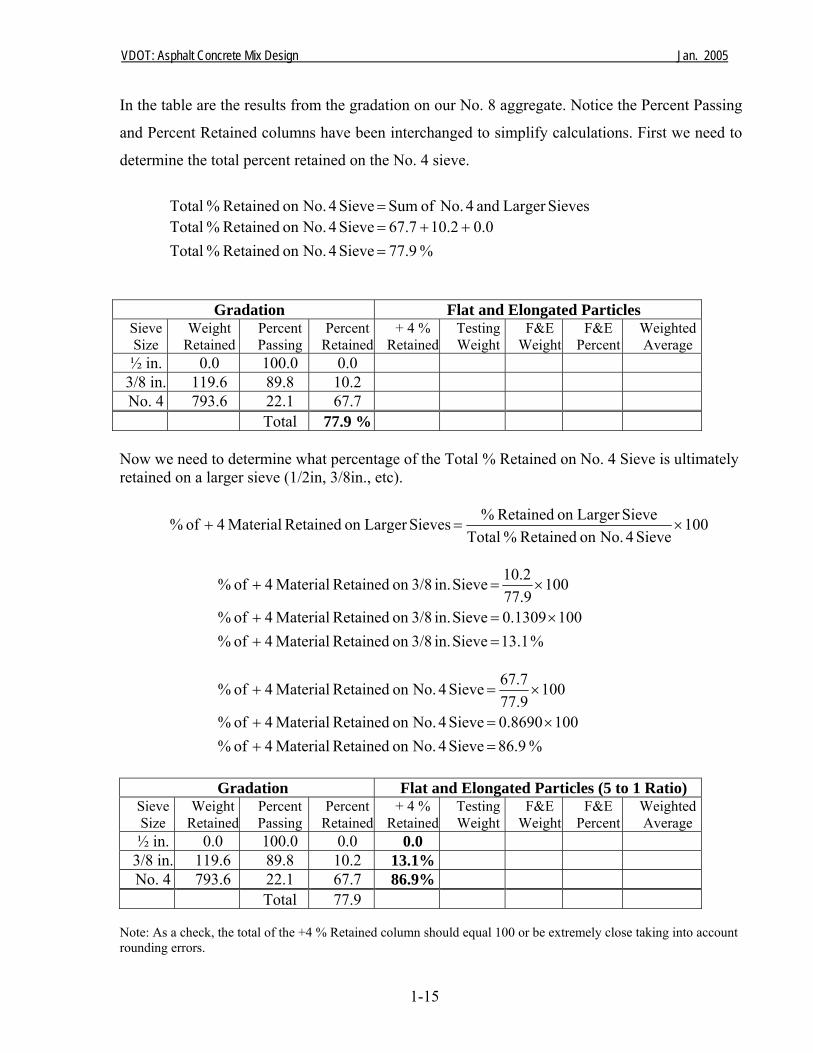
In the table are the results from the gradation on our No. 8 aggregate. Notice the Percent Passing
and Percent Retained columns have been interchanged to simplify calculations. First we need to
determine the total percent retained on the No. 4 sieve.
SievesLarger and 4 No. of Sum Sieve 4 No.on Retained % Total =
% 77.9 Sieve 4 No.on Retained % Total
0.0 10.2 67.7 Sieve 4 No.on Retained % Total=
++=
Gradation Flat and Elongated Particles Sieve Size
Weight Retained
Percent Passing
PercentRetained
+ 4 % Retained
TestingWeight
F&E Weight
F&E Percent
WeightedAverage
½ in. 0.0 100.0 0.0 3/8 in. 119.6 89.8 10.2 No. 4 793.6 22.1 67.7
Total 77.9 % Now we need to determine what percentage of the Total % Retained on No. 4 Sieve is ultimately retained on a larger sieve (1/2in, 3/8in., etc).
100 Sieve 4 No.on Retained%Total
SieveLarger on Retained % SievesLarger on Retained Material 4 of % ×=+
% 13.1 Sieve in. 3/8on Retained Material 4 of %100 0.1309 Sieve in. 3/8on Retained Material 4 of %
100 77.910.2 Sieve in. 3/8on Retained Material 4 of %
=+×=+
×=+
% 86.9 Sieve 4 No.on Retained Material 4 of %100 0.8690 Sieve 4 No.on Retained Material 4 of %
100 77.967.7 Sieve 4 No.on Retained Material 4 of %
=+×=+
×=+
Note: As a check, the total of the +4 % Retained column should equal 100 or be extremely close taking into account rounding errors.
Gradation Flat and Elongated Particles (5 to 1 Ratio) Sieve Size
Weight Retained
Percent Passing
PercentRetained
+ 4 % Retained
TestingWeight
F&E Weight
F&E Percent
WeightedAverage
½ in. 0.0 100.0 0.0 0.0 3/8 in. 119.6 89.8 10.2 13.1% No. 4 793.6 22.1 67.7 86.9%
Total 77.9
VDOT: Asphalt Concrete Mix Design Jan. 2005
1-16
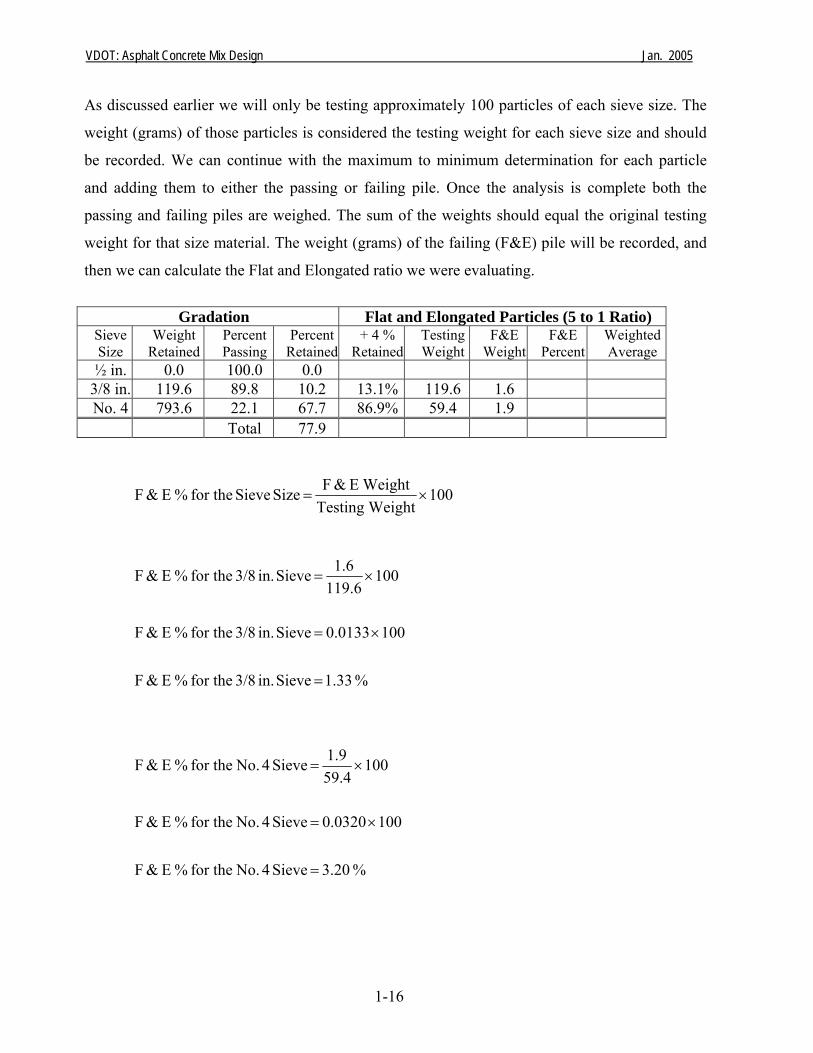
As discussed earlier we will only be testing approximately 100 particles of each sieve size. The
weight (grams) of those particles is considered the testing weight for each sieve size and should
be recorded. We can continue with the maximum to minimum determination for each particle
and adding them to either the passing or failing pile. Once the analysis is complete both the
passing and failing piles are weighed. The sum of the weights should equal the original testing
weight for that size material. The weight (grams) of the failing (F&E) pile will be recorded, and
then we can calculate the Flat and Elongated ratio we were evaluating.
Gradation Flat and Elongated Particles (5 to 1 Ratio)
Sieve Size
Weight Retained
Percent Passing
PercentRetained
+ 4 % Retained
TestingWeight
F&E Weight
F&E Percent
WeightedAverage
½ in. 0.0 100.0 0.0 3/8 in. 119.6 89.8 10.2 13.1% 119.6 1.6 No. 4 793.6 22.1 67.7 86.9% 59.4 1.9
Total 77.9
100 WeightTesting
WeightE&F Size Sieve for the % E&F ×=
% 1.33 Sieve in. 3/8 for the % E&F
100 0.0133 Sieve in. 3/8 for the % E&F
100 119.61.6 Sieve in. 3/8 for the % E&F
=
×=
×=
% 3.20 Sieve 4 No. for the % E&F
100 0.0320 Sieve 4 No. for the % E&F
100 59.41.9 Sieve 4 No. for the % E&F
=
×=
×=
VDOT: Asphalt Concrete Mix Design Jan. 2005
1-17
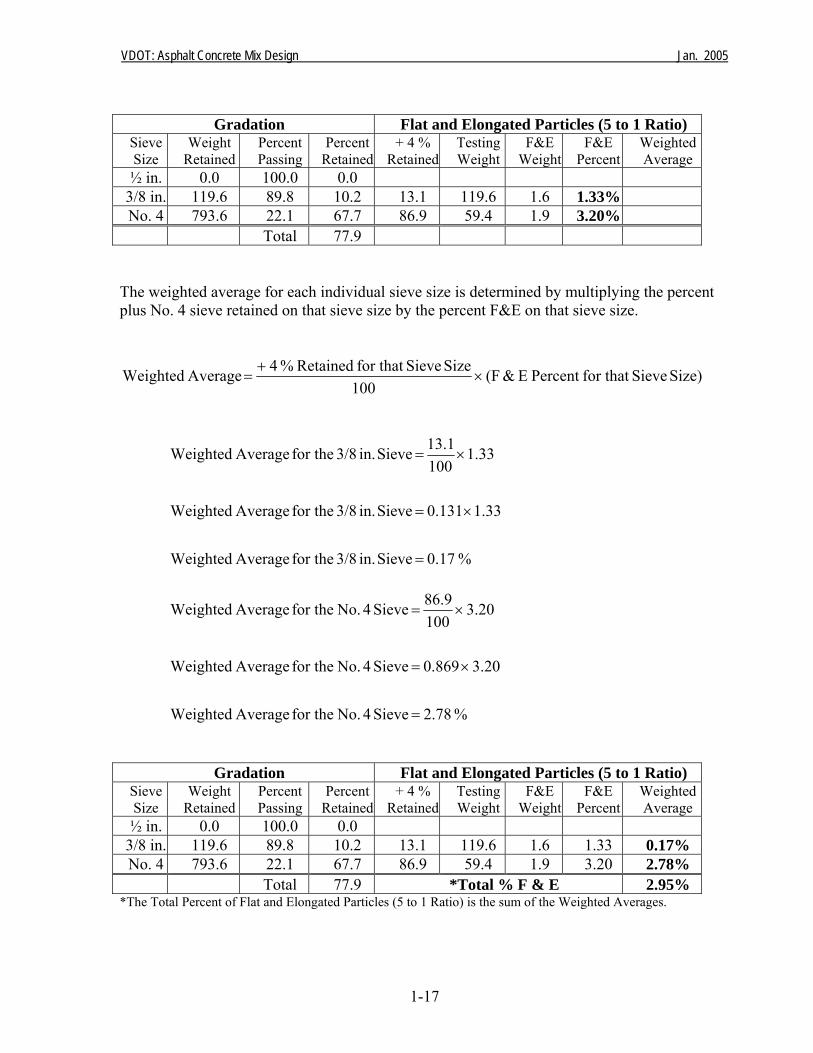
The weighted average for each individual sieve size is determined by multiplying the percent plus No. 4 sieve retained on that sieve size by the percent F&E on that sieve size.
Size) Sievefor that Percent E&(F 100
Size Sievefor that Retained % 4 Average Weighted ×+
=
% 0.17 Sieve in. 3/8 for the Average Weighted
1.33 0.131 Sieve in. 3/8 for the Average Weighted
1.33 10013.1 Sieve in. 3/8 for the Average Weighted
=
×=
×=
% 2.78 Sieve 4 No. for the Average Weighted
3.20 0.869 Sieve 4 No. for the Average Weighted
3.20 10086.9 Sieve 4 No. for the Average Weighted
=
×=
×=
Gradation Flat and Elongated Particles (5 to 1 Ratio) Sieve Size
Weight Retained
Percent Passing
PercentRetained
+ 4 % Retained
TestingWeight
F&E Weight
F&E Percent
WeightedAverage
½ in. 0.0 100.0 0.0 3/8 in. 119.6 89.8 10.2 13.1 119.6 1.6 1.33 0.17% No. 4 793.6 22.1 67.7 86.9 59.4 1.9 3.20 2.78%
Total 77.9 *Total % F & E 2.95% *The Total Percent of Flat and Elongated Particles (5 to 1 Ratio) is the sum of the Weighted Averages.
Gradation Flat and Elongated Particles (5 to 1 Ratio) Sieve Size
Weight Retained
Percent Passing
PercentRetained
+ 4 % Retained
TestingWeight
F&E Weight
F&E Percent
WeightedAverage
½ in. 0.0 100.0 0.0 3/8 in. 119.6 89.8 10.2 13.1 119.6 1.6 1.33% No. 4 793.6 22.1 67.7 86.9 59.4 1.9 3.20%
Total 77.9
VDOT: Asphalt Concrete Mix Design Jan. 2005
1-18
Determining the Percentage of Fractured Particles in Coarse Aggregate (ASTM D 5821) This property is normally only tested on gravel sources. If your material is mined from a quarry
where the material has to be blasted before it is crushed there typically is no need to run this test
and you can report 100 percent passing.
Fine Aggregate Angularity (FAA) as determined by: Uncompacted Void Content of Fine Aggregate (AASHTO T 304) - Method A This procedure is intended to give an angularity measurement for fine aggregates. Fine
Aggregate Angularity (FAA) is defined as the percent air voids of loosely compacted aggregate.
The theory behind the FAA test is that uncompacted materials that are angular will produce
greater air voids than rounded materials in the same volume. The fear is that rounded materials
may promote rutting.
From our gradations on the fine aggregate (No.10 and natural sand), each individual sieve size-
sized material should be kept separate for determining FAA. When this material is cleaned out of
the sieves extreme caution should be taken so as to not include any particles that may be
damaged while brushing the sieve.
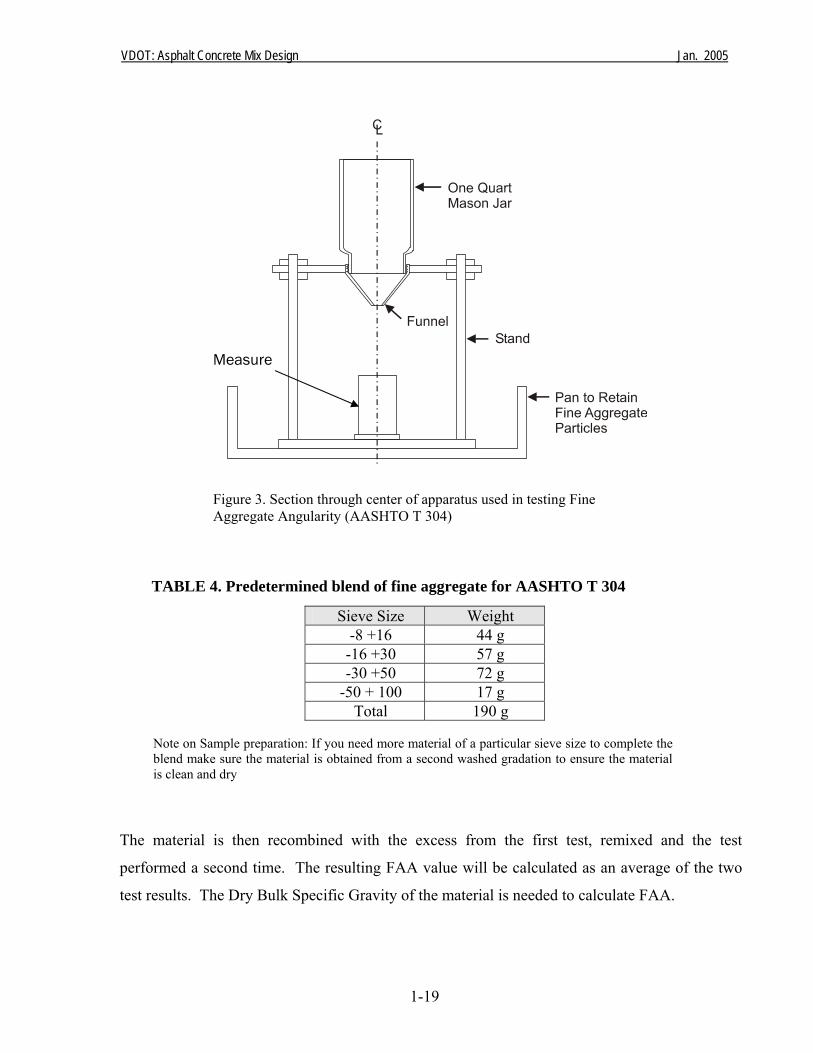
In AASHTO T 304 Method A there is a predetermined blend of particle sizes to be tested (Table
4). Once the materials have been blended they need to be mixed with a spatula until they appear
homogenous but careful not to damage any particles in the process. This blend of materials is
then loaded into the funnel, leveled off with a spatula, and allowed to fall freely into the measure
(Figure 3). Without any vibration the measure is struck off with one smooth pass of the spatula.
The outside of the measure is brushed clean and then weighed.
VDOT: Asphalt Concrete Mix Design Jan. 2005
1-19
TABLE 4. Predetermined blend of fine aggregate for AASHTO T 304
The material is then recombined with the excess from the first test, remixed and the test
performed a second time. The resulting FAA value will be calculated as an average of the two
test results. The Dry Bulk Specific Gravity of the material is needed to calculate FAA.
Sieve Size Weight -8 +16 44 g -16 +30 57 g -30 +50 72 g
-50 + 100 17 g Total 190 g
Measure
Figure 3. Section through center of apparatus used in testing Fine Aggregate Angularity (AASHTO T 304)
Note on Sample preparation: If you need more material of a particular sieve size to complete the blend make sure the material is obtained from a second washed gradation to ensure the material is clean and dry
VDOT: Asphalt Concrete Mix Design Jan. 2005
1-20
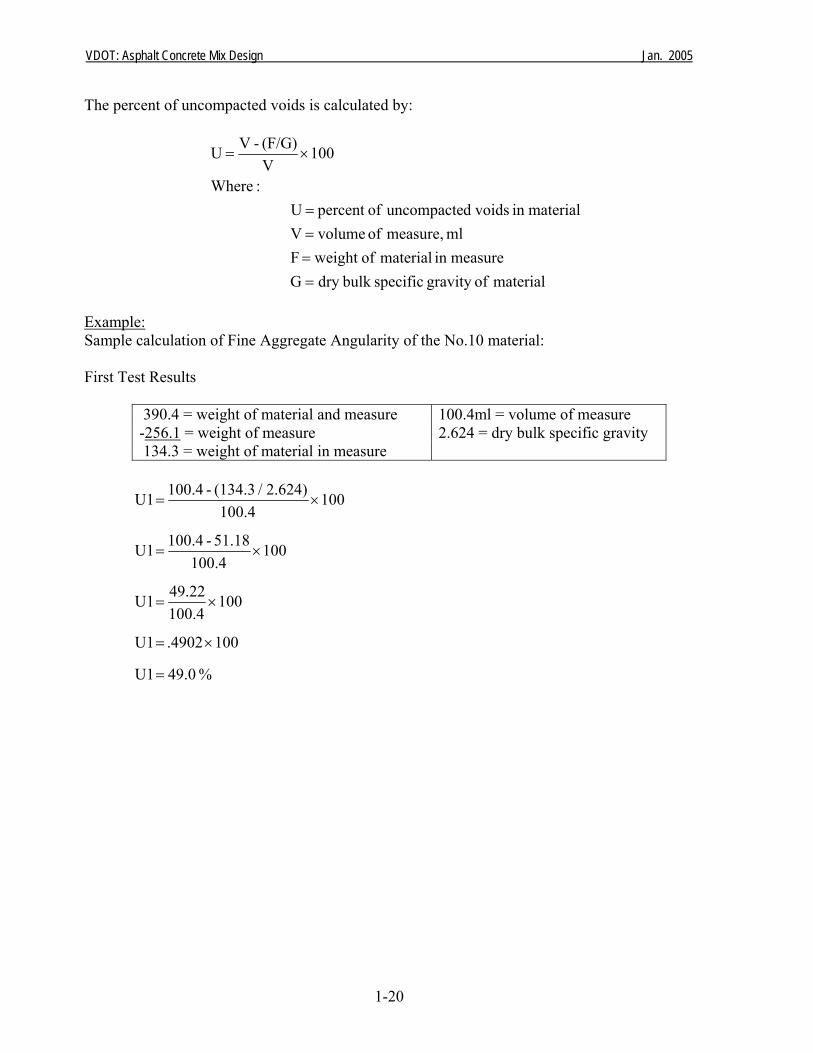
The percent of uncompacted voids is calculated by:
material ofgravity specificbulk dry G measurein material of weight F
ml measure, of volume V materialin voidsduncompacte ofpercent U
:Where
100 V(F/G) - V U
====
×=
Example: Sample calculation of Fine Aggregate Angularity of the No.10 material: First Test Results
390.4 = weight of material and measure 100.4ml = volume of measure -256.1 = weight of measure 2.624 = dry bulk specific gravity 134.3 = weight of material in measure
% 49.0 U1
100 .4902 U1
100 100.449.22 U1
100 100.4
51.18 - 100.4 U1
100 100.4
2.624) / (134.3 - 100.4 U1
=
×=
×=
×=
×=
VDOT: Asphalt Concrete Mix Design Jan. 2005
1-21
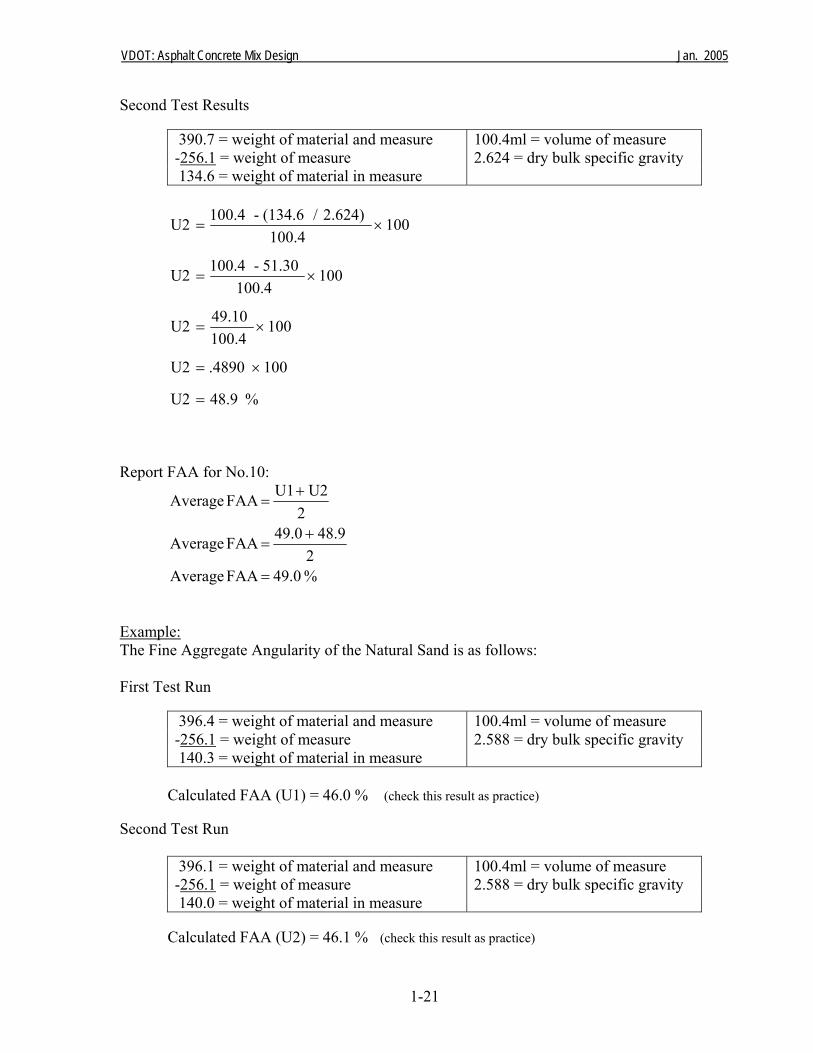
Second Test Results
390.7 = weight of material and measure 100.4ml = volume of measure -256.1 = weight of measure 2.624 = dry bulk specific gravity 134.6 = weight of material in measure
% 48.9 U2
100 .4890 U2
100 100.449.10 U2
100 100.4
51.30 - 100.4 U2
100 100.4
2.624) / (134.6 - 100.4 U2
=
×=
×=
×=
×=
Report FAA for No.10:
% 49.0 FAA Average2
48.9 49.0 FAA Average
2 U2 U1 FAA Average
=
+=
+=
Example: The Fine Aggregate Angularity of the Natural Sand is as follows: First Test Run
396.4 = weight of material and measure 100.4ml = volume of measure -256.1 = weight of measure 2.588 = dry bulk specific gravity 140.3 = weight of material in measure
Calculated FAA (U1) = 46.0 % (check this result as practice) Second Test Run
396.1 = weight of material and measure 100.4ml = volume of measure -256.1 = weight of measure 2.588 = dry bulk specific gravity 140.0 = weight of material in measure
Calculated FAA (U2) = 46.1 % (check this result as practice)
VDOT: Asphalt Concrete Mix Design Jan. 2005
1-22
Report FAA for this Natural Sand: Average FAA = (U1 +U2) / 2 Average FAA = (46.0 + 46.1) / 2 = 46.1 Thus, FAA = 46.1% Clay Content as determined by: Sand Equivalent Test (AASHTO T 176) The clay content is important in a mix design because clay will affect bonding of binder to the
aggregates. Clay Content is determined in accordance with “Plastic Fines in Graded Aggregates
and Soils by the Use of the Sand Equivalent Test AASHTO T176”.
The material should be reduced to proper testing size with extreme caution, as any segregation
will affect the test results. The dry sample is then placed on a clean surface and a 3-ounce tin is
filled to overflowing. The material is consolidated and leveled off even with the top of the tin.
Charge the testing cylinder with 4.0 in. of calcium chloride solution and add the test sample. Tap
the bottom of the cylinder several times, sharply, and allow it to stand undisturbed for 10
minutes. After 10 minutes, add the stopper to the top of the cylinder, loosen the material from the bottom,
and load into a mechanical shaker. This will apply the standard shaking action for 45 seconds.
After shaking, set the cylinder upright on the table and remove the stopper. Insert the irrigator
tube down the cylinder and penetrate through the sample in a manner as to promote the fine
materials into suspension above the coarser particles. Allow the cylinder and contents to stand
undisturbed for 20 minutes.
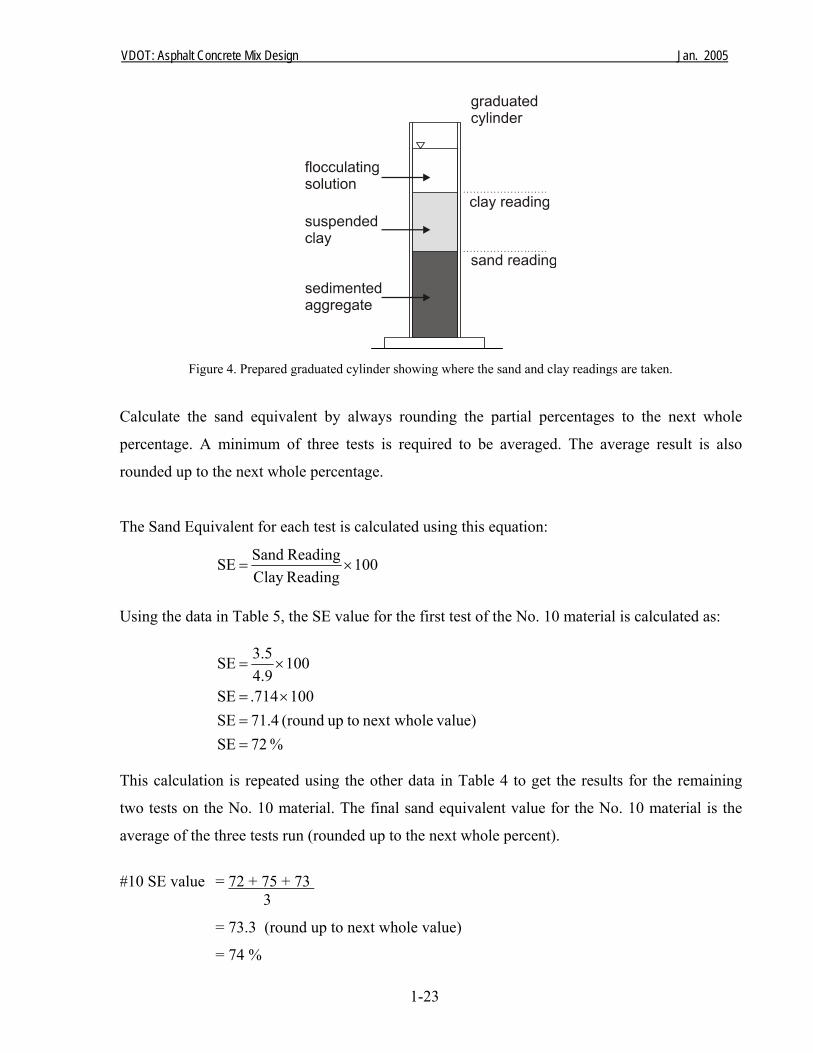
At this time you can take the clay reading at the interface between the clear solution and the
cloudy solution containing suspended fine material. Then insert the weighted foot, which will
penetrate through the suspended clay layer and sit on top of the sediment aggregate layer. The
interface between these two layers is the sand reading (Figure 4).
VDOT: Asphalt Concrete Mix Design Jan. 2005
1-23
Figure 4. Prepared graduated cylinder showing where the sand and clay readings are taken. Calculate the sand equivalent by always rounding the partial percentages to the next whole
percentage. A minimum of three tests is required to be averaged. The average result is also
rounded up to the next whole percentage.
The Sand Equivalent for each test is calculated using this equation:
100 ReadingClay Reading Sand SE ×=
Using the data in Table 5, the SE value for the first test of the No. 10 material is calculated as:
% 72 SE value)next whole toup (round 71.4 SE
100 .714 SE
100 4.93.5 SE
==
×=
×=
This calculation is repeated using the other data in Table 4 to get the results for the remaining
two tests on the No. 10 material. The final sand equivalent value for the No. 10 material is the
average of the three tests run (rounded up to the next whole percent).
#10 SE value = 72 + 75 + 73 3
= 73.3 (round up to next whole value)
= 74 %
VDOT: Asphalt Concrete Mix Design Jan. 2005
1-24
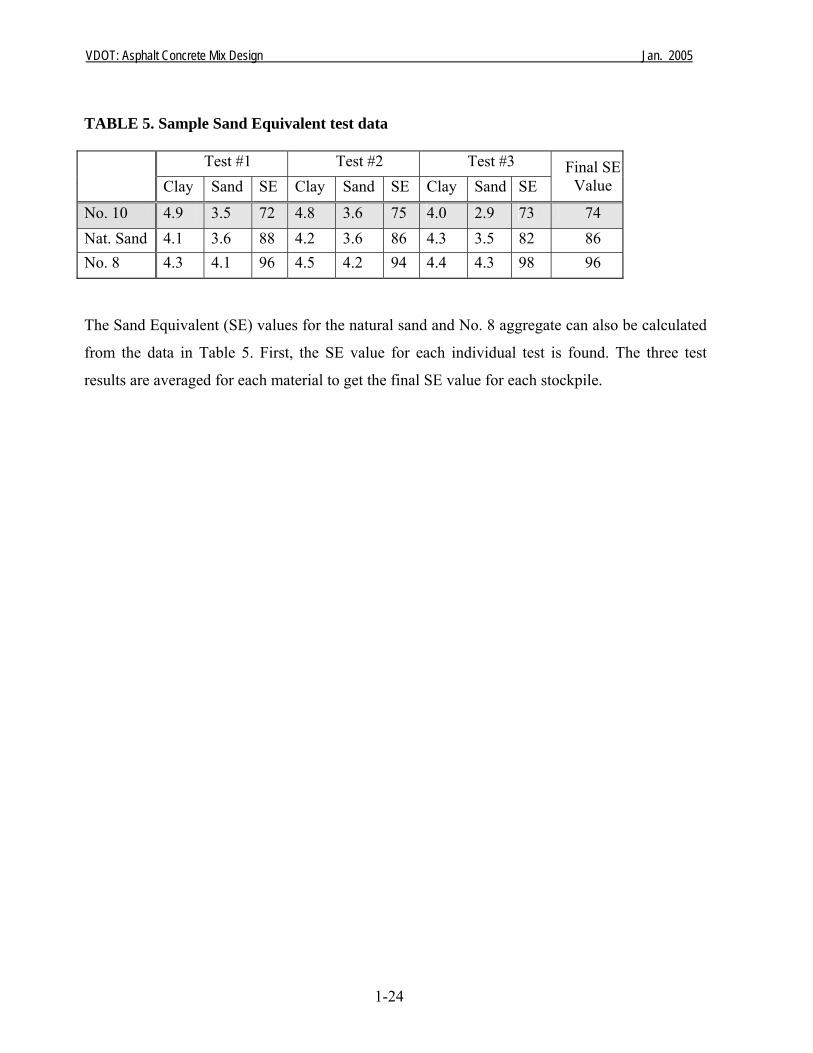
TABLE 5. Sample Sand Equivalent test data
Test #1 Test #2 Test #3 Clay Sand SE Clay Sand SE Clay Sand SE
Final SE Value
No. 10 4.9 3.5 72 4.8 3.6 75 4.0 2.9 73 74 Nat. Sand 4.1 3.6 88 4.2 3.6 86 4.3 3.5 82 86 No. 8 4.3 4.1 96 4.5 4.2 94 4.4 4.3 98 96 The Sand Equivalent (SE) values for the natural sand and No. 8 aggregate can also be calculated
from the data in Table 5. First, the SE value for each individual test is found. The three test
results are averaged for each material to get the final SE value for each stockpile.
VDOT: Asphalt Concrete Mix Design Jan. 2005
2-1
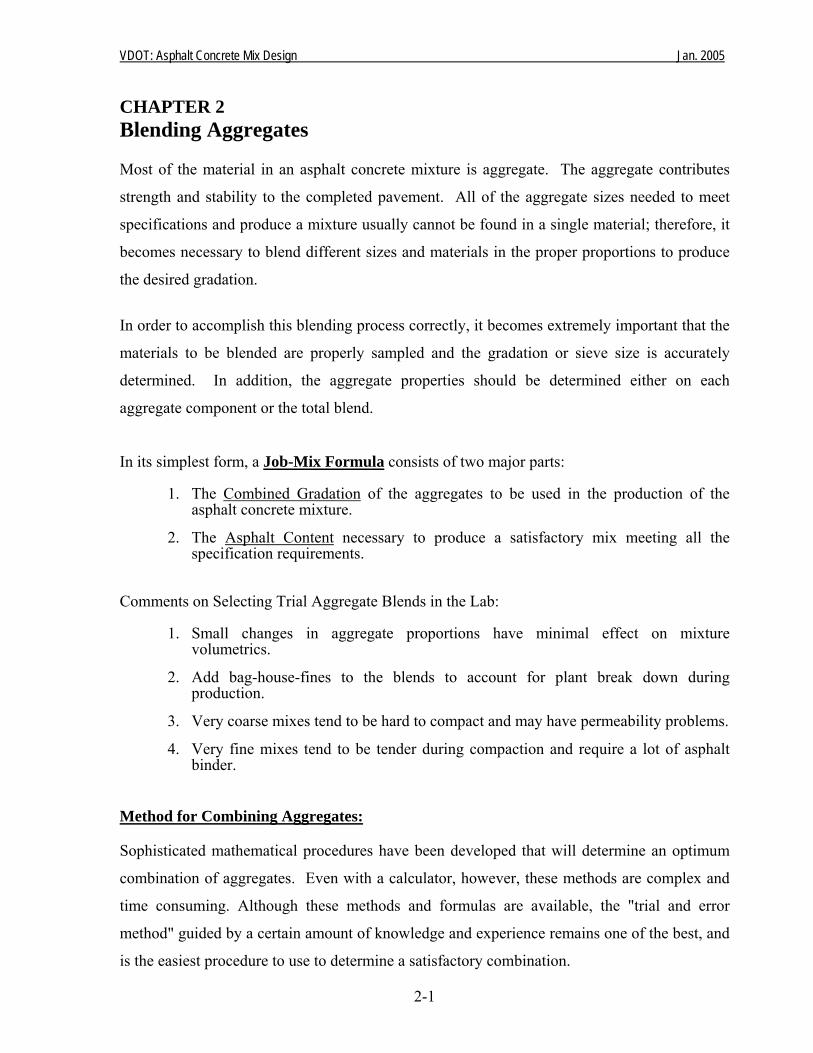
CHAPTER 2 Blending Aggregates Most of the material in an asphalt concrete mixture is aggregate. The aggregate contributes
strength and stability to the completed pavement. All of the aggregate sizes needed to meet
specifications and produce a mixture usually cannot be found in a single material; therefore, it
becomes necessary to blend different sizes and materials in the proper proportions to produce
the desired gradation.
In order to accomplish this blending process correctly, it becomes extremely important that the
materials to be blended are properly sampled and the gradation or sieve size is accurately
determined. In addition, the aggregate properties should be determined either on each
aggregate component or the total blend. In its simplest form, a Job-Mix Formula consists of two major parts:
1. The Combined Gradation of the aggregates to be used in the production of the asphalt concrete mixture.
2. The Asphalt Content necessary to produce a satisfactory mix meeting all the
specification requirements. Comments on Selecting Trial Aggregate Blends in the Lab:
1. Small changes in aggregate proportions have minimal effect on mixture volumetrics.
2. Add bag-house-fines to the blends to account for plant break down during
production. 3. Very coarse mixes tend to be hard to compact and may have permeability problems. 4. Very fine mixes tend to be tender during compaction and require a lot of asphalt
binder.
Method for Combining Aggregates: Sophisticated mathematical procedures have been developed that will determine an optimum
combination of aggregates. Even with a calculator, however, these methods are complex and
time consuming. Although these methods and formulas are available, the "trial and error
method" guided by a certain amount of knowledge and experience remains one of the best, and
is the easiest procedure to use to determine a satisfactory combination.
VDOT: Asphalt Concrete Mix Design Jan. 2005
There are multiple software programs available to assist with this process. These programs will
automate the mathematical calculations required to blend the individual aggregate gradations
and properties.
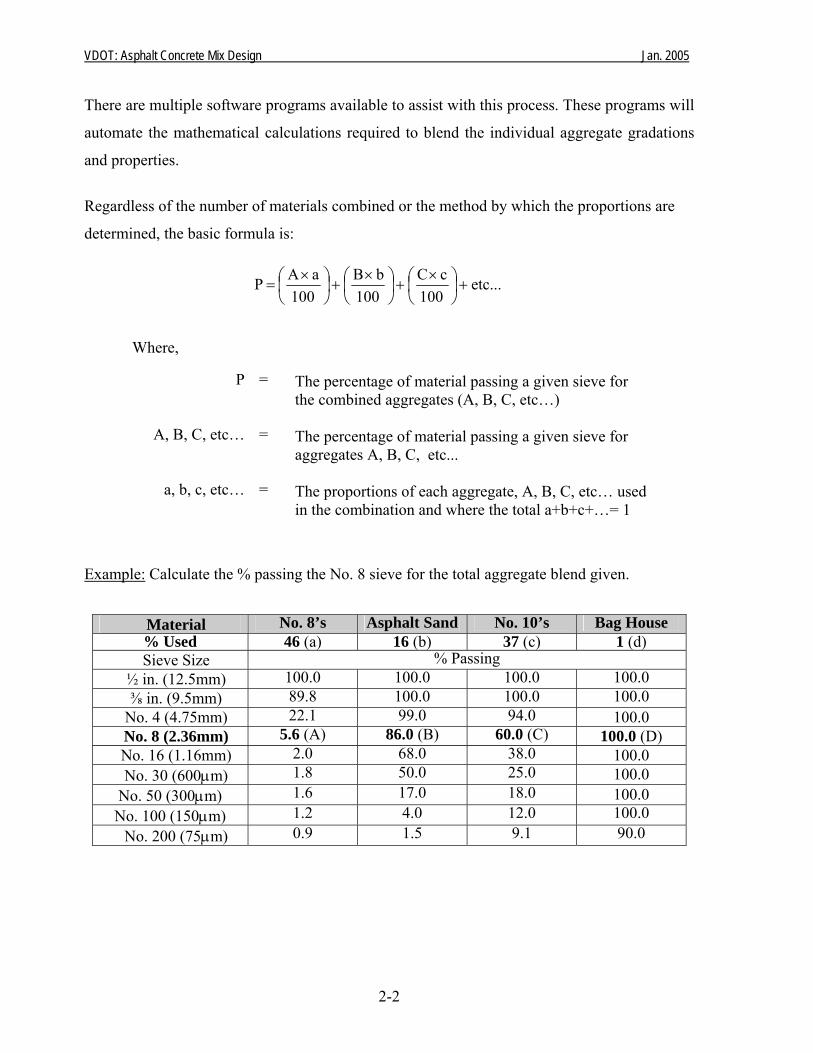
Regardless of the number of materials combined or the method by which the proportions are
determined, the basic formula is:
2-2
Where,
P = The percentage of material passing a given sieve for the combined aggregates (A, B, C, etc…)
A, B, C, etc… = The percentage of material passing a given sieve for aggregates A, B, C, etc...
a, b, c, etc… = The proportions of each aggregate, A, B, C, etc… used in the combination and where the total a+b+c+…= 1
Example: Calculate the % passing the No. 8 sieve for the total aggregate blend given.
Material No. 8’s Asphalt Sand No. 10’s Bag House % Used 46 (a) 16 (b) 37 (c) 1 (d) Sieve Size % Passing
½ in. (12.5mm) 100.0 100.0 100.0 100.0 ⅜ in. (9.5mm) 89.8 100.0 100.0 100.0
No. 4 (4.75mm) 22.1 99.0 94.0 100.0 No. 8 (2.36mm) 5.6 (A) 86.0 (B) 60.0 (C) 100.0 (D) No. 16 (1.16mm) 2.0 68.0 38.0 100.0 No. 30 (600μm) 1.8 50.0 25.0 100.0
No. 50 (300μm) 1.6 17.0 18.0 100.0 No. 100 (150μm) 1.2 4.0 12.0 100.0
No. 200 (75μm) 0.9 1.5 9.1 90.0
etc... 100
cC 100
bB 100
aA P +⎟⎠⎞
⎜⎝⎛ ×
+⎟⎠⎞
⎜⎝⎛ ×
+⎟⎠⎞
⎜⎝⎛ ×
=
VDOT: Asphalt Concrete Mix Design Jan. 2005
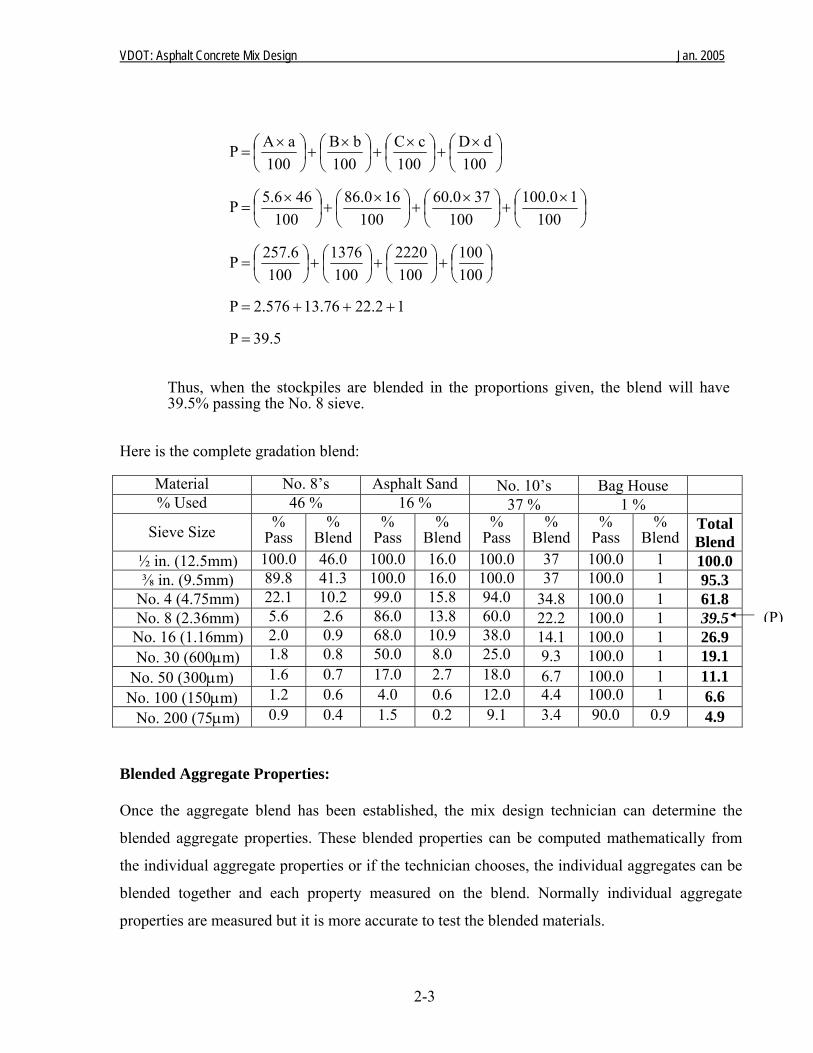
39.5 P
1 22.2 13.76 2.576 P
100100
1002220
1001376
100257.6 P
1001100.0
1003760.0
1001686.0
100465.6 P
100dD
100cC
100bB
100aA P
=
+++=
⎟⎠⎞
⎜⎝⎛+⎟
⎠⎞
⎜⎝⎛+⎟
⎠⎞
⎜⎝⎛+⎟
⎠⎞
⎜⎝⎛=
⎟⎠⎞
⎜⎝⎛ ×
+⎟⎠⎞
⎜⎝⎛ ×
+⎟⎠⎞
⎜⎝⎛ ×
+⎟⎠⎞
⎜⎝⎛ ×
=
⎟⎠⎞
⎜⎝⎛ ×
+⎟⎠⎞
⎜⎝⎛ ×
+⎟⎠⎞
⎜⎝⎛ ×
+⎟⎠⎞
⎜⎝⎛ ×
=
Thus, when the stockpiles are blended in the proportions given, the blend will have 39.5% passing the No. 8 sieve.
Here is the complete gradation blend:
Material No. 8’s Asphalt Sand No. 10’s Bag House % Used 46 % 16 % 37 % 1 %
Sieve Size % Pass
% Blend
% Pass
% Blend
% Pass
% Blend
% Pass
% Blend
Total Blend
½ in. (12.5mm) 100.0 46.0 100.0 16.0 100.0 37 100.0 1 100.0 ⅜ in. (9.5mm) 89.8 41.3 100.0 16.0 100.0 37 100.0 1 95.3
No. 4 (4.75mm) 22.1 10.2 99.0 15.8 94.0 34.8 100.0 1 61.8 No. 8 (2.36mm) 5.6 2.6 86.0 13.8 60.0 22.2 100.0 1 39.5 No. 16 (1.16mm) 2.0 0.9 68.0 10.9 38.0 14.1 100.0 1 26.9 No. 30 (600μm) 1.8 0.8 50.0 8.0 25.0 9.3 100.0 1 19.1
No. 50 (300μm) 1.6 0.7 17.0 2.7 18.0 6.7 100.0 1 11.1 No. 100 (150μm) 1.2 0.6 4.0 0.6 12.0 4.4 100.0 1 6.6
No. 200 (75μm) 0.9 0.4 1.5 0.2 9.1 3.4 90.0 0.9 4.9
(P)
Blended Aggregate Properties: Once the aggregate blend has been established, the mix design technician can determine the
blended aggregate properties. These blended properties can be computed mathematically from
the individual aggregate properties or if the technician chooses, the individual aggregates can be
blended together and each property measured on the blend. Normally individual aggregate
properties are measured but it is more accurate to test the blended materials.
2-3
VDOT: Asphalt Concrete Mix Design Jan. 2005
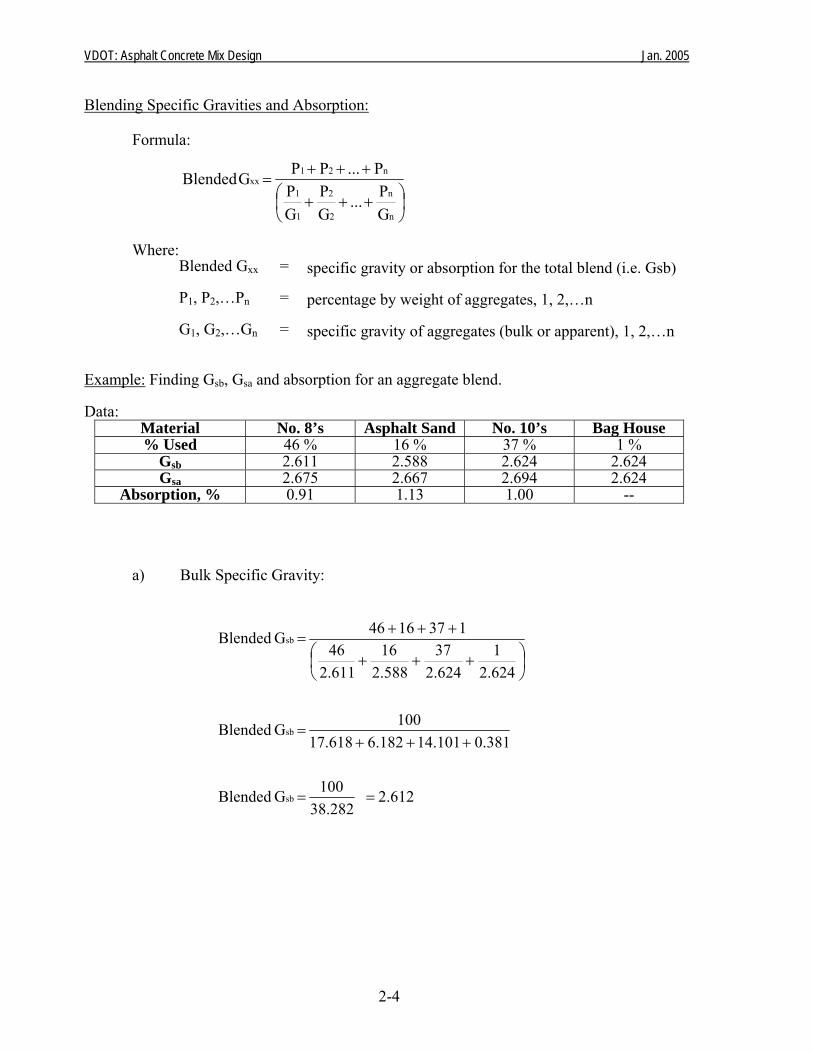
Blending Specific Gravities and Absorption:
Formula:
⎟⎠⎞
⎜⎝⎛ +++
+++=
n
n
2
2
1
1
n21xx
GP ...
GP
GP
P ... P P G Blended
Where:
Blended Gxx = specific gravity or absorption for the total blend (i.e. Gsb)
P1, P2,…Pn = percentage by weight of aggregates, 1, 2,…n
G1, G2,…Gn = specific gravity of aggregates (bulk or apparent), 1, 2,…n Example: Finding Gsb, Gsa and absorption for an aggregate blend. Data:
Material No. 8’s Asphalt Sand No. 10’s Bag House % Used 46 % 16 % 37 % 1 %
Gsb 2.611 2.588 2.624 2.624 Gsa 2.675 2.667 2.694 2.624
Absorption, % 0.91 1.13 1.00 --
a) Bulk Specific Gravity:
2.612 38.282
100 G Blended
0.381 14.101 6.182 17.618100 G Blended
2.6241
2.62437
2.58816
2.61146
1 37 16 46 G Blended
sb
sb
sb
==
+++=
⎟⎠⎞
⎜⎝⎛ +++
+++=
2-4
VDOT: Asphalt Concrete Mix Design Jan. 2005
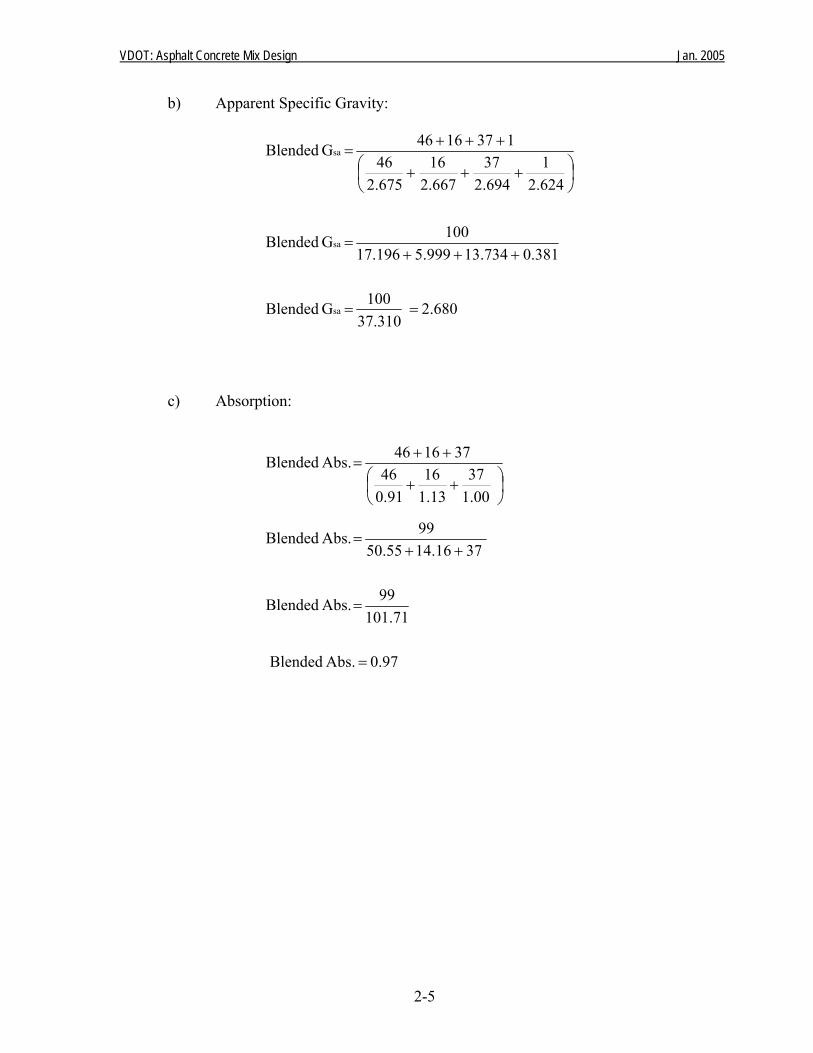
b) Apparent Specific Gravity:
2.680 37.310
100 G Blended
0.381 13.734 999.5 17.196100 G Blended
2.6241
2.69437
2.66716
2.67546
1 37 16 46 G Blended
sa
sa
sa
==
+++=
⎟⎠⎞
⎜⎝⎛ +++
+++=
c) Absorption:
0.97 Abs. Blended
101.71
99 Abs. Blended
37 16.14 50.5599 Abs. Blended
1.0037
1.1316
0.9146
37 16 46 Abs. Blended
=
=
++=
⎟⎠⎞
⎜⎝⎛ ++
++=
2-5
VDOT: Asphalt Concrete Mix Design Jan. 2005
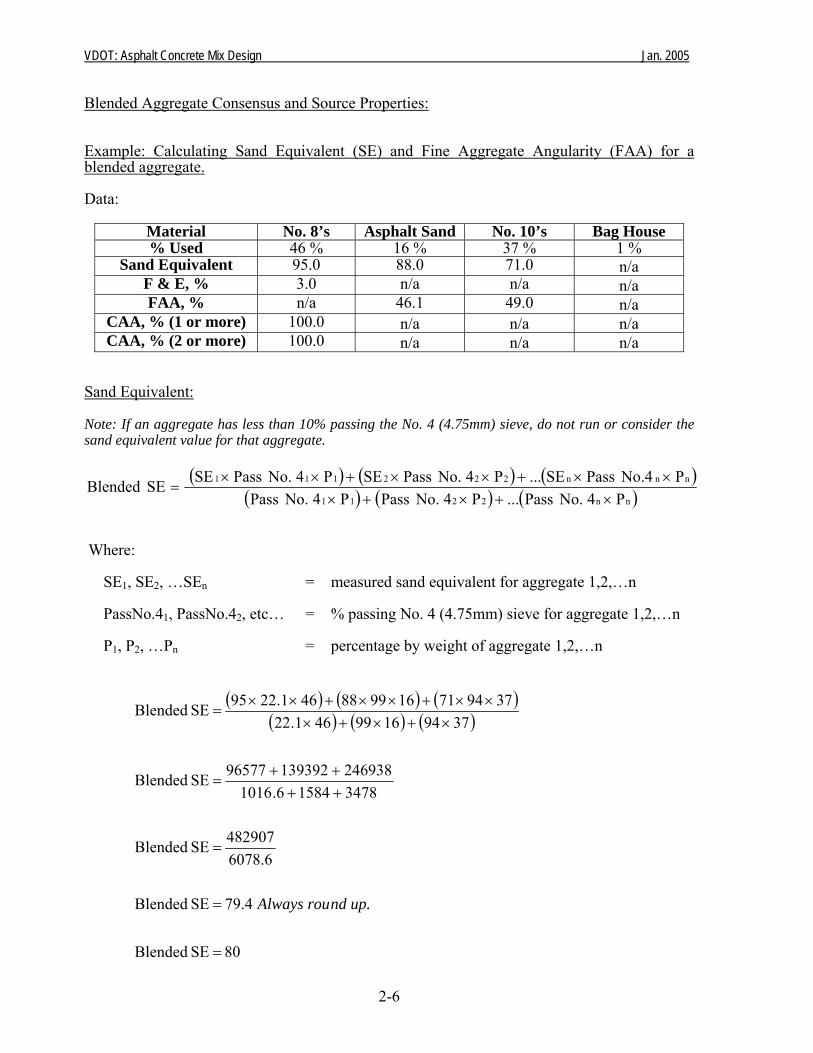
Blended Aggregate Consensus and Source Properties: Example: Calculating Sand Equivalent (SE) and Fine Aggregate Angularity (FAA) for a blended aggregate. Data:
Material No. 8’s Asphalt Sand No. 10’s Bag House % Used 46 % 16 % 37 % 1 %
Sand Equivalent 95.0 88.0 71.0 n/a F & E, % 3.0 n/a n/a n/a FAA, % n/a 46.1 49.0 n/a
CAA, % (1 or more) 100.0 n/a n/a n/a CAA, % (2 or more) 100.0 n/a n/a n/a
Sand Equivalent: Note: If an aggregate has less than 10% passing the No. 4 (4.75mm) sieve, do not run or consider the sand equivalent value for that aggregate.
( ) ( ) ( )( ) ( ) ( )nn2211
nnn222111
P4 No. Pass... P4 No. Pass P4 No. PassPNo.4 PassSE... P4 No. PassSE P4 No. PassSE SE Blended
×+×+×××+××+××
=
Where:
SE1, SE2, …SEn = measured sand equivalent for aggregate 1,2,…n
PassNo.41, PassNo.42, etc… = % passing No. 4 (4.75mm) sieve for aggregate 1,2,…n
P1, P2, …Pn = percentage by weight of aggregate 1,2,…n
( ) ( ) ( )( ) ( ) ( )
80 SE Blended
79.4 SE Blended
6078.6482907 SE Blended
3478 1584 6.1016246938 139392 96577 SE Blended
3794 1699 461.22379471 169988 461.2295 SE Blended
=
=
=
++++
=
×+×+×××+××+××
=
nd up.Always rou
2-6
VDOT: Asphalt Concrete Mix Design Jan. 2005
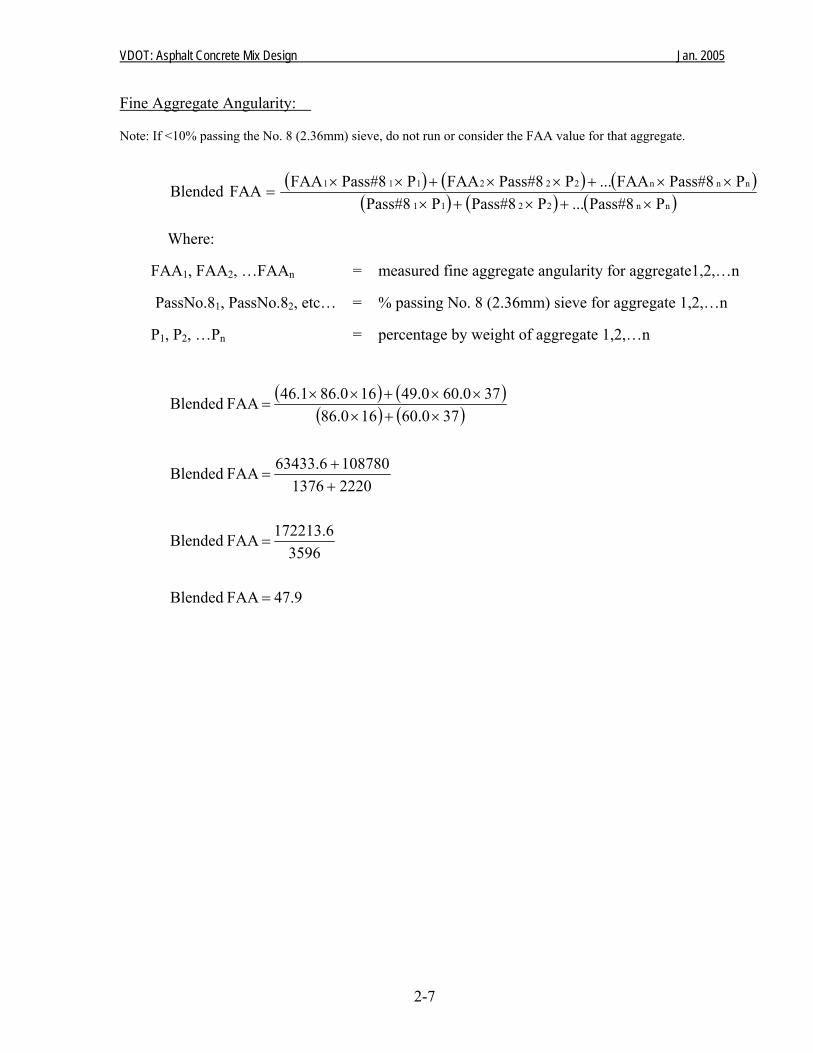
Fine Aggregate Angularity: Note: If <10% passing the No. 8 (2.36mm) sieve, do not run or consider the FAA value for that aggregate.
( ) ( ) ( )( ) ( ) ( )
2-7
Where:
FAA1, FAA2, …FAAn = measured fine aggregate angularity for aggregate1,2,…n
PassNo.81, PassNo.82, etc… = % passing No. 8 (2.36mm) sieve for aggregate 1,2,…n
P1, P2, …Pn = percentage by weight of aggregate 1,2,…n
nn2211
nnn222111
PPass#8... PPass#8 PPass#8PPass#8FAA... PPass#8FAA PPass#8FAA FAA Blended
×+×+×× × + × × + × ×
=
( ) ( )( ) ( )
47.9 FAA Blended
3596172213.6 FAA Blended
2220 1376108780 63433.6 FAA Blended
3760.0 1686.03760.049.0 1686.046.1 FAA Blended
=
=
++
=
×+×××+××
=
VDOT: Asphalt Concrete Mix Design Jan. 2005
CHAPTER 3 Batching Specimens The goal of batching is to closely match the laboratory aggregate blend to the final field
aggregate blend. Tight control in stockpile sampling and laboratory blending procedures will
help achieve a close match.1 The two most common methods utilized when batching
aggregates are to sieve each stockpile sample into different size fractions and recombine, or to
bulk batch. With either method, proper lab procedures need to be followed to achieve an
accurate blend. Fractionating stockpile samples will add considerable time to the mix design process. Also the
mix design technician needs to ensure that the stockpile sample is divided on all sieves from
the top size through the pan (dust).
Caution: separating stockpile samples on each sieve gives the mix design technician greater
control of the blended aggregate gradation than plant production is typically able to achieve.
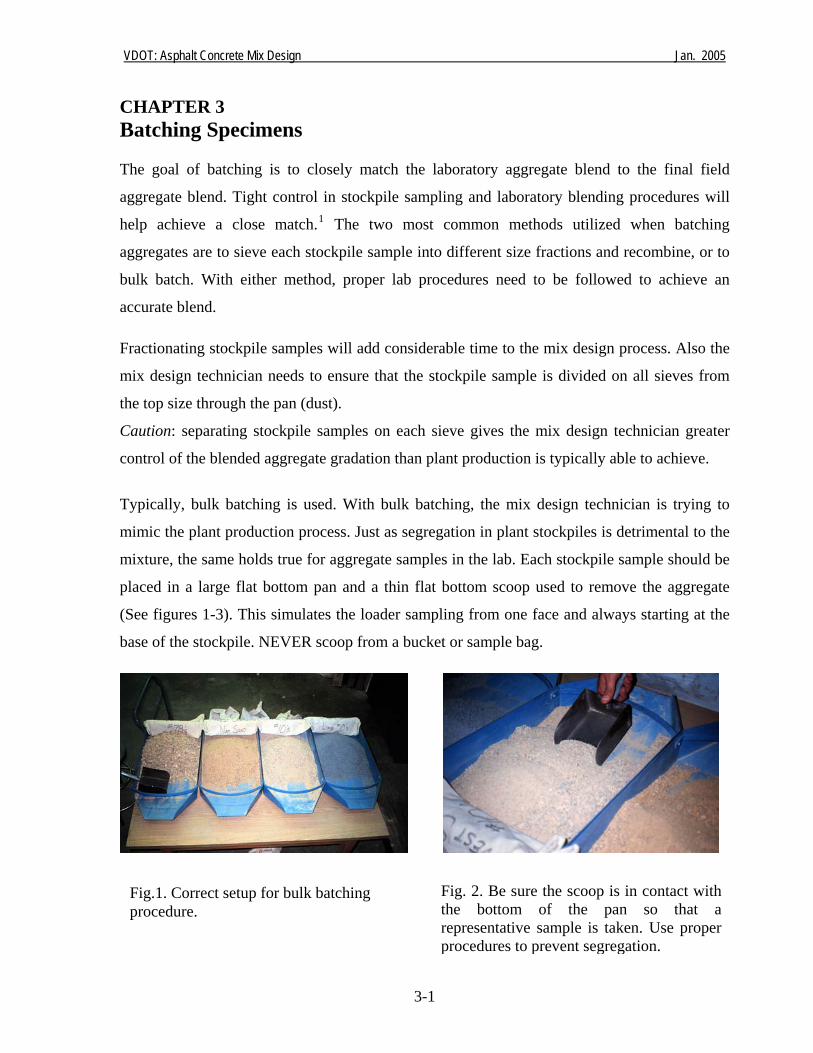
Typically, bulk batching is used. With bulk batching, the mix design technician is trying to
mimic the plant production process. Just as segregation in plant stockpiles is detrimental to the
mixture, the same holds true for aggregate samples in the lab. Each stockpile sample should be
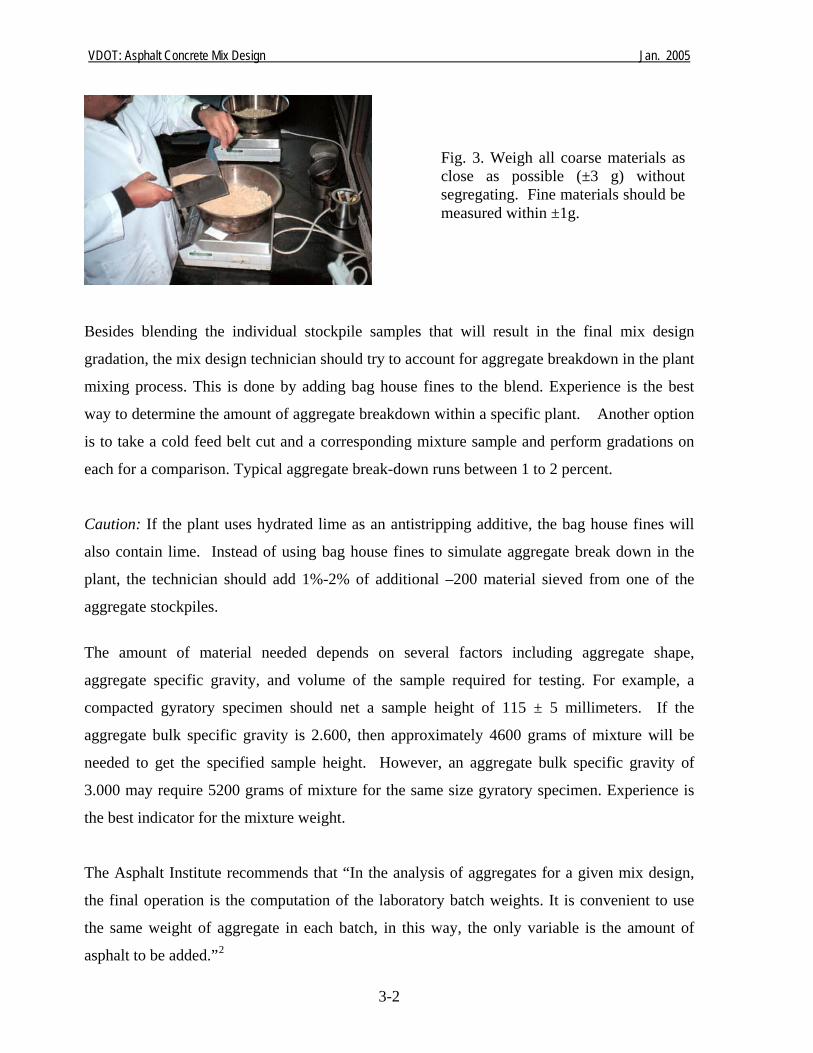
placed in a large flat bottom pan and a thin flat bottom scoop used to remove the aggregate
(See figures 1-3). This simulates the loader sampling from one face and always starting at the
base of the stockpile. NEVER scoop from a bucket or sample bag.
Fig. 2. Be sure the scoop is in contact with
the bottom of the pan so that a representative sample is taken. Use proper procedures to prevent segregation.
Fig.1. Correct setup for bulk batching procedure.
3-1
VDOT: Asphalt Concrete Mix Design Jan. 2005
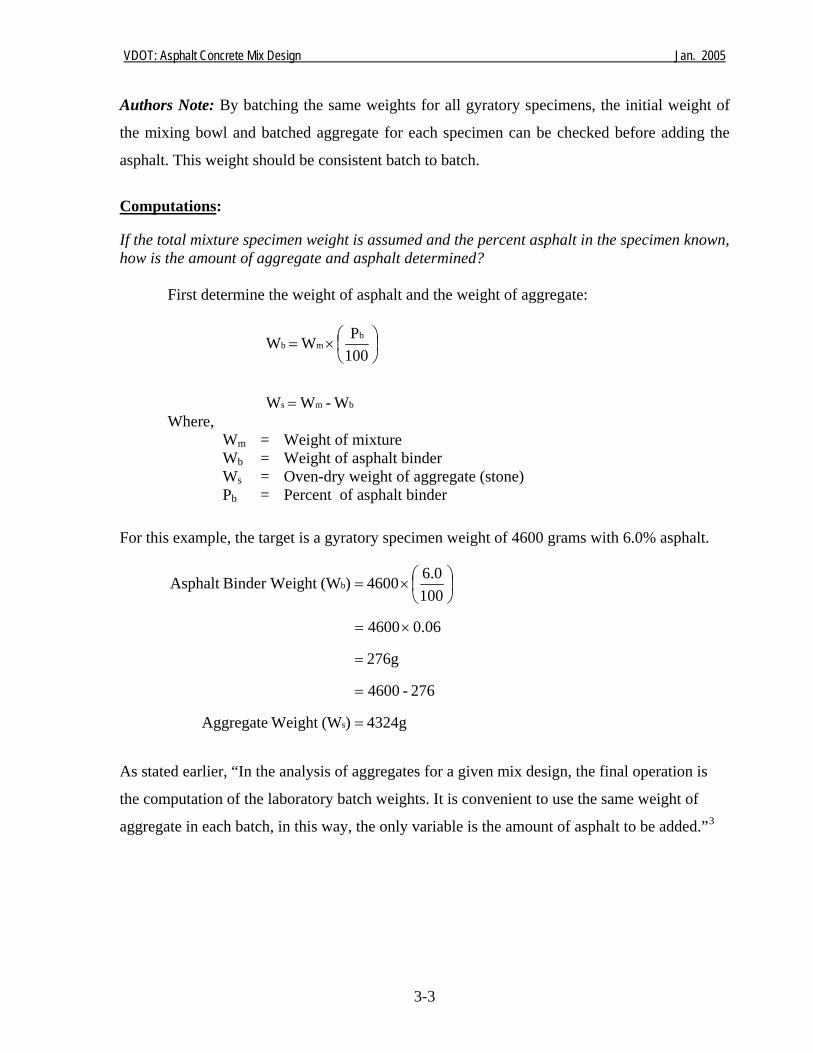
Fig. 3. Weigh all coarse materials as close as possible (±3 g) without segregating. Fine materials should be measured within ±1g.
Besides blending the individual stockpile samples that will result in the final mix design
gradation, the mix design technician should try to account for aggregate breakdown in the plant
mixing process. This is done by adding bag house fines to the blend. Experience is the best
way to determine the amount of aggregate breakdown within a specific plant. Another option
is to take a cold feed belt cut and a corresponding mixture sample and perform gradations on
each for a comparison. Typical aggregate break-down runs between 1 to 2 percent.
Caution: If the plant uses hydrated lime as an antistripping additive, the bag house fines will
also contain lime. Instead of using bag house fines to simulate aggregate break down in the
plant, the technician should add 1%-2% of additional –200 material sieved from one of the
aggregate stockpiles.
The amount of material needed depends on several factors including aggregate shape,
aggregate specific gravity, and volume of the sample required for testing. For example, a
compacted gyratory specimen should net a sample height of 115 ± 5 millimeters. If the
aggregate bulk specific gravity is 2.600, then approximately 4600 grams of mixture will be
needed to get the specified sample height. However, an aggregate bulk specific gravity of
3.000 may require 5200 grams of mixture for the same size gyratory specimen. Experience is
the best indicator for the mixture weight.
The Asphalt Institute recommends that “In the analysis of aggregates for a given mix design,
the final operation is the computation of the laboratory batch weights. It is convenient to use
the same weight of aggregate in each batch, in this way, the only variable is the amount of
asphalt to be added.”2
3-2
VDOT: Asphalt Concrete Mix Design Jan. 2005
Authors Note: By batching the same weights for all gyratory specimens, the initial weight of
the mixing bowl and batched aggregate for each specimen can be checked before adding the
asphalt. This weight should be consistent batch to batch.
Computations: If the total mixture specimen weight is assumed and the percent asphalt in the specimen known, how is the amount of aggregate and asphalt determined?
First determine the weight of asphalt and the weight of aggregate:
bms
bmb
W- W W
100P W W
=
⎟⎠⎞
⎜⎝⎛×=
Where, Wm = Weight of mixture Wb = Weight of asphalt binder Ws = Oven-dry weight of aggregate (stone) Pb = Percent of asphalt binder
For this example, the target is a gyratory specimen weight of 4600 grams with 6.0% asphalt.
4324g )(W Weight Aggregate
276 - 4600
276g
0.06 4600
1006.0 4600 )(Wght Binder WeiAsphalt
s
b
=
=
=
×=
⎟⎠⎞
⎜⎝⎛×=
As stated earlier, “In the analysis of aggregates for a given mix design, the final operation is
the computation of the laboratory batch weights. It is convenient to use the same weight of
aggregate in each batch, in this way, the only variable is the amount of asphalt to be added.”3
3-3
VDOT: Asphalt Concrete Mix Design Jan. 2005
With a known aggregate weight and percent asphalt, determine the asphalt weight: First find the total specimen (mixture) weight, then determine the asphalt weight:
smb
b
sm
W- W W
100P - 1
W W
=
⎥⎦
⎤⎢⎣
⎡⎟⎠⎞
⎜⎝⎛
=
Where, Wm = Weight of mixture. Wb = Weight of asphalt binder. Ws = Oven-dry weight of aggregate (stone). Pb = Percent of asphalt binder.
For this example the aggregate weight is 4324g and 6.0 percent asphalt should be added.
[ ]
276g )(Wght Binder WeiAsphalt
4324 -4600
4600g
0.944324
0.06 -14324
1006.0 - 1
4324 )(W Weight Mixture
b
m
=
=
=
=
=
⎥⎦
⎤⎢⎣
⎡⎟⎠⎞
⎜⎝⎛
=
With both of these calculations the goal is to obtain the specimen aggregate weight, asphalt
weight, and mixture weight. These values are required to calculate the individual component
percentage weights for each specimen.
To evaluate a mix design a set of three (3) gyratory specimens must be prepared at the target
asphalt content, the target asphalt content + 0.5%, and the target asphalt content + 1.0%.
Remember, each specimen is bulk batched. When bulk batching, ALWAYS include a
gradation check. That is, one additional specimen is batched and a wash gradation performed
to verify the specimen gradation is close to the target blend.
3-4
VDOT: Asphalt Concrete Mix Design Jan. 2005
When batching it is important to start with the coarse aggregate and work to the fine materials.
Also it is important to use cumulative weights from one stockpile to the next - this ensures the
aggregate blend weight will properly correspond to the asphalt weight.
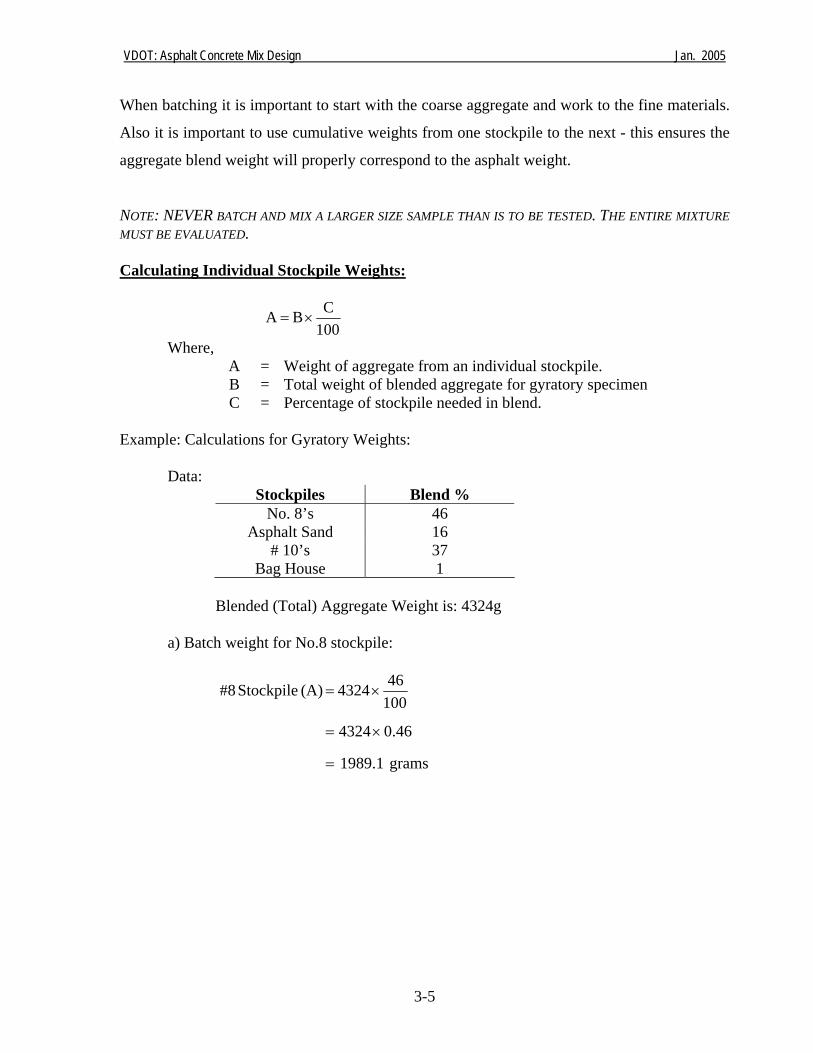
NOTE: NEVER BATCH AND MIX A LARGER SIZE SAMPLE THAN IS TO BE TESTED. THE ENTIRE MIXTURE MUST BE EVALUATED. Calculating Individual Stockpile Weights:
100C B A ×=
Where, A = Weight of aggregate from an individual stockpile. B = Total weight of blended aggregate for gyratory specimen C = Percentage of stockpile needed in blend.
Example: Calculations for Gyratory Weights: Data:
Stockpiles Blend % No. 8’s 46
Asphalt Sand 16 # 10’s 37
Bag House 1 Blended (Total) Aggregate Weight is: 4324g
a) Batch weight for No.8 stockpile:
grams 1989.1
0.46 4324
10046 4324 (A) Stockpile #8
=
×=
×=
3-5
VDOT: Asphalt Concrete Mix Design Jan. 2005
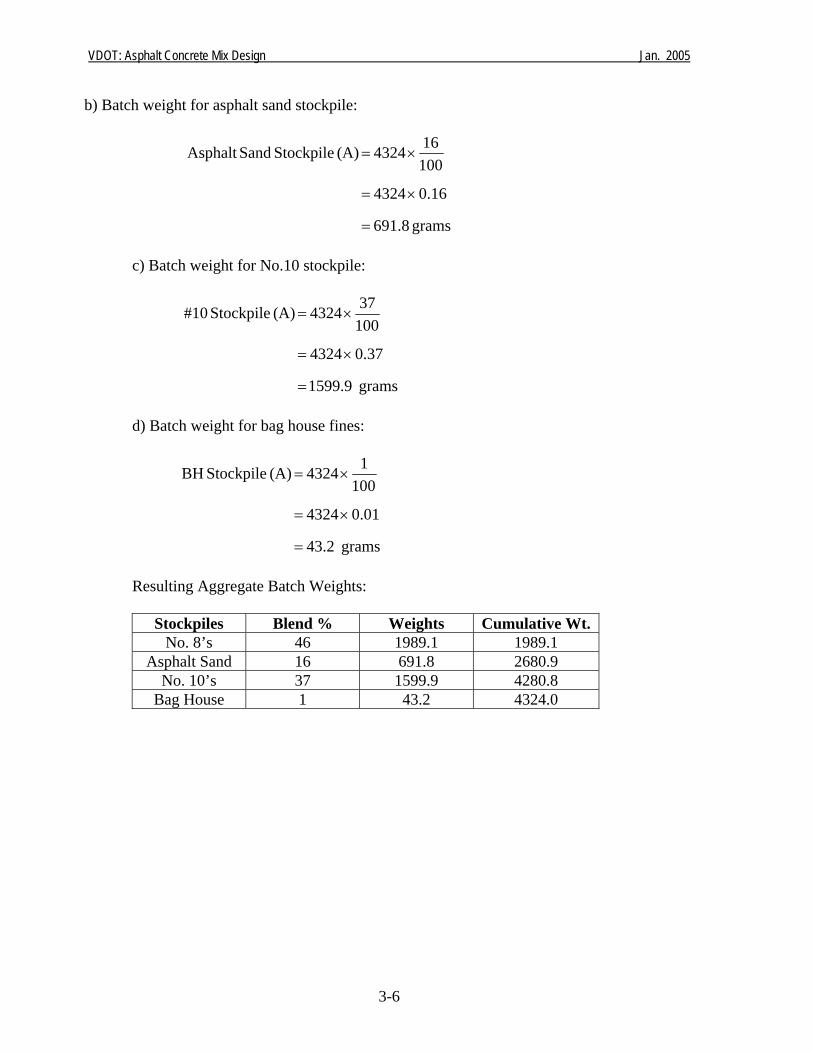
b) Batch weight for asphalt sand stockpile:
grams 691.8
0.16 4324
10016 4324 (A) Stockpile SandAsphalt
=
×=
×=
c) Batch weight for No.10 stockpile:
grams 1599.9
0.37 4324
10037 4324 (A) Stockpile #10
=
×=
×=
d) Batch weight for bag house fines:
grams 43.2
0.01 4324
1001 4324 (A) Stockpile BH
=
×=
×=
Resulting Aggregate Batch Weights:
Stockpiles Blend % Weights Cumulative Wt. No. 8’s 46 1989.1 1989.1
Asphalt Sand 16 691.8 2680.9 No. 10’s 37 1599.9 4280.8
Bag House 1 43.2 4324.0
3-6
VDOT: Asphalt Concrete Mix Design Jan. 2005
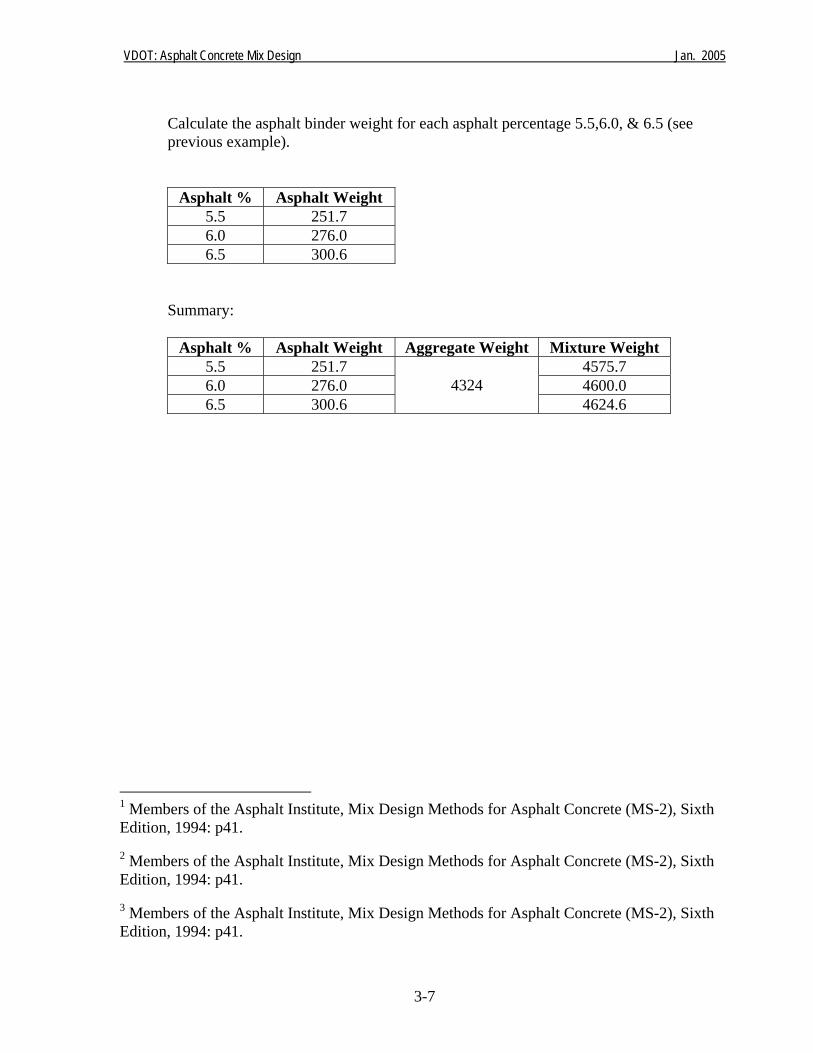
Calculate the asphalt binder weight for each asphalt percentage 5.5,6.0, & 6.5 (see previous example).
Asphalt % Asphalt Weight 5.5 251.7 6.0 276.0 6.5 300.6
Summary:
Asphalt % Asphalt Weight Aggregate Weight Mixture Weight 5.5 251.7 4575.7 6.0 276.0 4600.0 6.5 300.6
4324 4624.6
1 Members of the Asphalt Institute, Mix Design Methods for Asphalt Concrete (MS-2), Sixth Edition, 1994: p41. 2 Members of the Asphalt Institute, Mix Design Methods for Asphalt Concrete (MS-2), Sixth Edition, 1994: p41. 3 Members of the Asphalt Institute, Mix Design Methods for Asphalt Concrete (MS-2), Sixth Edition, 1994: p41.
3-7
VDOT: Asphalt Concrete Mix Design Jan. 2005
4-1
CHAPTER 4 Selecting Target Gradation For Job Mix Submittal When determining the gradation that will be submitted to the Department, there are several key
elements that must be taken into account. First is knowing the history of aggregate breakdown
when the material is produced at the plant, which should be accounted for in the mix design
process. This is why when designing the mix baghouse fines, (typically 1.0% - 2.0%) are
added to the blend.
The second consideration is when the asphalt content is determined by use of the Muffle
Furnace, some aggregates tend to break down more than others. Therefore, in determining the
Muffle Furnace Correction Factor it is necessary that a gradation of the material be determined
so that the Mix Design technician can verify that the aggregates selected for use are not
breaking down to a point that the material will not meet the target gradation that has been
selected for acceptance.
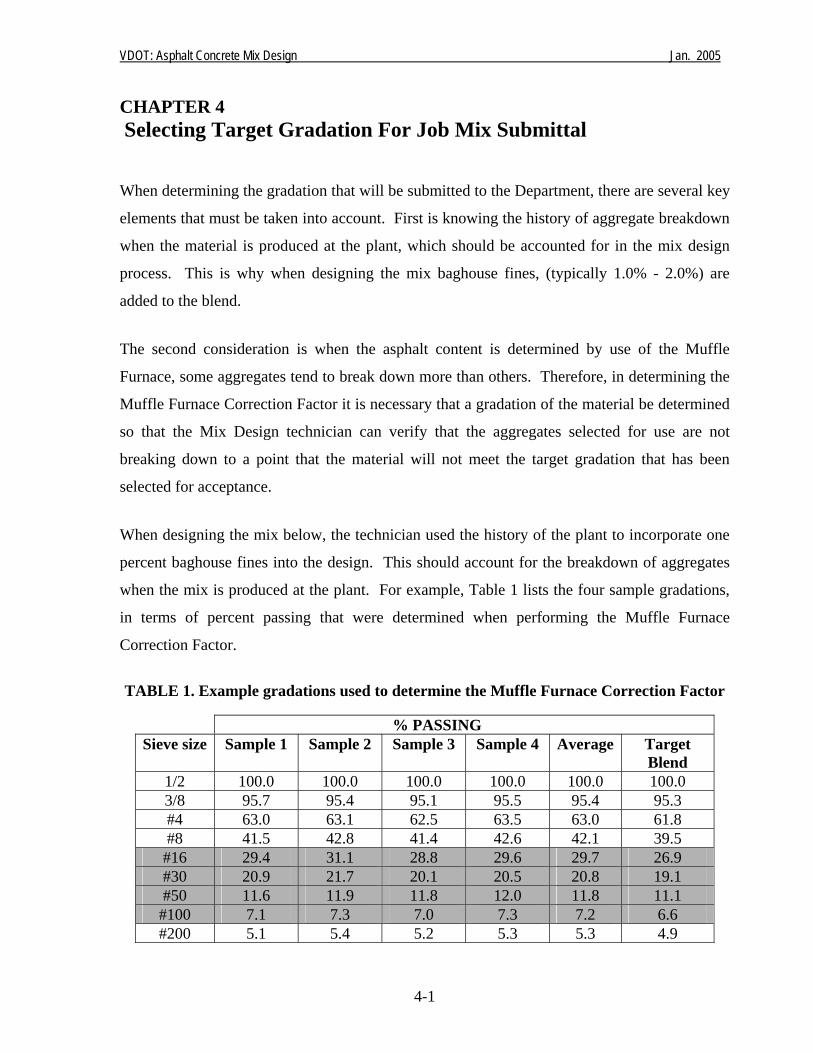
When designing the mix below, the technician used the history of the plant to incorporate one
percent baghouse fines into the design. This should account for the breakdown of aggregates
when the mix is produced at the plant. For example, Table 1 lists the four sample gradations,
in terms of percent passing that were determined when performing the Muffle Furnace
Correction Factor.
TABLE 1. Example gradations used to determine the Muffle Furnace Correction Factor
% PASSING
Sieve size Sample 1 Sample 2 Sample 3 Sample 4 Average Target Blend
1/2 100.0 100.0 100.0 100.0 100.0 100.0 3/8 95.7 95.4 95.1 95.5 95.4 95.3 #4 63.0 63.1 62.5 63.5 63.0 61.8 #8 41.5 42.8 41.4 42.6 42.1 39.5 #16 29.4 31.1 28.8 29.6 29.7 26.9 #30 20.9 21.7 20.1 20.5 20.8 19.1 #50 11.6 11.9 11.8 12.0 11.8 11.1 #100 7.1 7.3 7.0 7.3 7.2 6.6 #200 5.1 5.4 5.2 5.3 5.3 4.9
VDOT: Asphalt Concrete Mix Design Jan. 2005
4-2
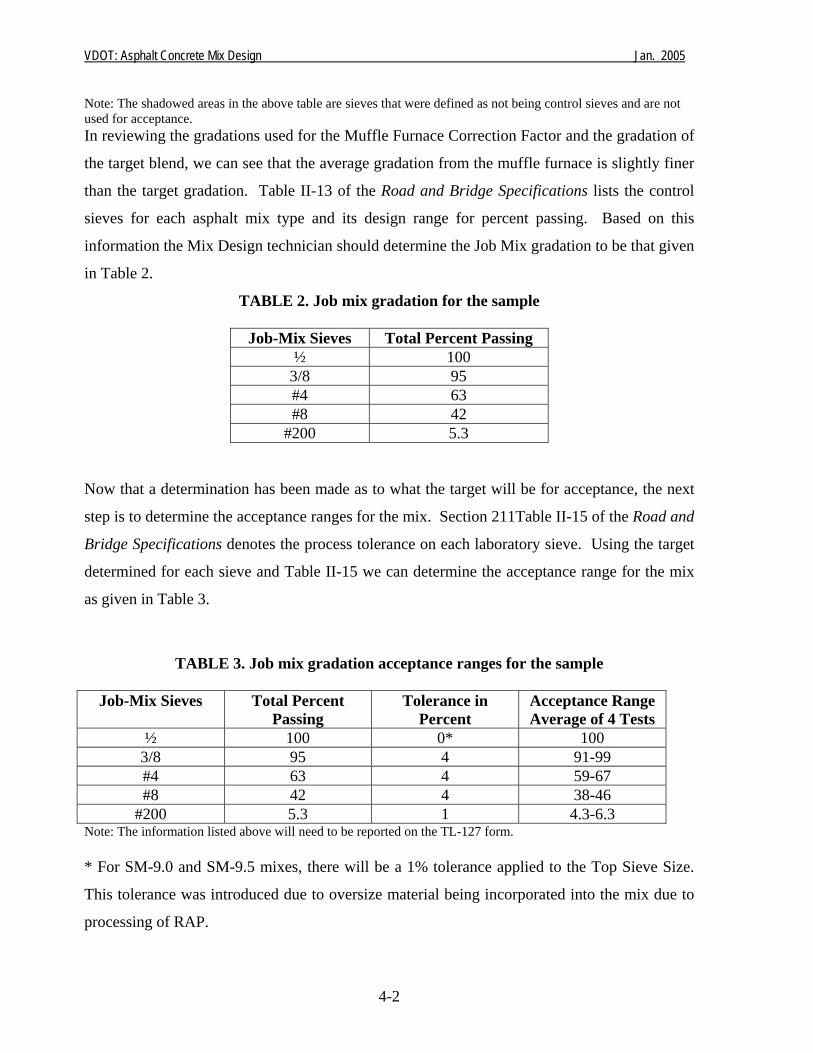
Note: The shadowed areas in the above table are sieves that were defined as not being control sieves and are not used for acceptance. In reviewing the gradations used for the Muffle Furnace Correction Factor and the gradation of
the target blend, we can see that the average gradation from the muffle furnace is slightly finer
than the target gradation. Table II-13 of the Road and Bridge Specifications lists the control
sieves for each asphalt mix type and its design range for percent passing. Based on this
information the Mix Design technician should determine the Job Mix gradation to be that given
in Table 2.
TABLE 2. Job mix gradation for the sample
Job-Mix Sieves Total Percent Passing ½ 100
3/8 95 #4 63 #8 42
#200 5.3 Now that a determination has been made as to what the target will be for acceptance, the next
step is to determine the acceptance ranges for the mix. Section 211Table II-15 of the Road and
Bridge Specifications denotes the process tolerance on each laboratory sieve. Using the target
determined for each sieve and Table II-15 we can determine the acceptance range for the mix
as given in Table 3.
TABLE 3. Job mix gradation acceptance ranges for the sample
Job-Mix Sieves Total Percent Passing
Tolerance in Percent
Acceptance Range Average of 4 Tests
½ 100 0* 100 3/8 95 4 91-99 #4 63 4 59-67 #8 42 4 38-46
#200 5.3 1 4.3-6.3 Note: The information listed above will need to be reported on the TL-127 form. * For SM-9.0 and SM-9.5 mixes, there will be a 1% tolerance applied to the Top Sieve Size.
This tolerance was introduced due to oversize material being incorporated into the mix due to
processing of RAP.
VDOT: Asphalt Concrete Mix Design Jan. 2005
5-1
CHAPTER 5 Selecting the Design Asphalt Content Once the design aggregate structure is selected, specimens are compacted at three different
asphalt contents. The mixture properties are then evaluated to determine the design asphalt
content. A minimum of three specimens are compacted at each of the three asphalt contents
selected:
- Estimated asphalt content
- 0.5% below estimated asphalt content
- 0.5% above estimated asphalt content
When making the selection for the estimated asphalt content the mix design technician should
take into account the plant history for this type of mix. The selected asphalt content should be
very close to the 4.0% VTM design criteria.
For this example the mix design technician has decided to use 5.9% for the estimated asphalt
content. This means that he/she will be required to compact three specimens at an asphalt
content of 5.4%, three specimens at an asphalt content of 5.9% and three specimens at an
asphalt content of 6.4%. A butter batch is required prior to mixing the samples. If the mixer is
cleaned after each varying asphalt content, then a butter batch will be required for each varying
asphalt content. Specimens are prepared and tested in the same manner as the specimens from
the “Selection of A Design Aggregate Structure” in the FHWA workbook. A minimum of two
additional samples is required for determining the maximum theoretical specific gravity for
each asphalt content.
Note: AASHTO PP-28 sec. 8.4 Note 8 requires 2 tests to be performed for Maximum Theoretical Specific Gravity. Sample size shall be in accordance to AASHTO T-209.
VDOT: Asphalt Concrete Mix Design Jan. 2005
5-2
Blending
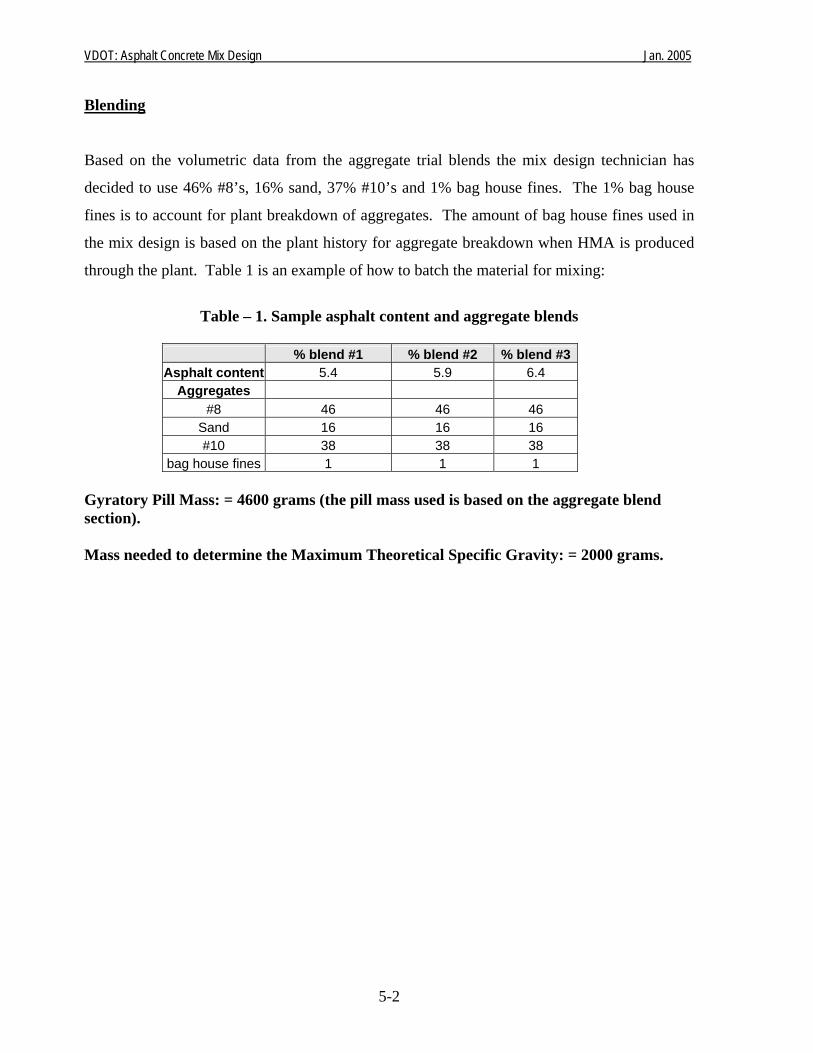
Based on the volumetric data from the aggregate trial blends the mix design technician has
decided to use 46% #8’s, 16% sand, 37% #10’s and 1% bag house fines. The 1% bag house
fines is to account for plant breakdown of aggregates. The amount of bag house fines used in
the mix design is based on the plant history for aggregate breakdown when HMA is produced
through the plant. Table 1 is an example of how to batch the material for mixing:
Table – 1. Sample asphalt content and aggregate blends
% blend #1 % blend #2 % blend #3 Asphalt content 5.4 5.9 6.4
Aggregates #8 46 46 46
Sand 16 16 16 #10 38 38 38
bag house fines 1 1 1 Gyratory Pill Mass: = 4600 grams (the pill mass used is based on the aggregate blend section). Mass needed to determine the Maximum Theoretical Specific Gravity: = 2000 grams.
VDOT: Asphalt Concrete Mix Design Jan. 2005
5-3
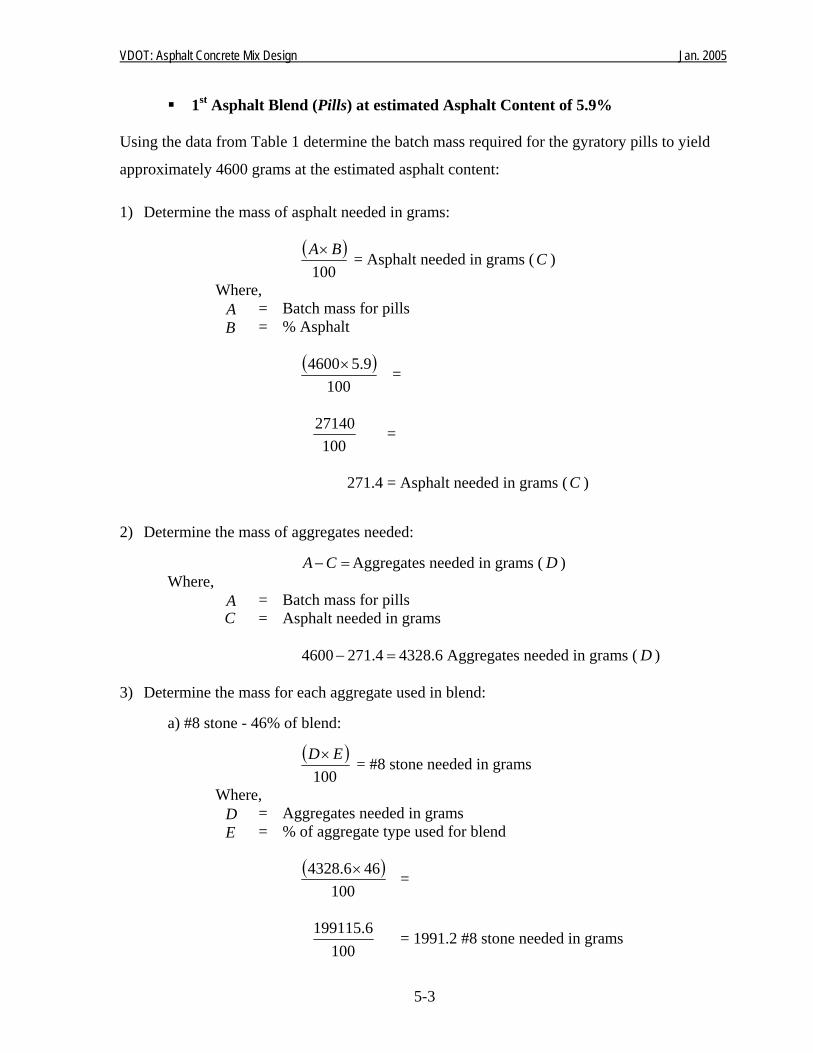
1st Asphalt Blend (Pills) at estimated Asphalt Content of 5.9% Using the data from Table 1 determine the batch mass required for the gyratory pills to yield
approximately 4600 grams at the estimated asphalt content: 1) Determine the mass of asphalt needed in grams:
( )100
BA× = Asphalt needed in grams ( C )
Where, A = Batch mass for pills B = % Asphalt
( )
1009.54600× =
100
27140 =
271.4 = Asphalt needed in grams (C )
2) Determine the mass of aggregates needed:
=−CA Aggregates needed in grams ( D ) Where,
A = Batch mass for pills C = Asphalt needed in grams
=− 4.2714600 4328.6 Aggregates needed in grams ( D )
3) Determine the mass for each aggregate used in blend:
a) #8 stone - 46% of blend:
( )100
ED× = #8 stone needed in grams
Where, D = Aggregates needed in grams E = % of aggregate type used for blend
( )
100466.4328 × =
1006.199115 = 1991.2 #8 stone needed in grams

VDOT: Asphalt Concrete Mix Design Jan. 2005
5-4
b) Sand – 16% of blend:
( )100
ED× = Sand needed in grams
Where, D = Aggregates needed in grams E = % of aggregate type used for blend
( )
100166.4328 × =
1006.69257 =
692.6 = Sand needed in grams
c) #10 Stone – 37% of blend:
( )
100ED× = #10 stone needed in grams
Where, D = Aggregates needed in grams E = % of aggregate type used for blend
( )
100376.4328 × =
1002.160158 =
1601.6 = #10 stone needed in grams
d) Bag house fines – 1% of blend
( )
100ED× = Bag house fines needed in grams
Where, D = Aggregates needed in grams E = % of aggregate type used for blend
( )
10016.4328 × =
1006.4328 = 43.3 Bag house fines needed in grams
VDOT: Asphalt Concrete Mix Design Jan. 2005
5-5
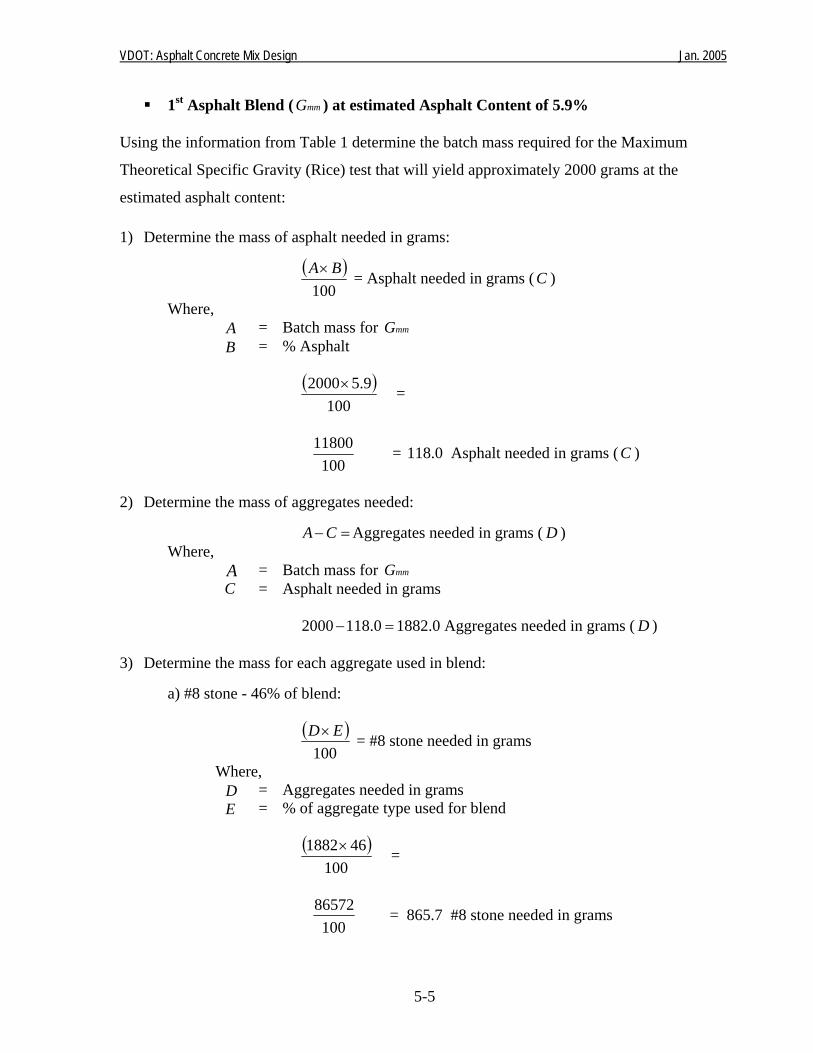
1st Asphalt Blend ( mmG ) at estimated Asphalt Content of 5.9% Using the information from Table 1 determine the batch mass required for the Maximum
Theoretical Specific Gravity (Rice) test that will yield approximately 2000 grams at the
estimated asphalt content: 1) Determine the mass of asphalt needed in grams:
( )100
BA× = Asphalt needed in grams ( C )
Where, A = Batch mass for mmGB = % Asphalt
( )
1009.52000× =
100
11800 = 118.0 Asphalt needed in grams (C )
2) Determine the mass of aggregates needed:
=−CA Aggregates needed in grams ( D ) Where,
A = Batch mass for mmG C = Asphalt needed in grams
=− 0.1182000 1882.0 Aggregates needed in grams ( D )
3) Determine the mass for each aggregate used in blend:
a) #8 stone - 46% of blend:
( )100
ED× = #8 stone needed in grams
Where, D = Aggregates needed in grams E = % of aggregate type used for blend
( )
100461882× =
10086572 = 865.7 #8 stone needed in grams
VDOT: Asphalt Concrete Mix Design Jan. 2005
5-6
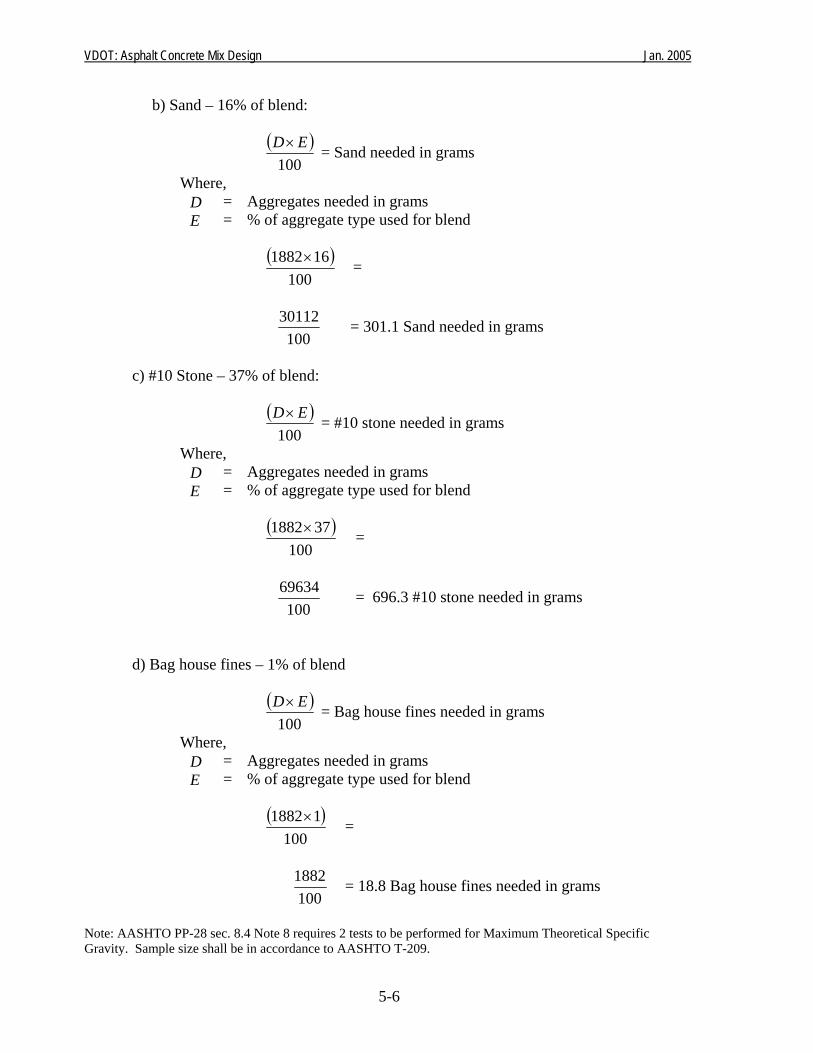
b) Sand – 16% of blend:
( )100
ED× = Sand needed in grams
Where, D = Aggregates needed in grams E = % of aggregate type used for blend
( )
100161882× =
10030112 = 301.1 Sand needed in grams
c) #10 Stone – 37% of blend:
( )
100ED× = #10 stone needed in grams
Where, D = Aggregates needed in grams E = % of aggregate type used for blend
( )
100371882× =
10069634 = 696.3 #10 stone needed in grams
d) Bag house fines – 1% of blend
( )100
ED× = Bag house fines needed in grams
Where, D = Aggregates needed in grams E = % of aggregate type used for blend
( )
10011882× =
1001882 = 18.8 Bag house fines needed in grams
Note: AASHTO PP-28 sec. 8.4 Note 8 requires 2 tests to be performed for Maximum Theoretical Specific Gravity. Sample size shall be in accordance to AASHTO T-209.
VDOT: Asphalt Concrete Mix Design Jan. 2005
5-7
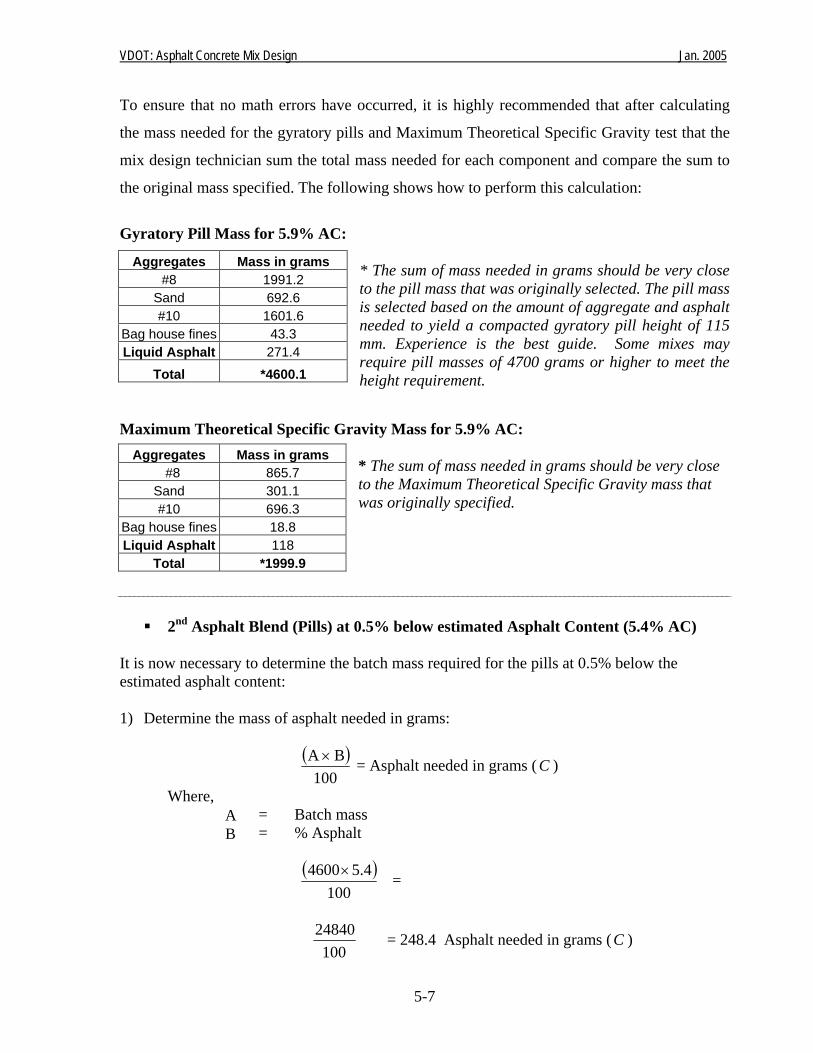
To ensure that no math errors have occurred, it is highly recommended that after calculating
the mass needed for the gyratory pills and Maximum Theoretical Specific Gravity test that the
mix design technician sum the total mass needed for each component and compare the sum to
the original mass specified. The following shows how to perform this calculation:
Gyratory Pill Mass for 5.9% AC:
* The sum of mass needed in grams should be very close to the pill mass that was originally selected. The pill mass is selected based on the amount of aggregate and asphalt needed to yield a compacted gyratory pill height of 115 mm. Experience is the best guide. Some mixes may require pill masses of 4700 grams or higher to meet the height requirement.
Maximum Theoretical Specific Gravity Mass for 5.9% AC:
* The sum of mass needed in grams should be very close to the Maximum Theoretical Specific Gravity mass that was originally specified.
2nd Asphalt Blend (Pills) at 0.5% below estimated Asphalt Content (5.4% AC) It is now necessary to determine the batch mass required for the pills at 0.5% below the estimated asphalt content: 1) Determine the mass of asphalt needed in grams:
( )100
BA × = Asphalt needed in grams ( C )
Where, A = Batch mass B = % Asphalt
( )
1004.54600× =
100
24840 = 248.4 Asphalt needed in grams (C )
Aggregates Mass in grams #8 1991.2
Sand 692.6 #10 1601.6
Bag house fines 43.3 Liquid Asphalt 271.4
Total *4600.1
Aggregates Mass in grams #8 865.7
Sand 301.1 #10 696.3
Bag house fines 18.8 Liquid Asphalt 118
Total *1999.9
VDOT: Asphalt Concrete Mix Design Jan. 2005
5-8
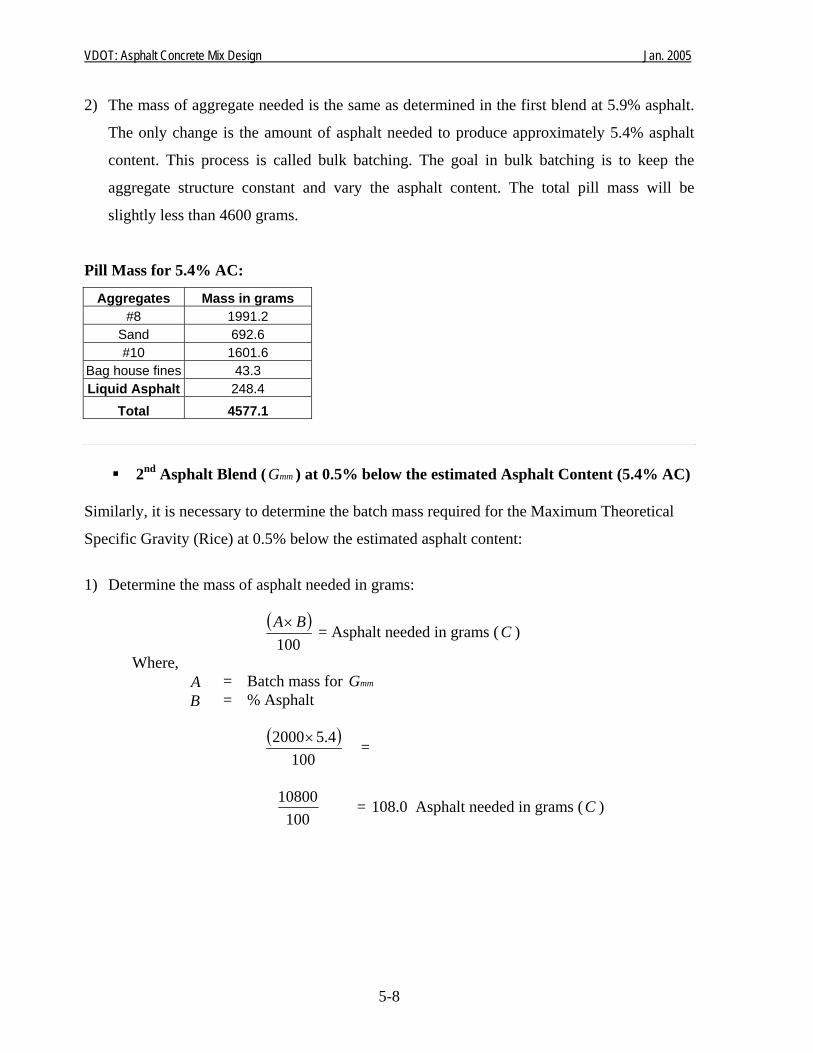
2) The mass of aggregate needed is the same as determined in the first blend at 5.9% asphalt.
The only change is the amount of asphalt needed to produce approximately 5.4% asphalt
content. This process is called bulk batching. The goal in bulk batching is to keep the
aggregate structure constant and vary the asphalt content. The total pill mass will be
slightly less than 4600 grams.
Pill Mass for 5.4% AC:
2nd Asphalt Blend ( mmG ) at 0.5% below the estimated Asphalt Content (5.4% AC) Similarly, it is necessary to determine the batch mass required for the Maximum Theoretical
Specific Gravity (Rice) at 0.5% below the estimated asphalt content:
1) Determine the mass of asphalt needed in grams:
( )100
BA× = Asphalt needed in grams ( C )
Where, A = Batch mass for mmGB = % Asphalt
( )
1004.52000× =
100
10800 = 108.0 Asphalt needed in grams (C )
Aggregates Mass in grams #8 1991.2
Sand 692.6 #10 1601.6
Bag house fines 43.3 Liquid Asphalt 248.4
Total 4577.1
VDOT: Asphalt Concrete Mix Design Jan. 2005
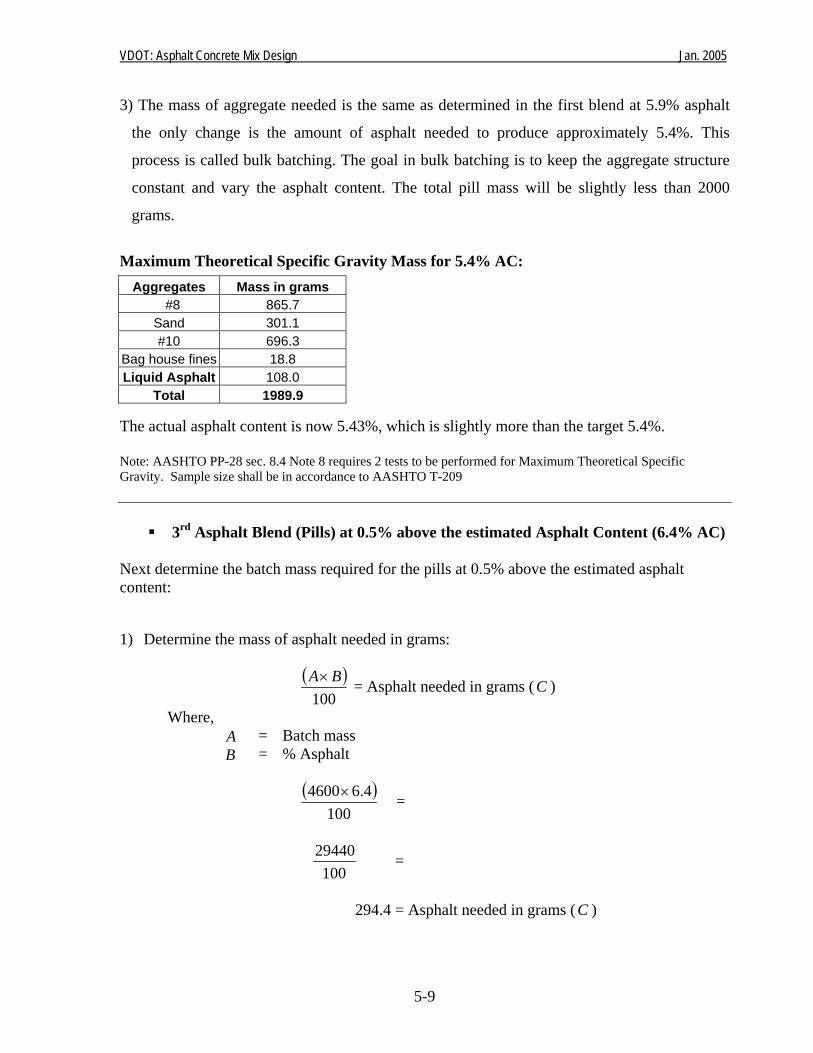
5-9
3) The mass of aggregate needed is the same as determined in the first blend at 5.9% asphalt
the only change is the amount of asphalt needed to produce approximately 5.4%. This
process is called bulk batching. The goal in bulk batching is to keep the aggregate structure
constant and vary the asphalt content. The total pill mass will be slightly less than 2000
grams.
Maximum Theoretical Specific Gravity Mass for 5.4% AC:
The actual asphalt content is now 5.43%, which is slightly more than the target 5.4%. Note: AASHTO PP-28 sec. 8.4 Note 8 requires 2 tests to be performed for Maximum Theoretical Specific Gravity. Sample size shall be in accordance to AASHTO T-209
3rd Asphalt Blend (Pills) at 0.5% above the estimated Asphalt Content (6.4% AC) Next determine the batch mass required for the pills at 0.5% above the estimated asphalt content: 1) Determine the mass of asphalt needed in grams:
( )100
BA× = Asphalt needed in grams ( C )
Where, A = Batch mass B = % Asphalt
( )
1004.64600× =
100
29440 =
294.4 = Asphalt needed in grams (C )
Aggregates Mass in grams #8 865.7
Sand 301.1 #10 696.3
Bag house fines 18.8 Liquid Asphalt 108.0
Total 1989.9
VDOT: Asphalt Concrete Mix Design Jan. 2005
5-10
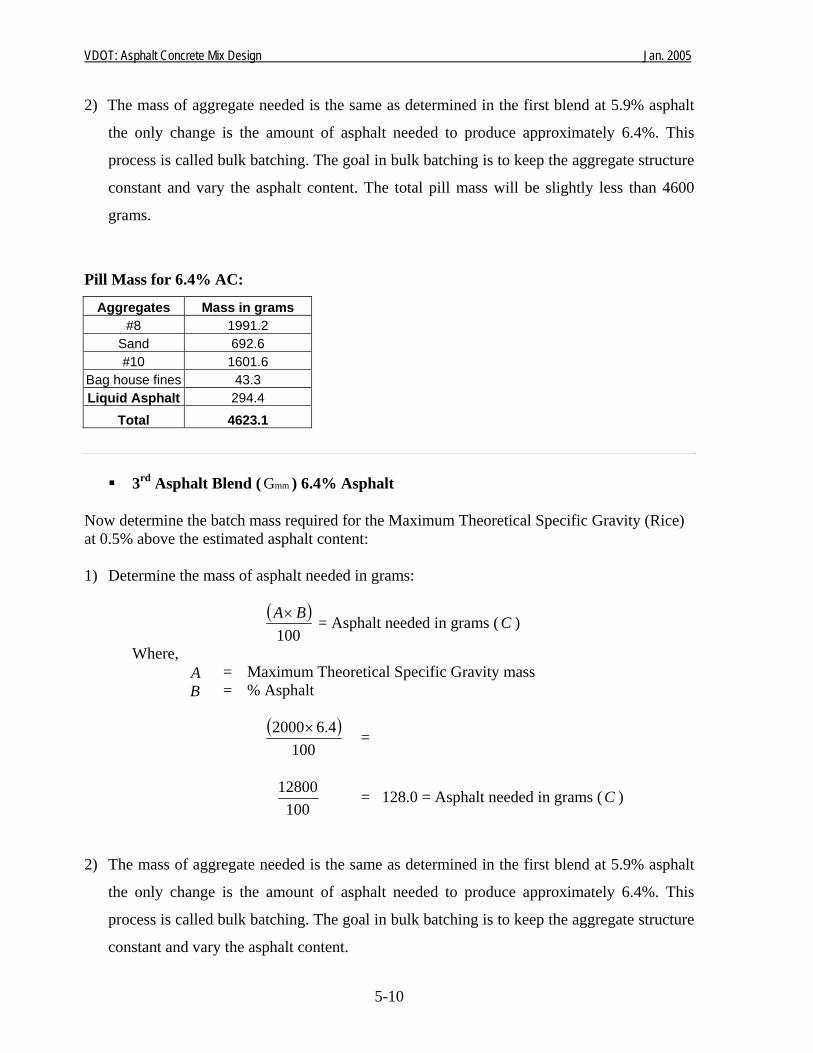
2) The mass of aggregate needed is the same as determined in the first blend at 5.9% asphalt
the only change is the amount of asphalt needed to produce approximately 6.4%. This
process is called bulk batching. The goal in bulk batching is to keep the aggregate structure
constant and vary the asphalt content. The total pill mass will be slightly less than 4600
grams.
Pill Mass for 6.4% AC:
3rd Asphalt Blend ( mmG ) 6.4% Asphalt
Now determine the batch mass required for the Maximum Theoretical Specific Gravity (Rice) at 0.5% above the estimated asphalt content: 1) Determine the mass of asphalt needed in grams:
( )100
BA× = Asphalt needed in grams ( C )
Where, A = Maximum Theoretical Specific Gravity mass B = % Asphalt
( )
1004.62000× =
100
12800 = 128.0 = Asphalt needed in grams (C )
2) The mass of aggregate needed is the same as determined in the first blend at 5.9% asphalt
the only change is the amount of asphalt needed to produce approximately 6.4%. This
process is called bulk batching. The goal in bulk batching is to keep the aggregate structure
constant and vary the asphalt content.
Aggregates Mass in grams #8 1991.2
Sand 692.6 #10 1601.6
Bag house fines 43.3 Liquid Asphalt 294.4
Total 4623.1
VDOT: Asphalt Concrete Mix Design Jan. 2005
5-11
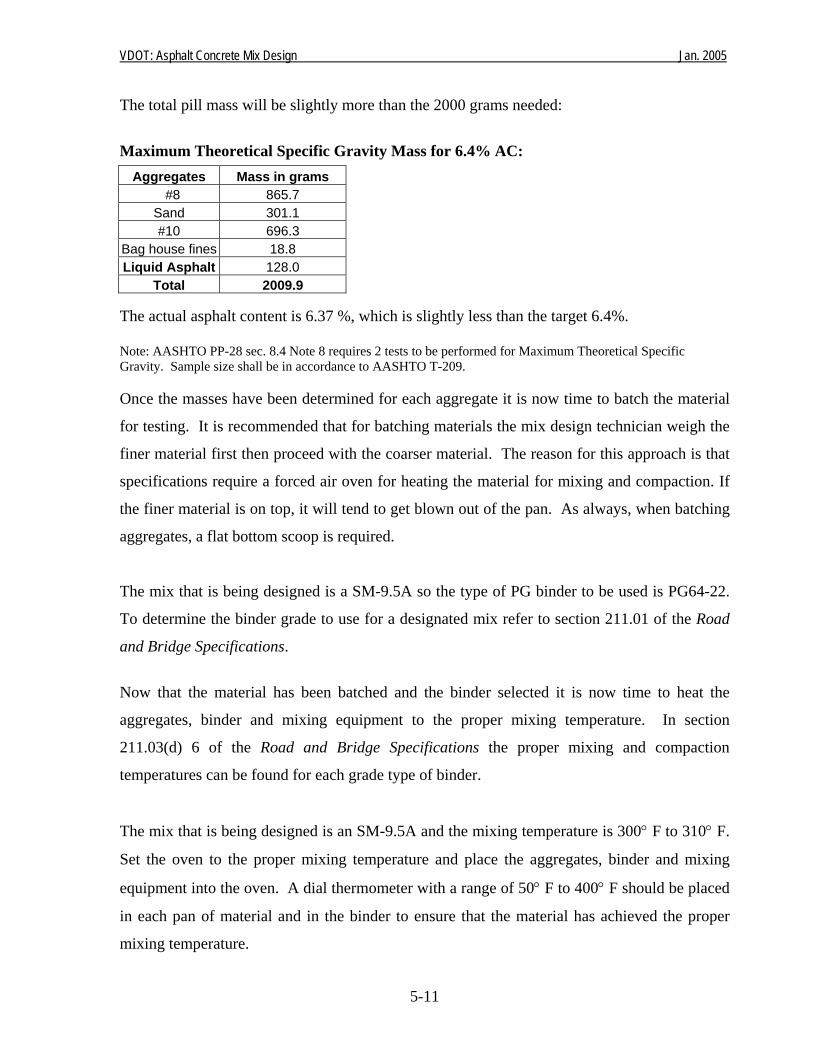
The total pill mass will be slightly more than the 2000 grams needed:
Maximum Theoretical Specific Gravity Mass for 6.4% AC:
The actual asphalt content is 6.37 %, which is slightly less than the target 6.4%. Note: AASHTO PP-28 sec. 8.4 Note 8 requires 2 tests to be performed for Maximum Theoretical Specific Gravity. Sample size shall be in accordance to AASHTO T-209. Once the masses have been determined for each aggregate it is now time to batch the material
for testing. It is recommended that for batching materials the mix design technician weigh the
finer material first then proceed with the coarser material. The reason for this approach is that
specifications require a forced air oven for heating the material for mixing and compaction. If
the finer material is on top, it will tend to get blown out of the pan. As always, when batching
aggregates, a flat bottom scoop is required.
The mix that is being designed is a SM-9.5A so the type of PG binder to be used is PG64-22.
To determine the binder grade to use for a designated mix refer to section 211.01 of the Road
and Bridge Specifications.
Now that the material has been batched and the binder selected it is now time to heat the
aggregates, binder and mixing equipment to the proper mixing temperature. In section
211.03(d) 6 of the Road and Bridge Specifications the proper mixing and compaction
temperatures can be found for each grade type of binder.
The mix that is being designed is an SM-9.5A and the mixing temperature is 300° F to 310° F.
Set the oven to the proper mixing temperature and place the aggregates, binder and mixing
equipment into the oven. A dial thermometer with a range of 50° F to 400° F should be placed
in each pan of material and in the binder to ensure that the material has achieved the proper
mixing temperature.
Aggregates Mass in grams #8 865.7
Sand 301.1 #10 696.3
Bag house fines 18.8 Liquid Asphalt 128.0
Total 2009.9
VDOT: Asphalt Concrete Mix Design Jan. 2005
5-12
Once the material has reached the specified mixing temperature proceed with combining the
aggregates and liquid asphalt (remember that the first sample to be mixed is the butter batch).
Charge the mixing bowl with the heated aggregate and mix thoroughly. Form a crater in the
dry blended aggregate, and weigh the required amount of binder into the mix. Immediately
initiate mixing. AASHTO R35-04 does allow the material to be mixed using a mechanical
mixer or hand mixing. Whichever method of mixing is used, mixing must be uniform and with
minimal loss of temperature.
After mixing, the materials must go thru an aging period. AASHTO R30-02 section 7.1.2
states that the material must be aged at the specified compaction temperature for 2 hours ± 5
minutes. The compaction temperature for this mix (refer to section 211.03(d) 6 of the Road
and Bridge Specifications) is 285° F to 290° F.
After the material has aged, the next step is to compact the specimen in the Gyratory
compactor (AASHTO T312-01). The mix design technician will need to record the height at
initialN and designN for each specimen, and then determine the average height at initialN and
designN for each asphalt blend. Allow the compacted specimens to cool to room temperature
(16 Hours) before proceeding with the Bulk Specific Gravity (AASHTO T166-00) test.
Now that the mix design technician has performed the Maximum Theoretical Specific Gravity
(AASHTO T209-99) and Bulk Specific Gravity (AASHTO T166-00), determine the mmG and
mbG of each asphalt blend.
• 1st Asphalt Blend @ 5.9% Asphalt
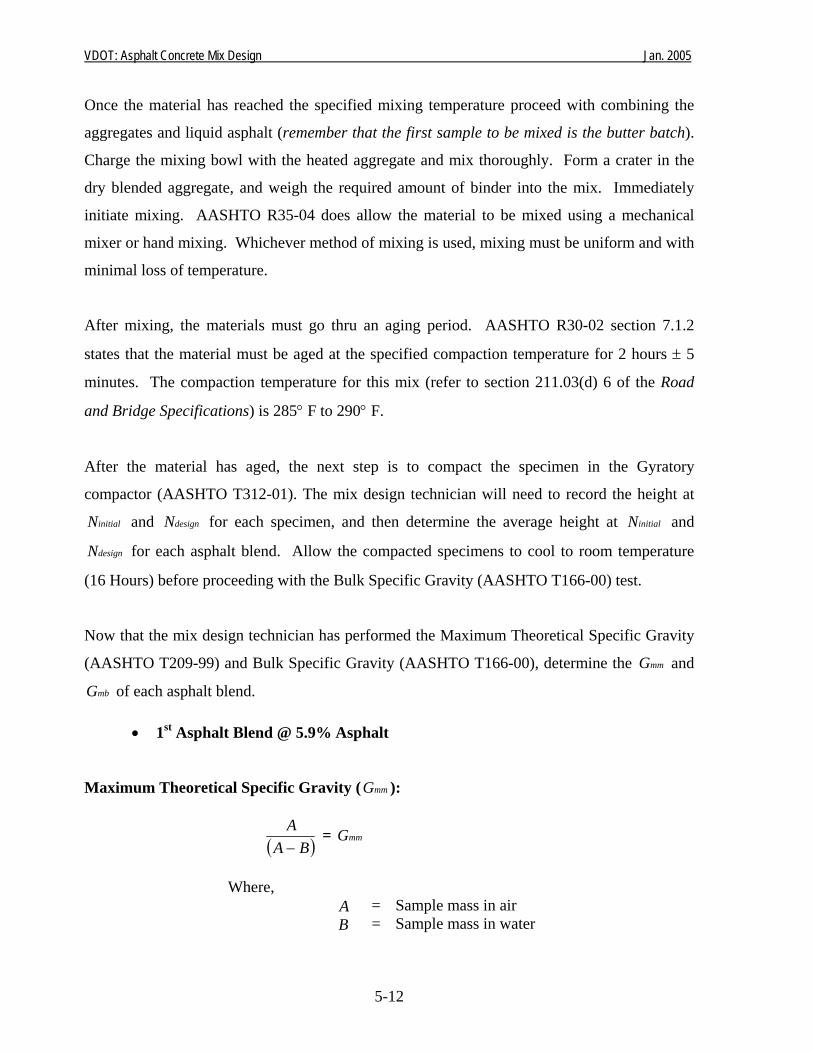
Maximum Theoretical Specific Gravity ( mmG ):
( )BAA−
= mmG
Where,
A = Sample mass in air B = Sample mass in water
VDOT: Asphalt Concrete Mix Design Jan. 2005
5-13
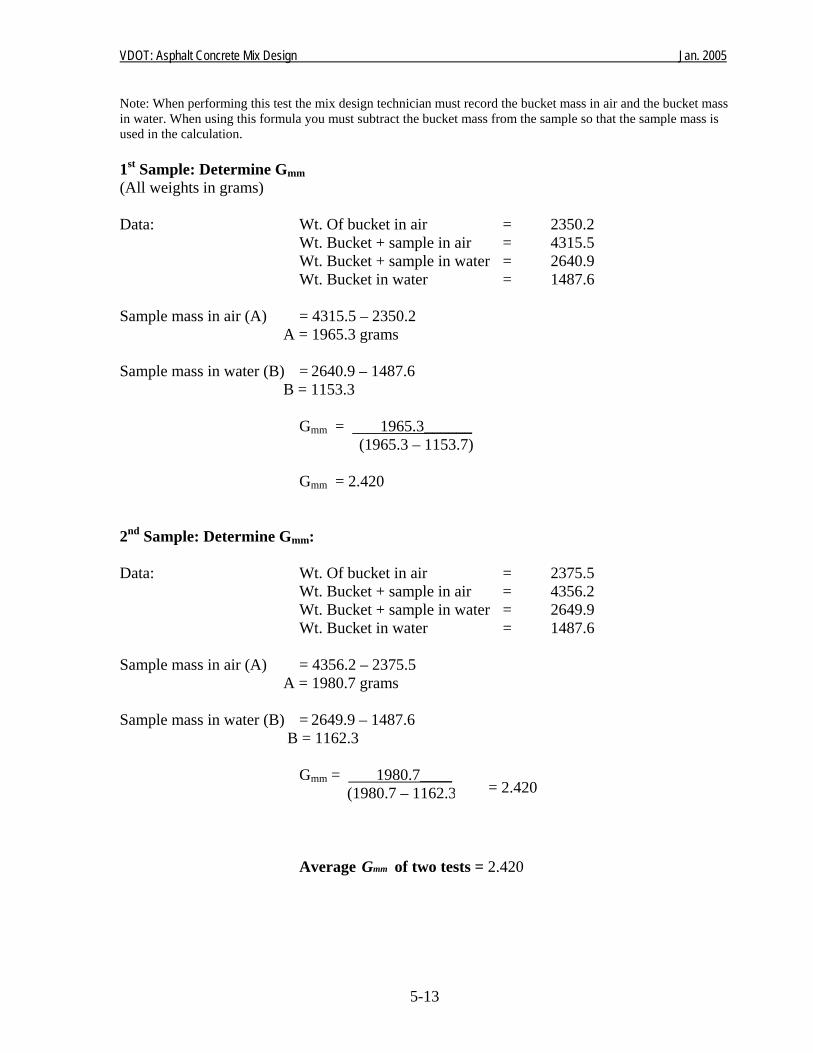
Note: When performing this test the mix design technician must record the bucket mass in air and the bucket mass in water. When using this formula you must subtract the bucket mass from the sample so that the sample mass is used in the calculation. 1st Sample: Determine Gmm (All weights in grams) Data: Wt. Of bucket in air = 2350.2 Wt. Bucket + sample in air = 4315.5 Wt. Bucket + sample in water = 2640.9 Wt. Bucket in water = 1487.6 Sample mass in air (A) = 4315.5 – 2350.2 A = 1965.3 grams Sample mass in water (B) = 2640.9 – 1487.6 B = 1153.3 Gmm = 1965.3______ (1965.3 – 1153.7)
Gmm = 2.420 2nd Sample: Determine Gmm: Data: Wt. Of bucket in air = 2375.5 Wt. Bucket + sample in air = 4356.2 Wt. Bucket + sample in water = 2649.9 Wt. Bucket in water = 1487.6 Sample mass in air (A) = 4356.2 – 2375.5 A = 1980.7 grams Sample mass in water (B) = 2649.9 – 1487.6 B = 1162.3 Gmm = 1980.7____ (1980.7 – 1162.3)
Average mmG of two tests = 2.420
= 2.420
VDOT: Asphalt Concrete Mix Design Jan. 2005
5-14
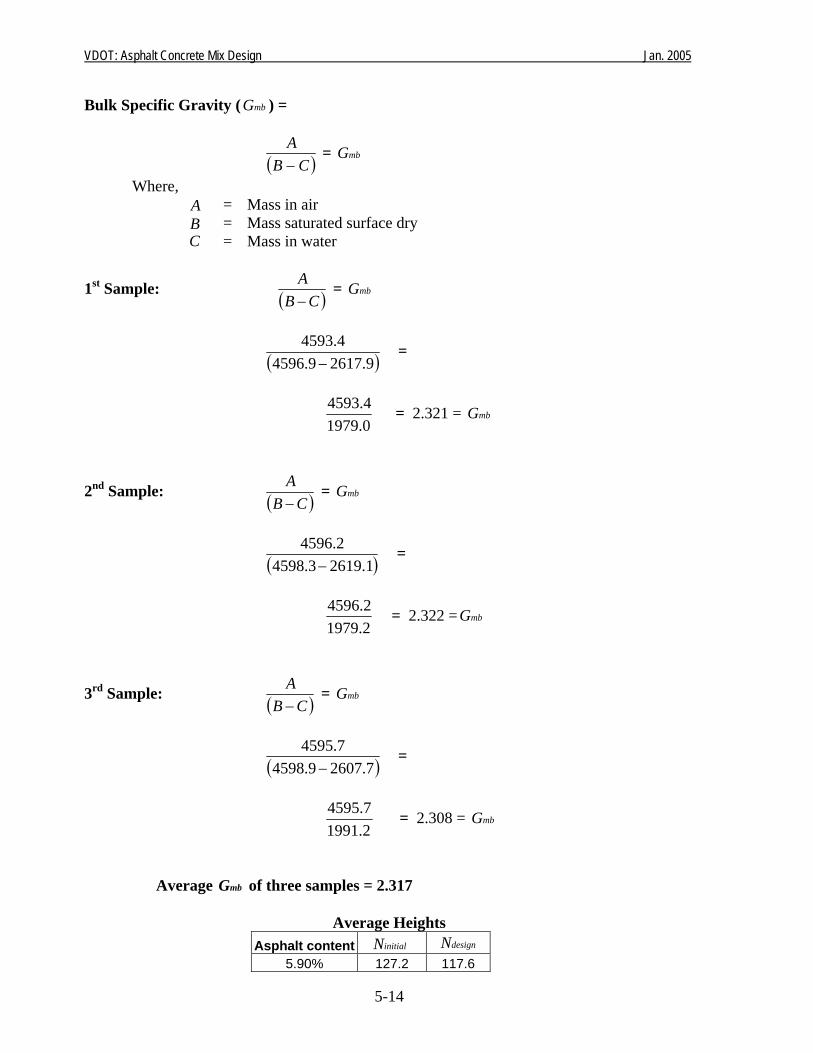
Bulk Specific Gravity ( mbG ) =
( )CBA−
= mbG
Where, A = Mass in air B = Mass saturated surface dry C = Mass in water
1st Sample: ( )CBA−
= mbG
( )9.26179.45964.4593
− =
0.19794.4593 = 2.321 = mbG
2nd Sample: ( )CBA−
= mbG
( )1.26193.45982.4596
− =
2.19792.4596 = 2.322 = mbG
3rd Sample: ( )CBA−
= mbG
( )7.26079.45987.4595
− =
2.19917.4595 = 2.308 = mbG
Average mbG of three samples = 2.317
Average Heights Asphalt content initialN designN
5.90% 127.2 117.6
VDOT: Asphalt Concrete Mix Design Jan. 2005
5-15
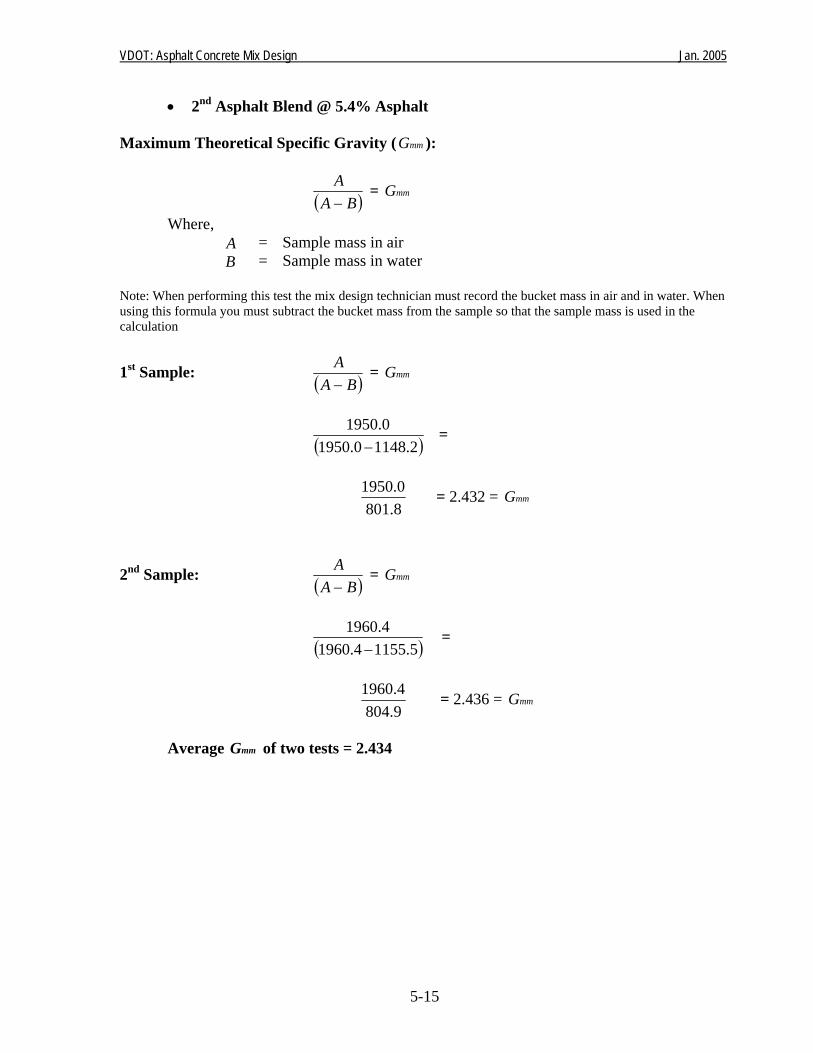
• 2nd Asphalt Blend @ 5.4% Asphalt Maximum Theoretical Specific Gravity ( mmG ):
( )BAA−
= mmG
Where, A = Sample mass in air B = Sample mass in water
Note: When performing this test the mix design technician must record the bucket mass in air and in water. When using this formula you must subtract the bucket mass from the sample so that the sample mass is used in the calculation
1st Sample: ( )BAA−
= mmG
( )2.11480.19500.1950
− =
8.8010.1950 = 2.432 = mmG
2nd Sample: ( )BAA−
= mmG
( )5.11554.19604.1960
− =
9.8044.1960 = 2.436 = mmG
Average mmG of two tests = 2.434
VDOT: Asphalt Concrete Mix Design Jan. 2005
5-16
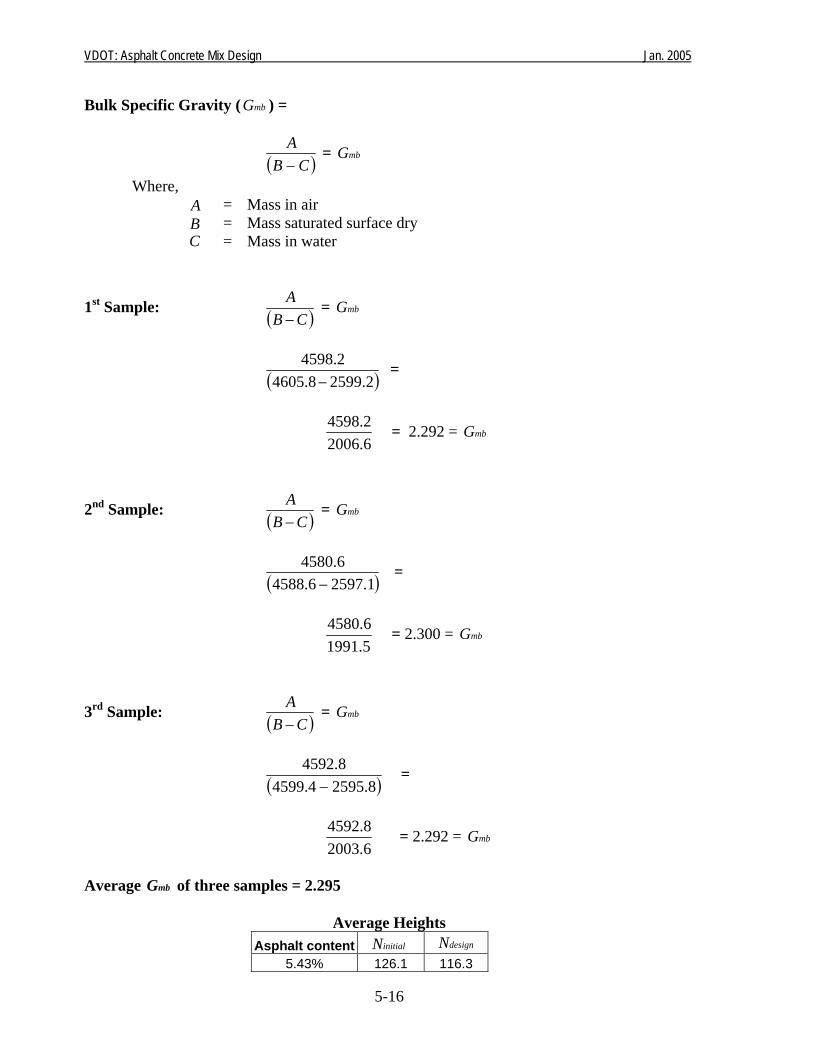
Bulk Specific Gravity ( mbG ) =
( )CBA−
= mbG
Where, A = Mass in air B = Mass saturated surface dry C = Mass in water
1st Sample: ( )CBA−
= mbG
( )2.25998.46052.4598
− =
6.20062.4598 = 2.292 = mbG
2nd Sample: ( )CBA−
= mbG
( )1.25976.45886.4580
− =
5.19916.4580 = 2.300 = mbG
3rd Sample: ( )CBA−
= mbG
( )8.25954.45998.4592
− =
6.20038.4592 = 2.292 = mbG
Average mbG of three samples = 2.295
Average Heights Asphalt content initialN designN
5.43% 126.1 116.3
VDOT: Asphalt Concrete Mix Design Jan. 2005
5-17
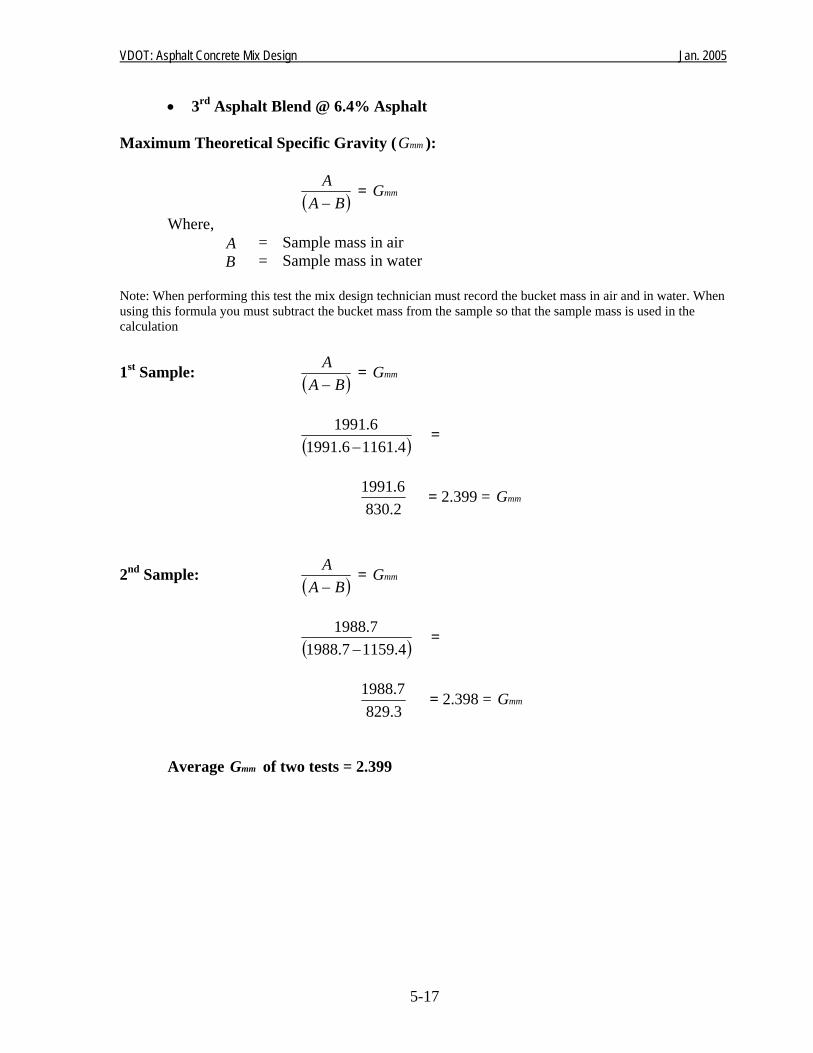
• 3rd Asphalt Blend @ 6.4% Asphalt
Maximum Theoretical Specific Gravity ( mmG ):
( )BAA−
= mmG
Where, A = Sample mass in air B = Sample mass in water
Note: When performing this test the mix design technician must record the bucket mass in air and in water. When using this formula you must subtract the bucket mass from the sample so that the sample mass is used in the calculation
1st Sample: ( )BAA−
= mmG
( )4.11616.19916.1991
− =
2.8306.1991 = 2.399 = mmG
2nd Sample: ( )BAA−
= mmG
( )4.11597.19887.1988
− =
3.8297.1988 = 2.398 = mmG
Average mmG of two tests = 2.399
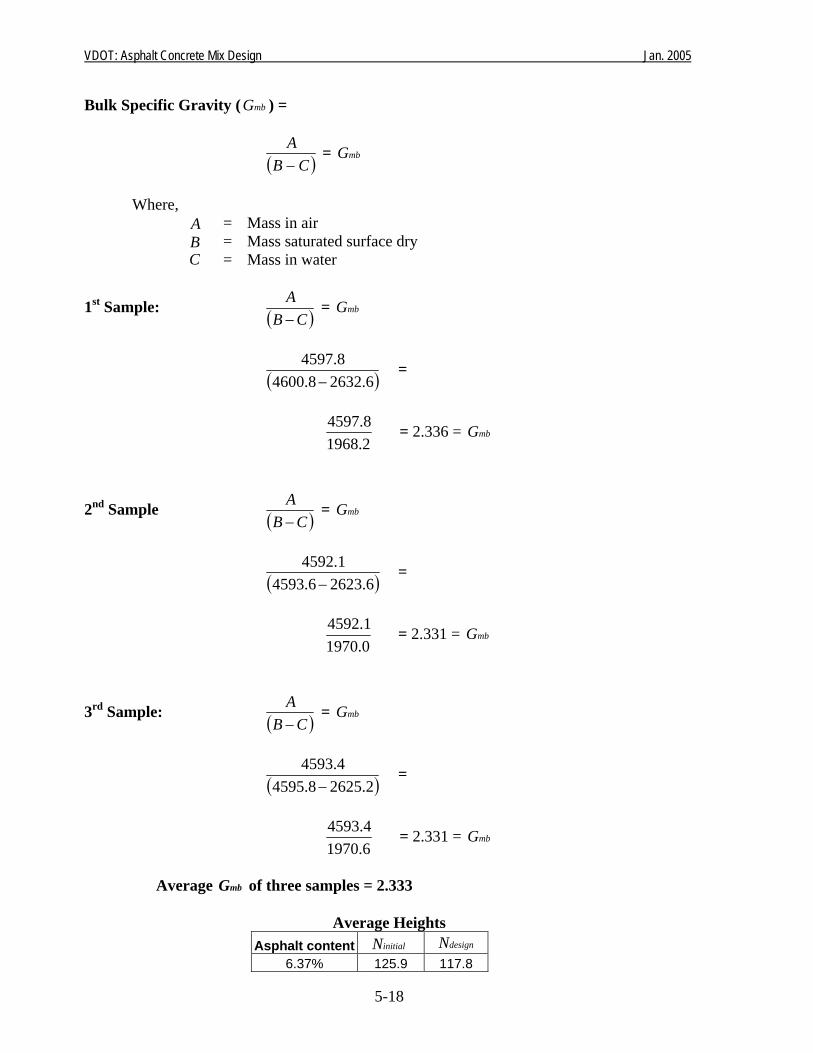
VDOT: Asphalt Concrete Mix Design Jan. 2005
5-18
Bulk Specific Gravity ( mbG ) =
( )CBA−
= mbG
Where,
A = Mass in air B = Mass saturated surface dry C = Mass in water
1st Sample: ( )CBA−
= mbG
( )6.26328.46008.4597
− =
2.19688.4597 = 2.336 = mbG
2nd Sample ( )CBA−
= mbG
( )6.26236.45931.4592
− =
0.19701.4592 = 2.331 = mbG
3rd Sample: ( )CBA−
= mbG
( )2.26258.45954.4593
− =
6.19704.4593 = 2.331 = mbG
Average mbG of three samples = 2.333
Average Heights Asphalt content initialN designN
6.37% 125.9 117.8
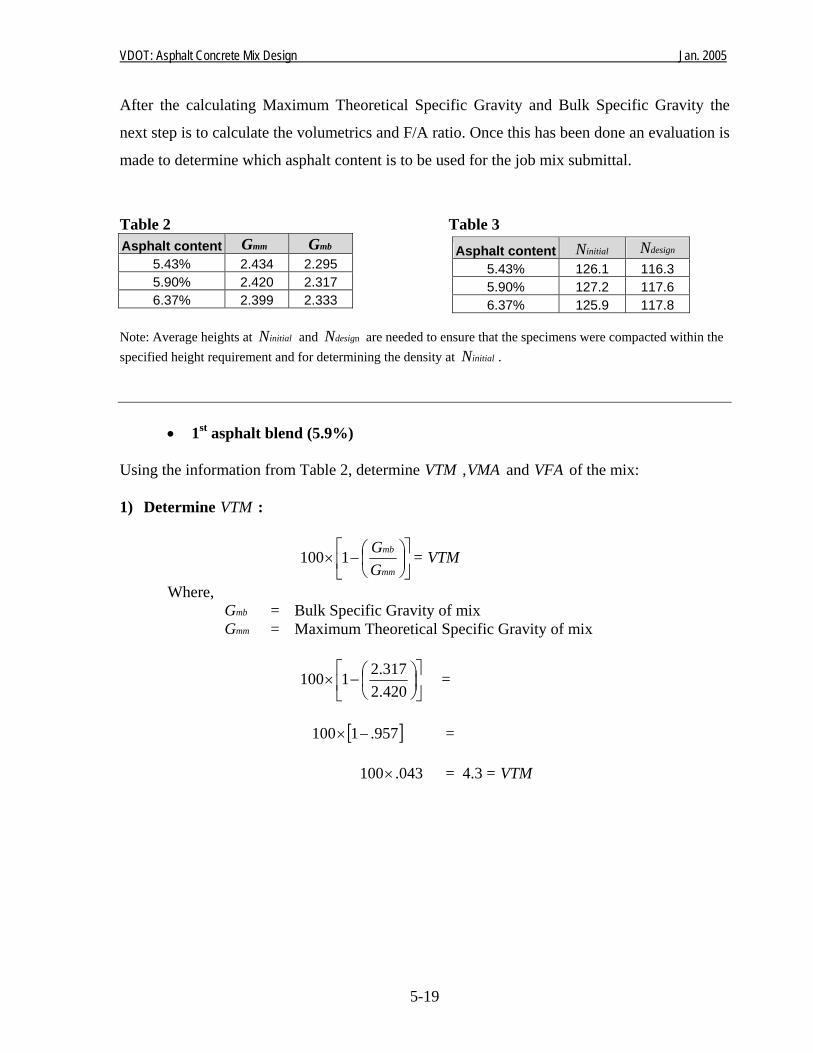
VDOT: Asphalt Concrete Mix Design Jan. 2005
5-19
After the calculating Maximum Theoretical Specific Gravity and Bulk Specific Gravity the
next step is to calculate the volumetrics and F/A ratio. Once this has been done an evaluation is
made to determine which asphalt content is to be used for the job mix submittal.
Table 2 Asphalt content mmG mbG
5.43% 2.434 2.295 5.90% 2.420 2.317 6.37% 2.399 2.333
Table 3
Note: Average heights at initialN and ndesigN are needed to ensure that the specimens were compacted within the specified height requirement and for determining the density at initialN .
• 1st asphalt blend (5.9%)
Using the information from Table 2, determine VTM ,VMA and VFA of the mix: 1) Determine VTM :
⎥⎦
⎤⎢⎣
⎡⎟⎠⎞
⎜⎝⎛−×
mm
mb
GG1100 = VTM
Where, mbG = Bulk Specific Gravity of mix mmG = Maximum Theoretical Specific Gravity of mix
⎥⎦
⎤⎢⎣
⎡⎟⎠⎞
⎜⎝⎛−×
420.2317.21100 =
[ ]957.1100 −× =
043.100× = 4.3 = VTM
Asphalt content initialN designN 5.43% 126.1 116.3 5.90% 127.2 117.6 6.37% 125.9 117.8
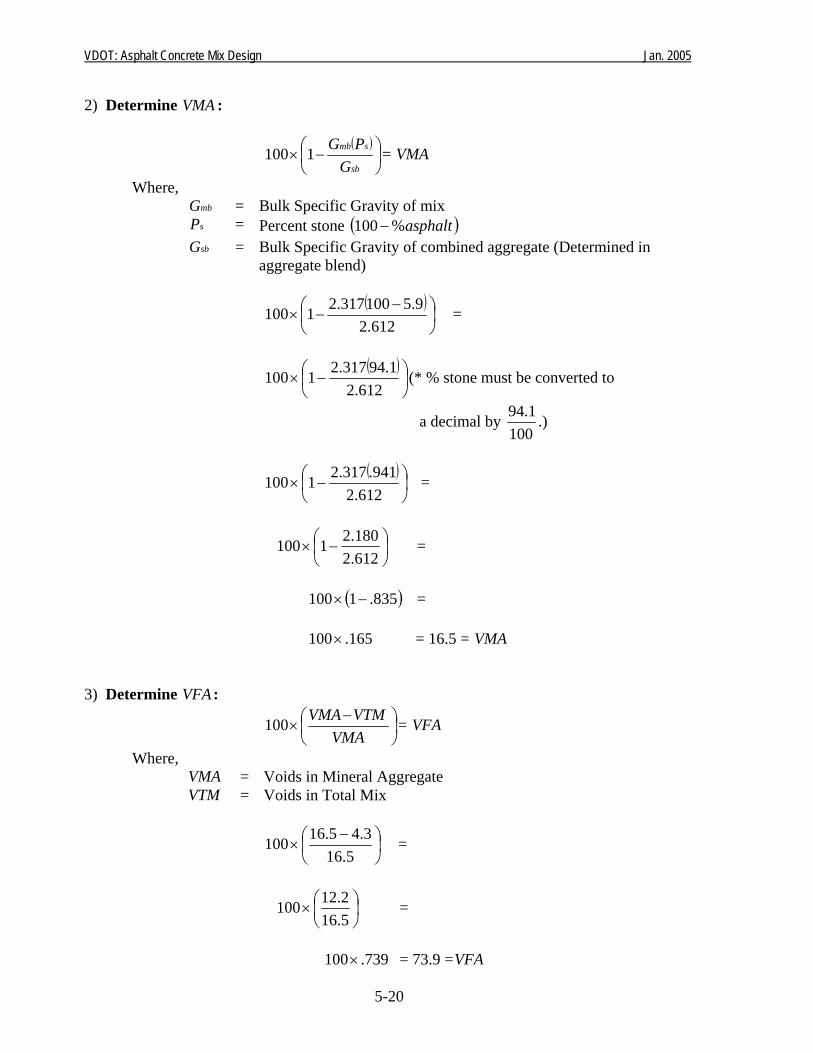
VDOT: Asphalt Concrete Mix Design Jan. 2005
5-20
2) Determine VMA :
( )⎟⎠⎞
⎜⎝⎛ −×
sb
smb
GPG1100 = VMA
Where, mbG = Bulk Specific Gravity of mix sP = Percent stone ( )asphalt%100− sbG = Bulk Specific Gravity of combined aggregate (Determined in
aggregate blend)
( )⎟⎠⎞
⎜⎝⎛ −−×
612.29.5100317.21100 =
( )
⎟⎠⎞
⎜⎝⎛ −×
612.21.94317.21100 (* % stone must be converted to
a decimal by 100
1.94 .)
( )
⎟⎠⎞
⎜⎝⎛ −×
612.2941.317.21100 =
⎟⎠⎞
⎜⎝⎛ −×
612.2180.21100 =
( )835.1100 −× =
165.100× = 16.5 = VMA 3) Determine VFA :
⎟⎠⎞
⎜⎝⎛ −
×VMA
VTMVMA100 = VFA
Where, VMA = Voids in Mineral Aggregate VTM = Voids in Total Mix
⎟⎠⎞
⎜⎝⎛ −
×5.16
3.45.16100 =
⎟⎠⎞
⎜⎝⎛×
5.162.12100 =
739.100× = 73.9 =VFA
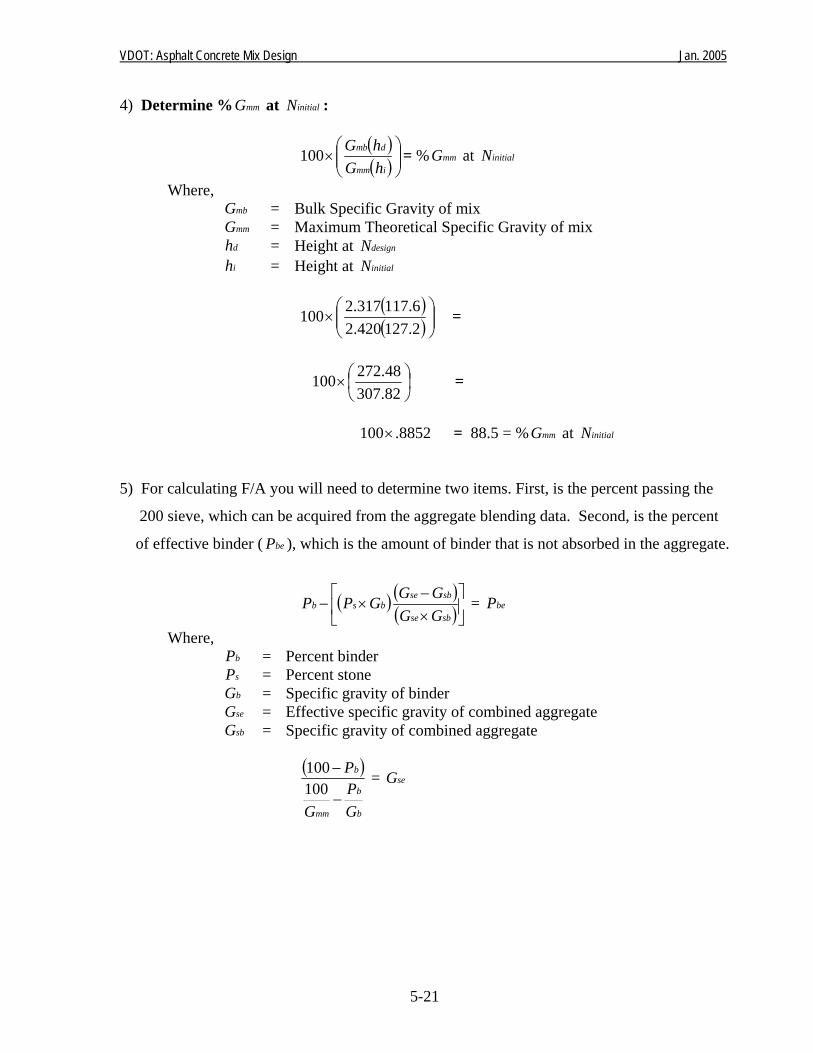
VDOT: Asphalt Concrete Mix Design Jan. 2005
5-21
4) Determine % mmG at initialN :
( )( )⎟⎟⎠
⎞⎜⎜⎝
⎛×
imm
dmb
hGhG100 = % mmG at initialN
Where, mbG = Bulk Specific Gravity of mix mmG = Maximum Theoretical Specific Gravity of mix
dh = Height at designN ih = Height at initialN
( )( )⎟⎟⎠
⎞⎜⎜⎝
⎛×
2.127420.26.117317.2100 =
⎟⎠⎞
⎜⎝⎛×
82.30748.272100 =
8852.100× = 88.5 = % mmG at initialN
5) For calculating F/A you will need to determine two items. First, is the percent passing the
200 sieve, which can be acquired from the aggregate blending data. Second, is the percent
of effective binder ( beP ), which is the amount of binder that is not absorbed in the aggregate.
( ) ( )( )⎥⎦
⎤⎢⎣
⎡×−
×−sbse
sbsebsb
GGGGGPP = beP
Where, bP = Percent binder sP = Percent stone bG = Specific gravity of binder seG = Effective specific gravity of combined aggregate sbG = Specific gravity of combined aggregate
( )
b
b
mm
b
GP
G
P
−
−100100 = seG
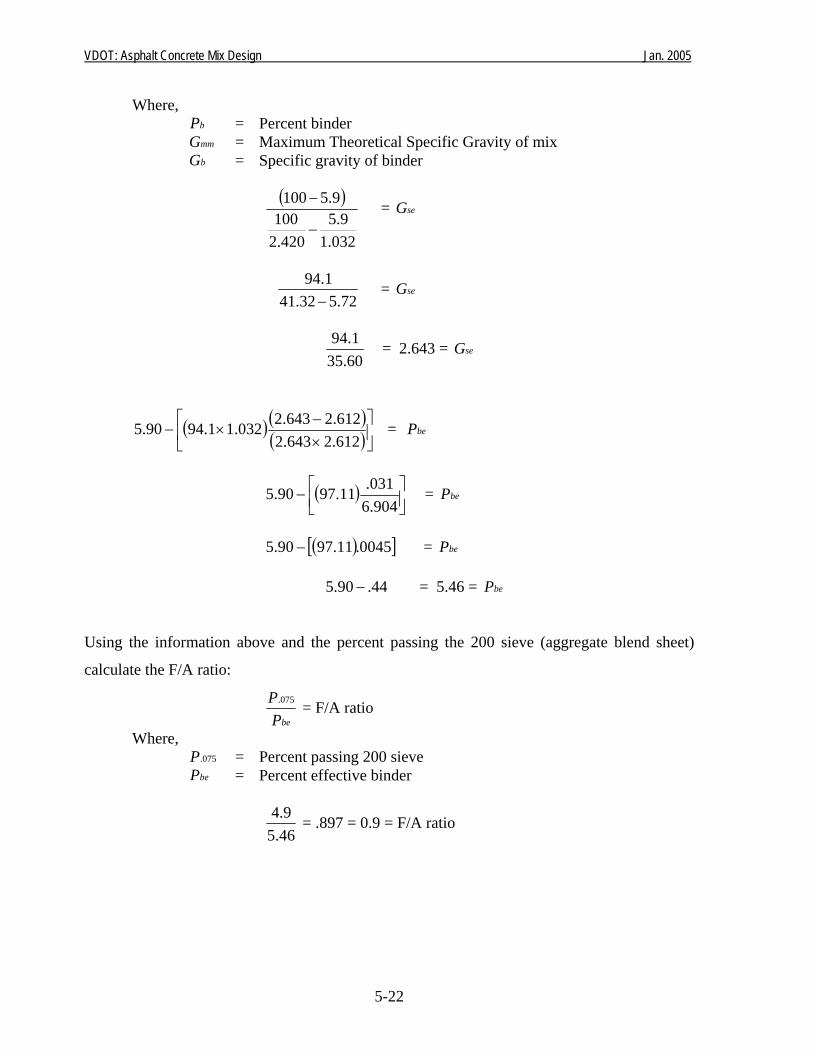
VDOT: Asphalt Concrete Mix Design Jan. 2005
5-22
Where, bP = Percent binder mmG = Maximum Theoretical Specific Gravity of mix bG = Specific gravity of binder
( )
032.19.5
420.2100
9.5100
−
− = seG
72.532.411.94−
= seG
60.351.94 = 2.643 = seG
( ) ( )( )⎥⎦
⎤⎢⎣
⎡×−
×−612.2643.2612.2643.2032.11.9490.5 = beP
( ) ⎥⎦⎤
⎢⎣⎡−
904.6031.11.9790.5 = beP
( )[ ]0045.11.9790.5 − = beP
44.90.5 − = 5.46 = beP
Using the information above and the percent passing the 200 sieve (aggregate blend sheet)
calculate the F/A ratio:
bePP 075. = F/A ratio
Where, 075.P = Percent passing 200 sieve
beP = Percent effective binder
46.59.4 = .897 = 0.9 = F/A ratio
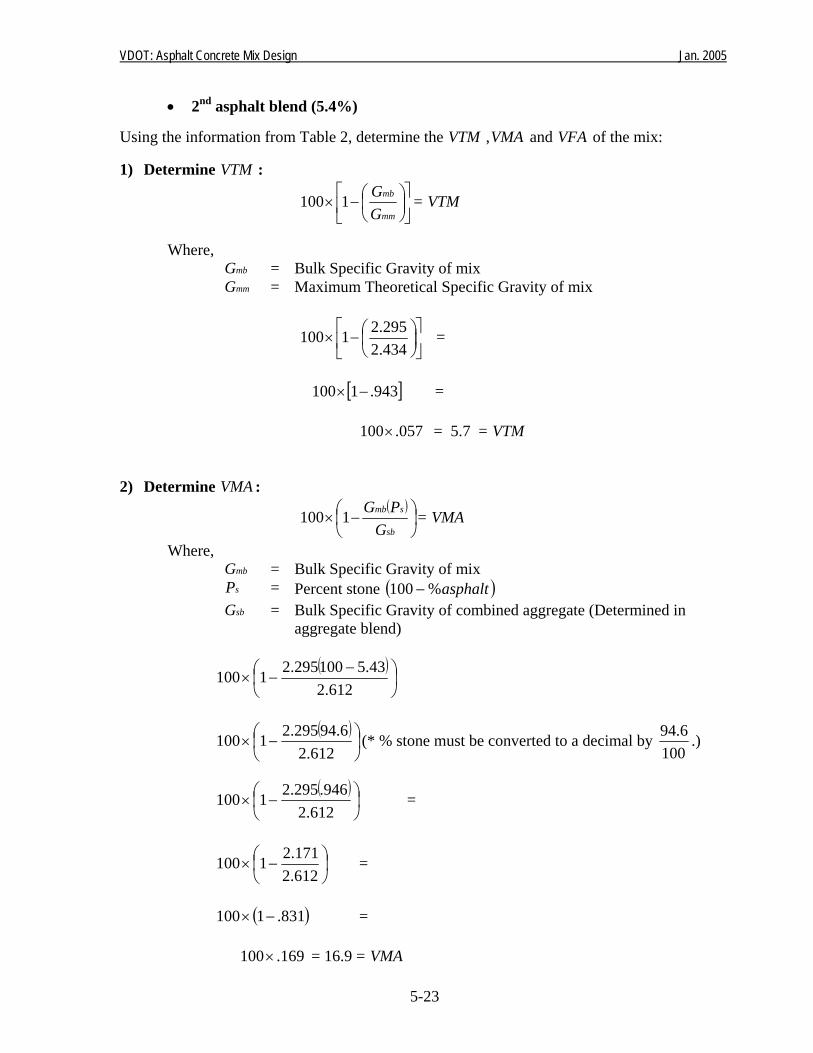
VDOT: Asphalt Concrete Mix Design Jan. 2005
5-23
• 2nd asphalt blend (5.4%)
Using the information from Table 2, determine the VTM ,VMA and VFA of the mix: 1) Determine VTM :
⎥⎦
⎤⎢⎣
⎡⎟⎠⎞
⎜⎝⎛−×
mm
mb
GG1100 = VTM
Where,
mbG = Bulk Specific Gravity of mix mmG = Maximum Theoretical Specific Gravity of mix
⎥⎦
⎤⎢⎣
⎡⎟⎠⎞
⎜⎝⎛−×
434.2295.21100 =
[ ]943.1100 −× =
057.100× = 5.7 = VTM
2) Determine VMA : ( )
⎟⎠⎞
⎜⎝⎛ −×
sb
smb
GPG1100 = VMA
Where, mbG = Bulk Specific Gravity of mix sP = Percent stone ( )asphalt%100 − sbG = Bulk Specific Gravity of combined aggregate (Determined in
aggregate blend)
( )⎟⎠⎞
⎜⎝⎛ −−×
612.243.5100295.21100
( )
⎟⎠⎞
⎜⎝⎛ −×
612.26.94295.21100 (* % stone must be converted to a decimal by
1006.94 .)
( )
⎟⎠⎞
⎜⎝⎛ −×
612.2946.295.21100 =
⎟⎠⎞
⎜⎝⎛ −×
612.2171.21100 =
( )831.1100 −× =
169.100× = 16.9 = VMA
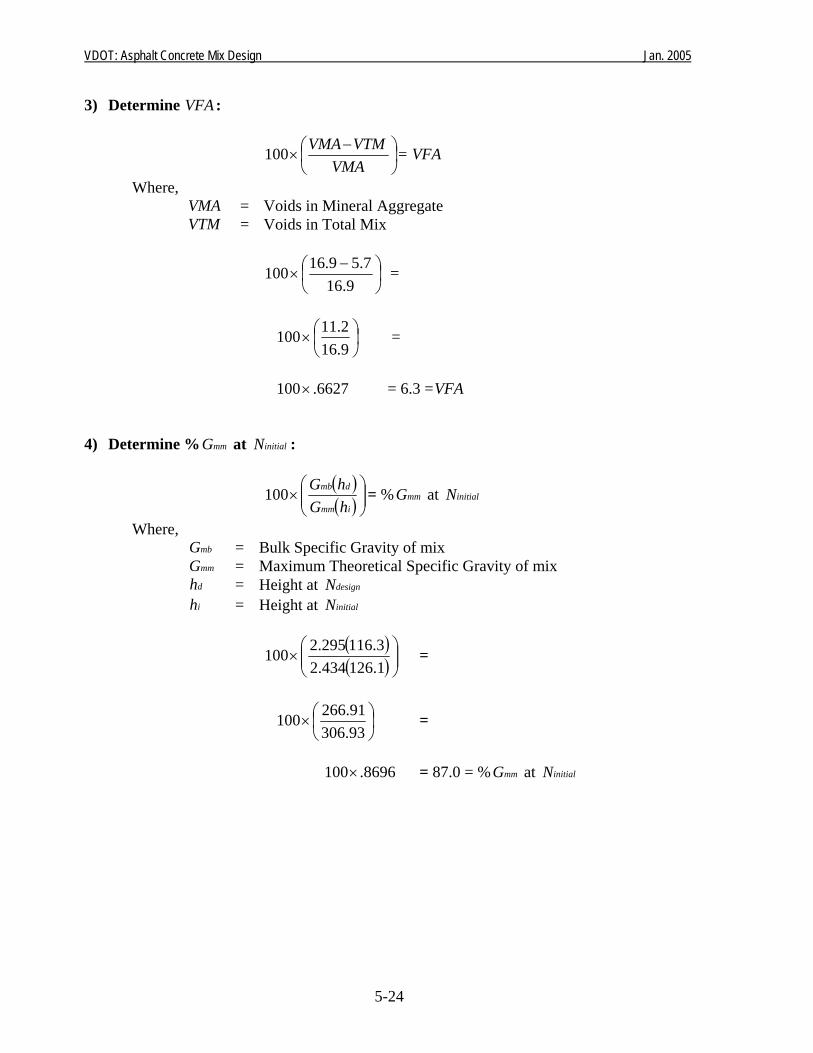
VDOT: Asphalt Concrete Mix Design Jan. 2005
5-24
3) Determine VFA :
⎟⎠⎞
⎜⎝⎛ −
×VMA
VTMVMA100 = VFA
Where, VMA = Voids in Mineral Aggregate VTM = Voids in Total Mix
⎟⎠⎞
⎜⎝⎛ −
×9.16
7.59.16100 =
⎟⎠⎞
⎜⎝⎛×
9.162.11100 =
6627.100× = 6.3 =VFA
4) Determine % mmG at initialN :
( )( )⎟⎟⎠
⎞⎜⎜⎝
⎛×
imm
dmb
hGhG100 = % mmG at initialN
Where, mbG = Bulk Specific Gravity of mix mmG = Maximum Theoretical Specific Gravity of mix
dh = Height at designN ih = Height at initialN
( )( )⎟⎟⎠
⎞⎜⎜⎝
⎛×
1.126434.23.116295.2100 =
⎟⎠⎞
⎜⎝⎛×
93.30691.266100 =
8696.100× = 87.0 = % mmG at initialN
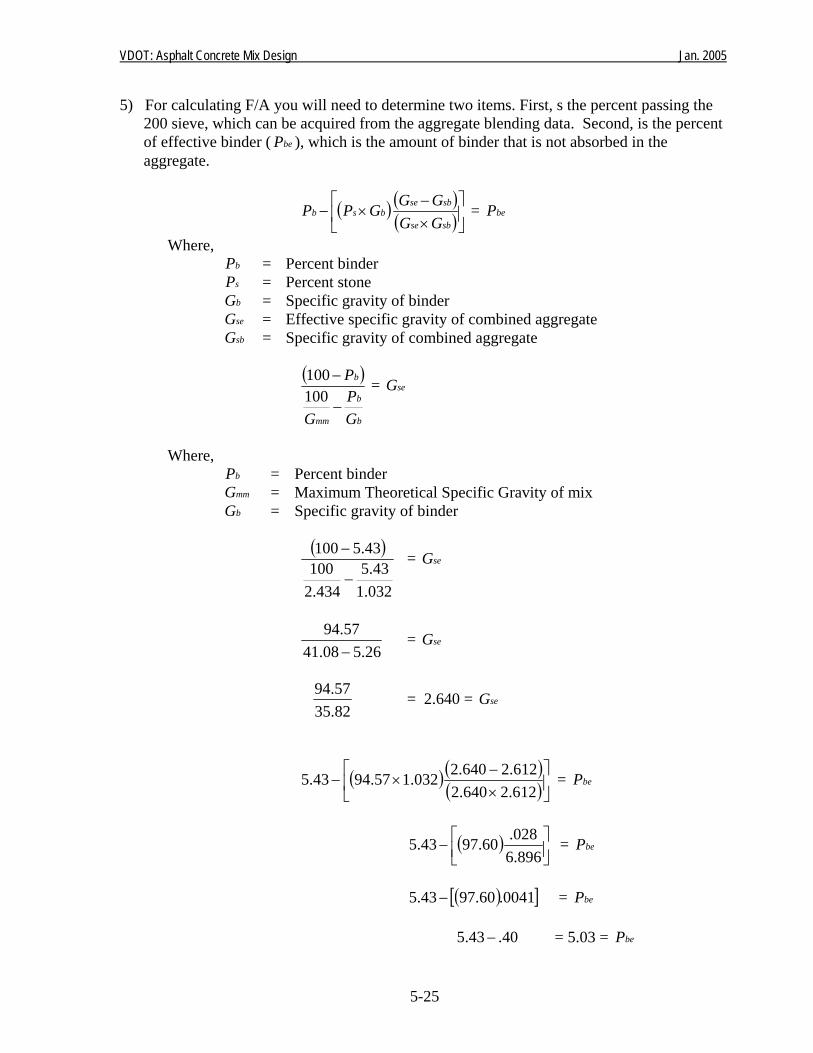
VDOT: Asphalt Concrete Mix Design Jan. 2005
5-25
5) For calculating F/A you will need to determine two items. First, s the percent passing the 200 sieve, which can be acquired from the aggregate blending data. Second, is the percent of effective binder ( beP ), which is the amount of binder that is not absorbed in the aggregate.
( ) ( )( )⎥⎦
⎤⎢⎣
⎡×−
×−sbse
sbsebsb
GGGGGPP = beP
Where, bP = Percent binder sP = Percent stone bG = Specific gravity of binder seG = Effective specific gravity of combined aggregate sbG = Specific gravity of combined aggregate
( )
b
b
mm
b
GP
G
P
−
−100100 = seG
Where,
bP = Percent binder mmG = Maximum Theoretical Specific Gravity of mix bG = Specific gravity of binder
( )
032.143.5
434.2100
43.5100
−
− = seG
26.508.4157.94−
= seG
82.3557.94 = 2.640 = seG
( ) ( )( )⎥⎦
⎤⎢⎣
⎡×−
×−612.2640.2612.2640.2032.157.9443.5 = beP
( ) ⎥⎦⎤
⎢⎣⎡−
896.6028.60.9743.5 = beP
( )[ ]0041.60.9743.5 − = beP
40.43.5 − = 5.03 = beP
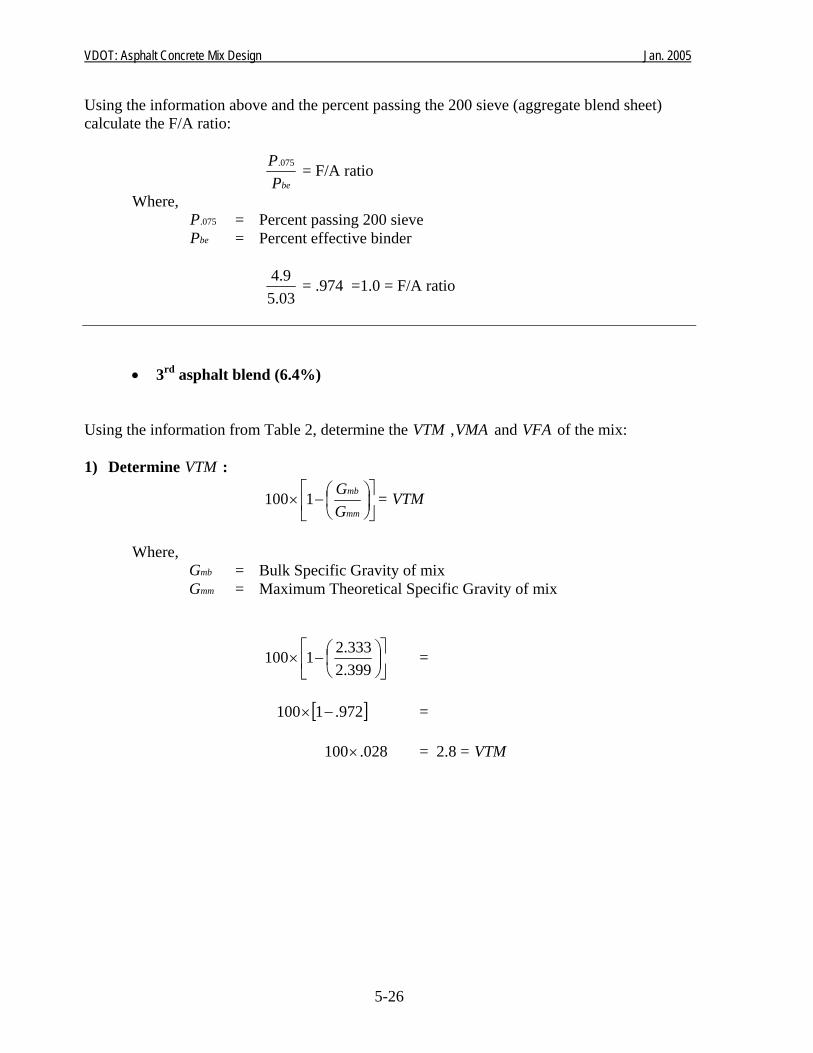
VDOT: Asphalt Concrete Mix Design Jan. 2005
5-26
Using the information above and the percent passing the 200 sieve (aggregate blend sheet) calculate the F/A ratio:
bePP 075. = F/A ratio
Where, 075.P = Percent passing 200 sieve
beP = Percent effective binder
03.59.4 = .974 =1.0 = F/A ratio
• 3rd asphalt blend (6.4%) Using the information from Table 2, determine the VTM ,VMA and VFA of the mix: 1) Determine VTM :
⎥⎦
⎤⎢⎣
⎡⎟⎠⎞
⎜⎝⎛−×
mm
mb
GG1100 = VTM
Where,
mbG = Bulk Specific Gravity of mix mmG = Maximum Theoretical Specific Gravity of mix
⎥⎦
⎤⎢⎣
⎡⎟⎠⎞
⎜⎝⎛−×
399.2333.21100 =
[ ]972.1100 −× =
028.100× = 2.8 = VTM
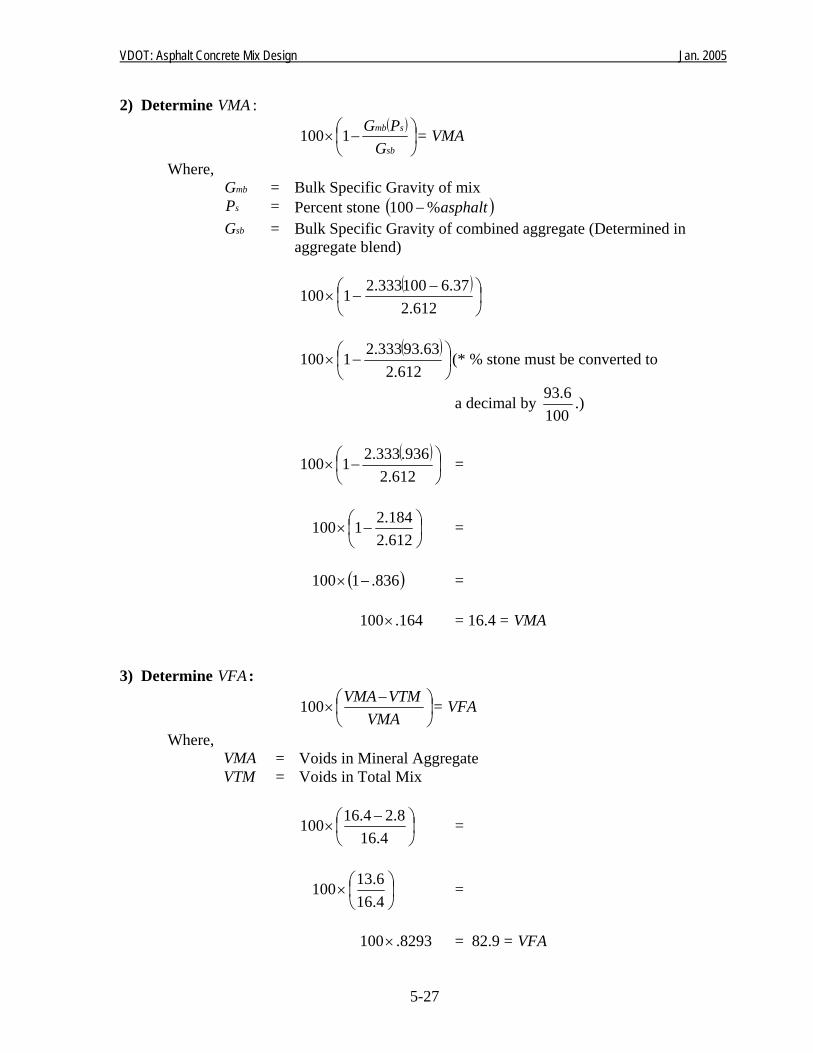
VDOT: Asphalt Concrete Mix Design Jan. 2005
5-27
2) Determine VMA : ( )
⎟⎠⎞
⎜⎝⎛ −×
sb
smb
GPG1100 = VMA
Where, mbG = Bulk Specific Gravity of mix sP = Percent stone ( )asphalt%100− sbG = Bulk Specific Gravity of combined aggregate (Determined in
aggregate blend)
( )⎟⎠⎞
⎜⎝⎛ −−×
612.237.6100333.21100
( )
⎟⎠⎞
⎜⎝⎛ −×
612.263.93333.21100 (* % stone must be converted to
a decimal by 100
6.93 .)
( )
⎟⎠⎞
⎜⎝⎛ −×
612.2936.333.21100 =
⎟⎠⎞
⎜⎝⎛ −×
612.2184.21100 =
( )836.1100 −× =
164.100× = 16.4 = VMA
3) Determine VFA :
⎟⎠⎞
⎜⎝⎛ −
×VMA
VTMVMA100 = VFA
Where, VMA = Voids in Mineral Aggregate VTM = Voids in Total Mix
⎟⎠⎞
⎜⎝⎛ −
×4.16
8.24.16100 =
⎟⎠⎞
⎜⎝⎛×
4.166.13100 =
8293.100× = 82.9 = VFA
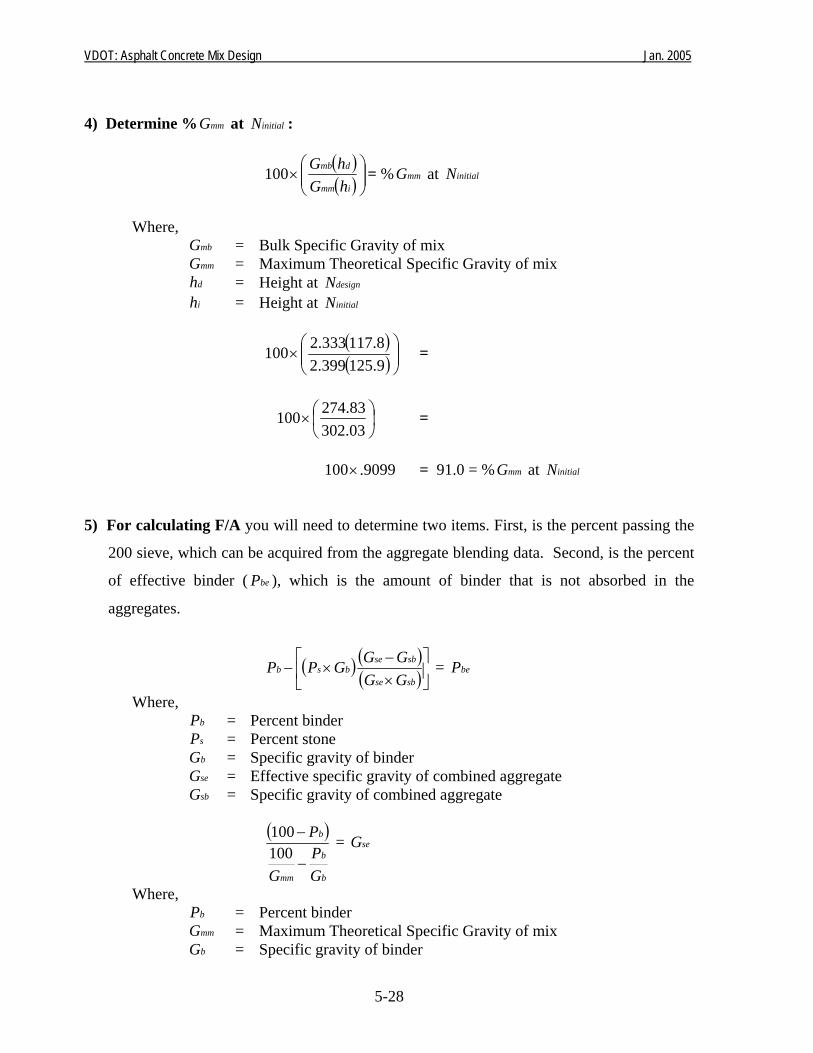
VDOT: Asphalt Concrete Mix Design Jan. 2005
5-28
4) Determine % mmG at initialN :
( )( )⎟⎟⎠
⎞⎜⎜⎝
⎛×
imm
dmb
hGhG100 = % mmG at initialN
Where,
mbG = Bulk Specific Gravity of mix mmG = Maximum Theoretical Specific Gravity of mix
dh = Height at designN ih = Height at initialN
( )( )⎟⎟⎠
⎞⎜⎜⎝
⎛×
9.125399.28.117333.2100 =
⎟⎠⎞
⎜⎝⎛×
03.30283.274100 =
9099.100× = 91.0 = % mmG at initialN
5) For calculating F/A you will need to determine two items. First, is the percent passing the
200 sieve, which can be acquired from the aggregate blending data. Second, is the percent
of effective binder ( beP ), which is the amount of binder that is not absorbed in the
aggregates.
( ) ( )( )⎥⎦
⎤⎢⎣
⎡×−
×−sbse
sbsebsb
GGGGGPP = beP
Where, bP = Percent binder sP = Percent stone bG = Specific gravity of binder seG = Effective specific gravity of combined aggregate sbG = Specific gravity of combined aggregate
( )
b
b
mm
b
GP
G
P
−
−100100 = seG
Where, bP = Percent binder mmG = Maximum Theoretical Specific Gravity of mix bG = Specific gravity of binder

VDOT: Asphalt Concrete Mix Design Jan. 2005
5-29
( )
032.137.6
399.2100
37.6100
−
− = seG
17.668.4163.93−
= seG
51.3563.93 = 2.637 = seG
( ) ( )( )⎥⎦
⎤⎢⎣
⎡×−
×−612.2637.2612.2637.2032.163.9337.6 = beP
( ) ⎥⎦⎤
⎢⎣⎡−
888.6025.63.9637.6 = beP
( )[ ]0036.63.9637.6 − = beP
35.37.6 − = 6.02 = beP
Using the information above and the percent passing the 200 sieve (aggregate blend sheet) calculate the F/A ratio:
bePP 075. = F/A ratio
Where, 075.P = Percent passing 200 sieve
beP = Percent effective binder
02.69.4 = .814
0.8 = F/A ratio
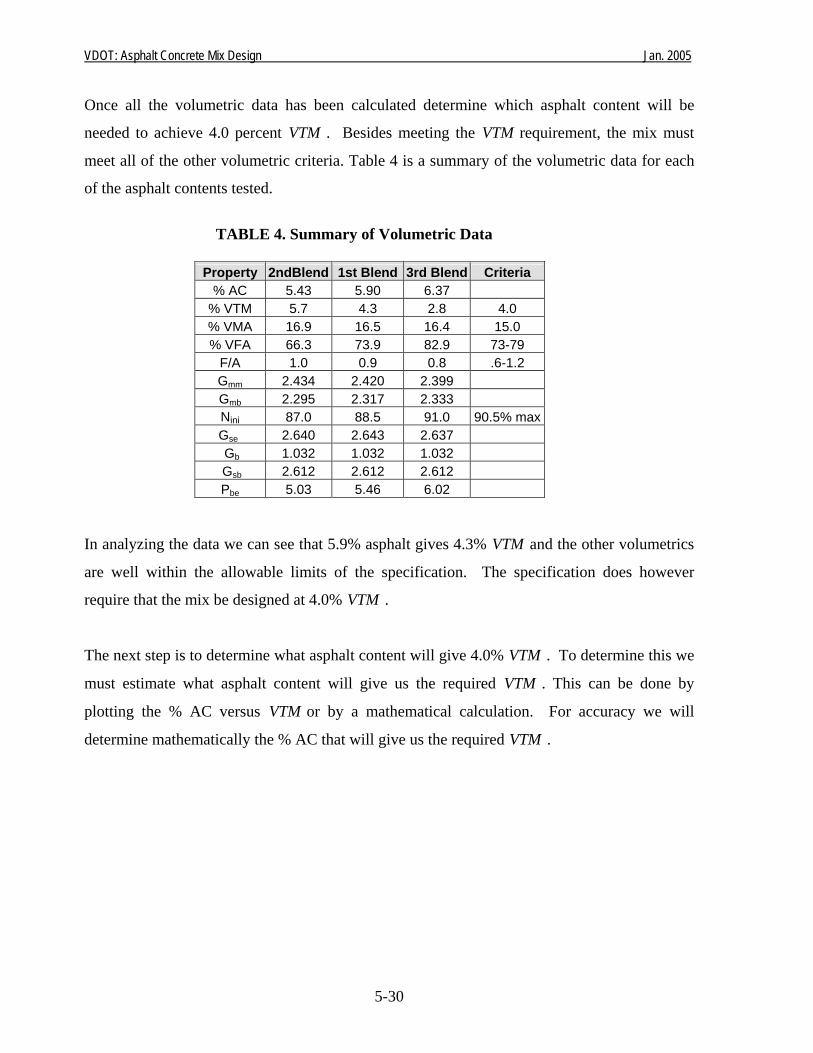
VDOT: Asphalt Concrete Mix Design Jan. 2005
5-30
Once all the volumetric data has been calculated determine which asphalt content will be
needed to achieve 4.0 percent VTM . Besides meeting the VTM requirement, the mix must
meet all of the other volumetric criteria. Table 4 is a summary of the volumetric data for each
of the asphalt contents tested.
TABLE 4. Summary of Volumetric Data
Property 2ndBlend 1st Blend 3rd Blend Criteria % AC 5.43 5.90 6.37
% VTM 5.7 4.3 2.8 4.0 % VMA 16.9 16.5 16.4 15.0 % VFA 66.3 73.9 82.9 73-79
F/A 1.0 0.9 0.8 .6-1.2 Gmm 2.434 2.420 2.399 Gmb 2.295 2.317 2.333 Nini 87.0 88.5 91.0 90.5% maxGse 2.640 2.643 2.637 Gb 1.032 1.032 1.032 Gsb 2.612 2.612 2.612 Pbe 5.03 5.46 6.02
In analyzing the data we can see that 5.9% asphalt gives 4.3% VTM and the other volumetrics
are well within the allowable limits of the specification. The specification does however
require that the mix be designed at 4.0% VTM .
The next step is to determine what asphalt content will give 4.0% VTM . To determine this we
must estimate what asphalt content will give us the required VTM . This can be done by
plotting the % AC versus VTM or by a mathematical calculation. For accuracy we will
determine mathematically the % AC that will give us the required VTM .
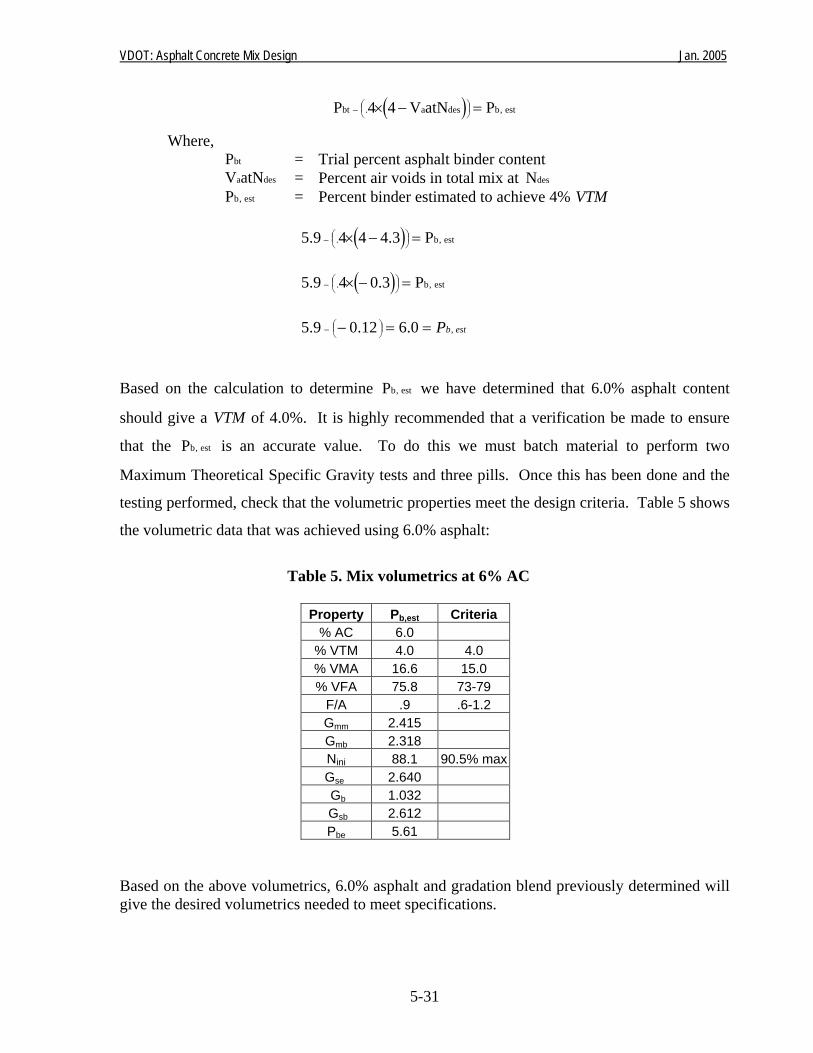
VDOT: Asphalt Concrete Mix Design Jan. 2005
5-31
( ) est,bdesa.bt PatNV44P =−× ⎟⎠⎞⎜
⎝⎛−
Where, btP = Trial percent asphalt binder content
desaatNV = Percent air voids in total mix at desN est,bP = Percent binder estimated to achieve 4% VTM
( ) est,b. P3.4449.5 =−× ⎟
⎠⎞⎜
⎝⎛−
( ) est,b. P3.049.5 =−× ⎟
⎠⎞⎜
⎝⎛−
estbP ,0.612.09.5 ==− ⎟
⎠⎞⎜
⎝⎛−
Based on the calculation to determine est,bP we have determined that 6.0% asphalt content
should give a VTM of 4.0%. It is highly recommended that a verification be made to ensure
that the est,bP is an accurate value. To do this we must batch material to perform two
Maximum Theoretical Specific Gravity tests and three pills. Once this has been done and the
testing performed, check that the volumetric properties meet the design criteria. Table 5 shows
the volumetric data that was achieved using 6.0% asphalt:
Table 5. Mix volumetrics at 6% AC
Based on the above volumetrics, 6.0% asphalt and gradation blend previously determined will give the desired volumetrics needed to meet specifications.
Property Pb,est Criteria % AC 6.0
% VTM 4.0 4.0 % VMA 16.6 15.0 % VFA 75.8 73-79
F/A .9 .6-1.2 Gmm 2.415 Gmb 2.318 Nini 88.1 90.5% maxGse 2.640 Gb 1.032 Gsb 2.612 Pbe 5.61
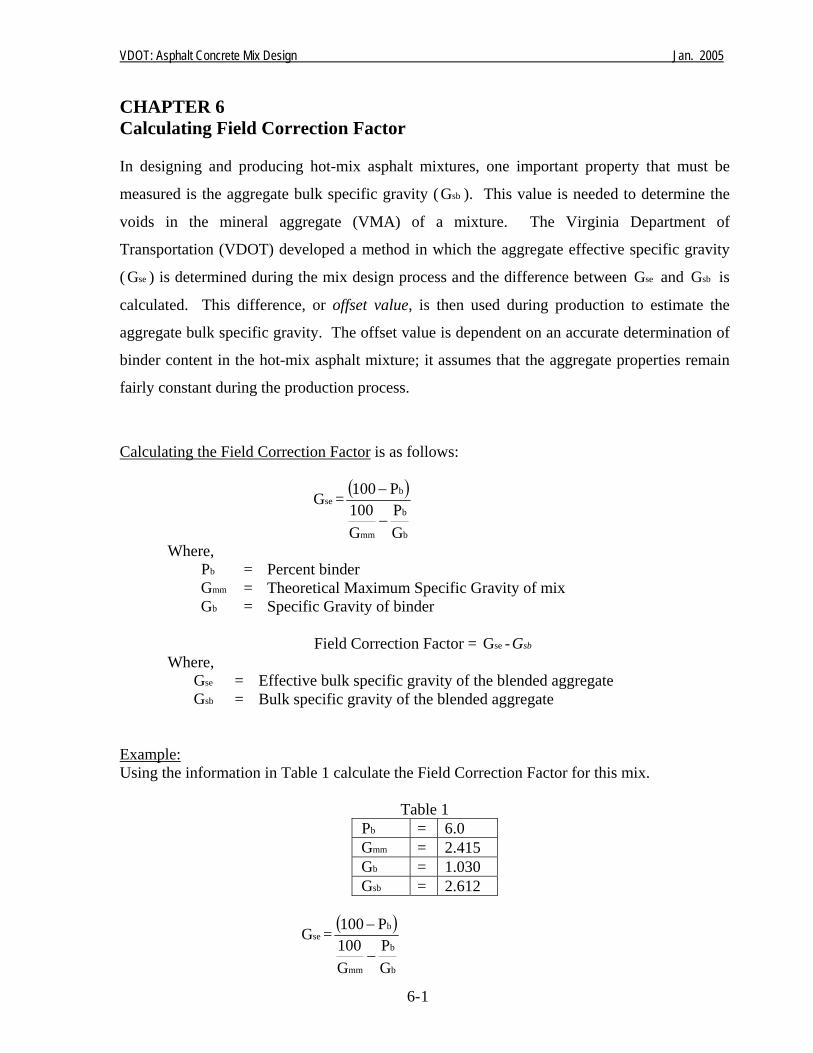
VDOT: Asphalt Concrete Mix Design Jan. 2005
6- 1
CHAPTER 6 Calculating Field Correction Factor In designing and producing hot-mix asphalt mixtures, one important property that must be
measured is the aggregate bulk specific gravity ( sbG ). This value is needed to determine the
voids in the mineral aggregate (VMA) of a mixture. The Virginia Department of
Transportation (VDOT) developed a method in which the aggregate effective specific gravity
( seG ) is determined during the mix design process and the difference between seG and sbG is
calculated. This difference, or offset value, is then used during production to estimate the
aggregate bulk specific gravity. The offset value is dependent on an accurate determination of
binder content in the hot-mix asphalt mixture; it assumes that the aggregate properties remain
fairly constant during the production process.
Calculating the Field Correction Factor is as follows:
seG = ( )
b
b
mm
b
GP
G100
P100
−
−
Where, bP = Percent binder mmG = Theoretical Maximum Specific Gravity of mix bG = Specific Gravity of binder
Field Correction Factor = seG - sbG
Where, seG = Effective bulk specific gravity of the blended aggregate sbG = Bulk specific gravity of the blended aggregate
Example: Using the information in Table 1 calculate the Field Correction Factor for this mix.
Table 1 bP = 6.0 mmG = 2.415 bG = 1.030 sbG = 2.612
seG = ( )
b
b
mm
b
GP
G100
P100
−
−
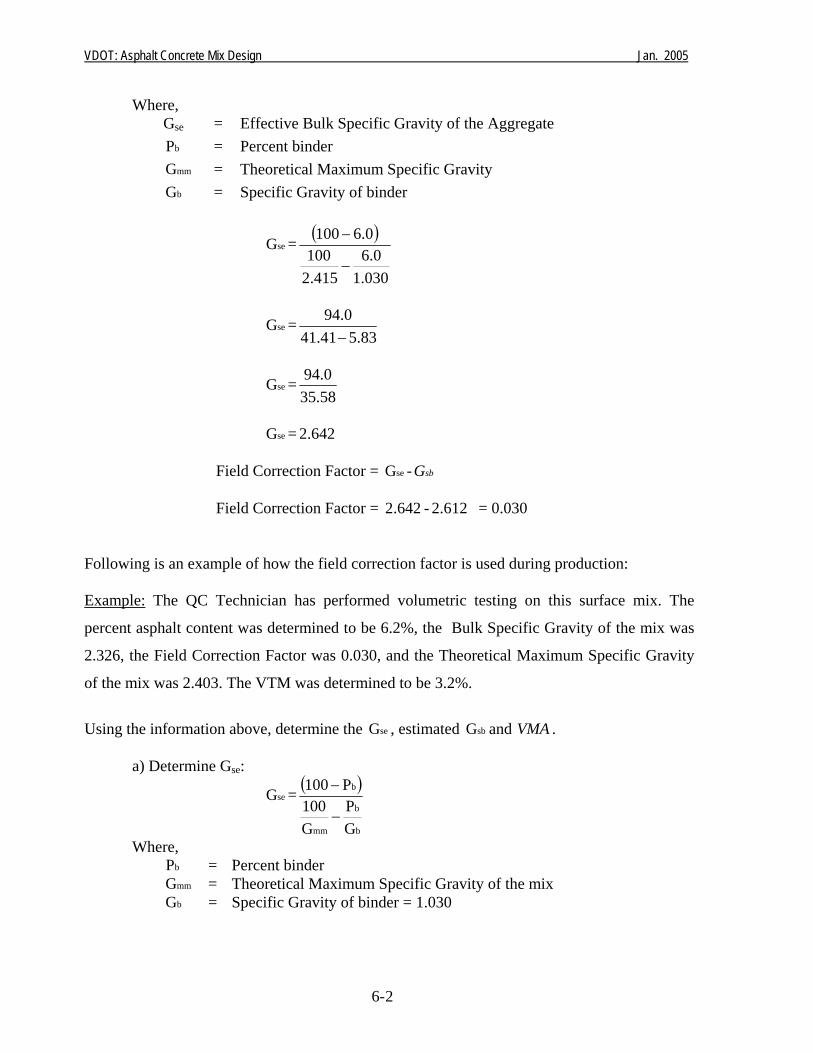
VDOT: Asphalt Concrete Mix Design Jan. 2005
6- 2
Where, Gse = Effective Bulk Specific Gravity of the Aggregate
bP = Percent binder mmG = Theoretical Maximum Specific Gravity bG = Specific Gravity of binder
seG = ( )
030.10.6
415.2100
0.6100
−
−
seG =83.541.41
0.94−
seG =58.350.94
seG = 642.2
Field Correction Factor = seG - sbG Field Correction Factor = 642.2 - 612.2 = 0.030 Following is an example of how the field correction factor is used during production: Example: The QC Technician has performed volumetric testing on this surface mix. The
percent asphalt content was determined to be 6.2%, the Bulk Specific Gravity of the mix was
2.326, the Field Correction Factor was 0.030, and the Theoretical Maximum Specific Gravity
of the mix was 2.403. The VTM was determined to be 3.2%.
Using the information above, determine the seG , estimated sbG and VMA . a) Determine Gse:
seG = ( )
b
b
mm
b
GP
G100
P100
−
−
Where, bP = Percent binder mmG = Theoretical Maximum Specific Gravity of the mix bG = Specific Gravity of binder = 1.030
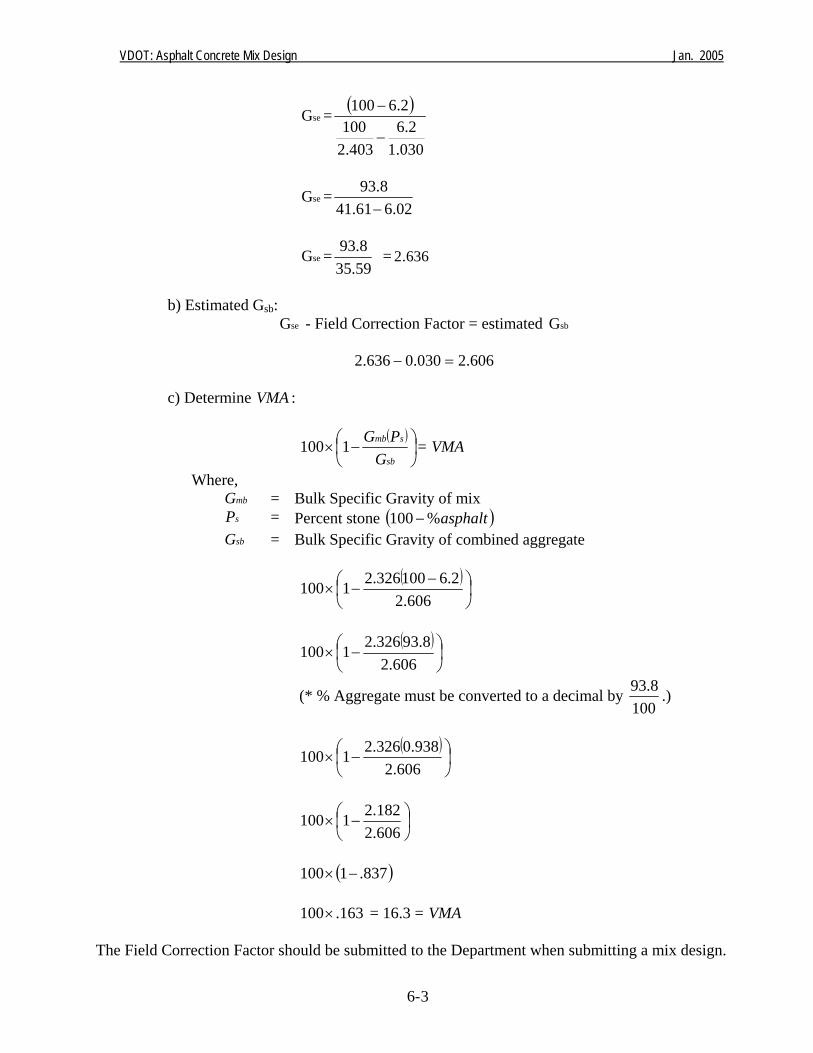
VDOT: Asphalt Concrete Mix Design Jan. 2005
6- 3
seG = ( )
030.12.6
403.2100
2.6100
−
−
seG =02.661.41
8.93−
seG =59.358.93 = 636.2
b) Estimated Gsb:
seG - Field Correction Factor = estimated sbG
606.2030.0636.2 =−
c) Determine VMA :
( )⎟⎠⎞
⎜⎝⎛ −×
sb
smb
GPG1100 = VMA
Where, mbG = Bulk Specific Gravity of mix sP = Percent stone ( )asphalt%100− sbG = Bulk Specific Gravity of combined aggregate
( )
⎟⎠⎞
⎜⎝⎛ −−×
606.22.6100326.21100
( )
⎟⎠⎞
⎜⎝⎛ −×
606.28.93326.21100
(* % Aggregate must be converted to a decimal by 100
8.93 .)
( )
⎟⎠⎞
⎜⎝⎛ −×
606.2938.0326.21100
⎟⎠⎞
⎜⎝⎛ −×
606.2182.21100
( )837.1100 −×
163.100× = 16.3 = VMA
The Field Correction Factor should be submitted to the Department when submitting a mix design.
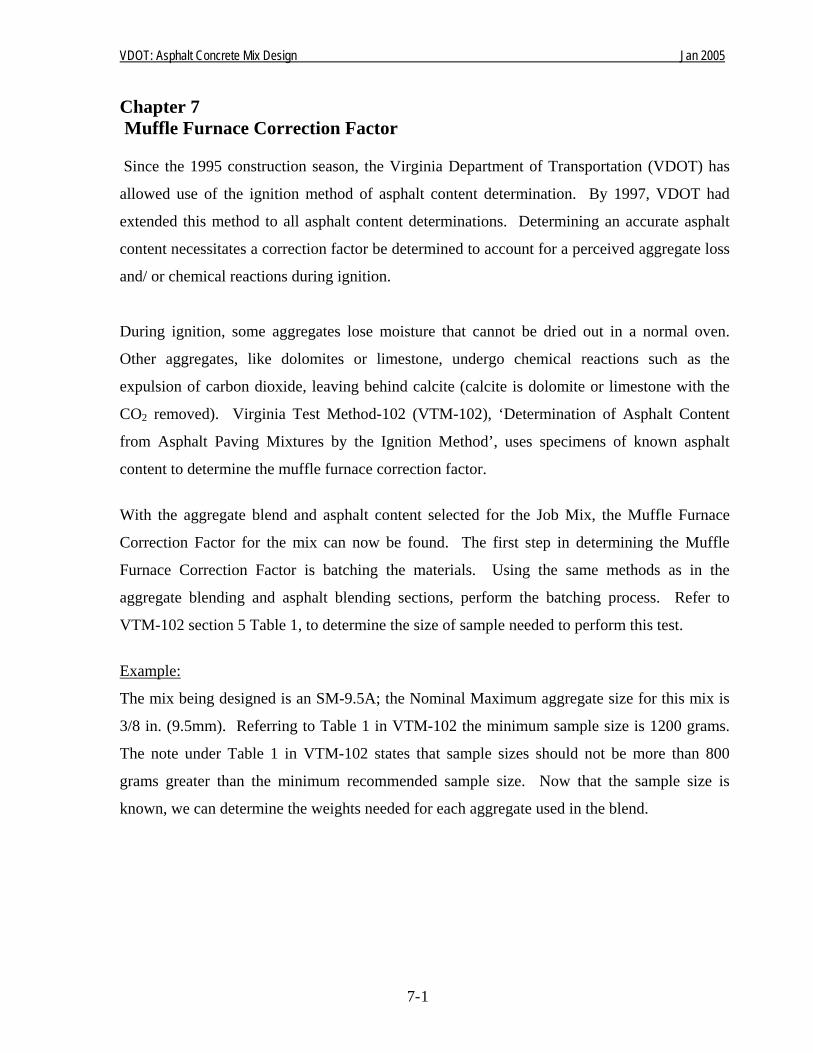
VDOT: Asphalt Concrete Mix Design Jan 2005
Chapter 7 Muffle Furnace Correction Factor Since the 1995 construction season, the Virginia Department of Transportation (VDOT) has
allowed use of the ignition method of asphalt content determination. By 1997, VDOT had
extended this method to all asphalt content determinations. Determining an accurate asphalt
content necessitates a correction factor be determined to account for a perceived aggregate loss
and/ or chemical reactions during ignition.
During ignition, some aggregates lose moisture that cannot be dried out in a normal oven.
Other aggregates, like dolomites or limestone, undergo chemical reactions such as the
expulsion of carbon dioxide, leaving behind calcite (calcite is dolomite or limestone with the
CO2 removed). Virginia Test Method-102 (VTM-102), ‘Determination of Asphalt Content
from Asphalt Paving Mixtures by the Ignition Method’, uses specimens of known asphalt
content to determine the muffle furnace correction factor.
With the aggregate blend and asphalt content selected for the Job Mix, the Muffle Furnace
Correction Factor for the mix can now be found. The first step in determining the Muffle
Furnace Correction Factor is batching the materials. Using the same methods as in the
aggregate blending and asphalt blending sections, perform the batching process. Refer to
VTM-102 section 5 Table 1, to determine the size of sample needed to perform this test.
Example:
The mix being designed is an SM-9.5A; the Nominal Maximum aggregate size for this mix is
3/8 in. (9.5mm). Referring to Table 1 in VTM-102 the minimum sample size is 1200 grams.
The note under Table 1 in VTM-102 states that sample sizes should not be more than 800
grams greater than the minimum recommended sample size. Now that the sample size is
known, we can determine the weights needed for each aggregate used in the blend.
7- 1
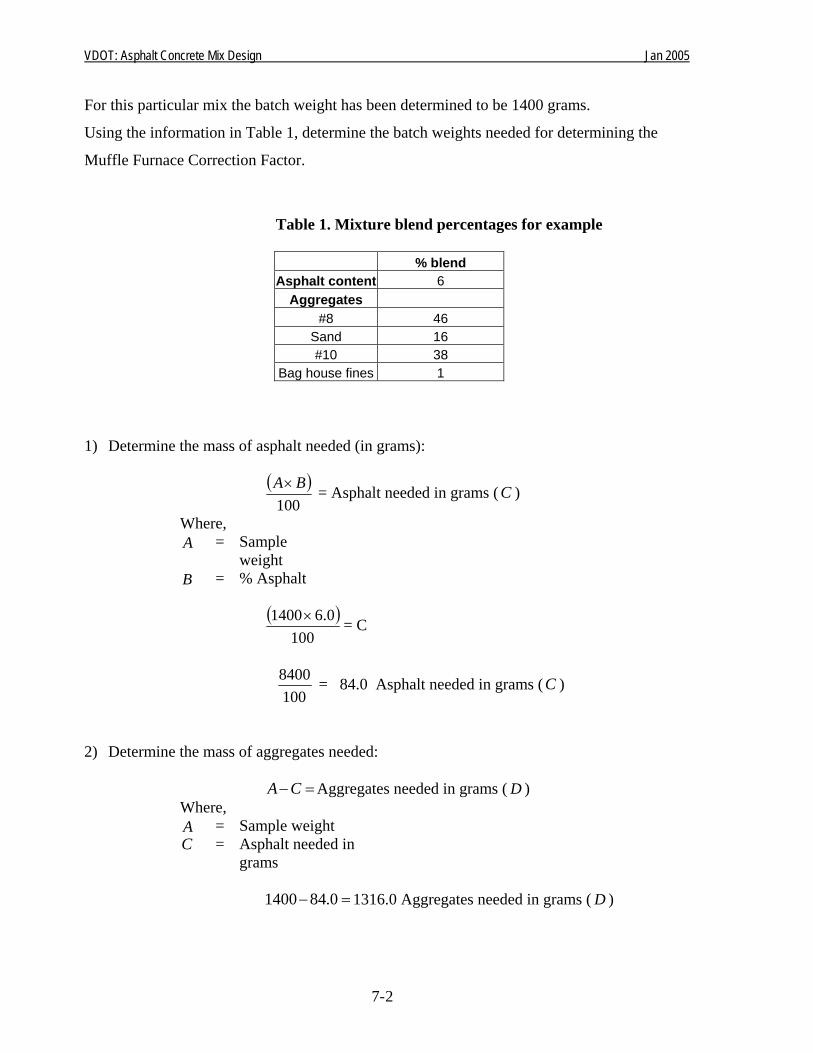
VDOT: Asphalt Concrete Mix Design Jan 2005
For this particular mix the batch weight has been determined to be 1400 grams.
Using the information in Table 1, determine the batch weights needed for determining the
Muffle Furnace Correction Factor.
Table 1. Mixture blend percentages for example
% blend Asphalt content 6
Aggregates #8 46
Sand 16 #10 38
Bag house fines 1 1) Determine the mass of asphalt needed (in grams):
( )100
BA× = Asphalt needed in grams ( ) C
Where, A = Sample
weight B = % Asphalt
( )
1000.61400× = C
1008400 = 84.0 Asphalt needed in grams (C )
2) Determine the mass of aggregates needed:
=−CA Aggregates needed in grams ( ) DWhere, A = Sample weight C = Asphalt needed in
grams
=− 0.841400 1316.0 Aggregates needed in grams ( ) D
7- 2
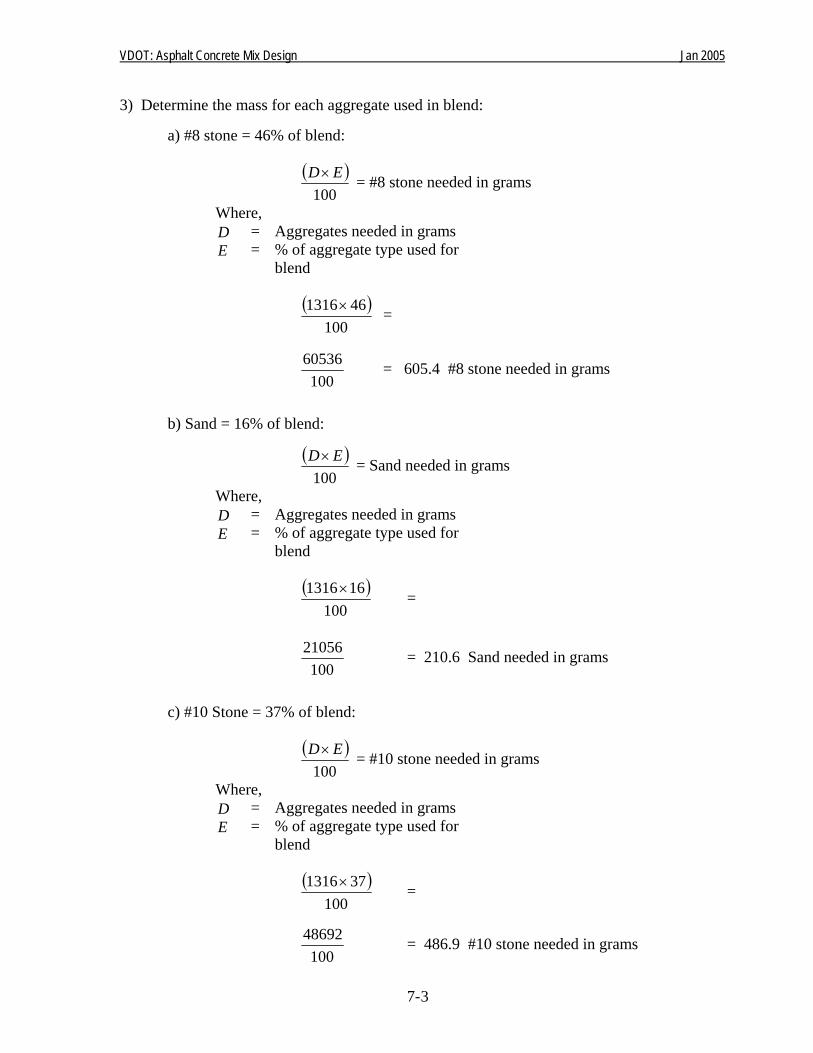
VDOT: Asphalt Concrete Mix Design Jan 2005
3) Determine the mass for each aggregate used in blend:
a) #8 stone = 46% of blend:
( )100
ED× = #8 stone needed in grams
Where, D = Aggregates needed in grams E = % of aggregate type used for
blend
( )100
461316× =
10060536 = 605.4 #8 stone needed in grams
b) Sand = 16% of blend:
( )100
ED× = Sand needed in grams
Where, D = Aggregates needed in grams E = % of aggregate type used for
blend
( )100
161316× =
10021056 = 210.6 Sand needed in grams
c) #10 Stone = 37% of blend:
( )100
ED× = #10 stone needed in grams
Where, D = Aggregates needed in grams E = % of aggregate type used for
blend
( )100
371316× =
10048692 = 486.9 #10 stone needed in grams
7- 3
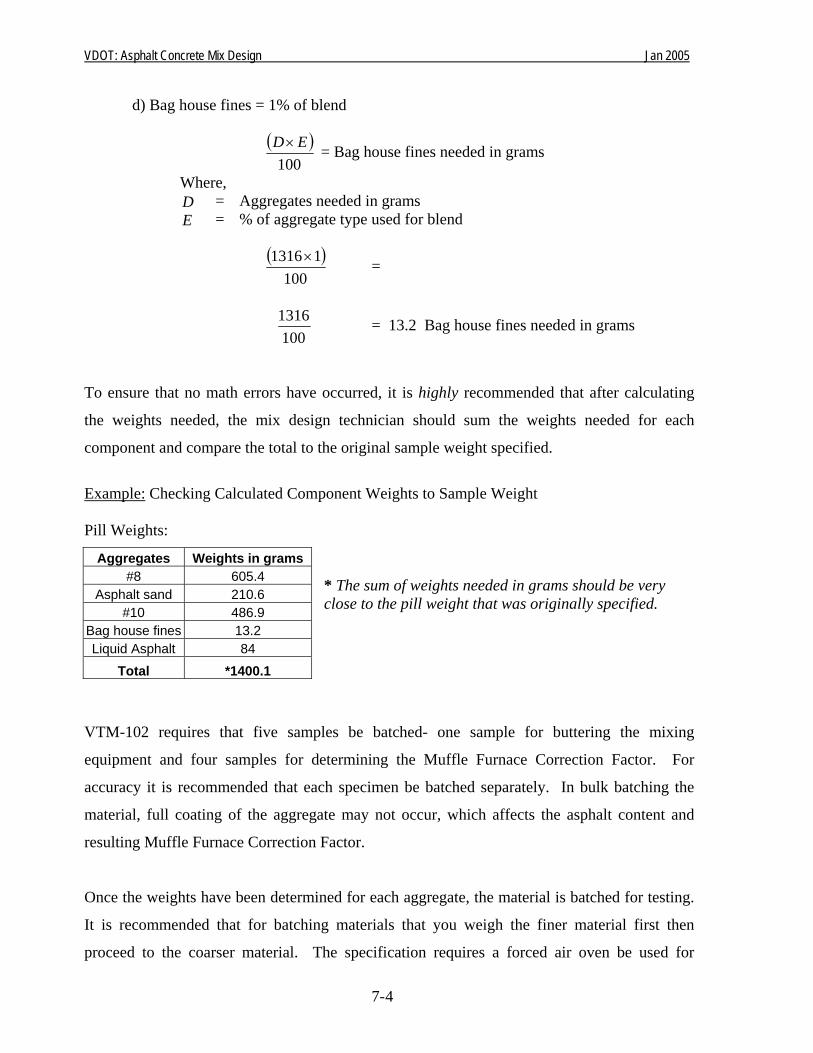
VDOT: Asphalt Concrete Mix Design Jan 2005
d) Bag house fines = 1% of blend
( )100
ED× = Bag house fines needed in grams
Where, D = Aggregates needed in grams E = % of aggregate type used for blend
( )
10011316× =
1001316 = 13.2 Bag house fines needed in grams
To ensure that no math errors have occurred, it is highly recommended that after calculating
the weights needed, the mix design technician should sum the weights needed for each
component and compare the total to the original sample weight specified.
Example: Checking Calculated Component Weights to Sample Weight Pill Weights:
* The sum of weights needed in grams should be very close to the pill weight that was originally specified.
Aggregates Weights in grams #8 605.4
Asphalt sand 210.6 #10 486.9
Bag house fines 13.2 Liquid Asphalt 84
Total *1400.1
VTM-102 requires that five samples be batched- one sample for buttering the mixing
equipment and four samples for determining the Muffle Furnace Correction Factor. For
accuracy it is recommended that each specimen be batched separately. In bulk batching the
material, full coating of the aggregate may not occur, which affects the asphalt content and
resulting Muffle Furnace Correction Factor.
Once the weights have been determined for each aggregate, the material is batched for testing.
It is recommended that for batching materials that you weigh the finer material first then
proceed to the coarser material. The specification requires a forced air oven be used for
7- 4
VDOT: Asphalt Concrete Mix Design Jan 2005
heating the material for mixing and compaction; if the finer material is on top, it will tend to
get blown out of the pan. As always, when batching aggregates, a flat bottom scoop is required.
Now that the material has been batched and the binder selected it is now time to heat the
aggregates, binder and mixing equipment to the proper mixing temperature. Section
211.03(d)6 of the Road and Bridge Specifications lists the proper mixing and compaction
temperatures for each grade type of binder. The mix that is being designed is a SM-9.5A thus
the mixing temperature is 300° F to 310° F. Set the oven to the proper mixing temperature and
place the aggregates, binder and mixing equipment in the oven. A dial thermometer with a
range of 50° F to 400° F should be placed in each pan of material and in the binder to ensure
the materials have achieved the proper mixing temperature.
Once the material has reached the specified mixing temperature proceed with combining the
liquid asphalt and aggregates. Always thoroughly mix each sample after adding the liquid
asphalt (remember that the first sample to be mixed is the butter batch). For determining the
Muffle Furnace Correction Factor, aging the mix for two hours is not required. Once the
material has been mixed, VTM-102 is followed. Section 6 of VTM-102 gives the procedure to
follow for determining the calibration factor. Part of section 6 of VTM-102 follows:
6. Calibration
A mixture calibration procedure is required. For mix designs containing RAP, sufficient
quantity of RAP should be sampled such that the binder content of the RAP may be estimated,
and to provide for the RAP to be used in the mix calibration. The binder content of the RAP
will be estimated from the average of four samples (RAP only) burned in the furnace. The
portions of RAP should be obtained using a sample splitter.
Typically, calibration testing will be performed at 538 °C (1000 °F). However, certain
aggregate types may result in an unusually high calibration factor and erroneous gradation
results. Such mixes should be calibrated and tested at a lower temperature, typically 482 °C
(900 °F) as approved by the Engineer.
7- 5
VDOT: Asphalt Concrete Mix Design Jan 2005
6A. Calibration Procedure for Hot-Mix Asphalt
6A.1 This method may be affected by the type of aggregate in the mixture.
Accordingly, to optimize accuracy, a calibration factor will be
established with the testing of a set of calibration samples for each mix
type. This procedure must be performed before any acceptance testing
is completed.
6A.2 Four calibration specimens conforming to the mass requirements of
Section 5.2.2 shall be prepared at the optimum asphalt content. A butter
mix shall be prepared at the design asphalt content, mixed and discarded
prior to mixing any of the calibration specimens to ensure an accurate
asphalt content. Aggregate used for the calibration specimens shall be
sampled from stockpiled material produced in the current construction
season. Any method may be used to combine the aggregates, however
an additional “blank” specimen shall be batched and tested according to
AASHTO T 30. The washed gradation shall fall within the JMF (mix
design) tolerances.
NOTE: When batching calibration samples, be sure to account for the AC%
contribution of the RAP to the total asphalt content of the specimens.
6A.3 The freshly mixed specimens may be placed directly in the sample
basket(s). If allowed to cool, the samples must be preheated in a 125°C
(257°F) oven for 25 minutes. Do not preheat the sample basket(s).
6A.4 Preheat the ignition furnace to 538°C (1000°F). Record the furnace
temperature (set point) prior to the initiation of the test.
6A.4 Enter a calibration factor of 0.00 in the ignition furnace.
7- 6
VDOT: Asphalt Concrete Mix Design Jan 2005
6A.5 Weigh and record the weight of the sample basket(s) and catch pan (with
guards in place). 6A.6 Place the sample basket in the catch pan. Evenly distribute the calibration
specimen in the basket taking care to keep the material away from the edges
of the basket. Use a spatula or trowel to level the specimen.
6A.7 When multiple sample baskets are used, place a sample basket in the catch
pan. Evenly distribute an equal portion of the specimen in the basket, taking
care to keep the material away from the edges of the basket. Each
subsequent basket should be placed on top of the preceding basket with an
equal portion of the specimen evenly distributed in each basket. Care should
be taken to keep the material away from the edges of the baskets. Use a
spatula or trowel to level the specimen.
6A.8 Weigh and record the sample, basket(s), catch pan, and basket guards.
Calculate and record the initial weight of the sample specimen (total weight -
the weight of the sample basket assembly).
6A.9 Input the initial weight of the sample specimen in whole grams into the
ignition furnace controller. Verify that the correct weight has been entered.
6A.10 Open the chamber door and place the sample basket(s) in the furnace. Close
the chamber door and verify that the sample weight (including the basket(s)
displayed on the furnace scale equals the total weight recorded in Section 6.8
within ± 5g. Differences greater than 5 grams or failure of the furnace scale
to stabilize may indicate that the sample basket(s) are contacting the furnace
wall. Initiate the test by pressing the start/stop button. This will lock the
sample chamber and start the combustion blower.
6A.11 Allow the test to continue until the stable light and audible stable indicator
indicates the test is complete. Press the start/stop button. This will unlock the
sample chamber and cause the printer to print out the test results.
7- 7
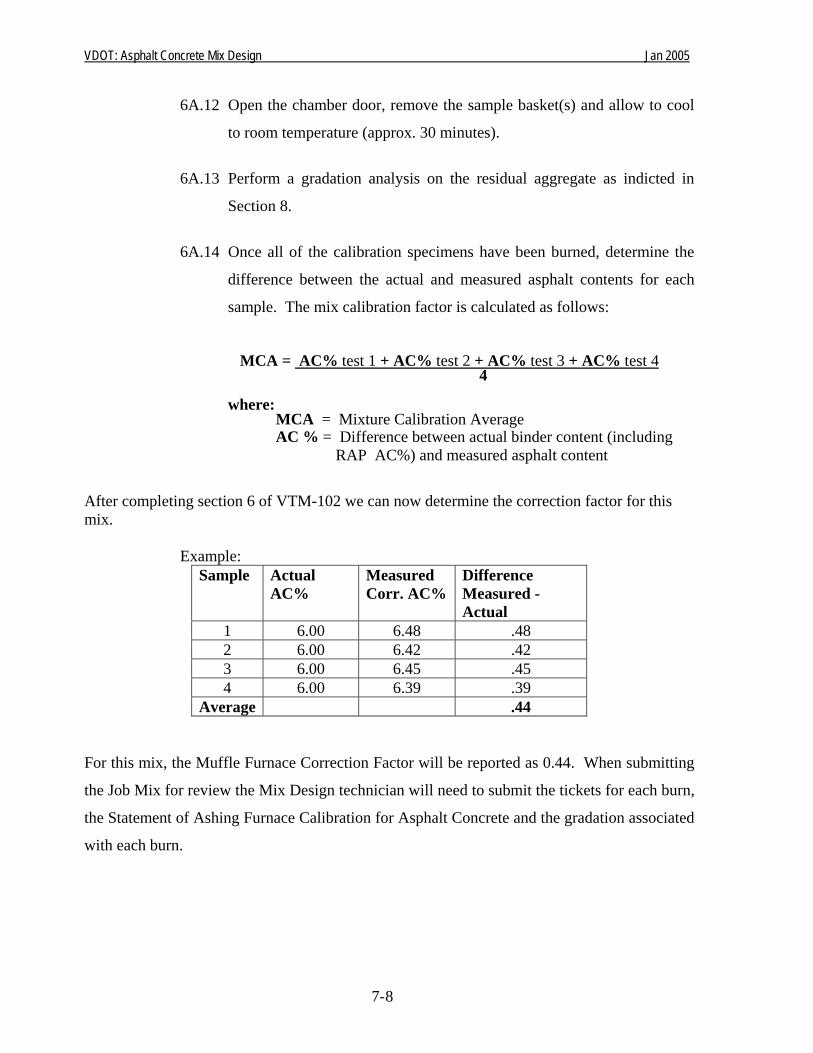
VDOT: Asphalt Concrete Mix Design Jan 2005
6A.12 Open the chamber door, remove the sample basket(s) and allow to cool
to room temperature (approx. 30 minutes).
6A.13 Perform a gradation analysis on the residual aggregate as indicted in
Section 8.
6A.14 Once all of the calibration specimens have been burned, determine the
difference between the actual and measured asphalt contents for each
sample. The mix calibration factor is calculated as follows:
MCA = AC% test 1 + AC% test 2 + AC% test 3 + AC% test 4 4
where:
MCA = Mixture Calibration Average AC % = Difference between actual binder content (including
RAP AC%) and measured asphalt content
After completing section 6 of VTM-102 we can now determine the correction factor for this mix. Example:
Sample Actual AC%
Measured Corr. AC%
Difference Measured - Actual
1 6.00 6.48 .48 2 6.00 6.42 .42 3 6.00 6.45 .45 4 6.00 6.39 .39
Average .44 For this mix, the Muffle Furnace Correction Factor will be reported as 0.44. When submitting
the Job Mix for review the Mix Design technician will need to submit the tickets for each burn,
the Statement of Ashing Furnace Calibration for Asphalt Concrete and the gradation associated
with each burn.
7- 8
VDOT: Asphalt Concrete Mix Design Jan. 2005
CHAPTER 8 Testing %Gmm at Nmax Once the aggregate blend and percent asphalt have been determined for design submittal it is
now time to perform Nmax. This consists of batching a minimum of two pills at the design
asphalt content. The Maximum Theoretical Specific Gravity (Gmm) was determined at the
design asphalt content when performing the asphalt blending so there is no need to rerun this
test. Section 211, Table II-14 of the Road and Bridge Specifications lists the gyration level
required to achieve Nmax. In AASHTO M323 the criteria for Nmax is listed in Table 6, which is
less than or equal to 98 percent of Maximum Theoretical Specific Gravity. The first step in
this process is to batch the aggregates for mixing. This is done by following the same steps as
in the asphalt blending chapter.
Nmax (Pills) at 6.0% Asphalt Using the information from Table 1 determine the batch weights for the pills:
Table 1. Sample data
Pill weight: 4600g Aggregates % blend Asphalt content
#8 46 6.0% sand 16 #10 38
bag house fines 1
1) Determine the mass of asphalt needed in grams:
( )100
BA× = Asphalt needed in grams (C )
Where, A = Pill weight B = % Asphalt
( )
1000.64600× = C
100
27600 = C
276.0 = Asphalt needed in grams ( ) C
8-1
VDOT: Asphalt Concrete Mix Design Jan. 2005
2) Determine the mass of aggregates needed:
=−CA Aggregates needed in grams ( ) D
Where,
A = Pill weight C = Asphalt needed in grams
=− 0.2764600 4324.0 Aggregates needed in grams ( ) D
3) Determine the mass for each aggregate used in blend:
a) #8 stone - 46% of blend:
( )100
ED× = #8 stone needed in grams
Where, D = Aggregates needed in grams E = % of aggregate type used for blend
( )
100464324 × =
100
198904 =
1989.0 = #8 stone needed in grams
b) Sand – 16% of blend:
( )
100ED× = Sand needed in grams
Where, D = Aggregates needed in grams E = % of aggregate type used for blend
( )
100164324× =
10069184 =
691.8 = Sand needed in grams
c) #10 Stone – 37% of blend:
8-2
VDOT: Asphalt Concrete Mix Design Jan. 2005
( )
100ED× = #10 stone needed in grams
Where,
D = Aggregates needed in grams E = % of aggregate type used for blend
( )
100374324× =
100159988 = 1599.9 #10 stone needed in grams
d) Bag house fines – 1% of blend
( )100
ED× = Bag house fines needed in grams
Where, D = Aggregates needed in grams E = % of aggregate type used for blend
( )
10014324× =
1004324 = 43.2 Bag house fines needed in grams
Note: Butter batch and 2 pills are required for Nmax. To ensure that no math errors have occurred, it is highly recommended that after calculating
the weights needed for the pills, the mix design technician should sum the weights needed of
each component and compare the total to the original pill weight specified.
Example: Checking Calculated Component Weights to Pill Weight Pill Weights:
* The sum of weights needed (in grams) should be very
close to the pill weight originally specified.
Once the masses have been determined for each aggregate, the materials can be batched for
Aggregates Weights in grams #8 1989.0
Asphalt sand 691.8 #10 1599.9
Bag house fines 43.2 Liquid Asphalt 276
Total *4599.9
8-3
VDOT: Asphalt Concrete Mix Design Jan. 2005
8-4
testing. It is recommended that in batching materials the mix design technician weigh the finer
material first then proceed with the coarser material. The reason for this approach is that
specifications require a forced air oven for heating the material for mixing and compaction. If
the finer material is on top, it will tend to get blown out of the pan. As always, when batching
aggregates, a flat bottom scoop is required.
The mix being designed is a SM-9.5A so the PG binder type to be used is PG64-22. Refer to
section 211.01 of the Road and Bridge Specifications to find the binder grade to use for a
specified mix type.
After the material is batched and the binder selected, the aggregates, binder and mixing
equipment are heated to the proper mixing temperature. Section 211.03(d)6 of the Road and
Bridge Specifications lists the proper mixing and compaction temperatures for each grade type
of binder.
The mix that is being designed is a SM-9.5A and the mixing temperature is 300° F to 310° F.
Set the oven to the proper mixing temperature and place the aggregates, binder and mixing
equipment into the oven. A dial thermometer with a range of 50° F to 400° F should be placed
in each pan of material and in the binder to ensure that the materials have reached the proper
mixing temperature. Once the materials have reached the specified mixing temperature
proceed with combining the aggregates and liquid asphalt (always remember that the first
sample to be mixed is the butter batch).
Charge the mixing bowl with the heated aggregate and mix thoroughly. Form a crater in the
dry blended aggregate, and weigh the required amount of binder into the mix. Immediately
start mixing. AASHTO PP-28 does allow the material to be mixed using a mechanical mixer
or by hand mixing. Whichever method of mixing is used, mixing must be uniform and with
minimal loss of temperature.
After mixing, the material must be aged. AASHTO PP2-01 section 7.1.2 states that the
material must be aged at the specified compaction temperature for 2 hours ± 5 minutes. The
compaction temperature for this mix is 285° F. to 290° F. (Refer to section 211.03(d) 6 of the
Road and Bridge Specifications to find the proper compaction temperature.)
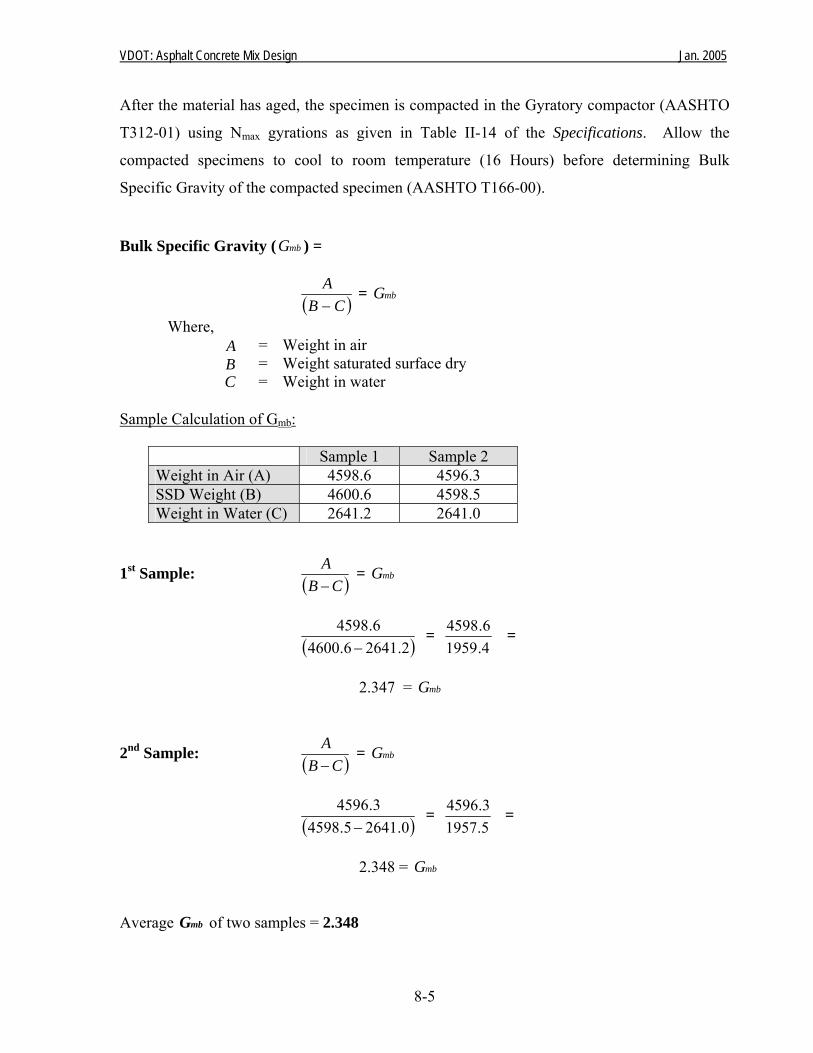
VDOT: Asphalt Concrete Mix Design Jan. 2005
After the material has aged, the specimen is compacted in the Gyratory compactor (AASHTO
T312-01) using Nmax gyrations as given in Table II-14 of the Specifications. Allow the
compacted specimens to cool to room temperature (16 Hours) before determining Bulk
Specific Gravity of the compacted specimen (AASHTO T166-00). Bulk Specific Gravity ( ) = mbG
( )CBA−
= mbG
Where, A = Weight in air B = Weight saturated surface dry C = Weight in water
Sample Calculation of Gmb:
Sample 1 Sample 2 Weight in Air (A) 4598.6 4596.3 SSD Weight (B) 4600.6 4598.5 Weight in Water (C) 2641.2 2641.0
1st Sample: ( )CBA−
= mbG
( )
8-5
2.26416.46006.4598
− =
4.19596.4598 =
2.347 = mbG
2nd Sample: ( )CBA−
= mbG
( )0.26415.45983.4596
− =
5.19573.4596 =
2.348 = mbG
Average of two samples = 2.348 mbG
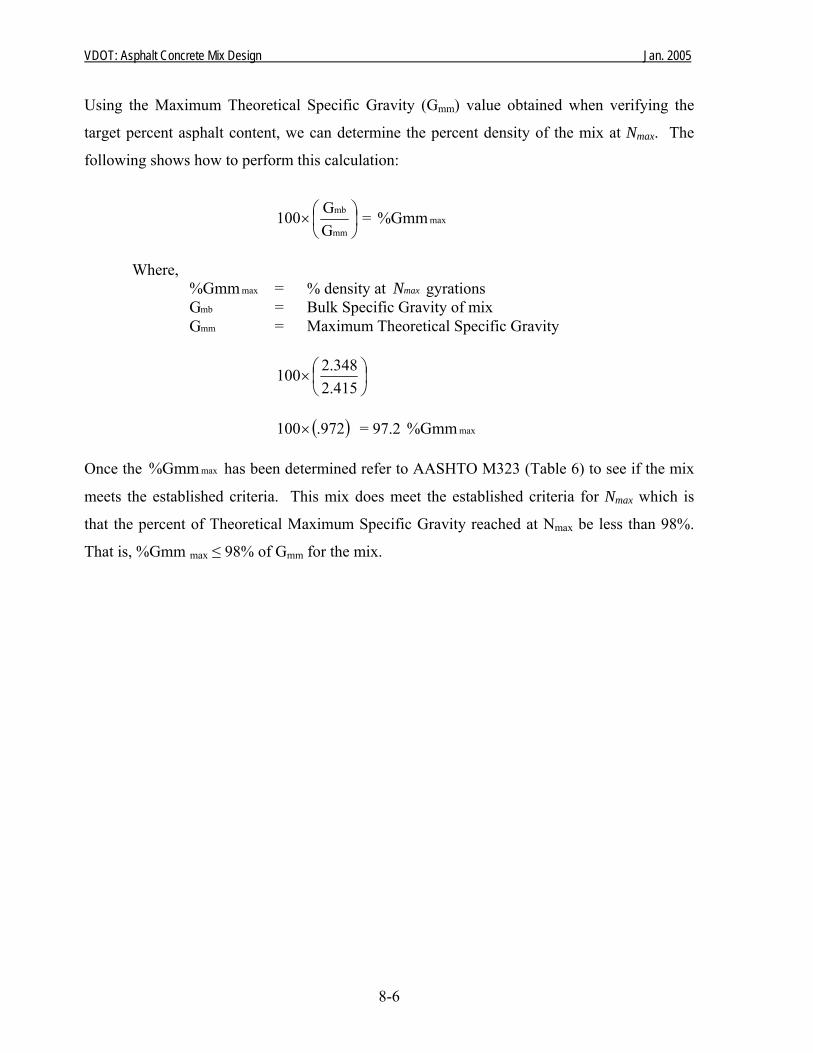
VDOT: Asphalt Concrete Mix Design Jan. 2005
Using the Maximum Theoretical Specific Gravity (Gmm) value obtained when verifying the
target percent asphalt content, we can determine the percent density of the mix at Nmax. The
following shows how to perform this calculation:
⎟⎠⎞
⎜⎝⎛×
mm
mb
GG100 = maxGmm%
Where,
maxGmm% = % density at gyrations maxNmbG = Bulk Specific Gravity of mix mmG = Maximum Theoretical Specific Gravity
⎟⎠⎞
⎜⎝⎛×
415.2348.2100
( 972.100× ) = 97.2 maxGmm%
Once the has been determined refer to AASHTO M323 (Table 6) to see if the mix
meets the established criteria. This mix does meet the established criteria for N
maxGmm%
max which is
that the percent of Theoretical Maximum Specific Gravity reached at Nmax be less than 98%.
That is, %Gmm max ≤ 98% of Gmm for the mix.
8-6
VDOT: Asphalt Concrete Mix Design Jan. 2005
9- 1
CHAPTER 9 Resistance of Compacted Bituminous Mixture to Moisture-Induced Damage(TSR) Once the design is complete, the final step in the mix design process is determining the amount
of anti-strip additive to be used to prevent stripping of the material. The designer, when
determining which additive to use can choose either hydrated lime or a chemical additive. If
hydrated lime is used as an anti-stripping additive it must be incorporated into the design phase
for the aggregate blend and asphalt blending procedure. If a chemical additive is used it must
be one from the approved list found in VDOT’s Manual of Instructions.
Once the Mix Design technician has determined the type of additive he/she is going to use they
must then determine the amount of additive to use that will give the mix the necessary Tensile
Strength Ratio. The Tensile Strength Ratio is a way of estimating the stripping potential of the
mix. The ‘Resistance of Compacted Bituminous Mixture to Moisture-Induced Damage (TSR)’
AASHTO T-283 is a test used to determine if the amount of anti-stripping additive is sufficient
to reduce the potential for stripping. For the TSR test the following procedures should be
reviewed: Section 211.02(H) of the Road and Bridge Specifications, AASHTO T-283, T-166,
T-209, T-269 and ASTM D 3549.
For this particular mix, the mix design technician has decided to use a chemical additive from
the approved list. Once he/she has determined which additive to use the next step is to
determine the amount needed to give a TSR value that meets specification. To determine the
amount needed the mix design technician will need to have knowledge of the history of the
materials used in their mixes. If the mix design technician does not have this information
he/she can contact the manufacturer and they should be able to give a good starting point. For
this example the design technician has decided to use 1.0% of product X in the blend.
The Department allows two methods for compaction of specimens, the Field Marshall
compactor and the Gyratory compactor. The technician will need to batch a butter sample,
eight pills and one rice to perform this test. For batching the material, the technician will need
to follow the same procedure that was done in the Aggregate Blend and Asphalt Blend
chapters.
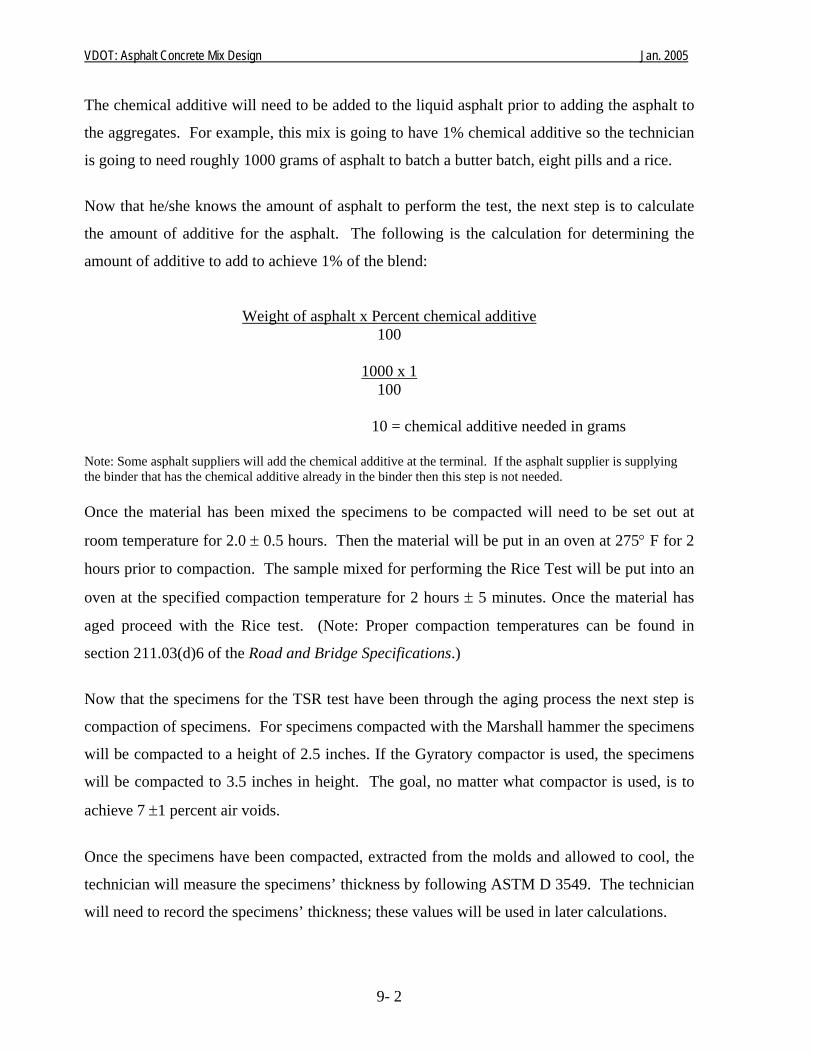
VDOT: Asphalt Concrete Mix Design Jan. 2005
9- 2
The chemical additive will need to be added to the liquid asphalt prior to adding the asphalt to
the aggregates. For example, this mix is going to have 1% chemical additive so the technician
is going to need roughly 1000 grams of asphalt to batch a butter batch, eight pills and a rice.
Now that he/she knows the amount of asphalt to perform the test, the next step is to calculate
the amount of additive for the asphalt. The following is the calculation for determining the
amount of additive to add to achieve 1% of the blend:
Weight of asphalt x Percent chemical additive 100
1000 x 1
100
10 = chemical additive needed in grams
Note: Some asphalt suppliers will add the chemical additive at the terminal. If the asphalt supplier is supplying the binder that has the chemical additive already in the binder then this step is not needed. Once the material has been mixed the specimens to be compacted will need to be set out at
room temperature for 2.0 ± 0.5 hours. Then the material will be put in an oven at 275° F for 2
hours prior to compaction. The sample mixed for performing the Rice Test will be put into an
oven at the specified compaction temperature for 2 hours ± 5 minutes. Once the material has
aged proceed with the Rice test. (Note: Proper compaction temperatures can be found in
section 211.03(d)6 of the Road and Bridge Specifications.)
Now that the specimens for the TSR test have been through the aging process the next step is
compaction of specimens. For specimens compacted with the Marshall hammer the specimens
will be compacted to a height of 2.5 inches. If the Gyratory compactor is used, the specimens
will be compacted to 3.5 inches in height. The goal, no matter what compactor is used, is to
achieve 7 ±1 percent air voids.
Once the specimens have been compacted, extracted from the molds and allowed to cool, the
technician will measure the specimens’ thickness by following ASTM D 3549. The technician
will need to record the specimens’ thickness; these values will be used in later calculations.
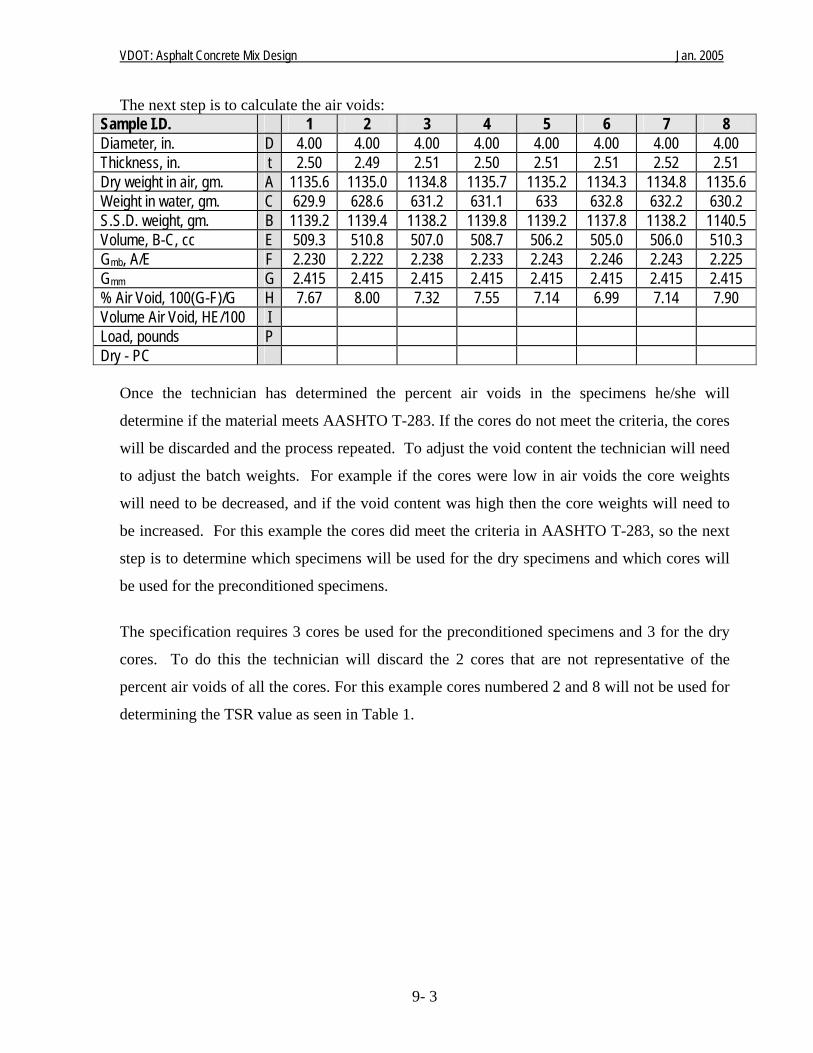
VDOT: Asphalt Concrete Mix Design Jan. 2005
9- 3
The next step is to calculate the air voids: Sample I.D. 1 2 3 4 5 6 7 8 Diameter, in. D 4.00 4.00 4.00 4.00 4.00 4.00 4.00 4.00 Thickness, in. t 2.50 2.49 2.51 2.50 2.51 2.51 2.52 2.51 Dry weight in air, gm. A 1135.6 1135.0 1134.8 1135.7 1135.2 1134.3 1134.8 1135.6 Weight in water, gm. C 629.9 628.6 631.2 631.1 633 632.8 632.2 630.2 S.S.D. weight, gm. B 1139.2 1139.4 1138.2 1139.8 1139.2 1137.8 1138.2 1140.5 Volume, B-C, cc E 509.3 510.8 507.0 508.7 506.2 505.0 506.0 510.3 Gmb, A/E F 2.230 2.222 2.238 2.233 2.243 2.246 2.243 2.225 Gmm G 2.415 2.415 2.415 2.415 2.415 2.415 2.415 2.415 % Air Void, 100(G-F)/G H 7.67 8.00 7.32 7.55 7.14 6.99 7.14 7.90 Volume Air Void, HE/100 I Load, pounds P Dry - PC
Once the technician has determined the percent air voids in the specimens he/she will
determine if the material meets AASHTO T-283. If the cores do not meet the criteria, the cores
will be discarded and the process repeated. To adjust the void content the technician will need
to adjust the batch weights. For example if the cores were low in air voids the core weights
will need to be decreased, and if the void content was high then the core weights will need to
be increased. For this example the cores did meet the criteria in AASHTO T-283, so the next
step is to determine which specimens will be used for the dry specimens and which cores will
be used for the preconditioned specimens.
The specification requires 3 cores be used for the preconditioned specimens and 3 for the dry
cores. To do this the technician will discard the 2 cores that are not representative of the
percent air voids of all the cores. For this example cores numbered 2 and 8 will not be used for
determining the TSR value as seen in Table 1.
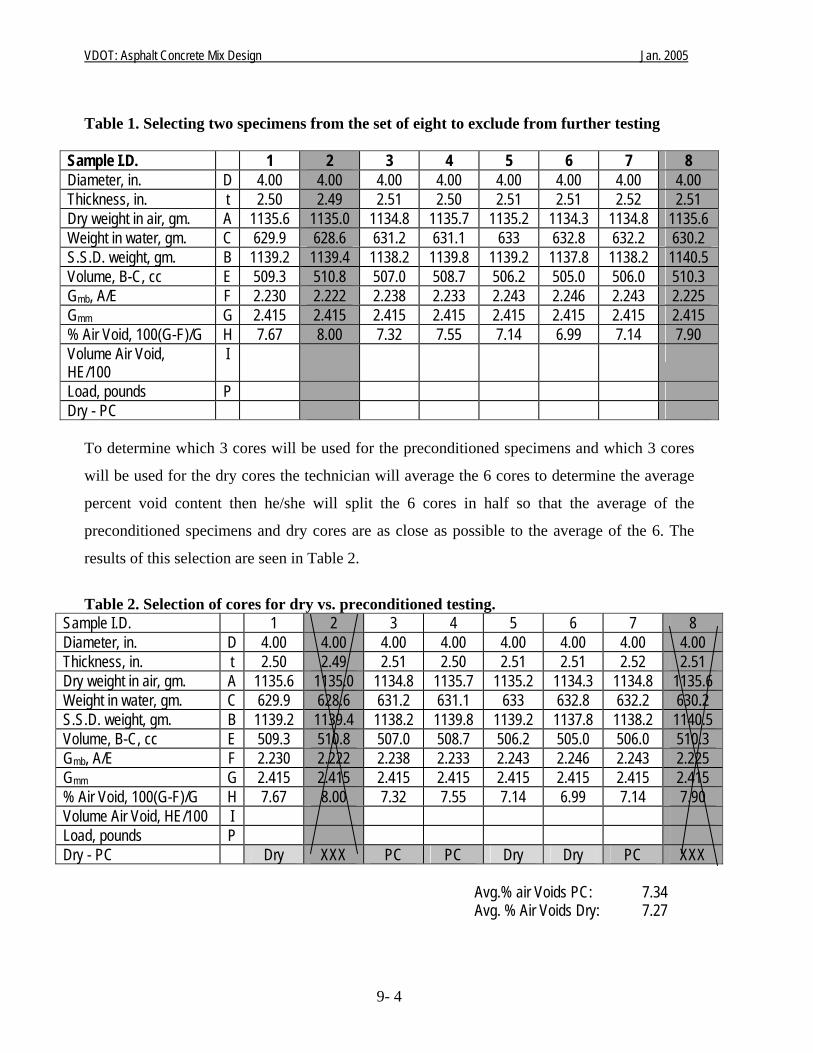
VDOT: Asphalt Concrete Mix Design Jan. 2005
Table 1. Selecting two specimens from the set of eight to exclude from further testing
Sample I.D. 1 2 3 4 5 6 7 8 Diameter, in. D 4.00 4.00 4.00 4.00 4.00 4.00 4.00 4.00 Thickness, in. t 2.50 2.49 2.51 2.50 2.51 2.51 2.52 2.51 Dry weight in air, gm. A 1135.6 1135.0 1134.8 1135.7 1135.2 1134.3 1134.8 1135.6 Weight in water, gm. C 629.9 628.6 631.2 631.1 633 632.8 632.2 630.2 S.S.D. weight, gm. B 1139.2 1139.4 1138.2 1139.8 1139.2 1137.8 1138.2 1140.5 Volume, B-C, cc E 509.3 510.8 507.0 508.7 506.2 505.0 506.0 510.3 Gmb, A/E F 2.230 2.222 2.238 2.233 2.243 2.246 2.243 2.225 Gmm G 2.415 2.415 2.415 2.415 2.415 2.415 2.415 2.415 % Air Void, 100(G-F)/G H 7.67 8.00 7.32 7.55 7.14 6.99 7.14 7.90 Volume Air Void, HE/100
I
Load, pounds P Dry - PC
To determine which 3 cores will be used for the preconditioned specimens and which 3 cores
will be used for the dry cores the technician will average the 6 cores to determine the average
percent void content then he/she will split the 6 cores in half so that the average of the
preconditioned specimens and dry cores are as close as possible to the average of the 6. The
results of this selection are seen in Table 2.
Table 2. Selection of cores for dry vs. preconditioned testing.
Sample I.D. 1 2 3 4 5 6 7 8 Diameter, in. D 4.00 4.00 4.00 4.00 4.00 4.00 4.00 4.00 Thickness, in. t 2.50 2.49 2.51 2.50 2.51 2.51 2.52 2.51 Dry weight in air, gm. A 1135.6 1135.0 1134.8 1135.7 1135.2 1134.3 1134.8 1135.6 Weight in water, gm. C 629.9 628.6 631.2 631.1 633 632.8 632.2 630.2 S.S.D. weight, gm. B 1139.2 1139.4 1138.2 1139.8 1139.2 1137.8 1138.2 1140.5 Volume, B-C, cc E 509.3 510.8 507.0 508.7 506.2 505.0 506.0 510.3 Gmb, A/E F 2.230 2.222 2.238 2.233 2.243 2.246 2.243 2.225 Gmm G 2.415 2.415 2.415 2.415 2.415 2.415 2.415 2.415 % Air Void, 100(G-F)/G H 7.67 8.00 7.32 7.55 7.14 6.99 7.14 7.90 Volume Air Void, HE/100 I Load, pounds P Dry - PC Dry XXX PC PC Dry Dry PC XXX
Avg.% air Voids PC: 7.34 Avg. % Air Voids Dry: 7.27
9- 4
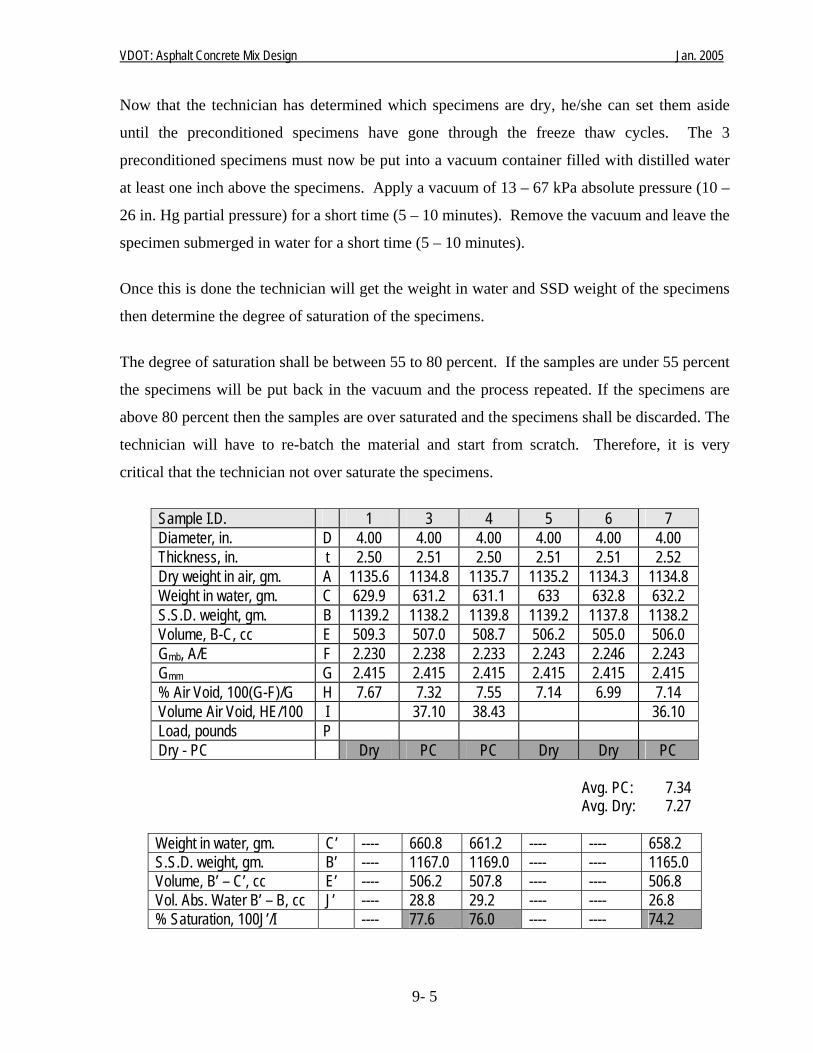
VDOT: Asphalt Concrete Mix Design Jan. 2005
9- 5
Now that the technician has determined which specimens are dry, he/she can set them aside
until the preconditioned specimens have gone through the freeze thaw cycles. The 3
preconditioned specimens must now be put into a vacuum container filled with distilled water
at least one inch above the specimens. Apply a vacuum of 13 – 67 kPa absolute pressure (10 –
26 in. Hg partial pressure) for a short time (5 – 10 minutes). Remove the vacuum and leave the
specimen submerged in water for a short time (5 – 10 minutes).
Once this is done the technician will get the weight in water and SSD weight of the specimens
then determine the degree of saturation of the specimens.
The degree of saturation shall be between 55 to 80 percent. If the samples are under 55 percent
the specimens will be put back in the vacuum and the process repeated. If the specimens are
above 80 percent then the samples are over saturated and the specimens shall be discarded. The
technician will have to re-batch the material and start from scratch. Therefore, it is very
critical that the technician not over saturate the specimens.
Sample I.D. 1 3 4 5 6 7 Diameter, in. D 4.00 4.00 4.00 4.00 4.00 4.00 Thickness, in. t 2.50 2.51 2.50 2.51 2.51 2.52 Dry weight in air, gm. A 1135.6 1134.8 1135.7 1135.2 1134.3 1134.8 Weight in water, gm. C 629.9 631.2 631.1 633 632.8 632.2 S.S.D. weight, gm. B 1139.2 1138.2 1139.8 1139.2 1137.8 1138.2 Volume, B-C, cc E 509.3 507.0 508.7 506.2 505.0 506.0 Gmb, A/E F 2.230 2.238 2.233 2.243 2.246 2.243 Gmm G 2.415 2.415 2.415 2.415 2.415 2.415 % Air Void, 100(G-F)/G H 7.67 7.32 7.55 7.14 6.99 7.14 Volume Air Void, HE/100 I 37.10 38.43 36.10 Load, pounds P Dry - PC Dry PC PC Dry Dry PC
Avg. PC: 7.34 Avg. Dry: 7.27
Weight in water, gm. C’ ---- 660.8 661.2 ---- ---- 658.2 S.S.D. weight, gm. B’ ---- 1167.0 1169.0 ---- ---- 1165.0 Volume, B’ – C’, cc E’ ---- 506.2 507.8 ---- ---- 506.8 Vol. Abs. Water B’ – B, cc J’ ---- 28.8 29.2 ---- ---- 26.8 % Saturation, 100J’/I ---- 77.6 76.0 ---- ---- 74.2
VDOT: Asphalt Concrete Mix Design Jan. 2005
9- 6
Now that the technician has determined that the degree of saturation meets the requirements of
AASHTO T-283 he/she can now proceed with conditioning of the specimens. The first step in
this process is to wrap the specimens in cellophane, then place the specimens in a zip lock bag.
Before closing the bag 10 ml of distilled water is added. Once this is done the specimens are
placed in a freezer at a temperature of 0° ± 5° F. for a minimum of 16 hours.
After removal from the freezer, place the specimens in a bath containing distilled water at 140°
± 2° F. for 24 ± 1 hours. As soon as possible after placement in the bath, remove the
cellophane from each specimen. After 24 ± 1 hours in the 140° F. water bath, remove the
specimens and place them and the dry specimens in a water bath already at 77° ± 1° F. for 2 ±
hours.
Note: The dry specimens must be wrapped in cellophane to prevent moisture from entering the specimens.
The next step is to determine the indirect tensile strength of the dry and conditioned specimens.
Remove the specimen from the 77° F. water bath and place between the two bearing plates in
the testing machine. Care must be taken so that the load is applied along the diameter of the
specimen. If steel loading strips are used, record the maximum compressive strength noted on
the testing machine, and continue loading until a vertical crack appears.
Remove the specimen from the machine and pull it apart at the crack. Inspect the interior
surface for stripping and record observations. If steel loading strips are not used, stop loading
as soon as the maximum compressive load is reached. Record the maximum compressive load.
Remove the specimen, measure, and record the side (edge) flattening to the nearest .1mm (.1
in.). The flattening may be easier to measure if the flattened edge is rubbed with the
lengthwise edge of a piece of chalk. After recording the flattening, replace the specimen in the
compression machine and compress until a vertical crack appears. Remove the specimen from
the machine and pull apart at the crack. Inspect the interior surface for stripping and record
observations.
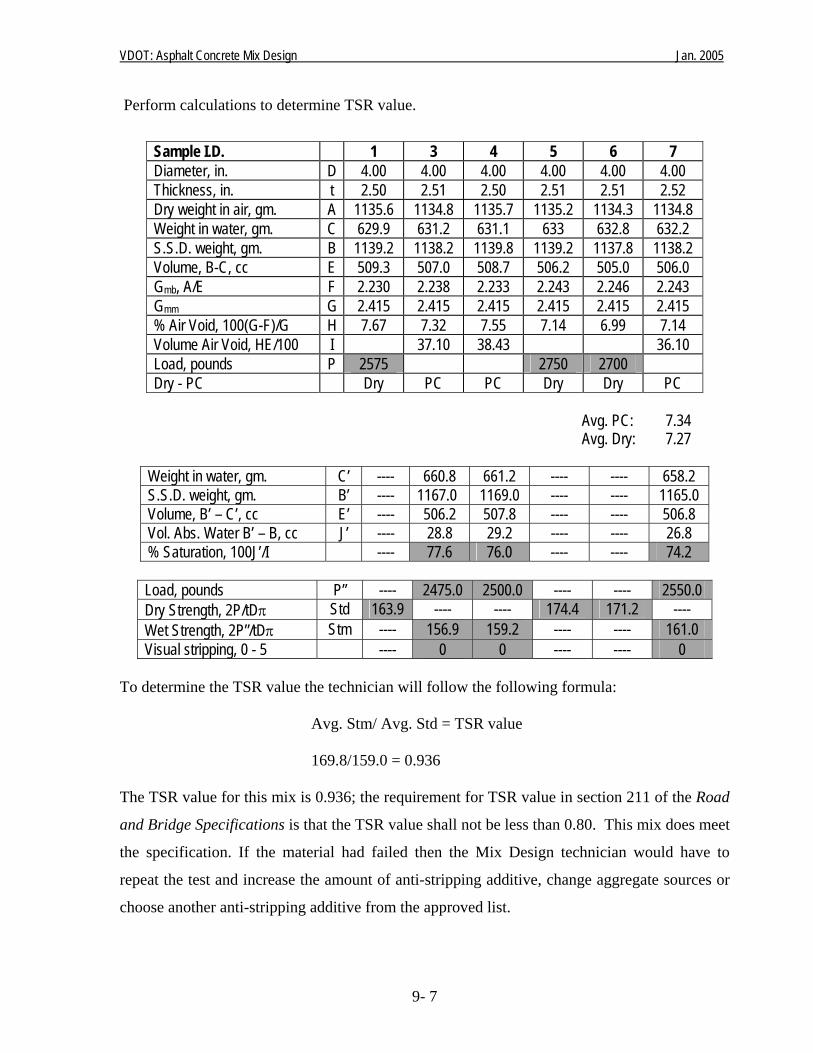
VDOT: Asphalt Concrete Mix Design Jan. 2005
9- 7
Perform calculations to determine TSR value.
Sample I.D. 1 3 4 5 6 7 Diameter, in. D 4.00 4.00 4.00 4.00 4.00 4.00 Thickness, in. t 2.50 2.51 2.50 2.51 2.51 2.52 Dry weight in air, gm. A 1135.6 1134.8 1135.7 1135.2 1134.3 1134.8 Weight in water, gm. C 629.9 631.2 631.1 633 632.8 632.2 S.S.D. weight, gm. B 1139.2 1138.2 1139.8 1139.2 1137.8 1138.2 Volume, B-C, cc E 509.3 507.0 508.7 506.2 505.0 506.0 Gmb, A/E F 2.230 2.238 2.233 2.243 2.246 2.243 Gmm G 2.415 2.415 2.415 2.415 2.415 2.415 % Air Void, 100(G-F)/G H 7.67 7.32 7.55 7.14 6.99 7.14 Volume Air Void, HE/100 I 37.10 38.43 36.10 Load, pounds P 2575 2750 2700 Dry - PC Dry PC PC Dry Dry PC
Avg. PC: 7.34 Avg. Dry: 7.27
Weight in water, gm. C’ ---- 660.8 661.2 ---- ---- 658.2 S.S.D. weight, gm. B’ ---- 1167.0 1169.0 ---- ---- 1165.0 Volume, B’ – C’, cc E’ ---- 506.2 507.8 ---- ---- 506.8 Vol. Abs. Water B’ – B, cc J’ ---- 28.8 29.2 ---- ---- 26.8 % Saturation, 100J’/I ---- 77.6 76.0 ---- ---- 74.2
Load, pounds P” ---- 2475.0 2500.0 ---- ---- 2550.0 Dry Strength, 2P/tDπ Std 163.9 ---- ---- 174.4 171.2 ---- Wet Strength, 2P”/tDπ Stm ---- 156.9 159.2 ---- ---- 161.0 Visual stripping, 0 - 5 ---- 0 0 ---- ---- 0
To determine the TSR value the technician will follow the following formula:
Avg. Stm/ Avg. Std = TSR value 169.8/159.0 = 0.936
The TSR value for this mix is 0.936; the requirement for TSR value in section 211 of the Road
and Bridge Specifications is that the TSR value shall not be less than 0.80. This mix does meet
the specification. If the material had failed then the Mix Design technician would have to
repeat the test and increase the amount of anti-stripping additive, change aggregate sources or
choose another anti-stripping additive from the approved list.