Embed Size (px)
Citation preview
Table of effects in benefit-risk assessments
Hans Hillege,
CHMP Member, Medicines Evaluation Board, The Netherlands

Table of effects in benefit-risk assessments current European status Challenges and Opportunities within current practices and processes
Disclaimer
The views and opinions expressed in the following presentation are those of the individual presenter and should not be attributed to the European Medicines Agency, one of its committees or working parties or any other regulatory agency.
2

Table of effects in benefit-risk assessments current European status Challenges and Opportunities within current practices and processes
Daniels N. Accountability for reasonableness. BMJ. 2000;321(7272):1300-1
A fair regulatory process requires “accountability for reasonableness”, i.e., publicity about the reasons and rationales that play a part in decisions
What is expected from a regulatory agency?
3

Table of effects in benefit-risk assessments current European status Challenges and Opportunities within current practices and processes
Background
March 2008 CHMP: Reflection paper on benefit-risk assessment methods with two main recommendations to improve consistency, transparency and communication of B/R :
• Revise the benefit-risk balance section of the CHMP
Assessment Report template
• Introduce research methodologies of benefit-risk balance - Involve experts, assessors, and specialists in Decision
Theory - Switch from “implicit” to “explicit” decision making
2009 Start Benefit-risk methodology project
4
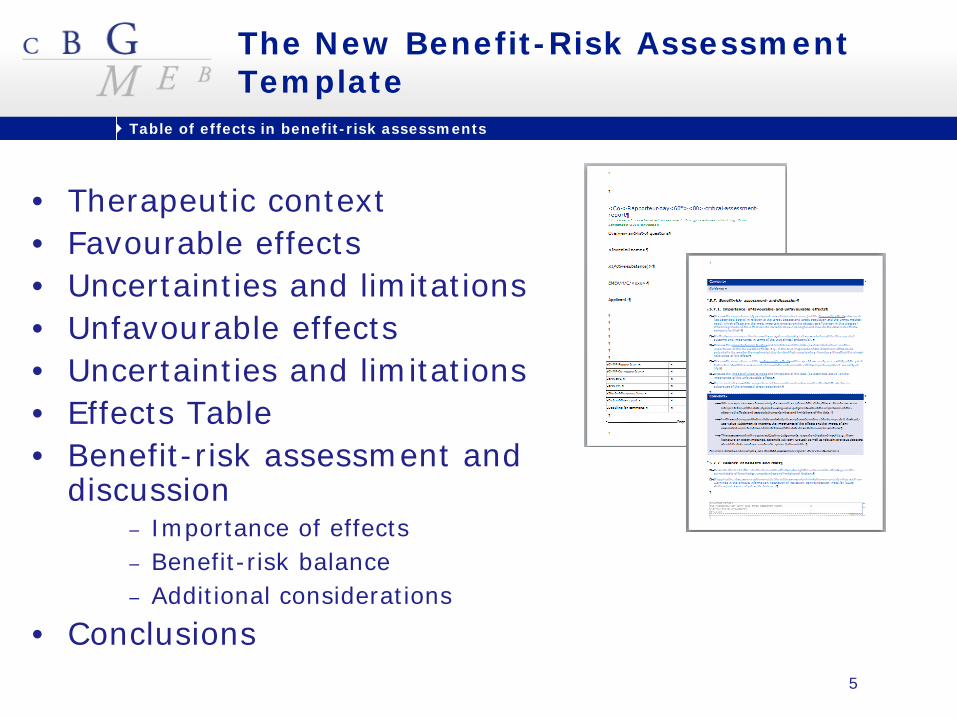
Table of effects in benefit-risk assessments current European status Challenges and Opportunities within current practices and processes
The New Benefit-Risk Assessment Template
• Therapeutic context • Favourable effects • Uncertainties and limitations • Unfavourable effects • Uncertainties and limitations • Effects Table • Benefit-risk assessment and
discussion − Importance of effects − Benefit-risk balance − Additional considerations
• Conclusions 5

Table of effects in benefit-risk assessments current European status Challenges and Opportunities within current practices and processes
The Effects table
• An effects table is a useful qualitative tool for displaying a concise summary of the key benefits and risks of a new product (single or multiple doses) compared to either placebo or an existing product
• It displays all important favourable and unfavourable effects including all uncertainties and limitations that may affect their clinical interpretation
6

Table of effects in benefit-risk assessments current European status Challenges and Opportunities within current practices and processes
Effects table example
Effect Short Description
Unit Placebo Vandetanib Uncertainties/ Strength of evidence
References
Favo
ura
ble
PFS From randomization to progression or death (blinded independent review)
% 51.0 (41.4-60.1)
31.6 (26.0-37.9)
HR 0.45 (0.31, 0.6) Large effect in overall population. Consistent and significant effect on PFS but not OS (too early?) Log rank P-value (2- sided) p<.0001 RR 3.5 (2.0-5.9) Only a very low number of patients with definite RET mutation negative status at baseline. Lower efficacy? No clear effect on PRO/QoL (missing data) 9)
See Discussion on Clinical Efficacy. Single-arm study in RET negative patients post-approval. See Discussion on Clinical Efficacy.
PFS (median) Weibull model Months 19.3 30.5
ORR Proportion of complete or partial responders (>=30% decrease unidimensional) RECIST
% 13.0 (7.8-21.0)
45.0 (38.7-51.5)
Un
favo
ura
ble
Diarrhoea Grade 3-4 (1)
Increase of ≥7 stools per day over baseline; incontinence; Life-threatening
% 2.0 (0.6-7.0)
10.8 (7.4-15.5)
RR 3.5 (2.0, 5,9) Duration of follow up is short vs. the need for long duration of treatment. RR 13.0 (1.8-94.0) Risk of developing further major cardiac SAEs including Torsades de pointe? RR 1.4 (1.0, 1.9)
Risk of dehydration and renal/cardiac risks (see SmPC 4.4) Restrict to symptomatic and aggressive disease (see SmPC 4.1). Explore lower dose (see See Table 20. Summary of the RMP)
QTc related events Grade 3-4 (1)
QTc >0.50 second; life threatening; Torsade de pointes
% 1.0 (0.2-5.5)
13.4 (9.6-18.4)
Infections Grade 3-4 (1)
IV antibiotic, antifungal, or antiviral intervention indicated; Life-threatening
% 36.4 (27.3-45.8)
49.8 (43.4-56.2)
7
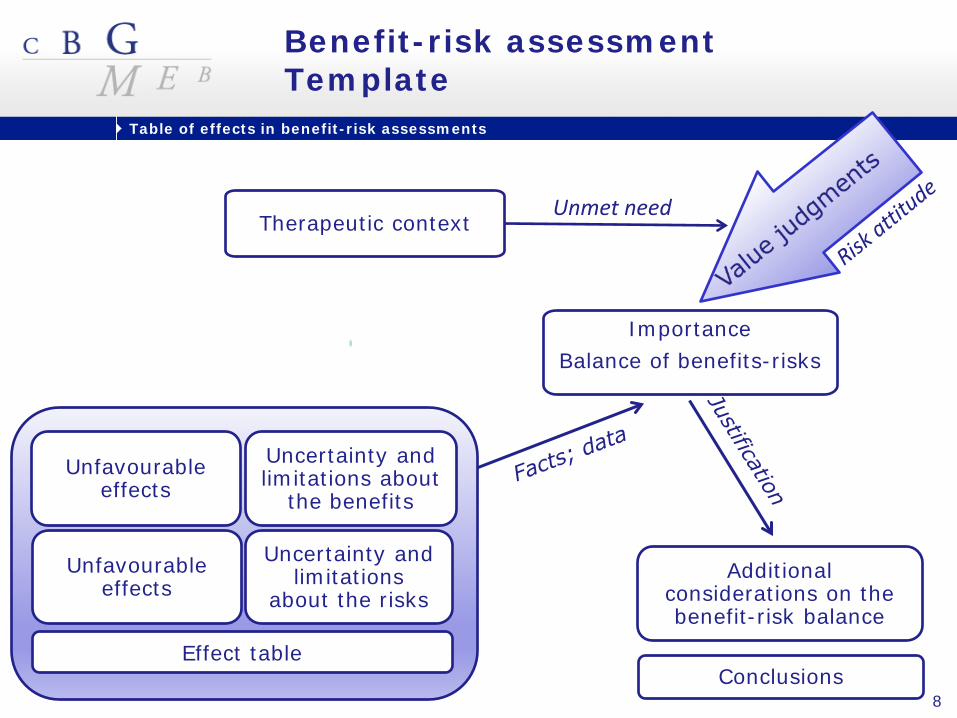
Table of effects in benefit-risk assessments current European status Challenges and Opportunities within current practices and processes
Benefit-risk assessment Template
Therapeutic context
Importance Balance of benefits-risks
Unmet need
Effect table
Unfavourable effects
Unfavourable effects
Uncertainty and limitations about
the benefits
Uncertainty and limitations
about the risks Additional
considerations on the benefit-risk balance
Conclusions 8

Table of effects in benefit-risk assessments current European status Challenges and Opportunities within current practices and processes
Effects table pros and cons
Pros • It drives alignment on key benefits and risks
• It clarifies the way to measure and/or present key benefits and risks
• It’s an efficient tool to aid communication
• It permits an opportunity to rank key benefits and risks
• It can be used to look for consistency of the benefit-risk ratio across subgroups
• It will facilitate internal governance reviews
• It may help in payer discussions
Cons • Risk of focusing on table and missing the totality of evidence
• Risk of oversimplification
• Increased workload for assessors
• Difficult to have a good ET for large and complex applications
9

Table of effects in benefit-risk assessments current European status Challenges and Opportunities within current practices and processes
Compliance with template guidance (B-R balance)
Item(s) Score BR Balance Items .55 Importance .64 • Important benefits identified? .94 Explicit value judgements? .45
• Important risks identified? .87 Explicit value judgements? .29
Benefit risk balance .37 • Value function? .07 • Benefits and risks trade-offs? .66 Discussion .29 • Effect of uncertainties? .48 • Different stakeholders? .11
10

Table of effects in benefit-risk assessments current European status Challenges and Opportunities within current practices and processes
Compliance with template guidance (B-R balance)
Item(s) Score BR Balance Items .55 Importance .64 • Important benefits identified? .94 Explicit value judgements? .45
• Important risks identified? .87 Explicit value judgements? .29
Benefit risk balance .37 • Value function? .07 • Benefits and risks trade-offs? .66 Discussion .29 • Effect of uncertainties? .48 • Different stakeholders? .11
0=Not covered 1=Partly covered 2=Fully covered
11

Table of effects in benefit-risk assessments current European status Challenges and Opportunities within current practices and processes
B/R balance B/R balance, intuitive assessment
Effect Short description Unit Treatment Control
Favourable effects
Progression free survival
Proportion of patients who have a time to progression of at least 12 months
%
Unfavourable effects
Severe toxicity Proportion of patients who experience severe or life-threatening side-effects
%
12
Effect Short description Unit Treatment Control
Favourable effects
Progression free survival
Proportion of patients who have a time to progression of at least 12 months
% 70% 50%
Unfavourable effects
Severe toxicity Proportion of patients who experience severe or life-threatening side-effects
% 85% 45%

Table of effects in benefit-risk assessments current European status Challenges and Opportunities within current practices and processes
Intuitive vs explicit assessment
• Intuitive assessment: preferences for different treatment outcomes remain implicit and undocumented
• Explicit assessment: the conclusion regarding the B/R balance is derived from a set of qualitative or quantitative preference statements elicited from the decision maker
13

Table of effects in benefit-risk assessments current European status Challenges and Opportunities within current practices and processes
Effect Short description Unit Treatment Control
Favourable effects
Progression free survival
Proportion of patients who have a time to progression of at least 12 months
% 70% 50%
Unfavourable effects
Severe toxicity Proportion of patients who experience severe or life-threatening side-effects
% 85% 45%
Conclusion
The increase in PFS from 50% to 70% is clinically relevant and outweighs the increase in severe toxicity. Therefore, the B/R balance of the new treatment is positive.
B/R balance, intuitive assessment
14

Table of effects in benefit-risk assessments current European status Challenges and Opportunities within current practices and processes
B/R balance, explicit assessment
Elicited preference statement:
Starting from a value of 50%, the smallest increase in PFS that would be required to offset an increase in severe toxicity from 45% to 85% is 15% (i.e., an increase from 50% to 65%).
Conclusion: The increase in PFS with the new treatment exceeds the minimum required benefit of 15%. Therefore, the B/R balance of the new treatment is positive.
15

Table of effects in benefit-risk assessments current European status Challenges and Opportunities within current practices and processes
Explicit assessment (cont)
• Myeloma patients from the Myeloma UK patient organisation were invited to complete a multi-criteria decision analysis comprising the following three attributes: (i) progression-free survival, (ii) moderate but chronic toxicity, and (iii) severe toxicity.
• A total of 560 participants completed the questionnaire. – Overall context of the survey was discussed in a
focus group – First version of the online questionnaire was
developed and pre-tested in a second group of myeloma patients;
– Revised version of the questionnaire was developed.
16

Table of effects in benefit-risk assessments current European status Challenges and Opportunities within current practices and processes
Stated Preferences for multiple myeloma: Methods
D. Postmus et al. The Oncologist 2017. Individual trade-offs between possible benefits and risks of cancer treatments: Results from a stated preference study with multiple myeloma patients. 17

Table of effects in benefit-risk assessments current European status Challenges and Opportunities within current practices and processes
Example: new treatment for multiple myeloma
Effect Short description Unit Treatment Control
Favourable effects
Progression free survival
Proportion of patients who have a time to progression free survival of at least 12 months
% 90% 50%
Unfavourable effects
Severe toxicity Proportion of patients who experience severe or life-threatening side-effects
% 85% 45%
Moderate but
chronic toxicity
Probability of experiencing mild to moderate side-effects for two months or longer
% 80% 20%
18
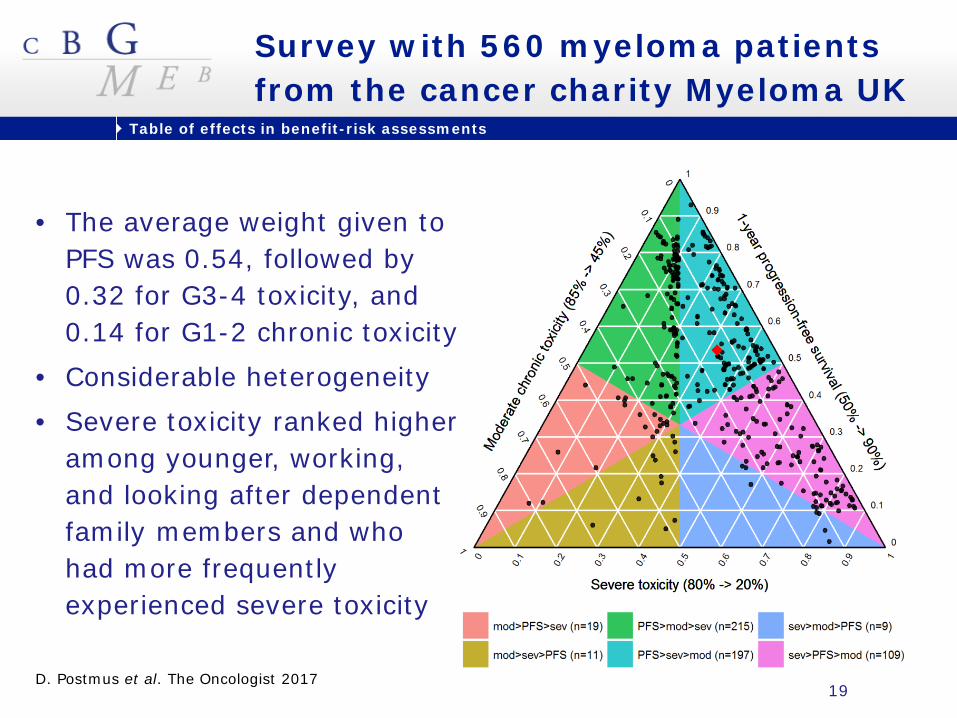
Table of effects in benefit-risk assessments current European status Challenges and Opportunities within current practices and processes
Survey with 560 myeloma patients from the cancer charity Myeloma UK
• The average weight given to PFS was 0.54, followed by 0.32 for G3-4 toxicity, and 0.14 for G1-2 chronic toxicity
• Considerable heterogeneity • Severe toxicity ranked higher
among younger, working, and looking after dependent family members and who had more frequently experienced severe toxicity
D. Postmus et al. The Oncologist 2017 19
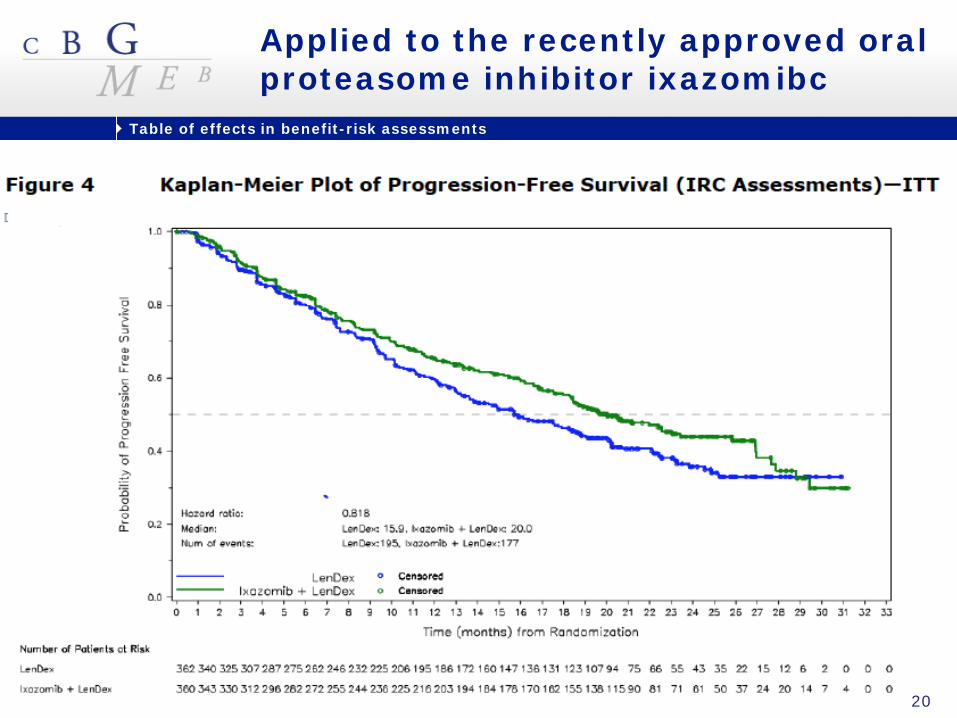
Table of effects in benefit-risk assessments current European status Challenges and Opportunities within current practices and processes
Applied to the recently approved oral proteasome inhibitor ixazomibc
20

Table of effects in benefit-risk assessments current European status Challenges and Opportunities within current practices and processes
Is the B/R balance of the new treatment positive or negative?
Effect Short description Unit Treatment Control
Favourable effects
Progression free survival
Proportion of patients who have a time to progression free survival of at least 12 months
% 66% 59%
Unfavourable effects
Severe toxicity Proportion of patients who experience severe or life-threatening side-effects
% 71% 69%
Moderate but
chronic toxicity
Probability of experiencing mild to moderate side-effects for two months or longer
% 60% 53%
Applied to the recently approved oral proteasome inhibitor ixazomibc
21
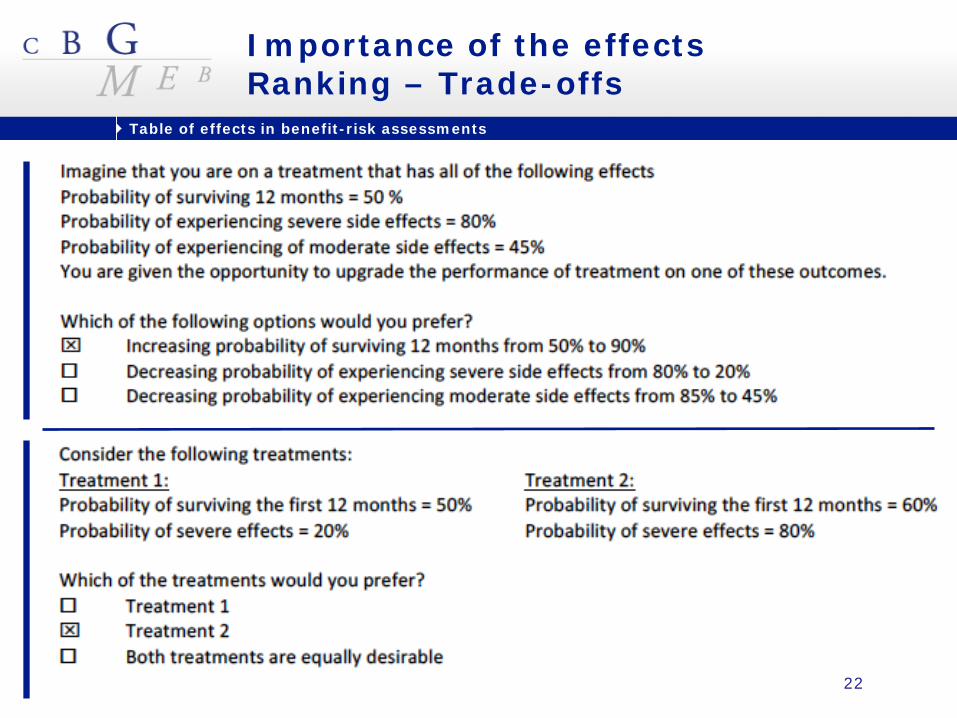
Table of effects in benefit-risk assessments current European status Challenges and Opportunities within current practices and processes
Importance of the effects Ranking – Trade-offs
22

Table of effects in benefit-risk assessments current European status Challenges and Opportunities within current practices and processes
Applied to the recently approved oral proteasome inhibitor ixazomibc
How the total value of each alternative is composed out of each value for each criterion
0.57
0.44
0.0
How likely each intervention is to overall be the best, worst based on the SMAA model results for the given preferences and data.
0.0
0.20
0.80
0.0
1.0
23

Table of effects in benefit-risk assessments current European status Challenges and Opportunities within current practices and processes
One-way sensitivity analysis
One-way sensitivity analysis
24

Table of effects in benefit-risk assessments current European status Challenges and Opportunities within current practices and processes
Table of effects in BR assessments : • adds transparency • improves consistency in data presentation • creates the possibility to make value
judgements more explicit • ensures quality of decision making
Concluding remarks (I)
25

Table of effects in benefit-risk assessments current European status Challenges and Opportunities within current practices and processes
• (Patient) Preference information: – might be helpful in regulatory decision making in
situations where the balance of benefits and risks is not self-evident
– could change the weight of benefits and risks as judged by the regulatory authorities, leading to different decisions regarding approval of medicines
– could lead to the identification of subgroups of patients with homogeneous preferences and, as a result, to market authorization or reimbursement decisions that will be tailored to such subgroups
• Are we there, we are improving but not yet; Who, What, Why, When, Where, How, How Much?
Concluding remarks (II)
26

Table of effects in benefit-risk assessments current European status Challenges and Opportunities within current practices and processes
Douwe Postmus, Francesco Pignatti, Enrica Alteri, Sinan Bardakci Sarac, Andrea Beyer, Nathalie Bere, Jan Mueller-Berghaus, Michael Berntgen, Laurent Brassart, Pierre Demolis, Hans-Georg Eichler, Harald Enzmann, F. Gniewosz, Pieter de Graeff, Jolanta Gulbinovic, Brigitte Keller-Stanislawsk, Andreas Kouroumalis, Isabelle Moulon, Larry Phillips, Tomas Salmonson, Almath Spooner, Rafe Suvarna, Xavier Kurz, Nikos Zafiropoulous, Arantxa Sancho and the “Addis development team”
Acknowledgements
27

Table of effects in benefit-risk assessments current European status Challenges and Opportunities within current practices and processes
Thank you very much for your attention !
28

Table of effects in benefit-risk assessments current European status Challenges and Opportunities within current practices and processes
29

Table of effects in benefit-risk assessments current European status Challenges and Opportunities within current practices and processes
Reminder
In the mind’s eye
“Subjectivity is inescapable in all phases of clinical research: planning, execution, analysis and reporting.
The ultimate subjectivity is in the interpretation of published data”.
J.P. Van der Broecke NTvG 1996; 14: 220-1
30

Table of effects in benefit-risk assessments current European status Challenges and Opportunities within current practices and processes
Application example
SMAA: The proportion of patients ranking the experimental regimen above the placebo regimen was 76%
Attribute Experi-mental
Placebo
1-yr PFS 66% 59%
G 1-2 chronic
71% 69%
G 3-4 60% 53%
Abbreviations: SMAA, Stochastic multi-criteria acceptability analysis. Severe toxicity (from 53% to x%)
Mod
erat
e to
xici
ty (
from
69%
to
x%)
Max. acceptable Risk for an increase in 1-year PFS from 59% to 66%
31

Table of effects in benefit-risk assessments current European status Challenges and Opportunities within current practices and processes
Proportion of patients ranking ixazomib lower than the standard regimen stratified for time of diagnosis
32