Embed Size (px)
Citation preview

Number Description Page
Table 3 Commercial Waste Composition by Subsector Page 2
Table 4a Key for Tables 4 - 7 Page 3
Table 4 Institutional Waste by Category -- Summer Page 4
Table 5 Institutional Waste by Category -- Fall Page 5
Table 6 Institutional Waste by Category -- Winter Page 6
Table 7 Institutional Waste by Category -- Spring Page 7
Table 8 Material Conversion Chart Page 8
Table 9 Weight Volume Conversion Table Page 9
Worksheet 1 Waste Reduction Assessment Worksheet Page 10
Worksheet 2 Solid Waste Composition and Management Page 11
Worksheet 3 Waste Audit General Information Page 12
Worksheet 4 Solid Waste Quantification and Composition Page 14
Worksheet 5 Recycling Action Plan Page 16
TABLES AND WORKSHEETS
TA
BL
E 3
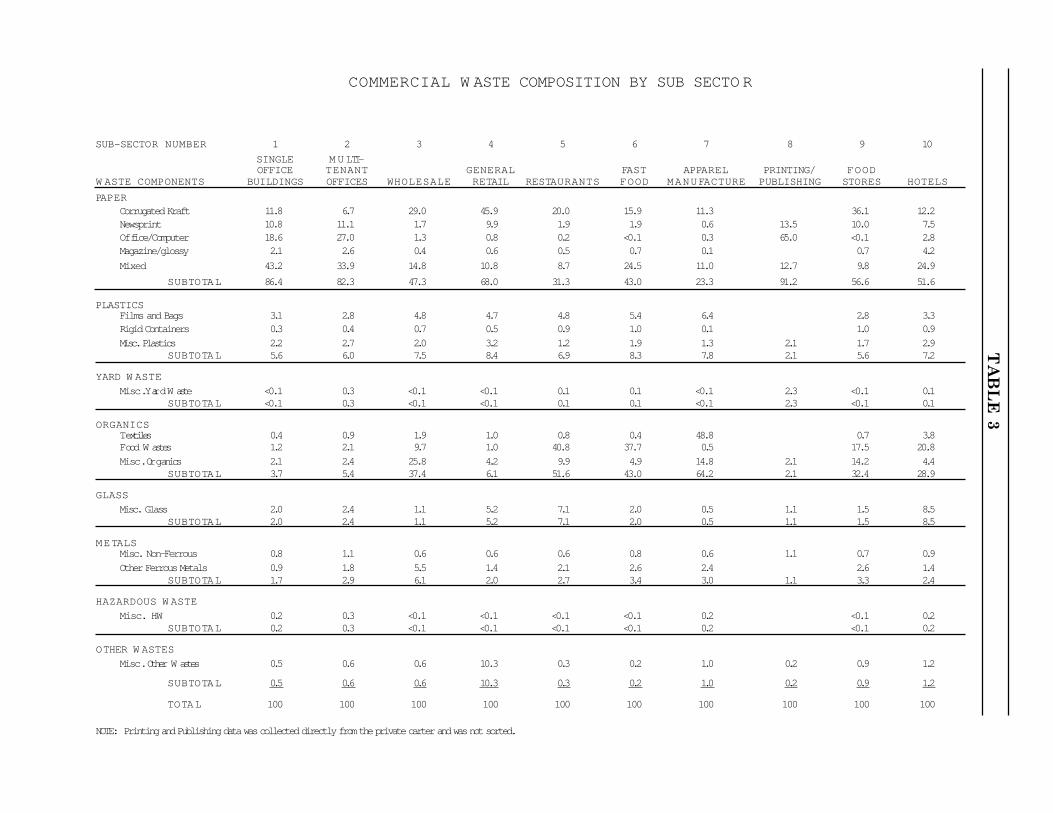
COMMERCIAL WASTE COMPOSITION BY SUB SECTO R
SUB-SECTOR NUMBER 1 2 3 4 5 6 7 8 9 10
SINGLE M U LTI-OFFICE TENANT GENERAL FAST APPAREL PRINTING/ FOOD
W ASTE COMPONENTS BUILDINGS OFFICES WHOLESALE RETAIL RESTAURANTS FOOD M A N U FACTURE PUBLISHING STORES HOTELS
PAPERCorrugated Kraft 11.8 6 .7 29.0 45.9 20.0 15.9 11.3 36.1 12.2Newsprint 10.8 11.1 1 .7 9.9 1.9 1.9 0.6 13.5 10.0 7 .5Off ice/Computer 18.6 27.0 1 .3 0.8 0.2 <0.1 0 .3 65.0 <0.1 2 .8Magazine/glossy 2 .1 2.6 0.4 0.6 0.5 0.7 0.1 0.7 4.2
Mixed 43.2 33.9 14.8 10.8 8 .7 24.5 11.0 12.7 9 .8 24.9
SUBTOTAL 86.4 82.3 47.3 68.0 31.3 43.0 23.3 91.2 56.6 51.6
PLASTICSFilms and Bags 3 .1 2.8 4.8 4.7 4.8 5.4 6.4 2.8 3.3Rigid Containers 0 .3 0.4 0.7 0.5 0.9 1.0 0.1 1.0 0.9
Misc. Plastics 2 .2 2.7 2.0 3.2 1.2 1.9 1.3 2.1 1.7 2.9SUBTOTAL 5.6 6.0 7.5 8.4 6.9 8.3 7.8 2.1 5.6 7.2
YARD WASTE
Misc. Yard W aste <0.1 0 .3 <0.1 <0.1 0 .1 0.1 <0.1 2 .3 <0.1 0 .1SUBTOTAL <0.1 0 .3 <0.1 <0.1 0 .1 0.1 <0.1 2 .3 <0.1 0 .1
ORGANICSTextiles 0.4 0.9 1.9 1.0 0.8 0.4 48.8 0 .7 3.8Food W astes 1.2 2.1 9.7 1.0 40.8 37.7 0 .5 17.5 20.8
Misc. Organics 2 .1 2.4 25.8 4 .2 9.9 4.9 14.8 2 .1 14.2 4 .4SUBTOTAL 3.7 5.4 37.4 6 .1 51.6 43.0 64.2 2 .1 32.4 28.9
GLASS
Misc. Glass 2 .0 2.4 1.1 5.2 7.1 2.0 0.5 1.1 1.5 8.5SUBTOTAL 2.0 2.4 1.1 5.2 7.1 2.0 0.5 1.1 1.5 8.5
M E TALSMisc. Non-Ferrous 0 .8 1.1 0.6 0.6 0.6 0.8 0.6 1.1 0.7 0.9
Other Ferrous Metals 0 .9 1.8 5.5 1.4 2.1 2.6 2.4 2.6 1.4SUBTOTAL 1.7 2.9 6.1 2.0 2.7 3.4 3.0 1.1 3.3 2.4
HAZARDOUS WASTE
Misc. HW 0 .2 0.3 <0.1 <0.1 <0.1 <0.1 0 .2 <0.1 0 .2SUBTOTAL 0.2 0.3 <0.1 <0.1 <0.1 <0.1 0 .2 <0.1 0 .2
OTHER WASTES
Misc. Other W astes 0.5 0.6 0.6 10.3 0 .3 0.2 1.0 0.2 0.9 1.2
SUBTOTAL 0.5 0.6 0.6 10.3 0.3 0.2 1.0 0.2 0.9 1.2
TOTA L 100 100 100 100 100 100 100 100 100 100
NOTE: Printing and Publishing data was collected directly from the private carter and was not sorted.

TABLE 4A
Institutional CategoryNumber Description
1 Public Elementary Schools
2 Junior High Schools
3 Private Schools (K - 8TH Grade)
4 Private Schools (6TH - 12TH Grade)
5 Psychiatric Hospitals
6 Skilled Nursing Facilities
7 Municipal Hospitals8 Teaching Hospitals9 Non-Profit Hospitals10 Government Office Buildings11 Correctional Facilities12 Colleges/Universities13 Public High Schools14 Transportation Hubs
KEY FOR TABLES 4 - 7

INSTITUTIONAL WASTE COMPOSITION BY CATEGORY
SUMMER
INSTITUTIONAL CATEGORY NUMBER
WASTE COMPONENT 1 2 3 4 5 6 7 8 9 10 11 12 13 14
Corrugated/Kraft 10.16 9.53 6.02 6.06 12.82 9.07 24.21 11.00 26.59 4.66 7.88 8.78 11.99 6.55Newsprint 3.32 1.87 1.50 6.62 2.07 0.83 1.33 5.96 2.64 8.90 6.49 5.23 4.38 30.35Office/Computer 2.60 4.77 1.03 6.70 8.83 1.96 10.21 14.51 10.57 51.17 5.74 22.56 3.75 7.01Magazines & Glossy 0.96 0.44 6.28 3.06 0.50 0.38 2.70 0.60 0.57 1.77 0.69 5.40 0.83 1.48Book/Phone Book 0.74 0.41 18.19 2.25 0.04 0.12 0.03 0.96 2.57 0.69 7.99 2.24 0.92Non-Corrugated OCC 3.56 4.65 2.03 1.29 6.34 3.70 5.08 6.33 3.39 3.19 2.12 3.53 10.18 2.24Mixed 6.26 4.86 6.86 6.55 5.16 5.81 12.08 12.69 11.19 12.22 11.53 12.38 24.29 18.42
TOTAL PAPER FRACTION 27.59 26.33 41.71 32.56 35.56 21.85 55.64 52.07 54.93 84.50 35.13 65.85 57.66 64.97
Clear HDPE containers 0.27 0.34 0.14 0.31 0.30 0.38 0.20 0.45 0.30 0.06 0.23 0.30 0.17 0.27Colored HDPE containers 0.34 0.22 0.11 0.21 0.57 0.35 0.62 1.58 0.06 0.06 0.45 0.24 0.09 0.34LDPE 0.05 0.05 0.01 0.13 0.23 0.03 0.12 0.19 0.06 0.11 0.08 0.02 0.06Films and Bags 3.58 3.24 2.75 10.34 4.59 5.06 3.45 5.13 3.97 1.70 8.38 3.60 5.03 3.22Green PET containers 0.11 0.01 0.06 0.13 0.24 0.32 0.01 0.04 0.26 0.43 0.03 0.12Clear PET containers 0.23 0.43 0.12 0.09 0.21 0.03 0.18 0.17 0.04 0.13 0.12 0.27 0.10 0.25PVC 0.06 0.06 0.01 0.04 0.01 0.06 0.22 0.06 0.10 0.01 0.03 0.09Polypropylene 0.12 0.02 0.01 0.07 0.08 0.14 0.23 0.25 0.73 0.20 0.23 0.02 0.05 0.07Polystyrene (estimated) 2.67 1.10 1.25 1.08 7.23 5.58 2.54 4.69 5.74 1.05 1.36 1.67 1.83 0.83Misc. Plastic 1.83 5.58 0.83 0.25 0.20 0.10 2.00 0.40 4.46 1.05 1.63 0.25 0.87 0.52
TOTAL PLASTIC FRACTION 9.26 11.04 4.84 12.40 13.45 11.86 9.82 13.11 15.72 4.46 12.86 6.86 8.23 5.77
Grass/Leaves 6.74 2.66 13.28 4.58 0.05 0.23 0.11 13.79 0.37 1.21 0.49Brush/Prunnings/Stumps 1.09 1.23 0.33 8.55 0.74 0.58 1.66 0.35 1.18
TOTAL YARD WASTE FRACTION 7.83 1.23 2.99 21.84 5.32 0.63 0.23 0.11 15.46 0.72 2.39 0.49
Lumber 5.79 1.80 0.27 6.68 0.94 0.16 0.41 1.43 0.66 0.05 1.61 0.88 1.32 0.60Textiles 2.67 1.50 0.69 1.69 3.76 3.06 2.79 5.64 1.29 0.80 3.92 1.52 0.75 3.54Rubber 0.03 0.13 0.23 0.15 0.19 0.35 0.45 1.04 0.24 0.03 0.43Fines 2.07 1.29 0.65 1.55 1.66 0.96 1.33 0.60 0.65 2.26 0.72 1.34 2.31Diapers 1.59 0.32 0.14 0.06 1.31 33.29 4.30 2.43 11.86 0.05 0.05 0.09 0.27Foodwaste 16.85 21.48 37.65 3.24 18.01 14.07 11.56 12.73 8.25 2.26 9.79 15.12 8.68 2.17Misc. Organic 5.21 8.88 1.25 4.28 7.33 6.73 3.75 1.66 0.80 4.52 2.02 5.00 2.64
TOTAL ORGANIC FRACTION 34.21 35.27 40.77 17.74 33.02 59.18 24.11 25.67 22.65 4.41 23.18 20.58 17.11 11.96
Clear Glass containers 1.75 1.31 0.39 1.50 1.77 0.69 6.30 0.56 1.39 2.14 1.21 1.37 1.48 3.71Green Glass containers 0.26 0.29 0.03 0.31 0.05 0.09 0.10 0.51 0.32 0.26 0.41 0.16 1.09Brown Glass containers 0.26 0.61 0.05 0.33 0.15 0.06 0.23 0.03 0.06 0.12 0.23 0.06 0.73Misc. Glass 0.43 0.04 0.03 0.04 1.31 2.02
TOTAL GLASS FRACTION 2.71 2.26 0.47 2.14 1.96 0.88 6.63 1.10 1.43 2.54 1.60 2.01 3.03 7.55
Alum. Food containers/foil 0.45 0.66 0.32 0.51 1.01 0.40 0.56 0.96 0.24 0.80 0.32 0.17 0.65 0.51Alum. Beverage Cans 0.31 0.25 0.16 0.41 0.40 0.20 0.48 0.59 0.42 0.89 0.44 0.61 0.89 1.11Misc. Aluminum 0.14 0.03 0.07 0.06 0.06 0.17 0.09 0.40 0.17 0.20 0.08 0.14 0.11
TOTAL ALUMINUM FRACTION 0.89 0.94 0.55 0.96 1.47 0.77 1.15 1.94 0.66 1.65 0.96 0.86 1.68 1.72
Ferrous Metal Food conts. 1.60 1.72 2.06 1.03 4.46 2.96 1.19 2.39 3.18 0.35 1.28 0.43 1.87 0.67Other Ferrous Metal 1.93 1.64 0.97 1.61 0.41 0.21 0.36 0.06 0.27 0.28 2.54 1.29 5.28 2.64
TOTAL FERROUS METAL FRACTION 3.53 3.36 3.03 2.64 4.87 3.17 1.55 2.47 3.45 0.63 3.82 1.73 7.16 3.31
Bimetal cans 0.05 0.04TOTAL METAL FRACTION 4.42 4.30 3.58 3.62 6.34 3.94 2.74 4.41 4.11 2.28 4.78 2.58 8.88 5.03
Non-bulk Ceramics 0.02 0.03 0.05 0.28 0.02 0.20 0.11 0.08Misc. Non-organic 3.24 13.64 0.78 6.54 1.96 0.59 0.05 0.03 0.01 4.39 1.24 3.22
TOTAL INORGANIC FRACTION 3.26 13.67 0.83 6.83 1.96 0.59 0.05 0.03 0.03 4.58 1.35 3.30
Pesticides 0.12Non-pesticide Poisons 0.01 0.04 0.01 0.01 0.02Paint/Solvent/Fuel 0.56 0.40 0.02 0.09 0.01 0.12 0.06 0.26 0.01 0.03 0.03Dry Cell Batteries 0.01 0.01 0.01 0.09 0.01 0.03 0.01 0.01 0.04Car BatteriesMedical Waste 0.04 0.29 0.37 0.49 3.05 0.76Misc. HHW 0.32 0.02 0.07 0.14 0.03 0.42
TOTAL HHW FRACTION 0.94 0.40 0.05 0.50 0.47 0.51 3.19 1.01 0.11 0.27 0.01 0.10 0.49
TOTAL BULK ITEMS 9.81 5.52 4.79 2.90 1.86 0.57 0.27 0.41 0.12 1.53 2.11 1.40 1.24 0.43
TABLE 4

INSTITUTIONAL WASTE COMPOSITION BY CATEGORY
FALL
INSTITUTIONAL CATEGORY NUMBER
WASTE COMPONENT 1 2 3 4 5 6 7 8 9 10 11 12 13 14
Corrugated/Kraft 12.41 11.10 12.66 13.92 10.73 9.66 19.85 10.55 19.81 5.03 7.61 15.89 15.39 9.33Newsprint 3.20 4.36 4.36 4.31 3.68 3.27 4.16 5.41 3.94 8.57 4.24 9.57 5.91 36.40Office/Computer 3.92 5.51 1.62 2.61 3.70 3.65 6.26 9.49 3.70 36.36 0.94 10.77 5.28 2.13Magazines & Glossy 1.17 1.57 1.40 0.42 2.12 0.90 1.64 1.72 1.32 2.84 0.35 1.47 0.96 1.64Book/Phone Book 2.00 2.89 2.73 1.22 1.25 0.71 0.62 3.21 0.85 5.40 0.46 0.93 4.46 0.13Non-Corrugated OCC 3.40 12.61 2.11 1.94 5.08 1.73 3.41 5.30 2.59 3.99 2.13 1.15 3.35 1.77Mixed 19.32 11.86 27.32 24.59 10.31 9.55 15.16 15.10 19.64 23.95 12.20 25.82 19.75 15.75
TOTAL PAPER FRACTION 45.42 49.91 52.20 48.99 36.88 29.47 51.09 50.77 51.85 86.14 27.92 65.59 55.09 67.16
Clear HDPE containers 0.12 0.08 0.18 0.06 0.14 0.23 0.19 0.06 0.33 0.11 0.12 0.23 0.14 0.11Colored HDPE containers 0.09 0.06 0.25 0.08 0.54 0.15 0.26 0.19 0.11 0.07 0.08 0.14 0.05 0.06LDPE 0.01 0.07 0.03 0.01 0.19 0.26 0.44 0.29 0.09 0.01 0.03 0.02 0.01 0.02Films and Bags 4.37 2.49 4.11 3.56 6.42 5.66 4.45 5.12 4.82 2.79 4.14 4.53 4.00 3.57Green PET containers 0.02 0.01 0.04 0.01 0.17 0.04 0.73 0.02 0.03 0.24 0.01 0.30 0.03 0.05Clear PET containers 0.03 0.06 0.18 0.10 0.18 0.02 0.05 0.04 0.02 0.10 0.07 0.23 0.07 0.10PVC 0.02 0.02 0.13 0.13 0.04 0.32 0.12 0.28 0.11 0.03 0.03 0.05 0.08 0.13Polypropylene 0.10 0.01 0.44 0.22 0.26 0.27 0.06 0.02 0.06 0.02 0.01 0.04Polystyrene (est. for Summer) 2.97 0.76 1.28 0.38 1.53 1.25 0.76 0.29 2.54 0.55 0.76 1.89 3.35 0.69Misc. Plastic 2.76 0.75 0.79 0.86 4.92 3.71 2.85 4.62 4.72 1.64 0.24 0.69 1.30 0.62
TOTAL PLASTIC FRACTION 10.48 4.33 6.99 5.19 14.56 11.88 10.11 11.19 12.85 5.55 5.54 8.09 9.03 5.38
Grass/Leaves 5.39 2.46 8.61 29.43 0.96 4.57 1.16 5.62 0.26 0.06 0.79 5.15 1.46 1.30Brush/Prunnings/Stumps 0.95 0.06 0.11 0.07 0.01
TOTAL YARD WASTE FRACTION 5.39 2.46 9.56 29.49 0.96 4.68 1.16 5.62 0.26 0.06 0.79 5.22 1.46 1.31
Lumber 0.93 1.07 0.18 0.01 0.19 0.28 1.57 0.17 0.24 0.33 2.05 3.30 3.10Textiles 0.64 0.51 1.75 1.11 3.69 1.40 3.29 3.89 1.56 0.48 2.71 0.84 1.23 4.52Rubber 0.33 0.07 0.11 0.03 0.08 0.30 0.20Fines 1.12 1.75 0.47 0.42 1.62 1.66 1.44 0.80 1.27 0.60 0.70 0.62 0.71 1.53Diapers 0.42 1.49 1.72 19.48 5.56 2.48 3.89 0.13 0.18 0.06Foodwaste 17.79 19.61 21.18 8.07 13.27 19.37 14.18 12.57 17.90 1.32 55.73 7.26 8.06 0.74Misc. Organic 3.43 7.38 2.62 0.68 5.22 6.42 5.09 7.48 5.34 0.04 2.41 1.33 2.37 2.03
TOTAL ORGANIC FRACTION 24.85 31.80 26.27 10.29 25.71 48.72 31.16 27.47 30.50 2.43 62.01 12.28 16.26 12.17
Clear Glass containers 0.63 0.80 0.63 0.63 3.98 0.54 1.84 1.20 0.82 1.83 0.35 2.54 1.53 2.38Green Glass containers 0.23 0.06 0.04 0.06 0.76 0.04 0.08 0.14 0.14 0.64 0.19 0.33 0.17 0.76Brown Glass containers 0.05 0.03 0.14 0.04 0.70 0.15 0.03 0.07 0.14 0.02 0.20 0.15 0.43Misc. Glass 0.03 0.09 0.15 5.34 0.03 0.18 0.02 0.02 0.90 0.33
TOTAL GLASS FRACTION 0.94 0.89 0.90 0.87 10.77 0.61 2.24 1.37 1.05 2.63 0.56 3.96 1.85 3.90
Alum. Food containers/foil 0.36 0.26 0.95 0.33 0.31 0.18 0.15 0.24 0.29 0.61 0.29 0.54 0.47 0.13Alum. Beverage Cans 0.33 0.17 0.57 1.48 0.48 0.22 0.36 0.49 0.23 0.86 0.25 1.41 0.55 0.57Misc. Aluminum 0.19 0.06 0.06 0.05 0.02 0.05 0.04 0.01
TOTAL ALUMINUM FRACTION 0.87 0.43 1.60 1.89 0.79 0.45 0.55 0.78 0.52 1.51 0.54 1.95 1.03 0.70
Ferrous Metal Food conts. 3.27 1.89 1.25 0.73 5.27 2.53 1.67 1.15 2.03 0.44 2.09 0.53 1.31 0.42Other Ferrous Metal 0.79 1.02 0.93 1.66 2.63 0.95 0.55 0.42 0.45 0.73 0.38 0.53 11.46 6.80
TOTAL FERROUS METAL FRACTION 4.06 2.91 2.18 2.39 7.90 3.47 2.21 1.57 2.48 1.17 2.47 1.07 12.79 7.22
Bimetal cans 0.02TOTAL METAL FRACTION 4.93 3.34 3.78 4.26 8.68 3.92 2.76 2.35 3.00 2.67 3.01 3.04 13.82 7.92
Non-bulk Ceramics 0.68 0.04 0.02 0.02 0.03 0.12 0.01 0.05 0.33 0.05Misc. Non-organic 6.27 6.39 0.18 1.71 0.35 0.24 0.11 0.01 0.80 0.96 1.65
TOTAL INORGANIC FRACTION 6.95 6.39 0.22 1.73 0.35 0.26 0.03 0.12 0.11 0.02 0.85 1.29 1.69
PesticidesNon-pesticide Poisons 0.07Paint/Solvent/Fuel 0.05 0.04Dry Cell Batteries 0.01 0.03 0.12 0.01 0.06 0.01 0.01 0.01 0.01Car BatteriesMedical Waste 0.01 0.18 0.37 0.99 0.29Misc. HHW 0.06 0.14 0.15 0.12 0.07 0.10 0.09 0.17
TOTAL HHW FRACTION 0.06 0.06 0.14 0.12 0.19 0.52 1.07 0.41 0.12 0.11 0.01 0.16 0.18
TOTAL BULK ITEMS 1.18 0.86 0.74 0.54 0.19 0.69 0.13 0.28 0.04 0.93 1.02 0.30
TABLE 5

INSTITUTIONAL WASTE COMPOSITION BY CATEGORY
WINTER
INSTITUTIONAL CATEGORY NUMBER
WASTE COMPONENT 1 2 3 4 5 6 7 8 9 10 11 12 13 14
Corrugated/Kraft 7.52 8.39 11.46 10.63 12.95 6.06 19.52 10.50 21.87 7.88 9.88 15.51 10.73 9.22Newsprint 1.79 3.17 1.74 4.24 3.64 1.33 2.45 4.52 2.95 10.51 3.65 9.22 3.10 29.44Office/Computer 2.07 4.45 3.28 2.47 6.43 1.18 5.75 7.24 5.35 19.50 3.07 14.51 4.86 2.62Magazines & Glossy 0.96 2.29 2.84 0.92 0.99 0.44 1.87 1.53 0.80 1.10 0.52 2.16 1.31 0.92Book/Phone Book 0.55 2.73 1.63 0.95 0.81 0.06 0.24 0.34 0.35 2.12 0.28 4.38 1.72 3.76Non-Corrugated OCC 10.55 10.69 2.91 5.41 2.17 1.38 3.48 3.51 2.89 1.51 2.15 1.20 17.77 1.85Mixed 15.94 23.08 35.16 26.25 15.02 13.28 19.69 19.21 16.66 32.44 15.23 25.75 21.32 19.36
TOTAL PAPER FRACTION 39.39 54.78 59.03 50.87 42.02 23.73 53.01 46.85 50.87 75.07 34.78 72.71 60.81 67.16
Clear HDPE containers 0.21 0.40 0.54 0.33 0.22 0.23 0.18 0.50 0.26 0.18 0.29 0.27 0.27 0.24Colored HDPE containers 0.13 0.04 0.12 0.21 0.18 0.20 0.38 0.17 0.09 0.10 0.20 0.12 0.03 0.16LDPE 0.04 0.01 0.01 0.05 0.01 0.25 0.04 0.09 0.02 0.06 0.14 0.04Films and Bags 4.38 6.07 4.83 5.60 7.91 9.64 4.62 7.90 4.80 3.84 6.43 4.00 6.18 3.34Green PET containers 0.05 0.02 0.07 0.06 0.02 0.07 0.34 0.07 0.01 0.01 0.06 0.09 0.05 0.02Clear PET containers 0.05 0.06 .014 0.12 0.24 0.02 0.10 0.23 0.04 0.15 0.18 0.18 0.08 0.09PVC 0.01 0.02 0.03 0.09 0.05 0.03 0.06 0.13 0.11 0.05 0.11 0.05 0.02 0.03Polypropylene 0.01 0.06 0.02 0.06 0.03 0.19 0.10 0.29 0.03 0.13 0.02 0.13 0.05Polystyrene (est. for Summer) 2.10 1.32 1.85 1.83 10.67 9.73 2.54 6.79 5.75 1.33 1.84 1.38 1.14 0.92Misc. Plastic 0.21 0.94 1.23 0.66 0.63 0.51 2.27 2.50 3.33 0.95 0.61 1.07 0.77 0.85
TOTAL PLASTIC FRACTION 7.14 8.99 8.84 8.91 20.05 20.46 10.93 18.42 14.78 6.65 9.90 7.31 8.67 5.74
Grass/Leaves 1.11 0.26 0.39 0.14 0.48 0.13 0.09 0.03 0.02Brush/Prunnings/Stumps 0.02 0.07 0.14 0.01 0.06 0.05
TOTAL YARD WASTE FRACTION 0.02 1.18 0.26 0.53 0.14 0.48 0.13 0.10 0.06 0.08 0.02
Lumber 0.35 0.77 1.36 0.15 1.32 0.23 0.78 0.85 0.40 0.29 0.19 0.35 0.16 1.45Textiles 0.49 4.18 1.09 1.71 5.07 1.33 2.99 3.97 1.71 2.15 3.33 1.15 0.25 5.02Rubber 0.09 0.06 0.05 0.41 0.15 0.40 0.23 0.04 0.62Fines 1.91 2.63 2.40 1.77 1.70 1.30 1.10 1.68 0.96 1.52 1.28 1.18 1.80 2.88Diapers 0.69 0.05 0.09 1.84 21.04 5.91 2.19 6.76 0.02 0.02 0.44 0.01 0.06Foodwaste 10.14 8.60 8.52 3.93 9.22 18.89 12.34 9.02 14.96 4.34 37.69 8.33 7.96 1.99Misc. Organic 7.06 6.84 6.09 6.78 8.55 5.44 3.56 6.49 3.41 1.89 4.45 1.48 8.26 2.74
TOTAL ORGANIC FRACTION 20.64 23.15 19.61 14.34 27.73 48.23 27.06 24.34 28.62 10.22 47.19 12.91 18.49 14.75
Clear Glass containers 0.77 0.76 1.60 1.20 1.76 0.57 3.64 2.02 0.96 2.24 0.83 2.92 1.75 1.92Green Glass containers 0.05 0.34 0.17 0.02 0.52 0.01 0.09 0.17 0.08 0.26 0.10 0.37 0.19 0.40Brown Glass containers 0.04 0.15 0.26 0.02 0.25 0.25 0.03 0.12 0.04 0.18 0.31Misc. Glass 0.09 0.02 0.02 0.24 0.07 0.06 0.13 0.03 0.05 0.06 0.09 0.31 0.01
TOTAL GLASS FRACTION 0.86 1.34 1.79 1.24 2.77 0.67 4.04 2.57 1.13 2.67 1.05 3.56 2.24 2.64
Alum. Food containers/foil 0.57 0.69 1.67 1.03 1.06 0.62 0.43 0.77 0.30 0.85 0.23 0.23 0.85 0.21Alum. Beverage Cans 0.24 0.81 1.34 1.67 0.52 0.22 0.43 0.78 0.31 0.84 0.35 1.30 1.35 0.83Misc. Aluminum 0.06 0.11 0.20 0.03 0.05 0.04 0.01 0.01 0.02 0.01 0.01
TOTAL ALUMINUM FRACTION 0.87 1.61 3.21 2.73 1.65 0.83 0.91 1.56 0.62 1.70 0.58 1.53 2.20 1.05
Ferrous Metal Food conts. 2.15 1.40 1.85 0.79 3.17 3.80 1.33 2.35 2.55 0.99 3.90 0.41 2.34 1.08Other Ferrous Metal 0.24 0.94 2.53 0.46 0.76 0.56 0.58 0.76 0.39 1.45 0.96 1.02 1.46 5.34
TOTAL FERROUS METAL FRACTION 2.38 2.34 4.18 1.25 3.93 4.45 1.92 3.11 2.94 2.44 4.86 1.43 3.80 6.42
Bimetal cans 0.07 0.06 0.02 0.01 0.02 0.02 0.02 0.02 0.12 0.03TOTAL METAL FRACTION 3.25 4.02 7.45 4.00 5.59 5.28 2.84 4.69 3.57 4.16 5.44 2.96 6.12 7.50
Non-bulk Ceramics 0.05 0.10 0.02 0.03 0.03 0.10 0.01 0.01 0.05 0.18 0.01 0.05 0.16Misc. Non-organic 27.09 5.27 1.47 19.34 0.64 0.06 0.21 0.86 0.55 0.17 0.09 2.27 0.73
TOTAL INORGANIC FRACTION 27.14 5.37 1.49 19.37 0.67 0.18 0.22 0.87 0.05 0.73 0.18 0.14 2.27 0.88
Pesticides 0.01 0.04Non-pesticide Poisons 0.01 0.01 0.03 0.04Paint/Solvent/Fuel 0.09 0.05 0.02 0.01 0.01 0.01 0.05 0.37 0.04 0.35Dry Cell Batteries 0.03 0.01 0.01 0.04 0.04 0.02 0.01 0.61Car BatteriesMedical Waste 0.29 0.58 0.79 0.77 0.70Misc. HHW 0.15 0.02 0.10 0.11 0.04 0.02 0.18
TOTAL HHW FRACTION 0.03 0.15 0.13 0.06 0.41 0.59 0.92 0.82 0.83 0.07 0.41 0.04 0.01 1.18
TOTAL BULK ITEMS 1.55 2.20 0.46 0.94 0.24 0.74 0.48 1.29 0.06 0.36 1.09 0.28 1.38 0.16
TABLE 6

INSTITUTIONAL WASTE COMPOSITION BY CATEGORY
SPRING
INSTITUTIONAL CATEGORY NUMBER
WASTE COMPONENT 1 2 3 4 5 6 7 8 9 10 11 12 13 14
Corrugated/Kraft 10.06 7.74 7.54 5.45 14.42 8.78 14.51 10.87 19.21 5.24 6.70 10.21 9.87 7.35Newsprint 2.29 2.63 2.09 3.12 3.49 1.37 1.87 5.96 2.29 11.46 2.79 7.46 4.15 34.97Office/Computer 0.33 0.85 1.51 1.46 1.73 0.91 0.80 4.72 1.77 13.70 1.69 8.57 1.13 0.72Magazines & Glossy 0.31 0.48 1.34 0.63 0.33 0.16 1.28 1.60 0.50 1.82 0.39 2.81 0.19 1.00Book/Phone Book 0.21 3.34 1.08 4.13 0.50 0.06 0.07 0.29 0.21 2.35 0.40 6.11 0.54 0.26Non-Corrugated OCC 4.09 4.29 1.44 1.56 0.54 0.77 1.96 2.62 2.71 1.26 1.23 1.22 9.38 1.36Mixed 30.59 28.40 24.66 25.59 17.72 13.41 31.83 28.05 19.15 42.19 14.48 28.03 31.79 18.69
TOTAL PAPER FRACTION 47.88 47.73 39.66 41.93 38.73 25.45 52.32 54.12 45.83 78.02 27.66 64.42 57.05 64.34
Clear HDPE containers 0.19 0.26 0.27 0.22 0.04 0.29 0.16 0.27 0.14 0.14 0.14 0.41 0.11 0.25Colored HDPE containers 0.16 0.10 0.22 0.17 0.10 0.13 0.27 0.22 0.11 0.14 0.26 0.16 0.19 0.25LDPE 0.12 0.09 0.01 0.02 0.03 0.05 0.05 0.01Films and Bags 4.74 5.86 3.29 4.75 6.47 5.93 5.95 8.80 5.62 4.55 6.20 4.09 4.91 2.72Green PET containers 0.03 0.01 0.02 0.04 0.02 0.05 0.02 0.04 0.02 0.05 0.01 0.01Clear PET containers 0.14 0.12 0.06 0.32 0.24 0.01 0.07 0.14 0.06 0.19 0.15 0.35 0.15 0.21PVC 0.01 0.02 0.01 0.01 0.02 0.01 0.02 0.01Polypropylene 0.01 0.10 0.08 0.02 0.07 0.07 0.07 0.02 0.05 0.11 0.02 0.06Polystyrene (est. for Summer) 3.72 1.32 0.77 1.02 9.78 5.76 4.31 6.91 8.95 1.30 1.52 1.79 1.00 0.89Misc. Plastic 0.24 2.09 0.65 0.54 0.21 0.44 1.98 1.02 0.81 0.49 0.39 0.69 0.55 0.99
TOTAL PLASTIC FRACTION 9.35 9.85 5.40 7.12 16.88 12.63 12.85 15.49 15.77 6.88 8.78 7.64 6.96 5.39
Grass/Leaves 1.53 5.67 26.34 6.21 0.19 1.02 0.04 3.34 0.01 2.18 1.06 2.14 0.95Brush/Prunnings/Stumps 0.03 0.39 0.22 0.03 0.06 0.03 0.06 0.05 3.52
TOTAL YARD WASTE FRACTION 1.56 6.06 26.55 6.21 0.19 1.05 0.04 3.40 0.04 2.24 1.11 5.66 0.95
Lumber 0.54 0.77 2.30 1.75 1.10 0.28 0.35 1.01 0.31 0.05 0.77 1.08 0.51 0.83Textiles 1.79 1.10 1.52 4.04 5.35 1.04 2.88 2.52 2.27 0.61 2.58 1.12 0.78 3.51Rubber 0.25 0.19 0.03 0.05 0.19 0.30 0.85 0.63 0.90 0.03 0.08 0.06Fines 1.32 1.06 1.16 4.25 1.02 0.94 0.91 0.81 1.07 0.38 0.76 1.28 1.51 1.90Diapers 1.05 0.06 2.95 26.80 7.87 1.49 4.54 0.06 0.04 0.06 0.06Foodwaste 23.06 10.94 5.95 3.29 14.19 21.05 11.28 9.46 18.73 3.90 49.80 11.26 9.35 3.10Misc. Organic 3.94 3.74 4.35 5.35 6.27 3.08 1.82 2.79 4.89 0.88 2.20 2.07 4.36 3.42
TOTAL ORGANIC FRACTION 31.97 17.80 15.38 18.73 31.08 53.49 25.94 18.73 32.70 5.88 56.06 16.88 16.57 12.99
Clear Glass containers 1.39 0.96 0.72 1.09 1.84 0.47 2.80 1.80 0.74 2.51 0.63 4.01 1.15 2.45Green Glass containers 0.48 0.10 0.05 0.26 0.27 0.05 0.09 0.33 0.11 0.23 0.13 0.56 0.14 1.04Brown Glass containers 0.30 0.09 0.02 0.06 0.15 0.04 0.36 0.34 0.02 0.26 0.08 0.51 0.10 0.46Misc. Glass 0.19 0.03 0.01 1.40 0.07 0.05 0.03 0.05 0.35 3.61 0.84
TOTAL GLASS FRACTION 2.36 1.18 0.80 2.81 2.33 0.61 3.24 2.46 0.90 3.05 1.19 5.07 5.00 4.78
Alum. Food containers/foil 0.45 0.91 0.63 0.90 0.76 0.66 0.57 0.93 0.36 0.45 0.24 0.46 0.63 0.32Alum. Beverage Cans 0.27 0.86 0.61 1.00 0.37 0.17 0.44 0.72 0.29 0.69 0.14 1.37 0.77 0.58Misc. Aluminum 0.07 0.01 0.17 0.14 0.02 0.04 0.04 0.41 0.02
TOTAL ALUMINUM FRACTION 0.72 1.85 1.24 2.07 1.13 0.97 1.03 1.64 0.89 1.13 0.38 1.87 1.82 0.92
Ferrous Metal Food conts. 2.57 1.22 0.94 1.46 2.82 2.65 1.14 1.38 2.45 0.46 2.94 0.41 1.97 0.40Other Ferrous Metal 1.68 5.07 1.76 5.64 0.09 0.74 0.85 0.36 0.45 0.91 0.53 0.92 2.93 6.47
TOTAL FERROUS METAL FRACTION 4.25 6.29 2.70 7.10 2.90 3.38 1.99 1.74 2.90 1.37 3.48 1.33 4.90 6.87
Bimetal cans 0.01 0.09 0.06 0.01 0.01 0.01 0.01 0.01 0.03 0.01 0.02TOTAL METAL FRACTION 4.97 8.23 4.02 9.17 4.03 4.35 3.03 3.39 3.60 2.51 3.85 3.23 6.73 7.80
Non-bulk Ceramics 0.03 0.02 0.07Misc. Non-organic 1.30 4.90 5.83 5.96 4.28 1.08 0.35 1.54 0.58 1.19 0.66 0.46 2.53
TOTAL INORGANIC FRACTION 1.30 4.90 5.83 5.96 4.28 1.11 0.35 1.54 0.02 0.58 1.19 0.73 0.48 2.53
Pesticides 0.02 0.01Non-pesticide Poisons 0.01Paint/Solvent/Fuel 0.29 0.04 0.02 0.04 0.01 0.01 0.02 0.08 0.01Dry Cell Batteries 0.03 0.07 0.02 0.01 0.03 0.01 0.01 0.03 0.09Car BatteriesMedical Waste 1.07 0.64 1.52 0.24 1.05 0.07 0.03 0.01Misc. HHW 0.02 1.05 0.07 0.15 0.51 0.14 0.17 0.10 0.01 0.32 0.01 0.91
TOTAL HHW FRACTION 0.02 1.34 0.14 0.24 1.58 0.82 1.74 0.26 1.08 0.13 0.09 0.36 0.14 1.01
TOTAL BULK ITEMS 0.57 2.86 2.20 7.79 0.88 0.50 0.46 0.61 0.08 0.72 1.18 0.55 1.35 0.20
TABLE 7

Resources
M AM AM AM AM ATERIAL CONVERSION CHARTERIAL CONVERSION CHARTERIAL CONVERSION CHARTERIAL CONVERSION CHARTERIAL CONVERSION CHARTTTTT
WEIGHT WEIGHT
M ATERIAL (lbs./cu. yd.) M ATERIAL (lbs./cu. yd.)
range range
PAPER MIXED MSWCorr ugat ed Uncompacted ro l l -off
Loose 100 No re cycl ing 80Compacted 200-750 OCC Removed 100
Off iceLoose 300-400 W O O D
Newspri nt Pallets 290 1 Pal let = 40 lbs.Loose 360-500 Sa wdust 500Compacted 650-800 Bark 600
Mixed Loose Dimensional Lumber 240Loose 150
M E TAL CANS ASHFerrous Course Bottom Ash 3160
Whole 150 F ine Bottom Ash 1650Flattened 350-400 F ly Ash 1780Baled 850Densifi ed 1600 FOOD WASTE
Aluminum Kitchen W a ste 800-900 55 g al. = 400 lbs.Whole 50-70 Solid and Liquid Fat s 1490Flattened 140-220Baled 350-450 TEXTILES/F ABRICSDensifi ed 1080 Loose 240
Bi-Metal (whole) 110 Baled 480
GLASS 55 GALLON DRU M SContainers S teel 40-60 each
Whole 500-650 P lastic 20-30 eachSemi-Crushed (manual) 1000-1080Crushed (mec hanically broke n) 1800-2700 TIRES
Plate 500-1000 P assenger 20 eachPLASTICS Truck 60-100 each
PET SLUDGESWhole 30 W et (25-55% Solids) 1600-2000Flattened 80 Dry (55-85% Solids) 850-1600Baled 400Granulated 500-600 LITHO/FILM
HDPE Loose 280-690Whole (milk) 20-30 Baled 2200-2490Flattened (milk) 70Whole (colored) 50 R UBBERFlattened (colored) 90 Granulated 2500Baled 400Granulated 500-600 CONSTRUCTION/DEMOLITION
Other (mixe d) DEBRISWhole 50 Mixe d, loose 540
Baled 400-700
YARD WASTE CONCRETE/BRICK/BLOCKGrass Crushed 4000
Loose 400-740Compacted 1050-1110 ST ONE/CLAY/SAND 2500
LeavesLoose 250-400 USED MOTOR OIL 1410 1 gal . = 7 lbs.Compacted 450-670
Brush BA TTERIES 1780-1940 33 - 36 lbs. ea.Loose 200
INK 1720 1 gal . = 8.5 lbs.
LUBRICANTS 1410 1 gal . = 7 lbs.
N OTES: 1. Sour ces to be pro vided upon r equest2. Conve rsions to tons = P ounds/2000
TABLE 8
N OTES

WEIGHT/VWEIGHT/VWEIGHT/VWEIGHT/VWEIGHT/VO L U M EO L U M EO L U M EO L U M EO L U M ECONVERSION CONVERSION CONVERSION CONVERSION CONVERSION TTTTTABLESABLESABLESABLESABLES
M ATERIAL VO L U M E WEIGHT IN LBS. WEIGHT IN TONSNEWSPRINT
loose 12 inch stack 35 0.017560 gallon 170 0.08590 gallon 300 0.151 cubic yard 360 to 800 0.18 to 0.4
compacted 1 cubic yard 720 to 1,000 0.36 to 0.5CORRU G ATED
loose 1 cubic yard 300 0.15baled 1 cubic yard 1,000 to 1,200 0.5 to 0.6
GLASS
uncrushed 1 grocery bag 16 0.00860 gallon 100 0.0590 gallon 275 0.13751 cubic yard 600 to 1,000 0.3 to 0.5
semicrushed 1 cubic yard 1,000 to 1,800 0.5 to 0.9
crushed 1 cubic yard 800 to 2,700 0.4 to 1.35ALUMINUM
unflattened 1 grocery bag 1 .5 0.0007560 gallon 20 0.0190 gallon 30 0.0151 cubic yard 50 to 74 0.025 to 0.037
flattened 1 cubic yard 250 0.125FERROUS
unflattened 1 cubic yard 150 0.075flattened 1 cubic yard 850 0.425
PLASTIC
unflattened 60 g allon 10 0.00590 gallon 15 0.0075
1 cubic yard 24 to 40 0.012 to 0.02YA R D W ASTE
uncompacted 1 cubic yard 250 to 450 0.125 to 0.225compacted 1 cubic yard 320 to 500 0.16 to 0.25wood c hips 1 cubic yard 500 0.25
grass 1 cubic yard 400 to 1,500 0.2 to 0.75
FOOD W ASTE 55 gallon 412 0.206
Resources TABLE 9

Material Targeted For:Waste
PreventionRecycling
Quantity
wt., vol., %
Material
Recycled
Quantity
wt., vol., %
Present
in Waste
Current RecyclingActivity
Waste ReductionPreliminary PlanningWaste Composition
PAPER:
White Ledger
Colored Ledger
Computer
Newspaper
Cardboard
Magazine
Telephone Books
Other Paper:(i.e. fax, paper towels)
PLASTIC
GLASS:
Containers
Other Glass
ALUMINUM
OTHER METAL:
Steel
Copper
WOOD
GREEN WASTE
FOOD WASTE
TIRES
USED OIL
HAZARDOUS WASTE:
Paint
Batteries
Solvents
CLOTHING/TEXTILES
FURNITURE
OTHER:
WORKSHEET 1
WASTE REDUCTION ASSESSMENT WORKSHEET

WORKSHEET 2
SOLID WASTE COMPOSITION AND MANAGEMENT
AMOUNT AMOUNT RECYCLER DISPOSALMATERIAL DISPOSED RECYCLED Name & Location Facility Name
Paper:CardboardOfficeNewsprintOther
Metals:FerrousAluminumOther Non-ferrousMetal Dust
Glass:ContainersPlateOther
PlasticRubberTextiles/FabricWood:
PalletsSawdustBarkOther
Stone/Clay/SandYard WasteConcreteAshOilsSludgesBatteriesDrumsDust Collector FinesInkLitho/FilmLubricantsPlasterRefractoriesSilica/AluminaSlagMixed WasteOther (specify)
TOTALS

WASTE AUDITGENERAL INFORMATION
NAME OF BUSINESS DATE
MAILING ADDRESS ZIP
KEY CONTACT PERSON/TITLE PHONE
SOURCE OF REFERRAL
PROPERTY MANAGEMENT COMPANY
DESCRIPTION OF BUILDING
NUMBER OF EMPLOYEES NUMBER OF FLOORS
NUMBER OF COMPUTER PRINTERS NO. OF PHOTOCOPIERS
ARE ELEVATORS AVAILABLE? YES NO
DOES THE BUILDING HAVE A LOADING DOCK FOR FREIGHT DELIVERIES? YES NO
SPECIAL NEEDS THAT MAY AFFECT RECYCLING: (SHREDDING FOR CONFIDENTIALITY, SPACE LIMITATIONS)
CURRENT WASTE MANAGEMENT SERVICES
NAME OF JANITORIAL SERVICE
JANITORIAL SERVICE PARTICIPATION IN RECYCLING PROGRAM? YES NO
WASTE COLLECTION SERVICE PHONE
QUANTITY AND EQUIPMENT USED FOR WASTE COLLECTION AND DISPOSAL
TYPE/NO. OF CONTAINERS % FULL FREQUENCY OF PICKUP
DUMPSTERS DAILY WEEKLY
CANS DAILY WEEKLY
COMPACTOR DAILY WEEKLY
SHREDDER DAILY WEEKLY
CURRENT RECYCLING ACTIVITY
CURRENTLY RECYCLING? YES NO MATERIALS
VENDOR(S)
HAS PROGRAM BEEN SUCCESSFUL? YES NO WHY?
WORKSHEET 3

WASTE CURRENTLY GENERATED
PAPER % OF TOTAL WASTE
White Ledger Paper
Colored Ledger Paper
Computer Paper
Newspaper
Corrugated Cardboard
Multi-Copy Forms (pressure sensitive)
Mixed Waste Paper
Magazines
METAL
Aluminum Cans
Aluminum/Other
Brass
Copper
Iron
Lead
Steel
Tin Cans
Other
OTHER MATERIALS TYPE
Glass
Plastic
Textiles
Wood Waste
Motor Oil
Compostable Waste
Other
THE VOLUMES ABOVE ARE ESTIMATES PER DAY WEEK MONTH
WORKSHEET 3 (cont'd)

WORKSHEET 4
SOLID WASTE QUANTIFICATION AND COMPOSITION ANALYSIS
SORT DATA SHEET
SITE INFORMATION:
LOCATION
TIME
SAMPLE INFORMATION:
SORT DATA:
WASTE COMPONENTS NET WEIGHTS COMMENTS1 PAPER
NewspaperMagazinesCorrugated CardboardKraft PaperCoated ContainersPaperboardBooksOffice PaperOther Paper
2 PLASTICSPET (#1)HDPE (#2)LHDPE (#2)PVC (#3)LDPE (#4)LLDPE (#4)Polypropylene (#5)Polystyrene (#6)Other Containers (#7)Misc. Plastic
3 ORGANICSFood WasteTextiles/LeatherRubberDiapersFinesOther Organics
4 FERROUS METALSFood Containers/BimetalAerosolsWhite/EnamelledAuto PartsOther Ferrous
5 NON-FERROUS METALAluminum CansAluminum FoilOther AluminumOther Non-Ferrous

SOLID WASTE QUANTIFICATION AND COMPOSITION ANALYSIS
SORT DATA SHEET
SAMPLE INFORMATION:
SORT DATA:WASTE COMPONENTS NET WEIGHTS COMMENTS
6 GLASSClear ContainersGreen ContainersBrown ContainersPlate GlassOther Glass
7 WOODPalletsLumberStumps/Heavy SectionsOther Wood
8 INERTAsphaltConcrete/Brick/RockDirtOther Inert
9 YARD WASTELeavesGrassOther Yard Waste
10 HAZARDOUSLead Acid BatteriesDry Cell BatteriesOther Hazardous
COMMENTS/OBSERVATIONS:
WORKSHEET 4 (cont'd)

RECYCLING ACTION PLAN
Use the following worksheets to begin planning your recycling program. If yourcompany has more than one facility, the recycling program design may vary from site tosite. Prepare individual plans for each facility.
A. COMPANY PROFILE
Company Name:
Recycling Coordinator:
Address/Telephone:
Type of Business
Number of Employees:
Number of Facilities:
B. Facility/Site Description
Address:
Recycling Coordinator's Contact Person:
Number of Employees:
Type of Building: single-tenant multi-tenant
high-rise horizontal property
Number of Floors Square Footage
Departments Location
1. 1.
2. 2.
3. 3.
4. 4.
Number of Elevators: passenger freight
Loading Dock Location and Access Route:
WORKSHEET 5

C. TARGET MATERIALS (check all that apply)
office paper phone books wood clothing
newspaper plastic yard waste furniture/equipment
cardboard glass food waste other
magazine aluminum tires other
other paper other metal used oil
D. PLANNED FLOW OF RECYCLABLE MATERIALS (check all that apply)
Employees deposit recyclable materials in Area Collection Containers.
Employees deposit recyclables directly in Central Collection/Storage Area.
(type of in-house staff) transports recyclables from Area CollectionContainers to Central Storage Area.
(name of contracted collector) picks up recyclables from CentralStorage and transports to an Oahu recycling center for processing.
E. LOCATION OF CONTAINERS FOR RECYCLABLE COLLECTION
1.2.3.4.5.6.7.8.9.
10.11.12.13.14.15.16.17.18.19.20.
1. 2.
Area CollectionLocation(s):
Central Collection/StorageLocation(s):

F. CONTAINERS NEEDED
For Employee Collection
Type of Container Quantity Cost
Type of Container Quantity Cost
For Area Collection
For Central Collection and Storage
Type of Container Quantity Cost

G. HAULING/PICKUP DATA
Current Refuse Hauler:
Contact Person: Telephone #:
Terms of Fee Base: flat rate per cubic yardContract per container pickup
Container Size:
Number of Containers:
Pickup Frequency every
Is there a provision for recycling?yes no
Is there an opportunity to reduce disposal costs afterrecycling is implemented?
yes no
Expiration Date of Contract:

Contracted Recycling Collector:
Contact Person: Telephone #:
Type of Company: refuse hauler recycling processorsmall independent not-for-profitcollector organization
Terms of Fee/Revenue Base:Contract
Revenue return for recyclables based on amounts setin a long-term contract.
Revenue return for recyclables based on slidingmarket values.
No pay/no charge
The net result of a per-container collection charge, witha revenue return for the recyclables based on slidingmarket values.
Container Size:
Number of Containers:
Are storage containers provided as part of the contract?yes no
Are in-house collection containers provided as part ofthe contract?
yes no
Does contractor provide program organization andpromotion assistance?
yes no
Expiration Date of Contract:

Educational materials and media to be used to encourage staff participation:
kick-off/introduction memo brochures
posters mini presentations/workshops
company newsletters staff meetings
new employee orientation video
packets
bulletin board progress reports other
Educational materials and media to be used to develop customer/public awareness:
Printed messages on:
company letterhead
shopping bags
product packaging
menus
other
Advertising and publicity in/at:
newspaper
radio
magazines/trade journals
television
trade shows
conferences/seminars
other
H. EDUCATION AND PROMOTION

I. SUMMARY OF RESPONSIBILITIES
Employees
In-House Maintenance Staff
Recycling Collector
Recycling Coordinator
J. COST-BENEFIT WORKSHEET
Once you have completed this cost-benefit worksheet, you will have estimated costs andsavings associated with your new recycling program compared to your current wasteremoval expenditures. Remember to amortize major equipment over its expected life.
Current Waste Removal Cost:
Monthly Annual
Hauling contractors $ $
Tipping fees $ $
Equipment (e.g., containers, compactor, etc.) $ $
Janitorial services (prorated) $ $
Less revenue from any current recycling measures in use $( ) $( )
(A) Equals total current removal cost $ $

Anticipated Disposal Cost After Implementing Recycling Program:
Monthly Annual
Waste removal expense (possibly reduced by recycling) $ $
Recyclable material removal expense, if any $ $
Coordinator's wages/salary (prorated) $ $
Replacement & maintenance of recycling containers $ $
Janitorial services (prorated) $ $
(B) Equals total anticipated disposal cost $ $
Initial Cost to Begin New Recycling Program:
Monthly Annual
Equipment/supplies (e.g., compactor, containers) $ $
Installation $ $
Publicity/education $ $
(C) Equals total initial cost to begin recycling program $ $
Revenue From Recyclable Material Sale:
Quantity
$ Per Ton Per Month Monthly Annual
Aluminum $ $ $
Copper $ $ $
Steel $ $ $
Glass $ $ $
Newspaper $ $ $
Corrugated Cardboard $ $ $
Office/Computer Paper $ $ $
Plastic $ $ $
Other $ $ $
(D) Total revenue from recyclable materials $ $

Net Anticipated Disposal Cost After Recycling Program Has Begun:
Monthly Annual
B (Anticipated waste removal cost) $ $
+ C (Initial cost to begin new recycling program) $ $
= Total estimated cost of new recycling program $ $
- D (Revenue from recyclable materials) $( ) $( )
= (E) Net anticipated disposal cost $ $
Compare with Current Waste Removal System:
Monthly Annual
A (Current waste removal cost) $ $
- E (Net anticipated disposal cost) $( ) $( )
= NET SAVINGS $ $