Embed Size (px)
Citation preview
Tackling the X-ray cargo inspection challengeusing machine learning
Nicolas Jaccarda, Thomas W. Rogersa,c, Edward J. Mortonb, and Lewis D. Griffina
aDept. of Computer Science, University College London, UKbRapiscan Systems Ltd., Victoria Business Park, Stroke-on-Trent, UKcDept. of Security and Crime Sciences, University College London, UK
ABSTRACT
The current infrastructure for non-intrusive inspection of cargo containers cannot accommodate exploding com-merce volumes and increasingly stringent regulations. There is a pressing need to develop methods to automateparts of the inspection workflow, enabling expert operators to focus on a manageable number of high-risk images.To tackle this challenge, we developed a modular framework for automated X-ray cargo image inspection. Em-ploying state-of-the-art machine learning approaches, including deep learning, we demonstrate high performancefor empty container verification and specific threat detection. This work constitutes a significant step towardsthe partial automation of X-ray cargo image inspection.
Keywords: Cargo screening, X-ray imaging, Classification, Machine Learning, Deep Learning, Threat ImageProjection, TIP
1. INTRODUCTION
In 2013, global cargo container traffic at ports surpassed 650 million TEU (twenty-foot equivalent unit, the sizeof a standard container).1 Growth of the global shipping network increases security risks as any container couldpotentially be used by malicious actors to smuggle restricted or prohibited items across borders. The methodsemployed by criminals include concealment of undeclared goods amongst legitimate cargo or in the fabric of thecontainer itself (e.g. floor, refrigeration unit).2 The detection and prevention of this type of criminal activityis particularly challenging as it must be done with minimal disruption to the flow of commerce. Indeed, it isnot feasible to subject a significant fraction of containers to a physical inspection, a time-consuming and costlyprocess. Instead, the detection of undeclared goods relies on a combination of statistical risk analysis (e.g. basedon shipping information), non-invasive X-ray imaging, and physical inspection as a last resort.
The inspection of X-ray cargo images is a challenging visual search task for security officers;3 the imagestend to be very cluttered, often with other objects whose appearance closely resemble that of the targets ofinterest. This issue is compounded by the large variety of objects that are transported in cargo containers,making it difficult for operators to learn a complete catalogue of visual appearances. In addition, and unlikeoptical images of natural scenes, imaged objects appear translucent and overlap,4–6 which complicates theirinterpretation. As such, an impractically large contingent of suitably trained security officers would be requiredto inspect all the images that could be acquired from the increasing number of container transactions. Machinevision and learning have been successfully employed to automate similar search tasks in other fields. However,their application to X-ray images, outside of biomedical applications, appear to be mostly limited to imagepre-processing and enhancement methods.7–10
In this paper we propose a machine learning framework for tackling the X-ray cargo inspection challenge.The framework has two distinct module types; (i) the verification of whether containers are empty or not, and(ii) the detection of specific threat items. Empty verification acts to filter images that do not need inspection bythe specific object detectors, that is those 20% of containers in the stream-of-commerce (SoC) that are definitely
Further author information: (Send correspondence to Lewis D. Griffin)Lewis D. Griffin: E-mail: [email protected], Telephone: +44 20 3108 7107
Anomaly Detection and Imaging with X-Rays (ADIX), edited by Amit Ashok, Mark A. Neifeld, Michael E. Gehm, Proc. of SPIE Vol. 9847,
98470N · © 2016 SPIE · CCC code: 0277-786X/16/$18 · doi: 10.1117/12.2222765
Proc. of SPIE Vol. 9847 98470N-1
Downloaded From: http://proceedings.spiedigitallibrary.org/ on 05/18/2016 Terms of Use: http://spiedigitallibrary.org/ss/TermsOfUse.aspx
empty. It is also used to raise a flag when a declared-as-empty container is found to contain cargo, since it islikely that the container is being used in shipping fraud or to smuggle contraband.
All detected non-empty containers are sent to the specific threat item detection modules. We focus on twoexamples; cars and ‘small metallic threats’. Thus, we cover both large-scale (cars occupy most of a container)and small-scale (‘small metallic threats’ occupy only a very small region of the image) threat detection. Forconvenience, we refer to cars as threats and indeed they are frequently involved in criminality, either when theyare disassembled or undeclared to avoid duty, or when they have been stolen. Please note, we use the term‘small metallic threats’ as we do not wish to make our research results easily discoverable by keyword searching.However, the threats in question are similar in form to hand drills.
In the next section we discuss related work in cargo and baggage imagery. In Sec. 3 we give an overview ofthe imaging modality and the collected dataset used in training and testing our methods. In Sec. 4 we presentthe proposed framework and a description of each module, as well as a discussion of the performance of thedetection module.
2. RELATED WORK
There is a small, but steadily growing, body of publications on X-ray image processing for security purposes;mainly on threat detection in baggage, with a smaller number on the classification of X-ray cargo images. Thesparsity of publications on cargo is presumably due to the relative novelty of the imaging technology and thedifficulty of obtaining large datasets for training and validating algorithms. We have previously reported on ourcar detection module11 and our empty verification module.12 Other researchers have focussed on methods forempty verification13–15 and manifest verification.4,16
On cargo, published classification methodologies have mostly employed devised metrics with little applicationof machine learning. For empty verification, Chalmers et al.13,14 extract the container and generate “a histogramof cargo region data values” and compare “key metrics (e.g. the minimum, mean, standard deviation, andmaximum cargo data values) with a reference set generated from a known empty container”. Orphan et al.15
report an accuracy 97.2% (with a 0.4% false negative rate) for SoC empty verification, by segmenting the image(floor/walls/roof) and applying a rule-based object detection algorithm. No attempt is made to extend themethod to small, difficult loads, as we do in this work.
Manifest verification is a multi-class classification problem, where containers are classified according to theirHarmonized System code (HS - broad category of cargo type e.g. live animals & animal products, or vegetableproducts). Tuszynski et al.,16 form a model for each HS code by taking the median image grey-level histogram andaverage absolute deviation. They use a weighted city block distance to compare a given test image to each HS codemodel. This approach yields an overall accuracy of 48% given a false positive rate of 5%. Zhang et al.4 achieveslightly better performance, by using a visual codebook based on a bank of Leung-Malik filters, and showingthat this outperforms scale-invariant feature transform (SIFT). That approach leaves out image examples wherethe container is less than half-filled with goods. In this work, we include and encourage the machine learning tobe robust to such examples. We also extend testing to very small synthetic loads representative of adversarialattempts to smuggle small amounts of contraband.
Research activities for ‘small metallic threat’ detection in baggage security are based on three imaging modali-ties; (i) single-view X-ray imaging (single view),17 (ii) multi-view X-ray imaging,18,19 and (iii) Computed Tomog-raphy (CT).20–23 Classification performance typically improves with the number of views, due to the additionalinformation available. The state-of-the-art for ‘small metallic threat’ detection ranges from 89% detection and18% false positives using a single view,17 to 97.2% detection and 1.5% false positives in full CT imagery.20 Forcargo, ‘small metallic threat’ detection is much more challenging than for single-view baggage, since the threat isphysically very small relative to a 20 ft container. Thus it can appear in many more distinct positions within theimage than it can in baggage, which can lead to high false alarm rates without advanced methods. Additionally,threats are often shielded by dense cargo such that they are often not visible without intensity manipulations ofthe image.
The consensus, amongst the baggage community, is that X-ray image data is more challenging than visiblespectrum data, and that direct application of methods used frequently on natural images (such as SIFT, RIFT,
Proc. of SPIE Vol. 9847 98470N-2
Downloaded From: http://proceedings.spiedigitallibrary.org/ on 05/18/2016 Terms of Use: http://spiedigitallibrary.org/ss/TermsOfUse.aspx
y
¡jTi jhTf 7 71
...i' iit2 t3 t4
tn-2 tn-1 tn
X
HoG) does not always perform well.24 However, performance can be improved by exploiting the characteristicsof X-ray images; by augmenting multiple views, using a coloured material image,25 or using simple (gradient)density histogram descriptors.20,22 In this work, we only have access to a single view, and the high photonenergy regime required for cargo imaging makes it difficult to form coloured material images.10 It has also beenwidely reported that texture descriptors perform poorly for baggage images which are fairly unvarying in thisrespect.24–26 In contrast, the amount of visible texture in cargo X-ray images does differ significantly betweenimages. Medium to low density cargo (such as tyres, and machinery) is highly textured, while high density cargo(such as barrels of oil) has a uniform texture.
To our knowledge, no attempts have been made to use Deep Learning in the classification of X-ray imagesof cargo or baggage. However, Bastan25 discusses some of the potential difficulties when learning features usingdeep convolutional neural networks (CNNs), including out-of-plane rotations and varying image size. Bastansuggests that CNNs have a slight in-plane rotation invariance due to pooling but that data augmentation isrequired to handle the “severe rotation problem”. We are faced with similar problems in cargo. We handlevarying image sizes by using sliding windows and taking the maximum of their scores to make a classificationfor the whole image. We do not explicitly tackle the out-of-plane rotation problem, instead we rely on a datasetcaptured with a sufficient number of poses of the threat objects.
3. STREAM-OF-COMMERCE DATASET
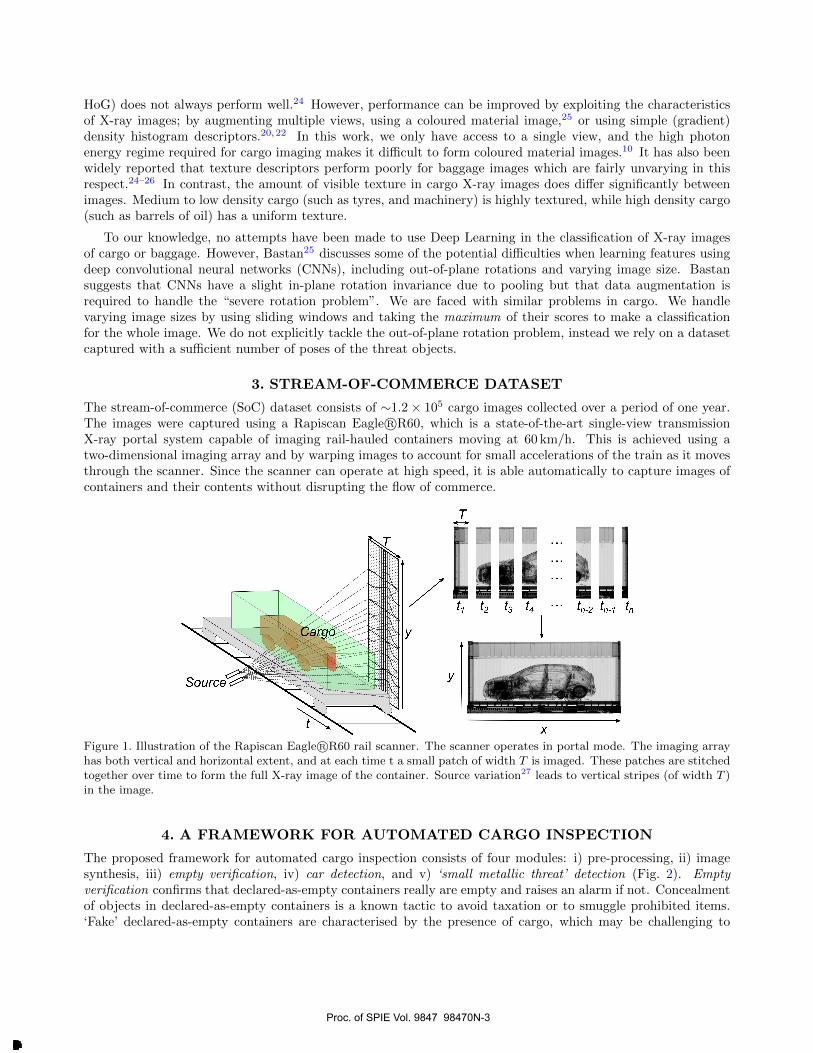
The stream-of-commerce (SoC) dataset consists of ∼1.2× 10⁵ cargo images collected over a period of one year.The images were captured using a Rapiscan Eagle R©R60, which is a state-of-the-art single-view transmissionX-ray portal system capable of imaging rail-hauled containers moving at 60 km/h. This is achieved using atwo-dimensional imaging array and by warping images to account for small accelerations of the train as it movesthrough the scanner. Since the scanner can operate at high speed, it is able automatically to capture images ofcontainers and their contents without disrupting the flow of commerce.
Figure 1. Illustration of the Rapiscan Eagle R©R60 rail scanner. The scanner operates in portal mode. The imaging arrayhas both vertical and horizontal extent, and at each time t a small patch of width T is imaged. These patches are stitchedtogether over time to form the full X-ray image of the container. Source variation27 leads to vertical stripes (of width T )in the image.
4. A FRAMEWORK FOR AUTOMATED CARGO INSPECTION
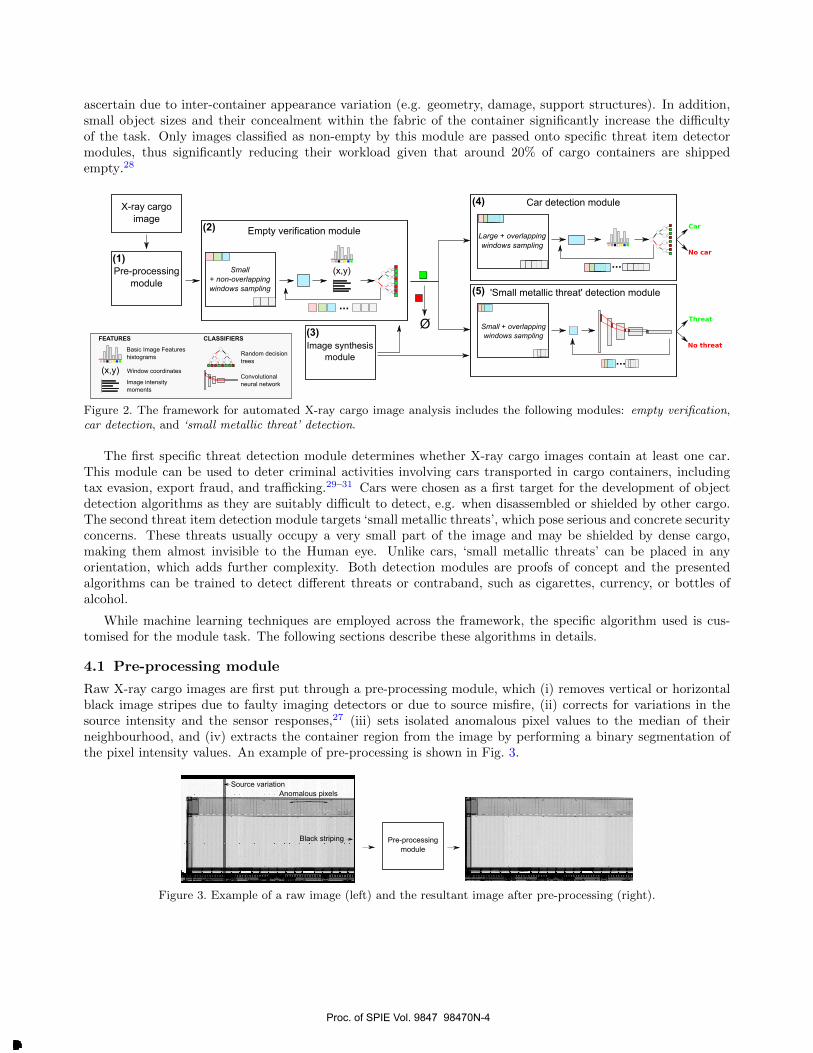
The proposed framework for automated cargo inspection consists of four modules: i) pre-processing, ii) imagesynthesis, iii) empty verification, iv) car detection, and v) ‘small metallic threat’ detection (Fig. 2). Emptyverification confirms that declared-as-empty containers really are empty and raises an alarm if not. Concealmentof objects in declared-as-empty containers is a known tactic to avoid taxation or to smuggle prohibited items.‘Fake’ declared-as-empty containers are characterised by the presence of cargo, which may be challenging to
Proc. of SPIE Vol. 9847 98470N-3
Downloaded From: http://proceedings.spiedigitallibrary.org/ on 05/18/2016 Terms of Use: http://spiedigitallibrary.org/ss/TermsOfUse.aspx
Lamm=i I - - - - -
ascertain due to inter-container appearance variation (e.g. geometry, damage, support structures). In addition,small object sizes and their concealment within the fabric of the container significantly increase the difficultyof the task. Only images classified as non-empty by this module are passed onto specific threat item detectormodules, thus significantly reducing their workload given that around 20% of cargo containers are shippedempty.28
(x,y)
...
Empty verification module
Ø
Small + non-overlapping windows sampling
X-ray cargo image
Large + overlappingwindows sampling
...
Car
No car
Threat
No threat
Small + overlappingwindows sampling
...
FEATURES
Basic Image Featureshistograms
(x,y) Window coordinates
Image intensitymoments
CLASSIFIERS
Random decisiontrees
Convolutionalneural network
Pre-processingmodule
Image synthesis module
Car detection module
'Small metallic threat' detection module
(1)
(2)
(3)
(4)
(5)
Figure 2. The framework for automated X-ray cargo image analysis includes the following modules: empty verification,car detection, and ‘small metallic threat’ detection.
The first specific threat detection module determines whether X-ray cargo images contain at least one car.This module can be used to deter criminal activities involving cars transported in cargo containers, includingtax evasion, export fraud, and trafficking.29–31 Cars were chosen as a first target for the development of objectdetection algorithms as they are suitably difficult to detect, e.g. when disassembled or shielded by other cargo.The second threat item detection module targets ‘small metallic threats’, which pose serious and concrete securityconcerns. These threats usually occupy a very small part of the image and may be shielded by dense cargo,making them almost invisible to the Human eye. Unlike cars, ‘small metallic threats’ can be placed in anyorientation, which adds further complexity. Both detection modules are proofs of concept and the presentedalgorithms can be trained to detect different threats or contraband, such as cigarettes, currency, or bottles ofalcohol.
While machine learning techniques are employed across the framework, the specific algorithm used is cus-tomised for the module task. The following sections describe these algorithms in details.
4.1 Pre-processing module
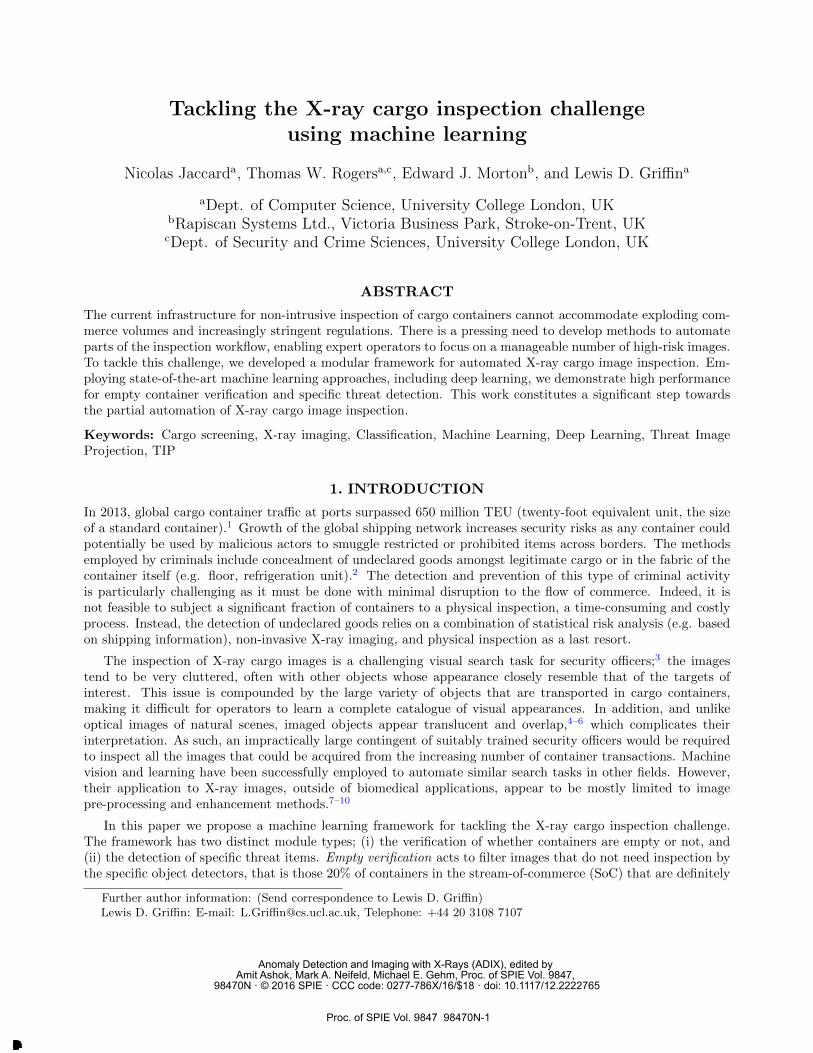
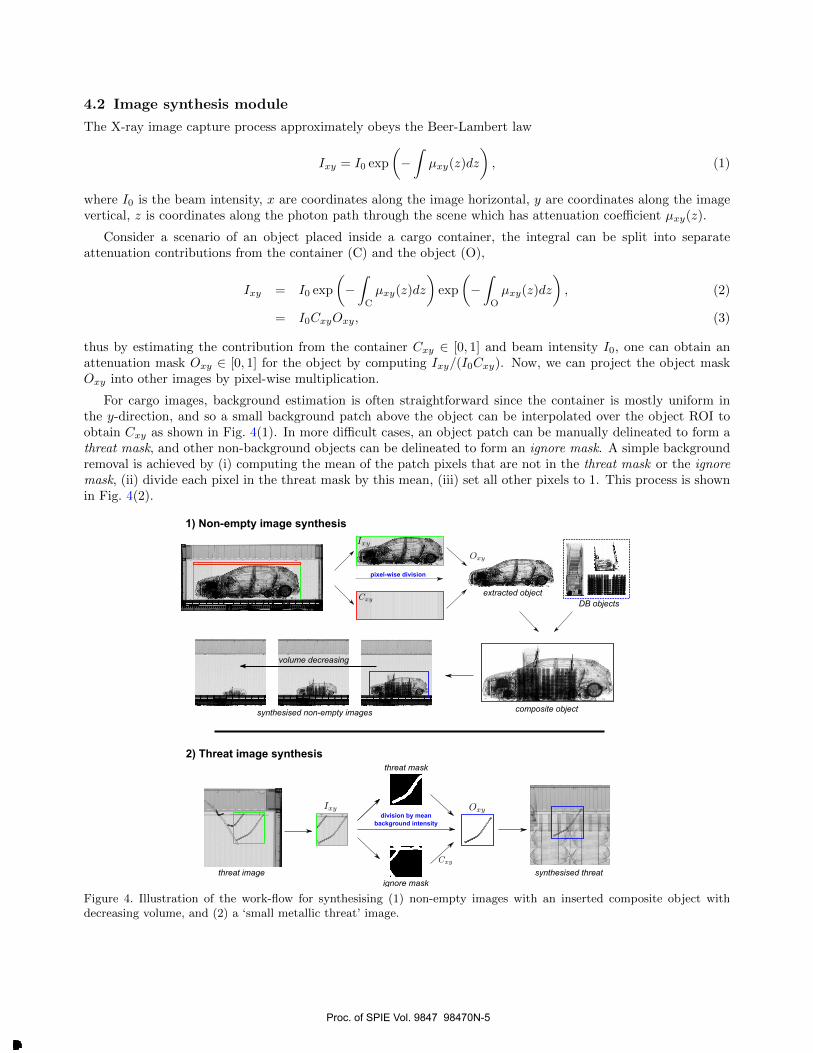
Raw X-ray cargo images are first put through a pre-processing module, which (i) removes vertical or horizontalblack image stripes due to faulty imaging detectors or due to source misfire, (ii) corrects for variations in thesource intensity and the sensor responses,27 (iii) sets isolated anomalous pixel values to the median of theirneighbourhood, and (iv) extracts the container region from the image by performing a binary segmentation ofthe pixel intensity values. An example of pre-processing is shown in Fig. 3.
Pre-processingmodule
Source variation }Anomalous pixels
Black striping
Figure 3. Example of a raw image (left) and the resultant image after pre-processing (right).
Proc. of SPIE Vol. 9847 98470N-4
Downloaded From: http://proceedings.spiedigitallibrary.org/ on 05/18/2016 Terms of Use: http://spiedigitallibrary.org/ss/TermsOfUse.aspx
Ir ° __ .. __ ___ _
. -. __ ___ _
. -
4.2 Image synthesis module
The X-ray image capture process approximately obeys the Beer-Lambert law
Ixy = I0 exp
(−∫µxy(z)dz
), (1)
where I0 is the beam intensity, x are coordinates along the image horizontal, y are coordinates along the imagevertical, z is coordinates along the photon path through the scene which has attenuation coefficient µxy(z).
Consider a scenario of an object placed inside a cargo container, the integral can be split into separateattenuation contributions from the container (C) and the object (O),
Ixy = I0 exp
(−∫C
µxy(z)dz
)exp
(−∫O
µxy(z)dz
), (2)
= I0CxyOxy, (3)
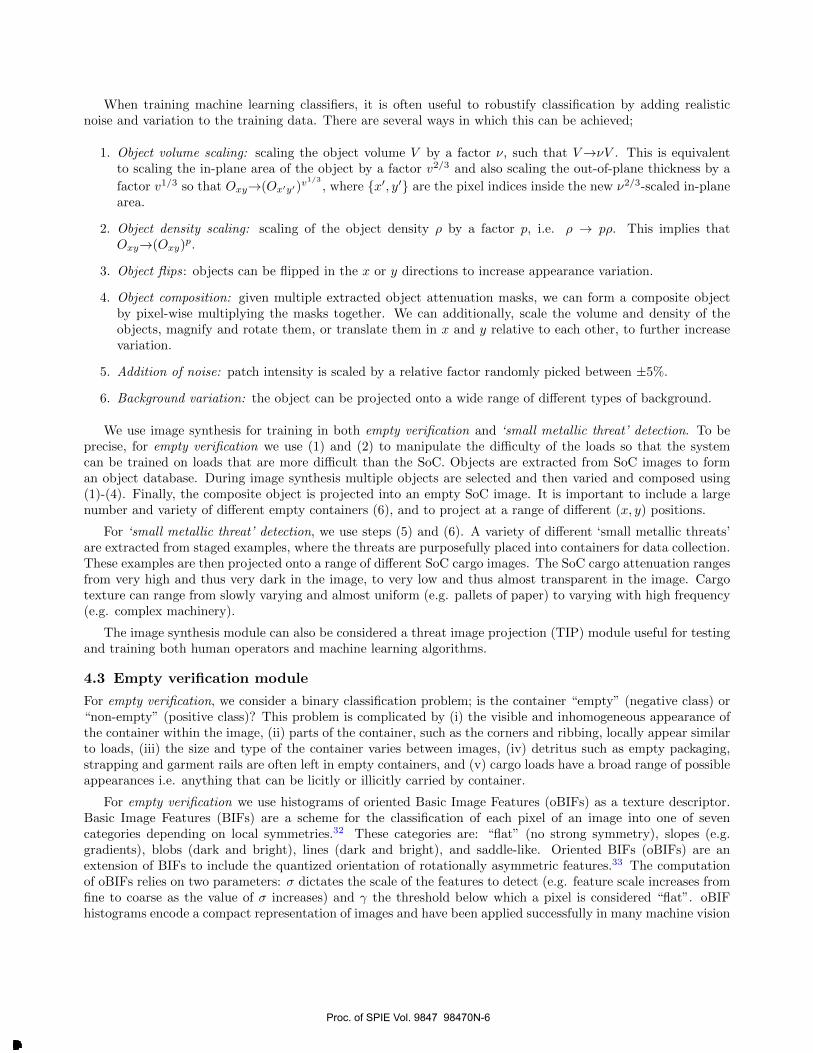
thus by estimating the contribution from the container Cxy ∈ [0, 1] and beam intensity I0, one can obtain anattenuation mask Oxy ∈ [0, 1] for the object by computing Ixy/(I0Cxy). Now, we can project the object maskOxy into other images by pixel-wise multiplication.
For cargo images, background estimation is often straightforward since the container is mostly uniform inthe y-direction, and so a small background patch above the object can be interpolated over the object ROI toobtain Cxy as shown in Fig. 4(1). In more difficult cases, an object patch can be manually delineated to form athreat mask, and other non-background objects can be delineated to form an ignore mask. A simple backgroundremoval is achieved by (i) computing the mean of the patch pixels that are not in the threat mask or the ignoremask, (ii) divide each pixel in the threat mask by this mean, (iii) set all other pixels to 1. This process is shownin Fig. 4(2).
volume decreasing
pixel-wise division
composite object
extracted objectDB objects
synthesised non-empty images
1) Non-empty image synthesis
threat mask
ignore mask
division by mean background intensity
synthesised threatthreat image
2) Threat image synthesis
Figure 4. Illustration of the work-flow for synthesising (1) non-empty images with an inserted composite object withdecreasing volume, and (2) a ‘small metallic threat’ image.
Proc. of SPIE Vol. 9847 98470N-5
Downloaded From: http://proceedings.spiedigitallibrary.org/ on 05/18/2016 Terms of Use: http://spiedigitallibrary.org/ss/TermsOfUse.aspx
When training machine learning classifiers, it is often useful to robustify classification by adding realisticnoise and variation to the training data. There are several ways in which this can be achieved;
1. Object volume scaling: scaling the object volume V by a factor ν, such that V→νV . This is equivalentto scaling the in-plane area of the object by a factor v2/3 and also scaling the out-of-plane thickness by a
factor v1/3 so that Oxy→(Ox′y′)v1/3
, where {x′, y′} are the pixel indices inside the new ν2/3-scaled in-planearea.
2. Object density scaling: scaling of the object density ρ by a factor p, i.e. ρ → pρ. This implies thatOxy→(Oxy)p.
3. Object flips: objects can be flipped in the x or y directions to increase appearance variation.
4. Object composition: given multiple extracted object attenuation masks, we can form a composite objectby pixel-wise multiplying the masks together. We can additionally, scale the volume and density of theobjects, magnify and rotate them, or translate them in x and y relative to each other, to further increasevariation.
5. Addition of noise: patch intensity is scaled by a relative factor randomly picked between ±5%.
6. Background variation: the object can be projected onto a wide range of different types of background.
We use image synthesis for training in both empty verification and ‘small metallic threat’ detection. To beprecise, for empty verification we use (1) and (2) to manipulate the difficulty of the loads so that the systemcan be trained on loads that are more difficult than the SoC. Objects are extracted from SoC images to forman object database. During image synthesis multiple objects are selected and then varied and composed using(1)-(4). Finally, the composite object is projected into an empty SoC image. It is important to include a largenumber and variety of different empty containers (6), and to project at a range of different (x, y) positions.
For ‘small metallic threat’ detection, we use steps (5) and (6). A variety of different ‘small metallic threats’are extracted from staged examples, where the threats are purposefully placed into containers for data collection.These examples are then projected onto a range of different SoC cargo images. The SoC cargo attenuation rangesfrom very high and thus very dark in the image, to very low and thus almost transparent in the image. Cargotexture can range from slowly varying and almost uniform (e.g. pallets of paper) to varying with high frequency(e.g. complex machinery).
The image synthesis module can also be considered a threat image projection (TIP) module useful for testingand training both human operators and machine learning algorithms.
4.3 Empty verification module
For empty verification, we consider a binary classification problem; is the container “empty” (negative class) or“non-empty” (positive class)? This problem is complicated by (i) the visible and inhomogeneous appearance ofthe container within the image, (ii) parts of the container, such as the corners and ribbing, locally appear similarto loads, (iii) the size and type of the container varies between images, (iv) detritus such as empty packaging,strapping and garment rails are often left in empty containers, and (v) cargo loads have a broad range of possibleappearances i.e. anything that can be licitly or illicitly carried by container.
For empty verification we use histograms of oriented Basic Image Features (oBIFs) as a texture descriptor.Basic Image Features (BIFs) are a scheme for the classification of each pixel of an image into one of sevencategories depending on local symmetries.32 These categories are: “flat” (no strong symmetry), slopes (e.g.gradients), blobs (dark and bright), lines (dark and bright), and saddle-like. Oriented BIFs (oBIFs) are anextension of BIFs to include the quantized orientation of rotationally asymmetric features.33 The computationof oBIFs relies on two parameters: σ dictates the scale of the features to detect (e.g. feature scale increases fromfine to coarse as the value of σ increases) and γ the threshold below which a pixel is considered “flat”. oBIFhistograms encode a compact representation of images and have been applied successfully in many machine vision
Proc. of SPIE Vol. 9847 98470N-6
Downloaded From: http://proceedings.spiedigitallibrary.org/ on 05/18/2016 Terms of Use: http://spiedigitallibrary.org/ss/TermsOfUse.aspx
tasks. Implementations for BIFs and oBIFs in MATLAB and Mathematica are available online.34 After computingoBIFs, we efficiently construct 23-bin histograms using the integral histogram method.35
In our approach, we split the image into a grid of 96×96 pixel windows. Within each window, we compute(i) oBIFs at scales σ = {0.7, 1.4, 2.8, 5.6, 11.2} and threshold γ = 0.1, (ii) window intensity moments up to 2ndorder, and (iii) the coordinates of the window centre (x, y) within the image. The feature vector for each windowis fed into a Random Forest (RF) classifier. A window score is computed based on the fraction of trees in theRF ensemble that vote that the window is “non-empty”. To make a decision for the whole image, we take themaximum of the window scores and compare to a threshold.
Each feature type plays a distinct role in the window descriptor;
1. oBIF histograms: encode textural information for windows at different locations in the container. Thecontainer has a distinct, ordered, structure, and the smaller scale oBIFs, and their quantized orientation,help to encode this information. Due to the large variation in appearance of possible loads, it would bevery difficult for the RF to learn all the different small-scale structures, thus large scale oBIFs prove useful,since they encode information about the larger scale image structure, rather than getting stuck in theintricate small-scale details. For example, we find that the large-scale minima-like BIF-type is assignedhigh importance by the RF since smaller loads tend to appear as dark blobs at larger scales.
2. Intensity moments: encode information about image intensity and its spatial distribution; informationwhich is lost in the computation of oBIFs.
3. (x, y): allow the RF to implicitly learn the range of appearances at different locations in the container. Forexample, it is able to learn that empty windows near the top of the image should have roof-like appearanceand that windows towards the bottom should have floor-like appearance. It does so without explicitly beingtold where the roof or floor are. Thus, we can avoid segmenting the container into separate regions (e.g.floor, walls, and roof) and training a separate classifier on each image region. We measure the x-coordinatefrom the nearest container end to account for its reflectional symmetry about the container centre. Thiseffectively halves the number of x-locations that the RF needs to learn.
In the stream-of-commerce (SoC) dataset, it is relatively straightforward to classify containers, since cargousually occupies a large proportion of the container. Performance on the SoC dataset does not adequatelyevaluate the ability of the classifier on more difficult scenarios, such as where criminals smuggle a small amountof contraband inside an otherwise empty container. To this end, we have developed a method of synthesisingrealistic examples from the SoC data (Sec. 4.2). Synthesising images in this way allows us to (i) obtain groundtruth labels for individual windows which is useful in training and testing the classifier, (ii) control the volumeand density of the load so that we can measure the performance of the system at different levels of difficulty,and (iii) to test on examples that are more difficult than those in the SoC.
The system was trained on synthesised non-empty examples and SoC empty examples. The densities andvolumes of the training objects ranged from 0.2 g/cm3 to 1.75 g/cm3 and 0.001 m3 to 1.5 m3, respectively. In total2.8× 105 windows, with balanced empty and non-empty classes, were used to train the classifier. We randomlysample 11≈
√122 (where 122 is the dimensionality of the feature vector) variables at each split, and use 500 trees
in the ensemble selected by finding the point where the out-of-bag error (versus number of trees) plateaus.
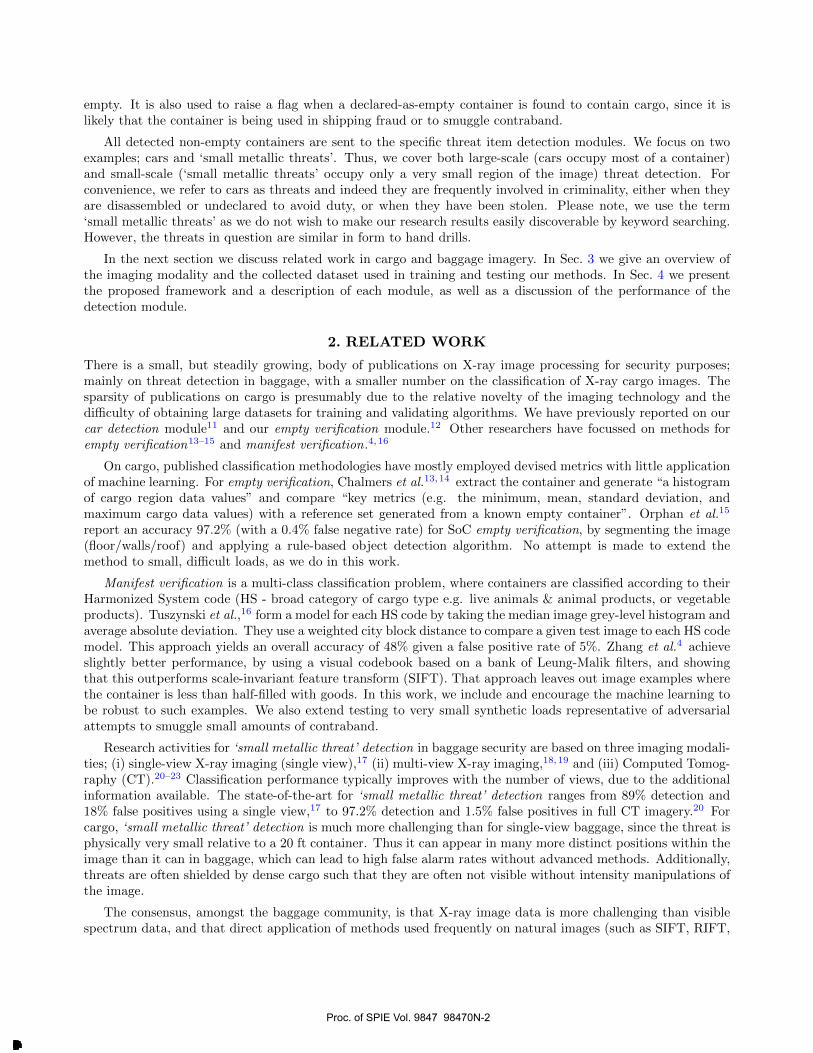
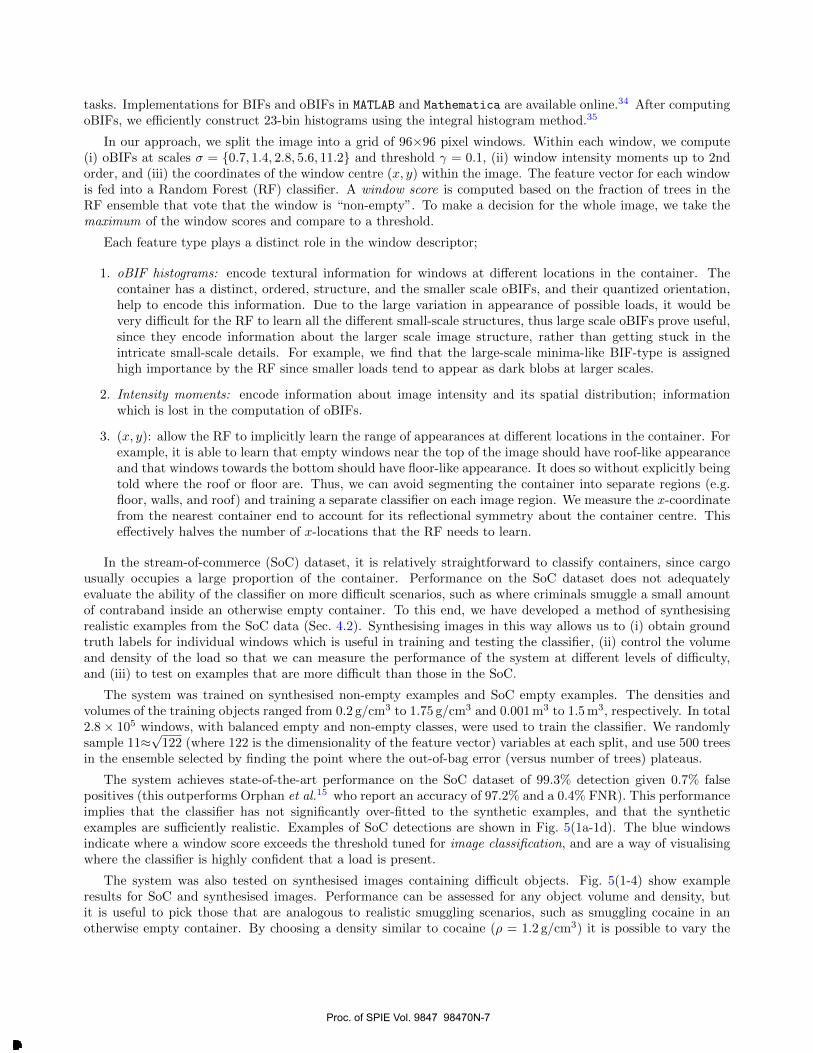
The system achieves state-of-the-art performance on the SoC dataset of 99.3% detection given 0.7% falsepositives (this outperforms Orphan et al.15 who report an accuracy of 97.2% and a 0.4% FNR). This performanceimplies that the classifier has not significantly over-fitted to the synthetic examples, and that the syntheticexamples are sufficiently realistic. Examples of SoC detections are shown in Fig. 5(1a-1d). The blue windowsindicate where a window score exceeds the threshold tuned for image classification, and are a way of visualisingwhere the classifier is highly confident that a load is present.
The system was also tested on synthesised images containing difficult objects. Fig. 5(1-4) show exampleresults for SoC and synthesised images. Performance can be assessed for any object volume and density, butit is useful to pick those that are analogous to realistic smuggling scenarios, such as smuggling cocaine in anotherwise empty container. By choosing a density similar to cocaine (ρ = 1.2 g/cm3) it is possible to vary the
Proc. of SPIE Vol. 9847 98470N-7
Downloaded From: http://proceedings.spiedigitallibrary.org/ on 05/18/2016 Terms of Use: http://spiedigitallibrary.org/ss/TermsOfUse.aspx
A - IPA7+T+T11T41FAi *1111IIIq,t911Eevrw'«i I f ü 1 F 1 1 I k n4 11 11Rt 112 ' I: C 9:1i1C1{
Cti4}.c'-.WZdP i!?Ni
0 0.05 0.1 0.15 0.2 0.250.75
0.8
0.85
0.9
0.95
1
FPR
TPR
~0.5 kg cocaine~1.3 kg cocaine~3.5 kg cocaine~10 kg cocaine~81 kg cocaine
5)
Figure 5. 1. Example true positives on SoC data. 2,3: Synthetic images with object of similar volume and density to 1 Lof water. 2: True positives. 3: False negatives, missed because of alignment with container structures. 4: False positives;a is detritus, b is damage. 5: ROC curves for different masses of cocaine.
object volume and determine receiver operating characteristic (ROC) curves for different masses of cocaine, asshown in Fig. 5(5). As the cocaine mass gets smaller, the task becomes more challenging, and the ROC curvegets pushed towards lower true positive and false positive rates. For 1.25 kg of cocaine, the system achieves 93.0%detection, while triggering 1% false alarms on empty containers. Cocaine smugglers typically smuggle between8 kg and 514 kg of cocaine,2 so the system performance in this context is at a useful level.
4.4 Car detection module
The car detection module (Fig. 2) classifies the input image as “car” (contains at least one car, positive class) or“non-car” (does not contain a car, negative class). Rectangular 350×1050 pixel sub-windows are densely sampledwith a 40 pixel stride. Window features are computed and fed to a RF classifier, which assigns a score to eachwindow. The image score is then computed as the maximum of the window scores. Binary classification of theimage is finally obtained by comparing the image score with a threshold value.
Image feature computation is a key aspect of this classification scheme. The simplest type of features evaluatedfor the classification of windows as “car” or “non-car” were histograms of raw pixel intensities that encode thedistribution of intensity within a window. These histograms can thus be used to discriminate between windowsof different contrasts, e.g. between container background and industrial machinery. Intensity histograms areconvenient features due to their simplicity and efficient computation by the integral histogram method.35 Wealso evaluated oBIFs as texture features for classification.
The dataset included 79 car images, for a total of 192 cars, and 20,000 non-car images. Due to the relativelylow number of car images, leave-one-out cross-validation (LOOCV) was employed to evaluate the generalisationof the method to unseen car images. A hold-out validation scheme using all car images and 10,000 non-car imagesenabled the determination of the false alarm rate on previously unseen images. Performance was summarisedby computing the H-measure, an alternative to the traditional area-under-the-curve (AUC) that was shown tobetter accommodate unbalanced datasets.36
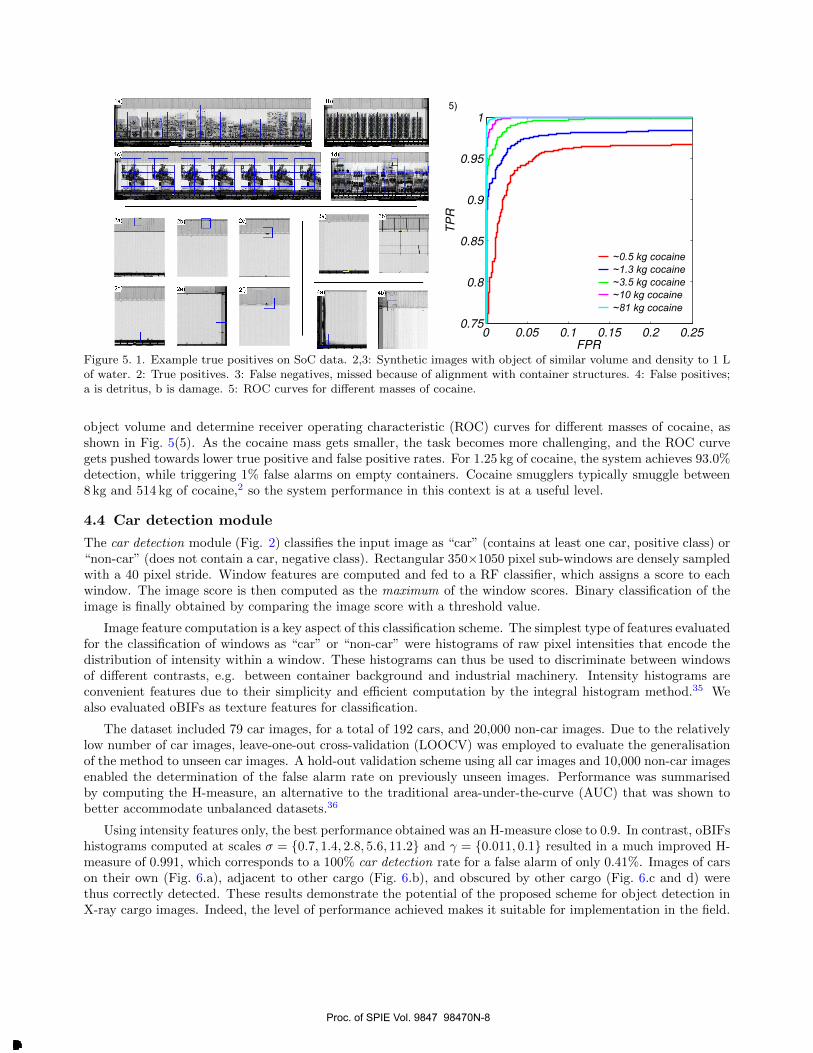
Using intensity features only, the best performance obtained was an H-measure close to 0.9. In contrast, oBIFshistograms computed at scales σ = {0.7, 1.4, 2.8, 5.6, 11.2} and γ = {0.011, 0.1} resulted in a much improved H-measure of 0.991, which corresponds to a 100% car detection rate for a false alarm of only 0.41%. Images of carson their own (Fig. 6.a), adjacent to other cargo (Fig. 6.b), and obscured by other cargo (Fig. 6.c and d) werethus correctly detected. These results demonstrate the potential of the proposed scheme for object detection inX-ray cargo images. Indeed, the level of performance achieved makes it suitable for implementation in the field.
Proc. of SPIE Vol. 9847 98470N-8
Downloaded From: http://proceedings.spiedigitallibrary.org/ on 05/18/2016 Terms of Use: http://spiedigitallibrary.org/ss/TermsOfUse.aspx
.41
0 0.2 0.4 0.6 0.8 1.0
a)a)a)
a)a)c)
a)a)b)
a)a)d)
Figure 6. Examples of car classification outputs. For each panel, the top half is the raw X-ray transmission image overlaidwith the manually annotated region of interest in red, the bottom half is a visualization of the classification scores atvarious location of the image (blue and red indicate high confidence that the region is background and car, respectively.
4.5 ‘Small metallic threat’ detection module
The detection of ‘small metallic threats’, even more so than car detection and empty verification, is a challengingmachine vision task for the following reasons: i) variations in size (i.e. from the equivalent of a mobile phoneto that of large industrial tools), ii) unconstrained orientation, iii) large number of models and manufacturers,iv) lack of discriminative visual features (i.e. their appearance is close to that of legitimate cargo and containerstructures). The classification scheme employed in the car detection and empty verification modules (classificationby RF based on various fixed features, including oBIFs) performed poorly for this task. Instead, a differentapproach was taken with the implementation of a classification scheme based on convolutional neural networks(CNNs).
CNNs are part of a family of representation-learning algorithms commonly referred to as Deep Learning.37
As the name suggests, representation-learning consists in determining a representation of the data that optimisethe task (classification or regression). Thus, instead of relying on generic features such as oBIFs, CNNs attemptto learn task-optimal features from labelled example images. It is well-known that for artificial neural networksto perform well on image data, it is necessary to process small pixel neighbourhoods rather than individualpixels.38 Connections between the layers of a network should thus be from a neighbourhood of pixels to another,which preserves the two-dimensional nature of images. Moreover, the weights dictating these connections shouldbe the same across the entire image, as it is likely that features performing well in one location will also do soeverywhere else (i.e. translation invariance). In CNNs, those notions of weight sharing and local connectivityare enforced by introduction of convolutional layers where the mappings from inputs to ouputs are computedbased on the convolution operator.39 Together with convolutional layers, rectified linear units and regularisationtechniques (e.g. dropout40) define the building blocks of CNN architectures that are becoming the state-of-the-art in many applications (e.g. face verification), even surpassing human performance for some tasks such aslarge-scale classification of natural images.41
Even more so than other machine learning approaches, deep learning requires a very large number of examples
Proc. of SPIE Vol. 9847 98470N-9
Downloaded From: http://proceedings.spiedigitallibrary.org/ on 05/18/2016 Terms of Use: http://spiedigitallibrary.org/ss/TermsOfUse.aspx
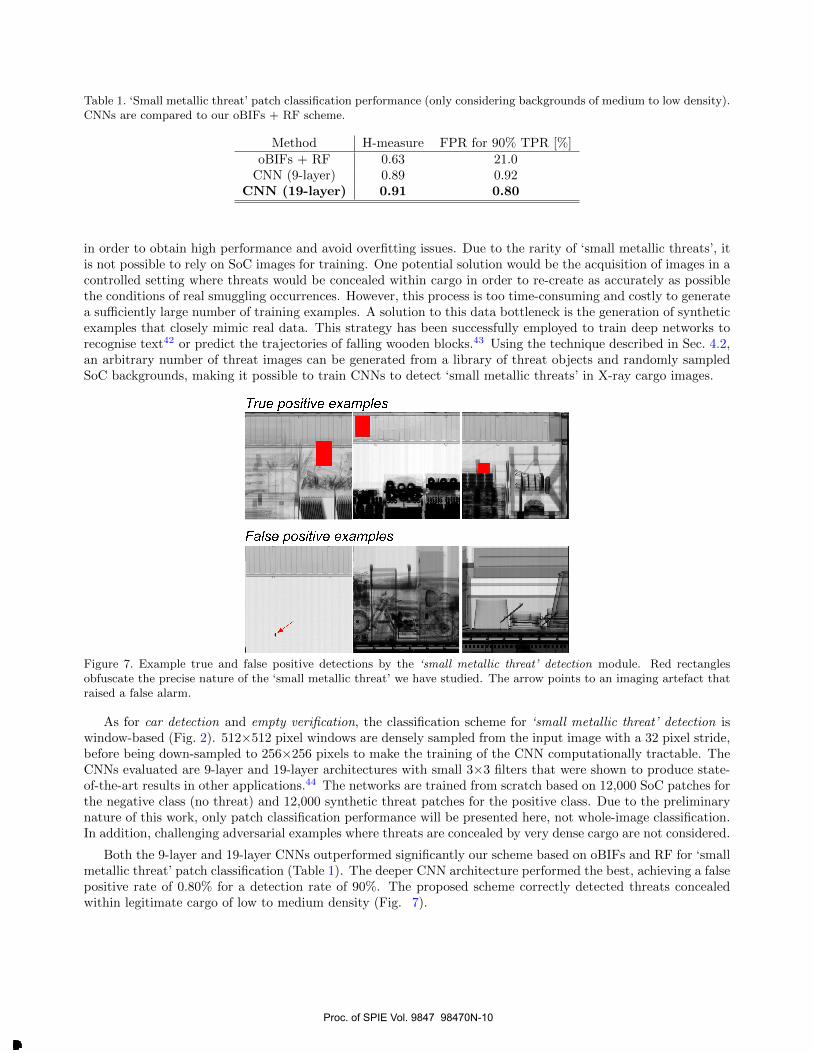
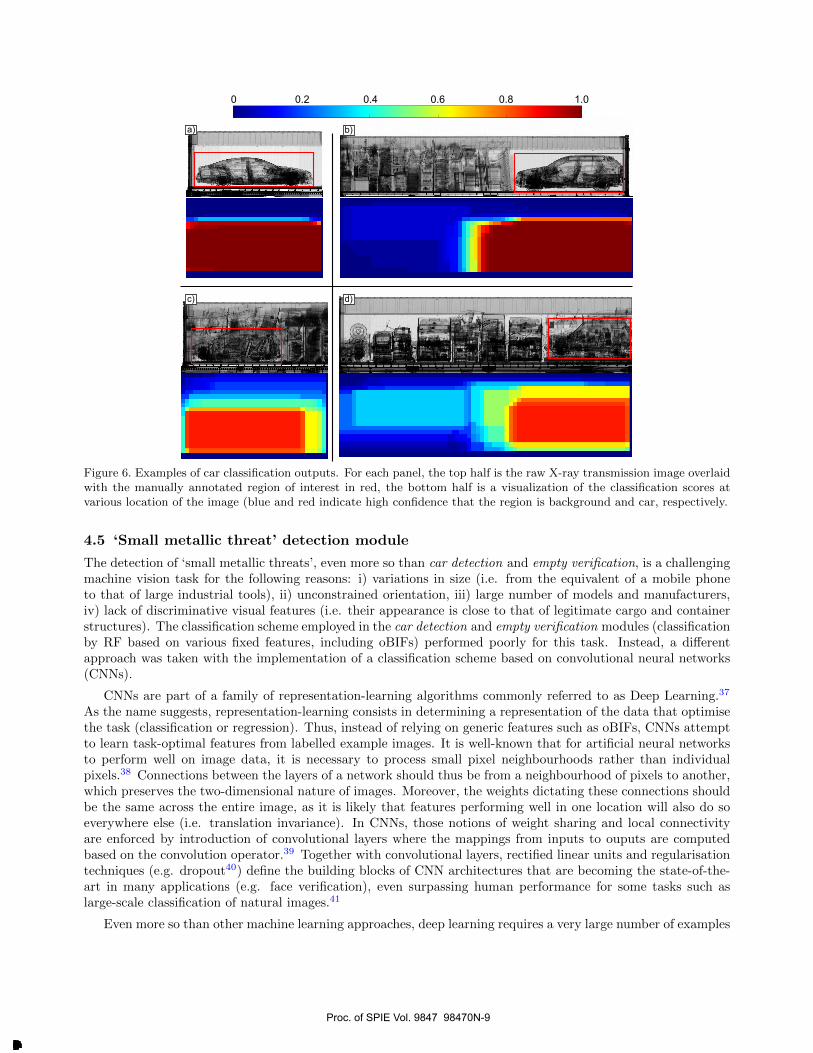
True positive examples
False positive examples
Table 1. ‘Small metallic threat’ patch classification performance (only considering backgrounds of medium to low density).CNNs are compared to our oBIFs + RF scheme.
Method H-measure FPR for 90% TPR [%]oBIFs + RF 0.63 21.0
CNN (9-layer) 0.89 0.92CNN (19-layer) 0.91 0.80
in order to obtain high performance and avoid overfitting issues. Due to the rarity of ‘small metallic threats’, itis not possible to rely on SoC images for training. One potential solution would be the acquisition of images in acontrolled setting where threats would be concealed within cargo in order to re-create as accurately as possiblethe conditions of real smuggling occurrences. However, this process is too time-consuming and costly to generatea sufficiently large number of training examples. A solution to this data bottleneck is the generation of syntheticexamples that closely mimic real data. This strategy has been successfully employed to train deep networks torecognise text42 or predict the trajectories of falling wooden blocks.43 Using the technique described in Sec. 4.2,an arbitrary number of threat images can be generated from a library of threat objects and randomly sampledSoC backgrounds, making it possible to train CNNs to detect ‘small metallic threats’ in X-ray cargo images.
Figure 7. Example true and false positive detections by the ‘small metallic threat’ detection module. Red rectanglesobfuscate the precise nature of the ‘small metallic threat’ we have studied. The arrow points to an imaging artefact thatraised a false alarm.
As for car detection and empty verification, the classification scheme for ‘small metallic threat’ detection iswindow-based (Fig. 2). 512×512 pixel windows are densely sampled from the input image with a 32 pixel stride,before being down-sampled to 256×256 pixels to make the training of the CNN computationally tractable. TheCNNs evaluated are 9-layer and 19-layer architectures with small 3×3 filters that were shown to produce state-of-the-art results in other applications.44 The networks are trained from scratch based on 12,000 SoC patches forthe negative class (no threat) and 12,000 synthetic threat patches for the positive class. Due to the preliminarynature of this work, only patch classification performance will be presented here, not whole-image classification.In addition, challenging adversarial examples where threats are concealed by very dense cargo are not considered.
Both the 9-layer and 19-layer CNNs outperformed significantly our scheme based on oBIFs and RF for ‘smallmetallic threat’ patch classification (Table 1). The deeper CNN architecture performed the best, achieving a falsepositive rate of 0.80% for a detection rate of 90%. The proposed scheme correctly detected threats concealedwithin legitimate cargo of low to medium density (Fig. 7).
Proc. of SPIE Vol. 9847 98470N-10
Downloaded From: http://proceedings.spiedigitallibrary.org/ on 05/18/2016 Terms of Use: http://spiedigitallibrary.org/ss/TermsOfUse.aspx
5. CONCLUSION
The inspection of X-ray cargo images is a challenging visual search task akin to finding a needle in a haystack.The majority of images that an operator is tasked with inspecting do not contain an anomaly, thus wastingtime and money. In this report, we presented a modular framework based on modern machine vision andlearning techniques that aims to assist security officers by partially automating the inspection process. Byautomatically sifting through large numbers of images, the proposed system would enable security officers tofocus their attention on images that are likely to be anomalous, thus easing the inspection time constraint andmaking sure that the security infrastructure can be scaled-up as necessary with the ever-increasing volume ofcommerce.
We demonstrated state-of-the-art performance for three tasks: i) car detection, ii) empty container verifica-tion, and iii) ‘small metallic threat’ detection. In order to achieve these results, it was necessary to introduceseveral new methods such as location-specific appearance learning by providing the classifier with window coordi-nates, and threat image projection for the generation of de-novo synthetic training examples. To our knowledge,the proposed ‘small metallic threat’ detection module is the first application of convolutional neural networks toX-ray cargo images.
Despite these achievements, it is clear that much remains to be done. Future efforts will be focused onobtaining larger and more diverse datasets as well as on refining the algorithms described in this contribution.For instance, it is likely that the method that was used to infer an image class based on a collection of windowscores, essentially by thresholding the maximum window score, was not optimal. Similarly, the window-basedscheme could potentially be replaced by per-pixel predictions using fully convolutional neural networks.45
Acknowledgement
The authors acknowledge the use of the UCL Legion High Performance Computing Facility (Legion@UCL), andassociated support services, in the completion of this work. Funding for this work was provided by EPSRC Grantno. EP/G037264/1 as part of UCL’s Security Science Doctoral Training Centre, and Rapiscan Systems Ltd.
REFERENCES
[1] The World Bank, “World development indicators.” Data file available at: http://data.worldbank.org/
indicator/IS.SHP.GOOD.TU/ (2016).
[2] European Commission, “Good practice guide for sea container control, ch. 6 concealment methods.” Avail-able at: http://ec.europa.eu/taxation_customs/elearning/demo/container/library/GPG/chapter_6_Concealment_methods.pdf (2002).
[3] Wolfe, J. M., Brunelli, D. N., Rubinstein, J., and Horowitz, T. S., “Prevalence effects in newly trainedairport checkpoint screeners: trained observers miss rare targets, too.,” Journal of vision 13, 33 (jan 2013).
[4] Zhang, J., Zhang, L., Zhao, Z., Liu, Y., Gu, J., Li, Q., and Zhang, D., “Joint Shape and Texture BasedX-Ray Cargo Image Classification,” in [2014 IEEE Conference on Computer Vision and Pattern RecognitionWorkshops ], 266–273, IEEE (June 2014).
[5] Bastan, M., Yousefi, M. R., and Breuel, T. M., “Visual words on baggage x-ray images,” in [Proceedings ofthe 14th International Conference on Computer Analysis of Images and Patterns - Volume Part I ], CAIP’11,360–368, Springer-Verlag, Berlin, Heidelberg (2011).
[6] McDaniel, F. D., Doyle, B. L., Vizkelethy, G., Johnson, B. M., Sisterson, J. M., and Chen, G., “Under-standing X-ray cargo imaging,” Nuclear Instruments and Methods in Physics Research Section B: BeamInteractions with Materials and Atoms 241(1), 810–815 (2005).
[7] Abidi, B., Page, D., and Abidi, M., “A Combinational Approach to the Fusion, De-noising and Enhancementof Dual-Energy X-Ray Luggage Images,” in [2005 IEEE Computer Society Conference on Computer Visionand Pattern Recognition (CVPR’05) - Workshops ], 3, 2–2, IEEE (2005).
[8] Woodell, G., Rahman, Z.-u., Jobson, D. J., and Hines, G., “Enhanced images for checked and carry-onbaggage and cargo screening,” in [Third International Conference on Advances in Pattern Recognition,ICAPR 2005, Bath, UK, August 22-25, 2005, Proceedings, Part II ], Carapezza, E. M., ed. (Sept. 2005).
Proc. of SPIE Vol. 9847 98470N-11
Downloaded From: http://proceedings.spiedigitallibrary.org/ on 05/18/2016 Terms of Use: http://spiedigitallibrary.org/ss/TermsOfUse.aspx
[9] Abidi, B., Zheng, Y., Gribok, A., and Abidi, M., “Improving Weapon Detection in Single Energy X-Ray Im-ages Through Pseudocoloring,” IEEE Transactions on Systems, Man and Cybernetics, Part C (Applicationsand Reviews) 36, 784–796 (Nov. 2006).
[10] Ogorodnikov, S. and Petrunin, V., “Processing of interlaced images in 410 MeV dual energy customs systemfor material recognition,” Physical Review Special Topics - Accelerators and Beams 5, 104701 (Oct. 2002).
[11] Jaccard, N., Rogers, T. W., and Griffin, L. D., “Automated detection of cars in transmission X-ray imagesof freight containers,” in [2014 11th IEEE International Conference on Advanced Video and Signal BasedSurveillance (AVSS) ], 387–392, IEEE (Aug. 2014).
[12] Rogers, T. W., Jaccard, N., Morton, E. J., and D., G. L., “Detection of cargo container loads from x-rayimages,” in [The IET Conference on Intelligent Signal Processing (ISP 2015) ], (2015).
[13] Chalmers, A., “Automatic high throughput empty ISO container verification,” Proc. SIE 6540(65400Z),1–4 (2007).
[14] Chalmers, A., “Cargo identification algorithms facilitating unmanned/unattended inspection at highthroughput terminals,” in [Proc. SPIE ], 6736, 67360M–67360M–6 (2007).
[15] Orphan, V. J. et al., “Advanced γ ray technology for scanning cargo containers,” Appl. Radiat. Isot. 63,723–732 (2005).
[16] Tuszynski, J., Briggs, J. T., and Kaufhold, J., “A method for automatic manifest verification of containercargo using radiography images,” J. Transp. Secur. 6(4), 339–356 (2013).
[17] Riffo, V. and Mery, D., “Automated Detection of Threat Objects Using Adapted Implicit Shape Model,”IEEE Trans. Syst. Man Cybern. , 1–11 (2015).
[18] Mery, D. et al., “Detection of regular objects in baggage using multiple X-ray views,” Insight Non-Destructive Test. Cond. Monit. 55(1), 16–20 (2013).
[19] Riffo, V. and Mery, D., “Active X-ray Testing of Complex Objects,” Insight - Non-Destructive Test. Cond.Monit. 54(1), 28–35 (2012).
[20] Flitton, G., Mouton, A., and Breckon, T. P., “Object classification in 3D baggage security computedtomography imagery using visual codebooks,” Pattern Recognit. 48(8), 1–11 (2015).
[21] Mouton, A. et al., “3D object classification in baggage computed tomography imagery using randomisedclustering forests,” IEEE Int. Conf. Image Process. , 5202–5206 (2014).
[22] Flitton, G., Breckon, T. P., and Megherbi, N., “A comparison of 3D interest point descriptors with appli-cation to airport baggage object detection in complex CT imagery,” Pattern Recognit. 46(9), 2420–2436(2013).
[23] Flitton, G., Breckon, T., and Megherbi Bouallagu, N., “Object Recognition using 3D SIFT in Complex CTVolumes,” in [Procedings Br. Mach. Vis. Conf. 2010 ], 11.1–11.12 (2010).
[24] Bastan, M. et al., “Visual Words on Baggage X-Ray Images,” in [Comput. Anal. Images ], (Figure 1), 1–7(2011).
[25] Batan, M., “Multi-view object detection in dual-energy X-ray images,” Mach. Vis. Appl. 26(7), 1045–1060(2015).
[26] Schmidt-hackenberg, L. et al., “Visual cortex inspired features for object detection in X-ray images,” in[Int. Conf. Pattern Recognit. ], (Icpr), 2573–2576 (2012).
[27] Rogers, T. W., Ollier, J., Morton, E. J., and Griffin, L. D., “Reduction of wobble artefacts in imagesfrom mobile transmission x-ray vehicle scanners,” in [Imaging Systems and Techniques (IST), 2014 IEEEInternational Conference on ], 356–360 (Oct 2014).
[28] Dong, J.-X. and Song, D.-P., “Container fleet sizing and empty repositioning in liner shipping systems,”Transportation Research Part E: Logistics and Transportation Review 45(6), 860 – 877 (2009).
[29] Aronowitz, A. A., Laagland, D. C. G., and Paulides, G., [Value-added Tax Fraud in the European Union ],Kugler Publications (1996).
[30] Clarke, R. V. and Brown, R., “International trafficking in stolen vehicles,” Crime and Justice , 197–227(2003).
[31] Clarke, R. V. and Brown, R., “International Trafficking of Stolen Vehicles,” in [International Crime andJustice ], Natarajan, M., ed., ch. 16, 126–132, Cambridge University Press (2010).
Proc. of SPIE Vol. 9847 98470N-12
Downloaded From: http://proceedings.spiedigitallibrary.org/ on 05/18/2016 Terms of Use: http://spiedigitallibrary.org/ss/TermsOfUse.aspx
[32] Griffin, L. D., Lillholm, M., Crosier, M., and van Sande, J., “Basic image features (bifs) arising fromapproximate symmetry type,” in [Scale Space and Variational Methods in Computer Vision ], Tai, X.-C.,Mrken, K., Lysaker, M., and Lie, K.-A., eds., Lecture Notes in Computer Science 5567, 343–355, SpringerBerlin Heidelberg (2009).
[33] Newell, A. J. and Griffin, L. D., “Natural Image Character Recognition Using Oriented Basic Image Fea-tures,” in [2011 International Conference on Digital Image Computing: Techniques and Applications ], 191–196, IEEE (Dec. 2011).
[34] Griffin, L. D. et al., “Basic Image Features (BIFs) implementation.” Available at: https://github.com/
GriffinLab/BIFs (2015).
[35] Porikli, F., “Integral Histogram : A Fast Way to Extract Histograms in Cartesian Spaces,” (2005).
[36] Hand, D. J. and Anagnostopoulos, C., “A better Beta for the H measure of classification performance,”(Feb. 2012).
[37] LeCun, Y., Bengio, Y., and Hinton, G., “Deep learning,” Nature 521(7553), 436–444 (2015).
[38] LeCun, Y. et al., “Generalization and network design strategies,” Connections in Perspective. North-Holland, Amsterdam , 143–55 (1989).
[39] Jarrett, K., Kavukcuoglu, K., Ranzato, M., and LeCun, Y., “What is the best multi-stage architecture forobject recognition?,” in [Computer Vision, 2009 IEEE 12th International Conference on ], 2146–2153, IEEE(2009).
[40] Srivastava, N., Hinton, G., Krizhevsky, A., Sutskever, I., and Salakhutdinov, R., “Dropout: a simple way toprevent neural networks from overfitting,” The Journal of Machine Learning Research 15, 1929–1958 (jan2014).
[41] He, K., Zhang, X., Ren, S., and Sun, J., “Delving Deep into Rectifiers: Surpassing Human-Level Performanceon ImageNet Classification,” (feb 2015).
[42] Jaderberg, M., Simonyan, K., Vedaldi, A., and Zisserman, A., “Synthetic Data and Artificial Neural Net-works for Natural Scene Text Recognition,” (jun 2014).
[43] Lerer, A., Gross, S., and Fergus, R., “Learning Physical Intuition of Block Towers by Example,” (mar 2016).
[44] Simonyan, K. and Zisserman, A., “Very Deep Convolutional Networks for Large-Scale Image Recognition,”(sep 2014).
[45] Long, J., Shelhamer, E., and Darrell, T., “Fully convolutional networks for semantic segmentation,” in[Proceedings of the IEEE Conference on Computer Vision and Pattern Recognition ], 3431–3440 (2015).
Proc. of SPIE Vol. 9847 98470N-13
Downloaded From: http://proceedings.spiedigitallibrary.org/ on 05/18/2016 Terms of Use: http://spiedigitallibrary.org/ss/TermsOfUse.aspx