Embed Size (px)
Citation preview
Donna Wendt
Tacoma Economic Development: GIS Diversity, SAP Addresses and 3D Visualization
Abstract:
In order to promote economic development, measure growth, and create comprehensive plans, the Tacoma Economic Development Department requires GIS data from most of the other city, utility, regional, and state agencies. GIS applications used to effectively accomplish this work are as diverse as the data collected from the many sources. Applications, data connections, and relationships with other departments and agencies are documented. Two applications are highlighted: the GIS address interface into Tacoma’s new enterprise SAP system which replaces over 100 old computer applications, and 3D visualization of neighborhood development.
This paper was presented on August 12, 2004.
Introduction
When the Tacoma Economic Development Department (TEDD) was known as Planning and Development Services, it needed a multitude of GIS data from most of the other departments in the city as well as adjacent and regional government agencies. As the economic development component of planning was added, even more data and information were needed to support GIS analysis. Results-oriented measurement of TEDD’s departmental strategic goals further pushed the envelope of the quantity and consistency of community and planning data.
The first department in the City of Tacoma or Pierce County to use GIS, Tacoma Planning started with the basics of parcels, municipal boundaries, and addresses in 1975. This data migrated from a home-grown GIS on an IBM mainframe to ESRI PIOS on a Prime minicomputer, then to Arc/Info, and eventually to a network of UNIX and Windows servers using ArcGIS. The inventory of GIS data expanded dramatically with each platform change. The cost of hardware decreased as well as the amount of time needed to produce analysis and maps. Huge productivity gains and more information for management decision support were realized as the GIS industry grew from it’s infancy to today’s mature science of geography.
Applications
Applications including traditional planning functions along with those for other city departments. The Crime Analysis Mapping System, fire response analysis, dispatch data extracts, and a permit system were added during the Prime minicomputer era. Some of these applications included:
• Address matching (geocoding) • Change in Land Use • Zoning Change over Time • Comprehensive Plan Support • Archeological, Architectural, and Historic Properties • Senior Case Management • Traffic Accident Reporting System • Fire Alarm Assignment System • Emergency Medical Mapping System • Street Center Line Interface to Fire Dispatch (ported to the City and County of
Spokane) • Crime Analysis Mapping System (requested by many cities and counties in the
USA and Holland) • Building Permits (the first automated permit system, pre-Tidemark and pre-SAP) • Population Projections • Redistricting of Election Boundaries • Mailing Labels • Assessor Data Interface • Available of facilities and infrastructure for business recruitment • Mapping of businesses, Tax & License division of Finance • Tacoma Public Library Circulation Desk Query for Addresses Inside City Limits
With the advent of UNIX and Windows platforms and increasing use of the Internet, more applications were possible. For example:
• Commercial Space Availability, www.TacomaSpace.com and www.DistrictSpace.com
• Mailing Labels from the Intranet • Internet Historic Parcel Locations,
http://www.cityoftacoma.org/historicpreservation , then “Tacoma’s Historic Properties” and “Is My Property Historic”
• Download of GIS Maps and Data, http://www.cityoftacoma.org/default.asp?main=/41assist/default.asp then “Maps & Data”
• Growth Management & Buildable Lands • Address & Critical Land Interfaces to the Permit systems
• Updated Pierce County Assessor Data Interface to GIS, permits, and data warehouse
• Ortho-photo management • ESRI GIS data integration with AutoCAD (utilities) and SmallWorld (Power
Dept.) • Cartography and Mapping (No council presentation without a map!)
o MapsRUs.mxd – User-friendly ArcMap application • GIS-driven Outcome Measurement • CommunityViz™ commercial software for planning scenario evaluation,
projections, and integrated GIS 3D visualization of analysis outcomes (see www.CommunityViz.com)
The measurement applications are among the most data-demanding of GIS applications. They encompass assessed values by land use coming from the Pierce County Assessor tied to parcels and addresses, development investments as documented by building permit activity, business locations and associated business and sales tax, to vacancy rates as derived from utility customer accounts. Relationships with many departments and agencies are important when collecting the needed data for the kind of analysis to do measurement. Customers of the measurement reports include planners and analysts in TEDD, city management, the city council, and the public.
In the past few years, the public has demanded results-oriented measurement of government performance. When establishing the budget and deciding on city-wide and departmental programs, the question, as expressed by city manager Jim Walton in his employee presentation on June 23, 2004, “What is the outcome and how is the public benefited?” must be asked. TEDD and Human Services, which used to be part of the Planning department, were early leaders in measurement techniques. The kinds of outcome measures being used in the Tacoma Economic Development Department are now being utilized in the city’s Strategic Plan, Tacoma Tomorrow, 2005-1010. Many of these new measures utilize GIS. One example of this is the strategic initiative:
Sustain, expand and diversify businesses in our mixed-use centers, resulting in increased business development in mixed use centers, excluding Downtown and Tacoma Mall.
The measures for this initiative are:
• 4 percent increase per year in taxable income reported by businesses in mixed use centers
• 5 percent increase per year in net new businesses in mixed use centers
Data needed to perform this measure include quality business addresses, quality street center line addresses, robust GIS geocoding (address matching to a point map theme), mixed use center polygons, and consistent business and tax data from one year to the next. Departments involved in the data related to just this one measure include Business Information Systems, Finance, Public Works, Fire, and TEDD.
In the author’s opinion, the single most data-hungry application for TEDD would be transportation analysis. TEDD works together with Public Works, Pierce County, and the Puget Sound Regional Council to complete a regional transportation model of current and projected transportation needs. This application must consider traffic counts, streets, parcels, zoning, demographics, jobs, land use, land use change forecasts, the comprehensive plan, population and employment forecasts, parking availability, multi-modal transportation, utility and facility availability, ortho photos, and vacancy rates.
Professional Alliances
The flow of such a wide collection of GIS data depends on maintaining a number of relationships with other agencies, as mentioned above. These relationships are important for the exchange of data, ideas, and customized GIS software. Some of the professional relationships needed for Tacoma Economic Development Department are:
• Most of the government departments in the City of Tacoma and Tacoma Public Utilities
• Tacoma Metro Parks • Pierce County GIS • Pierce County Planning and Landuse Services • Puyallup Tribe • State of Washington Department of Natural Resources • State of Washington Department of Revenue • State of Washington Department of Transportation • Puget Sound Regional Council (A regional planning agency.) • Large and adjacent cities in Washington • University of Washington GIS Program
Collection of Data
Over 800 geographic datasets have been collected by TEDD and documented in a data dictionary. The most-used layers are easily accessed from the custom smiley-face icon in the MapsRUs ArcMap application which was developed by Mike Murnane, Senior GIS Analyst for TEDD. This list is very indicative of the kind of data needed to support an Economic Development department:
• Addresses • Aerial Photos (1992) • Aerial Photos (1996) • Aerial Photos (1998) • Aerial Photos (1998, 2002)
• Aerial Photos (2002) • Arterials • Arterials (CAD) • Arterial Names • Building Permits (2001) • Buildings (1990) • Buildings Downtown (1996) • Census 2000 – Tacoma City Blocks • Census 2000 – Tacoma UGA Blocks • Census 2000 – Tacoma UGA Tracts • Census 2000 – Pierce County • Census 2000 – Washington State • Census Blocks (1990) • Census Block Groups (1990) • Census Tracts (1990) • Census Tract Boundaries (1990) • City Boundary • City of Tacoma • Commercial Characteristics Table • Contours (2ft) • Contours (10ft) • Councilmanic Districts • Councilmanic Boundaries • Empowerment Zone • Facilities (Capital) • Facilities (Community) • Facilities (Municipal) • Fire Stations • FAZ (Facility Analysis Zones) • Geodata Dictionary • Highways • Historic Areas • Hospitals • Land Use – Standard Colors • Land Use Code Table • Land Use Description Table • Land Use Intensity • Light Rail • Map Basics • Mixed Use Centers • Mixed Use Center Boundary • Neighborhood Areas • Neighborhood Blocks • Neighborhood Business Districts
• Neighborhood Business District Boundary • Neighborhood Council Districts • Neighborhood Council District Boundary • Parcels • Parcels (Assessor Data) • Parking Downtown • Parks • Puyallup Land Claims Settlement Survey Area • Puyallup Boundary (Land Claims Settlement) • Puyallup Trust Properties (within the City) • Real Property Table (Pierce County Assessor) • Real Property Appraisal (Improvements, Pierce County Assessor) • Schools • Steep Slopes • Street Center Lines • Street Center Lines (Pierce County) • Street Names • Street Names (ROW) • Table Data Dictionary • TAZ 1999 (Traffic Analysis Zones) • Urban Growth Area • Urban Growth Area Boundary • Vacant Parcels • Water • Wetlands • Zip Codes • Zip Code Boundaries • Zoning • Zoning – Standard Colors • Zoning Description Table • Zoning Boundary
Tracking of Customer Requests
TEDD’s GIS section is relatively small for the volume of requests and projects requested. Six full time staff fall into the following categories of work:
• Management: 1 • Group and work request coordination, public contact: 1 • GIS Analysts: 3 • System and Database Administration: 1
Additionally, TEDD leverages it’s production capabilities by working closely with the University of Washington Tacoma campus GIS program. Although student interns are unpaid, they receive a well-rounded real-world GIS experience while working with the TEDD GIS staff. These students receive letters of recommendations and have a very good track record of finding permanent jobs in the GIS industry.
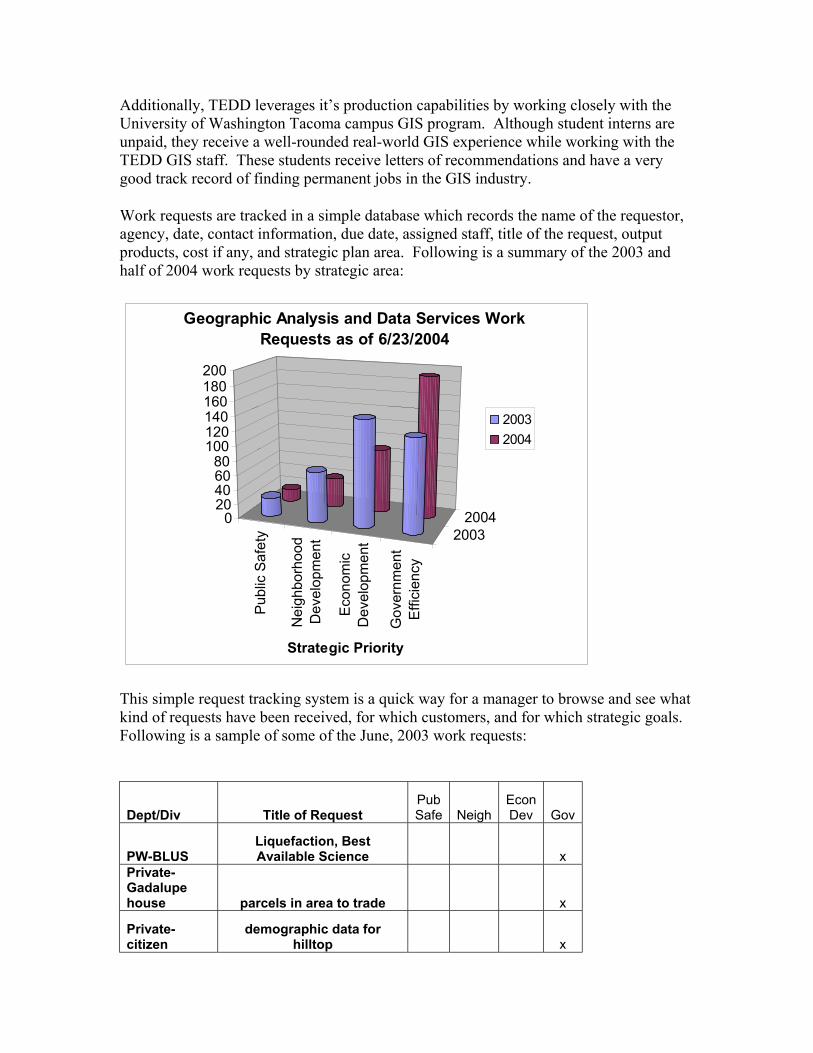
Work requests are tracked in a simple database which records the name of the requestor, agency, date, contact information, due date, assigned staff, title of the request, output products, cost if any, and strategic plan area. Following is a summary of the 2003 and half of 2004 work requests by strategic area:
Publ
ic S
afet
y
Nei
ghbo
rhoo
dD
evel
opm
ent
Econ
omic
Dev
elop
men
t
Gov
ernm
ent
Effic
ienc
y
200320040
20406080
100120140160180200
Strategic Priority
Geographic Analysis and Data Services Work Requests as of 6/23/2004
20032004
This simple request tracking system is a quick way for a manager to browse and see what kind of requests have been received, for which customers, and for which strategic goals. Following is a sample of some of the June, 2003 work requests:
Dept/Div Title of Request Pub Safe Neigh
Econ Dev Gov
PW-BLUS Liquefaction, Best Available Science x
Private-Gadalupe house parcels in area to trade x
Private-citizen
demographic data for hilltop x
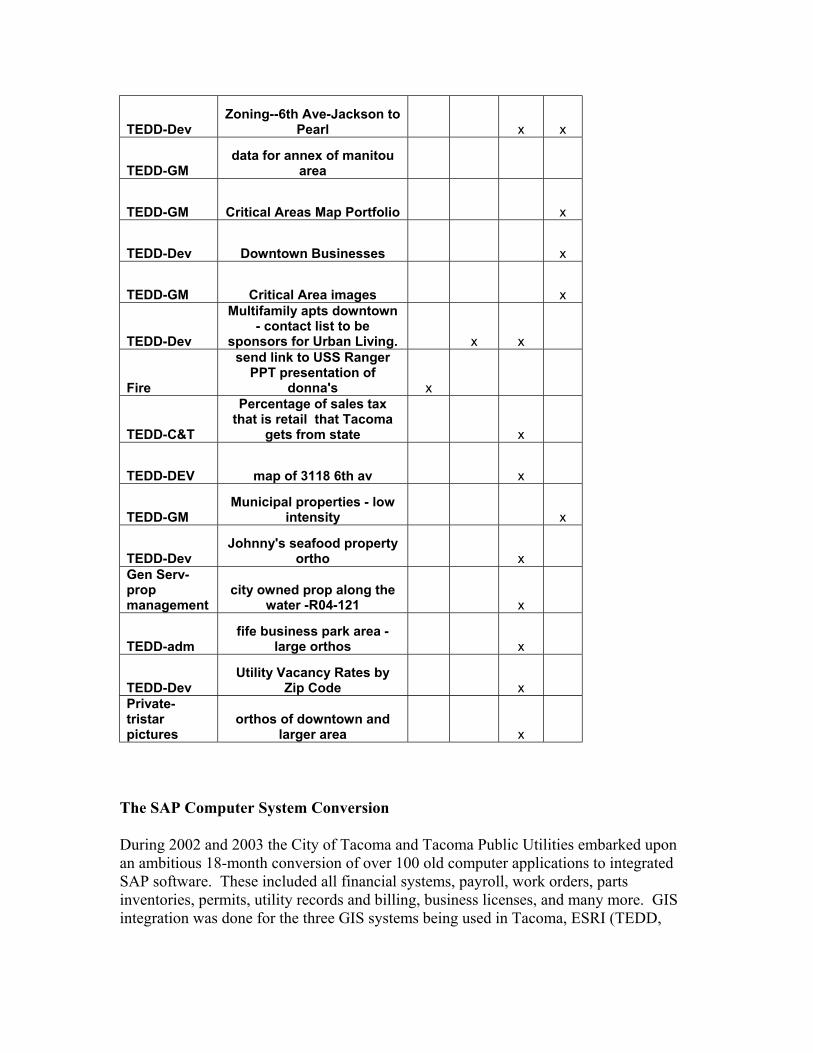
TEDD-Dev Zoning--6th Ave-Jackson to
Pearl x x
TEDD-GM data for annex of manitou
area
TEDD-GM Critical Areas Map Portfolio x
TEDD-Dev Downtown Businesses x
TEDD-GM Critical Area images x
TEDD-Dev
Multifamily apts downtown - contact list to be
sponsors for Urban Living. x x
Fire
send link to USS Ranger PPT presentation of
donna's x
TEDD-C&T
Percentage of sales tax that is retail that Tacoma
gets from state x
TEDD-DEV map of 3118 6th av x
TEDD-GM Municipal properties - low
intensity x
TEDD-Dev Johnny's seafood property
ortho x Gen Serv-prop management
city owned prop along the water -R04-121 x
TEDD-adm fife business park area -
large orthos x
TEDD-Dev Utility Vacancy Rates by
Zip Code x Private-tristar pictures
orthos of downtown and larger area x
The SAP Computer System Conversion
During 2002 and 2003 the City of Tacoma and Tacoma Public Utilities embarked upon an ambitious 18-month conversion of over 100 old computer applications to integrated SAP software. These included all financial systems, payroll, work orders, parts inventories, permits, utility records and billing, business licenses, and many more. GIS integration was done for the three GIS systems being used in Tacoma, ESRI (TEDD,
Fire, and Police), SmallWorld (Tacoma Power), and AutoCAD (Public Works and utilities).
TEDD participated in the GIS integration efforts in several ways. First, a year-long address standardization project created the “Regional Structure” for SAP, a database of addresses analogous to the attributes of a street center line GIS theme. The Regional Structure is used as the standard for address spelling and street ranges throughout all of the modules of SAP. To accomplish this task, street names were first standardized to the post office standards. The GIS street center line file was audited and needed name and range corrections were made. Feedback was sent to the Post Office when street name spelling corrections were needed. A parcel-level zip code map was created to assist in correcting zip codes on the city and county street center line files. Street center line correction feedback was also sent to Pierce County GIS.
Once the above was complete, address scrubbing of 209,000 utility customer addresses could be accomplished using geocoding tools. As a by-product of the scrubbing process, over 6,000 jurisdiction errors for utility customers were detected and corrected before they were loaded into SAP. With non-GIS tools, the utility scrubbing people were resolving only 10 problem addresses a week each.
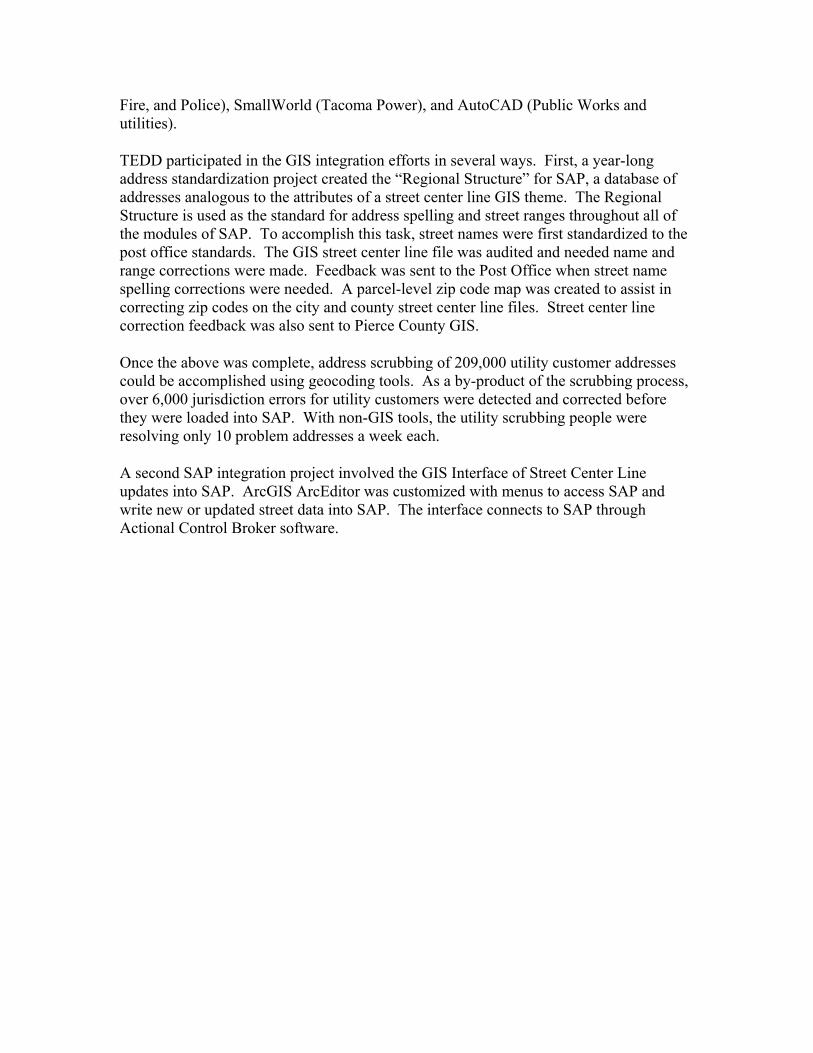
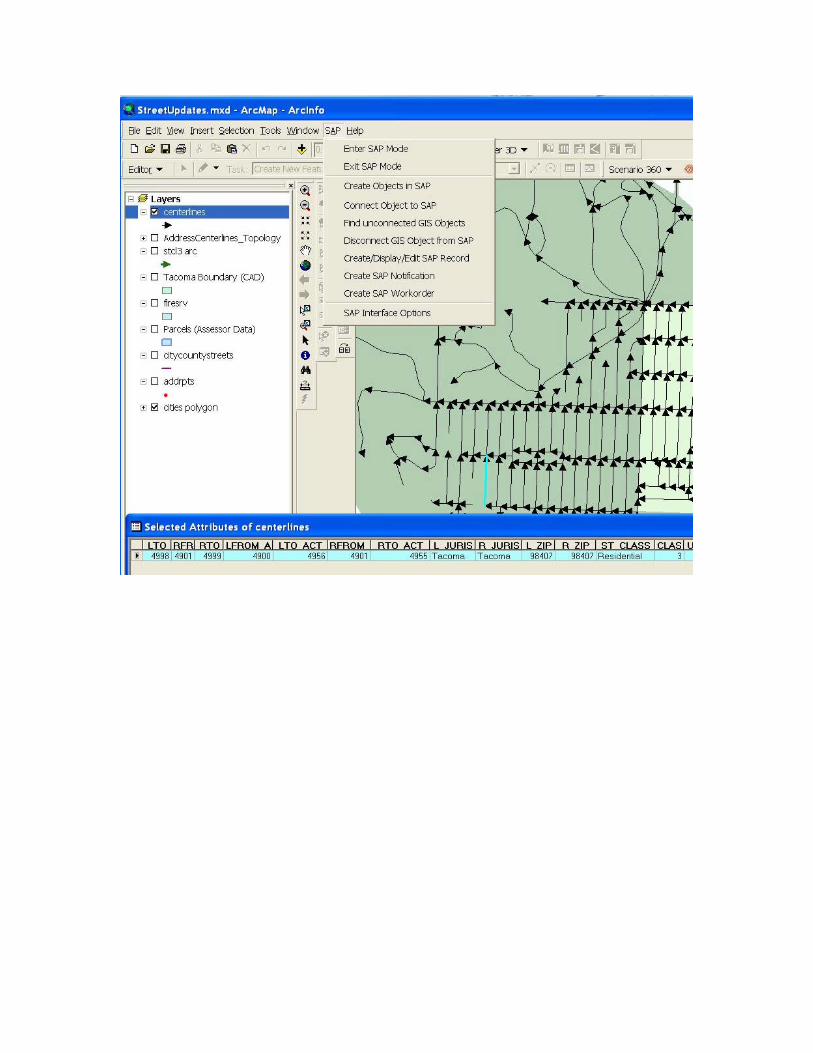
A second SAP integration project involved the GIS Interface of Street Center Line updates into SAP. ArcGIS ArcEditor was customized with menus to access SAP and write new or updated street data into SAP. The interface connects to SAP through Actional Control Broker software.
The third area of SAP integration involves SAP’s measurement module called “Balanced Scorecard.” Intended to easily display high level measures of important business indicators, the Balanced Scorecard is for use by managers to get a pulse of the utility, city, and community. GIS is used to measure changes in permit amount investment, assessed values, and taxes by business district and mixed use center boundaries.
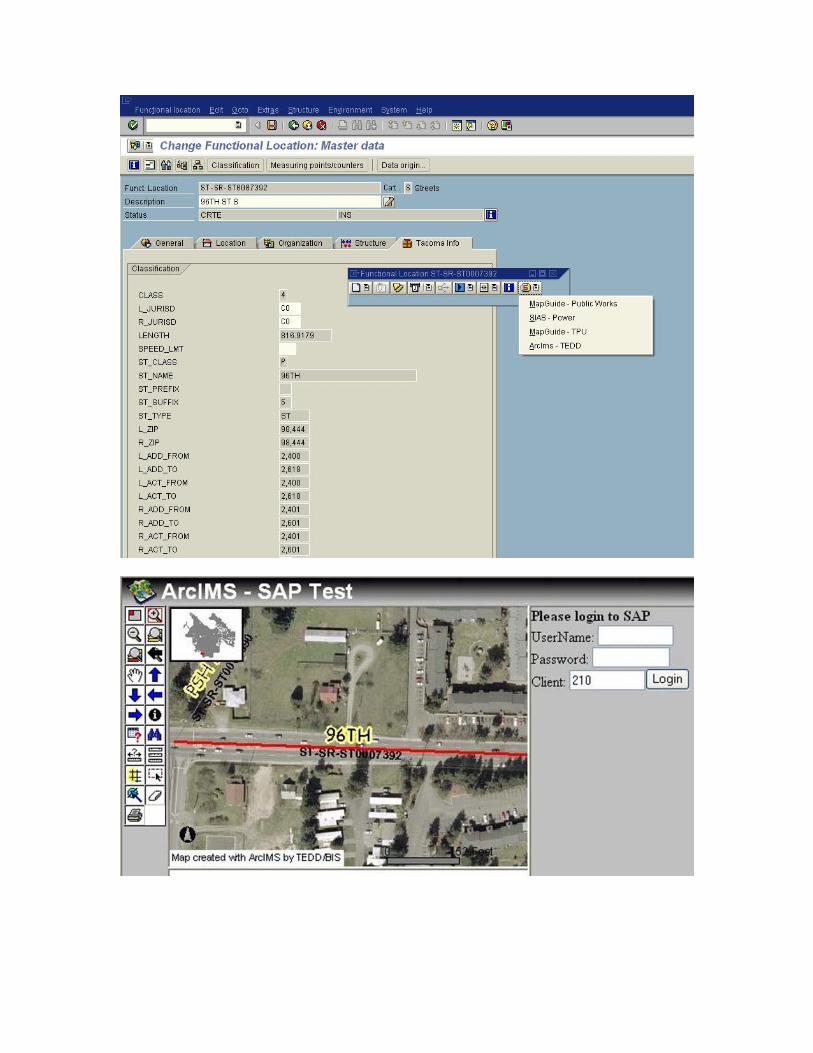
A fourth SAP interface application connected an SAP connection object to ArcIMS, the Internet Map Server which can be used for either Intranet or Internet mapping applications. Starting from SAP, a GIS icon brings up the ArcIMS application for mapping of the connection object. The beauty of this application is that it uses the robust geocoding (address matching and parsing) feature of ArcGIS, making sure that an address in a variety of formats can be easily queried. The map then can display any GIS data, including the proper spelling and format of the connection object address.
3D Visualization From GIS
Thematic maps drawn on paper in two dimensions in color are an important visual aid for public presentations of planning or economic development information. However, not all viewers relate well to maps. An advancement that made a difference for the 2D map viewers was the introduction of aerial digital ortho photos to GIS. More of the viewing audience could understand the maps being displayed. Taking that advancement one step further, the viewing of the ortho photo in 3D over a terrain model creates a map that almost anyone can understand. The latest enhancement to the 3D map includes custom 3D objects of existing and proposed structures for the best possible evaluation of development scenarios.
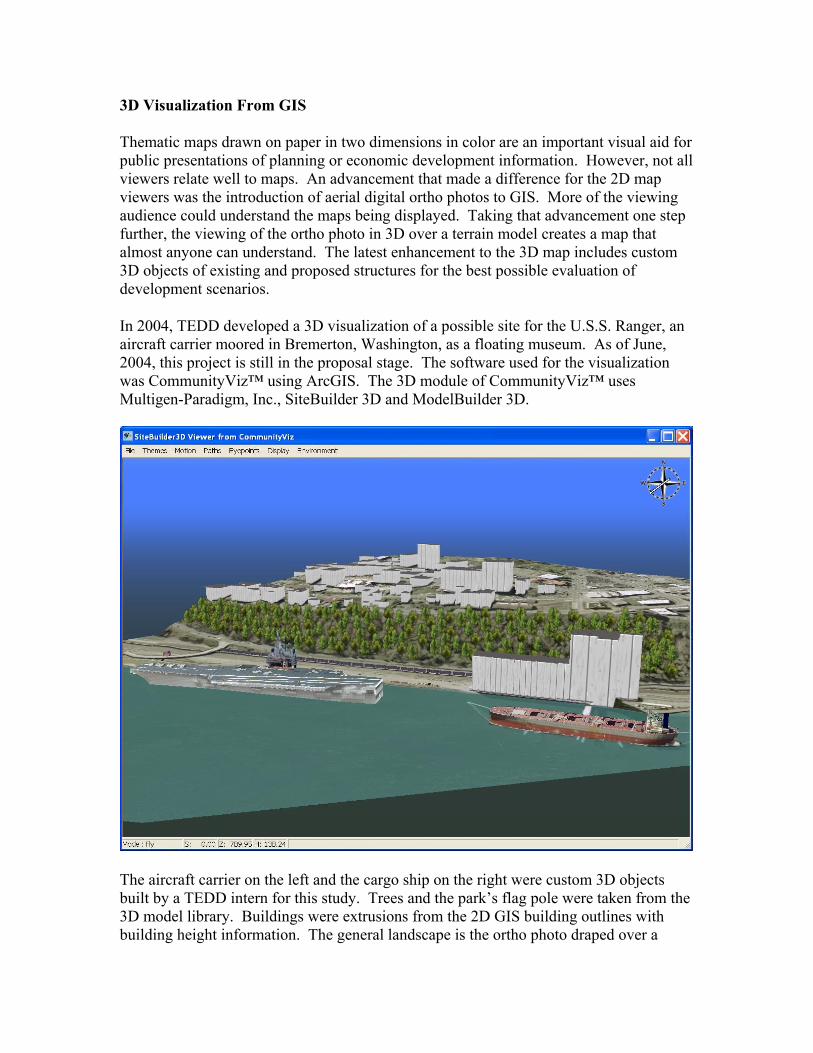
In 2004, TEDD developed a 3D visualization of a possible site for the U.S.S. Ranger, an aircraft carrier moored in Bremerton, Washington, as a floating museum. As of June, 2004, this project is still in the proposal stage. The software used for the visualization was CommunityViz™ using ArcGIS. The 3D module of CommunityViz™ uses Multigen-Paradigm, Inc., SiteBuilder 3D and ModelBuilder 3D.
The aircraft carrier on the left and the cargo ship on the right were custom 3D objects built by a TEDD intern for this study. Trees and the park’s flag pole were taken from the 3D model library. Buildings were extrusions from the 2D GIS building outlines with building height information. The general landscape is the ortho photo draped over a
terrain model created from the 2D GIS contour line layer. A recent software enhancement builds a stand-alone interactive 3D viewer which can be run from a laptop in a public meeting. The capability of manipulating the 3D scene works well when interacting with the meeting participants.
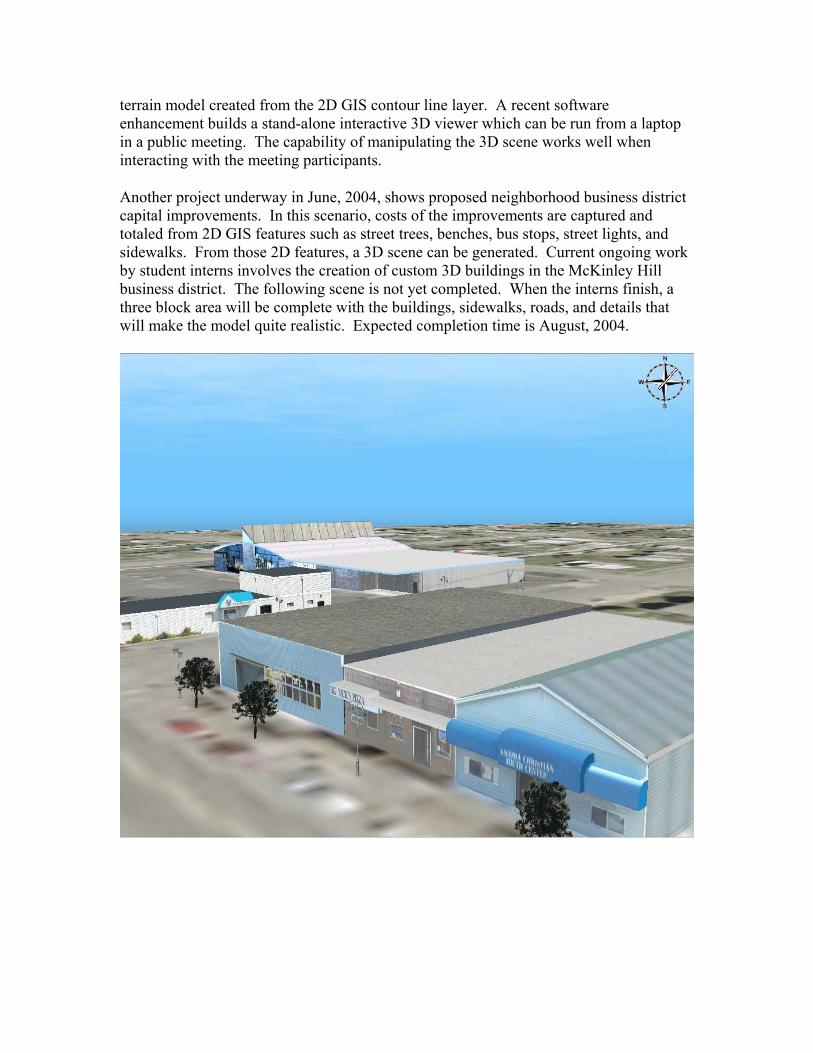
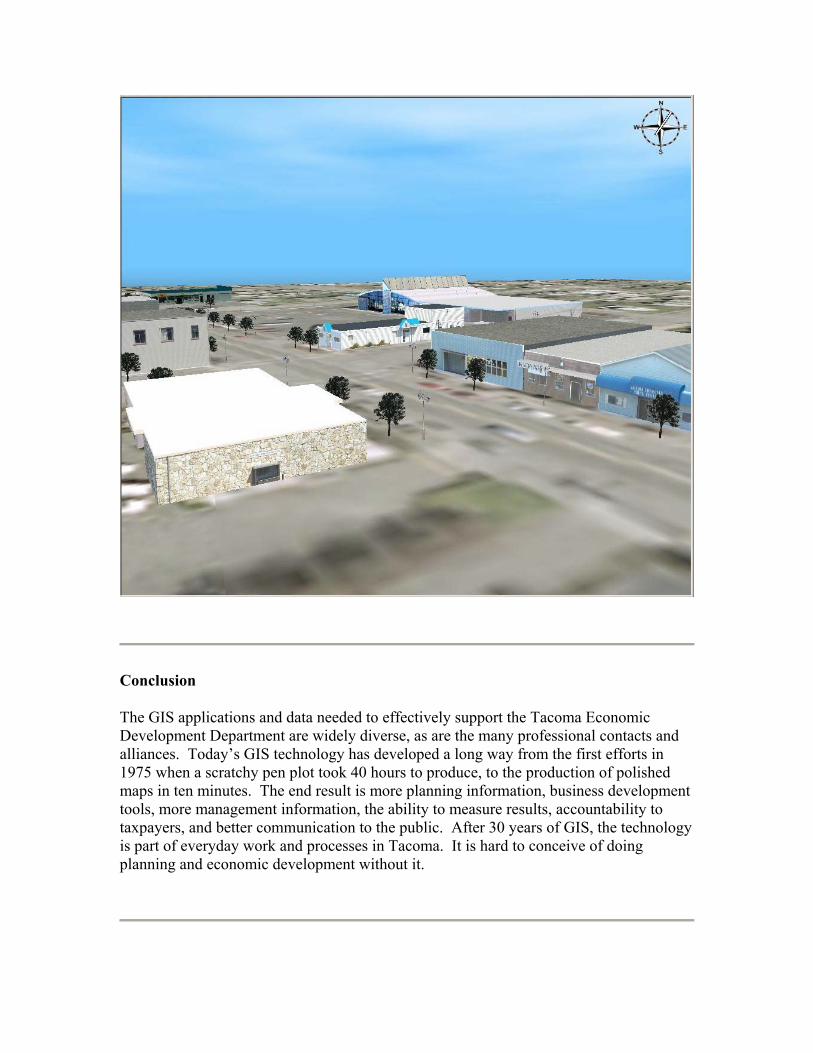
Another project underway in June, 2004, shows proposed neighborhood business district capital improvements. In this scenario, costs of the improvements are captured and totaled from 2D GIS features such as street trees, benches, bus stops, street lights, and sidewalks. From those 2D features, a 3D scene can be generated. Current ongoing work by student interns involves the creation of custom 3D buildings in the McKinley Hill business district. The following scene is not yet completed. When the interns finish, a three block area will be complete with the buildings, sidewalks, roads, and details that will make the model quite realistic. Expected completion time is August, 2004.
Conclusion
The GIS applications and data needed to effectively support the Tacoma Economic Development Department are widely diverse, as are the many professional contacts and alliances. Today’s GIS technology has developed a long way from the first efforts in 1975 when a scratchy pen plot took 40 hours to produce, to the production of polished maps in ten minutes. The end result is more planning information, business development tools, more management information, the ability to measure results, accountability to taxpayers, and better communication to the public. After 30 years of GIS, the technology is part of everyday work and processes in Tacoma. It is hard to conceive of doing planning and economic development without it.
About the Author:
Donna Wendt, Senior Technical GIS Analyst, City of Tacoma, Tacoma Economic Development Department email: [email protected] Address: 747 Market Street, Suite 900 Tacoma, WA 98402 Phone:(253) 591-2052, FAX: (253) 591-5232