Embed Size (px)
Citation preview
TADM Programmer’s Guide
Table of Contents
1 General information ...............................................................................................1
1.1 About this document ..............................................................................................1
1.2 Prerequisite knowledge..........................................................................................1
1.3 Further information.................................................................................................1
2 Installation..............................................................................................................3
3 The TADM Principle ...............................................................................................5
3.1 Introduction ............................................................................................................5
3.2 TADM curves .........................................................................................................6
3.2.1 Technical aspects ..................................................................................................6
3.3 Pipetting errors..................................................................................................... 10
3.3.1 Possible pipetting errors during aspiration............................................................ 10
3.3.2 Possible pipetting errors during dispensing .......................................................... 11
3.3.3 Summary ............................................................................................................. 11
4 Step by step using TADM .................................................................................... 13
4.1 Introduction .......................................................................................................... 13
4.2 Methodology ........................................................................................................ 14
4.3 Recording of pipetting curves............................................................................... 15
4.3.1 Instrument settings............................................................................................... 15
4.3.2 Enabling TADM for the liquid class....................................................................... 16
4.4 Preparing the method........................................................................................... 18
4.5 Analyzing TADM curves....................................................................................... 19
4.5.1 Viewing of TADM Curves ..................................................................................... 19
4.5.2 Characteristics of TADM curves........................................................................... 22
4.6 Defining the TADM Tolerance Band..................................................................... 24
4.6.1 Defining the TADM Tolerance Band for single pipetting ....................................... 24
4.6.2 Defining the TADM Tolerance Band for Dispense on the Fly................................ 26
4.6.3 General rules for defining the TADM Tolerance Band .......................................... 29
4.7 Interpreting the TADM pressure curves................................................................ 30
4.8 Working with TADM ............................................................................................. 30
5 The TADM Tolerance Band Editor ....................................................................... 31
5.1 Overview.............................................................................................................. 31
5.2 Menu details ........................................................................................................ 32
6 Glossary............................................................................................................... 35

TADM Programmer’s Guide

TADM Programmer’s Guide
624031/03 1
1 General informationThis chapter should be read thoroughly before applying the Total Aspiration and DispenseMonitoring (TADM) feature. It contains important information about the use of TADM and thisdocument.
All features described in this document are valid for TADM only. Refer to the correspondingmanuals for programming and operating instruments controlled by the MICROLAB STARLine Software.
The TADM feature 5.1 supports all pipetting channels such as the (old) 300ul channel, the1000ul channel, the 5ml channel and the 96 CO-RE head TADM. The 384 CO-RE head doesnot have individual pressure sensors on each channel and does therefore not support TADM.
1.1 About this document
The TADM Programmer’s Guide shows you step by step how to get more out of your systemby using TADM. When you have worked through this document, you should be able tounderstand the mechanism of TADM, in order to implement and use it in your application.
The TADM Programmer’s Guide is an addendum to the MICROLAB STAR Line manuals. Itprovides a guideline on how to use TADM. As each liquid has its own characteristics, youmay find some deviation from the indications in this document when you define the TADMtolerance bands for your specific application. This is due to the fact that not all variations andliquid-specific characteristics can be considered.
This document is intended to be used with MICROLAB STAR Line software VENUS twobase package 4.3 or above unless stated otherwise.
The manuals for programming and operating MICROLAB STAR Line instruments controlledby the MICROLAB STAR Line software contain mandatory basic information.
1.2 Prerequisite knowledge
In order to be able to use TADM successfully and safely, the programmer must be familiarwith the HAMILTON MICROLAB STAR Line VENUS software, must understand thelaboratory process which is automated, and must have taken appropriate Hamilton-authorized training on a MICROLAB STAR Line instrument.
1.3 Further information
Further information can be found in the MICROLAB STAR Line manuals as well as in theonline help.

TADM Programmer’s Guide
624031/03 2

TADM Programmer’s Guide
624031/03 3
2 Installation1. Insert the VENUS TADM feature software installation disk in the CD or DVD drive. The
installation starts automatically.
2. Follow the instructions of the installation program.
ATTENTION
The installation of the TADM software has to be done after the installation of themain software (the MICROLAB STAR VENUS software).
NOTE
If the installation does not start automatically, start it using the Windows programexecution function (menu “Start”–“Run”).

TADM Programmer’s Guide
624031/03 4

TADM Programmer’s Guide
624031/03 5
3 The TADM Principle
3.1 Introduction
TADM (Total Aspiration and Dispense Monitoring) is a tool to increase the safety and therobustness of pipetting processes. A pressure sensor inside each individual pipetting channelconstantly records the pressure in the system during aspiration and dispensing.
The software generates a pressure / time curve (See Fig. 2) that is different for each liquid(class) and each volume pipetted. The values obtained by the pressure sensor during apipetting step (aspiration or dispensing) can be compared to user-defined values, whichmeans real-time monitoring of the pipetting process.
Generally, TADM is best operated for volumes between 10l and 1000l on 1000l channels(50l - 5000l on 5ml channels) when pipetting serum, plasma, or other water-based liquids.However, depending on the specific requirements of an application, other volumes andliquids may be used as well.
time
pressure
ambient
aspiration dispensing
Fig. 2: Pressure signal over time
Plunger
Barrel
Pressure sensor
Tip
Liquid
Air inside the system
Fig. 1: Air displacement system with pressure sensor for TADM

TADM Programmer’s Guide
624031/03 6
3.2 TADM curves
3.2.1 Technical aspects
Figure 3 and Figure 4 explain in detail how the mechanical movement of the plungerinfluences the flow of liquid inside the tip and the shape of the resulting pressure curve for anaspiration or a dispense step. The lower part of Figure 3 and Figure 4 contain schematicdrawings of the situation within the tip at the start, during, and at the end of the pipetting step(Pi = air pressure inside the tip, Ph = hydrostatic pressure inside the tip, Pa = ambient airpressure).
Pa
Pi
Pi + Ph = Pa (Ph = 0) Pi + Ph < Pa Pi + Ph = Pa
Pi = Pa Pi < Pa - Ph Pi = Pa - Ph
Fig. 3: TADM curves: Aspiration

TADM Programmer’s Guide
624031/03 7
Pa
Pi
Pi + Ph = Pa Pi + Ph > Pa Pi + Ph = Pa (Ph = 0)
Fig. 4: TADM curves: Dispense
Obviously, the TADM feature would not be feasible if the pressure curves obtained wereinstrument-, weather- and altitude-dependent. Therefore, the reference point of the pressurecurve is zeroed automatically by the software before pipetting commands are executed.

TADM Programmer’s Guide
624031/03 8
Figure 5 explains at what time the reference point for the pressure curves is zeroeddepending on whether an aspiration or a dispense step is programmed. This is important toknow if consecutive aspiration or dispensing (aliquoting) steps use the same liquid class andvolume.
Set current ambient pressure valueas reference point
Record pressure valuesduring aspiration
Set current pressureas reference point
Record pressure valuesduring dispensing
Software:Tip Pick up
Instrument:Tip Pick up
Software: Aspirate
Software: Dispense
Software: Tip Eject
Instrument: Tip Eject
Fig. 5: Pressure value adjustments for aspiration and dispense steps
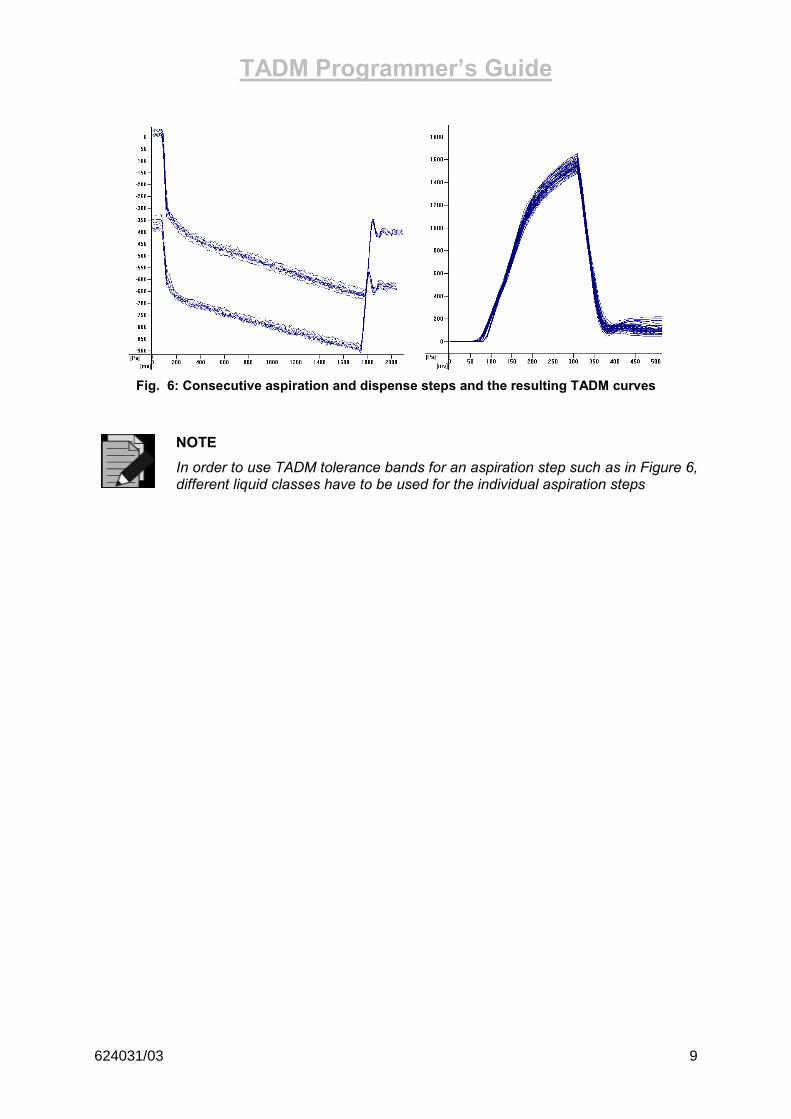
Because the pressure value is not re-zeroed between consecutive aspiration steps, TADMcurves from the different aspiration cycles will be shifted, as can be seen in Figure 6 (left side,2 aspirations of 400l each). In other words, the reference point for the start of an aspirationcurve will always be the pressure value obtained before the tip was picked up. Since thepressure value is re-zeroed between consecutive dispensing steps, curves as seen in Figure6 (right side, dispensing 100 l 8 times) will be obtained, where the curves from allconsecutive dispense cycles are not shifted.
TADM Programmer’s Guide
624031/03 9
Fig. 6: Consecutive aspiration and dispense steps and the resulting TADM curves
NOTE
In order to use TADM tolerance bands for an aspiration step such as in Figure 6,different liquid classes have to be used for the individual aspiration steps

TADM Programmer’s Guide
624031/03 10
3.3 Pipetting errors
By examining the TADM curves of many aspiration or dispense steps, it becomes apparentthat curves obtained from a normal, error-free pipetting step are distinctively different fromcurves from erroneous pipetting steps. These differences are quite obvious and can be usedto distinguish between correct and erroneous pipetting steps.
The following two figures show the different types of TADM curves that can be obtainedduring aspiration and dispense steps respectively. Basically, there are two different types ofscenarios that can be detected:
- Pressure above normal
- Pressure below normal
The type of pipetting step (aspiration or dispensing) influences what kind of scenario aspecific error produces. For example, a blocked tip will produce pressure below normalduring aspiration and pressure above normal during dispensing, while a short sample willproduce pressure above normal during aspiration and pressure below normal duringdispensing.
NOTE
The vast majority of pipetting errors will be detected during the aspiration step.Foam can behave rather unpredictably and can produce pressure above as wellas pressure below normal errors during aspiration and / or dispensing”).
3.3.1 Possible pipetting errors during aspiration
time
pressure
Not enough liquid
FoamNormal curve
Tip blocked (Clot)
Fig. 7: Typical TADM curves for correct and erroneous aspiration steps
A pressure value below the normal, error-free aspiration curve means that the pressuredecreases because as the plunger continues to move inside the channel, the liquid levelinside the tip does not. A pressure signal above the error-free curve signifies that as the

TADM Programmer’s Guide
624031/03 11
plunger moves inside the channel, the liquid that enters the tip has less resitance than thereference liquid.
3.3.2 Possible pipetting errors during dispensing
Tip blocked (Clot)
Normal curve
Foam
Not enough liquid
pressure
time
Fig. 8: Typical TADM curves for correct and erroneous dispensing steps
A pressure value above the error-free dispensing curve means that the pressure increasesbecause as the plunger continues to move inside the channel, the liquid level inside the tipdoes not. A pressure signal below the error-free curve signifies that as the plunger pushesthe air inside the channel, the liquid that leaves the tip has less resitance than the referenceliquid.
3.3.3 Summary
Below is a summary table showing the correlation between pipetting errors and the resultingpressure curves during either aspiration or dispensing.
Pipetting step Error type Pressure curve
clot detected pressure below normal
no or short sample pressure above normal
foam ‘zig-zag’behavior, pressure above/below normalaspiration
leaky system pressure above normal
blocked tip pressure above normal
not enough liquid retarded rise in pressure, pressure below normal
foam ‘zig-zag’behavior, pressure above/below normaldispensing
leaky system pressure below normal

TADM Programmer’s Guide
624031/03 12

TADM Programmer’s Guide
624031/03 13
4 Step by step using TADM
4.1 Introduction
The TADM principle can be used in two different ways:
1) Recording mode: The pressure inside the pipetting channel is recorded only.
2) Monitoring mode: The pressure inside the pipetting channel is constantly recordedand compared to a predefined tolerance value. If the measured value exceeds thetolerance, the plunger movement stops immediately and the software-dependenterror handling is executed.
However, special attention has to be paid to a number of settings that can influence theeffectiveness and behavior of TADM (see Figure 9 below).
Only error curves are storedNo curves are stored All curves are storedMethod will be abortedRecording of pressure values onlyNo recording of pressure values
Liquid Class:TADM enabledno
TADM mode
yes
Recording
Tolerance band set
Monitoring
no
error curves only
TADM Upload mode
yes
none all curves
START
Fig. 9: TADM settings and modes
ATTENTION
If TADM is not enabled for the liquid class, no TADM monitoring will take placefor this liquid class even if the TADM mode is set to monitoring.
If a tolerance band has not been defined for a specific volume used duringpipetting in TADM monitoring mode, the run will be aborted.
NOTE
The temperature of the liquid can have a significant influence on the pressurecurve. It is mandatory that the liquid used for recording the reference pressurecurves have the same temperature as the liquid used during routine work.

TADM Programmer’s Guide
624031/03 14
4.2 Methodology
In order to increase the safety and robustness of the pipetting process, the followingguidelines have to be followed for setting TADM tolerance bands.
1) Define the pipetting strategy
Although setting the TADM tolerance bands is the last stage of applicationdevelopment, the liquid handling process must be defined as early as possible duringdevelopment, because the implementation of liquid handling in the application mayhave a huge impact on the method programming.
2) Set up a robust process
Before the TADM tolerance bands for a specific liquid and volume can be set, aprecise and robust pipetting process has to be established. This involves the liquidclass (accuracy and precision according to requirements) and the pipetting strategy(surface or jet mode, etc.) itself.
3) Get TADM data
After the pipetting process has been established, a minimum of 20 curves perchannel should be recorded in TADM recording mode in order to collect a significantnumber of data points. These sample curves provide the basis for setting the TADMtolerance bands –therefore the samples used should be checked carefully for theabsence of clots, foam, etc.
4) Set tolerance bands
After the standard curves have been recorded, the TADM tolerance bands must beset (see Chapter 4.6).
5) Check settings with ’bad’samples
In order to check whether the TADM tolerance bands provide a safe and robustprocess, a run using stressed samples (foam, clots, etc.) must be performed in TADMmonitoring mode.
6) Perform periodic checks
It is recommended that you verify the usefulness of the TADM tolerance bands inroutine operation (about every 3 to 6 months), especially if a lot of pipetting errorsoccur. This can be a sign that the TADM tolerance bands are set too narrow or areinadequate.

TADM Programmer’s Guide
624031/03 15
4.3 Recording of pipetting curves
4.3.1 Instrument settings
During the development and testing phase, the instrument should be set to “TADM recordingmode”. This has to be set in the System Configuration Editor, which can be found under the"Tools" menu from the Method Editor.
The settings for the TADM modes / TADM Upload Modes can be set individually for everypipetting device such as 1000ul channels, 5ml channels and the CO-RE 96 Head.
Fig. 10: System Configuration Editor: TADM settings
Select your instrument (STAR, STARlet, STARplus) in the left of the window, and then scrolldown the right side of the window to the entry "TADM settings". Change "TADM Mode" to"Recording" for the desired pipetting devices. Close the System Configuration Editor andsave the changes.
Refer to figure 9 for an explanation of the different settings.

TADM Programmer’s Guide
624031/03 16
4.3.2 Enabling TADM for the liquid class
To use the TADM feature, the used liquid classes have to be prepared for that. In order to dothis, start the Liquid Editor. The "Liquid Classes" window lists all liquid classes available andalso shows whether TADM is enabled or disabled for a specific liquid class.
NOTE
All predefined liquid classes supplied by HAMILTON with the installation of thesoftware have TADM disabled and are write-protected.
To have the TADM feature enabled, copy the desired predefined liquid classand then enable the TADM feature
Select the desired predefined liquid class you want to copy and click the right mouse button.Click on ‘Create’
Fig. 11: Copying a predefined liquid class for TADM use
A dialog box opens to let you enter the name of the liquids class’copy:
Fig. 12: Entering a name for the liquid class for TADM use
TADM Programmer’s Guide
624031/03 17
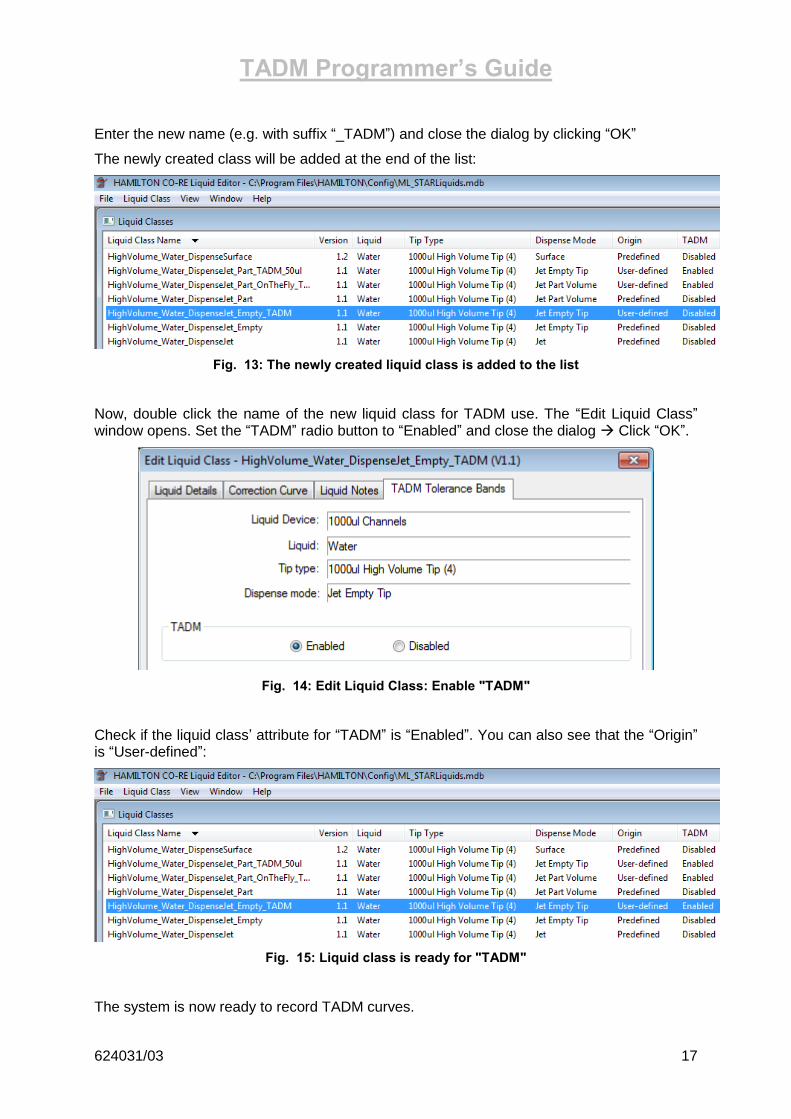
Enter the new name (e.g. with suffix “_TADM”) and close the dialog by clicking “OK”
The newly created class will be added at the end of the list:
Fig. 13: The newly created liquid class is added to the list
Now, double click the name of the new liquid class for TADM use. The “Edit Liquid Class”window opens. Set the “TADM”radio button to “Enabled”and close the dialog Click “OK”.
Fig. 14: Edit Liquid Class: Enable "TADM"
Check if the liquid class’attribute for “TADM”is “Enabled”. You can also see that the “Origin”is “User-defined”:
Fig. 15: Liquid class is ready for "TADM"
The system is now ready to record TADM curves.

TADM Programmer’s Guide
624031/03 18
NOTE
The TADM feature 5.1 supports all pipetting channels such as the (old) 300ulchannel, the 1000ul channel, the 5ml channel and the CO-RE 96 Head TADM.
The CO-RE head 384 does not have individual pressure sensors on eachchannel and does therefore not support TADM.
Use the Liquid device selection to make sure the liquid class supports the correct device:
Fig. 16: Liquid device selection
4.4 Preparing the method
In order to record the reference pressure curves for setting the TADM tolerance bands, theapplication must have an established pipetting strategy that is both robust and precise. If themethod is very large or time consuming to run, smaller methods can be prepared that containthe same pipetting steps like the original method. Original liquids and labware have to beused, and special care has to be taken to make sure that no pipetting errors occur.
TADM Programmer’s Guide
624031/03 19
4.5 Analyzing TADM curves
All pipetting steps of a run are traced and the relevant information like liquid class, pipettingmode (aspiration/dispensing, volume, channel number) is written into a single database.
4.5.1 Viewing of TADM Curves
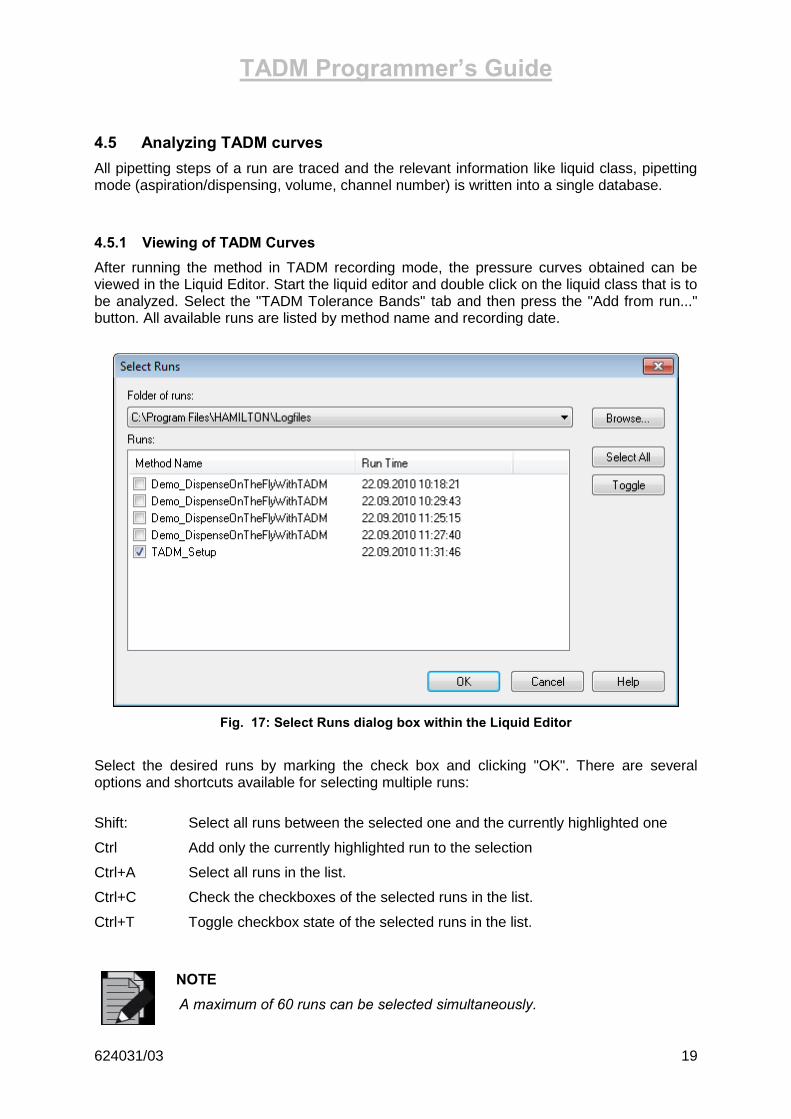
After running the method in TADM recording mode, the pressure curves obtained can beviewed in the Liquid Editor. Start the liquid editor and double click on the liquid class that is tobe analyzed. Select the "TADM Tolerance Bands" tab and then press the "Add from run..."button. All available runs are listed by method name and recording date.
Fig. 17: Select Runs dialog box within the Liquid Editor
Select the desired runs by marking the check box and clicking "OK". There are severaloptions and shortcuts available for selecting multiple runs:
Shift: Select all runs between the selected one and the currently highlighted one
Ctrl Add only the currently highlighted run to the selection
Ctrl+A Select all runs in the list.
Ctrl+C Check the checkboxes of the selected runs in the list.
Ctrl+T Toggle checkbox state of the selected runs in the list.
NOTE
A maximum of 60 runs can be selected simultaneously.

TADM Programmer’s Guide
624031/03 20
After pressing "OK", the selected runs will be searched for the specified liquid class and allaspiration and dispense volumes used will be listed (Figure 18).
Fig. 18: Select a pipetting step to "Open..." the TADM Tolerance Band Editor

TADM Programmer’s Guide
624031/03 21
Selecting a single pipetting step will enable the button "Open...". Double-clicking on apipetting step, or pressing this button, will open the “TADM Tolerance Band Editor”window(for a detailed account of the editor see chapter 5):
Fig. 19: The TADM Tolerance Band Editor
The title bar shows the selected liquid class, the volume and the pipetting mode. The windowitself is divided into two frames. The right-hand one shows all curves for the selected volumeand pipetting mode; the left-hand part of the window contains detailed information about theindividual curves (pipetting time, channel number, TADM mode, etc).
The values are displayed as pressure [Pascal] over time [milliseconds] curves.

TADM Programmer’s Guide
624031/03 22
4.5.2 Characteristics of TADM curves
TADM allows the analysis of pipetting steps and the resulting pressure curves in a qualitativeway. It can therefore be a very helpful tool to optimize liquid handling.
Fig. 20a: Uncorrected Aspiration Fig. 20b: Optimized Aspiration
The peaks and the fraying of curves observed in Figure 20a (left picture) can be an indicationthat the liquid class and / or the pipetting steps are not defined in an optimal and robust way,but they can also be characteristic of the liquid used. In the example shown above, thepipetting process was not optimized. An adjustment of the pipetting parameters in thepipetting process resulted in the curves shown in Figure 20b (right picture).
fraying
peaks

TADM Programmer’s Guide
624031/03 23
The following example shows typical curves for jet dispense steps.
Fig. 21: Dispensing process
The peak seen in the curves at 100ms in Figure 21 is typical for a dispense step and is notnecessarily the result of sub-optimal settings. It actually reflects the dispensing of thetransport air and the moment the liquid starts to leave the tip. The same holds true for theapparent fraying of the TADM curves at the end of the dispense step, which is the result ofthe blow-out volume and the resulting pressure inside the system.
NOTE
A narrow bundle of curves is not an indication that the pipetting process isprecise and robust. Moreover, a precise and robust pipetting process does notguarantee closely bundled pressure curves.
TADM curves such as in Figure 20a can be - but do not have to be - anindication that the pipetting process is not robust and precise.
peaks
fraying

TADM Programmer’s Guide
624031/03 24
4.6 Defining the TADM Tolerance Band
4.6.1 Defining the TADM Tolerance Band for single pipetting
Load a set of TADM curves into the TADM Tolerance Band Editor as shown in Figure 20.
- Choose Add Upper Limit Curve Points from the Edit menu or click on the icon
Fig. 22: Upper Limit Curve tolerance band
- It is recommended that you set the first curve point between the 0 and 100 Pascalvalue (Figure 22). A higher value may be required if wet tips are used for theaspiration (Figure 23). Place the next curve points where the TADM curves changedirections. Special attention should be paid to the tolerance band at the beginningand the end of the pipetting step. Here, the tolerance band should follow the actualpressure curve rather closely, while the distance between curves and toleranceband should be wider during the remaining phase of the pipetting step.
Fig. 23: TADM tolerance bands for an aspiration step
TADM Programmer’s Guide
624031/03 25
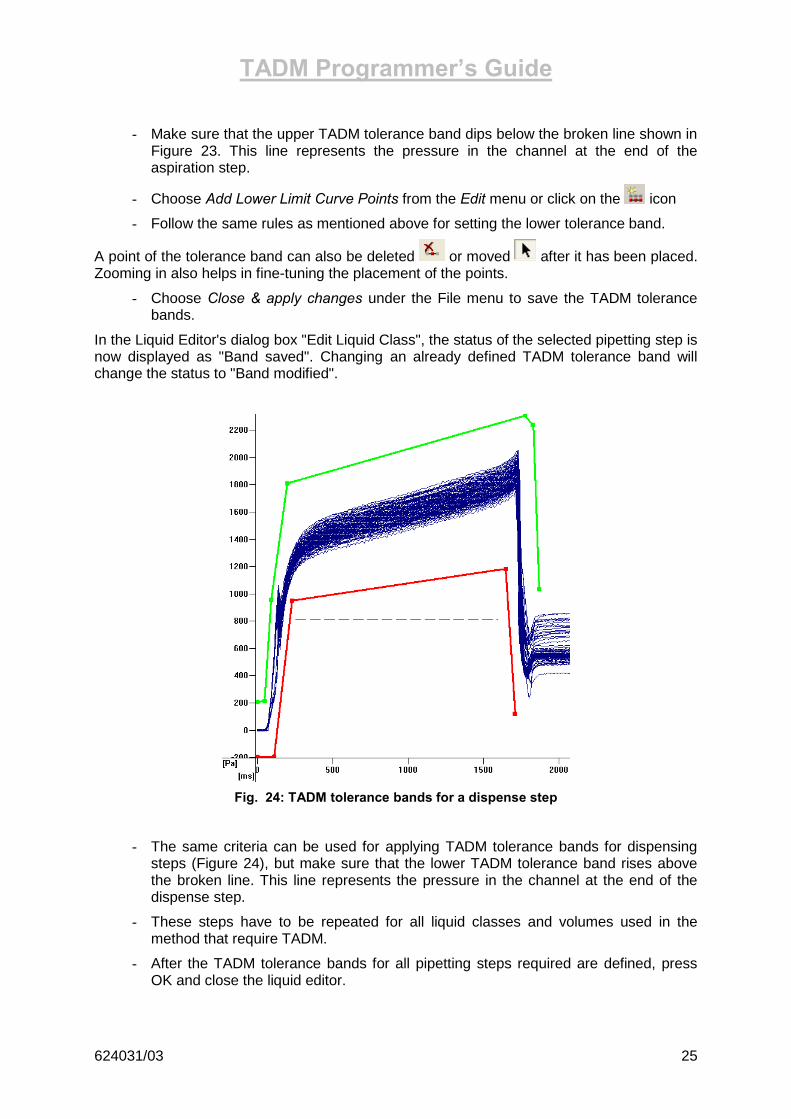
- Make sure that the upper TADM tolerance band dips below the broken line shown inFigure 23. This line represents the pressure in the channel at the end of theaspiration step.
- Choose Add Lower Limit Curve Points from the Edit menu or click on the icon
- Follow the same rules as mentioned above for setting the lower tolerance band.
A point of the tolerance band can also be deleted or moved after it has been placed.Zooming in also helps in fine-tuning the placement of the points.
- Choose Close & apply changes under the File menu to save the TADM tolerancebands.
In the Liquid Editor's dialog box "Edit Liquid Class", the status of the selected pipetting step isnow displayed as "Band saved". Changing an already defined TADM tolerance band willchange the status to "Band modified".
Fig. 24: TADM tolerance bands for a dispense step
- The same criteria can be used for applying TADM tolerance bands for dispensingsteps (Figure 24), but make sure that the lower TADM tolerance band rises abovethe broken line. This line represents the pressure in the channel at the end of thedispense step.
- These steps have to be repeated for all liquid classes and volumes used in themethod that require TADM.
- After the TADM tolerance bands for all pipetting steps required are defined, pressOK and close the liquid editor.

TADM Programmer’s Guide
624031/03 26
4.6.2 Defining the TADM Tolerance Band for Dispense on the Fly
A special pipetting mode is used in the function DispenseOnTheFly. This step does performa serial dispense of part volumes without stopping the movement in the X-direction.
From this pipetting mode, a different pressure curve results. Please see below the 12 peaksin the dispense curve, representing the on-the-fly-pipetting of 50ul per well with one channelover the row A (A1 –A12) in a 96 well plate.
Fig. 25: Pressure curve for a dispense on the fly step
TADM Programmer’s Guide
624031/03 27
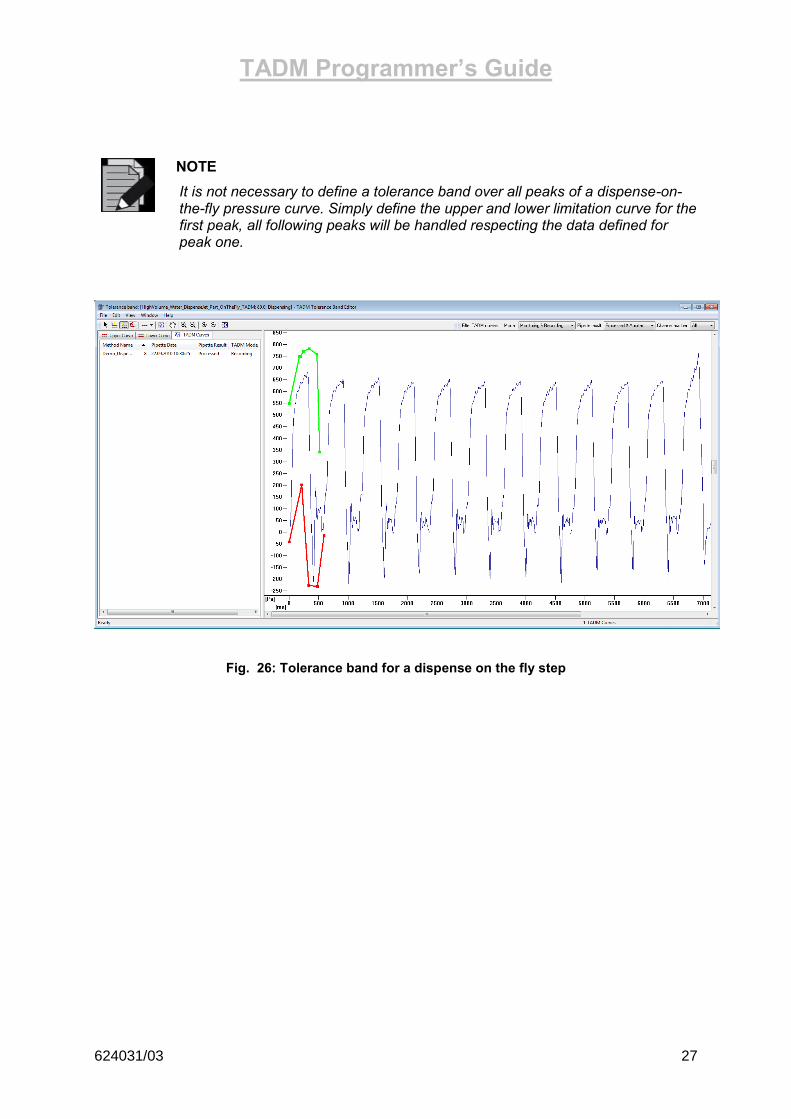
NOTE
It is not necessary to define a tolerance band over all peaks of a dispense-on-the-fly pressure curve. Simply define the upper and lower limitation curve for thefirst peak, all following peaks will be handled respecting the data defined forpeak one.
Fig. 26: Tolerance band for a dispense on the fly step

TADM Programmer’s Guide
624031/03 28
NOTE
Please make sure the defined upper and lower limitation curve respects thehighest peak and the lowest source in the whole curve, although it is definedonly for the first peak.
Refer to Figure 27, where the highest peak is at the end of the 12 shots.
Fig. 27: Respect the highest/lowest pressure point for the tolerance band

TADM Programmer’s Guide
624031/03 29
4.6.3 General rules for defining the TADM Tolerance Band
Distance between pressure curve and upper/lower limitation curveTake care not to set the TADM tolerance bands too close to the actual TADM curves as seenin Figure 28. While this ensures a safe pipetting process, many TADM errors will occurduring pipetting that will result in an unrobust process. This is due to minor variations in thesample liquid (e.g.serum) and the resulting widening of the TADM curve bundle as more andmore samples are pipetted (See Figure 29).
Fig. 28: Inadequate TADM tolerance bands: Bands are set too narrow
End position of the upper/lower limitation curveThe TADM tolerance bands should stop as soon as the pipetting step ends and must notextend further than the actual TADM curves (as seen in Fig 27).
Fig. 29: Inadequate TADM tolerance bands: Bands are much longer than curve
TADM Programmer’s Guide
624031/03 30
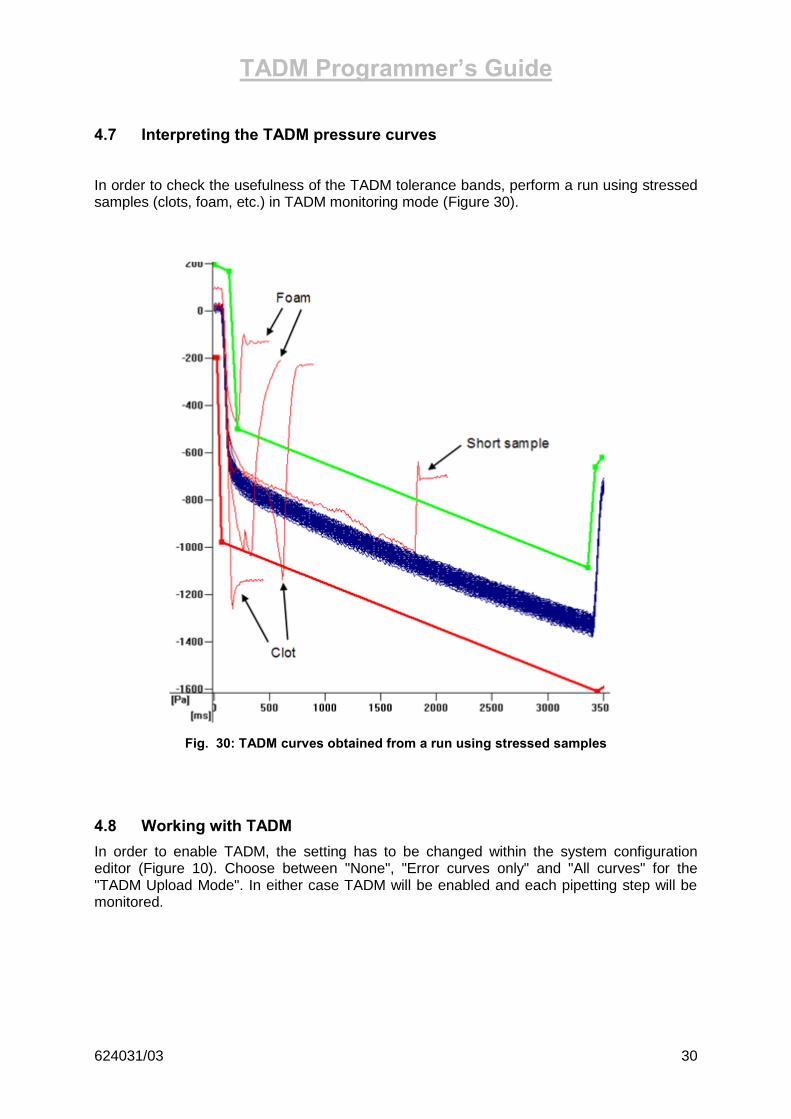
4.7 Interpreting the TADM pressure curves
In order to check the usefulness of the TADM tolerance bands, perform a run using stressedsamples (clots, foam, etc.) in TADM monitoring mode (Figure 30).
Fig. 30: TADM curves obtained from a run using stressed samples
4.8 Working with TADM
In order to enable TADM, the setting has to be changed within the system configurationeditor (Figure 10). Choose between "None", "Error curves only" and "All curves" for the"TADM Upload Mode". In either case TADM will be enabled and each pipetting step will bemonitored.

TADM Programmer’s Guide
624031/03 31
5 The TADM Tolerance Band Editor
5.1 Overview
The TADM Tolerance Band Editor consists of several parts, as shown in its main window.
Fig. 31: TADM Tolerance Band Editor main window
Menu toolbar TADM window
Filter TADM Curves toolbar Plotting area
The TADM window consists of three tabs (Upper Curve, Lower Curve, TADM Curves). Thefirst two tabs contain the coordinates for the points of the upper and lower tolerance bandsrespectively. The third tab lists the properties of the displayed TADM curves. The followingproperties can be viewed: the method name of the run where the TADM curve was recorded,the channel number, pipette date, pipette result (processed/aborted), TADM mode(Recording/Monitoring), and the Curve ID. TADM curves of aborted pipetting steps aredisplayed in red in the plotting area, while successfully processed ones are displayed in darkblue.
NOTE
The Pipette result “Aborted”can only occur if the run was performed inMonitoring mode.

TADM Programmer’s Guide
624031/03 32
Analyzing a large number of TADM curves in an efficient way can be achieved by using thefunctions available in the “Filter TADM curves”toolbar:
- choose between curves obtained during either recording mode, monitoring mode or both.
- choose between processed, aborted, or all curves obtained
- choose whether curves from all channels or just a specific channel should be displayed.
Obviously, it makes sense to combine these options to limit the number of curves that haveto be analyzed –for example: display all curves that were aborted (in monitoring mode) usingchannel number 5.
5.2 Menu details
Below is an overview of all available menus with their options and the corresponding toolbaricons:
File Description
Close & Apply Changes
Changes made to the tolerance band(upper and lower limit curves) will besaved and the Tolerance Band Editorwill be closed.
Close & Cancel Changes
Tolerance band changes will be ignoredand the Tolerance Band Editor will beclosed. If any changes were made, acue appears to discard all changes.

TADM Programmer’s Guide
624031/03 33
Edit Description
Cut Ctrl+X
Copy Ctrl+C
Paste Ctrl+V
Delete Del
These options apply to individualtolerance band points, and are onlyactive when either the “Upper curve”or“Lower curve”tab is selected.
Select When activated, tolerance band pointsor TADM curves are selectable byclicking on them in the plotting area
Add Upper Limit Curve Points
Add Lower Limit Curve Points
When activated, clicking in the plottingarea adds an upper/lower toleranceband point
Delete Limit Curve Points When this is activated, clicking on atolerance band point deletes it
Delete Limit Curve Point Del Deletes a single selected tolerance bandpoint
Exclude TADM Curve Ctrl+E A selected TADM curve will be excluded(not shown, and not used for guidancecurves).

TADM Programmer’s Guide
624031/03 34
View Description
Hand Tool Ctrl+H Move plotting area.
Zoom In Tool Ctrl+Shift+I
Zoom Out Tool Ctrl+Shift+O
Zoom In Ctrl+I
Zoom Out Ctrl+O
Zoom into or out of plotting area asdesired.
Fit To Window Ctrl+F Fit all curves to window.
Guidance Curves Display guidance curves.
Excluded TADM Curves Display excluded TADM curves asdashed lines.
TADM Curves... Add or remove TADM curves.
Guidance Curves Formula... Edit guidance curve parameters.
Line Size Change size of selected, guidance andlimit curves
Refresh F5 Refresh plotting area.
Click "Help" in the dialog box of menu item "Guidance Curves Formula..." for the formulabehind the guidance curves.
Window Description
Upper Limit Curves Ctrl+U
Lower Limit Curves Ctrl+L
Display upper or lower limit curve pointsas desired.
TADM Curve Properties Ctrl+T Display TADM curve properties on leftside of window.
Help Description
Help Topics View the online help.

TADM Programmer’s Guide
624031/03 35
6 Glossary
Term Definition
ADC Anti Droplet Control to prevent drops while pipetting highly volatilesolvents.
Adjustment Detailed positional setting for the hardware.
Air displacement tip Hamilton CO-RE disposable tip
Aliquot Aliquots are identical small volumes of liquid.
Aspirate Procedure to draw up liquid into a pipetting device.
Autoload Hardware assembly that enables automatic loading of the ML STAR.It consists of a loading head movable in Y direction, which draws thecarriers into the MICROLABSTAR and can read the barcodes onthem.
AutoLoad tray Hardware unit. The carriers can be placed on it and held outside theML STAR. The loading tray is attached to the ML STAR, to supportthe automatic loading and unloading process.
Barcode Mask The barcode mask defines the basic structure of a barcode. It is apattern to which a barcode must conform. The assignment of aspecific Labware item can be done in this manner. The barcode maskcan require a barcode to contain specific strings at fixed positions. Itcan also contain wildcards.
Barcode Reader Device for reading sample/plate Barcodes. Part of the AutoloadOption.
Carrier Unit for loading plates, tubes and tips on the ML STAR Line deck.Loading process is carried out by the autoload unit.
Container A container defines a tube, vessel or a single well of a plate.
Containeridentification
Barcode for the identification of a container. Servers for a uniqueidentification of a vessel, e.g. a sample test tube.
Deck The work surface of the ML STAR. It presents at the same time thegreatest possicle area, cf. Work Area. The deck is divided into tracks.Carrier placement is defined by the tracks, as long as they are in theoperating range of the pipetting area.
Deck Layout A collection of labware placed upon a deck.
Dispense To distribute quantities of liquid from a pipetting device.

TADM Programmer’s Guide
624031/03 36
Term Definition
Docking station The long bar at the back of the ML STAR instrument for guiding thecables and the tubing for accessories.
Firmware Lower Level program code that is carried out on the processors of theML STAR Instrument
Front Cover Protective covering for the ML STAR Instrument, featuring a hingedfront window made of transparent Plexiglas. With this option andassembly, the work surface of the ML STAR is covered in such a waythat it is shielded from user intervention and other outside influences(such as dust). At the same time, it protects the user from themovements of the ML STAR.
Hardware Error Type of error that is caused by a technical problem with the hardware
HSL Hamilton Standard Language
HHS Hamilton Heater Shaker. Unit to heat of shake microplates in SBSformat.
HSB Heater Shaker Box. Interface unit which is needed if more than twoHHS are being used.
Instrument Hardware of the ML STAR (mechanics, electronics, and firmware)
Instrument steps The commands made available by the firmware for controlling the MLSTAR.
Labware Refers to movable items to be placed on the ML STAR deck, such ascarriers, containers, or racks.
LIMS Higher level data processing system, generally known as LaboratoryInformation Management System, also LMS.
Liquid Includes all kinds of liquids, among which are included reagents,controls, standards, wash fluids.
LLD (Liquid LevelDetection)
Detection of liquid surface which may be achieved either by pressureor capacitive signal detection.
Loading/unloading The process by which plate, tube and tip carriers are brought on andoff the ML STAR deck. This is automatically performed via autoloadunit.
MAD (Monitored AirDisplacement)
Aspiration monitoring Feature. During the aspiration process, thepressure within the pipetting channel is measured in real time.
Method The method contains all instruction that must be executed during arun.
ML STAR Software Software to run the ML STAR.

TADM Programmer’s Guide
624031/03 37
Term Definition
MTP (Microtiterplate)
In general, a microtiter plate is assumed to have 96 wells (8 x 12)9mm wide. There are also plates with 384 wells (16 x 24 / 4.5 mm), orothers with a different size
Pause Interruption of processing. The current processing steps arecompleted.
Pipetting Transfer of liquids from one container to another.
Pipetting arm Assembly equipped with the pipetting device and/or plate handler.
Pipetting channel Hardware including the function of picking up a tip aspirating,dispensing, tip eject, liquid level detection and the Y/Z-movements
Pooling Pipetting of different liquids in one well; 1, 2, 3…to n and n to 1, 2, 3...
Processing Step Defines what must be carried out on the ML STAR instrument, as wellas the location it must be carried out and possible interaction withother system components or labware. The action is defined inaccordance with the methods, the loading and the tasks.
Rack Group of containers, as DWP, MTP, etc.
Rack identification Barcode for rack identification
Random access Means that every channel can access any position anywhere on thework area.
Run Execution of the processing steps defined in the method with the aimof processing one or more liquids and containers (e.g. MTP). The runis a series of timed commands, in order to carry out processing on theML STAR according to the processing plan.
Run abort Cancelled run by the user or by the ML STAR
Run visualization Visualization of the current run, reporting the status of the ML STAR.
Sample Refers to a liquid in a unique identified container which is to beprocessed.
Stacker Storage unit for racks
Side Touch Pipetting on the wall of a container of it’s center to prevent droplets.
TADM Total Aspiration and dispense monitoring. The pressure inside eachindividual pipetting channel is monitored, during aspiration anddispensing.
Tip Disposable tip for pipetting
Tip rack Frame that holds the tips.

TADM Programmer’s Guide
624031/03 38
Term Definition
Tip waste Container for ejected tips.
Touch-off Type of dispensing where the tip approaches the bottom of the emptycontainer so close as to allow the dispensed droplet to havesimulataneous contact with the tip and the container bottom.
Trace Record of the status during processing
Tube A container for liquid, usually having a circular cross-section, and acylindrical length section.
User User of the software. Access rights for different types of users can bedefined, such as operators, laboratory manager, etc.
Waste Container A device on the ML STAR deck to collect used disposable tips.
Well The individual container of a MTP or DWP.
Well type Geometrical shape of the well, such as U, V or flat.
Wick side ofcontainer
Type of dispensing where tip touches the side of the container andthus releases the droplet. This function is not available for the MLSTAR instruments.
Work area The area of the ML STAR to which access is provided during theprocessing. Elements to be pipetted or handled can be placed in thisarea.
Worklist Information according to which a method is to be executed on the MLSTAR. A worklist may contain different parameters e.g. Pipettingvolume, heating temperature, shaking speed, etc.


![Open length (M) BRECO AT3 BRECO AT3 Open … · Tadm [N] F Tadm [N] AT20 (M/V) Available lengths and versions Standard delivery lengths (M) rolls of 50 m Cut to lengths / lengths](https://img.pdfslide.net/doc/110x75/5b897f5f7f8b9a5b688dc38e/open-length-m-breco-at3-breco-at3-open-tadm-n-f-tadm-n-at20-mv-available.jpg)