Embed Size (px)
Citation preview

Tagai State College Queensland State School Reporting 2015 School Annual Report
Postal address PO Box 1000 Thursday Island 4875
Phone (07) 4030 6333
Fax (07) 4030 6302
Email [email protected]
Webpages Additional reporting information pertaining to Queensland state schools is located on the My School website and the Queensland Government data website.
Contact person Judith Ketchell Executive Principal
Principal’s foreword
Introduction
Welcome to the college 2015 School Annual Report – this report is a celebration of our achievements last year as
well as an analysis of areas for improvement considered in the college’s 2016 planning.
Tagai State College was established to deliver a world class standard education and training for the young people
of the Torres Strait through “YUMI Education” - a 2 way strong approach to education. The college prioritises the
whole child - the academic, social, emotional, cultural and physical needs of students by embedding the inherent
value of languages, culture and history into the teaching & learning processes. The commitment of “YUMI
Education” has positioned the college as the Torres Strait region’s preferred education and training provider -
offering services across 17 discrete communities for clients from birth to adulthood.
This School Annual Report describes the 2015 School Improvement priorities of Attendance, Reading and Number
initiatives and how quality teaching and effective school community partnerships have helped us to showcase
significant achievements in these areas. The purpose of the 2015 College theme “ Bearing towards Yumi
Destiny” was to focus on the act of precision and drilling down to understanding every child in our classrooms –
faces on our data. We believe in our students and working together as one team, one song and one ginar for the
journey with the stars.
Our Vision Navigating YUMI to a successful future, by embracing our unique Torres Strait Island identity to achieve a world class standard of education.
Our Mission Tagai State College guarantees the highest standard of teaching and learning to achieve the aspirations of the Torres Strait Nation.
Our Service
Guarantee
Tagai State College guarantees that every student upon graduating Year 12 will: Have engaged with the unique language & culture of the Torres Strait and Achieve an OP and university entry, Be progressing on a clearly articulated VET pathway Be in quality paid employment Or have a clearly defined transition plan for identified students
College Targets
2015
Attendance >90%; Attendance <85% to reduce to 25%
Levels of Achievement: C or higher 80%; A standard 10%
NAPLAN: 100% at national minimum standard
Upper 2 Bands: 7% in all domains except Spelling 10%
VET Completion Rate 100%
QCE Complete Rate 100%
SOS measures >90%
TAGAI STATE COLLEGE ACHIEVEMENTS IN 2015
Year 12 100% QCE Completion rates – highest FNQ rates for the last 3 years 100 % VET completion rates 100% QCE completion rates Student Attendance Data – maintained improvement from 2014 Attendance rate at 88% Unexplained Absences reduced by 50% Years 1-9 English Level of Achievement from 56% in 2014 to 62% in 2015 Years 1-9 Maths Level of Achievement from 53% in 2014 to 60% in 2015 Year 3 NAPLAN Reading NMS from 69% in 2014 to 79% in 2015 Year 5 NAPLAN Reading NMS from 51% in 2014 to 65% in 2015 Year 7 NAPLAN Reading NMS from 74% in 2014 to 90% in 2015 Year 9 NAPLAN Reading NMS from 54% in 2014 to 56% in 2015 Year 3 NAPLAN Numeracy NMS from 75% in 2014 to 78% in 2015 Year 5 NAPLAN Numeracy NMS from 48% in 2014 to 78% in 2015 Year 7 NAPLAN Numeracy NMS from 83% in 2014 to 88% in 2015 Year 9 NAPLAN Numeracy NMS from 73% in 2014 to 86% in 2015 Students achieved qualified Coxswain Grade I & II School Opinion Survey measures consistently >90% Consistent with Systems Leadership Theory: signature way of working based on shared values 100% classrooms have data walls and Individual student goal setting strategies Consistent use of Explicit Instruction in classrooms Family Empowerment strategies implemented Junior Secondary philosophy and strategy implemented Develop staff capabilities for individual planning for students (ICPs) Sports Excellence celebrating primary & secondary peninsula and state sporting achievements Individual case management systems of chronic non- attendance Improved Maths resources – ROLEM resources produced locally Indigenous Language program implemented in 5 campuses successfully A high quality College professional development schedule for all staff (on-line & face to face) Expert Curriculum teams across primary & secondary Bearing toward yumi destiny - Putting faces on the data - Emotional connection. Clear consistent & high quality weekly promotional Torres Newsletter & webinars Looking after wellbeing of self & our teams
We thank the school community for their strong partnerships and confidence in planning our college strategic achievements for a world class education system. “From small things; big things grow….. Tagai State College is advancing a nation of proud Aboriginal and/or Torres Strait Islander students and we are excited about the next 4 years ahead – Towards 2020. Yours in Education, Judith Ketchell Executive Principal
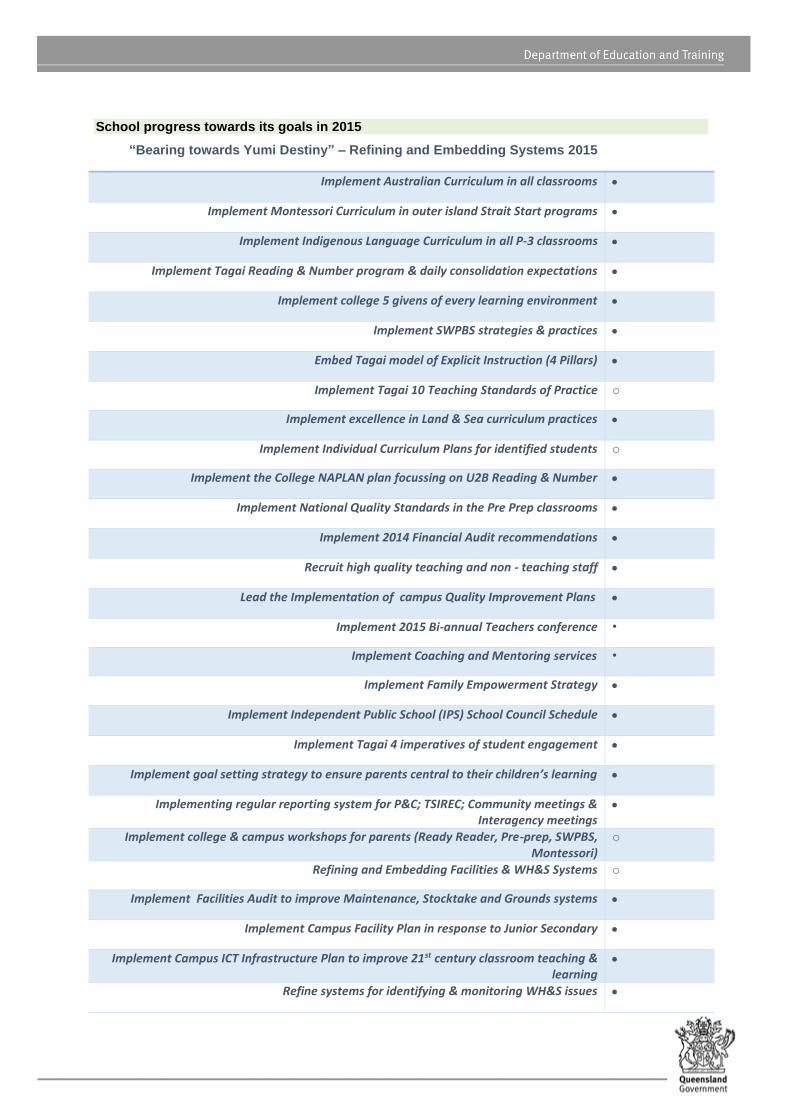
School progress towards its goals in 2015
“Bearing towards Yumi Destiny” – Refining and Embedding Systems 2015
Implement Australian Curriculum in all classrooms
Implement Montessori Curriculum in outer island Strait Start programs
Implement Indigenous Language Curriculum in all P-3 classrooms
Implement Tagai Reading & Number program & daily consolidation expectations
Implement college 5 givens of every learning environment
Implement SWPBS strategies & practices
Embed Tagai model of Explicit Instruction (4 Pillars)
Implement Tagai 10 Teaching Standards of Practice o
Implement excellence in Land & Sea curriculum practices
Implement Individual Curriculum Plans for identified students o
Implement the College NAPLAN plan focussing on U2B Reading & Number
Implement National Quality Standards in the Pre Prep classrooms
Implement 2014 Financial Audit recommendations
Recruit high quality teaching and non - teaching staff
Lead the Implementation of campus Quality Improvement Plans
Implement 2015 Bi-annual Teachers conference •
Implement Coaching and Mentoring services •
Implement Family Empowerment Strategy
Implement Independent Public School (IPS) School Council Schedule
Implement Tagai 4 imperatives of student engagement
Implement goal setting strategy to ensure parents central to their children’s learning
Implementing regular reporting system for P&C; TSIREC; Community meetings & Interagency meetings
Implement college & campus workshops for parents (Ready Reader, Pre-prep, SWPBS, Montessori)
o
Refining and Embedding Facilities & WH&S Systems o
Implement Facilities Audit to improve Maintenance, Stocktake and Grounds systems
Implement Campus Facility Plan in response to Junior Secondary
Implement Campus ICT Infrastructure Plan to improve 21st century classroom teaching & learning
Refine systems for identifying & monitoring WH&S issues
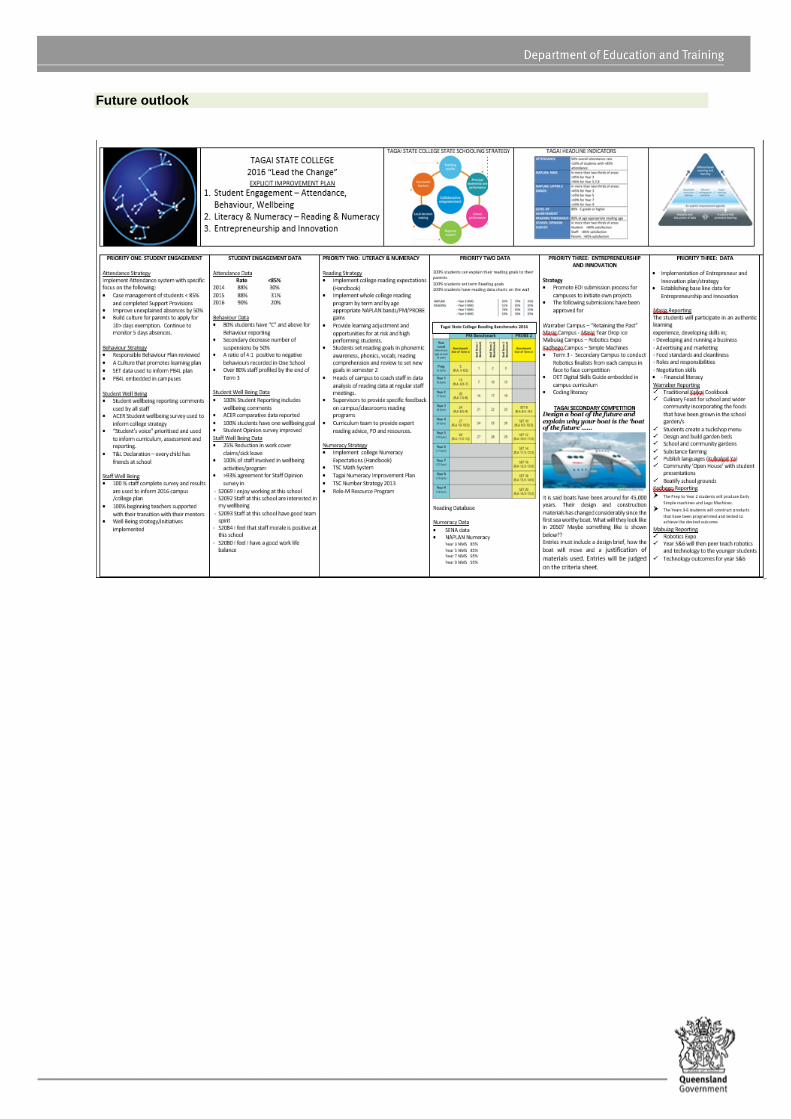
Future outlook
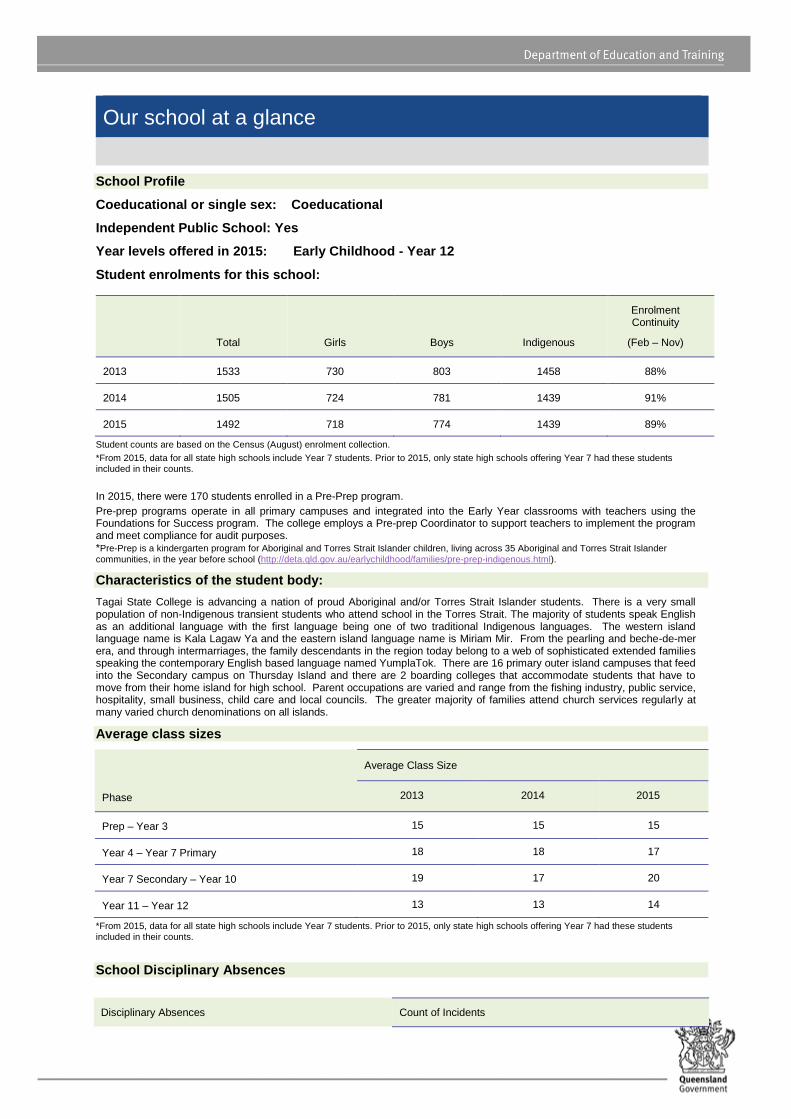
Our school at a glance
School Profile
Coeducational or single sex: Coeducational
Independent Public School: Yes
Year levels offered in 2015: Early Childhood - Year 12
Student enrolments for this school:
Total Girls Boys Indigenous
Enrolment Continuity
(Feb – Nov)
2013 1533 730 803 1458 88%
2014 1505 724 781 1439 91%
2015 1492 718 774 1439 89%
Student counts are based on the Census (August) enrolment collection.
*From 2015, data for all state high schools include Year 7 students. Prior to 2015, only state high schools offering Year 7 had these students included in their counts.
In 2015, there were 170 students enrolled in a Pre-Prep program.
Pre-prep programs operate in all primary campuses and integrated into the Early Year classrooms with teachers using the Foundations for Success program. The college employs a Pre-prep Coordinator to support teachers to implement the program and meet compliance for audit purposes. *Pre-Prep is a kindergarten program for Aboriginal and Torres Strait Islander children, living across 35 Aboriginal and Torres Strait Islander
communities, in the year before school (http://deta.qld.gov.au/earlychildhood/families/pre-prep-indigenous.html).
Characteristics of the student body:
Tagai State College is advancing a nation of proud Aboriginal and/or Torres Strait Islander students. There is a very small population of non-Indigenous transient students who attend school in the Torres Strait. The majority of students speak English as an additional language with the first language being one of two traditional Indigenous languages. The western island language name is Kala Lagaw Ya and the eastern island language name is Miriam Mir. From the pearling and beche-de-mer era, and through intermarriages, the family descendants in the region today belong to a web of sophisticated extended families speaking the contemporary English based language named YumplaTok. There are 16 primary outer island campuses that feed into the Secondary campus on Thursday Island and there are 2 boarding colleges that accommodate students that have to move from their home island for high school. Parent occupations are varied and range from the fishing industry, public service, hospitality, small business, child care and local councils. The greater majority of families attend church services regularly at many varied church denominations on all islands.
Average class sizes
Phase
Average Class Size
2013 2014 2015
Prep – Year 3 15 15 15
Year 4 – Year 7 Primary 18 18 17
Year 7 Secondary – Year 10 19 17 20
Year 11 – Year 12 13 13 14
*From 2015, data for all state high schools include Year 7 students. Prior to 2015, only state high schools offering Year 7 had these students included in their counts.
School Disciplinary Absences
Disciplinary Absences Count of Incidents
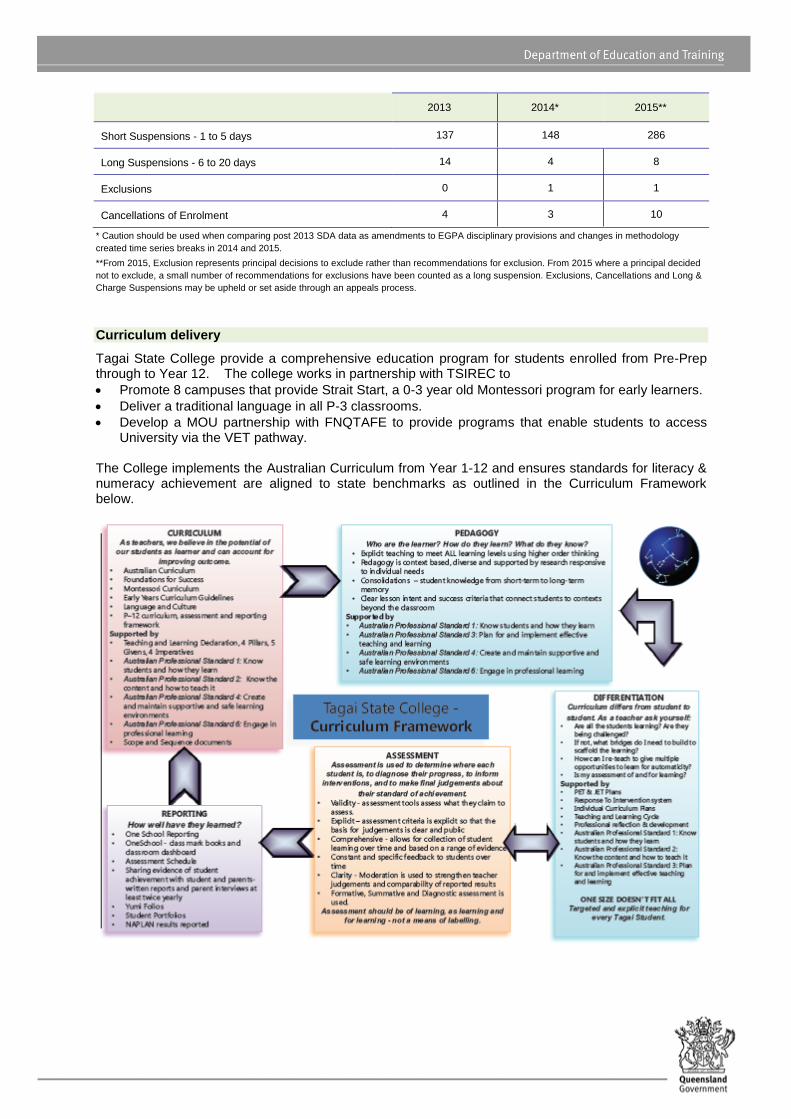
* Caution should be used when comparing post 2013 SDA data as amendments to EGPA disciplinary provisions and changes in methodology
created time series breaks in 2014 and 2015.
**From 2015, Exclusion represents principal decisions to exclude rather than recommendations for exclusion. From 2015 where a principal decided
not to exclude, a small number of recommendations for exclusions have been counted as a long suspension. Exclusions, Cancellations and Long &
Charge Suspensions may be upheld or set aside through an appeals process.
Curriculum delivery
Tagai State College provide a comprehensive education program for students enrolled from Pre-Prep through to Year 12. The college works in partnership with TSIREC to
Promote 8 campuses that provide Strait Start, a 0-3 year old Montessori program for early learners.
Deliver a traditional language in all P-3 classrooms.
Develop a MOU partnership with FNQTAFE to provide programs that enable students to access University via the VET pathway.
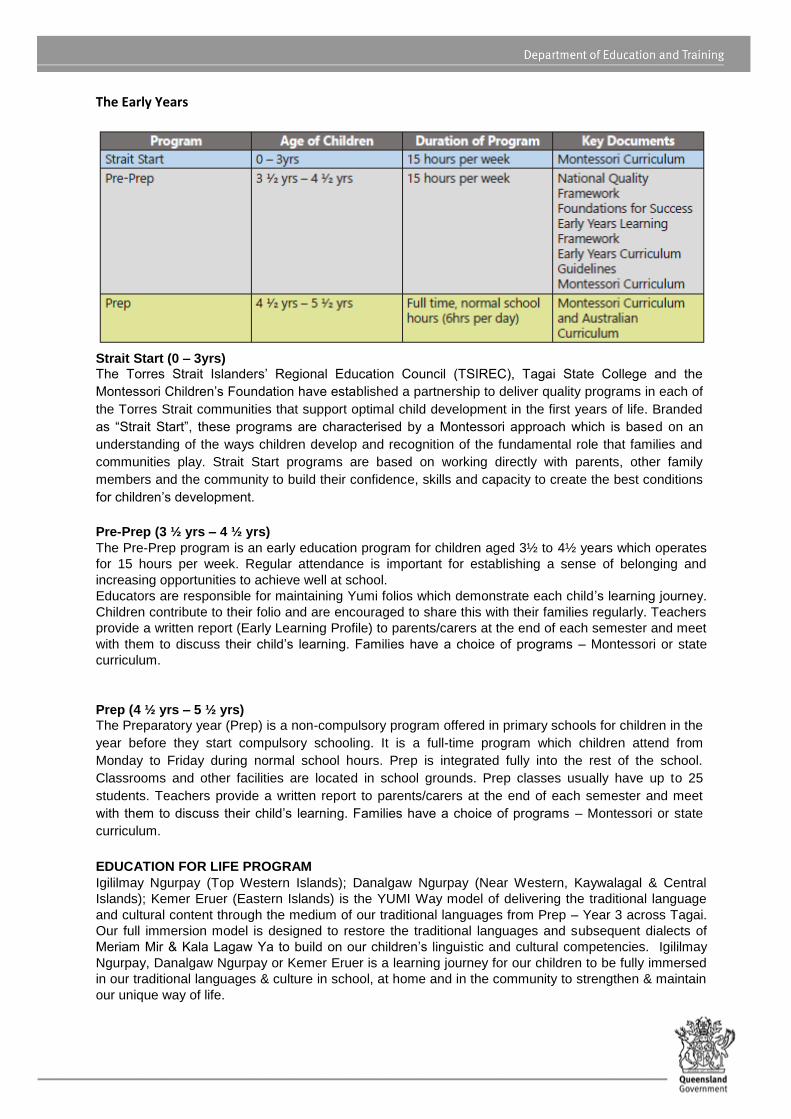
The College implements the Australian Curriculum from Year 1-12 and ensures standards for literacy & numeracy achievement are aligned to state benchmarks as outlined in the Curriculum Framework below.
2013 2014* 2015**
Short Suspensions - 1 to 5 days 137 148 286
Long Suspensions - 6 to 20 days 14 4 8
Exclusions 0 1 1
Cancellations of Enrolment 4 3 10
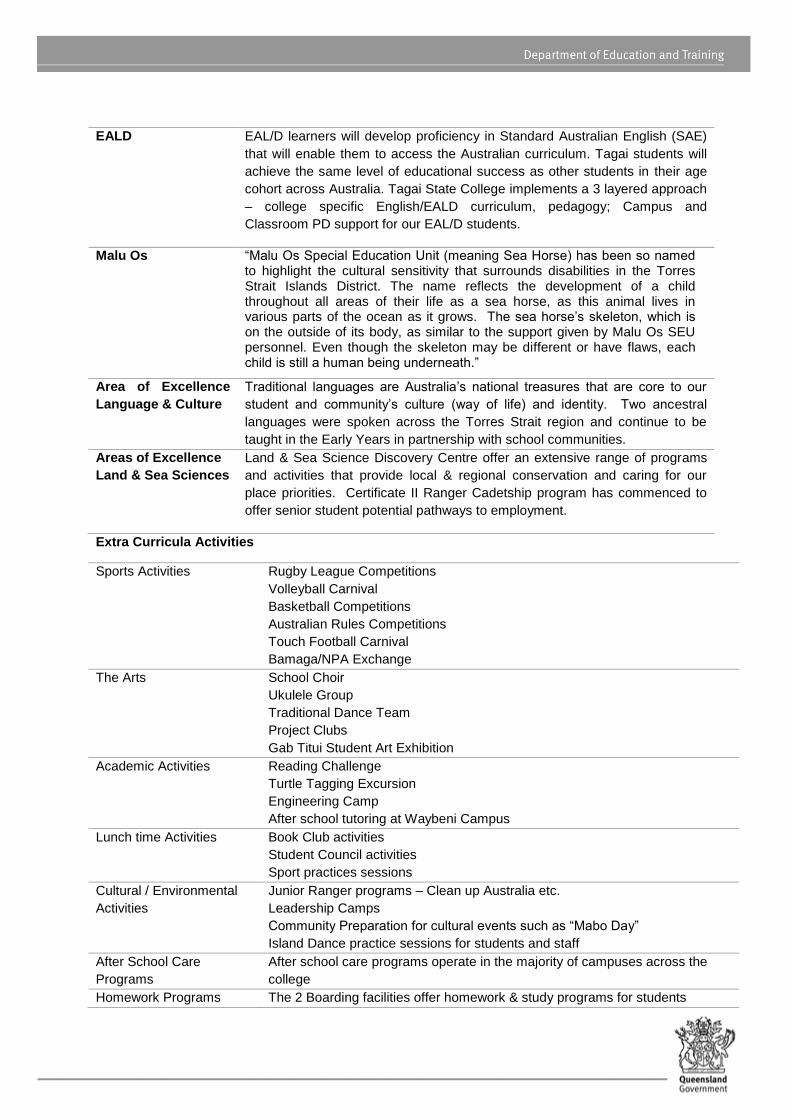
The Early Years
Strait Start (0 – 3yrs) The Torres Strait Islanders’ Regional Education Council (TSIREC), Tagai State College and the
Montessori Children’s Foundation have established a partnership to deliver quality programs in each of
the Torres Strait communities that support optimal child development in the first years of life. Branded
as “Strait Start”, these programs are characterised by a Montessori approach which is based on an
understanding of the ways children develop and recognition of the fundamental role that families and
communities play. Strait Start programs are based on working directly with parents, other family
members and the community to build their confidence, skills and capacity to create the best conditions
for children’s development.
Pre-Prep (3 ½ yrs – 4 ½ yrs)
The Pre-Prep program is an early education program for children aged 3½ to 4½ years which operates
for 15 hours per week. Regular attendance is important for establishing a sense of belonging and
increasing opportunities to achieve well at school.
Educators are responsible for maintaining Yumi folios which demonstrate each child’s learning journey.
Children contribute to their folio and are encouraged to share this with their families regularly. Teachers
provide a written report (Early Learning Profile) to parents/carers at the end of each semester and meet
with them to discuss their child’s learning. Families have a choice of programs – Montessori or state
curriculum.
Prep (4 ½ yrs – 5 ½ yrs)
The Preparatory year (Prep) is a non-compulsory program offered in primary schools for children in the
year before they start compulsory schooling. It is a full-time program which children attend from
Monday to Friday during normal school hours. Prep is integrated fully into the rest of the school.
Classrooms and other facilities are located in school grounds. Prep classes usually have up to 25
students. Teachers provide a written report to parents/carers at the end of each semester and meet
with them to discuss their child’s learning. Families have a choice of programs – Montessori or state
curriculum.
EDUCATION FOR LIFE PROGRAM
Igililmay Ngurpay (Top Western Islands); Danalgaw Ngurpay (Near Western, Kaywalagal & Central
Islands); Kemer Eruer (Eastern Islands) is the YUMI Way model of delivering the traditional language
and cultural content through the medium of our traditional languages from Prep – Year 3 across Tagai.
Our full immersion model is designed to restore the traditional languages and subsequent dialects of
Meriam Mir & Kala Lagaw Ya to build on our children’s linguistic and cultural competencies. Igililmay
Ngurpay, Danalgaw Ngurpay or Kemer Eruer is a learning journey for our children to be fully immersed
in our traditional languages & culture in school, at home and in the community to strengthen & maintain
our unique way of life.
Extra Curricula Activities
Sports Activities Rugby League Competitions
Volleyball Carnival
Basketball Competitions
Australian Rules Competitions
Touch Football Carnival
Bamaga/NPA Exchange
The Arts School Choir
Ukulele Group
Traditional Dance Team
Project Clubs
Gab Titui Student Art Exhibition
Academic Activities Reading Challenge
Turtle Tagging Excursion
Engineering Camp
After school tutoring at Waybeni Campus
Lunch time Activities Book Club activities
Student Council activities
Sport practices sessions
Cultural / Environmental
Activities
Junior Ranger programs – Clean up Australia etc.
Leadership Camps
Community Preparation for cultural events such as “Mabo Day”
Island Dance practice sessions for students and staff
After School Care
Programs
After school care programs operate in the majority of campuses across the
college
Homework Programs The 2 Boarding facilities offer homework & study programs for students
EALD EAL/D learners will develop proficiency in Standard Australian English (SAE)
that will enable them to access the Australian curriculum. Tagai students will
achieve the same level of educational success as other students in their age
cohort across Australia. Tagai State College implements a 3 layered approach
– college specific English/EALD curriculum, pedagogy; Campus and
Classroom PD support for our EAL/D students.
Malu Os “Malu Os Special Education Unit (meaning Sea Horse) has been so named to highlight the cultural sensitivity that surrounds disabilities in the Torres Strait Islands District. The name reflects the development of a child throughout all areas of their life as a sea horse, as this animal lives in various parts of the ocean as it grows. The sea horse’s skeleton, which is on the outside of its body, as similar to the support given by Malu Os SEU personnel. Even though the skeleton may be different or have flaws, each child is still a human being underneath.”
Area of Excellence
Language & Culture
Traditional languages are Australia’s national treasures that are core to our
student and community’s culture (way of life) and identity. Two ancestral
languages were spoken across the Torres Strait region and continue to be
taught in the Early Years in partnership with school communities.
Areas of Excellence
Land & Sea Sciences
Land & Sea Science Discovery Centre offer an extensive range of programs
and activities that provide local & regional conservation and caring for our
place priorities. Certificate II Ranger Cadetship program has commenced to
offer senior student potential pathways to employment.
How Information and Communication Technologies are used to improve learning
Tagai State College aspires to a world class delivery of innovative ICT service in teaching and learning;
professional development; curriculum provision and delivery, and equitable access to services and
opportunities. Tagai State College’s ICT environment is one of the most vast and complex in
Queensland currently supporting 1600 students and 165 teachers across 17 campuses located on very
remote Torres Strait Islands spreading over a geographic area of approximately 48 000 square
kilometres. The bandwidth varies across the college; 2 campuses rely on satellite links; 5 campuses
that are dependent on the weather conditions. The secondary campus ensures all students from year
9-12 are provided with access to a device to support teaching and learning in the classrooms as well as
complete assessments at home.
The present computer ratio is 1 computer for every 4 students which is the recommended ratio. Interactive whiteboards were installed in every classroom by the end of 2013.
All campuses are networked and wireless access points in all buildings that house teaching areas.
Internet access has been problematic in 2015 with some campuses with very frequent downtimes.
The use of ICT is integral to the delivery of professional learning to all staff. Teachers currently participate in moderation and can join into the college online training schedule throughout the year.
The college has registered the following software licences: Olivia, Mathletics, Agresso,
Webinars are being used to engage weekly with all leaders and each term with P&C representatives on the outer islands.
The Contemporary Practice Resource has been designed by classroom teachers to support all Qld teachers to implement the Australian Curriculum in a contemporary 21st century classroom.
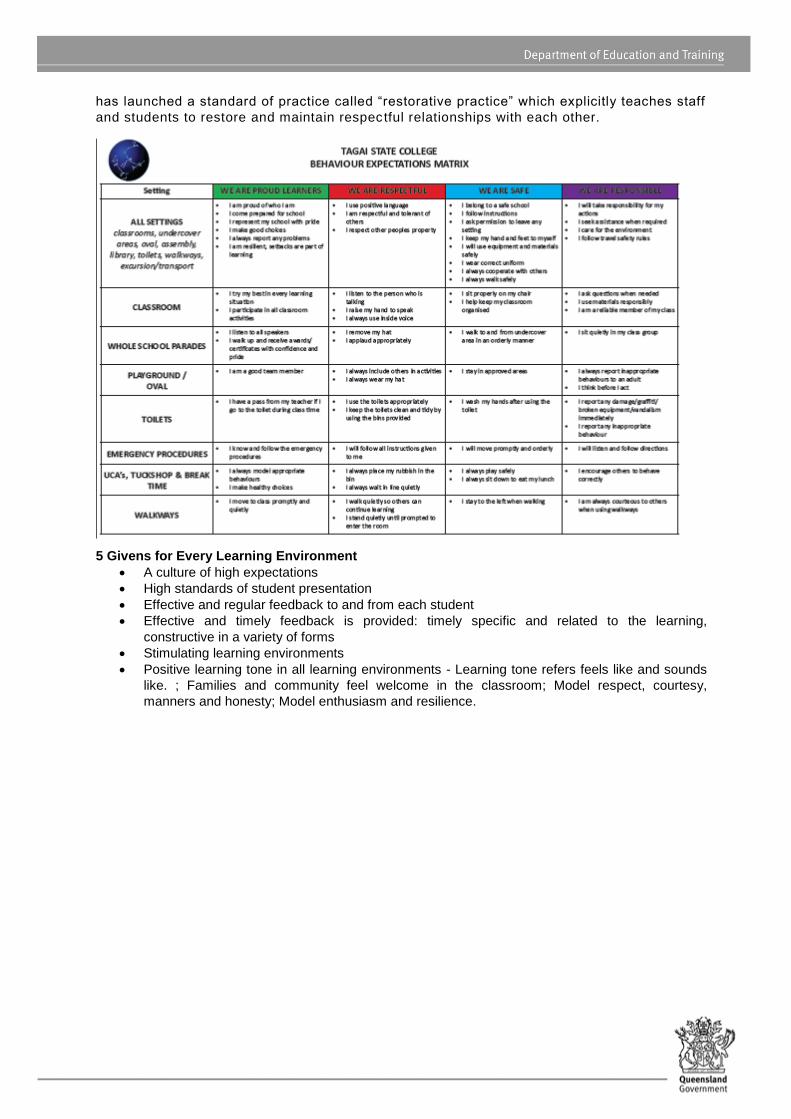
Social Climate
Tagai State College has a school wide positive behavior support system being implemented across all campuses. The college behavior expectation matrix is based on being proud learners who are respectful, safe, responsible and safe. Tagai State College endorses a whole school approach to promote, encourage and support appropriate behaviours in all students. To facilitate this approach, the College has implemented the Positive Behaviour for Learning (PBL) framework. An essential component of the PBL framework is the belief that positive behaviour needs to be explicitly taught at the commencement of the year and as the need arises throughout the year and at every “teachable moment” opportunity. The systematic teaching of Behavioural Expectations At Tagai State College we emphasise the importance of explicitly teaching and modelling expected behaviours. These expectations are taught and communicated to students through:
Use of the explicit teaching and learning cycle to teach social and emotional skills including You Can Do It (YCDI) Education.
Focussed lessons and activities as determined by analysis of data.
Re-inforcement of pro-social skills by all staff.
Teaching differentiated behaviour routines and skills as required by data and case management processes, enabling the necessary supports for students across classroom and non-classroom settings.
Use of positive language, Mina Pawa, Debe Tonar.
Building positive relationships.
Promoting and using restorative practices.
The college Anti bullying policy and procedures is aligned to the each campus Responsible
Behaviour Plan. The reporting of “bullying” is taken seriously and each campus has
developed a response plan to support students, staff and parents. Consultations with
community have resulted in the employment of school welfare officers to improve
communication and awareness of attendance and school expected behaviours. The college
has launched a standard of practice called “restorative practice” which explicitly teaches staff
and students to restore and maintain respectful relationships with each other.
5 Givens for Every Learning Environment
A culture of high expectations
High standards of student presentation
Effective and regular feedback to and from each student
Effective and timely feedback is provided: timely specific and related to the learning,
constructive in a variety of forms
Stimulating learning environments
Positive learning tone in all learning environments - Learning tone refers feels like and sounds
like. ; Families and community feel welcome in the classroom; Model respect, courtesy,
manners and honesty; Model enthusiasm and resilience.
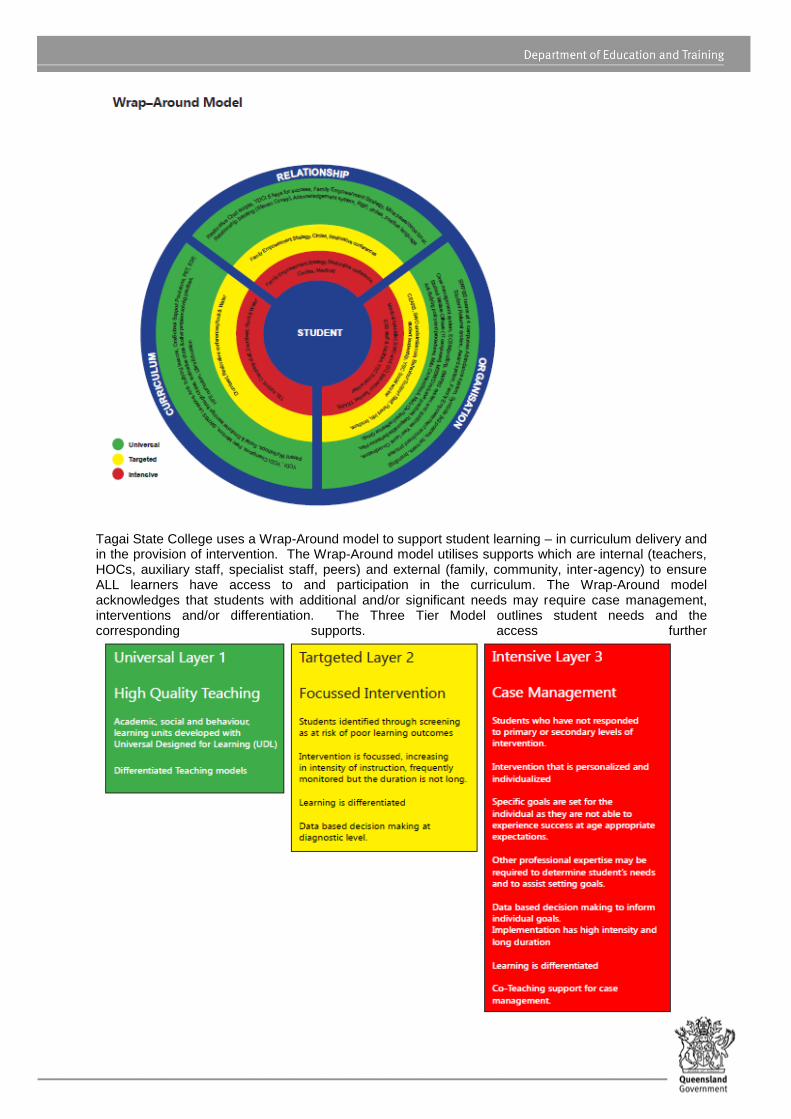
Tagai State College uses a Wrap-Around model to support student learning – in curriculum delivery and in the provision of intervention. The Wrap-Around model utilises supports which are internal (teachers, HOCs, auxiliary staff, specialist staff, peers) and external (family, community, inter-agency) to ensure ALL learners have access to and participation in the curriculum. The Wrap-Around model acknowledges that students with additional and/or significant needs may require case management, interventions and/or differentiation. The Three Tier Model outlines student needs and the corresponding supports. access further
At Tagai State College, Layer 2 and 3 students receive Wrap-Around support from the CARE team and
inter-agencies. The Tagai State College Specialist CARE team include Guidance Officers, Head of
Special Education Services, Inclusive Practices Coach, SWD teachers, Behaviour Support teacher,
Speech Language Pathologist, and Student Participation Officer.
Differentiation
Teachers at Tagai State College provide students with differentiated curriculum/pedagogy to access
and participate in curriculum that is meaningful and relevant and accommodate student’s individual
needs.
This includes:
students with a verified disability
students working below year level
students who are gifted and talented
students who require learning support
students with behavioural concerns
students with mental health concerns students with health concerns students in care students with sensory issues students with less than 85% attendance Student with English as an Additional Language/Dialect (EALD)
Teachers at Tagai State College make adjustments to the process, environment, product and/or
content. All adjustments are recorded on OneSchool in the Student Plan and are endorsed by student’s
family. Teachers at Tagai State College make any necessary accommodations to facilitate student
access to the curriculum. Students in Layers 2 and 3 are further supported by interventions, case
management, specialists and/or complex case management. The SEARS Flowchart was released in
Term 1, 2015. Leaders and teachers also received professional development on how to implement.
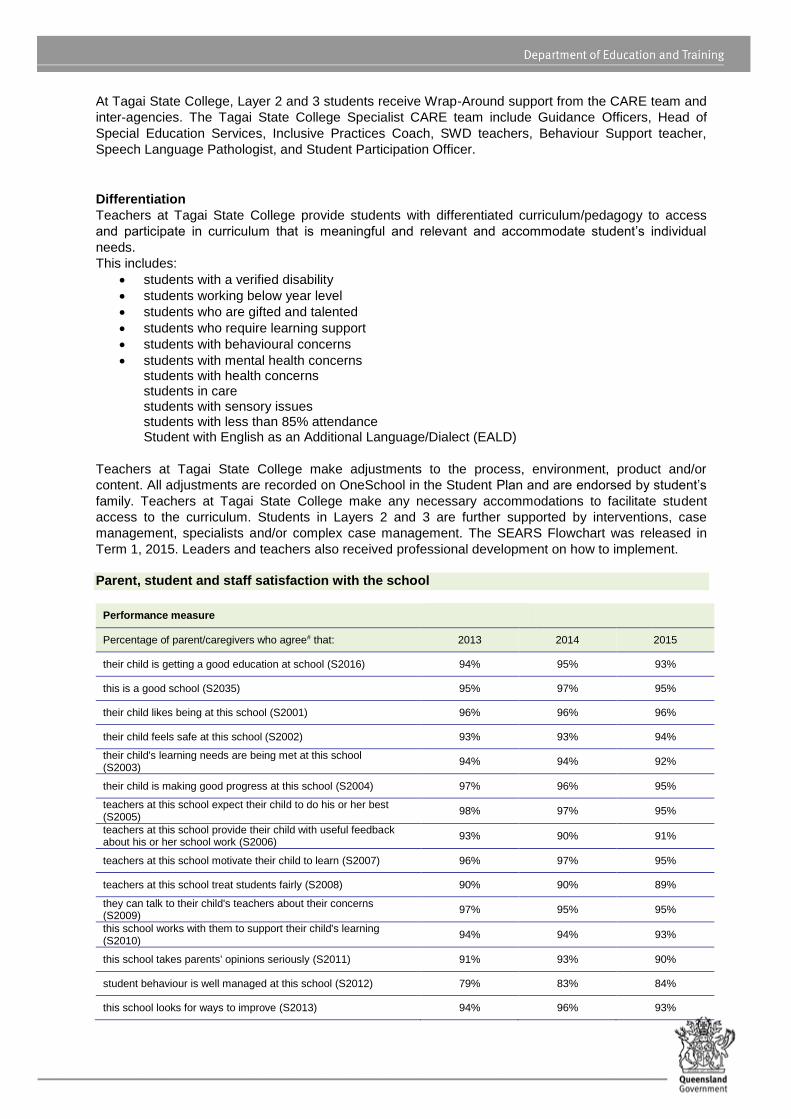
Parent, student and staff satisfaction with the school
Performance measure
Percentage of parent/caregivers who agree# that: 2013 2014 2015
their child is getting a good education at school (S2016) 94% 95% 93%
this is a good school (S2035) 95% 97% 95%
their child likes being at this school (S2001) 96% 96% 96%
their child feels safe at this school (S2002) 93% 93% 94%
their child's learning needs are being met at this school (S2003)
94% 94% 92%
their child is making good progress at this school (S2004) 97% 96% 95%
teachers at this school expect their child to do his or her best (S2005)
98% 97% 95%
teachers at this school provide their child with useful feedback about his or her school work (S2006)
93% 90% 91%
teachers at this school motivate their child to learn (S2007) 96% 97% 95%
teachers at this school treat students fairly (S2008) 90% 90% 89%
they can talk to their child's teachers about their concerns (S2009)
97% 95% 95%
this school works with them to support their child's learning (S2010)
94% 94% 93%
this school takes parents' opinions seriously (S2011) 91% 93% 90%
student behaviour is well managed at this school (S2012) 79% 83% 84%
this school looks for ways to improve (S2013) 94% 96% 93%
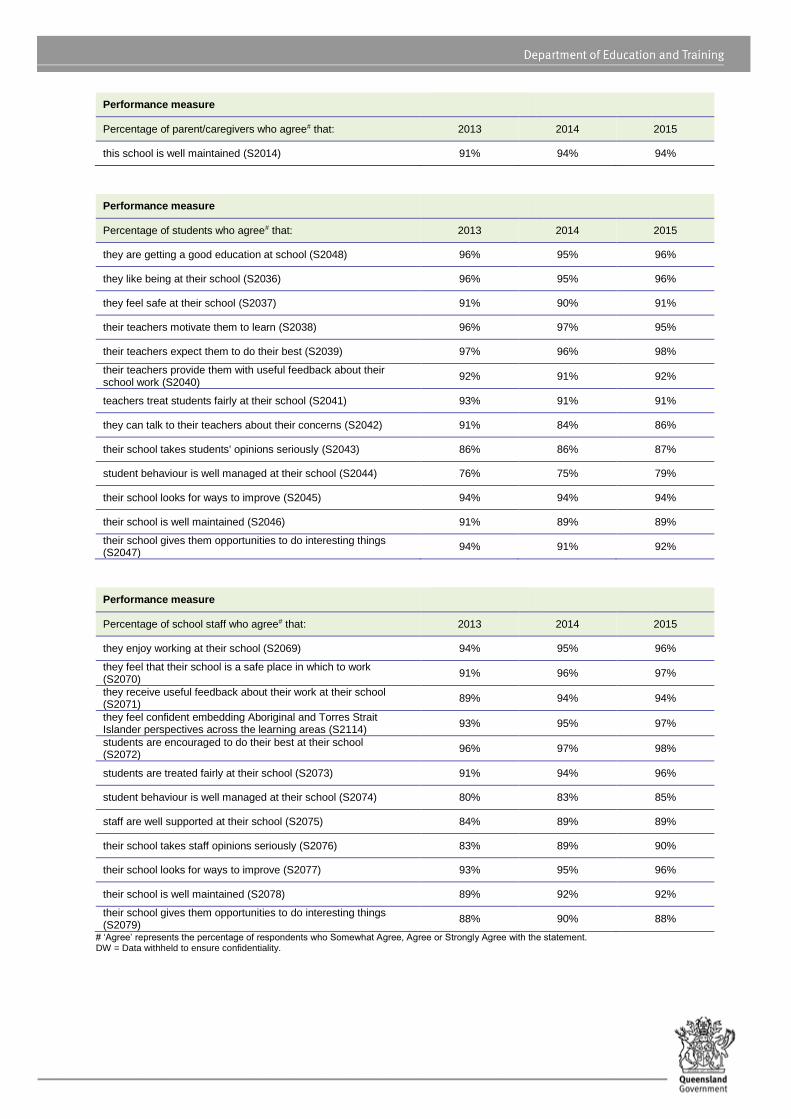
Performance measure
Percentage of parent/caregivers who agree# that: 2013 2014 2015
this school is well maintained (S2014) 91% 94% 94%
Performance measure
Percentage of students who agree# that: 2013 2014 2015
they are getting a good education at school (S2048) 96% 95% 96%
they like being at their school (S2036) 96% 95% 96%
they feel safe at their school (S2037) 91% 90% 91%
their teachers motivate them to learn (S2038) 96% 97% 95%
their teachers expect them to do their best (S2039) 97% 96% 98%
their teachers provide them with useful feedback about their school work (S2040)
92% 91% 92%
teachers treat students fairly at their school (S2041) 93% 91% 91%
they can talk to their teachers about their concerns (S2042) 91% 84% 86%
their school takes students' opinions seriously (S2043) 86% 86% 87%
student behaviour is well managed at their school (S2044) 76% 75% 79%
their school looks for ways to improve (S2045) 94% 94% 94%
their school is well maintained (S2046) 91% 89% 89%
their school gives them opportunities to do interesting things (S2047)
94% 91% 92%
Performance measure
Percentage of school staff who agree# that: 2013 2014 2015
they enjoy working at their school (S2069) 94% 95% 96%
they feel that their school is a safe place in which to work (S2070)
91% 96% 97%
they receive useful feedback about their work at their school (S2071)
89% 94% 94%
they feel confident embedding Aboriginal and Torres Strait Islander perspectives across the learning areas (S2114)
93% 95% 97%
students are encouraged to do their best at their school (S2072)
96% 97% 98%
students are treated fairly at their school (S2073) 91% 94% 96%
student behaviour is well managed at their school (S2074) 80% 83% 85%
staff are well supported at their school (S2075) 84% 89% 89%
their school takes staff opinions seriously (S2076) 83% 89% 90%
their school looks for ways to improve (S2077) 93% 95% 96%
their school is well maintained (S2078) 89% 92% 92%
their school gives them opportunities to do interesting things (S2079)
88% 90% 88%
# ‘Agree’ represents the percentage of respondents who Somewhat Agree, Agree or Strongly Agree with the statement. DW = Data withheld to ensure confidentiality.

Parent and Community Engagement
Tagai State College recognizes parents as vital partners and central to each child’s learning progress.
Each campus has their own P&C association who actively fundraise to support children’s resources in
schools. The P&C associations all advocated supporting the operations of the College School Council.
Our college has implemented a range of strategies to ensure our parents are well informed and are
provided with multiple opportunities to participate in school activities:
Parent Teacher parent information sessions
Weekly newsletter published in the Torres News
Parent Invitations to Weekly parades for special awards
Campus Noticeboards
Campus Postcards to parents
Parent Advisory Groups for Special Needs
Parent Volunteers to supervise on excursions & class activities
Parents & Elders as guest speakers to students
Men’s & Women’s business parades for secondary students
Family Empowerment Strategy - A Whole School Community Approach that focuses on parents as
the first teachers of their children. This strategy is designed to empower families and community to be
actively engaged and participating in their child/ren’s decision making for education and life choices.
“We need effective schools. We need effective families. We need effective communities. When schools,
families and communities work together in education, everybody does well.” By Dr George Otero –
Centre for Relational Learning.
What is the YUMI WAY?
Whenever you hear someone from Tagai school communities make reference to the phrase the YUMI
WAY, they are referring to a process for ensuring inclusiveness and ownership of a system that has
been quality assured by the Indigenous people of the Torres Strait since time immemorial.
Depending on the context, the phrase YUMI WAY, could be referring to a small group of people, a
selected group of people, and a large group of people or a nation of people.
The YUMI WAY incorporates a demonstration of respect for the peoples, languages, cultures and
protocols in order to do business correctly in the Torres Strait region or when working with Torres Strait
Islanders in other contexts.
The YUMI WAY is not only about using common sense, it is about implementing what works and best
practice. Incorporating and applying the YUMI WAY into policies and procedures will ensure these will
be more effective when implemented in the Torres Strait context. Whenever we use the YUMI WAY for
doing business we can feel confident and assured that the YUMI WAY is Our Way, the Right Way and
the Only Way. Steve Foster on behalf of Tagai Executive Team, 2014
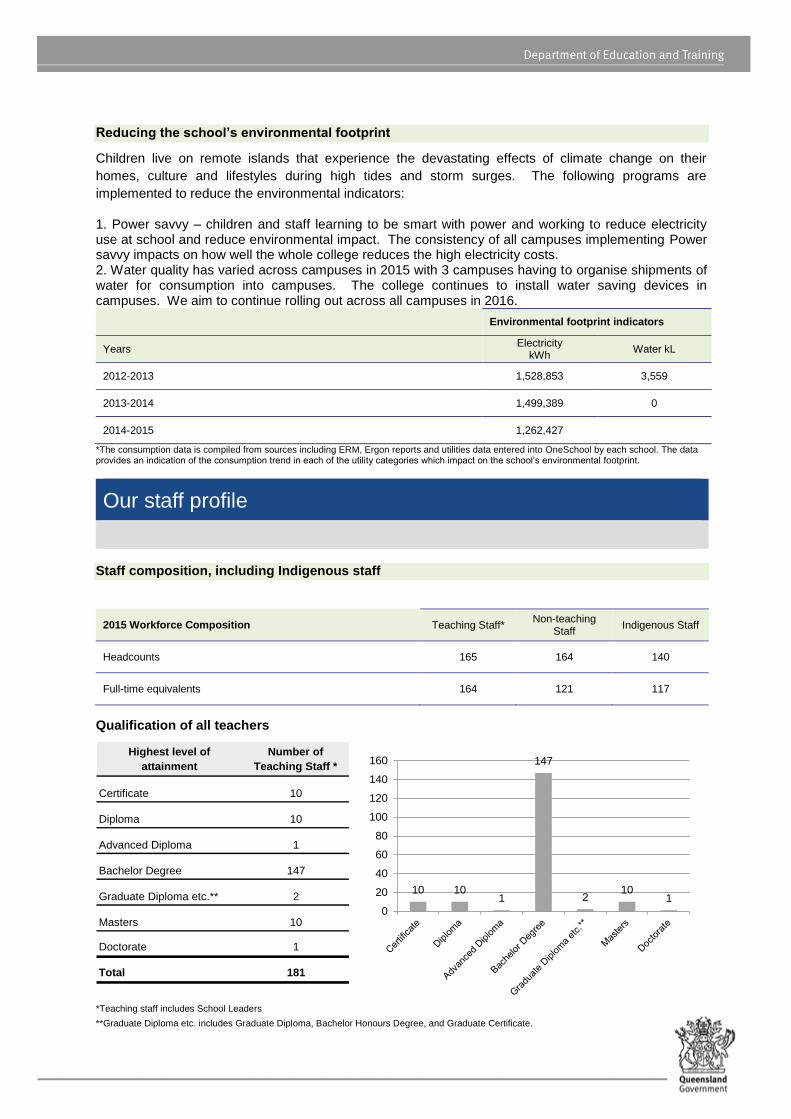
Reducing the school’s environmental footprint
Children live on remote islands that experience the devastating effects of climate change on their
homes, culture and lifestyles during high tides and storm surges. The following programs are
implemented to reduce the environmental indicators:
1. Power savvy – children and staff learning to be smart with power and working to reduce electricity use at school and reduce environmental impact. The consistency of all campuses implementing Power savvy impacts on how well the whole college reduces the high electricity costs. 2. Water quality has varied across campuses in 2015 with 3 campuses having to organise shipments of water for consumption into campuses. The college continues to install water saving devices in campuses. We aim to continue rolling out across all campuses in 2016.
Environmental footprint indicators
Years Electricity
kWh Water kL
2012-2013 1,528,853 3,559
2013-2014 1,499,389 0
2014-2015 1,262,427
*The consumption data is compiled from sources including ERM, Ergon reports and utilities data entered into OneSchool by each school. The data provides an indication of the consumption trend in each of the utility categories which impact on the school’s environmental footprint.
Our staff profile
Staff composition, including Indigenous staff
2015 Workforce Composition Teaching Staff* Non-teaching
Staff Indigenous Staff
Headcounts 165 164 140
Full-time equivalents 164 121 117
Qualification of all teachers
Highest level of
attainment
Number of
Teaching Staff *
Certificate 10
Diploma 10
Advanced Diploma 1
Bachelor Degree 147
Graduate Diploma etc.** 2
Masters 10
Doctorate 1
Total 181
10 101
147
210
10
20
40
60
80
100
120
140
160
*Teaching staff includes School Leaders
**Graduate Diploma etc. includes Graduate Diploma, Bachelor Honours Degree, and Graduate Certificate.

Expenditure on and teacher participation in professional development
The total funds expended on teacher professional development in 2015 was $592,859
The proportion of the teaching staff involved in professional development activities during 2014 was 75%. The major professional development initiatives are as follows:
Systems Leadership training workshops
Leadership coaching
Teacher coaching service
Beginning Teacher mentoring Service
4T strategy – Teachers visiting other teachers
SWPBS Coaching
Cairns Principals Business meetings
ICT Training
Classroom profiling training
Inclusive education practices workshop
Assessment, Reporting & Moderation PD
Language for Learning – EALD strategies in English
Language & Cultural Induction
Torres Strait orthography PD
Cleaners & Grounds training workshop
Early Years Training – National Quality Standards Framework
Reading & Numeracy workshop
Workplace Health & Safety training
Sports coach training clinics
One School Training
Average staff attendance 2013 2014 2015
Staff attendance for permanent and temporary staff and school leaders. 97% 97% 97%
Proportion of staff retained from the previous school year
From the end of the previous school year, 80% of staff was retained by the school for the entire 2015 school year.
School income broken down by funding source
School income broken down by funding source is available via the My School website at http://www.myschool.edu.au/.
To access our income details, click on the My School link above. You will then be taken to the My School website with the following ‘Find a school’ text box.
Where it says ‘School name’, type in the name of the school you wish to view, select the school from the drop-down list and select <GO>. Read and follow the instructions on the next screen; you will be asked to confirm that you are not a robot then by clicking continue, you acknowledge that you have read, accepted and agree to the Terms of Use and Privacy Policy before being given access to the school’s profile webpage.
School financial information is available by selecting ‘School finances’ in the menu box in the top left corner of the school’s profile webpage. If you are unable to access the internet, please contact the school for a paper copy of income by funding source.
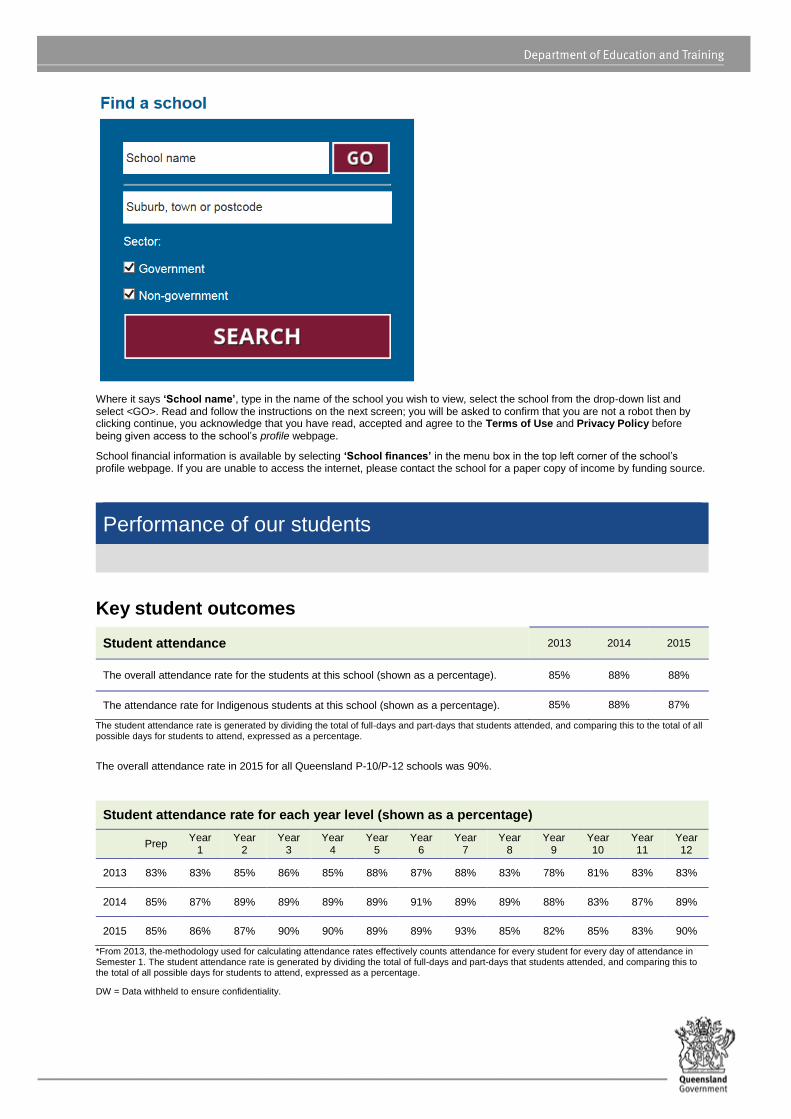
Performance of our students
Key student outcomes
Student attendance 2013 2014 2015
The overall attendance rate for the students at this school (shown as a percentage). 85% 88% 88%
The attendance rate for Indigenous students at this school (shown as a percentage). 85% 88% 87%
The student attendance rate is generated by dividing the total of full-days and part-days that students attended, and comparing this to the total of all possible days for students to attend, expressed as a percentage.
The overall attendance rate in 2015 for all Queensland P-10/P-12 schools was 90%.
Student attendance rate for each year level (shown as a percentage)
Prep Year
1 Year
2 Year
3 Year
4 Year
5 Year
6 Year
7 Year
8 Year
9 Year 10
Year 11
Year 12
2013 83% 83% 85% 86% 85% 88% 87% 88% 83% 78% 81% 83% 83%
2014 85% 87% 89% 89% 89% 89% 91% 89% 89% 88% 83% 87% 89%
2015 85% 86% 87% 90% 90% 89% 89% 93% 85% 82% 85% 83% 90%
*From 2013, the methodology used for calculating attendance rates effectively counts attendance for every student for every day of attendance in Semester 1. The student attendance rate is generated by dividing the total of full-days and part-days that students attended, and comparing this to the total of all possible days for students to attend, expressed as a percentage.
DW = Data withheld to ensure confidentiality.
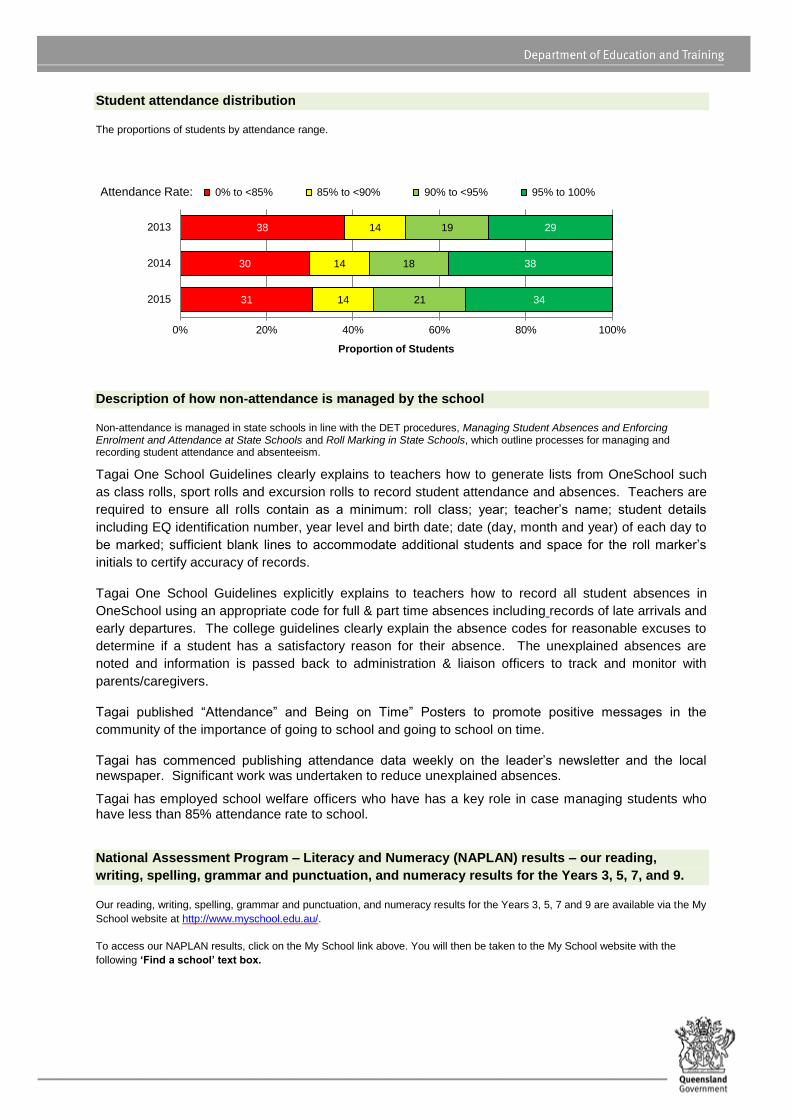
Student attendance distribution
The proportions of students by attendance range.
31
30
38
14
14
14
21
18
19
34
38
29
0% 20% 40% 60% 80% 100%
2015
2014
2013
Proportion of Students
Attendance Rate: 0% to <85% 85% to <90% 90% to <95% 95% to 100%
Description of how non-attendance is managed by the school
Non-attendance is managed in state schools in line with the DET procedures, Managing Student Absences and Enforcing Enrolment and Attendance at State Schools and Roll Marking in State Schools, which outline processes for managing and recording student attendance and absenteeism.
Tagai One School Guidelines clearly explains to teachers how to generate lists from OneSchool such
as class rolls, sport rolls and excursion rolls to record student attendance and absences. Teachers are
required to ensure all rolls contain as a minimum: roll class; year; teacher’s name; student details
including EQ identification number, year level and birth date; date (day, month and year) of each day to
be marked; sufficient blank lines to accommodate additional students and space for the roll marker’s
initials to certify accuracy of records.
Tagai One School Guidelines explicitly explains to teachers how to record all student absences in
OneSchool using an appropriate code for full & part time absences including records of late arrivals and
early departures. The college guidelines clearly explain the absence codes for reasonable excuses to
determine if a student has a satisfactory reason for their absence. The unexplained absences are
noted and information is passed back to administration & liaison officers to track and monitor with
parents/caregivers.
Tagai published “Attendance” and Being on Time” Posters to promote positive messages in the
community of the importance of going to school and going to school on time.
Tagai has commenced publishing attendance data weekly on the leader’s newsletter and the local newspaper. Significant work was undertaken to reduce unexplained absences.
Tagai has employed school welfare officers who have has a key role in case managing students who have less than 85% attendance rate to school.
National Assessment Program – Literacy and Numeracy (NAPLAN) results – our reading,
writing, spelling, grammar and punctuation, and numeracy results for the Years 3, 5, 7, and 9.
Our reading, writing, spelling, grammar and punctuation, and numeracy results for the Years 3, 5, 7 and 9 are available via the My
School website at http://www.myschool.edu.au/.
To access our NAPLAN results, click on the My School link above. You will then be taken to the My School website with the
following ‘Find a school’ text box.
Where it says ‘School name’, type in the name of the school you wish to view, select the school from the drop-down list and select <GO>. Read and follow the instructions on the next screen; you will be asked to confirm that you are not a robot then by clicking continue, you acknowledge that you have read, accepted and agree to the Terms of Use and Privacy Policy before being given access to the school’s profile webpage.
School NAPLAN information is available by selecting ‘NAPLAN’ in the menu box in the top left corner of the school’s profile webpage. If you are unable to access the internet, please contact the school for a paper copy of our school’s NAPLAN results.
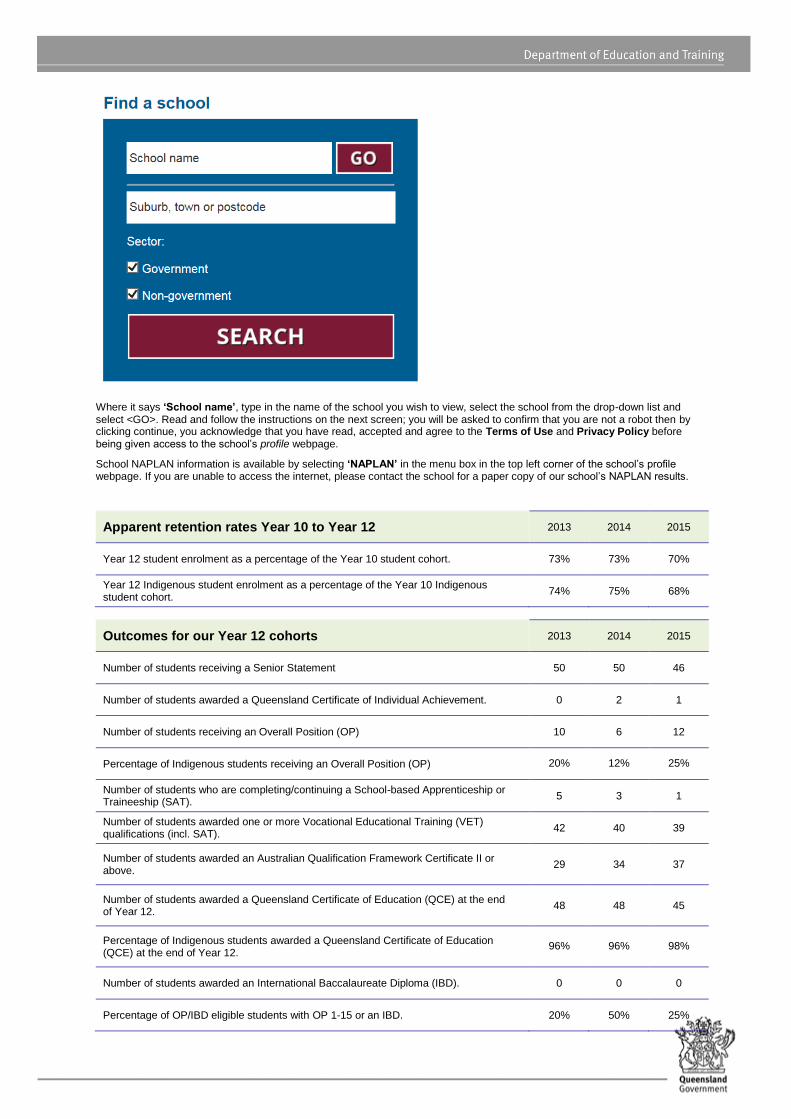
Outcomes for our Year 12 cohorts 2013 2014 2015
Number of students receiving a Senior Statement 50 50 46
Number of students awarded a Queensland Certificate of Individual Achievement. 0 2 1
Number of students receiving an Overall Position (OP) 10 6 12
Percentage of Indigenous students receiving an Overall Position (OP) 20% 12% 25%
Number of students who are completing/continuing a School-based Apprenticeship or Traineeship (SAT).
5 3 1
Number of students awarded one or more Vocational Educational Training (VET) qualifications (incl. SAT).
42 40 39
Number of students awarded an Australian Qualification Framework Certificate II or above.
29 34 37
Number of students awarded a Queensland Certificate of Education (QCE) at the end of Year 12.
48 48 45
Percentage of Indigenous students awarded a Queensland Certificate of Education (QCE) at the end of Year 12.
96% 96% 98%
Number of students awarded an International Baccalaureate Diploma (IBD). 0 0 0
Percentage of OP/IBD eligible students with OP 1-15 or an IBD. 20% 50% 25%
Apparent retention rates Year 10 to Year 12 2013 2014 2015
Year 12 student enrolment as a percentage of the Year 10 student cohort. 73% 73% 70%
Year 12 Indigenous student enrolment as a percentage of the Year 10 Indigenous student cohort.
74% 75% 68%
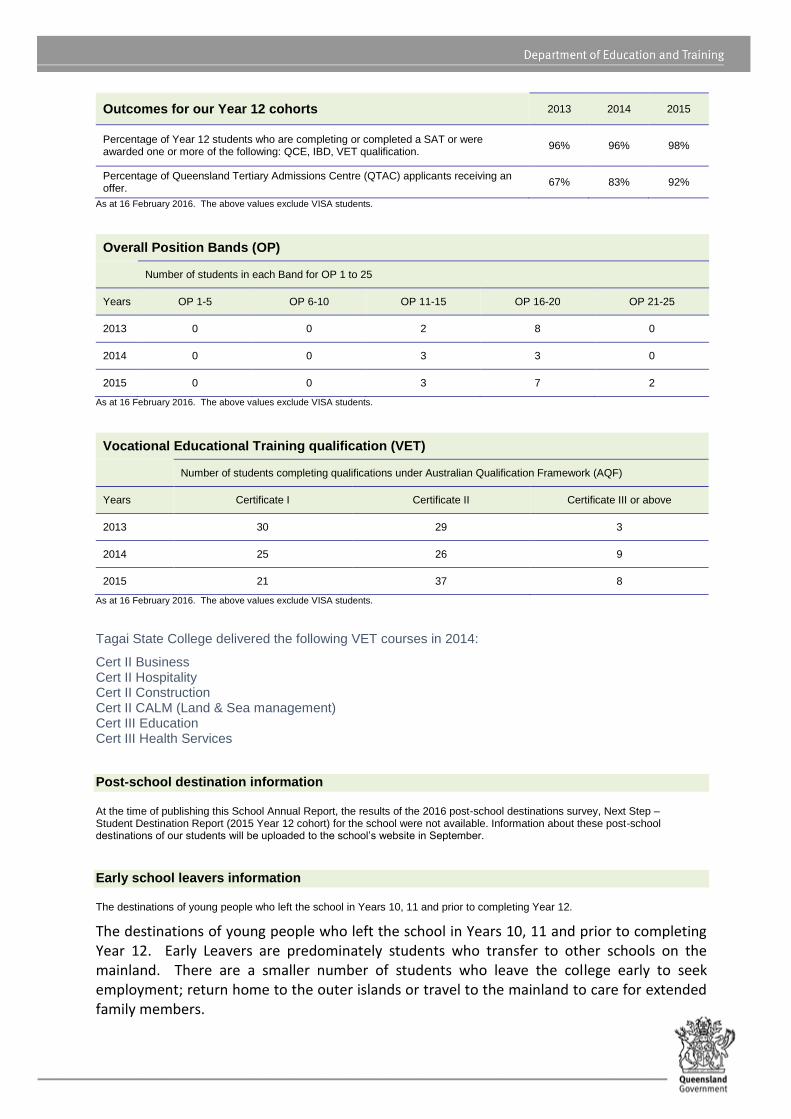
Outcomes for our Year 12 cohorts 2013 2014 2015
Percentage of Year 12 students who are completing or completed a SAT or were awarded one or more of the following: QCE, IBD, VET qualification.
96% 96% 98%
Percentage of Queensland Tertiary Admissions Centre (QTAC) applicants receiving an offer.
67% 83% 92%
As at 16 February 2016. The above values exclude VISA students.
As at 16 February 2016. The above values exclude VISA students.
As at 16 February 2016. The above values exclude VISA students.
Tagai State College delivered the following VET courses in 2014:
Cert II Business Cert II Hospitality Cert II Construction Cert II CALM (Land & Sea management) Cert III Education Cert III Health Services
Post-school destination information
At the time of publishing this School Annual Report, the results of the 2016 post-school destinations survey, Next Step – Student Destination Report (2015 Year 12 cohort) for the school were not available. Information about these post-school destinations of our students will be uploaded to the school’s website in September.
Early school leavers information
The destinations of young people who left the school in Years 10, 11 and prior to completing Year 12.
The destinations of young people who left the school in Years 10, 11 and prior to completing Year 12. Early Leavers are predominately students who transfer to other schools on the mainland. There are a smaller number of students who leave the college early to seek employment; return home to the outer islands or travel to the mainland to care for extended family members.
Overall Position Bands (OP)
Number of students in each Band for OP 1 to 25
Years OP 1-5 OP 6-10 OP 11-15 OP 16-20 OP 21-25
2013 0 0 2 8 0
2014 0 0 3 3 0
2015 0 0 3 7 2
Vocational Educational Training qualification (VET)
Number of students completing qualifications under Australian Qualification Framework (AQF)
Years Certificate I Certificate II Certificate III or above
2013 30 29 3
2014 25 26 9
2015 21 37 8
A more detailed analysis of tracking early leavers has been implemented in 2014. This has involved data collected from the secondary campus, Year 12 students & families; the 2 boarding facilities; outer island Heads of Campus and local council officers.