Embed Size (px)
Citation preview

Tailoring bioanalytical science strategies to support PKPD understanding at different stages of the project lifecycle
Paul MorganHead of Safety and ADME Translational Sciences Department, Drug Safety and Metabolism, AstraZeneca, Cambridge, UK
November 16th 2016

Aims of presentation
q Setting the scene – importance of bioanalytical quantification in PKPD
q Incorporating biological variability in preclinical PKPD predictions –cardiovascular case study
q Novel biomarker development and utilisation – case study in DILI
q Conclusions – how can bioanalytical community influence improved PKPD understanding
2

Quantification of PK and PD endpoints underpins PKPD and dose selection
• PKPD relationship governs dose response
• PK and PD variability impacts PKPD & dose
• Should bioanalyticalrobustness reflect biological variability of the system?
Effect
PD
PK
PKPD
3

Bioanalysis is the science to accurately and precisely document the concentration of a drug, metabolite or biomarker in a specific in vivo
compartment (plasma, tissue,..) as it was at the time it left the test system(animal, volunteer, patient,…..)
….and a lot can happen on the journey from the needle to the detector
[Courtesy of Philip Timmerman]
EBF: The science we need to manage
....even more variability can happen in the biological system as it is investigated from test tube to preclinical in vivo to clinical setting
4

Type 0 Biomarker that determine the disease state or the potential for therapeutic response or patient stratification (e.g. genotype or phenotype).
Type 1 The pharmacokinetics of the compound typically usually unbound plasma concentrations and/or target site exposure.
Type 2 Target occupancy via a direct measurement of receptor binding.(e.g. PET, autoradiography).
Type 3 An immediate biochemical response as a result of the interaction with the target (e.g. measure of signal transduction or a measure of an enzyme product).
Type 4A A physiological or tissue response directly linked to the pathophysiology.
Type 4B Parallel pharmacology driven through the same target but not directly linked to the pathophysiology.(e.g.differenttissues such as central vs peripheral)
Type 5 A biomarker of the pathophysiology(e.g. disease marker).
Type 6 Clinical measure of the outcome in a patient population approved by regulators (e.g. pain relief).
Lead Generation (LG)• Evaluation and selection of appropriate target
engagement biomarker (Type 2, 3 or 4) and optimization of PKPD study design.
• Use reference or lead compounds and target engagement biomarker to establish relationship between in vivo and in vitro potency.
• Establish the level of target engagement required for meaningful efficacy on the disease (Type 5) biomarker.
Target Validation (TV)• Translational plan outlining development
and evaluation of appropriate biomarkers to build PKPD understanding.
• If in vivo target validation model and a reference compound are available, applyPKPD principles to study design and ensurea sufficient duration and level of systemicunbound exposure relative the in vitro potency (also considering target class)
Lead optimization (LO) and Candidate selection• Clinical candidate criteria should be defined at start of LO based on
quantitative PKPD relationships established during LG.• Refinement of key relationships with higher quality compounds.• Target engagement PKPD as a driver for compound optimization.• For clinical candidate compound: estimate therapeutic concentration
time profile based on the PKPD relationship developed in preclinical species, and translation knowledge like differences PK, target potency and system properties
• Integration of PKPD for safety parameters to assess safety margin.
Generic MBDDx aspirations and criteria for Drug discovery phases
Animal
Human
Type 5Pathophysiology
or DiseaseProcess
Type 6Outcome
Type 5Pathophysiology
or DiseaseProcess
Type 6Outcome
Type 2Target
Occupancy
Type 3Target
Mechanism
Type 4APhysiological
Response
Type 4BPhysiological
Response
Type 0Genotype/phenotype
Type 1Drug
Concentration
Type 2Target
Occupancy
Type 3Target
Mechanism
Type 4APhysiological
Response
Type 4BPhysiological
Response
Type 0Genotype/phenotype
Type 1Drug
Concentration
Quantitative relationship between biomarkers
PoCPoPPoMPHC
Interspecies translational relationship
Transduction to Efficacy/SafetyTarget Exposure Target Engagement
TargetOccupancy
kon
koff
Target Mechanism
Disease Process
OutcomePatho-physiology
CpDose Ce
Plasma
keo
Targetsite
PHARMACOKINETICS PHARMACODYNAMICS
Compound-specific properties System-specific propertiesA
B
C
Quantitative pharmacology relationships and nomenclature
Visser et al, Model-based drug discovery: implementation and impact, Drug Discovery Today, 18: 764-775, 20135

AZ holistic cardiovascular strategy
6
Cardiovascular effects
• ECG
• Haemodynamics
• Pathological damage to myocardium and vasculature
• Blood function – Platelet function
In vitro molecular
assays
In vitro phenotypic
assays
In vivo models
In silico / systems pharmacology
modelling
Aspiration: To apply quantitative human-relevant translational understanding for CV safety risk assessment

Most confidence in translational, quantitative, prediction of QT
7
• Strategy evolved over 15 years based on improved knowledge and focussed investment• At candidate nomination, provide integrated assessment using non-GLP hERG data & QT data from dog plus g.pig• Quantitative relationships A and B underpin risk assessment

What value does GLP hERG bring? Measured versus nominal concentrations in 54 GLP hERG studies
8
• For 10 compounds, measured concentration was <75% of nominal concentrationCourtesy of Chris Pollard, AZ

Impact on IC50 of using measured versus nominal concentration
9
• Even for compounds with largest “loss”, impact on IC50 < 0.5 log10 unit
• In summary, measurement of concentrations:
– provides assurance of exposure to test compound
– prevents small under-estimate of potency for some compounds
• Warranted? Does it add to confidence in PKPD understanding?
0.1
1
10
100
1000
0.1 1 10 100 1000
IC50ba
sedon
nom
inalco
ncen
tration
IC50 basedonmeasuredconcentrationCourtesy of Chris Pollard, AZ

Using Bayesian inference model to predict probability of safety risk• Uncertainty is always represented
with a probability distribution.
• Set up a statistical model that addresses the research question; include everything relevant that you know, and also what you want to learn (unknowns).
• Use what you know to predict what you don't.
10
11
Predicting probability of QT prolongation using Bayesian models
Input parameters:
Uncertainty captured by shape of distribution
Dataset: n = 22 compounds
AZ 1AZ 2AZ 3AZ 4AZ 5AZ 6AZ 7MoxifloxacinAZ 8AZ 9AZ 10AZ 11AZ 12AZ 13ViozanAZ 14AZ 15AZ 16AZ 17AZ 18AZ 19AZ 20
AZ 6 AZ 19
AZ 8 AZ 9
Courtesy of Chris Pollard & Stan Lazic, AZ

Pre-FTIH candidate à Probability of QT increase?
12
• Assume we observe a hERG IC50 value of 3.16 uM.• Want to predict Human QT given several Human Cmax values (“what-if” scenarios).
q Does increasing bioanalytical complexity from early discovery to GLP dog telemetry reduce uncertainty?

Does increasing bioanalytical complexity from discovery to GLP telemetry impact uncertainty of QT risk?
§ Analytical uncertainty reduced but bear in mind that principal variables in QT risk prediction are hERGpotency and human Cmax estimate13
hERG screenAnaesth. g.pig CVhERG GLPGLP dog telemetryGLP pivotal tox
Increasing bioanalyticalcomplexity, resource and guidelines

14
Chemical insults & pathogenic mechanisms of DILI
DrugAccumulationMetabolism
• Acutefattyliverwithlacticacidosis• Acutehepaticnecrosis• Acuteliverfailure• Acuteviralhepatitis-likeliverinjury• Autoimmune-likehepatitis• Blandcholestasis• Cholestatic hepatitis• Cirrhosis• Immuno-allergichepatitis• Nodularregeneration• Nonalcoholic fattyliver• Sinusoidalobstructionsyndrome• Vanishingbileductsyndrome
DiverseClinicalPresentationsofDILI1. Mitochondrialimpairment
2. Inhibitionofbiliaryefflux
3. Lysosomal impairment
4. Reactivemetabolites/CovalentBinding
ChemicalstressImmuneactivation
5. InflammationImmuneSystem
InnateAdaptive
DRUGUPTAKE
CLEARANCE DILIcanpresentwithmultiple:varyingphenotypesclinical&histopathologicalfeatures
Asingle‘hepatotoxicitysignature’isunlikelyDILIpatientsprovidemechanisticclues

Drug induced liver injury – A consequence of multiple steps
15

Drug-induced liver injury: biomarker considerations
16
• Circulating biomarkers used for non-invasive DILI assessment- Clinic & pre-clinical toxicity screening
• Clinical DILI:- Unable to distinguish serious / benign DILI with ALT
• Preclinical DILI- Animal–human concordance is 50%1,2,3
- Attrition in biomarker translation
• Caveats with current biomarkers3,4
- ALT in muscle & kidney - ALT variation - circadian / enzyme induction- AST in heart, muscle, kidney & erythrocytes- LDH not specific
1Olson et al.2000; 2Greaves et al. 2004; 3Amacher. 2010; 4Dufour et al., 2000
Better translational biomarkers are requiredCourtesy of Dominic Williams

Likely mechanistic hepatic safety biomarker panel
Hepatocyte
Immune cell
IMMUNECELLACTIVATION
APOPTOSIS MITOCHONDRIALDYSFUNCTION
NECROSIS
HEPATOCYTEINJURY
HMGB1
Keratin-18 (FL)
ALT
GLDHKeratin-18 (CC)
miR-122
HMGB1
HMGB1-Acetyl
Informmedicinalchemist,toxicologist,clinical,regulatorandpublic– whatpurposearetheyfitfor?
17

18
ExploratoryDILI Biomarkers– whatisneededtounderpintheirutilityinunderstandingandtranslationofhepaticinjury?
• RegulatoryAcceptanceisinplace:• FDA,EMA,C-PATHsupportexploratoryDILIbiomarkers
• Cytokeratin18(cleaved+full),HMGB1(Ac&total),Osteopontin,CSF1• miR122,GLDHduetoprovenbenefitinacetaminophenoverdose
Courtesy of Dominic Williams
• Quantitativeassays:• Experimentalassaysinplaceforallbiomarkers• AcetylatedHMGB-1leastmature?• NeedsfurtherworkonSOPsandassayrobustness• Butexperimentalutilityneedstoberecognised
• TranslationalGaps:• Sparsepre-clinicalandpatientknowledgebase• Needcross-speciestranslation,e.g.rat,dog,NHP comparisontohumanandtoALT,etc• Needfurtherevaluationininvitromodels,e.g.HumanHeps,Hepatic3D&MPSmodels• Prognosticcapability– willbiomarkerprofileindicateseverityoutcome• Strengthenunderstandingforhepatotoxicity mechanisms

Exploratory Biomarkers for DILI:Bridging to/from Man to Animal Model to In Vitro
BioanalysisBiomarkers
Patients
DRUG
ADRmechanism
D a y 1
1 0 -6 . 0 1 0 -5 . 5 1 0 -5 . 0 1 0 -4 . 5 1 0 -4 . 0
0
2 5
5 0
7 5
1 0 0
1 2 5
0 .0
2 .5
5 .0
7 .5
1 0 .0
1 2 .5
[ C h lo rp ro m a z in e ] (M )%
Via
bil
ity
of
Co
ntr
ols
Fo
ld C
ha
ng
e in
miR
-12
2R
ela
tive
to V
eh
icle
Co
ntro
l
HepaticSpheroidsmiR122
19

Exploratory Biomarkers for DILI:Bridging to/from Man to Animal Model to In Vitro
BioanalysisBiomarkers
Patients
DRUG
ADRmechanism
D a y 1
1 0 -6 . 0 1 0 -5 . 5 1 0 -5 . 0 1 0 -4 . 5 1 0 -4 . 0
0
2 5
5 0
7 5
1 0 0
1 2 5
0 .0
2 .5
5 .0
7 .5
1 0 .0
1 2 .5
[ C h lo rp ro m a z in e ] (M )
% V
iab
ilit
y o
f C
on
tro
ls
Fo
ld C
ha
ng
e in
miR
-1
22
Re
lativ
e t
o V
eh
icle
Co
ntro
l
HepaticSpheroidsmiR122
Appropriate bioanalytical criteria & validation – recognising exploratory stage of their use and utility
20

Conclusionsq Bioanalysis provides fundamental quantitative data to underpin
PKPD modelling and understanding
q Increasingly complex strategies are needed for drug, biomarkers, delivery systems to inform PKPD hypothesis testing & understanding across project lifecycle, ultimately for regulatory useq These do not fit neatly into traditional non-GLP and GLP framework
q Bioanalytical community has significant role to play in developing appropriate science strategies that meet the need to inform PKPDunderstanding – right assay at right time
21

Acknowledgements
Chris PollardStan Lazic
Jay MettetalMark AndertonOwen Jones
Dominic WilliamsAmanda Wilson
Philip Timmerman
22

Confidentiality Notice This file is private and may contain confidential and proprietary information. If you have received this file in error, please notify us and remove it from your system and note that you must not copy, distribute or take any action in reliance on it. Any unauthorized use or disclosure of the contents of this file is not permitted and may be unlawful. AstraZeneca PLC, 2 Kingdom Street, London, W2 6BD, UK, T: +44(0)20 7604 8000, F: +44 (0)20 7604 8151, www.astrazeneca.com
23

Quantitative and Translational science core delivery for AZ Drug Safety & Metabolism
24
Target Organ Safety
CVS CNS
Hepatic Lung
Renal G.I.
Free Drug
TargetSoluble
Drug
SYSTEMIC CIRCULATION
GUT LIVER
Solubility
Permeability
First Pass Metabolism
Transporters
Bound Drug
Protein Binding
TISSUE
Distribution
Elimination
TargetedDrug Delivery
Polymorphic Metabolism
CYP Inhibition
CYP Induction
Transporters
Effect
TD
TK
TKTDPK/PD &
Empirical models
Bioanalysis & In Vitro & In Vivo
Models
Systems Pharmacology/
Mechanism based models
ADME / PK

Should bioanalytical rigour be tailored to system variability rather than project phase?
Regulatory Validation• pre-study validation• Min. 3 P&A runs• Likely 6+ runs in total• 15% P&A (20% at LLOQ)• ME, recovery, co-meds etc.• Dilution integrity• Selectivity incl. haemolysed & lipemic• Stability: LTS, BT, F-T• etc...
Scientific Validation• Single run pre-study validation when it
makes sense to do so
• Consider in-study validation for certain elements (e.g. stability, dilution integrity)
• Combine stability experiments to simplify
• Wider P&A criteria may be appropriate for the end point decision (e.g. 20%/25%)
vs

Cardiovascular Safety: holistic systems approach
26 Courtesy of Teresa Collins, AZ Refer to: Modelling and Simulation Approaches for Cardiovascular Function and Their Role in Safety Assessment; Collins et al.;CPT: Pharmacometrics and Systems Pharmacology (2015)

CV Example – Motivation for Modelling0 mg/kg2.5 mg/kg5 mg/kg15 mg/kg
Key question: What effect would be expected in clinic?-Different PK in human than in dog-Effect lags behind exposure-Changing baseline - Circadian rhythm-Data noisy
Modelling can help!

An “Effect Compartment” model is useful when PD is delayed behind the measured PKCaptures delay between plasma concentration, and concentration at site of action
Effect Compartment Model
28Time
TimePl
asm
a PK
PD
PKPD
PD
kePK
PK
TimeEffe
ct C
omp
PK
PK
PD
Plasma
EffectComp.

Model fits and parameters
29 Time (hr)
Time (hr)
Time (hr)
Time (hr)
HR
(bpm
)H
R (b
pm)
HR
(bpm
)H
R (b
pm)
Parameter Estimate (%CV)
HR baseline (bpm) 85.6 (8%)
Amplitude 17.94(12%)
Tshift 27.3 (1%)
ke0 (hour-1) 0.14 (28%)
Total slope 8.92 (27%)
Unbound slope 27.0Animal 1001 Animal 1002
Animal 1003 Animal 1004
Teresa Collins DSM – Translational Safety

Prediction of effect at predicted therapeutic dosePrediction technique:- Projected Human PK- Dog PK/PD relationship- Range of projected human dosesSimulate Human PK and PD
30
CpuCeuHR
Predicted Efficacious Dose Scenarios Predicted HR change
Lowest Expected Dose 9 bpm
Low-Mid Expected Dose 13 bpm
High-Mid Expected Dose 10 bpm
Highest Expected Dose 17 bpm

Large
Medium
Small
PK/PD modelling for SafetyWhen are models needed?
31
Safe
ty
Mar
gin
Will the margin erode over time?(Mainly a concern with chronic toxicities rather than acute)
Can we refine the analysis to more clearly identify if this is a good or bad situation?
Can schedule be identified that would increase margin?What is mechanism of action (inform backup program)?

Modeling and Informatics Approaches Fit for purpose
Effect
TD
TK
TKTD
PK/PD &Empirical models
Mechanism based models
Informatics ApproachesMachine Learning & Data Mining
Narrow Broad
Shal
low
Dee
p
Data Types
Dat
a Q
uant
ity
“Old Fashioned Elbow Grease”

Mechanistic/Systems-Models in Analysis and Translation
33
Raw Data“Preclinical”
Mechanistic Model
“Humanized” Mechanistic Model
Predicted Human PK
Human Parameters
HumanPrediction
System Specific Parameters (e.g. Prior experience or Literature)
Compound Specific Parameters
Insight on Mechanism & Potency
Technical:•Models are specific to the system being studied
•Distinguish between “system-specific” and “compound-specific” parameters
•Data from multiple sources
•Can provide insight into mechanisms of action
•Can incorporate known differences between species
Operational:•More complex structure requires more time and data to build
•Longer lead time requires strategic investments
Population Parameters “Population”
Mechanistic Model
Population Prediction
Predicted Pop. PK

Types of DILI biomarkersEarly biomarkers with improved hepatocyte specificity• microRNA-122 (miR-122)
• Small non-coding RNAs (20-25 nt), Negatively regulate gene expression• Marked tissue specificity and high abundance (miR-122 only expressed in liver, 70% of total hepatic miRNA)• Translational sequences, no PTMs• Stable and present in a wide range of biofluids• Simple amplification assay – qPCR
Early biomarkers with mechanistic specificity• Keratin-18 (cytokeratin-18, K18)
• Intermediate filament (structure and support)• Present in epithelial cells• Abundant in liver – 5% total hepatic protein• Caspase target during apoptosis (DALD/S motif)• Detectable in blood (fragment – apoptosis, full length – necrosis)
• High Mobility Group Box-1 (HMGB1)• 25 kDa chromatin binding protein• Regulates transcription (DNA binding)• DAMP – ligand for TLR4, RAGE, CXCR4• Necrosis – passive release (DILI biomarker)• Active immune cell secretion (requires NLS acetylation)• Redox regulation
Cys 23
Cys 45
S
S
Cys 106
SOHorSO2HorS03H

Translatable Hepatic DILI Biomarkers
35
FDA&EMA haveissuedaletterofsupporttoSAFE-Ttoencouragefurtherworkonspecifichepaticbiomarkers(ongoing);StatusofDILI biomarkerassayutilisation:
http://www.fda.gov/Drugs/DevelopmentApprovalProcess/ucm434382.htm
Biomarker Liverspecific
Mechanism Detection TranslatedDILI Preclinicalspecies
CK18full No Necrosis ELISAkit Mo, Hu Lackofassays
CK18cleaved No Apoptosis ELISAkit Mo, Hu Lack of assays
HMGB1(tot) No Necrosis ELISAAb Mo, Hu Yes
HMGB1(-Ac) No Innateimmuneactivation ProteomicMS Mo, Hu Yes
miR122 Yes Necrosis PCR(let-d7dCt) Mo, Hu Yes
GLDH No Mitochondrialdamage Absorbancekit Mo, Hu Yes
Osteopontin No Fibrosis/cholestasis ELISA Yes
M-CSF1 No Regeneration ELISA ?

129 patients – Early admission (< 24hr) following APAP overdose (70% of all APAP patients)
ALT/INR and timed APAP plasma concentration
N = 28 (22%) with ALT > ULN N = 101 (78%) with ALT < ULN
N = 15 go on to develop ALT > 3x
ULN
N = 86 with ALT that remain within normal
range
Patient journey
Novel biomarkers at presentation to
predict ALI early?
Biomarkers for early detection of hepatic injury
37

DJ Antoine et al 2013 Hepatology
Biomarkers for early detection of hepatic injury
• 101 patients present with normal ALT
• At later time points:• 86 stay below 3xULN• 15 rise above 3xULN
• miR-122, HMGB1 and FL-K18 are elevated at presentation when ALT was less than 3xULN
• But who later developed >3xULT ALT
Better understanding of the translation of pre-clinical to clinical biomarkers are required37
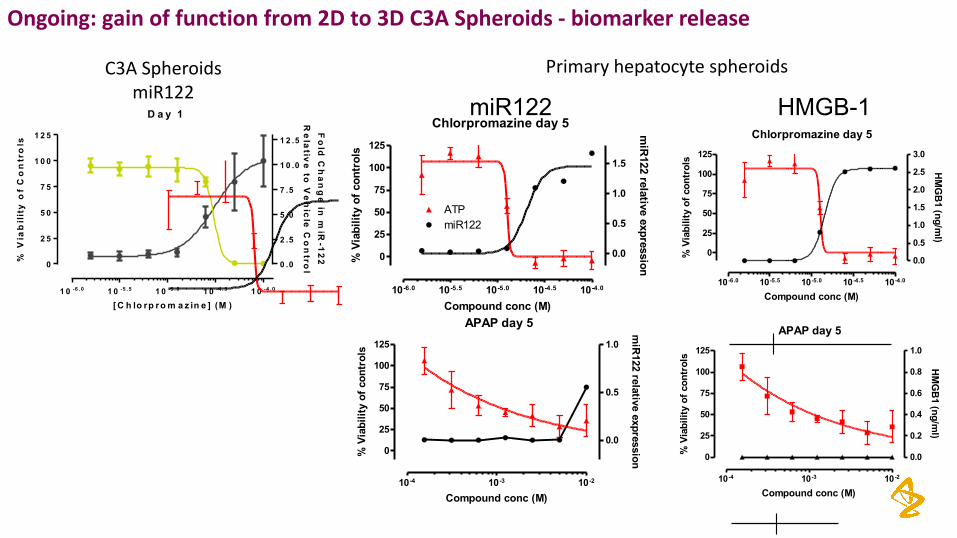
Ongoing: gainoffunctionfrom2Dto3DC3ASpheroids- biomarkerrelease
D a y 1
1 0 -6 . 0 1 0 -5 . 5 1 0 -5 . 0 1 0 -4 . 5 1 0 -4 . 0
0
2 5
5 0
7 5
1 0 0
1 2 5
0 .0
2 .5
5 .0
7 .5
1 0 .0
1 2 .5
[ C h lo rp ro m a z in e ] (M )
% V
iab
ilit
y o
f C
on
tro
ls
Fo
ld C
ha
ng
e in
miR
-12
2R
ela
tive
to V
eh
icle
Co
ntro
l
C3ASpheroidsmiR122
Chlorpromazine day 5
10-6.0 10-5.5 10-5.0 10-4.5 10-4.0
0
25
50
75
100
125
0.0
0.5
1.0
1.5
2.0
2.5
3.0
EC50 ~ 1.256e-005HMGB1
1.430e-005
HMGB1ATP
Compound conc (M)
% V
iabi
lity
of c
ontr
ols
HMG
B1 (ng/ml)
APAP day 5
10-4 10-3 10-2
0
25
50
75
100
125
0.0
0.2
0.4
0.6
0.8
1.0
EC50ATP
~ 7.990e-010
Compound conc (M)
% V
iabi
lity
of c
ontr
ols
HMG
B1 (ng/ml)
HMGB-1
APAP day 5
10-4 10-3 10-2
0
25
50
75
100
125
0.0
0.5
1.0
Compound conc (M)
% V
iabi
lity
of c
ontr
ols
miR122 relative expression
Primaryhepatocytespheroids
Chlorpromazine day 5
10-6.0 10-5.5 10-5.0 10-4.5 10-4.0
0
25
50
75
100
125
0.0
0.5
1.0
1.5
miR122ATP
Compound conc (M)
% V
iabi
lity
of c
ontr
ols
miR122 relative expression
Chlorpromazine day 5
10-6.0 10-5.5 10-5.0 10-4.5 10-4.0
0
25
50
75
100
125
0.0
0.5
1.0
1.5
miR122ATP
Compound conc (M)
% V
iabi
lity
of c
ontr
ols
miR122 relative expression
miR122

![[Pk Webtool Software] Software for Optimal Design Software for Optimal Design in Population Pkpd- In Population Pkpd- A Comparison](https://img.pdfslide.net/doc/110x75/577d29921a28ab4e1ea73219/pk-webtool-software-software-for-optimal-design-software-for-optimal-design.jpg)