Embed Size (px)
Citation preview


TAKE ON THE MARKETStay up-to-date on current market trends with our TAKE ON THE
MARKET webinar series. Every Friday, our senior product coaches
deliver insight, tips and guidance for investors looking for an edge.
Alongside the timely market analysis, you’ll find evergreen strategies
for improving your returns and outperforming the market.
Don’t miss this weekly video. The market never stops, and neither does MarketSmith®.
View at: Marketsmith.com/Webinar or youtube.com/MarketSmith1
Stock Guide // 2018 Q1
In this edition of the MarketSmith stock guide, we’ll look to the year ahead with an eye on earnings. Earnings reports can result in wild swings in a stock’s price—for better or worse. Smart investors can benefit from the skittish being shaken out of a top stock because of a lack of conviction. The keys are doing your homework on the company, knowing what to expect from the earnings reports and making sure you have a profit buffer to minimize risk. This quarter, we have a customer success story (and good stock-picking insight) from Steve Swetz, a full-time investor who first got started by reading Bill O’Neil’s book “How to Make Money in Stocks.” Recently, Steve bought into Warrior Met Coal right before a big breakout and extended run thanks to a custom MarketSmith screen that looks for newer IPOs with strong fundamentals. He shares this screen, as well as some advice about how to become a better investor by joining a meetup group. In the Coaches Corner, we introduce Scott St. Clair, a MarketSmith coach, webinar host and featured speaker at many IBD® Trading Summits. A former stockbroker, Scott is now sharing his years of firsthand market experience and knowledge with MarketSmith members every day. He’ll share some important lessons and tips he’s learned along the way, including a surprising tip from Scott O’Neil that changed the way he holds his top-performing stocks in a correction. As always, if you have any questions or comments about your investing research or any MarketSmith features, please call one of our product coaches at (800) 831-2525 or email us at [email protected]. We’re here to help you make more money in the market. Best Returns, The MarketSmith Team

2
Marketsmith.com // 2018 Q1 l Market Charts
S & P 500 INDEXCLOSE 2673.61
2400.98
2453.82
2490.87
2694.97
2233.62
2322.25
2352.72
2405.702417.35
2557.45
50 DAY MOVING AVERAGE
200 DAY MOVING AVERAGE
2250
2300
2350
2400
2450
2500
2550
2600
2650
2700
DAILY VOLUME AND 50-DAY AVERAGE DAILY VOLUME LINE
400 M
750 M
1.3 B
2.3 B
29151173206228251128143016219521724102410271330
DECNOVOCTSEPAUGJULJUNMAYAPRMARFEBJAN 2017
NASDAQ COMPOSITECLOSE 6903.39
6341.69
6460.84
7003.89
5371.89
5769.39
5996.82
6081.96
6177.18
6517.93
6734.136734.13
50 DAY MOVING AVERAGE
200 DAY MOVING AVERAGE
5350
5450
5550
5650
5750
5850
5950
6050
6150
6250
6350
6450
6550
6650
6750
6850
6950
7050
DAILY VOLUME AND 50-DAY AVERAGE DAILY VOLUME LINE
750 M
1.4 B
2.3 B
3.5 B
29151173206228251128143016219521724102410271330
DECNOVOCTSEPAUGJULJUNMAYAPRMARFEBJAN 2017
S&P 500 Index
NASDAQ Composite
3
*All screen results are computer-generated and were run on December 29, 2017.
Market Charts . . . . . . . . . . . . . . . . . . . . . . . . . . . . . . . . . . . . . . . . . . . . . . . . . 2Feature Article: Earnings Reward the Best and Shake out the Rest . . . . . . . . . . . . . . . . . 4Strong Earnings Reporters* . . . . . . . . . . . . . . . . . . . . . . . . . . . . . . . . . . . . . 6 Constellation Brands A (STZ) . . . . . . . . . . . . . . . . . . . . . . . . . . . . . . . . . .7 K B Home (KBH). . . . . . . . . . . . . . . . . . . . . . . . . . . . . . . . . . . . . . . . . . . . .7 Global Payments Inc (GPN) . . . . . . . . . . . . . . . . . . . . . . . . . . . . . . . . . . .8 Synnex Corp (SNX) . . . . . . . . . . . . . . . . . . . . . . . . . . . . . . . . . . . . . . . . . . .8 Neogen Corp (NEOG) . . . . . . . . . . . . . . . . . . . . . . . . . . . . . . . . . . . . . . . .9 Walgreens Boots Alliance (WBA) . . . . . . . . . . . . . . . . . . . . . . . . . . . . . . .9
Customer Success Story: Steve Swetz . . . . . . . . . . . . . . . . . . . . . . . . . . . . 10 Dynamic Newer Stocks* . . . . . . . . . . . . . . . . . . . . . . . . . . . . . . . . . . . . . . . . 12 Alibaba Group Hldg Ads (BABA) . . . . . . . . . . . . . . . . . . . . . . . . . . . . . . .13 Canada Goose Hldgs Cl A (GOOS) . . . . . . . . . . . . . . . . . . . . . . . . . . . . .13 Floor & Decor Hldgs Cl A (FND) . . . . . . . . . . . . . . . . . . . . . . . . . . . . . . .14 Gardner Denver Holdings (GDI) . . . . . . . . . . . . . . . . . . . . . . . . . . . . . . . .14 Daqo New Energy Corp Ads (DQ) . . . . . . . . . . . . . . . . . . . . . . . . . . . . . .15 China Lodging Group Ads (HTHT) . . . . . . . . . . . . . . . . . . . . . . . . . . . . . .15
MarketSmith® Coaches Corner: Scott St. Clair . . . . . . . . . . . . . . . . . . . . . 16RS Line at New High* . . . . . . . . . . . . . . . . . . . . . . . . . . . . . . . . . . . . . . . . . . 18 Ampio Pharmaceuticals (AMPE) . . . . . . . . . . . . . . . . . . . . . . . . . . . . . . .19 Anaptysbio Inc (ANAB) . . . . . . . . . . . . . . . . . . . . . . . . . . . . . . . . . . . . . . .19 Argenx SE Ads (ARGX) . . . . . . . . . . . . . . . . . . . . . . . . . . . . . . . . . . . . . . .20 Daqo New Energy Corp Ads (DQ) . . . . . . . . . . . . . . . . . . . . . . . . . . . . . .20 Immunomedics Inc (IMMU) . . . . . . . . . . . . . . . . . . . . . . . . . . . . . . . . . . .21 Neptune Tech & Bioresrc (NEPT) . . . . . . . . . . . . . . . . . . . . . . . . . . . . . . .21
MarketSmith® Features Highlight: Earnings . . . . . . . . . . . . . . . . . . . . . . . 22Resources . . . . . . . . . . . . . . . . . . . . . . . . . . . . . . . . . . . . . . . . . . . . . . . . . . . . . 24 Connect with Us . . . . . . . . . . . . . . . . . . . . . . . . . . . . . . . . . . . . . . . . . . . . . . . 25
Table of Contents
4
Marketsmith.com // 2018 Q1 l Feature Article
Feature Article: Earnings Reward the Best and Shake out the Rest
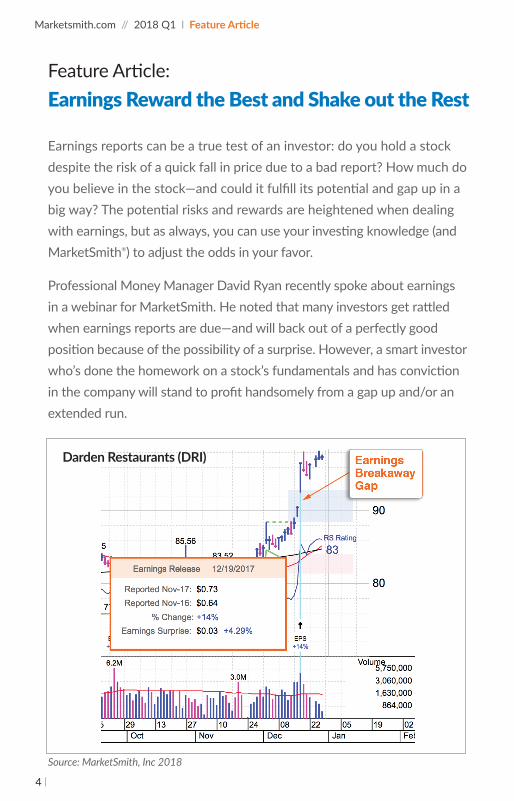
Earnings reports can be a true test of an investor: do you hold a stock despite the risk of a quick fall in price due to a bad report? How much do you believe in the stock—and could it fulfill its potential and gap up in a big way? The potential risks and rewards are heightened when dealing with earnings, but as always, you can use your investing knowledge (and MarketSmith®) to adjust the odds in your favor.
Professional Money Manager David Ryan recently spoke about earnings in a webinar for MarketSmith. He noted that many investors get rattled when earnings reports are due—and will back out of a perfectly good position because of the possibility of a surprise. However, a smart investor who’s done the homework on a stock’s fundamentals and has conviction in the company will stand to profit handsomely from a gap up and/or an extended run.
Source: MarketSmith, Inc 2018
Darden Restaurants (DRI)
5
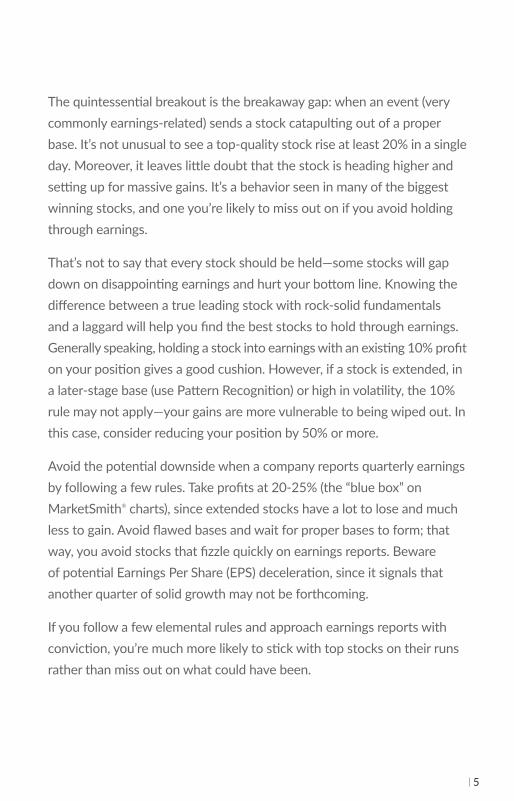
The quintessential breakout is the breakaway gap: when an event (very commonly earnings-related) sends a stock catapulting out of a proper base. It’s not unusual to see a top-quality stock rise at least 20% in a single day. Moreover, it leaves little doubt that the stock is heading higher and setting up for massive gains. It’s a behavior seen in many of the biggest winning stocks, and one you’re likely to miss out on if you avoid holding through earnings.
That’s not to say that every stock should be held—some stocks will gap down on disappointing earnings and hurt your bottom line. Knowing the difference between a true leading stock with rock-solid fundamentals and a laggard will help you find the best stocks to hold through earnings. Generally speaking, holding a stock into earnings with an existing 10% profit on your position gives a good cushion. However, if a stock is extended, in a later-stage base (use Pattern Recognition) or high in volatility, the 10% rule may not apply—your gains are more vulnerable to being wiped out. In this case, consider reducing your position by 50% or more.
Avoid the potential downside when a company reports quarterly earnings by following a few rules. Take profits at 20-25% (the “blue box” on MarketSmith® charts), since extended stocks have a lot to lose and much less to gain. Avoid flawed bases and wait for proper bases to form; that way, you avoid stocks that fizzle quickly on earnings reports. Beware of potential Earnings Per Share (EPS) deceleration, since it signals that another quarter of solid growth may not be forthcoming.
If you follow a few elemental rules and approach earnings reports with conviction, you’re much more likely to stick with top stocks on their runs rather than miss out on what could have been.
6
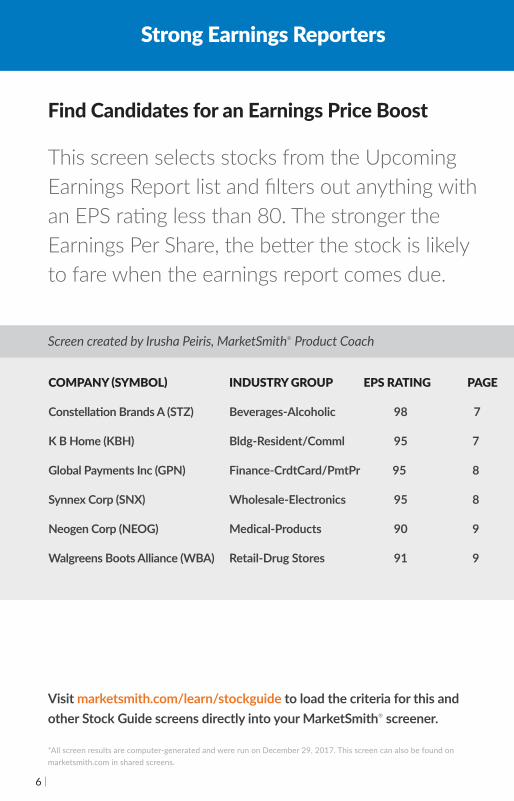
Find Candidates for an Earnings Price Boost
This screen selects stocks from the Upcoming Earnings Report list and filters out anything with an EPS rating less than 80. The stronger the Earnings Per Share, the better the stock is likely to fare when the earnings report comes due.
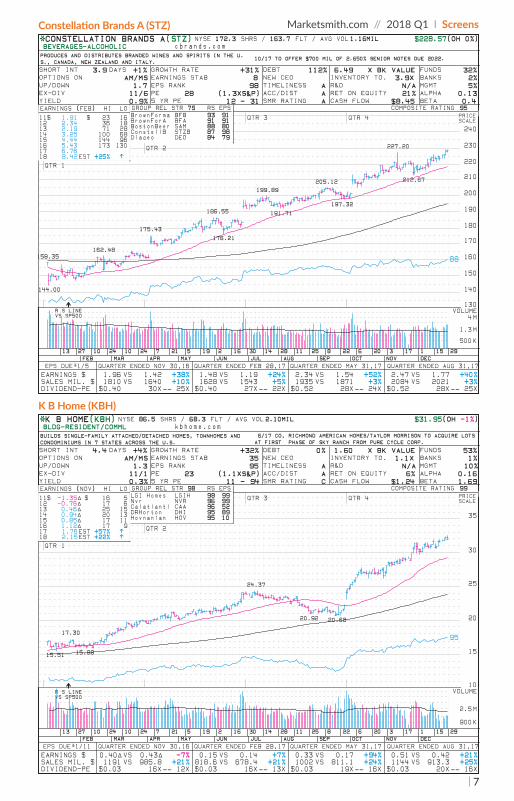
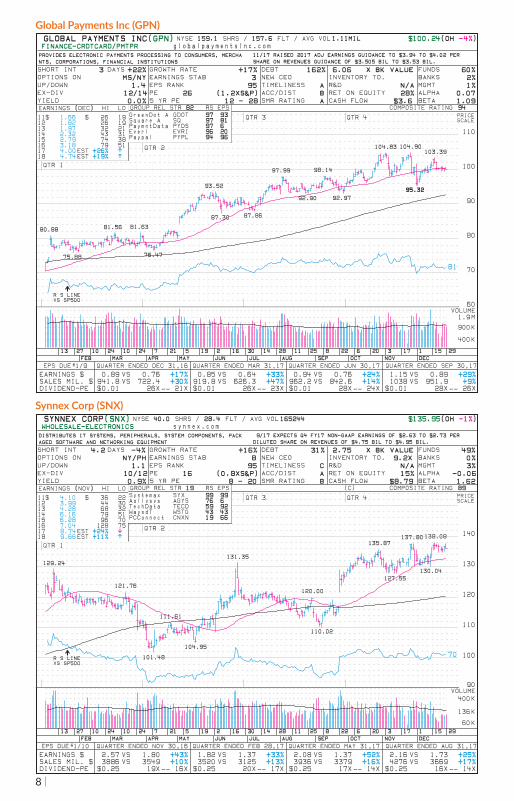
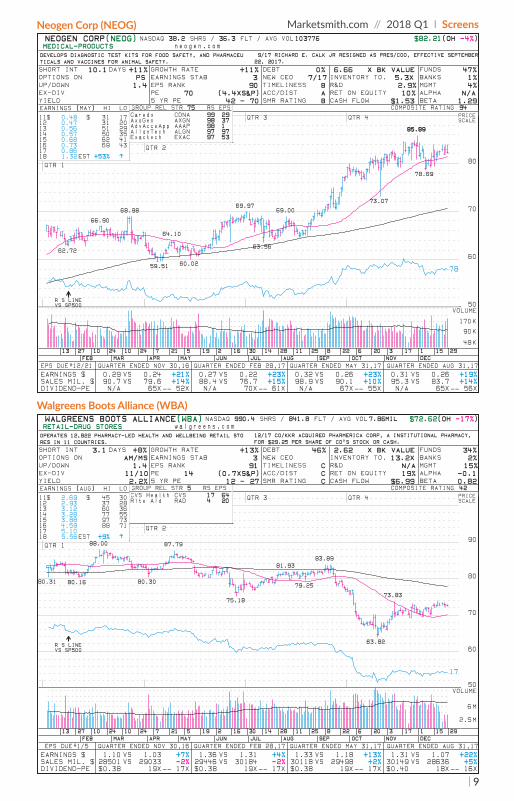
Strong Earnings Reporters
COMPANY (SYMBOL) INDUSTRY GROUP EPS RATING PAGE
Constellation Brands A (STZ) Beverages-Alcoholic 98 7
K B Home (KBH) Bldg-Resident/Comml 95 7
Global Payments Inc (GPN) Finance-CrdtCard/PmtPr 95 8
Synnex Corp (SNX) Wholesale-Electronics 95 8
Neogen Corp (NEOG) Medical-Products 90 9
Walgreens Boots Alliance (WBA) Retail-Drug Stores 91 9
Visit marketsmith.com/learn/stockguide to load the criteria for this and other Stock Guide screens directly into your MarketSmith® screener.
*All screen results are computer-generated and were run on December 29, 2017. This screen can also be found on marketsmith.com in shared screens.
Screen created by Irusha Peiris, MarketSmith® Product Coach
7
Marketsmith.com // 2018 Q1 l ScreensConstellation Brands A (STZ)
K B Home (KBH)
*CONSTELLATION BRANDS A(STZ) NYSE 172.3 SHRS / 163.7 FLT / AVG VOL1.16MIL $228.57(OH 0%)BEVERAGES-ALCOHOLIC cbrands.comPRODUCES AND DISTRIBUTES BRANDED WINES AND SPIRITS IN THE U.S., CANADA, NEW ZEALAND AND ITALY.
10/17 TO OFFER $700 MIL OF 2.650% SENIOR NOTES DUE 2022.
SHORT INT 3.9 DAYS +1%OPTIONS ON AM/MSUP/DOWN 1.7EX-DIV 11/6YIELD 0.9%
GROWTH RATE +31%EARNINGS STAB 8EPS RANK 98PE 28 (1.3XS&P)5 YR PE 12 - 31
DEBT 112%NEW CEOTIMELINESS AACC/DIST ASMR RATING A
6.49 X BK VALUEINVENTORY TO. 3.9XR&D N/ARET ON EQUITY 21%CASH FLOW $8.45
FUNDS 32%BANKS 2%MGMT 5%ALPHA 0.13BETA 0.4
158.35162.48
175.43
186.55
199.89205.12
227.20
144.00
176.21
191.71197.32
212.67
88
QTR 4QTR 3
QTR 2
QTR 1
130
140
150
160
170
180
190
200
210
220
230
240
PRICE SCALE
95COMPOSITE RATING11$ 1.91 $ 23 1612 2.34 36 1813 2.19 71 2814 3.25 100 6815 4.44 144 9616 5.43 173 13017 6.7618 8.42EST +25% ↑
EARNINGS (FEB) HI LOBrownForma BFB 93 91BrownForA BFA 91 91BostonBeer SAM 88 80ConstellB STZB 87 98Diageo DEO 84 79
GROUP REL STR 79 RS EPS
291511732062282511281430162195217241024102713DECNOVOCTSEPAUGJULJUNMAYAPRMARFEB
EARNINGS $SALES MIL. $DIVIDEND-PE
1.96 VS 1.42 +38%1810 VS 1640 +10%$0.40 30X-- 25X
1.48 VS 1.19 +24%1628 VS 1543 +5%$0.40 27X-- 22X
2.34 VS 1.54 +52%1935 VS 1871 +3%$0.52 28X-- 24X
2.47 VS 1.77 +40%2084 VS 2021 +3%$0.52 28X-- 25X
EPS DUE*1/5 QUARTER ENDED NOV 30,16 QUARTER ENDED FEB 28,17 QUARTER ENDED MAY 31,17 QUARTER ENDED AUG 31,17
R S LINE VS SP500
VOLUME
500K
1.3M
4M
*K B HOME(KBH) NYSE 86.5 SHRS / 68.3 FLT / AVG VOL2.10MIL $31.95(OH -1%)BLDG-RESIDENT/COMML kbhome.comBUILDS SINGLE-FAMILY ATTACHED/DETACHED HOMES, TOWNHOMES AND CONDOMINIUMS IN 7 STATES ACROSS THE U.S.
6/17 CO, RICHMOND AMERICAN HOMES/TAYLOR MORRISON TO ACQUIRE LOTS AT FIRST PHASE OF SKY RANCH FROM PURE CYCLE CORP.
SHORT INT 4.4 DAYS +4%OPTIONS ON AM/MSUP/DOWN 1.3EX-DIV 11/1YIELD 0.3%
GROWTH RATE +32%EARNINGS STAB 35EPS RANK 95PE 23 (1.1XS&P)5 YR PE 11 - 94
DEBT 0%NEW CEOTIMELINESS AACC/DIST ASMR RATING C
1.60 X BK VALUEINVENTORY TO. 1.1XR&D N/ARET ON EQUITY 6%CASH FLOW $1.24
FUNDS 53%BANKS 1%MGMT 10%ALPHA 0.16BETA 1.69
17.30
24.37
15.51 15.88
20.92 20.68
95
QTR 4QTR 3
QTR 2
QTR 1
10
15
20
25
30
35
PRICE SCALE
99COMPOSITE RATING11$ -1.35∆ $ 16 512 -0.76∆ 17 613 0.46∆ 25 1514 0.94∆ 20 1315 0.85∆ 17 1116 1.12∆ 17 917 1.76EST +57% ↑18 2.15EST +22% ↑
EARNINGS (NOV) HI LOLGI Homes LGIH 98 99Nvr NVR 96 99Calatlanti CAA 96 52DRHorton DHI 95 89Hovnanian HOV 95 10
GROUP REL STR 98 RS EPS
291511732062282511281430162195217241024102713DECNOVOCTSEPAUGJULJUNMAYAPRMARFEB
EARNINGS $SALES MIL. $DIVIDEND-PE
0.40∆ VS 0.43∆ -7%1191 VS 985.8 +21%$0.03 16X-- 12X
0.15 VS 0.14 +7%818.6 VS 678.4 +21%$0.03 16X-- 13X
0.33 VS 0.17 +94%1002 VS 811.1 +24%$0.03 19X-- 16X
0.51 VS 0.42 +21%1144 VS 913.3 +25%$0.03 20X-- 16X
EPS DUE*1/11 QUARTER ENDED NOV 30,16 QUARTER ENDED FEB 28,17 QUARTER ENDED MAY 31,17 QUARTER ENDED AUG 31,17
R S LINE VS SP500
VOLUME
900K
2.5M
8
Global Payments Inc (GPN)
Synnex Corp (SNX)
GLOBAL PAYMENTS INC(GPN) NYSE 159.1 SHRS / 157.6 FLT / AVG VOL1.11MIL $100.24(OH -4%)FINANCE-CRDTCARD/PMTPR globalpaymentsinc.comPROVIDES ELECTRONIC PAYMENTS PROCESSING TO CONSUMERS, MERCHANTS, CORPORATIONS, FINANCIAL INSTITUTIONS
11/17 RAISED 2017 ADJ EARNINGS GUIDANCE TO $3.94 TO $4.02 PER SHARE ON REVENUES GUIDANCE OF $3.505 BIL TO $3.53 BIL.
SHORT INT 3 DAYS +22%OPTIONS ON MS/NYUP/DOWN 1.4EX-DIV 12/14YIELD 0.0%
GROWTH RATE +17%EARNINGS STAB 3EPS RANK 95PE 26 (1.2XS&P)5 YR PE 12 - 28
DEBT 162%NEW CEOTIMELINESS AACC/DIST BSMR RATING A
6.06 X BK VALUEINVENTORY TO.R&D N/ARET ON EQUITY 28%CASH FLOW $3.6
FUNDS 60%BANKS 2%MGMT 1%ALPHA 0.07BETA 1.09
80.88 81.56 81.63
93.52
97.99 98.14
104.83 104.90103.39
75.88 76.47
87.30 87.86
92.90 92.9795.3295.32
81
QTR 4QTR 3
QTR 2
QTR 1
60
70
80
90
100
110
PRICE SCALE
94COMPOSITE RATING11$ 1.66 $ 26 1912 1.82 26 1913 1.97 32 2114 2.32 43 3115 2.79 74 3816 3.18 79 5117 4.00EST +26% ↑18 4.74EST +19% ↑
EARNINGS (DEC) HI LOGreenDot A GDOT 97 93Square A SQ 97 81PaymntData PYDS 97 6Everi EVRI 96 20Paypal PYPL 94 96
GROUP REL STR 82 RS EPS
291511732062282511281430162195217241024102713DECNOVOCTSEPAUGJULJUNMAYAPRMARFEB
EARNINGS $SALES MIL. $DIVIDEND-PE
0.89 VS 0.76 +17%941.8 VS 722.4 +30%$0.01 26X-- 21X
0.85 VS 0.64 +33%919.8 VS 626.3 +47%$0.01 26X-- 23X
0.94 VS 0.76 +24%962.2 VS 842.6 +14%$0.01 28X-- 24X
1.15 VS 0.89 +29%1038 VS 951.9 +9%$0.01 28X-- 26X
EPS DUE*1/9 QUARTER ENDED DEC 31,16 QUARTER ENDED MAR 31,17 QUARTER ENDED JUN 30,17 QUARTER ENDED SEP 30,17
R S LINE VS SP500
VOLUME
400K
900K
1.9M
SYNNEX CORP(SNX) NYSE 40.0 SHRS / 28.4 FLT / AVG VOL165244 $135.95(OH -1%)WHOLESALE-ELECTRONICS synnex.comDISTRIBUTES IT SYSTEMS, PERIPHERALS, SYSTEM COMPONENTS, PACKAGED SOFTWARE AND NETWORKING EQUIPMENT
9/17 EXPECTS Q4 FY17 NON-GAAP EARNINGS OF $2.63 TO $2.73 PER DILUTED SHARE ON REVENUES OF $4.75 BIL TO $4.95 BIL.
SHORT INT 4.2 DAYS -4%OPTIONS ON NY/PHUP/DOWN 1.1EX-DIV 10/12YIELD 0.9%
GROWTH RATE +16%EARNINGS STAB 8EPS RANK 95PE 16 (0.8XS&P)5 YR PE 8 - 20
DEBT 31%NEW CEOTIMELINESS CACC/DIST ASMR RATING B
2.75 X BK VALUEINVENTORY TO. 9.2XR&D N/ARET ON EQUITY 15%CASH FLOW $8.79
FUNDS 49%BANKS 0%MGMT 3%ALPHA -0.06BETA 1.62
129.24
121.76
111.61
131.35
120.00
135.87137.80138.08
101.48
104.95
110.02
127.55130.04
70
QTR 4QTR 3
QTR 2
QTR 1
90
100
110
120
130
140
PRICE SCALE
89COMPOSITE RATING(C)11$ 4.10 $ 36 2212 3.99 44 3013 4.28 68 3214 6.16 79 5115 6.28 96 7016 7.04 128 7517 8.74EST +24% ↓18 9.66EST +11% ↑
EARNINGS (NOV) HI LOSystemax SYX 99 99Agilysys AGYS 76 6TechData TECD 59 92WaysdT WSTG 43 43PCConnect CNXN 19 66
GROUP REL STR 19 RS EPS
291511732062282511281430162195217241024102713DECNOVOCTSEPAUGJULJUNMAYAPRMARFEB
EARNINGS $SALES MIL. $DIVIDEND-PE
2.57 VS 1.80 +43%3886 VS 3549 +10%$0.25 19X-- 16X
1.82 VS 1.37 +33%3520 VS 3125 +13%$0.25 20X-- 17X
2.08 VS 1.37 +52%3936 VS 3379 +16%$0.25 17X-- 14X
2.16 VS 1.73 +25%4276 VS 3669 +17%$0.25 16X-- 14X
EPS DUE*1/10 QUARTER ENDED NOV 30,16 QUARTER ENDED FEB 28,17 QUARTER ENDED MAY 31,17 QUARTER ENDED AUG 31,17
R S LINE VS SP500
VOLUME
60K
136K
400K
9
Marketsmith.com // 2018 Q1 l ScreensNeogen Corp (NEOG)
Walgreens Boots Alliance (WBA)
NEOGEN CORP(NEOG) NASDAQ 38.2 SHRS / 36.3 FLT / AVG VOL103776 $82.21(OH -4%)MEDICAL-PRODUCTS neogen.comDEVELOPS DIAGNOSTIC TEST KITS FOR FOOD SAFETY, AND PHARMACEUTICALS AND VACCINES FOR ANIMAL SAFETY.
9/17 RICHARD E. CALK JR RESIGNED AS PRES/COO, EFFECTIVE SEPTEMBER 22, 2017.
SHORT INT 10.1 DAYS +11%OPTIONS ON PSUP/DOWN 1.4EX-DIVYIELD
GROWTH RATE +11%EARNINGS STAB 3EPS RANK 90PE 70 (4.4XS&P)5 YR PE 42 - 70
DEBT 0%NEW CEO 7/17TIMELINESS BACC/DIST ASMR RATING B
6.66 X BK VALUEINVENTORY TO. 5.3XR&D 2.9%RET ON EQUITY 10%CASH FLOW $1.53
FUNDS 47%BANKS 1%MGMT 4%ALPHA N/ABETA 1.29
66.90
68.98
64.10
69.9769.00
85.8985.89
62.72
59.51 60.02
63.56
73.07
78.69
78
QTR 4QTR 3
QTR 2
QTR 1
50
60
70
80
PRICE SCALE
94COMPOSITE RATING11$ 0.48 $ 31 1712 0.47 31 2013 0.56 51 2914 0.57 50 3515 0.68 62 4116 0.73 69 4317 0.8618 1.32EST +53% ↑
EARNINGS (MAY) HI LOCaredx CDNA 99 29AxoGen AXGN 98 37AdvAcceApp AAAP 98 1AlignTech ALGN 97 97Exactech EXAC 97 53
GROUP REL STR 75 RS EPS
291511732062282511281430162195217241024102713DECNOVOCTSEPAUGJULJUNMAYAPRMARFEB
EARNINGS $SALES MIL. $DIVIDEND-PE
0.29 VS 0.24 +21%90.7 VS 79.6 +14%N/A 65X-- 52X
0.27 VS 0.22 +23%88.4 VS 76.7 +15%N/A 70X-- 61X
0.32 VS 0.26 +23%98.9 VS 90.1 +10%N/A 67X-- 55X
0.31 VS 0.26 +19%95.3 VS 83.7 +14%N/A 65X-- 56X
EPS DUE*12/21 QUARTER ENDED NOV 30,16 QUARTER ENDED FEB 28,17 QUARTER ENDED MAY 31,17 QUARTER ENDED AUG 31,17
R S LINE VS SP500
VOLUME
48K
90K
170K
WALGREENS BOOTS ALLIANCE(WBA) NASDAQ 990.4 SHRS / 841.8 FLT / AVG VOL7.86MIL $72.62(OH -17%)RETAIL-DRUG STORES walgreens.comOPERATES 12,822 PHARMACY-LED HEALTH AND WELLBEING RETAIL STORES IN 11 COUNTRIES.
12/17 CO/KKR ACQUIRED PHARMERICA CORP, A INSTITUTIONAL PHARMACY, FOR $29.25 PER SHARE OF CO'S STOCK OR CASH.
SHORT INT 3.1 DAYS +8%OPTIONS ON AM/MSUP/DOWN 1.4EX-DIV 11/10YIELD 2.2%
GROWTH RATE +13%EARNINGS STAB 3EPS RANK 91PE 14 (0.7XS&P)5 YR PE 12 - 27
DEBT 46%NEW CEOTIMELINESS CACC/DIST CSMR RATING C
2.62 X BK VALUEINVENTORY TO. 13.2XR&D N/ARET ON EQUITY 19%CASH FLOW $6.99
FUNDS 34%BANKS 2%MGMT 15%ALPHA -0.1BETA 0.82
88.00 87.79
81.9383.89
73.83
80.31 80.16 80.30
75.18
79.25
63.82
17
QTR 4QTR 3
QTR 2
QTR 1
50
60
70
80
90
PRICE SCALE
42COMPOSITE RATING11$ 2.69 $ 45 3012 2.93 37 2813 3.12 60 3614 3.28 77 5515 3.88 97 7316 4.59 88 7117 5.1018 5.56EST +9% ↑
EARNINGS (AUG) HI LOCVS Health CVS 17 64Rite Aid RAD 4 20
GROUP REL STR 5 RS EPS
291511732062282511281430162195217241024102713DECNOVOCTSEPAUGJULJUNMAYAPRMARFEB
EARNINGS $SALES MIL. $DIVIDEND-PE
1.10 VS 1.03 +7%28501 VS 29033 -2%$0.38 19X-- 17X
1.36 VS 1.31 +4%29446 VS 30184 -2%$0.38 19X-- 17X
1.33 VS 1.18 +13%30118 VS 29498 +2%$0.38 19X-- 17X
1.31 VS 1.07 +22%30149 VS 28636 +5%$0.40 18X-- 16X
EPS DUE*1/5 QUARTER ENDED NOV 30,16 QUARTER ENDED FEB 28,17 QUARTER ENDED MAY 31,17 QUARTER ENDED AUG 31,17
R S LINE VS SP500
VOLUME
2.5M
6M
10
Marketsmith.com // 2018 Q1 l Customer Success Story
Steve Swetz had always been interested in the stock market. Although he didn’t have much investing capital back in 1997, he decided to get into the market anyway. He went to a bookstore and started reading books by Warren Buffet and Peter Lynch; eventually, he ran across Bill O’Neil’s book, “How to Make Money in Stocks.”
“The book really spoke to me because it was very specific, concrete material,” Steve explained. “Although I had never heard of Bill O’Neil, I knew this CAN SLIM® Investing System was exactly what I had been looking for.” He bought his very first stock—Timberline Software—in November 1997; when it doubled in price, he sold it. From that successful first trade, he was hooked.
Steve continued his education through IBD’s advanced workshops and credits Scott O’Neil for helping him read charts better. He has been a full-time investor for the past ten years and lives in West Point, Mississippi.
Recently, he entered into a successful position using MarketSmith® research. “Warrior Met Coal (HCC) came up on one of my favorite screens, which is based on Bill O’Neil’s research that many successful stocks are newer IPOs from the past 15 years. I had also observed that many of the stocks found in MarketSmith’s ‘Top Stocks’ annual review books were also newer IPOs—perhaps as many as 80% of them. So I created a screen to help me find companies that met this criteria and I run it every weekend.”
Steve noted that Warrior Met Coal had been showing up on his MarketSmith screen for several weeks. It had 3 straight quarters of triple-digit earnings, and the earnings were accelerating.
He likes to enter on a shakeout within the handle so he can get in a little early. Steve bought Warrior Met on November 10th, 2017 after the company reported quarterly earnings that soared 498% with an earnings surprise of 5.58%; in addition, volume increased 169%, which indicated professional buying.
Customer Success Story: Steve Swetz
11
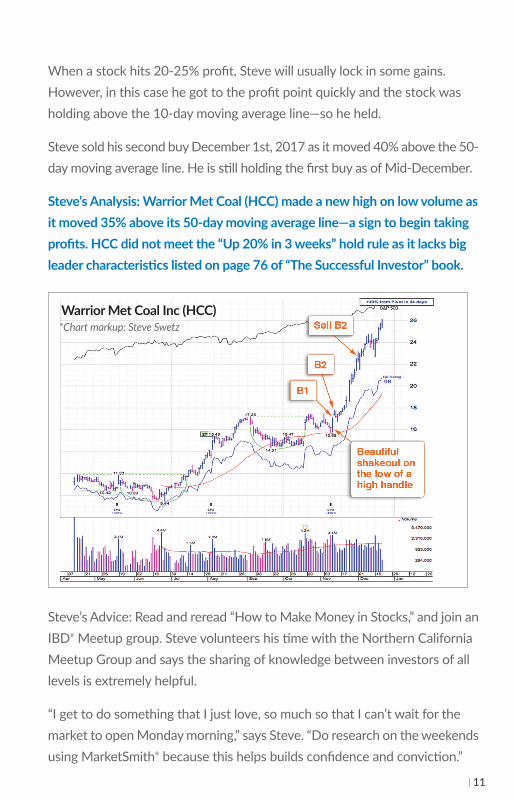
When a stock hits 20-25% profit, Steve will usually lock in some gains. However, in this case he got to the profit point quickly and the stock was holding above the 10-day moving average line—so he held.
Steve sold his second buy December 1st, 2017 as it moved 40% above the 50-day moving average line. He is still holding the first buy as of Mid-December.
Steve’s Analysis: Warrior Met Coal (HCC) made a new high on low volume as it moved 35% above its 50-day moving average line—a sign to begin taking profits. HCC did not meet the “Up 20% in 3 weeks” hold rule as it lacks big leader characteristics listed on page 76 of “The Successful Investor” book.
Steve’s Advice: Read and reread “How to Make Money in Stocks,” and join an IBD® Meetup group. Steve volunteers his time with the Northern California Meetup Group and says the sharing of knowledge between investors of all levels is extremely helpful.
“I get to do something that I just love, so much so that I can’t wait for the market to open Monday morning,” says Steve. “Do research on the weekends using MarketSmith® because this helps builds confidence and conviction.”
*Chart markup: Steve SwetzWarrior Met Coal Inc (HCC)
12
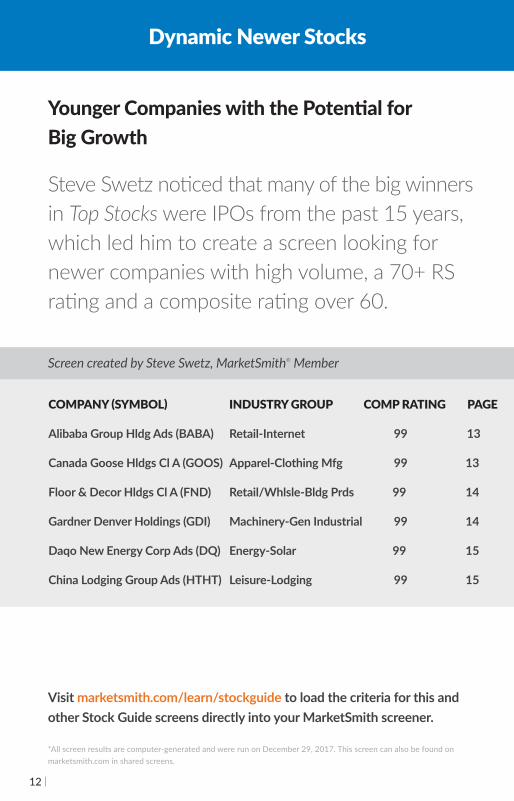
Younger Companies with the Potential for Big Growth
Steve Swetz noticed that many of the big winners in Top Stocks were IPOs from the past 15 years, which led him to create a screen looking for newer companies with high volume, a 70+ RS rating and a composite rating over 60.
Dynamic Newer Stocks
COMPANY (SYMBOL) INDUSTRY GROUP COMP RATING PAGE
Alibaba Group Hldg Ads (BABA) Retail-Internet 99 13
Canada Goose Hldgs Cl A (GOOS) Apparel-Clothing Mfg 99 13
Floor & Decor Hldgs Cl A (FND) Retail/Whlsle-Bldg Prds 99 14
Gardner Denver Holdings (GDI) Machinery-Gen Industrial 99 14
Daqo New Energy Corp Ads (DQ) Energy-Solar 99 15
China Lodging Group Ads (HTHT) Leisure-Lodging 99 15
Visit marketsmith.com/learn/stockguide to load the criteria for this and other Stock Guide screens directly into your MarketSmith screener.
*All screen results are computer-generated and were run on December 29, 2017. This screen can also be found on marketsmith.com in shared screens.
Screen created by Steve Swetz, MarketSmith® Member

13
Marketsmith.com // 2018 Q1 l ScreensAlibaba Group Hldg Ads (BABA)
Canada Goose Hldgs Cl A (GOOS)
*ALIBABA GROUP HLDG ADS(BABA) NYSE 2,552.0 SHRS / 1,148.4 FLT / AVG VOL19.93MIL$172.43(OH -10%)RETAIL-INTERNET alibabagroup.comHONG KONG-BASED PROVIDER OF ONLINE AND MOBILE RETAIL MARKETPLACES VIA TAOBAO.COM, TMALL.COM AND OTHER SITES.
11/17 TO OFFER $700 MIL OF 2.8% SENIOR UNSECURED NOTES DUE 2023.
SHORT INT 6.7 DAYS -2%OPTIONS ONUP/DOWN 0.8EX-DIVYIELD
GROWTH RATE +40%EARNINGS STAB 19EPS RANK 99PE 39 (1.9XS&P)5 YR PE 22 - 58
DEBT 28%NEW CEOTIMELINESS AACC/DIST DSMR RATING A
10.88 X BK VALUEINVENTORY TO.R&D 10.8%RET ON EQUITY 24%CASH FLOW $3.79
FUNDS 17%BANKS 1%MGMT 11%ALPHA 0.19BETA 1.24
104.57
148.29
160.39
191.75
114.00
147.50
166.79 168.58164.25164.25
92
QTR 4QTR 3
QTR 2
QTR 1
BARRONS 6/5/17
60
80
100
120
140
160
180
PRICE SCALE
99COMPOSITE RATING$68.00IPO 9/19/1411$ 0.17 $12 0.4113 0.9014 1.83 120 6015 2.27 106 5716 2.62 109 5917 3.4218 5.11EST +49% ↑
EARNINGS (MAR) HI LOOverstk OSTK 99 24Stitch Fix SFIX 98 45Baozun A BZUN 97 96PetMedExp PETS 97 9558.com WUBA 97 81
GROUP REL STR 83 RS EPS
291511732062282511281430162195217241024102713DECNOVOCTSEPAUGJULJUNMAYAPRMARFEB
EARNINGS $SALES MIL. $DIVIDEND-PE
1.30 VS 1.00 +30%7662 VS 5319 +44%N/A 39X-- 29X
0.63 VS 0.46 +37%5597 VS 3739 +50%N/A 34X-- 30X
1.17 VS 0.73 +60%7402 VS 4839 +53%N/A 43X-- 33X
1.29 VS 0.79 +63%7554 VS 5141 +47%N/A 46X-- 40X
EPS DUE*1/24 QUARTER ENDED DEC 31,16 QUARTER ENDED MAR 31,17 QUARTER ENDED JUN 30,17 QUARTER ENDED SEP 30,17
R S LINE VS SP500
VOLUME
6M
14M
*CANADA GOOSE HLDGS CL A(GOOS) NYSE 36.3 SHRS / 35.9 FLT / AVG VOL829400 $31.56(OH -1%)APPAREL-CLOTHING MFG canadagoose.comCANADIAN-BASED DESIGNER, MANUFACTURER, AND RETAILER OF PREMIUM OUTERWEAR FOR MEN, WOMEN AND CHILDREN.SHORT INT 2.8 DAYS -2%OPTIONS ONUP/DOWN 2.1EX-DIVYIELD
GROWTH RATE +67%EARNINGS STAB 99EPS RANK 79PE 69 (3.3XS&P)5 YR PE 42 - 102
DEBT 100%NEW CEOTIMELINESS AACC/DIST ASMR RATING A
30.86 X BK VALUEINVENTORY TO. 3.2XR&D N/ARET ON EQUITY 27%CASH FLOW $0.36
FUNDS 34%BANKS 1%MGMT 1%ALPHA 0.3BETA 1.03
24.32
20.40
18.50
16.96
19.95
97
QTR 4QTR 3
QTR 2
QTR 1
SO
PSO
10
15
20
25
30
35
PRICE SCALE
99COMPOSITE RATING$12.78IPO 3/16/1711$121314 -0.01 $15 0.2016 0.2517 0.4318 0.46EST +7% ↑
EARNINGS (MAR) HI LOMichaelKor KORS 95 84GIIIAppare GIII 93 42KBS Fashio KBSF 91 20Carters CRI 88 83VFCorp VFC 88 56
GROUP REL STR 90 RS EPS
291511732062282511281430162195217241024102713DECNOVOCTSEPAUGJULJUNMAYAPRMARFEB
EARNINGS $SALES MIL. $DIVIDEND-PE
0.15 VS 0.11 +36%209.1 VS 115.5 +81%N/A N/A
0.15 VS -0.09#+267%51.1 VS 41.9 +22%N/A 97X-- 80X
-0.13 VS -0.09 N/A28.2 VS 15.7 +80%N/A 102X-- 45X
0.29 VS 0.22 +32%172.3 VS 127.9 +35%N/A 54X-- 42X
EPS DUE 1/28 QUARTER ENDED DEC 31,16 QUARTER ENDED MAR 31,17 QUARTER ENDED JUN 30,17 QUARTER ENDED SEP 30,17
R S LINE VS SP500
VOLUME
400K
1.5M
6M
14
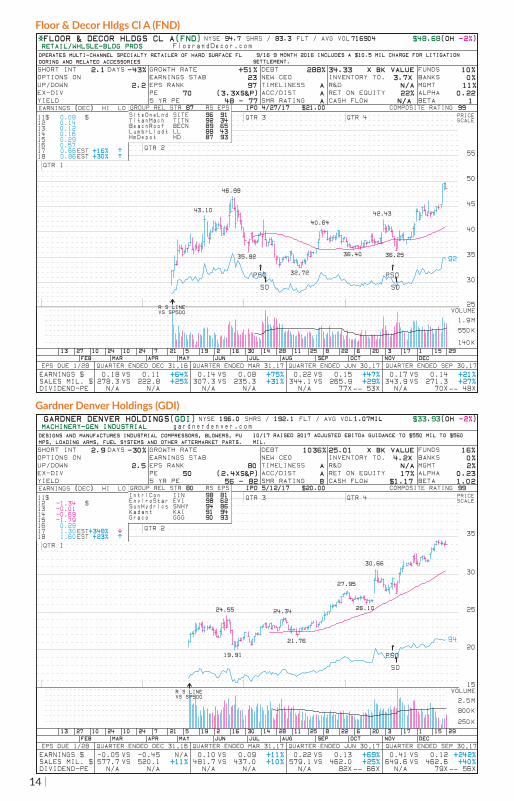
Floor & Decor Hldgs Cl A (FND)
Gardner Denver Holdings (GDI)
*FLOOR & DECOR HLDGS CL A(FND) NYSE 94.7 SHRS / 83.3 FLT / AVG VOL716904 $48.68(OH -2%)RETAIL/WHLSLE-BLDG PRDS FloorandDecor.comOPERATES MULTI-CHANNEL SPECIALTY RETAILER OF HARD SURFACE FLOORING AND RELATED ACCESSORIES
9/16 9 MONTH 2016 INCLUDES A $10.5 MIL CHARGE FOR LITIGATION SETTLEMENT.
SHORT INT 2.1 DAYS -43%OPTIONS ONUP/DOWN 2.2EX-DIVYIELD
GROWTH RATE +51%EARNINGS STAB 23EPS RANK 97PE 70 (3.3XS&P)5 YR PE 48 - 77
DEBT 288%NEW CEOTIMELINESS AACC/DIST ASMR RATING A
34.33 X BK VALUEINVENTORY TO. 3.7XR&D N/ARET ON EQUITY 22%CASH FLOW N/A
FUNDS 10%BANKS 0%MGMT 11%ALPHA 0.22BETA 1
43.10
46.99
40.6442.43
35.92
32.72
36.40 36.25 92
QTR 4QTR 3
QTR 2
QTR 1
SO
PSO
SO
PSO
25
30
35
40
45
50
55
PRICE SCALE
99COMPOSITE RATING$21.00IPO 4/27/1711$ 0.08 $12 0.1413 0.1214 0.1615 0.2916 0.5717 0.66EST +16% ↑18 0.86EST +30% ↑
EARNINGS (DEC) HI LOSiteOneLnd SITE 96 91TitanMach TITN 92 34BeacnRoof BECN 89 65LumbrLiqdt LL 88 43HmDepot HD 87 93
GROUP REL STR 87 RS EPS
291511732062282511281430162195217241024102713DECNOVOCTSEPAUGJULJUNMAYAPRMARFEB
EARNINGS $SALES MIL. $DIVIDEND-PE
0.18 VS 0.11 +64%278.3 VS 222.8 +25%N/A N/A
0.14 VS 0.08 +75%307.3 VS 235.3 +31%N/A N/A
0.22 VS 0.15 +47%344.1 VS 265.9 +29%N/A 77X-- 53X
0.17 VS 0.14 +21%343.9 VS 271.3 +27%N/A 70X-- 48X
EPS DUE 1/28 QUARTER ENDED DEC 31,16 QUARTER ENDED MAR 31,17 QUARTER ENDED JUN 30,17 QUARTER ENDED SEP 30,17
R S LINE VS SP500 VOLUME
140K
550K
1.9M
GARDNER DENVER HOLDINGS(GDI) NYSE 196.0 SHRS / 192.1 FLT / AVG VOL1.07MIL $33.93(OH -2%)MACHINERY-GEN INDUSTRIAL gardnerdenver.comDESIGNS AND MANUFACTURES INDUSTRIAL COMPRESSORS, BLOWERS, PUMPS, LOADING ARMS, FUEL SYSTEMS AND OTHER AFTERMARKET PARTS.
10/17 RAISED 2017 ADJUSTED EBITDA GUIDANCE TO $550 MIL TO $560 MIL.
SHORT INT 2.9 DAYS -30%OPTIONS ONUP/DOWN 2.5EX-DIVYIELD
GROWTH RATEEARNINGS STABEPS RANK 80PE 50 (2.4XS&P)5 YR PE 56 - 82
DEBT 1036%NEW CEOTIMELINESS AACC/DIST ASMR RATING B
25.01 X BK VALUEINVENTORY TO. 4.2XR&D N/ARET ON EQUITY 17%CASH FLOW $1.17
FUNDS 16%BANKS 0%MGMT 2%ALPHA 0.23BETA 1.02
24.55 24.34
27.95
30.66
19.91
21.76
26.10
94
QTR 4QTR 3
QTR 2
QTR 1
SO
PSO
15
20
25
30
35
PRICE SCALE
99COMPOSITE RATING$20.00IPO 5/12/1711$12 -1.34 $13 -0.0114 -0.6915 -1.7916 0.2917 1.30EST+348% ↓18 1.60EST +23% ↑
EARNINGS (DEC) HI LOIntriCon IIN 98 81EnviroStar EVI 98 62SunHydrlcs SNHY 94 86Kadant KAI 91 94Graco GGG 90 93
GROUP REL STR 80 RS EPS
291511732062282511281430162195217241024102713DECNOVOCTSEPAUGJULJUNMAYAPRMARFEB
EARNINGS $SALES MIL. $DIVIDEND-PE
-0.05 VS -0.45 N/A577.7 VS 520.1 +11%N/A N/A
0.10 VS 0.09 +11%481.7 VS 437.0 +10%N/A N/A
0.22 VS 0.13 +69%579.1 VS 462.0 +25%N/A 82X-- 66X
0.41 VS 0.12 +242%649.6 VS 462.6 +40%N/A 79X-- 56X
EPS DUE 1/28 QUARTER ENDED DEC 31,16 QUARTER ENDED MAR 31,17 QUARTER ENDED JUN 30,17 QUARTER ENDED SEP 30,17
R S LINE VS SP500
VOLUME
250K
800K
2.5M
15
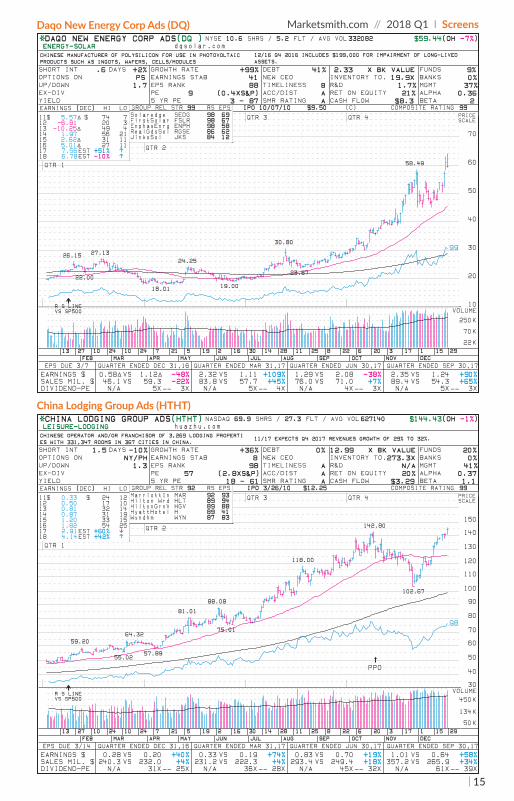
Marketsmith.com // 2018 Q1 l ScreensDaqo New Energy Corp Ads (DQ)
China Lodging Group Ads (HTHT)
*DAQO NEW ENERGY CORP ADS(DQ ) NYSE 10.6 SHRS / 5.2 FLT / AVG VOL332082 $59.44(OH -7%)ENERGY-SOLAR dqsolar.comCHINESE MANUFACTURER OF POLYSILICON FOR USE IN PHOTOVOLTAIC PRODUCTS SUCH AS INGOTS, WAFERS, CELLS/MODULES
12/16 Q4 2016 INCLUDES $199,000 FOR IMPAIRMENT OF LONG-LIVED ASSETS.
SHORT INT .6 DAYS +2%OPTIONS ON PSUP/DOWN 1.7EX-DIVYIELD
GROWTH RATE +99%EARNINGS STAB 41EPS RANK 88PE 9 (0.4XS&P)5 YR PE 3 - 87
DEBT 41%NEW CEOTIMELINESS BACC/DIST ASMR RATING A
2.33 X BK VALUEINVENTORY TO. 19.9XR&D 1.7%RET ON EQUITY 21%CASH FLOW $8.3
FUNDS 9%BANKS 0%MGMT 37%ALPHA 0.36BETA 2
26.15 27.1324.25
30.80
58.49
22.00
18.01 19.00
23.67
99
QTR 4QTR 3
QTR 2
QTR 1
10
20
30
40
50
60
70
PRICE SCALE
99COMPOSITE RATING(C)$9.50IPO 10/07/1011$ 5.57∆ $ 74 712 -6.81 20 313 -10.25∆ 49 414 1.97 56 2115 2.62∆ 31 1116 5.01∆ 27 1117 7.56EST +51% ↑18 6.78EST -10% ↑
EARNINGS (DEC) HI LOSolaredge SEDG 98 69FirstSolar FSLR 98 67EnphasEnrg ENPH 98 58RealGdsSol RGSE 86 62JinkoSol JKS 84 12
GROUP REL STR 99 RS EPS
291511732062282511281430162195217241024102713DECNOVOCTSEPAUGJULJUNMAYAPRMARFEB
EARNINGS $SALES MIL. $DIVIDEND-PE
0.58∆ VS 1.12∆ -48%46.1 VS 59.3 -22%N/A 5X-- 3X
2.32 VS 1.11 +109%83.8 VS 57.7 +45%N/A 5X-- 4X
1.29 VS 2.08 -38%76.0 VS 71.0 +7%N/A 4X-- 3X
2.35 VS 1.24 +90%89.4 VS 54.3 +65%N/A 5X-- 3X
EPS DUE 3/7 QUARTER ENDED DEC 31,16 QUARTER ENDED MAR 31,17 QUARTER ENDED JUN 30,17 QUARTER ENDED SEP 30,17
R S LINE VS SP500 VOLUME
22K
70K
250K
*CHINA LODGING GROUP ADS(HTHT) NASDAQ 69.9 SHRS / 27.3 FLT / AVG VOL627140 $144.43(OH -1%)LEISURE-LODGING huazhu.comCHINESE OPERATOR AND/OR FRANCHISOR OF 3,269 LODGING PROPERTIES WITH 331,347 ROOMS IN 367 CITIES IN CHINA.
11/17 EXPECTS Q4 2017 REVENUES GROWTH OF 29% TO 32%.
SHORT INT 1.5 DAYS -10%OPTIONS ON NY/PHUP/DOWN 1.3EX-DIVYIELD
GROWTH RATE +36%EARNINGS STAB 8EPS RANK 98PE 57 (2.8XS&P)5 YR PE 18 - 61
DEBT 0%NEW CEOTIMELINESS AACC/DIST ASMR RATING A
12.99 X BK VALUEINVENTORY TO.273.3XR&D N/ARET ON EQUITY 20%CASH FLOW $3.29
FUNDS 20%BANKS 0%MGMT 41%ALPHA 0.37BETA 1.1
59.2064.32
81.01
88.08
118.00
142.80
55.0257.89
75.01
102.67
98
QTR 4QTR 3
QTR 2
QTR 1
PPO
30
40
50
60
70
80
90
100
110
120
130
140
150
PRICE SCALE
99COMPOSITE RATING$12.25IPO 3/26/1011$ 0.33 $ 24 1212 0.50 17 1013 0.81 32 1414 0.87 31 1915 1.20 33 1516 1.82 54 2517 2.91EST +60% ↓18 4.14EST +42% ↑
EARNINGS (DEC) HI LOMarriottIn MAR 92 93Hilton Wrd HLT 89 94HiltonGrnV HGV 89 88HyattHotel H 89 41Wyndhm WYN 87 83
GROUP REL STR 92 RS EPS
291511732062282511281430162195217241024102713DECNOVOCTSEPAUGJULJUNMAYAPRMARFEB
EARNINGS $SALES MIL. $DIVIDEND-PE
0.28 VS 0.20 +40%240.3 VS 232.0 +4%N/A 31X-- 25X
0.33 VS 0.19 +74%231.2 VS 222.3 +4%N/A 36X-- 28X
0.83 VS 0.70 +19%293.4 VS 249.4 +18%N/A 45X-- 32X
1.01 VS 0.64 +58%357.2 VS 265.9 +34%N/A 61X-- 39X
EPS DUE 3/14 QUARTER ENDED DEC 31,16 QUARTER ENDED MAR 31,17 QUARTER ENDED JUN 30,17 QUARTER ENDED SEP 30,17
R S LINE VS SP500
VOLUME
50K
134K
450K
16
Marketsmith.com // 2018 Q1 l MarketSmith® Coaches Corner
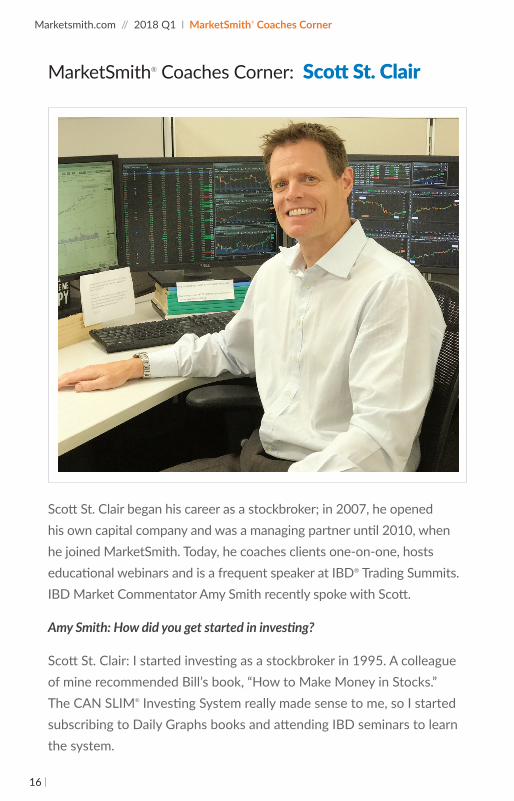
Scott St. Clair began his career as a stockbroker; in 2007, he opened his own capital company and was a managing partner until 2010, when he joined MarketSmith. Today, he coaches clients one-on-one, hosts educational webinars and is a frequent speaker at IBD® Trading Summits. IBD Market Commentator Amy Smith recently spoke with Scott.
Amy Smith: How did you get started in investing?
Scott St. Clair: I started investing as a stockbroker in 1995. A colleague of mine recommended Bill’s book, “How to Make Money in Stocks.” The CAN SLIM® Investing System really made sense to me, so I started subscribing to Daily Graphs books and attending IBD seminars to learn the system.
MarketSmith® Coaches Corner: Scott St. Clair
17
AS: As a MarketSmith® product coach, what are some of the most common questions you hear?
SSC: Most people struggle with selling—it is easily the hardest thing to do. Investors can review the MarketSmith webinars that we have done over the years to help them establish sell rules and spot changes in stocks that might signal a good time to lock in some gains.
AS: What is your favorite MarketSmith screen?
SSC: My favorite screen depends on the market environment. In a bear market, I love the “RS Line at New High” screen. Mostly, I rely on the Growth 250 to find my ideas. It really is a phenomenal list.
AS: What are the biggest lessons you’ve learned over time that might help other investors?
SSC: Patience is the biggest thing I have learned over the years. Like Bill says, it takes time for a stock to make a big move. Try not to be in such a hurry. I know that’s easier said than done! Study the stocks in the front of Bill’s book to see how he might have handled some big winners. By studying past winners, we learn lessons on how to handle them. Another big lesson I’ve learned is to be patient with gains and impatient with losses.
AS: What have you learned from working closely with Scott O’Neil?
SSC: Scott O’Neil told us that his dad would rarely get completely out of the market. I was surprised—I thought you were supposed to go to cash during corrections. Scott says Bill would often say, “Hold your best stocks for last.” So I try to hold on to the best performers until they have really broken.
Another thing I’ve learned: there are no “secrets” in-house. The tools we use in-house are the same tools the clients have access to. The process is what’s most important.
18
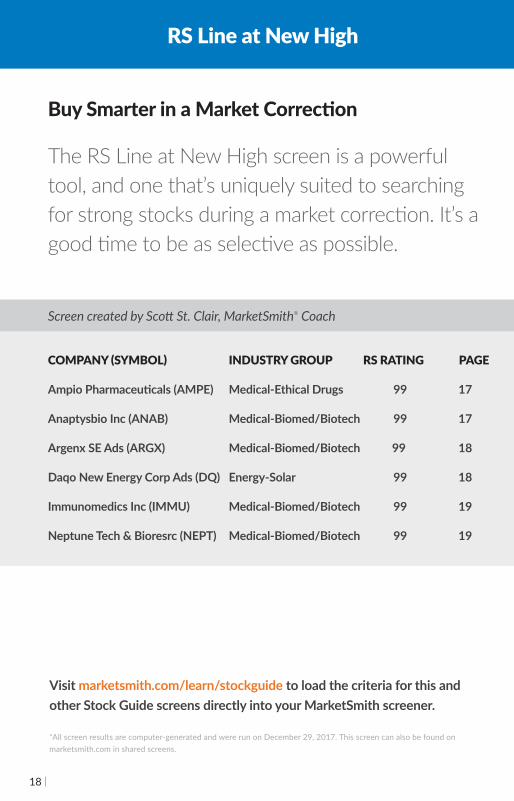
Buy Smarter in a Market Correction
The RS Line at New High screen is a powerful tool, and one that’s uniquely suited to searching for strong stocks during a market correction. It’s a good time to be as selective as possible.
COMPANY (SYMBOL) INDUSTRY GROUP RS RATING PAGE
Ampio Pharmaceuticals (AMPE) Medical-Ethical Drugs 99 17
Anaptysbio Inc (ANAB) Medical-Biomed/Biotech 99 17
Argenx SE Ads (ARGX) Medical-Biomed/Biotech 99 18
Daqo New Energy Corp Ads (DQ) Energy-Solar 99 18
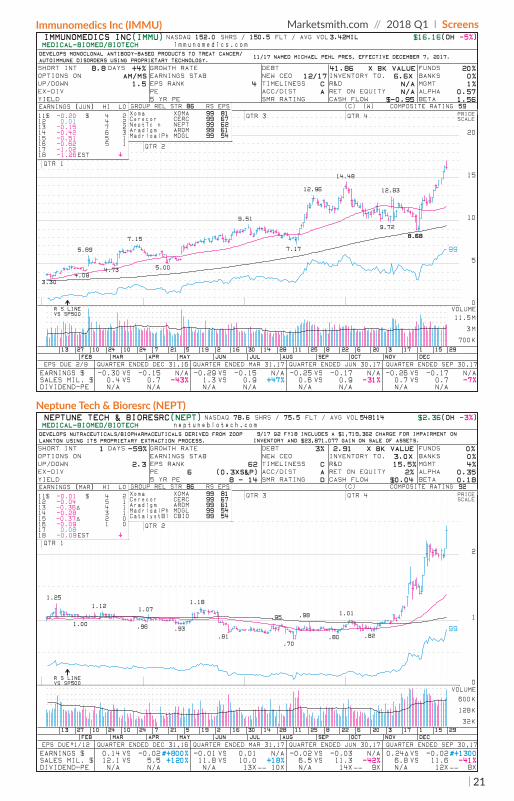
Immunomedics Inc (IMMU) Medical-Biomed/Biotech 99 19
Neptune Tech & Bioresrc (NEPT) Medical-Biomed/Biotech 99 19
Visit marketsmith.com/learn/stockguide to load the criteria for this and other Stock Guide screens directly into your MarketSmith screener.
*All screen results are computer-generated and were run on December 29, 2017. This screen can also be found on marketsmith.com in shared screens.
RS Line at New High
Screen created by Scott St. Clair, MarketSmith® Coach

19
Marketsmith.com // 2018 Q1 l ScreensAmpio Pharmaceuticals (AMPE)
Anaptysbio Inc (ANAB)
AMPIO PHARMACEUTICALS(AMPE) AMEX 75.9 SHRS / 69.1 FLT / AVG VOL1.71MIL $4.07(OH -17%)MEDICAL-ETHICAL DRUGS ampiopharma.comDEVELOPS PROPRIETARY PHARMACEUTICAL DRUGS TO IDENTIFY/TREAT INFLAMMATORY CONDITIONS, METABOLIC DISORDERS AND CANCER.
12/17 ANNOUNCED POSITIVE RESULTS OF PHASE 3 CLINICAL TRIAL OF AMPION, FOR THE TREATMENT OF OSTEOARTHRITIS OF THE KNEE.
SHORT INT 7.1 DAYS -10%OPTIONS ONUP/DOWN 2.8EX-DIVYIELD
GROWTH RATEEARNINGS STABEPS RANK 39PE5 YR PE
DEBT 0%NEW CEOTIMELINESS DACC/DIST ASMR RATING
46.59 X BK VALUEINVENTORY TO.R&D N/ARET ON EQUITY N/ACASH FLOW $-0.31
FUNDS 3%BANKS 0%MGMT 8%ALPHA 0.76BETA 0.36
1.05 1.04.78
1.34
.87 .76.52 .47 .38
99
QTR 4QTR 3
QTR 2
QTR 1
0
2
4
PRICE SCALE
72COMPOSITE RATING(W)(C)11$ -0.71 $ 9 312 -0.34 6 213 -0.63 10 314 -0.76 10 315 -0.46 9 116 -0.36 4 017 ↑18 ↓
EARNINGS (DEC) HI LOValeantPha VRX 95 22Kindred Bi KIN 93 23AkceaThera AKCA 92 41Protagonst PTGX 92 17AbbVie ABBV 90 88
GROUP REL STR 48 RS EPS
291511732062282511281430162195217241024102713DECNOVOCTSEPAUGJULJUNMAYAPRMARFEB
EARNINGS $SALES MIL. $DIVIDEND-PE
-0.06 VS -0.13 N/A
N/A N/A
-0.03 VS -0.13 N/A
N/A N/A
-0.04 VS -0.10 N/A
N/A N/A
-0.06 VS -0.07 N/A
N/A N/A
EPS DUE 3/16 QUARTER ENDED DEC 31,16 QUARTER ENDED MAR 31,17 QUARTER ENDED JUN 30,17 QUARTER ENDED SEP 30,17
R S LINE VS SP500
VOLUME
114K
550K
2.5M
ANAPTYSBIO INC(ANAB) NASDAQ 23.5 SHRS / 6.8 FLT / AVG VOL334670 $100.72(OH -1%)MEDICAL-BIOMED/BIOTECH anaptysbio.comDEVELOPS ANTIBODY PRODUCTS FOCUSED ON UNMET MEDICAL NEEDS IN INFLAMMATION.SHORT INT 2 DAYS +26%OPTIONS ONUP/DOWN 1.9EX-DIVYIELD
GROWTH RATEEARNINGS STABEPS RANK 8PE5 YR PE
DEBTNEW CEOTIMELINESS CACC/DIST ASMR RATING
-61.88 X BK VALUEINVENTORY TO.R&D 92.4%RET ON EQUITY N/ACASH FLOW $-1.52
FUNDS 11%BANKS 0%MGMT 24%ALPHA 0.86BETA 1
29.96 28.0030.71
37.62
74.00
22.4018.15 20.12
99
QTR 4QTR 3
QTR 2
QTR 1
PO
PPO
0
10
20
30
40
50
60
70
80
90
100
110
PRICE SCALE
70COMPOSITE RATING$15.00IPO 1/26/1711$1213 -0.30 $14 0.0115 -0.2716 -0.2117 -1.71EST ↑18 -2.46EST ↓
EARNINGS (DEC) HI LOXoma XOMA 99 81Cerecor CERC 99 67NeptTc n NEPT 99 62Aradigm ARDM 99 61MadrigalPh MDGL 99 54
GROUP REL STR 86 RS EPS
291511732062282511281430162195217241024102713DECNOVOCTSEPAUGJULJUNMAYAPRMARFEB
EARNINGS $SALES MIL. $DIVIDEND-PE
-0.23 VS -0.18 N/A2.8 VS 4.1 -32%N/A N/A
-0.57 VS -0.04 N/A
N/A N/A
-0.13 VS 0.12 N/A7.0 VS 5.9 +20%N/A N/A
-0.45 VS -0.06 N/A
N/A N/A
EPS DUE 3/8 QUARTER ENDED DEC 31,16 QUARTER ENDED MAR 31,17 QUARTER ENDED JUN 30,17 QUARTER ENDED SEP 30,17
R S LINE VS SP500
VOLUME
6K
50K
400K
20
Argenx SE Ads (ARGX)
Daqo New Energy Corp Ads (DQ)
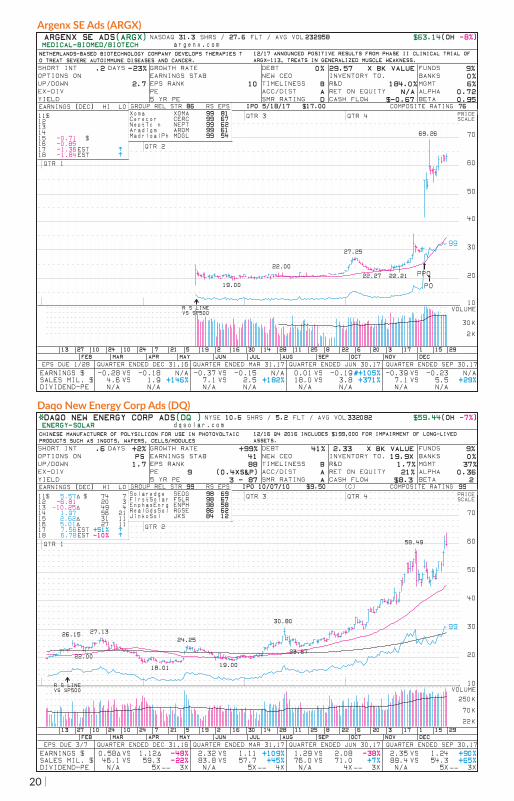
ARGENX SE ADS(ARGX) NASDAQ 31.3 SHRS / 27.6 FLT / AVG VOL232958 $63.14(OH -8%)MEDICAL-BIOMED/BIOTECH argenx.comNETHERLANDS-BASED BIOTECHNOLOGY COMPANY DEVELOPS THERAPIES TO TREAT SEVERE AUTOIMMUNE DISEASES AND CANCER.
12/17 ANNOUNCED POSITIVE RESULTS FROM PHASE II CLINICAL TRIAL OF ARGX-113, TREATS IN GENERALIZED MUSCLE WEAKNESS.
SHORT INT .2 DAYS -23%OPTIONS ONUP/DOWN 2.7EX-DIVYIELD
GROWTH RATEEARNINGS STABEPS RANK 10PE5 YR PE
DEBT 0%NEW CEOTIMELINESS BACC/DIST ASMR RATING D
29.57 X BK VALUEINVENTORY TO.R&D 184.0%RET ON EQUITY N/ACASH FLOW $-0.67
FUNDS 9%BANKS 0%MGMT 6%ALPHA 0.72BETA 0.95
22.00
27.25
69.26
19.0022.27 22.21
99
QTR 4QTR 3
QTR 2
QTR 1
PO
PPO
10
20
30
40
50
60
70
PRICE SCALE
76COMPOSITE RATING$17.00IPO 5/18/1711$12131415 -0.71 $16 -0.8517 -1.36EST ↑18 -1.84EST ↑
EARNINGS (DEC) HI LOXoma XOMA 99 81Cerecor CERC 99 67NeptTc n NEPT 99 62Aradigm ARDM 99 61MadrigalPh MDGL 99 54
GROUP REL STR 86 RS EPS
291511732062282511281430162195217241024102713DECNOVOCTSEPAUGJULJUNMAYAPRMARFEB
EARNINGS $SALES MIL. $DIVIDEND-PE
-0.28 VS -0.18 N/A4.6 VS 1.9 +146%N/A N/A
-0.37 VS -0.15 N/A7.1 VS 2.5 +182%N/A N/A
0.01 VS -0.19#+105%18.0 VS 3.8 +371%N/A N/A
-0.39 VS -0.23 N/A7.1 VS 5.5 +29%N/A N/A
EPS DUE 1/28 QUARTER ENDED DEC 31,16 QUARTER ENDED MAR 31,17 QUARTER ENDED JUN 30,17 QUARTER ENDED SEP 30,17
R S LINE VS SP500
VOLUME
2K
30K
*DAQO NEW ENERGY CORP ADS(DQ ) NYSE 10.6 SHRS / 5.2 FLT / AVG VOL332082 $59.44(OH -7%)ENERGY-SOLAR dqsolar.comCHINESE MANUFACTURER OF POLYSILICON FOR USE IN PHOTOVOLTAIC PRODUCTS SUCH AS INGOTS, WAFERS, CELLS/MODULES
12/16 Q4 2016 INCLUDES $199,000 FOR IMPAIRMENT OF LONG-LIVED ASSETS.
SHORT INT .6 DAYS +2%OPTIONS ON PSUP/DOWN 1.7EX-DIVYIELD
GROWTH RATE +99%EARNINGS STAB 41EPS RANK 88PE 9 (0.4XS&P)5 YR PE 3 - 87
DEBT 41%NEW CEOTIMELINESS BACC/DIST ASMR RATING A
2.33 X BK VALUEINVENTORY TO. 19.9XR&D 1.7%RET ON EQUITY 21%CASH FLOW $8.3
FUNDS 9%BANKS 0%MGMT 37%ALPHA 0.36BETA 2
26.15 27.1324.25
30.80
58.49
22.00
18.01 19.00
23.67
99
QTR 4QTR 3
QTR 2
QTR 1
10
20
30
40
50
60
70
PRICE SCALE
99COMPOSITE RATING(C)$9.50IPO 10/07/1011$ 5.57∆ $ 74 712 -6.81 20 313 -10.25∆ 49 414 1.97 56 2115 2.62∆ 31 1116 5.01∆ 27 1117 7.56EST +51% ↑18 6.78EST -10% ↑
EARNINGS (DEC) HI LOSolaredge SEDG 98 69FirstSolar FSLR 98 67EnphasEnrg ENPH 98 58RealGdsSol RGSE 86 62JinkoSol JKS 84 12
GROUP REL STR 99 RS EPS
291511732062282511281430162195217241024102713DECNOVOCTSEPAUGJULJUNMAYAPRMARFEB
EARNINGS $SALES MIL. $DIVIDEND-PE
0.58∆ VS 1.12∆ -48%46.1 VS 59.3 -22%N/A 5X-- 3X
2.32 VS 1.11 +109%83.8 VS 57.7 +45%N/A 5X-- 4X
1.29 VS 2.08 -38%76.0 VS 71.0 +7%N/A 4X-- 3X
2.35 VS 1.24 +90%89.4 VS 54.3 +65%N/A 5X-- 3X
EPS DUE 3/7 QUARTER ENDED DEC 31,16 QUARTER ENDED MAR 31,17 QUARTER ENDED JUN 30,17 QUARTER ENDED SEP 30,17
R S LINE VS SP500 VOLUME
22K
70K
250K
21
Marketsmith.com // 2018 Q1 l ScreensImmunomedics Inc (IMMU)
Neptune Tech & Bioresrc (NEPT)
IMMUNOMEDICS INC(IMMU) NASDAQ 152.0 SHRS / 150.5 FLT / AVG VOL3.42MIL $16.16(OH -5%)MEDICAL-BIOMED/BIOTECH immunomedics.comDEVELOPS MONOCLONAL ANTIBODY-BASED PRODUCTS TO TREAT CANCER/AUTOIMMUNE DISORDERS USING PROPRIETARY TECHNOLOGY.
11/17 NAMED MICHAEL PEHL PRES, EFFECTIVE DECEMBER 7, 2017.
SHORT INT 8.8 DAYS +4%OPTIONS ON AM/MSUP/DOWN 1.5EX-DIVYIELD
GROWTH RATEEARNINGS STABEPS RANK 4PE5 YR PE
DEBTNEW CEO 12/17TIMELINESS CACC/DIST ASMR RATING
-41.86 X BK VALUEINVENTORY TO. 6.6XR&D N/ARET ON EQUITY N/ACASH FLOW $-0.95
FUNDS 20%BANKS 0%MGMT 1%ALPHA 0.57BETA 1.56
5.89
7.15
9.51
12.96
14.48
12.83
3.304.08
4.73 5.00
7.17
9.728.688.68
99
QTR 4QTR 3
QTR 2
QTR 1
0
5
10
15
20
PRICE SCALE
59COMPOSITE RATING(W)(C)11$ -0.20 $ 4 212 0.01 4 213 -0.15 7 214 -0.42 6 315 -0.51 5 116 -0.62 5 117 -1.0218 -1.26EST ↓
EARNINGS (JUN) HI LOXoma XOMA 99 81Cerecor CERC 99 67NeptTc n NEPT 99 62Aradigm ARDM 99 61MadrigalPh MDGL 99 54
GROUP REL STR 86 RS EPS
291511732062282511281430162195217241024102713DECNOVOCTSEPAUGJULJUNMAYAPRMARFEB
EARNINGS $SALES MIL. $DIVIDEND-PE
-0.30 VS -0.15 N/A0.4 VS 0.7 -43%N/A N/A
-0.29 VS -0.15 N/A1.3 VS 0.9 +47%N/A N/A
-0.25 VS -0.17 N/A0.6 VS 0.9 -31%N/A N/A
-0.26 VS -0.17 N/A0.7 VS 0.7 -7%N/A N/A
EPS DUE 2/9 QUARTER ENDED DEC 31,16 QUARTER ENDED MAR 31,17 QUARTER ENDED JUN 30,17 QUARTER ENDED SEP 30,17
R S LINE VS SP500
VOLUME
700K
3M
11.5M
NEPTUNE TECH & BIORESRC(NEPT) NASDAQ 78.6 SHRS / 75.5 FLT / AVG VOL548114 $2.36(OH -3%)MEDICAL-BIOMED/BIOTECH neptunebiotech.comDEVELOPS NUTRACEUTICALS/BIOPHARMACEUTICALS DERIVED FROM ZOOPLANKTON USING ITS PROPRIETARY EXTRACTION PROCESS.
9/17 Q2 FY18 INCLUDES A $1,719,362 CHARGE FOR IMPAIRMENT ON INVENTORY AND $23,871,077 GAIN ON SALE OF ASSETS.
SHORT INT 1 DAYS -59%OPTIONS ONUP/DOWN 2.3EX-DIVYIELD
GROWTH RATEEARNINGS STABEPS RANK 62PE 6 (0.3XS&P)5 YR PE 8 - 14
DEBT 3%NEW CEOTIMELINESS CACC/DIST ASMR RATING D
2.91 X BK VALUEINVENTORY TO. 3.0XR&D 15.5%RET ON EQUITY 2%CASH FLOW $0.04
FUNDS 0%BANKS 0%MGMT 4%ALPHA 0.35BETA 0.18
1.251.12 1.07
1.18
.95 .98 1.01
1.00 .96 .93.81
.70.80 .82
99
QTR 4QTR 3
QTR 2
QTR 1
0
1
2
PRICE SCALE
92COMPOSITE RATING(C)11$ -0.01 $ 4 212 -0.04 5 113 -0.36∆ 4 114 -0.28 3 115 -0.37∆ 2 016 -0.09 1 017 0.0818 -0.09EST ↓
EARNINGS (MAR) HI LOXoma XOMA 99 81Cerecor CERC 99 67Aradigm ARDM 99 61MadrigalPh MDGL 99 54CatalystBi CBIO 99 54
GROUP REL STR 86 RS EPS
291511732062282511281430162195217241024102713DECNOVOCTSEPAUGJULJUNMAYAPRMARFEB
EARNINGS $SALES MIL. $DIVIDEND-PE
0.14 VS -0.02#+800%12.1 VS 5.5 +120%N/A N/A
-0.01 VS 0.01 N/A11.8 VS 10.0 +18%N/A 13X-- 10X
-0.02 VS -0.03 N/A6.5 VS 11.3 -42%N/A 14X-- 9X
0.24∆ VS -0.02#+13006.8 VS 11.6 -41%N/A 12X-- 8X
EPS DUE*1/12 QUARTER ENDED DEC 31,16 QUARTER ENDED MAR 31,17 QUARTER ENDED JUN 30,17 QUARTER ENDED SEP 30,17
R S LINE VS SP500
VOLUME
32K
128K
600K
22
Earnings aren’t just a report. They’re a key component of stock growth
and worth watching for any serious investor. MarketSmith knows the
value of earnings—which is why we’ve designed these features to keep
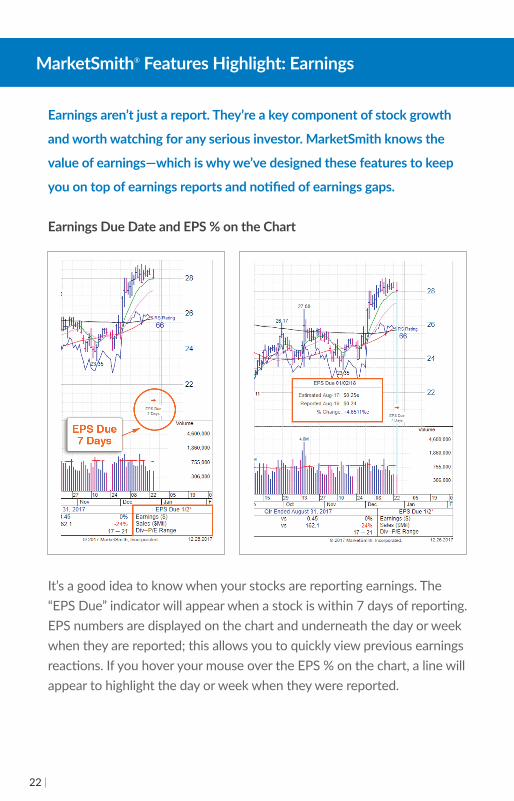
you on top of earnings reports and notified of earnings gaps. Earnings Due Date and EPS % on the Chart
It’s a good idea to know when your stocks are reporting earnings. The “EPS Due” indicator will appear when a stock is within 7 days of reporting. EPS numbers are displayed on the chart and underneath the day or week when they are reported; this allows you to quickly view previous earnings reactions. If you hover your mouse over the EPS % on the chart, a line will appear to highlight the day or week when they were reported.
MarketSmith® Features Highlight: Earnings
23
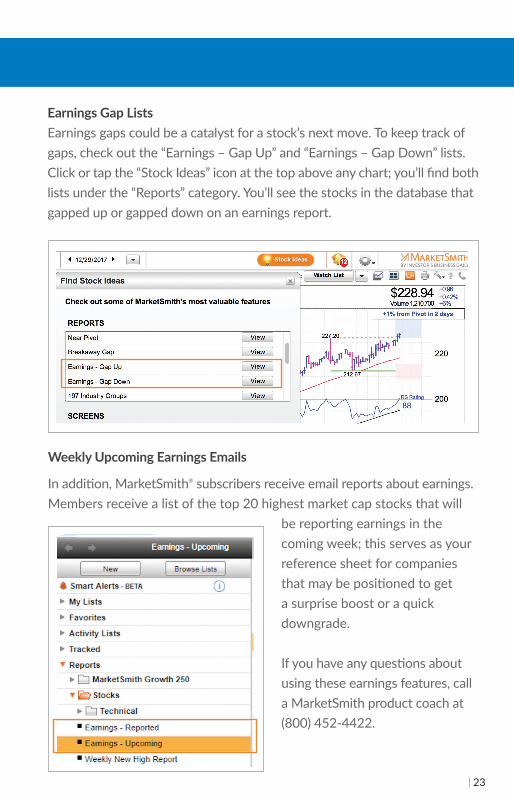
Earnings Gap Lists Earnings gaps could be a catalyst for a stock’s next move. To keep track of gaps, check out the “Earnings – Gap Up” and “Earnings – Gap Down” lists. Click or tap the “Stock Ideas” icon at the top above any chart; you’ll find both lists under the “Reports” category. You’ll see the stocks in the database that gapped up or gapped down on an earnings report.
Weekly Upcoming Earnings Emails In addition, MarketSmith® subscribers receive email reports about earnings. Members receive a list of the top 20 highest market cap stocks that will
be reporting earnings in the coming week; this serves as your reference sheet for companies that may be positioned to get a surprise boost or a quick downgrade. If you have any questions about using these earnings features, call a MarketSmith product coach at (800) 452-4422.

24
Getting Started with MarketSmith® MarketSmith offers a powerful set of investing tools, but where do you go if you’re still learning? Sign in to MarketSmith and you’ll be taken to our Member Page. Locate the “Getting Started” section, just under “Interpreting the Market.” Check out an overview video, our quick reference guide, and our “Becoming a MarketSmith” in-depth guide. __________________________________________________________________________________
Pop-up Blockers Charts are essential to the MarketSmith experience, but some web browsers prevent them from opening when you click on the prominent “Open Charts” button on the homepage. You’ll have to allow popups in your browser to fix this, but it’s an easy fix. Find out how at: Investors.com/MarketsmithPopup __________________________________________________________________________________
Video Tutorials to Sharpen Your Investing Skills From fundamental analysis to technical chart reading, Investor’s Business Daily® and MarketSmith offer comprehensive libraries of investing and stock research videos designed to help you make more money in the market. Hosted by IBD® experts and MarketSmith product coaches, you can find our video library at: Investors.com/MStutorial
Resources

25
Follow us for exclusive offers, giveaways and stock investing tips.
Get actionable investing content, unique financial stories and live videos with market updates on our Facebook page. ______________________________________________________________________
Get real-time updates on the stock market throughout the day on Twitter. Tweet us @MarketSmith with your thoughts on the market. ______________________________________________________________________
IBD’s StockTwits allows you to connect with other stock traders to get tips on growing your portfolio. ______________________________________________________________________
Reach out and network with the IBD® and MarketSmith® teams on LinkedIn to get in-depth investing knowledge. ______________________________________________________________________
Check out Friday’s video market update for our take on the market action in the week that was. Plus, you’ll find timely tips for your stock research routine. ______________________________________________________________________
Our Instagram gives you a behind-the-scenes look at how the IBD® and MarketSmith® teams work to help you succeed in the market.
Connect with Us

26
Notes

27

Top Stocks 2017 includes:
✔ Over 60 color stock graphs with price/volume activity and fundamental data
✔ An enhanced view of technical action provided by MarketSmith’s Pattern Recognition software
✔ Select stock charts annotated by MarketSmith® product coaches to illustrate key observations
What can 2017’s best stocks tell you about 2018?Successful investors know that picking stock market winners starts with studying leaders of the past to identify common threads. TOP STOCKS 2017 is a comprehensive review of the biggest market winners of 2017.
Order your copy of Top Stocks 2017 today and improve your investing outlook for 2018.
Marketsmith.investors.com/TS2017 (800) 831-2525

Copyright © 2018 Investor’s Business Daily, Inc., Investor’s Business Daily, IBD, CAN SLIM, and corresponding logos are registered trademarks owned by Investor’s Business Daily, Inc. MarketSmith is a registered trademark of MarketSmith, Incorporated.
The material contained herein is not to be reproduced, redistributed, published, stored in a retrieval system, or transmitted in any form or by any means, electronic mechanical, photocopying, recording, or otherwise, without prior written permission of Investor’s Business Daily, Inc. and MarketSmith Incorporated.
Data provided under license agreement by William O’Neil + Co. Incorporated. All material presented here has been obtained or derived from sources believed to be accurate, but Investor’s Business Daily, Inc., MarketSmith Inc., and William O’Neil + Company, Inc. do not guarantee its accuracy and it may possibly be incomplete and/or condensed. The contents are based on the study and interpretation of available data as it relates to our historical models of the best performing stocks. This is not a prospectus; no effort on our part with respect to sale or purchase of any securities is intended or implied. Any chart appearing in this material is for educational purposes and is not, and should not be construed as a recommendation or rating to buy or sell any security. It is possible that at this date or some subsequent date the officers, directors and/or shareholders of William O’Neil + Company, Inc., MarketSmith Inc. and Investor’s Business Daily, Inc. and their affiliates own securities or buy or sell securities listed in the following pages or those not mentioned.
Standard & Poor’s US Index Data
Copyright © 2018, Standard & Poor’s Financial Services LLC (“S&P”). Reproduction of S&P US Index Data in any form is prohibited except with the prior written permission of S&P. Because of the possibility of human or mechanical error by S&P’s sources, S&P or others, S&P does not guarantee the accuracy, adequacy, completeness, timeliness or availability of any information and is not responsible for any errors or omissions or for the results obtained from the use of such information. S&P GIVES NO EXPRESS OR IMPLIED WARRANTIES, INCLUDING, BUT NOT LIMITED TO, ANY WARRANTIES OF MERCHANTABILITY OR FITNESS FOR A PARTICULAR PURPOSE OR USE. In no event shall S&P or its affiliates be liable for any indirect, special or consequential damages in connection with subscriber’s or others’ use of S&P US Index Data. (2012)

1265
5 Be
atric
e St
reet
Los
Ange
les,
CA
9006
6
CO
NN
ECT
WIT
H U
S
STO
CK G
UID
E //
201
8 Q
1
Reac
h N
ew
Hei
ghts
in th
e N
ew Ye
ar