Embed Size (px)
Citation preview
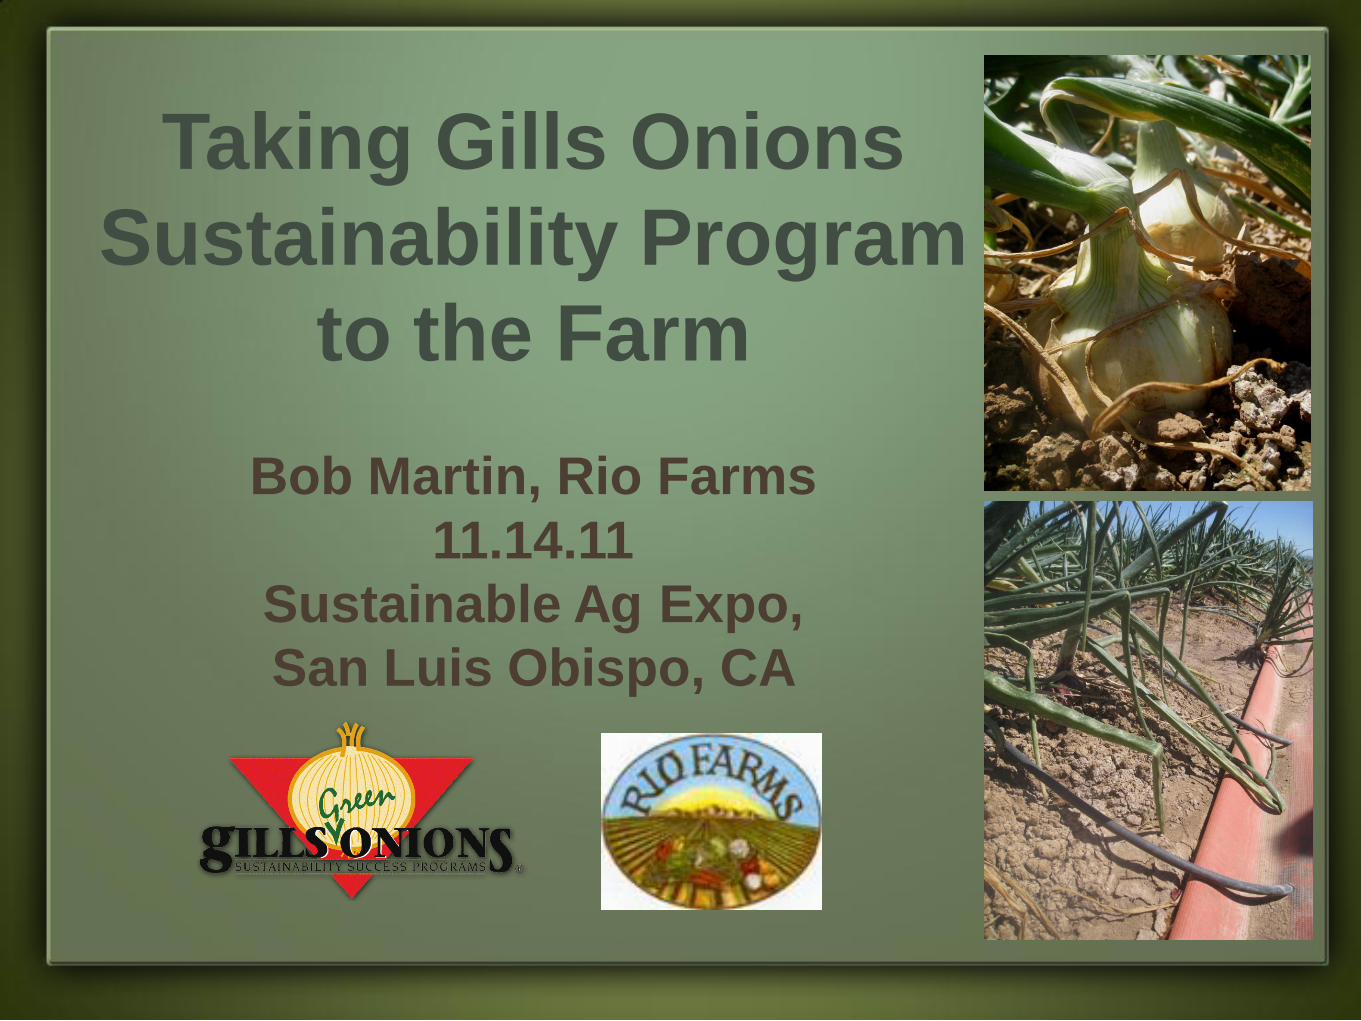
Taking Gills Onions
Sustainability Program
to the Farm
Bob Martin, Rio Farms
11.14.11
Sustainable Ag Expo,
San Luis Obispo, CA
Overview
• Background on Gills Onions & Rio Farms
• Gills Onions Sustainability Program
• Bringing Sustainability to the farm-level
• UCSB Project: 3 growing regions
• Soil Moisture Sensors
• Water Meters
• Quick Nitrate Soil Tests
• Grower’s Perspective
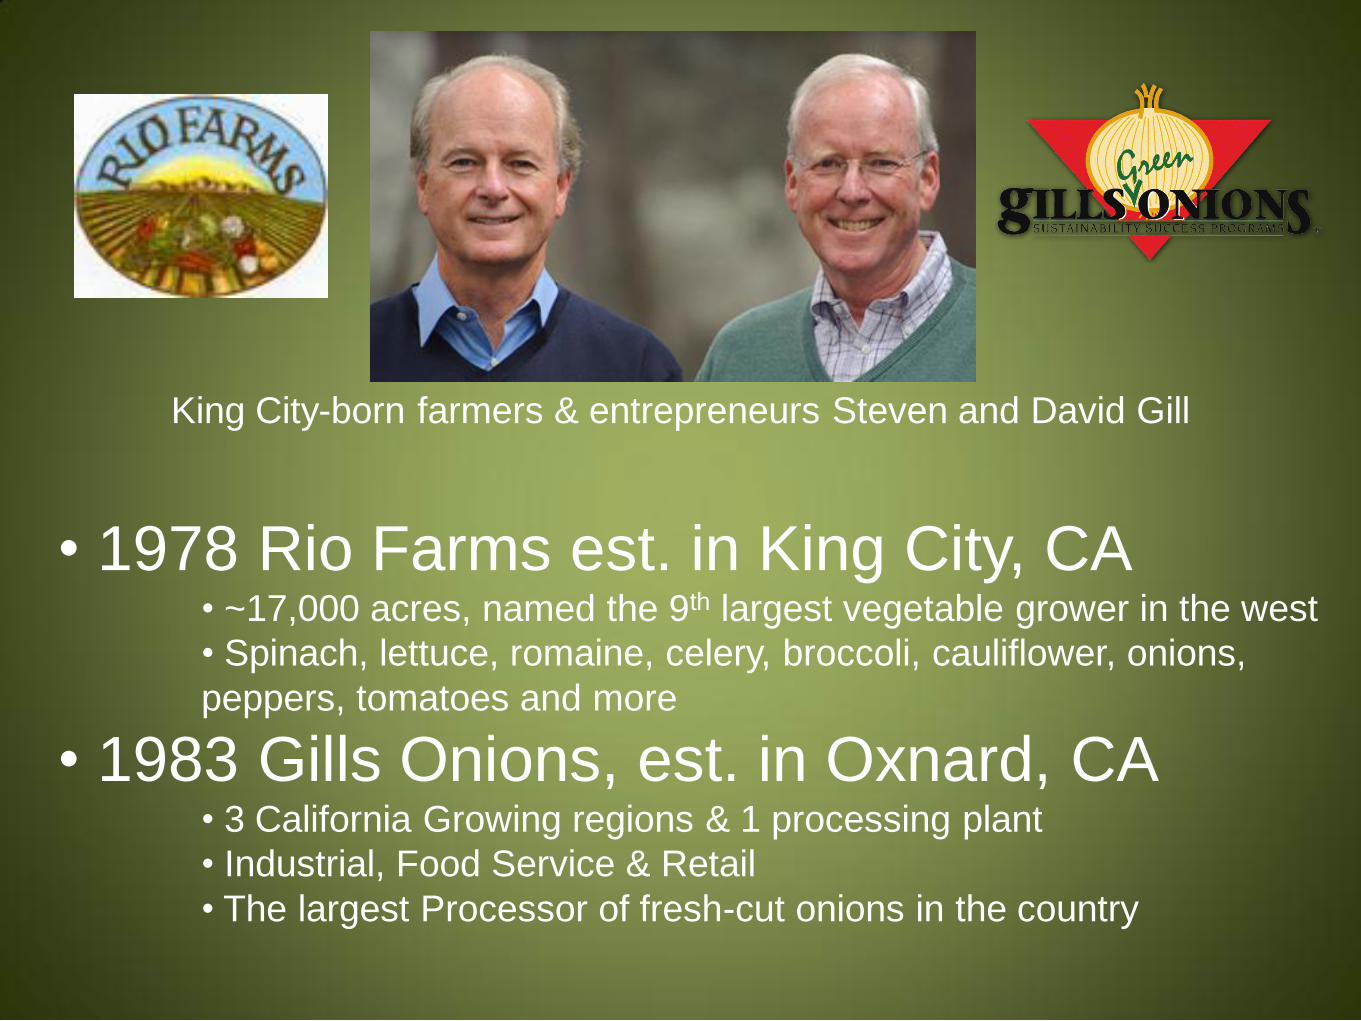
King City-born farmers & entrepreneurs Steven and David Gill
• 1978 Rio Farms est. in King City, CA • ~17,000 acres, named the 9th largest vegetable grower in the west
• Spinach, lettuce, romaine, celery, broccoli, cauliflower, onions,
peppers, tomatoes and more
• 1983 Gills Onions, est. in Oxnard, CA • 3 California Growing regions & 1 processing plant
• Industrial, Food Service & Retail
• The largest Processor of fresh-cut onions in the country
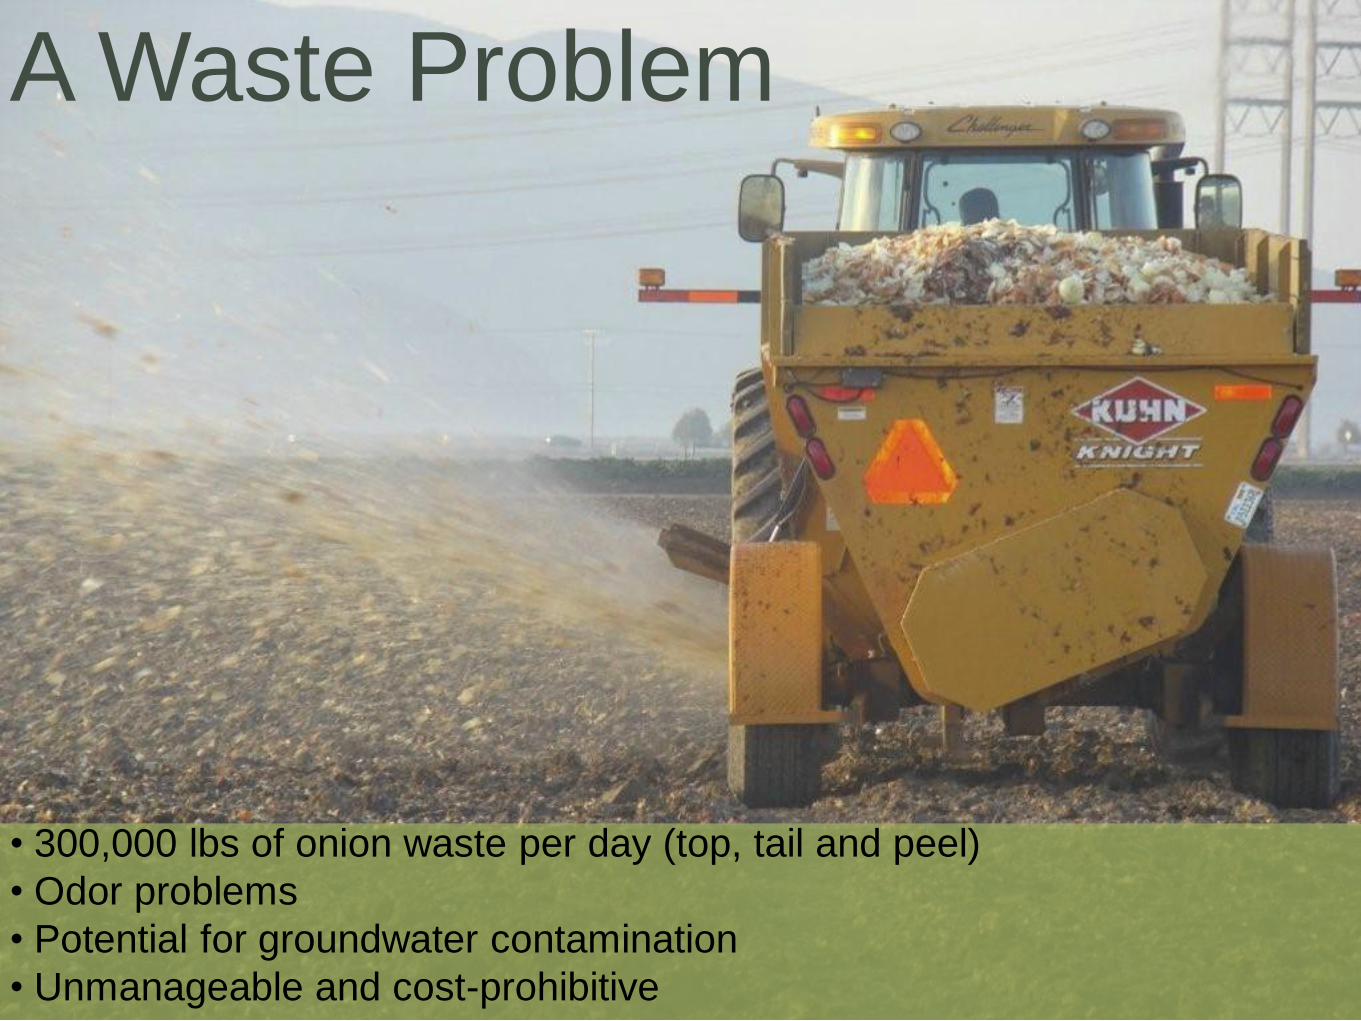
• 300,000 lbs of onion waste per day (top, tail and peel)
• Odor problems
• Potential for groundwater contamination
• Unmanageable and cost-prohibitive
A Waste Problem
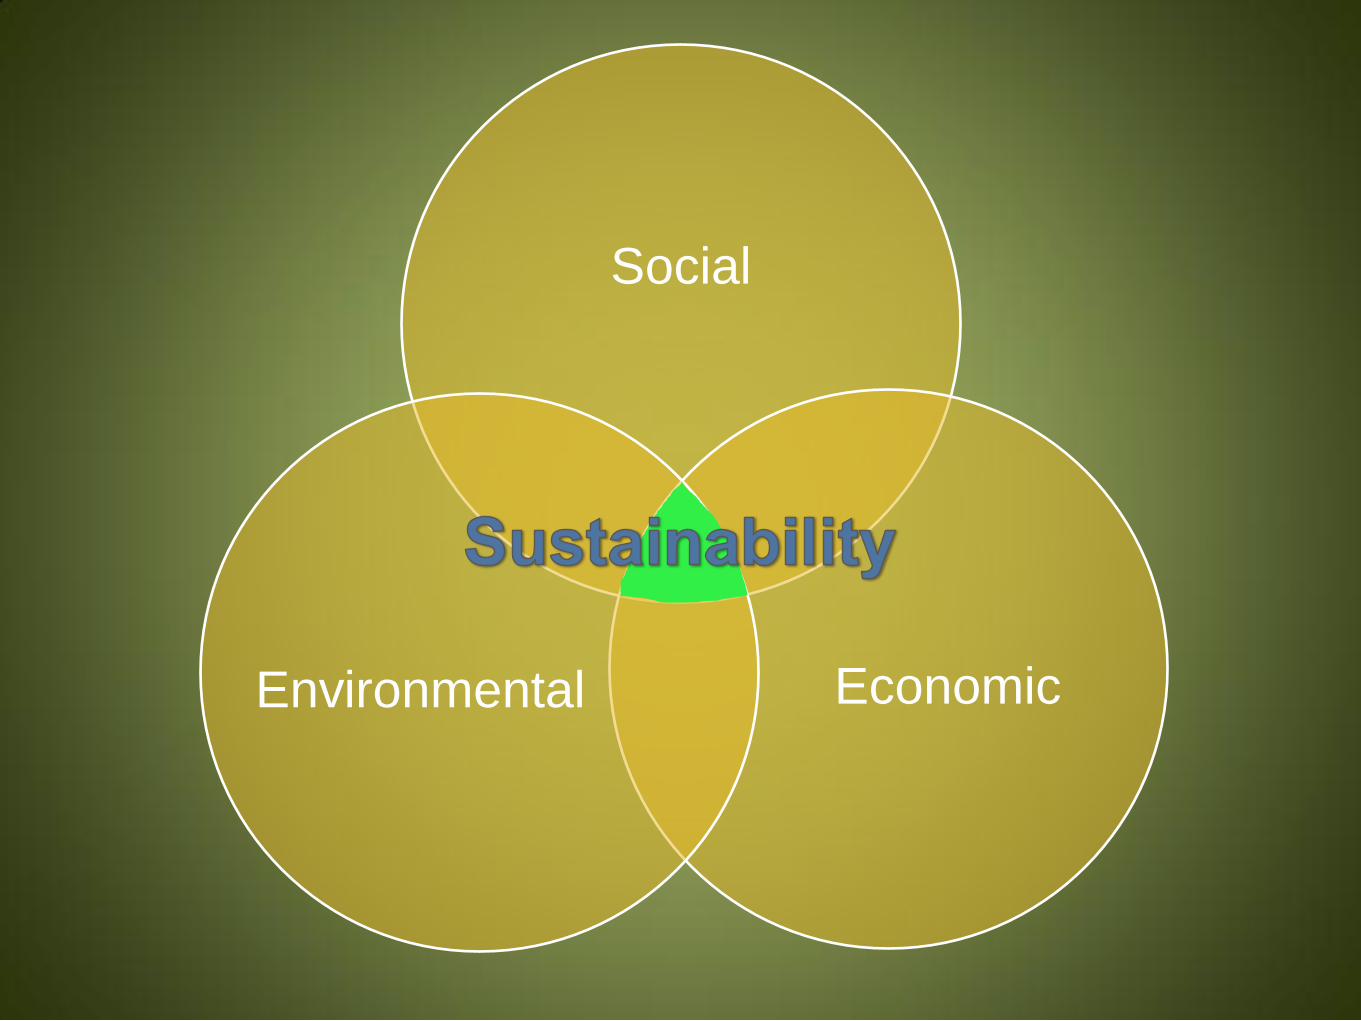
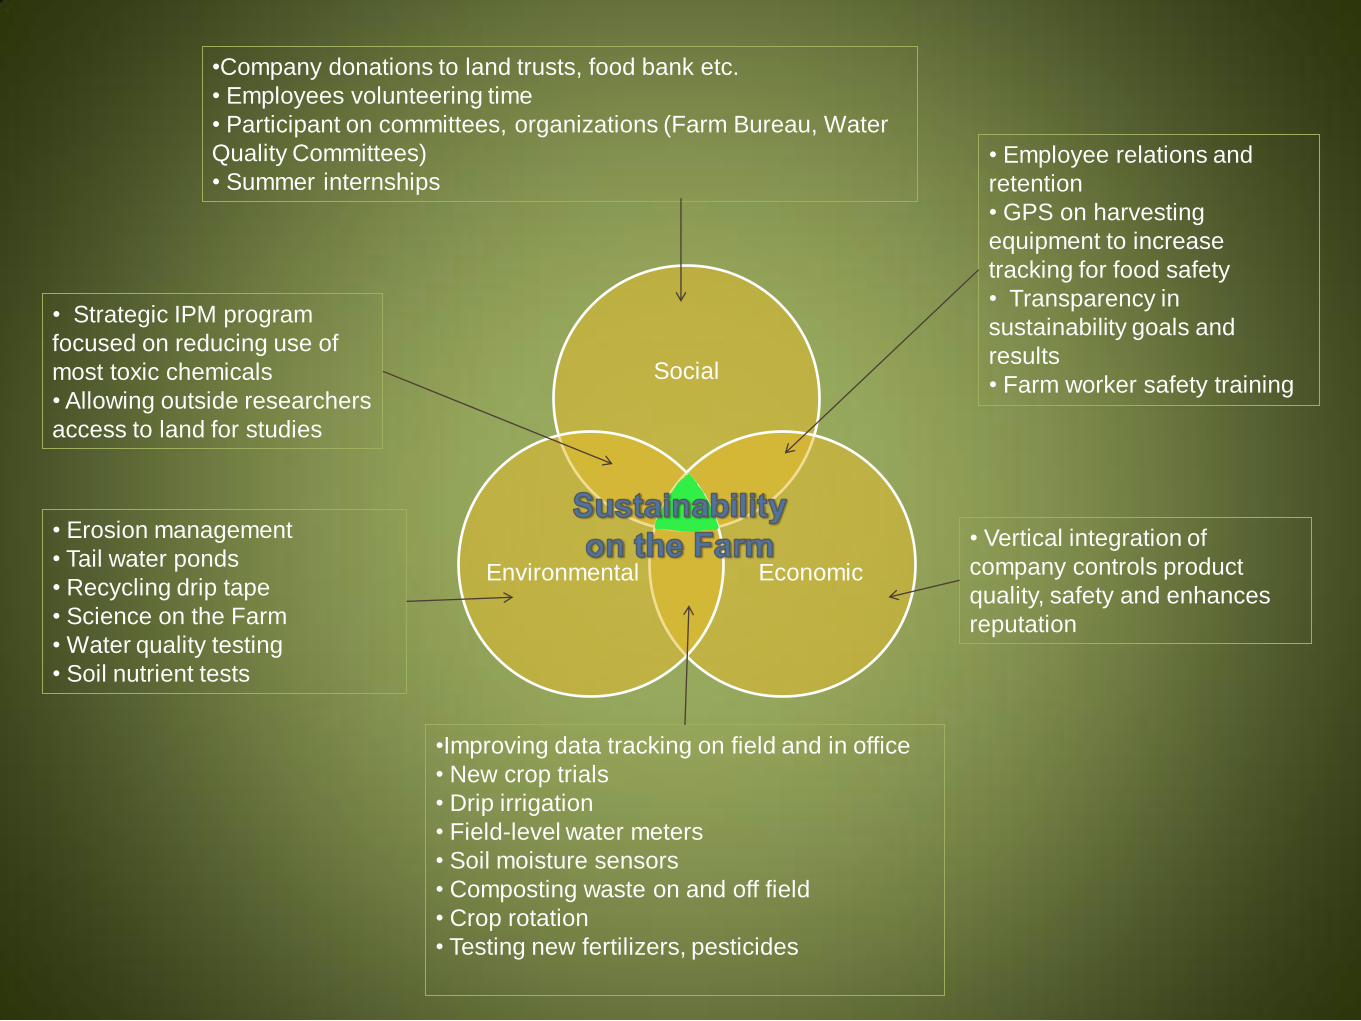
Social
Economic Environmental
Social
Economic Environmental
•Company donations to land trusts, food bank etc.
• Employees volunteering time
• Participant on committees, organizations (Farm Bureau, Water
Quality Committees)
• Summer internships • Employee relations and
retention
• GPS on harvesting
equipment to increase
tracking for food safety
• Transparency in
sustainability goals and
results
• Farm worker safety training
• Vertical integration of
company controls product
quality, safety and enhances
reputation
• Erosion management
• Tail water ponds
• Recycling drip tape
• Science on the Farm
• Water quality testing
• Soil nutrient tests
• Strategic IPM program
focused on reducing use of
most toxic chemicals
• Allowing outside researchers
access to land for studies
•Improving data tracking on field and in office
• New crop trials
• Drip irrigation
• Field-level water meters
• Soil moisture sensors
• Composting waste on and off field
• Crop rotation
• Testing new fertilizers, pesticides
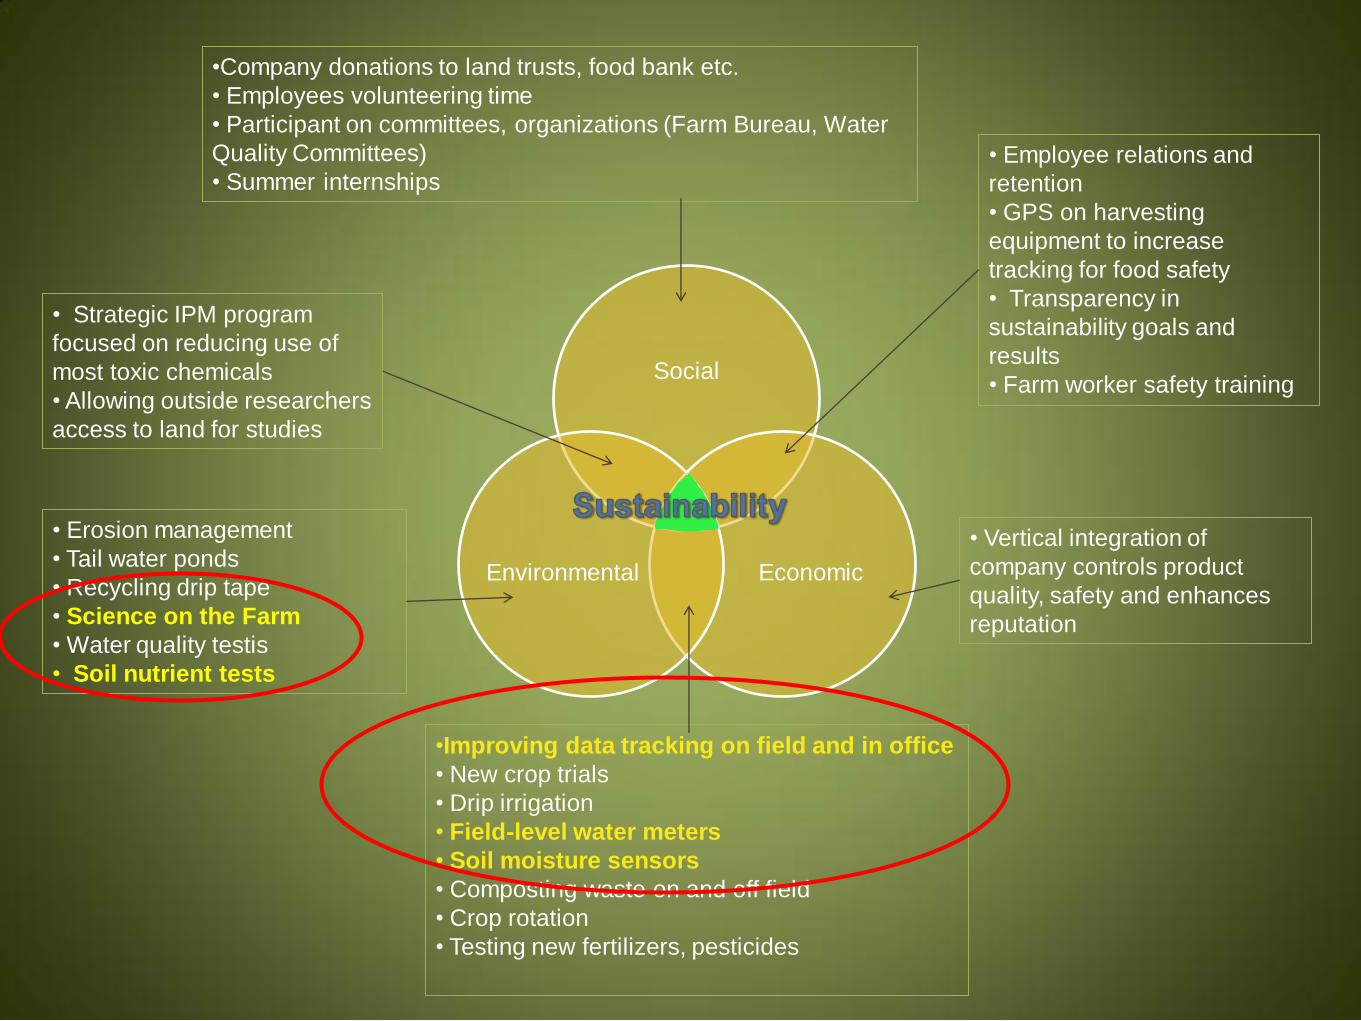
Social
Economic Environmental
•Company donations to land trusts, food bank etc.
• Employees volunteering time
• Participant on committees, organizations (Farm Bureau, Water
Quality Committees)
• Summer internships • Employee relations and
retention
• GPS on harvesting
equipment to increase
tracking for food safety
• Transparency in
sustainability goals and
results
• Farm worker safety training
• Vertical integration of
company controls product
quality, safety and enhances
reputation
• Erosion management
• Tail water ponds
• Recycling drip tape
• Science on the Farm
• Water quality testis
• Soil nutrient tests
• Strategic IPM program
focused on reducing use of
most toxic chemicals
• Allowing outside researchers
access to land for studies
•Improving data tracking on field and in office
• New crop trials
• Drip irrigation
• Field-level water meters
• Soil moisture sensors
• Composting waste on and off field
• Crop rotation
• Testing new fertilizers, pesticides
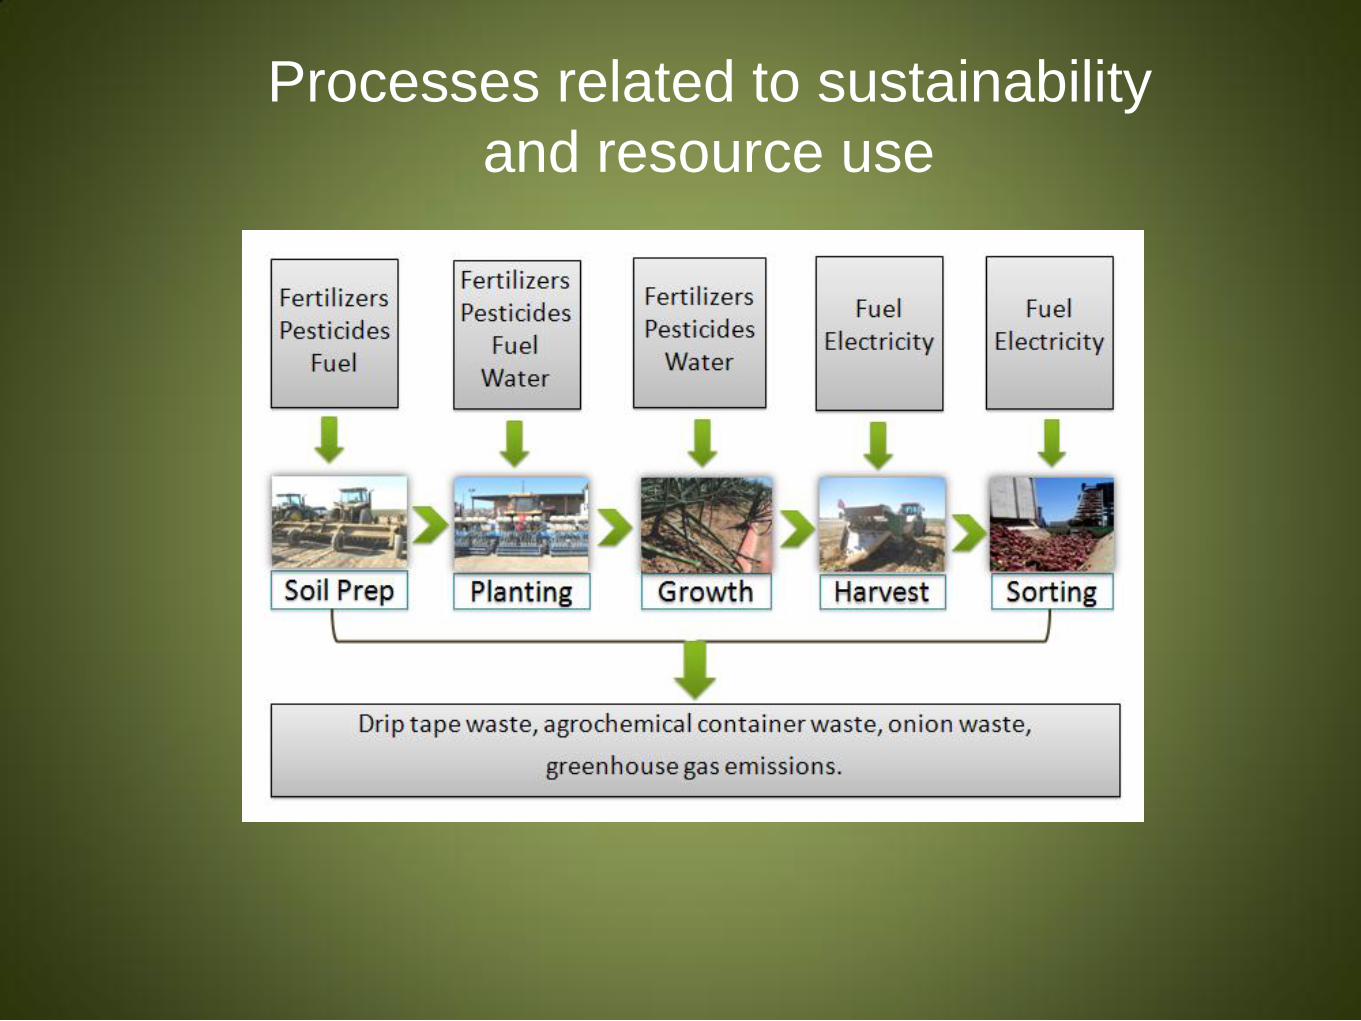
Processes related to sustainability
and resource use
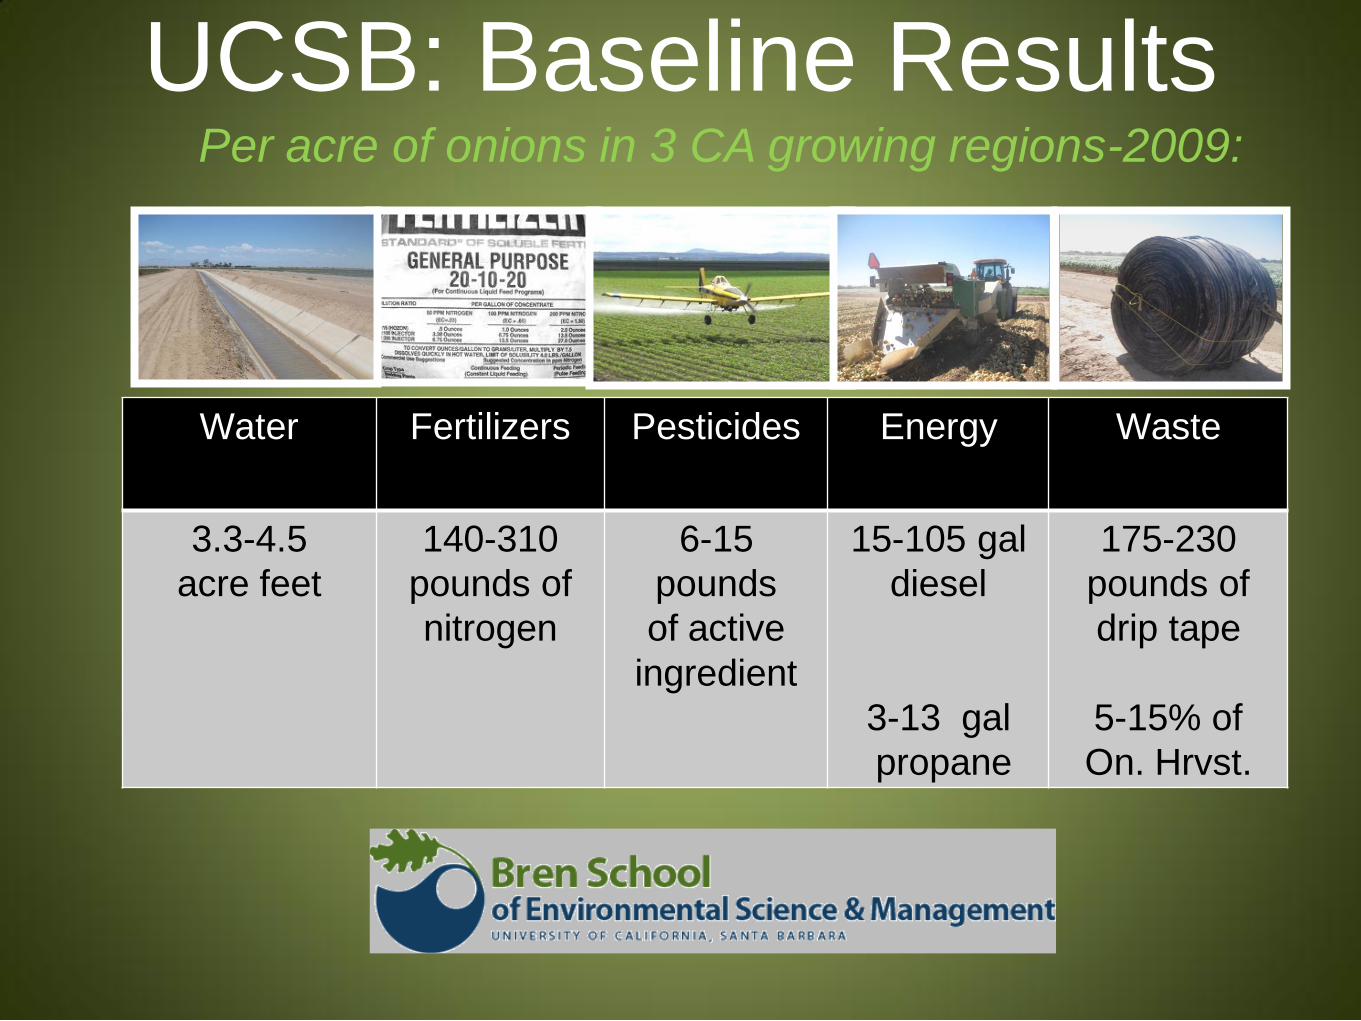
Per acre of onions in 3 CA growing regions-2009:
Water Fertilizers Pesticides Energy Waste
3.3-4.5
acre feet
140-310
pounds of
nitrogen
6-15
pounds
of active
ingredient
15-105 gal
diesel
3-13 gal
propane
175-230
pounds of
drip tape
5-15% of
On. Hrvst.
UCSB: Baseline Results
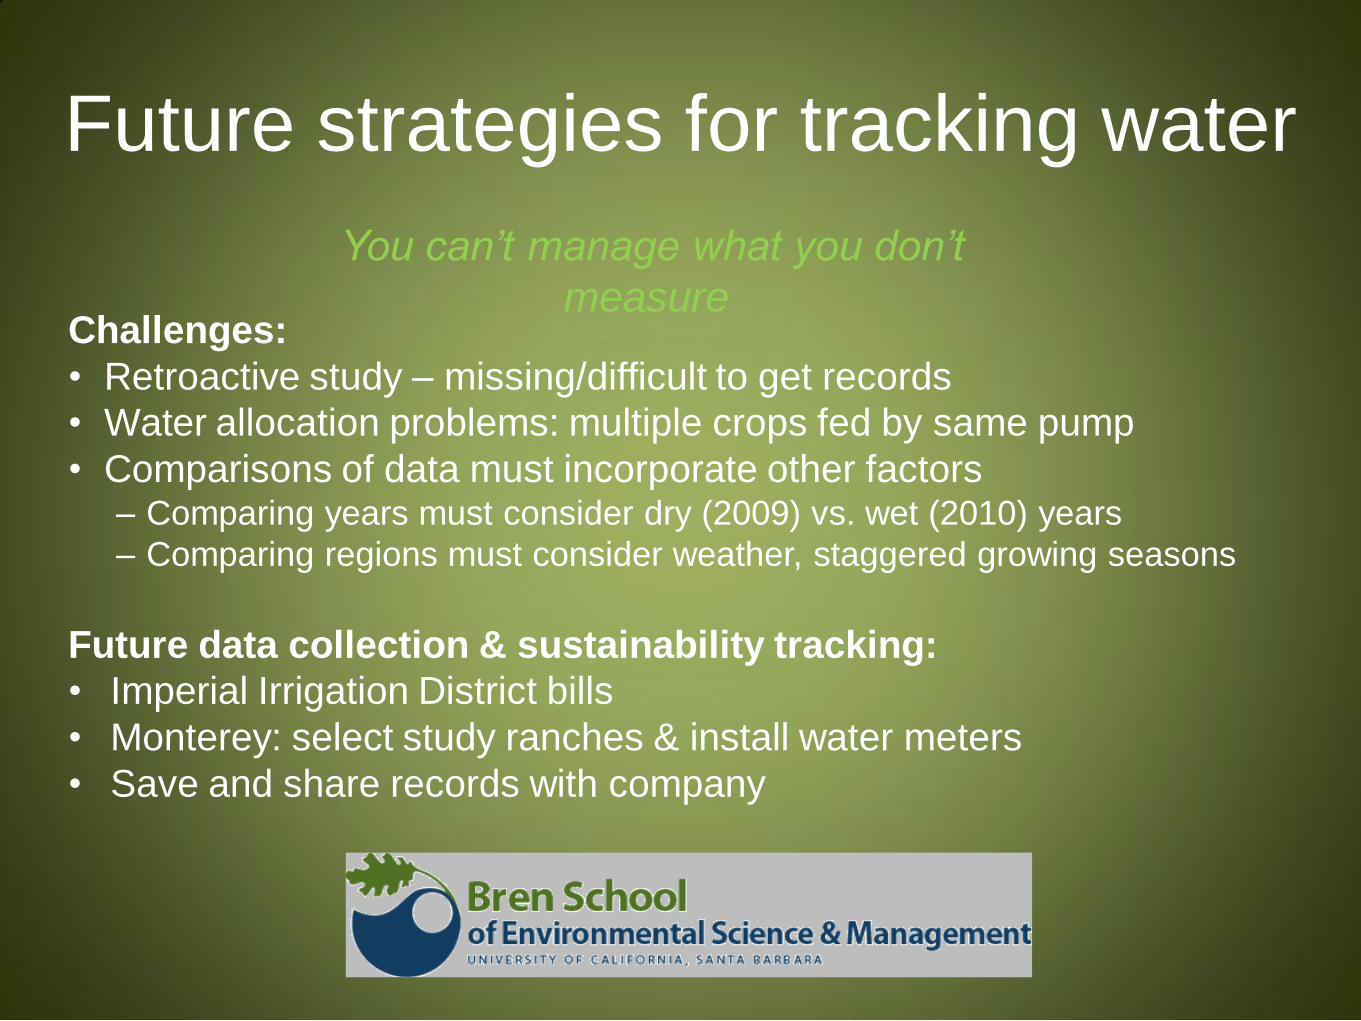
Challenges:
• Retroactive study – missing/difficult to get records
• Water allocation problems: multiple crops fed by same pump
• Comparisons of data must incorporate other factors – Comparing years must consider dry (2009) vs. wet (2010) years
– Comparing regions must consider weather, staggered growing seasons
Future data collection & sustainability tracking:
• Imperial Irrigation District bills
• Monterey: select study ranches & install water meters
• Save and share records with company
Future strategies for tracking water
You can’t manage what you don’t
measure
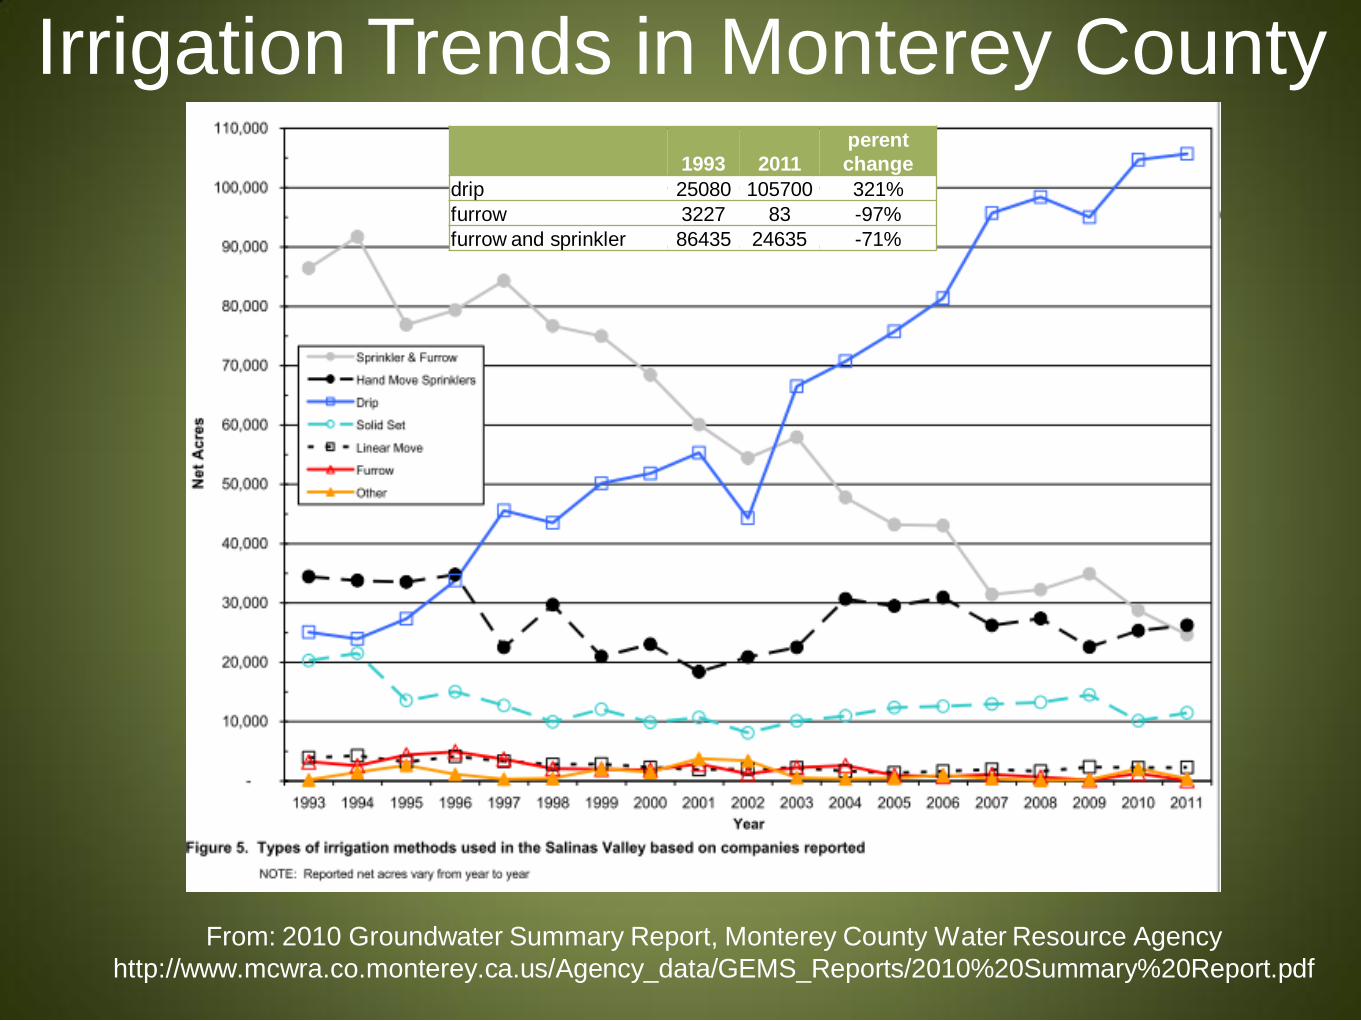
From: 2010 Groundwater Summary Report, Monterey County Water Resource Agency
http://www.mcwra.co.monterey.ca.us/Agency_data/GEMS_Reports/2010%20Summary%20Report.pdf
Irrigation Trends in Monterey County
1993 2011 perent
change
drip 25080 105700 321%
furrow 3227 83 -97%
furrow and sprinkler 86435 24635 -71%
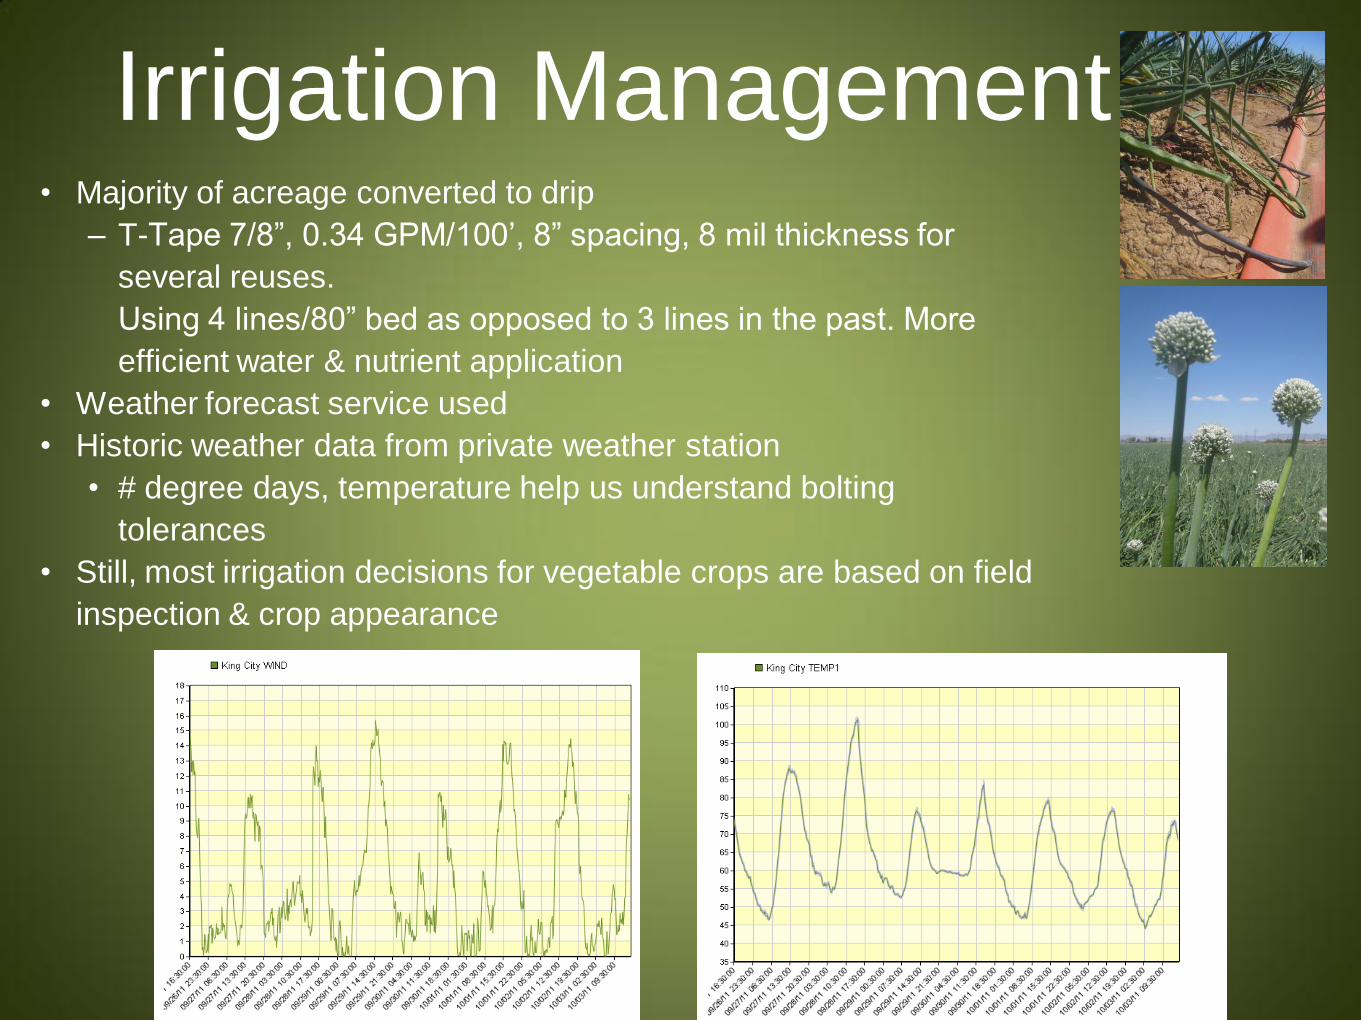
Irrigation Management • Majority of acreage converted to drip
– T-Tape 7/8”, 0.34 GPM/100’, 8” spacing, 8 mil thickness for
several reuses.
Using 4 lines/80” bed as opposed to 3 lines in the past. More
efficient water & nutrient application
• Weather forecast service used
• Historic weather data from private weather station
• # degree days, temperature help us understand bolting
tolerances
• Still, most irrigation decisions for vegetable crops are based on field
inspection & crop appearance
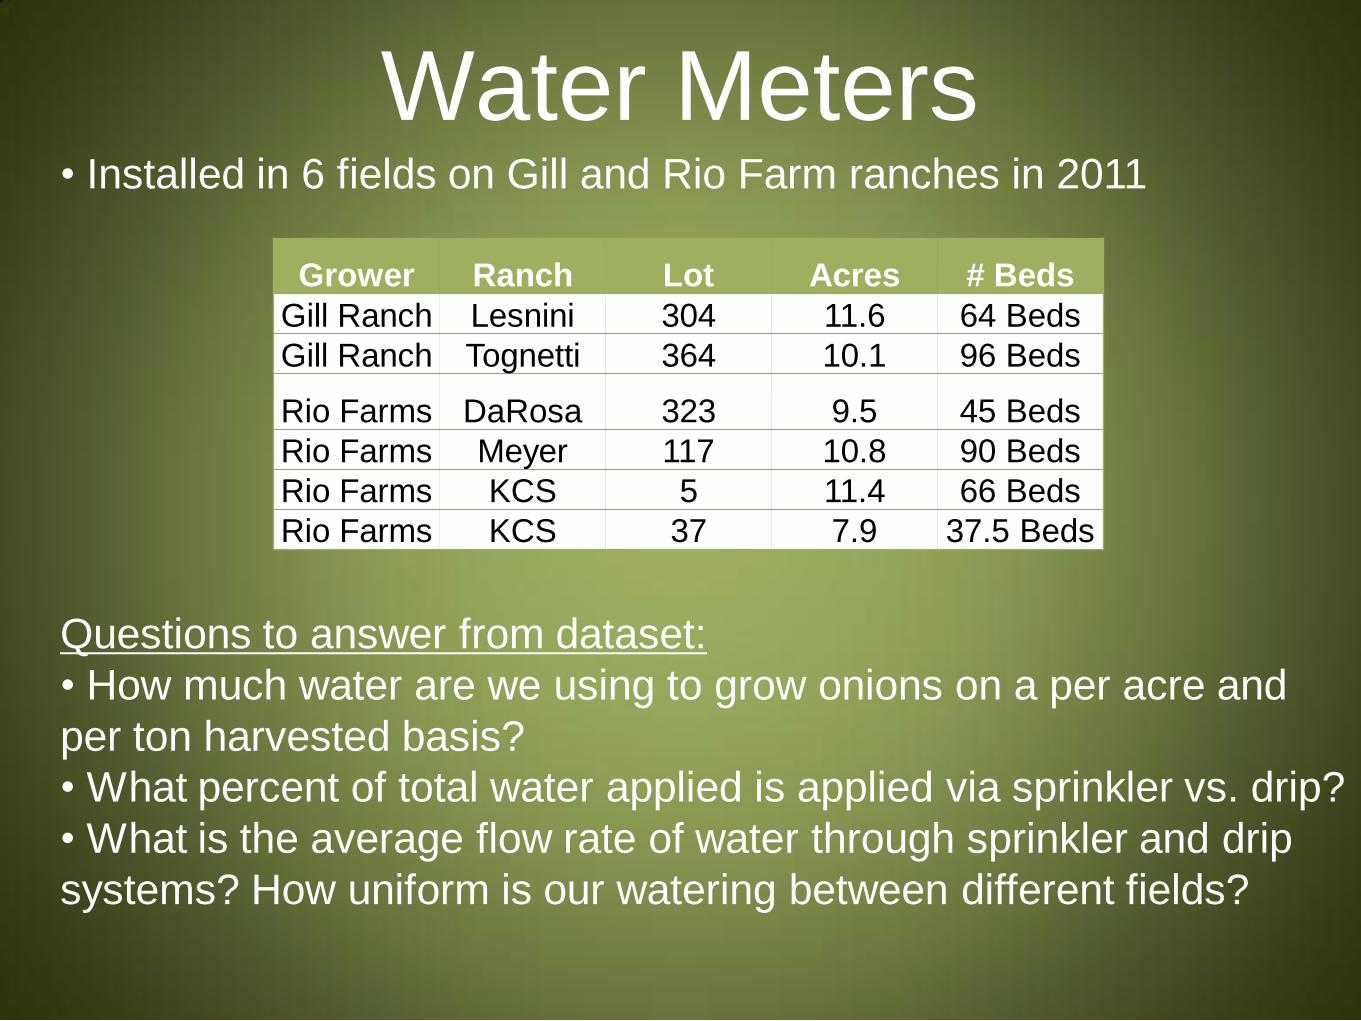
Water Meters
Grower Ranch Lot Acres # Beds
Gill Ranch Lesnini 304 11.6 64 Beds
Gill Ranch Tognetti 364 10.1 96 Beds
Rio Farms DaRosa 323 9.5 45 Beds
Rio Farms Meyer 117 10.8 90 Beds
Rio Farms KCS 5 11.4 66 Beds
Rio Farms KCS 37 7.9 37.5 Beds
• Installed in 6 fields on Gill and Rio Farm ranches in 2011
Questions to answer from dataset:
• How much water are we using to grow onions on a per acre and
per ton harvested basis?
• What percent of total water applied is applied via sprinkler vs. drip?
• What is the average flow rate of water through sprinkler and drip
systems? How uniform is our watering between different fields?
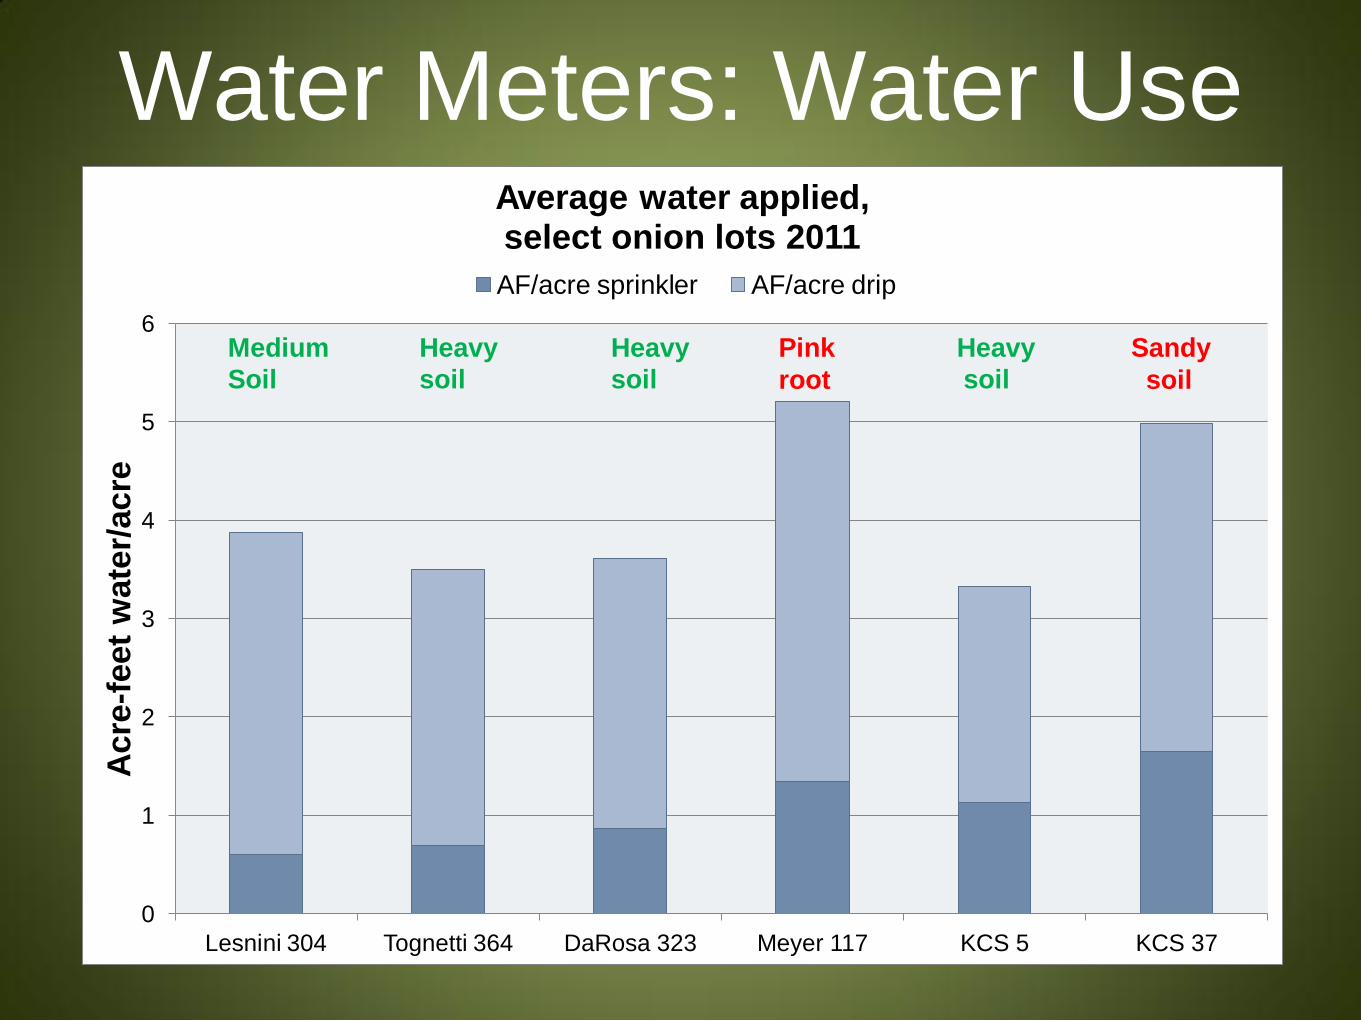
Water Meters: Water Use
0
1
2
3
4
5
6
Lesnini 304 Tognetti 364 DaRosa 323 Meyer 117 KCS 5 KCS 37
Acre
-feet
wate
r/acre
Average water applied, select onion lots 2011
AF/acre sprinkler AF/acre drip
Medium Heavy Heavy Heavy
Soil soil soil soil
Pink Sandy
root soil
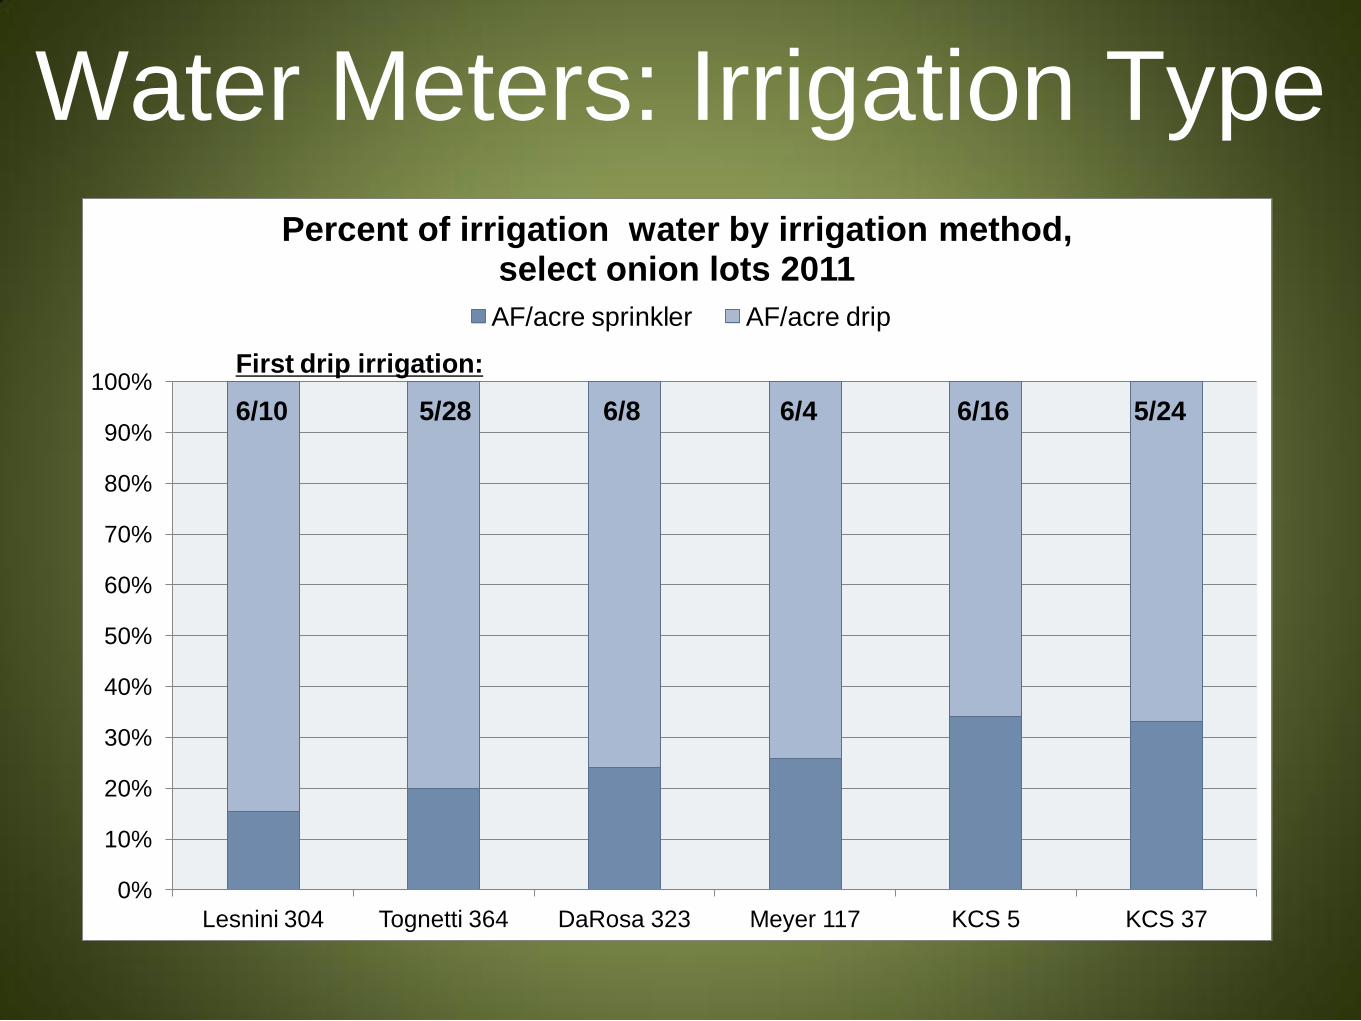
Water Meters: Irrigation Type
0%
10%
20%
30%
40%
50%
60%
70%
80%
90%
100%
Lesnini 304 Tognetti 364 DaRosa 323 Meyer 117 KCS 5 KCS 37
Percent of irrigation water by irrigation method, select onion lots 2011
AF/acre sprinkler AF/acre drip
First drip irrigation:
6/10 5/28 6/8 6/4 6/16 5/24
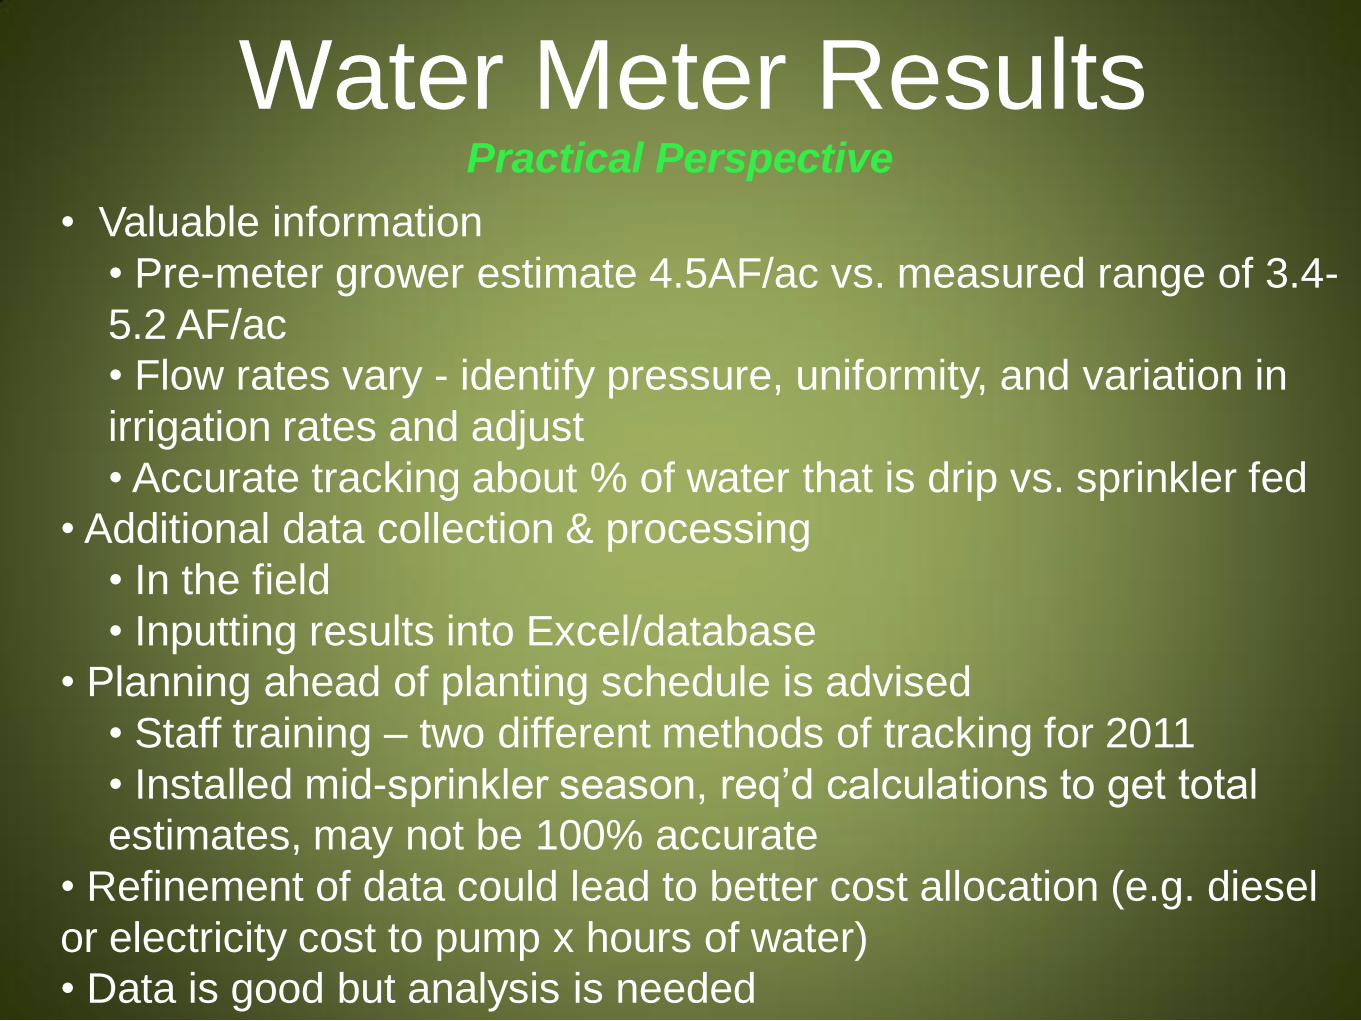
• Valuable information
• Pre-meter grower estimate 4.5AF/ac vs. measured range of 3.4-
5.2 AF/ac
• Flow rates vary - identify pressure, uniformity, and variation in
irrigation rates and adjust
• Accurate tracking about % of water that is drip vs. sprinkler fed
• Additional data collection & processing
• In the field
• Inputting results into Excel/database
• Planning ahead of planting schedule is advised
• Staff training – two different methods of tracking for 2011
• Installed mid-sprinkler season, req’d calculations to get total
estimates, may not be 100% accurate
• Refinement of data could lead to better cost allocation (e.g. diesel
or electricity cost to pump x hours of water)
• Data is good but analysis is needed
Water Meter Results Practical Perspective
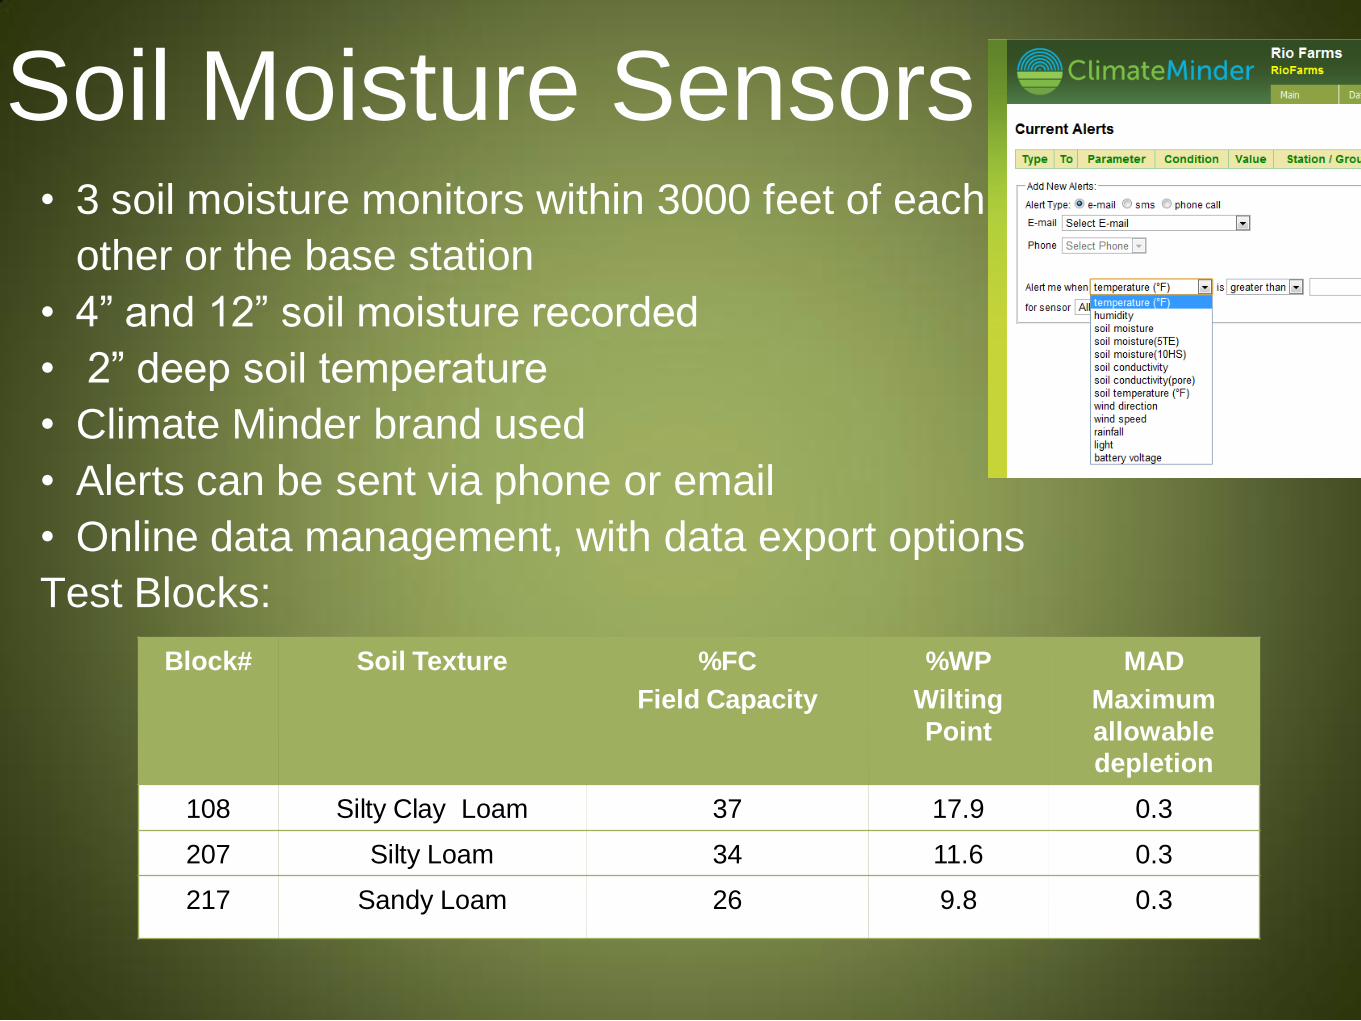
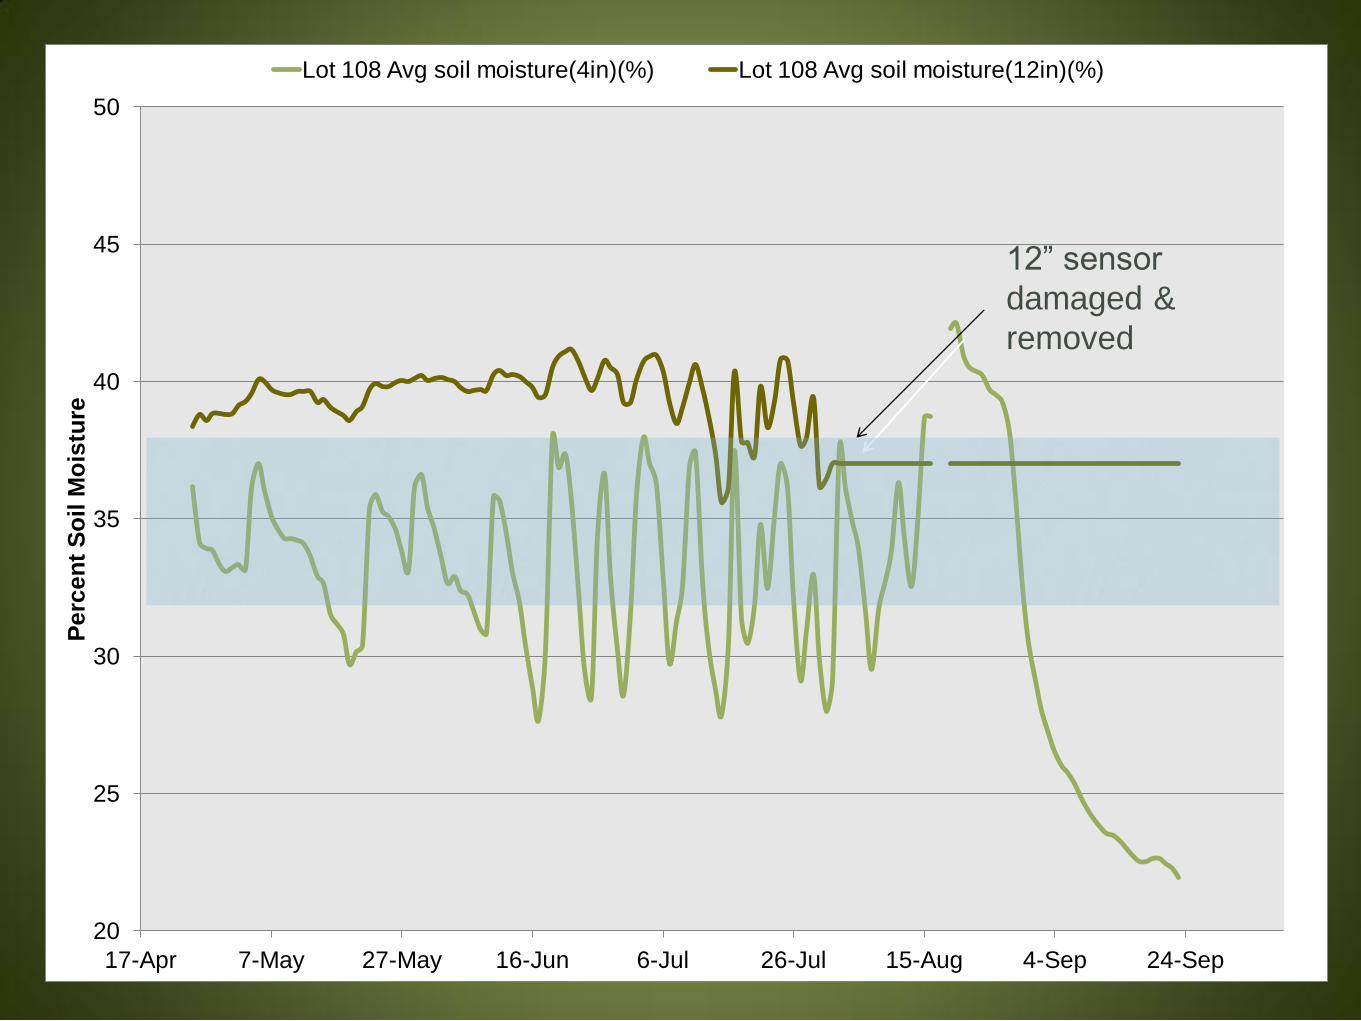
Soil Moisture Sensors • 3 soil moisture monitors within 3000 feet of each
other or the base station
• 4” and 12” soil moisture recorded
• 2” deep soil temperature
• Climate Minder brand used
• Alerts can be sent via phone or email
• Online data management, with data export options
Test Blocks:
Block# Soil Texture %FC
Field Capacity
%WP
Wilting
Point
MAD
Maximum
allowable
depletion
108 Silty Clay Loam 37 17.9 0.3
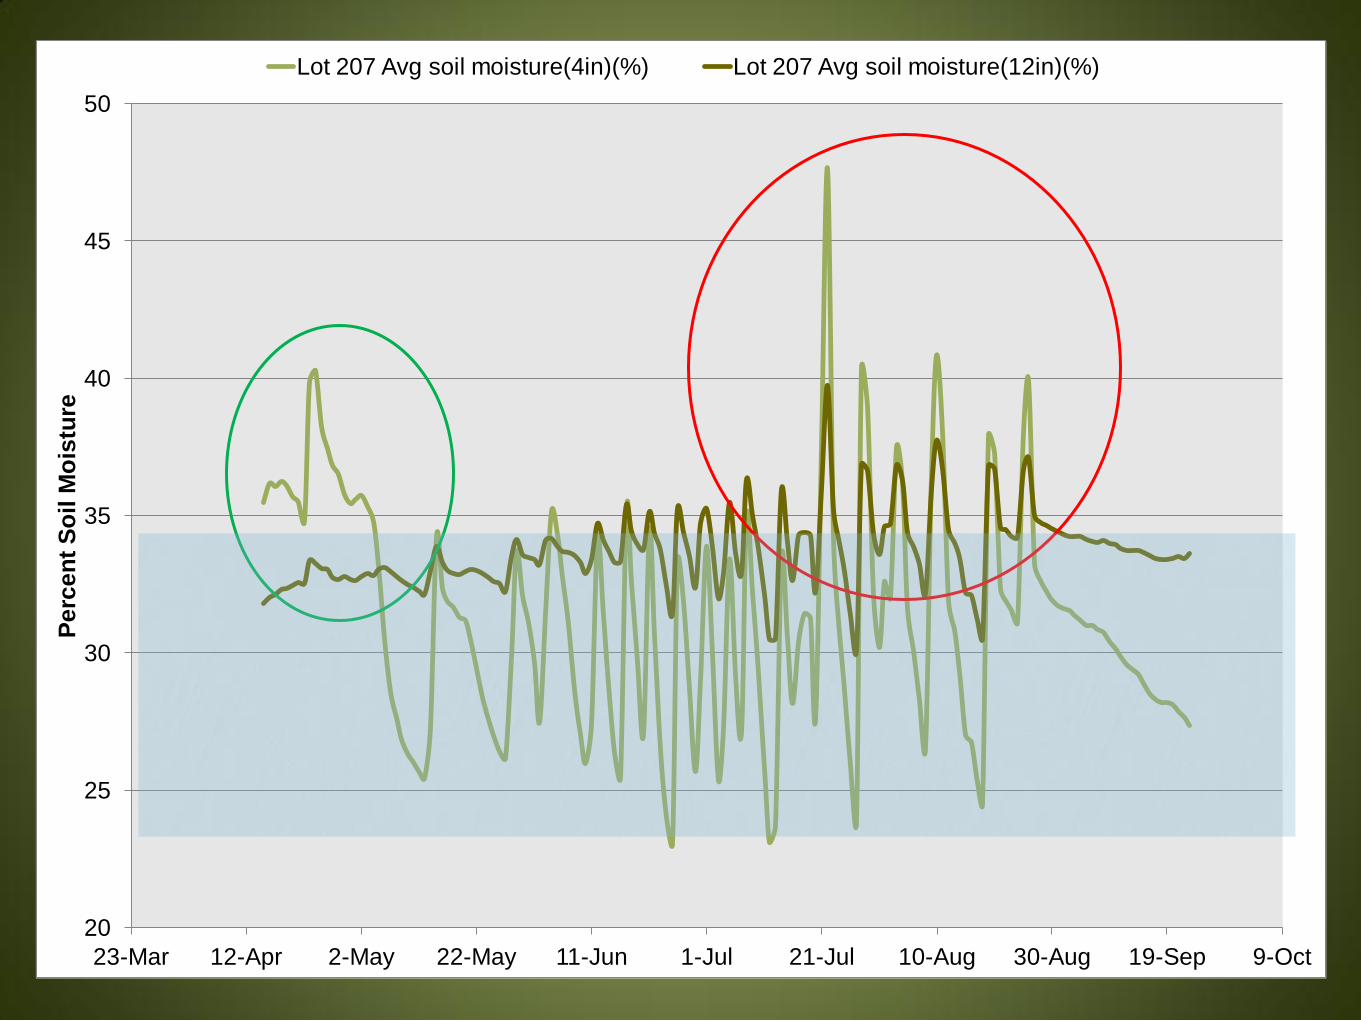
207 Silty Loam 34 11.6 0.3
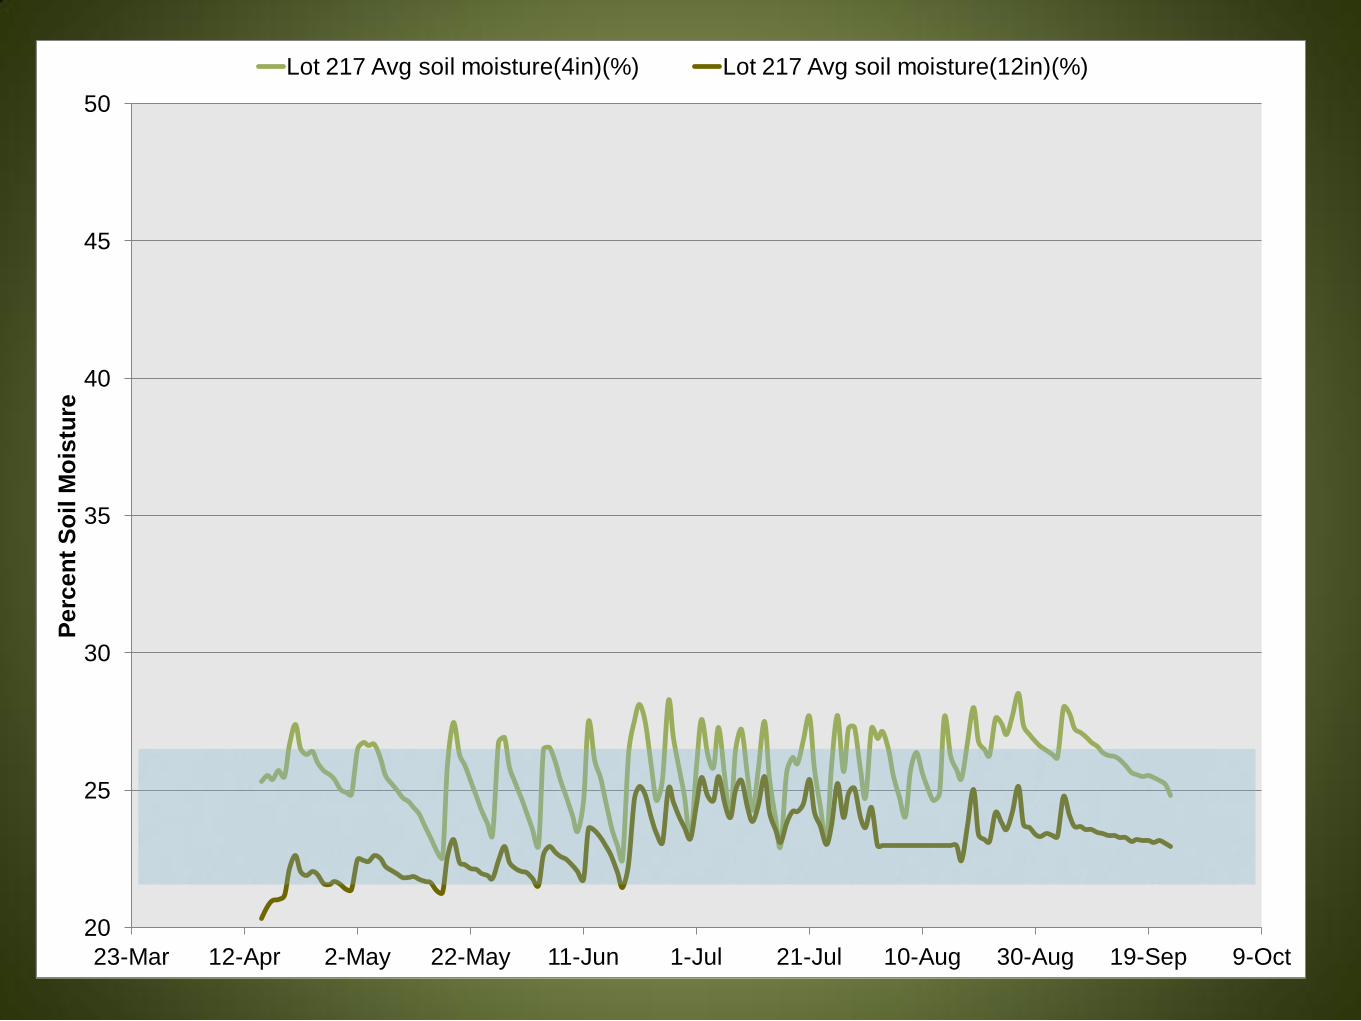
217 Sandy Loam 26 9.8 0.3
20
25
30
35
40
45
50
17-Apr 7-May 27-May 16-Jun 6-Jul 26-Jul 15-Aug 4-Sep 24-Sep
Pe
rce
nt
So
il M
ois
ture
Lot 108 Avg soil moisture(4in)(%) Lot 108 Avg soil moisture(12in)(%)
12” sensor
damaged &
removed
20
25
30
35
40
45
50
23-Mar 12-Apr 2-May 22-May 11-Jun 1-Jul 21-Jul 10-Aug 30-Aug 19-Sep 9-Oct
Pe
rce
nt
So
il M
ois
ture
Lot 207 Avg soil moisture(4in)(%) Lot 207 Avg soil moisture(12in)(%)
20
25
30
35
40
45
50
23-Mar 12-Apr 2-May 22-May 11-Jun 1-Jul 21-Jul 10-Aug 30-Aug 19-Sep 9-Oct
Pe
rce
nt
So
il M
ois
ture
Lot 217 Avg soil moisture(4in)(%) Lot 217 Avg soil moisture(12in)(%)
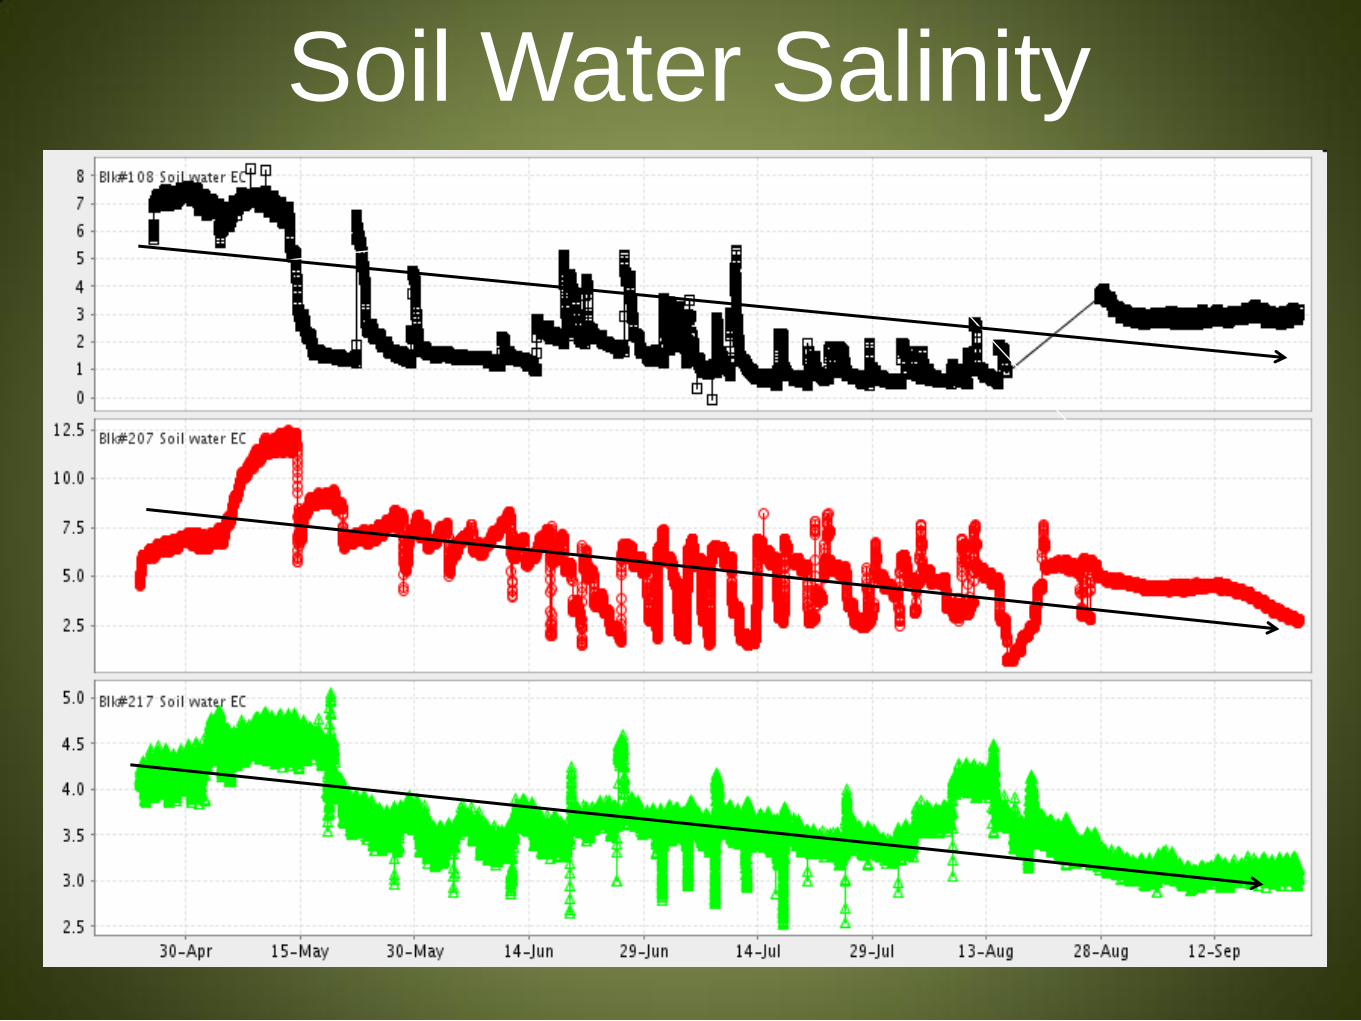
Soil water Salinity
Soil Water Salinity
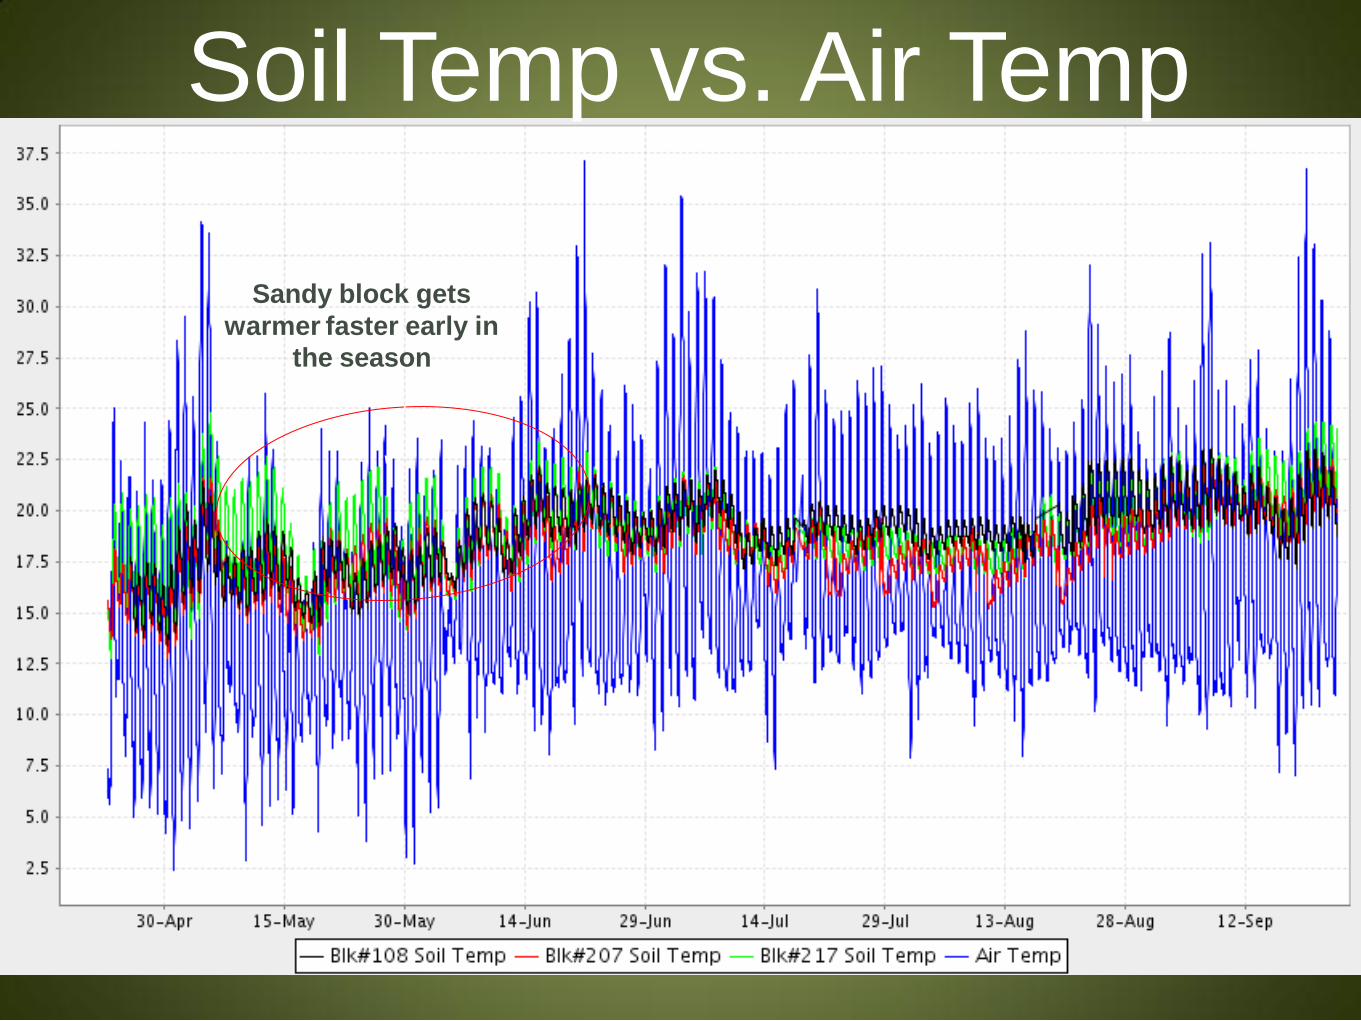
Soil Temp Vs. Air Temp
Sandy block gets
warmer faster early in
the season
Soil Temp vs. Air Temp
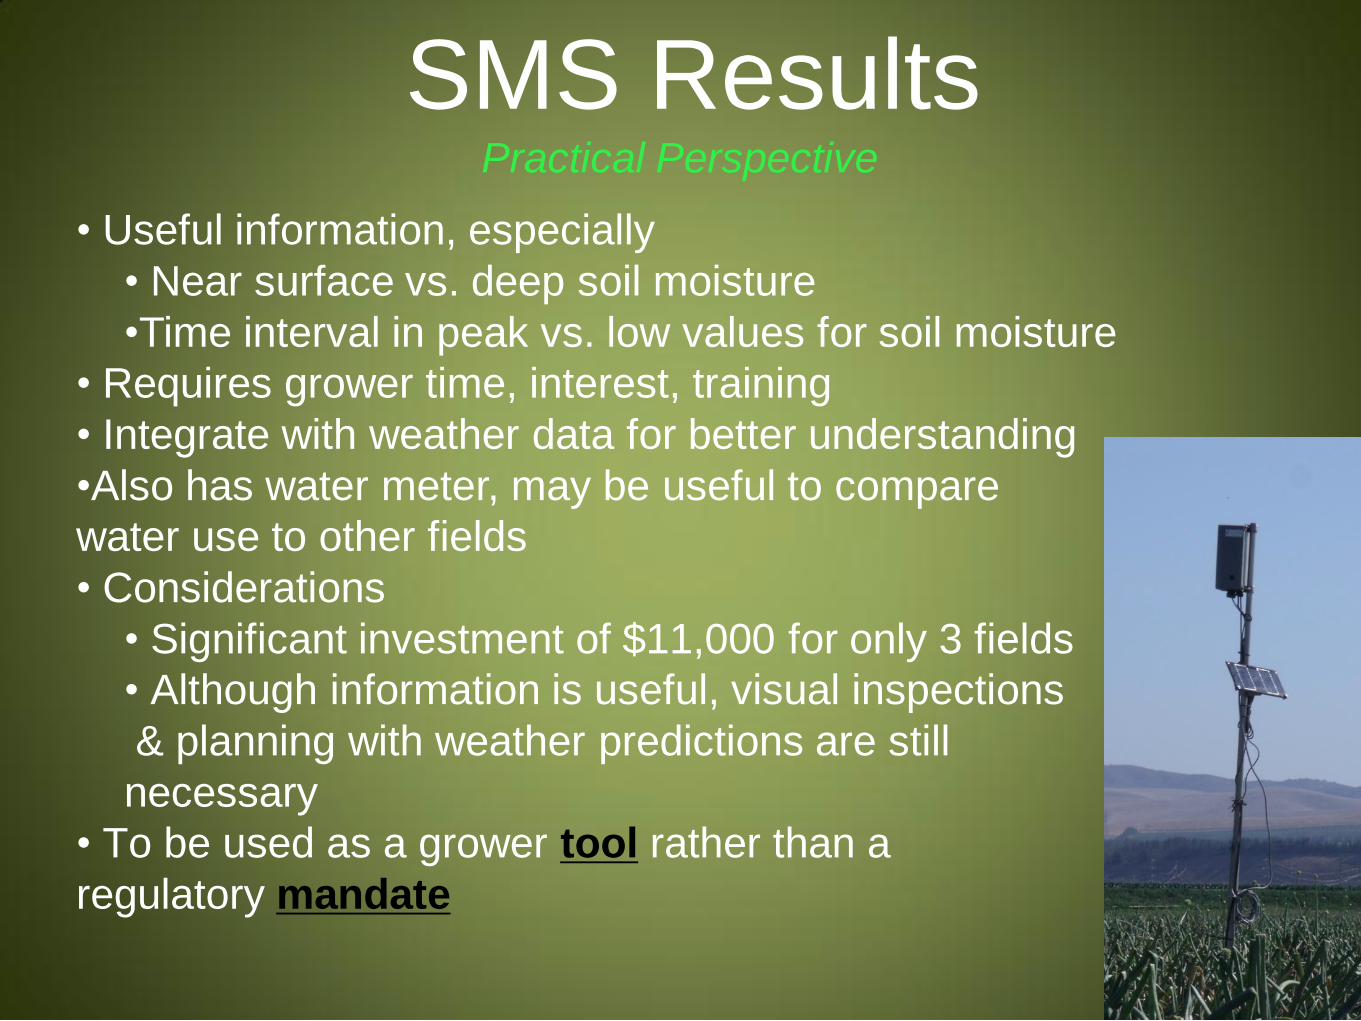
SMS Results Practical Perspective
• Useful information, especially
• Near surface vs. deep soil moisture
•Time interval in peak vs. low values for soil moisture
• Requires grower time, interest, training
• Integrate with weather data for better understanding
•Also has water meter, may be useful to compare
water use to other fields
• Considerations
• Significant investment of $11,000 for only 3 fields
• Although information is useful, visual inspections
& planning with weather predictions are still
necessary
• To be used as a grower tool rather than a
regulatory mandate
Quick Nitrate Soil Testing • Started with Tim Hartz in the 1990s
• Sample upper and lower parts of field, resampling if results differed
significantly
• June-August testing, every year since 1997
• Make recommendation of fertilizer application to grower
• Recently digitized 2007-2011 data for analysis -286 samples
Questions to answer from dataset:
• Is the soil nitrate changing between 2007-2011?
• Are we making consistent recommendations?
• How does soil nitrate differ between crops?
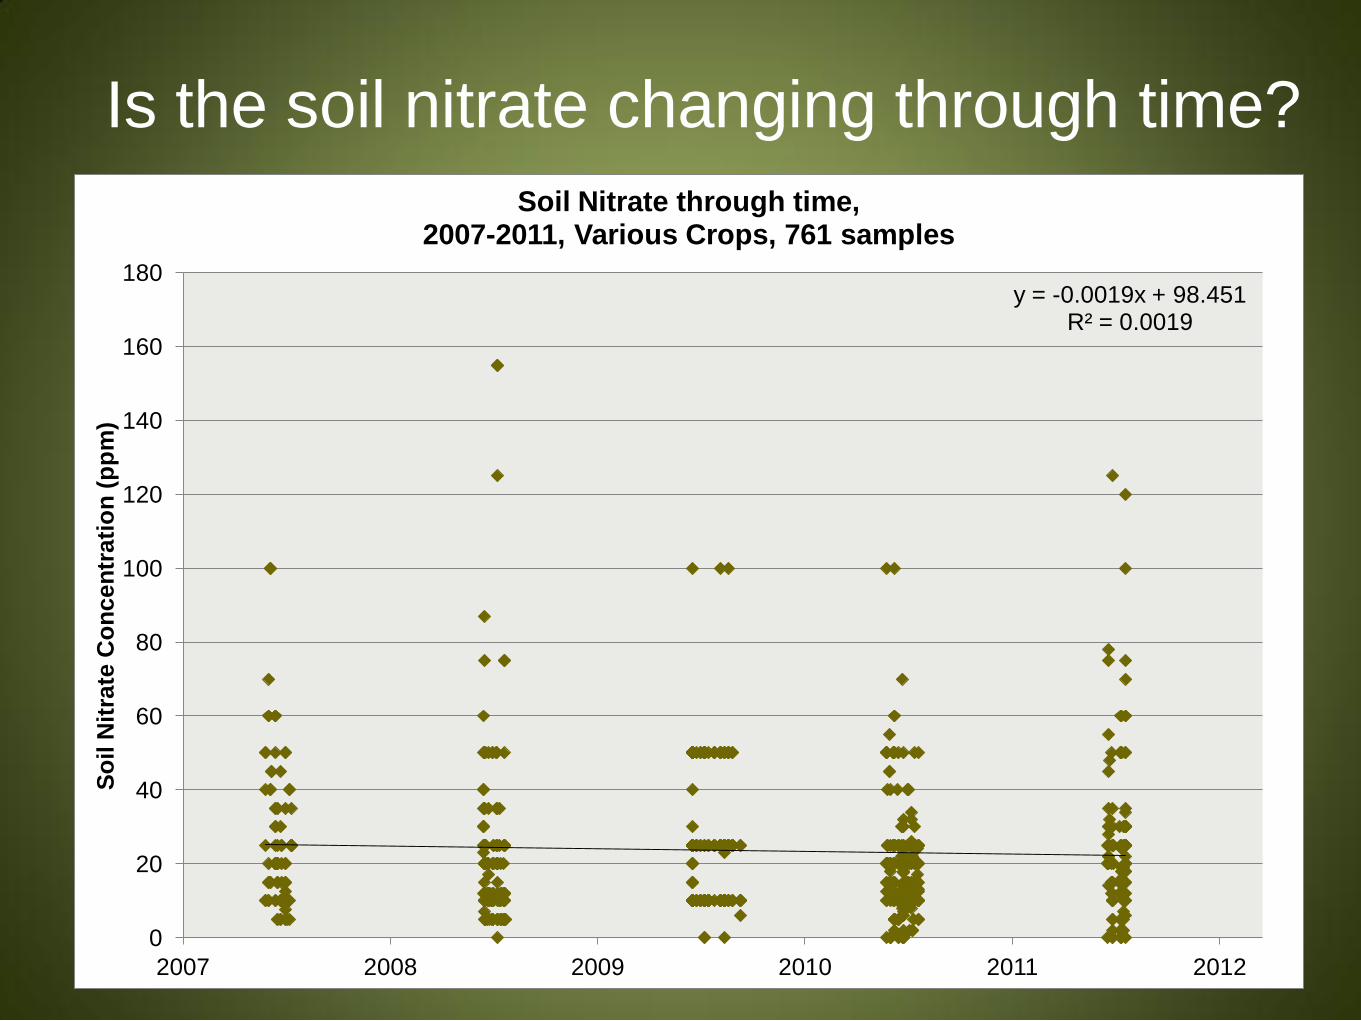
Is the soil nitrate changing through time?
y = -0.0019x + 98.451 R² = 0.0019
0
20
40
60
80
100
120
140
160
180
2007 2008 2009 2010 2011 2012
So
il N
itra
te C
on
ce
ntr
ati
on
(p
pm
)
Soil Nitrate through time, 2007-2011, Various Crops, 761 samples
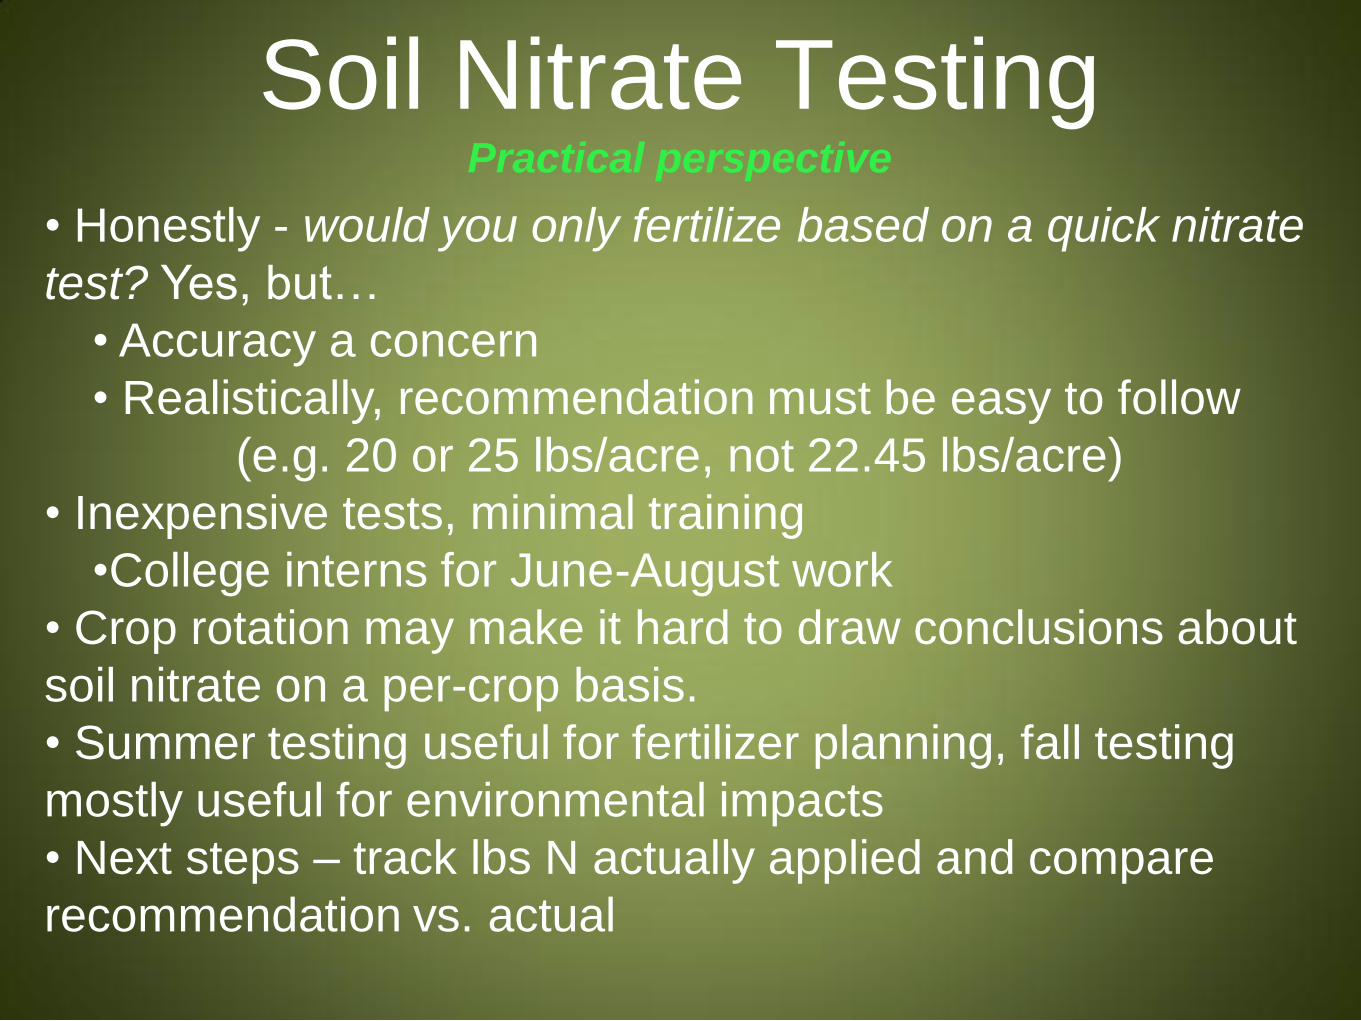
Soil Nitrate Testing Practical perspective
• Honestly - would you only fertilize based on a quick nitrate
test? Yes, but…
• Accuracy a concern
• Realistically, recommendation must be easy to follow
(e.g. 20 or 25 lbs/acre, not 22.45 lbs/acre)
• Inexpensive tests, minimal training
•College interns for June-August work
• Crop rotation may make it hard to draw conclusions about
soil nitrate on a per-crop basis.
• Summer testing useful for fertilizer planning, fall testing
mostly useful for environmental impacts
• Next steps – track lbs N actually applied and compare
recommendation vs. actual
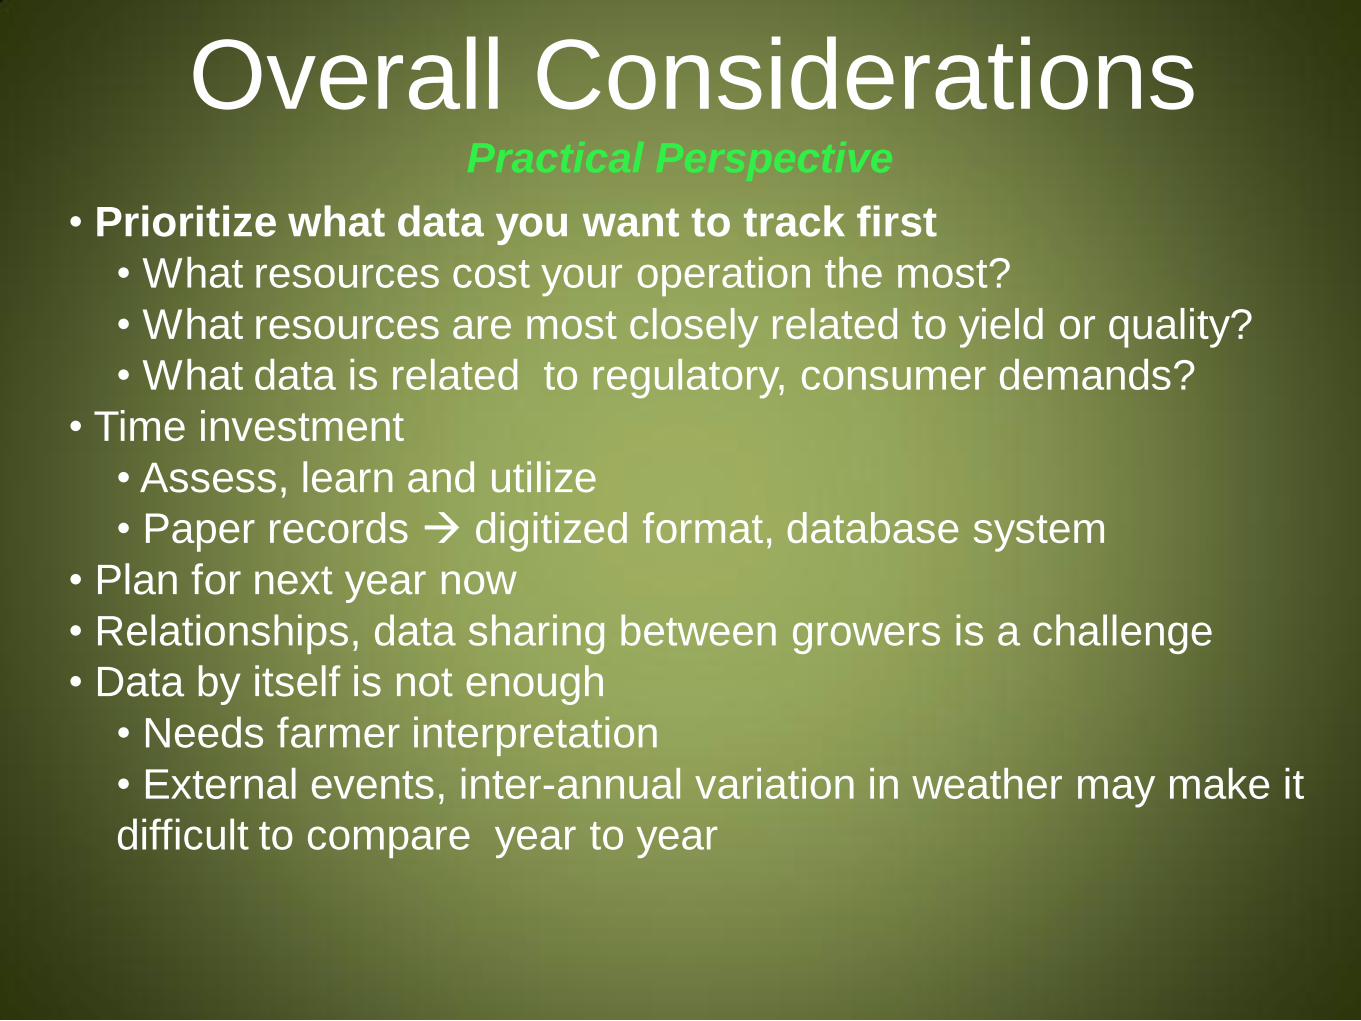
Overall Considerations Practical Perspective
• Prioritize what data you want to track first
• What resources cost your operation the most?
• What resources are most closely related to yield or quality?
• What data is related to regulatory, consumer demands?
• Time investment
• Assess, learn and utilize
• Paper records digitized format, database system
• Plan for next year now
• Relationships, data sharing between growers is a challenge
• Data by itself is not enough
• Needs farmer interpretation
• External events, inter-annual variation in weather may make it
difficult to compare year to year
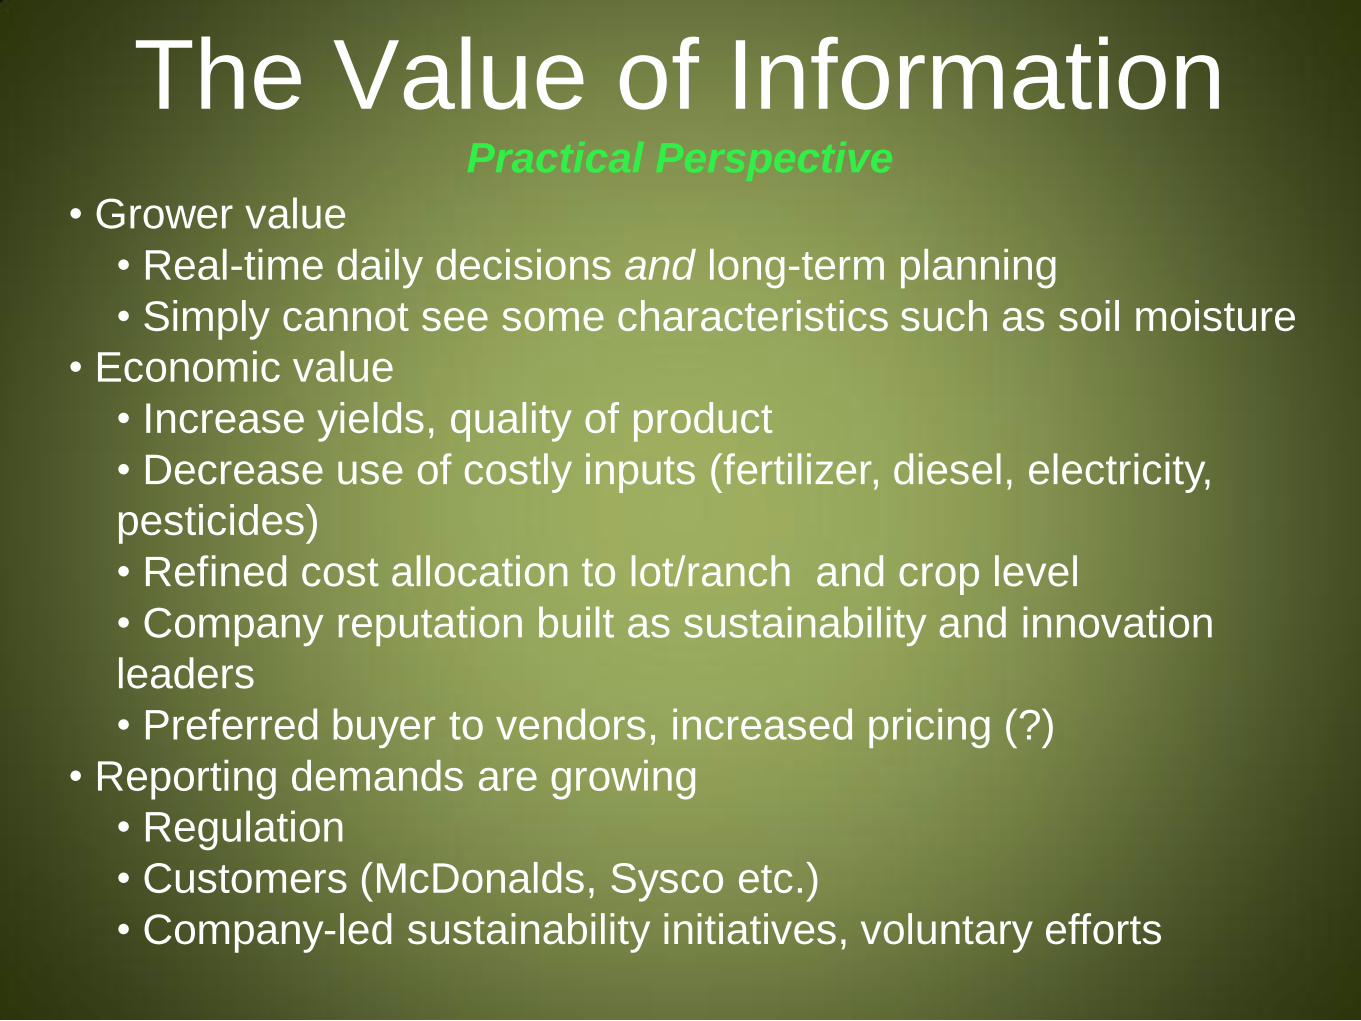
The Value of Information Practical Perspective
• Grower value
• Real-time daily decisions and long-term planning
• Simply cannot see some characteristics such as soil moisture
• Economic value
• Increase yields, quality of product
• Decrease use of costly inputs (fertilizer, diesel, electricity,
pesticides)
• Refined cost allocation to lot/ranch and crop level
• Company reputation built as sustainability and innovation
leaders
• Preferred buyer to vendors, increased pricing (?)
• Reporting demands are growing
• Regulation
• Customers (McDonalds, Sysco etc.)
• Company-led sustainability initiatives, voluntary efforts
Bob Martin Jocelyn Gretz Rio Farms, General Manager Sustainable Agriculture Program Manager